Article

Seasonal Variation in Total Cloud Cover and Cloud Type Characteristics in Xinjiang, China Based on FY-4A

1
Institute of Desert Meteorology, China Meteorological Administration, Urumqi 830002, China
2
Xinjiang Innovation Institute of Cloud Water Resource Development and Utilization, Urumqi 830002, China
3
Xinjiang Cloud Precipitation Physics and Cloud Water Resources Development Laboratory, Urumqi 830002, China
4
Field Scientific Observation Base of Cloud Precipitation Physics in West Tianshan Mountains, Xinyuan 844900, China
5
Laboratory of Cloud-Precipitation Physics and Severe Storms, Institute of Atmospheric Physics, Chinese Academy of Sciences, Beijing 100029, China
6
College of Earth Science, University of Chinese Academy of Sciences, Beijing 100049, China
7
Xinjiang Key Laboratory of Oasis Ecology, College of Geography and Remote Sensing Sciences, Xinjiang University, Urumqi 830017, China
*
Author to whom correspondence should be addressed.
Remote Sens. 2024, 16(15), 2803; https://doi.org/10.3390/rs16152803 (registering DOI)
Submission received: 25 June 2024 / Revised: 29 July 2024 / Accepted: 30 July 2024 / Published: 31 July 2024

Abstract

:
In order to deepen the knowledge of the seasonal variation in total cloud cover (TCC) in Xinjiang, China (XJ), a typical arid region, and to broaden the understanding of the seasonal variation in cloud type (CLT) in the region, we used TCC and CLT datasets from the latest generation of the geostationary satellite Fengyun 4A (FY-4A) from 2018 to 2022 to investigate the seasonal variation characteristics of TCC and CLT in XJ. Meanwhile, to verify the accuracy of TCC from FY-4A, ground observation (GROB) TCC datasets from 105 national meteorological stations (NMSs) in XJ and TCC datasets from ERA5 during the same period were used. In addition, the correlation between TCC from FY-4A and meteorological factors from ERA5 was also analyzed in this study. The TCC from FY-4A, GROB, and ERA5 can all well reflect the significant seasonal variation in TCC in XJ, with the highest (lowest) mean TCC and a distribution pattern of high in the southwest (northwest) and low in the northeast (southeast) in spring (fall) in XJ. Although the mean TCC from FY-4A in all four seasons was lower than that from GROB, the two were comparable in spring (44.09% and 47.32%) and summer (42.88% and 43.17%), while there was a significant difference between the two in fall (27.86% and 40.19%) and winter (30.58% and 46.93%) for 105 NMSs in XJ. The TCC from FY-4A was lower (higher) than that from GROB in spring and summer at most NMSs in northern (southern) XJ, while the TCC from FY-4A was lower than that from GROB for the vast majority of NMSs in fall and winter, especially in northern XJ. The seasonal variation in the spatial distribution of different CLTs (clear, water-type, supercooled-type, mixed-type, ice-type, cirrus-type, and overlap-type) from FY-4A exhibited diverse variation characteristics. Water-type (supercooled-water-type) had a high-frequency center of over 30% in the Tarim Basin (Kunlun Mountains) during summer. Mixed-type (ice-type and cirrus-type) had the highest frequency in winter (spring), while overlap-type had the highest frequency in summer. The correlation between TCC and water vapor conditions (total column vertically integrated water vapor, specific humidity at 250 hPa, 500 hPa, and 700 hPa) was positive in XJ.

1. Introduction

Cloudiness is one of the important climate factors that affect radiation transfer and water cycle and has a significant impact on climate change [1,2,3,4,5]. In addition, cloudiness plays an important role in the evolution of weather systems and the development of climate systems [6,7,8]. These effects of cloudiness are not only greatly influenced by their horizontal distribution, i.e., total cloud cover (TCC), but also greatly constrained by their formation, height, and optical thickness, such as cloud type (CLT) [9,10,11,12,13,14]. TCC and CLT are influenced by many factors, including geographical location [15,16,17,18], terrain [19,20], and season [21,22,23]. Differences in geographical location can lead to differences in cloud characteristics; for example, there were significant differences in TCC between the Tibetan Plateau and eastern China on various time scales [18], and the differences in TCC caused by geographical location differences were also significant in different regions of the United States [16,17]. Meanwhile, the influence of terrain on cloud characteristics is also evident, such as Dommo et al. [19] using the K-means clustering method to cluster western central Africa terrain into four categories: coast and low-lying ocean-facing valleys, windward flanks, plateaus, and Congo basin margins, and pointed out that the main differences between these four types are related to the frequency of low cloud cover. Due to the severe influence of terrain, the annual average TCC over the Tibetan Plateau decreased from the southeast to the northwest [20]. In addition, seasonal variation also has a significant impact on cloud characteristics. Ahmadi et al. [22] discussed in detail the seasonal variation in liquid and ice clouds in Iran and pointed out that liquid clouds in summer and ice clouds in spring had a higher correlation with precipitation in Iran. The seasonal variation in TCC in southern Italy showed the highest incidence in winter, while the seasonal variation in TCC in low- and high-altitude areas in northern Italy showed more complex characteristics with significant differences [23].
China has a vast territory, complex terrain, and significant differences in climate characteristics. Unlike the eastern and southern regions of China, Xinjiang, China (XJ) is not directly affected by the monsoon system and is a typical arid region [24,25]. XJ is located in the northwest of China and also in the hinterland of the Eurasian continent, with significant differences in both macro- and microphysical characteristics of precipitation compared to other regions of China [26,27,28,29,30,31,32,33]. Clouds and precipitation have a critical impact on the economic and social development, ecological environment protection, meteorological disaster prevention and reduction, water resource utilization, and water security of XJ. However, research on clouds is clearly insufficient compared to precipitation in XJ. Zeng et al. [34] used the Ka-band cloud radar located in the Tianshan Mountains of XJ to study the diurnal variation in clouds from March to May 2020, and found that the diurnal variation in cloud base height and cloud top height is closely related to the terrain of the Tianshan Mountains of XJ. Based on the same cloud radar as Zeng [34], Zhang et al. [35] compared in detail the macro- and microphysical characteristics of snowfall and non-snowfall clouds in the Tianshan Mountains of XJ. However, XJ accounts for about one-sixth of China’s land area and has complex terrain. The above research is only focused on a fixed location in XJ, and little is known about the characteristics of clouds in the vast majority of other regions of XJ.
The characteristics of clouds can be obtained through ground observations, satellite observations, and reanalysis datasets. Compared to cloud radar, ground meteorological stations are more common and convenient in observing the characteristics of clouds [14,16,17,36,37]. There are 105 national meteorological stations (NMSs) in XJ that can observe the characteristics of clouds. Compared to ground observations, satellite observations have the advantages of wide coverage and high spatiotemporal resolution, making them widely used in observing clouds worldwide [6,10,11,12,13,19,20,21,22]. In addition to ground and satellite observations, reanalysis datasets including ERA5, ERA-Interim, NCEP, MERRA, the Japanese 55-year Reanalysis Project, and CRA40 from the China Meteorological Administration can also provide convenience for studying the characteristics of clouds [11,13,17,18]. Satellite observation has significant advantages over the other two types of data in XJ, which is a vast and complex terrain area.
Fengyun-4A (FY-4A) is the newest generation of the geostationary orbit meteorological satellite in China, and its TCC and CLT data can be obtained from March 2018. The Advanced Geosynchronous Radiation Imager (AGRI) on board FY-4A has many advantages compared to its predecessor, the Fengyun-2 series, such as much higher spectral, radiation, and spatial resolution, and shortened revisit time [38,39,40]. The capabilities of FY-4A/AGRI [41] are comparable to the most advanced imaging instruments in the newest generation of geostationary orbit meteorological satellites, such as GOES-R/Advanced Baseline Imager (ABI) [42] and Himawari-8/Advanced Himawari Imager (AHI) [43]. Lai et al. [44] compared cloud mask and cloud phase from Moderate Resolution Imaging Spectroradiometer (MODIS), Himawari-8/AHI, and FY-4A/AGRI, and found that these instruments are reasonably consistent. Based on the comparative results of MODIS and FY-4A/AGRI on the Tibetan Plateau, Xu et al. [40] pointed out that for cloud mask retrievals, the fractional agreement between the two under cloudy and clear conditions was 0.93 and 0.73, respectively. In recent years, an increasing number of studies also indicate that FY-4A has reliable quality and important application value in cloud detection [45,46,47,48,49,50,51]. However, the relevant research in XJ is insufficient.
To reveal the seasonal variation in TCC and CLT from FY-4A and to verify the accuracy of TCC from FY-4A in XJ, a typical arid region, we conducted this study using TCC and CLT datasets from FY-4A during 2018–2022 combined with TCC datasets from 105 NMSs in XJ and ERA5 during the same period. In addition, to explore the relationship between TCC and meteorological factors, the correlation between TCC from FY-4A and meteorological factors from ERA5 was also analyzed in this study. The remainder of this study is organized as follows. The data and methodology are provided in Section 2. Section 3 presents seasonal variation in TCC and CLT, as well as correlations between TCC and meteorological factors in XJ. A discussion about seasonal variation in TCC and CLT in XJ is given in Section 4. Conclusions are presented in Section 5.

2. Data and Methodology
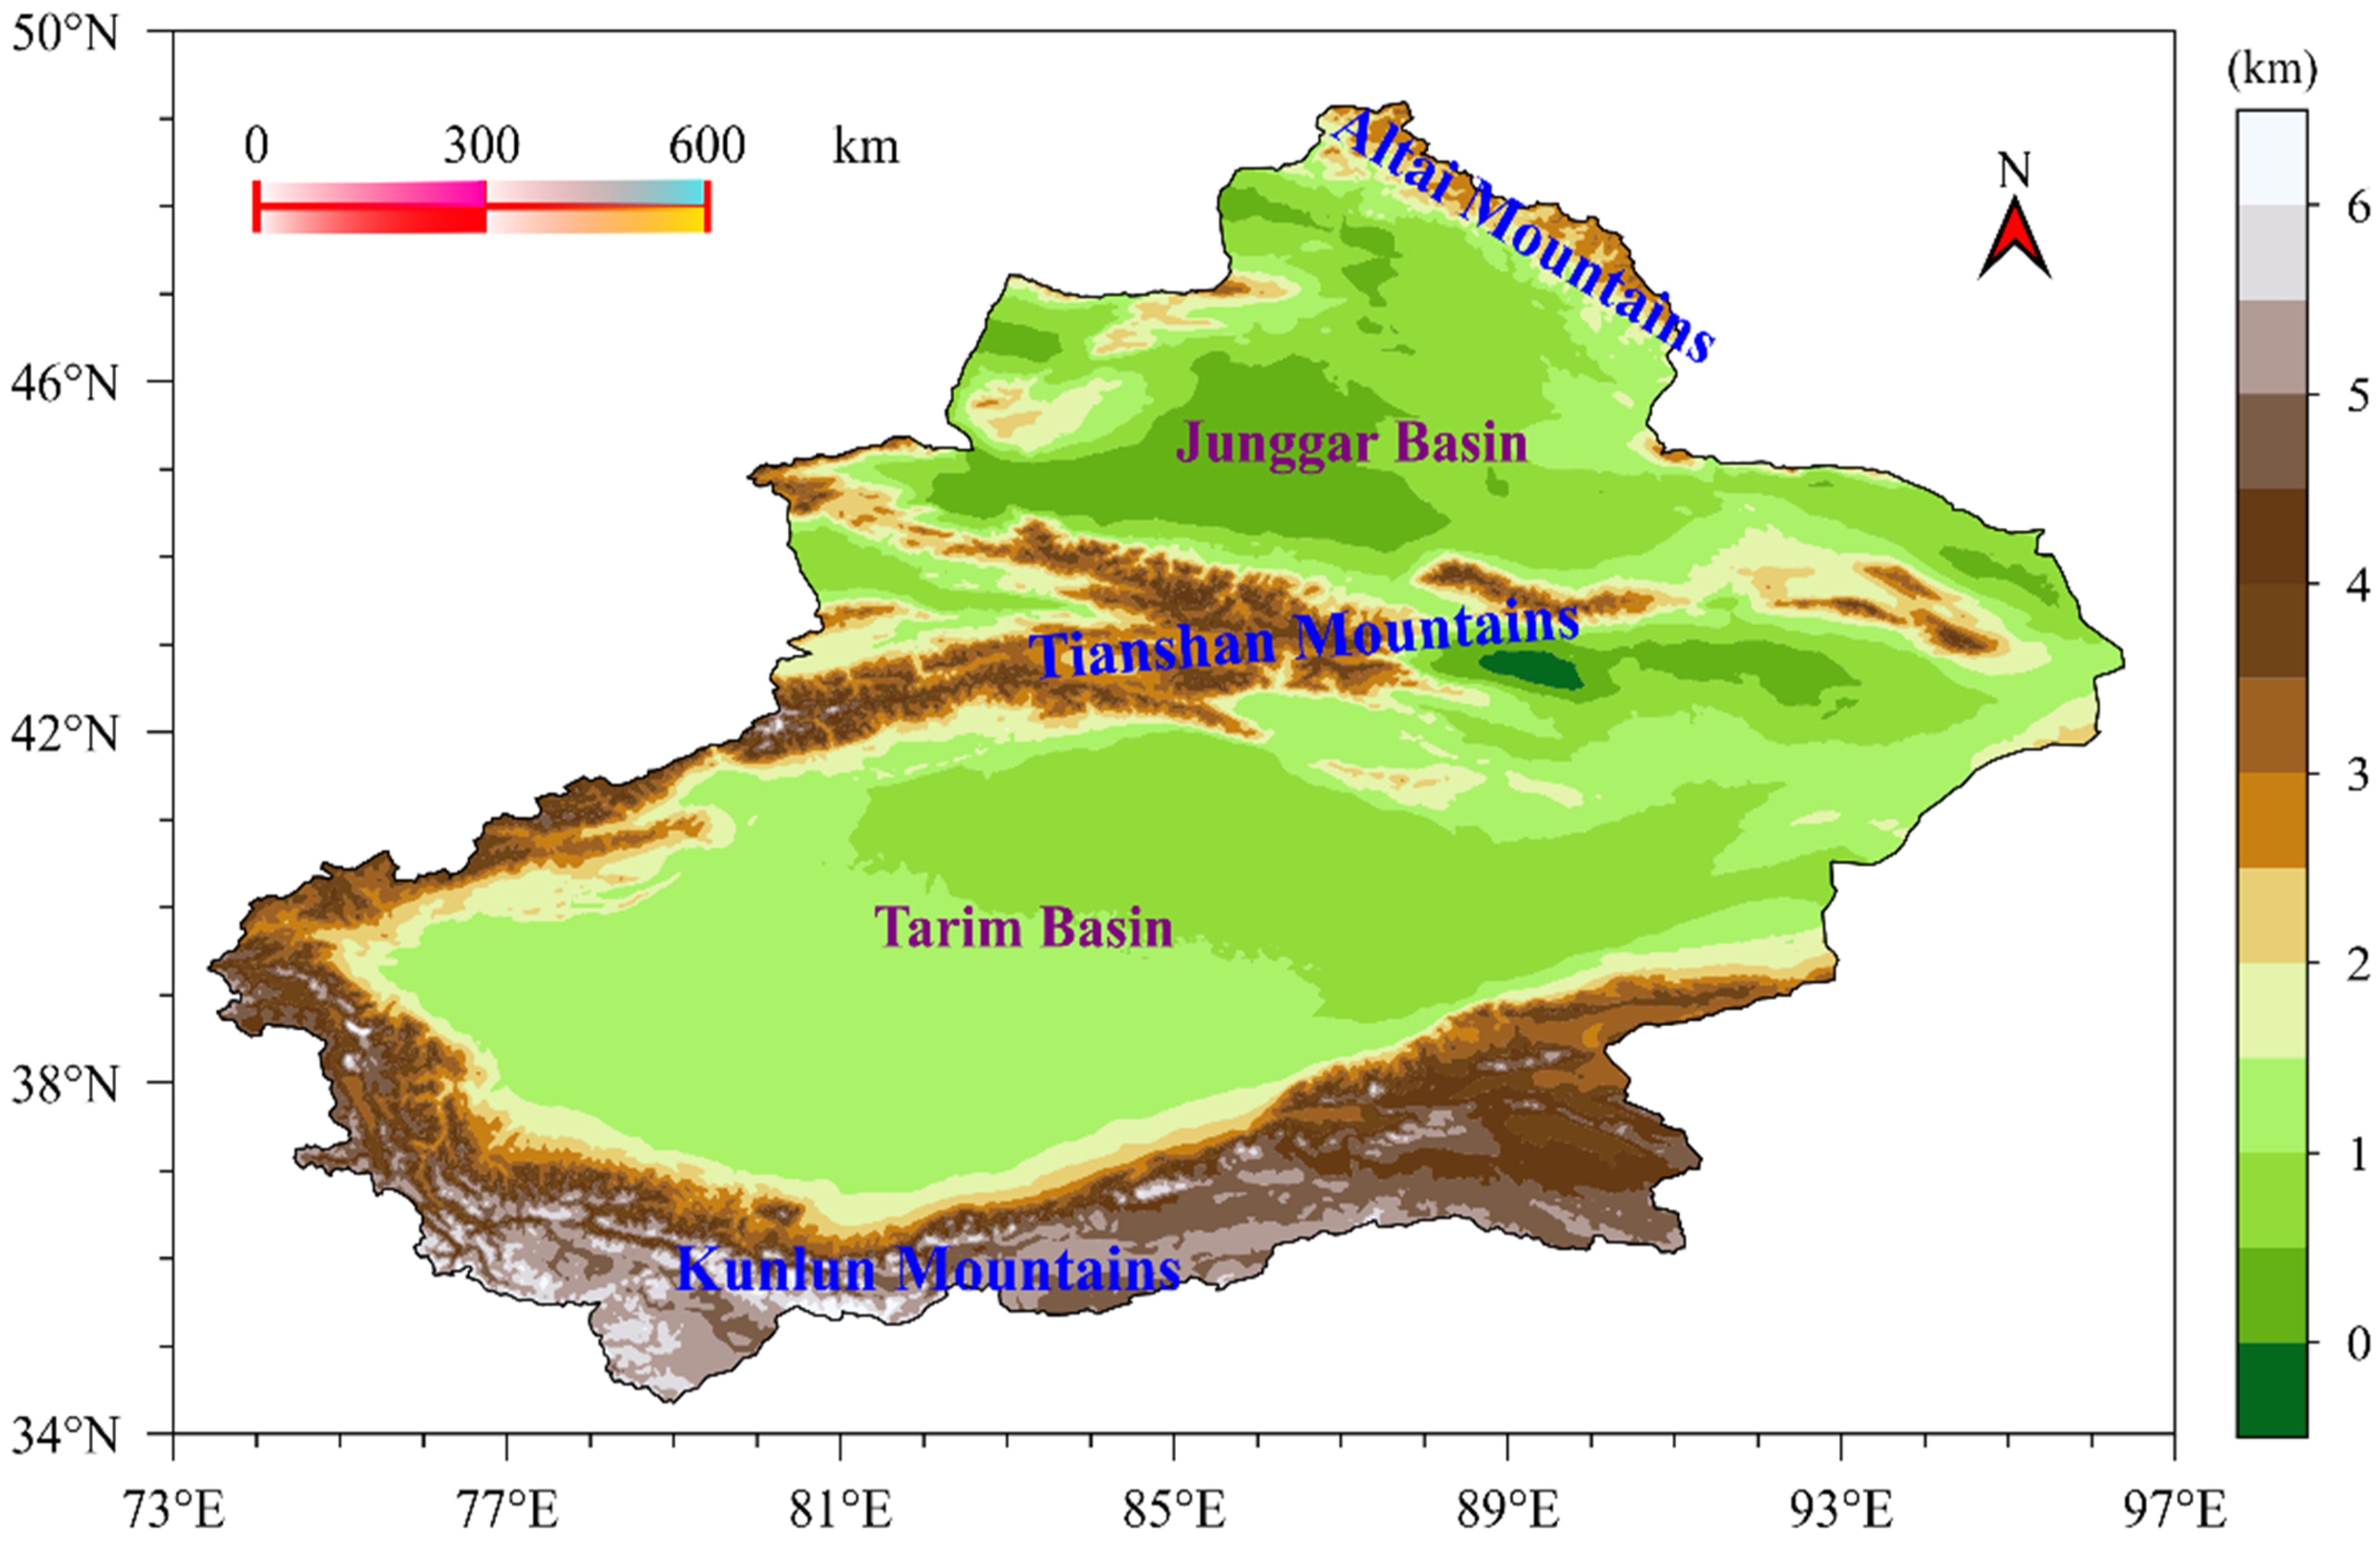
2.1. Study Area

Xinjiang, China (XJ) is located in the northwest of China and belongs to a typical arid climate region, and the region is far from the ocean and has relatively sparse precipitation [25,52,53]. From north to south, XJ has a topographic distribution pattern of alternating mountains and basins, that is, the Junggar Basin and Tarim Basin are distributed between the Altai Mountains, Tianshan Mountains, and Kunlun Mountains, as shown Figure 1.

2.2. Dataset

The data used in this study include (1) total cloud cover (TCC) from FY-4A, ground observations (GROB) based on 105 national meteorological stations (NMSs) in XJ, and ERA5, respectively; (2) cloud type (CLT) from FY-4A; and (3) total column water vapor (TCWV) and specific humidity (SH) at 250 hPa, 500 hPa, and 700 hPa from ERA5. The above data are from March 2018 to February 2023. For TCC and CLT from FY-4A, their temporal and spatial resolutions are 1 h and 0.04° × 0.04°, respectively, which can be obtained from http://data.nsmc.org.cn (accessed on 10 January 2024). For TCC from GROB based on 105 NMSs, they come from the daily average dataset of Xinjiang Meteorological Information Center. For TCWV and specific humidity from ERA5, they come from the monthly average dataset with 0.25° × 0.25° resolution of the European Centre for Medium Range Weather Forecasts, which can be accessed through https://www.ecmwf.int/en/forecasts/datasets/reanalysis-datasets/era5 (accessed on 12 January 2024).

2.3. Methodology

Firstly, all data used in this study were processed into monthly mean time series. Secondly, the monthly TCC from FY-4A and ERA5 was interpolated to 105 NMSs in XJ using a bilinear interpolation method for comparison with TCC from GROB, and the monthly grid TCC from FY-4A was interpolated using bilinear interpolation to a spatial resolution of 0.25° × 0.25° to explore the correlation with the meteorological factors of ERA5. Thirdly, the seasonal (spring: March–May; summer: June–August; fall: September–November; and winter: December–February) TCC and CLT were obtained from the monthly TCC and CLT series from March 2018 to February 2023. Finally, Pearson correlation coefficients and their significance p (p < 0.05 in this study) between monthly mean TCC and meteorological factor time series were computed.

3. Results

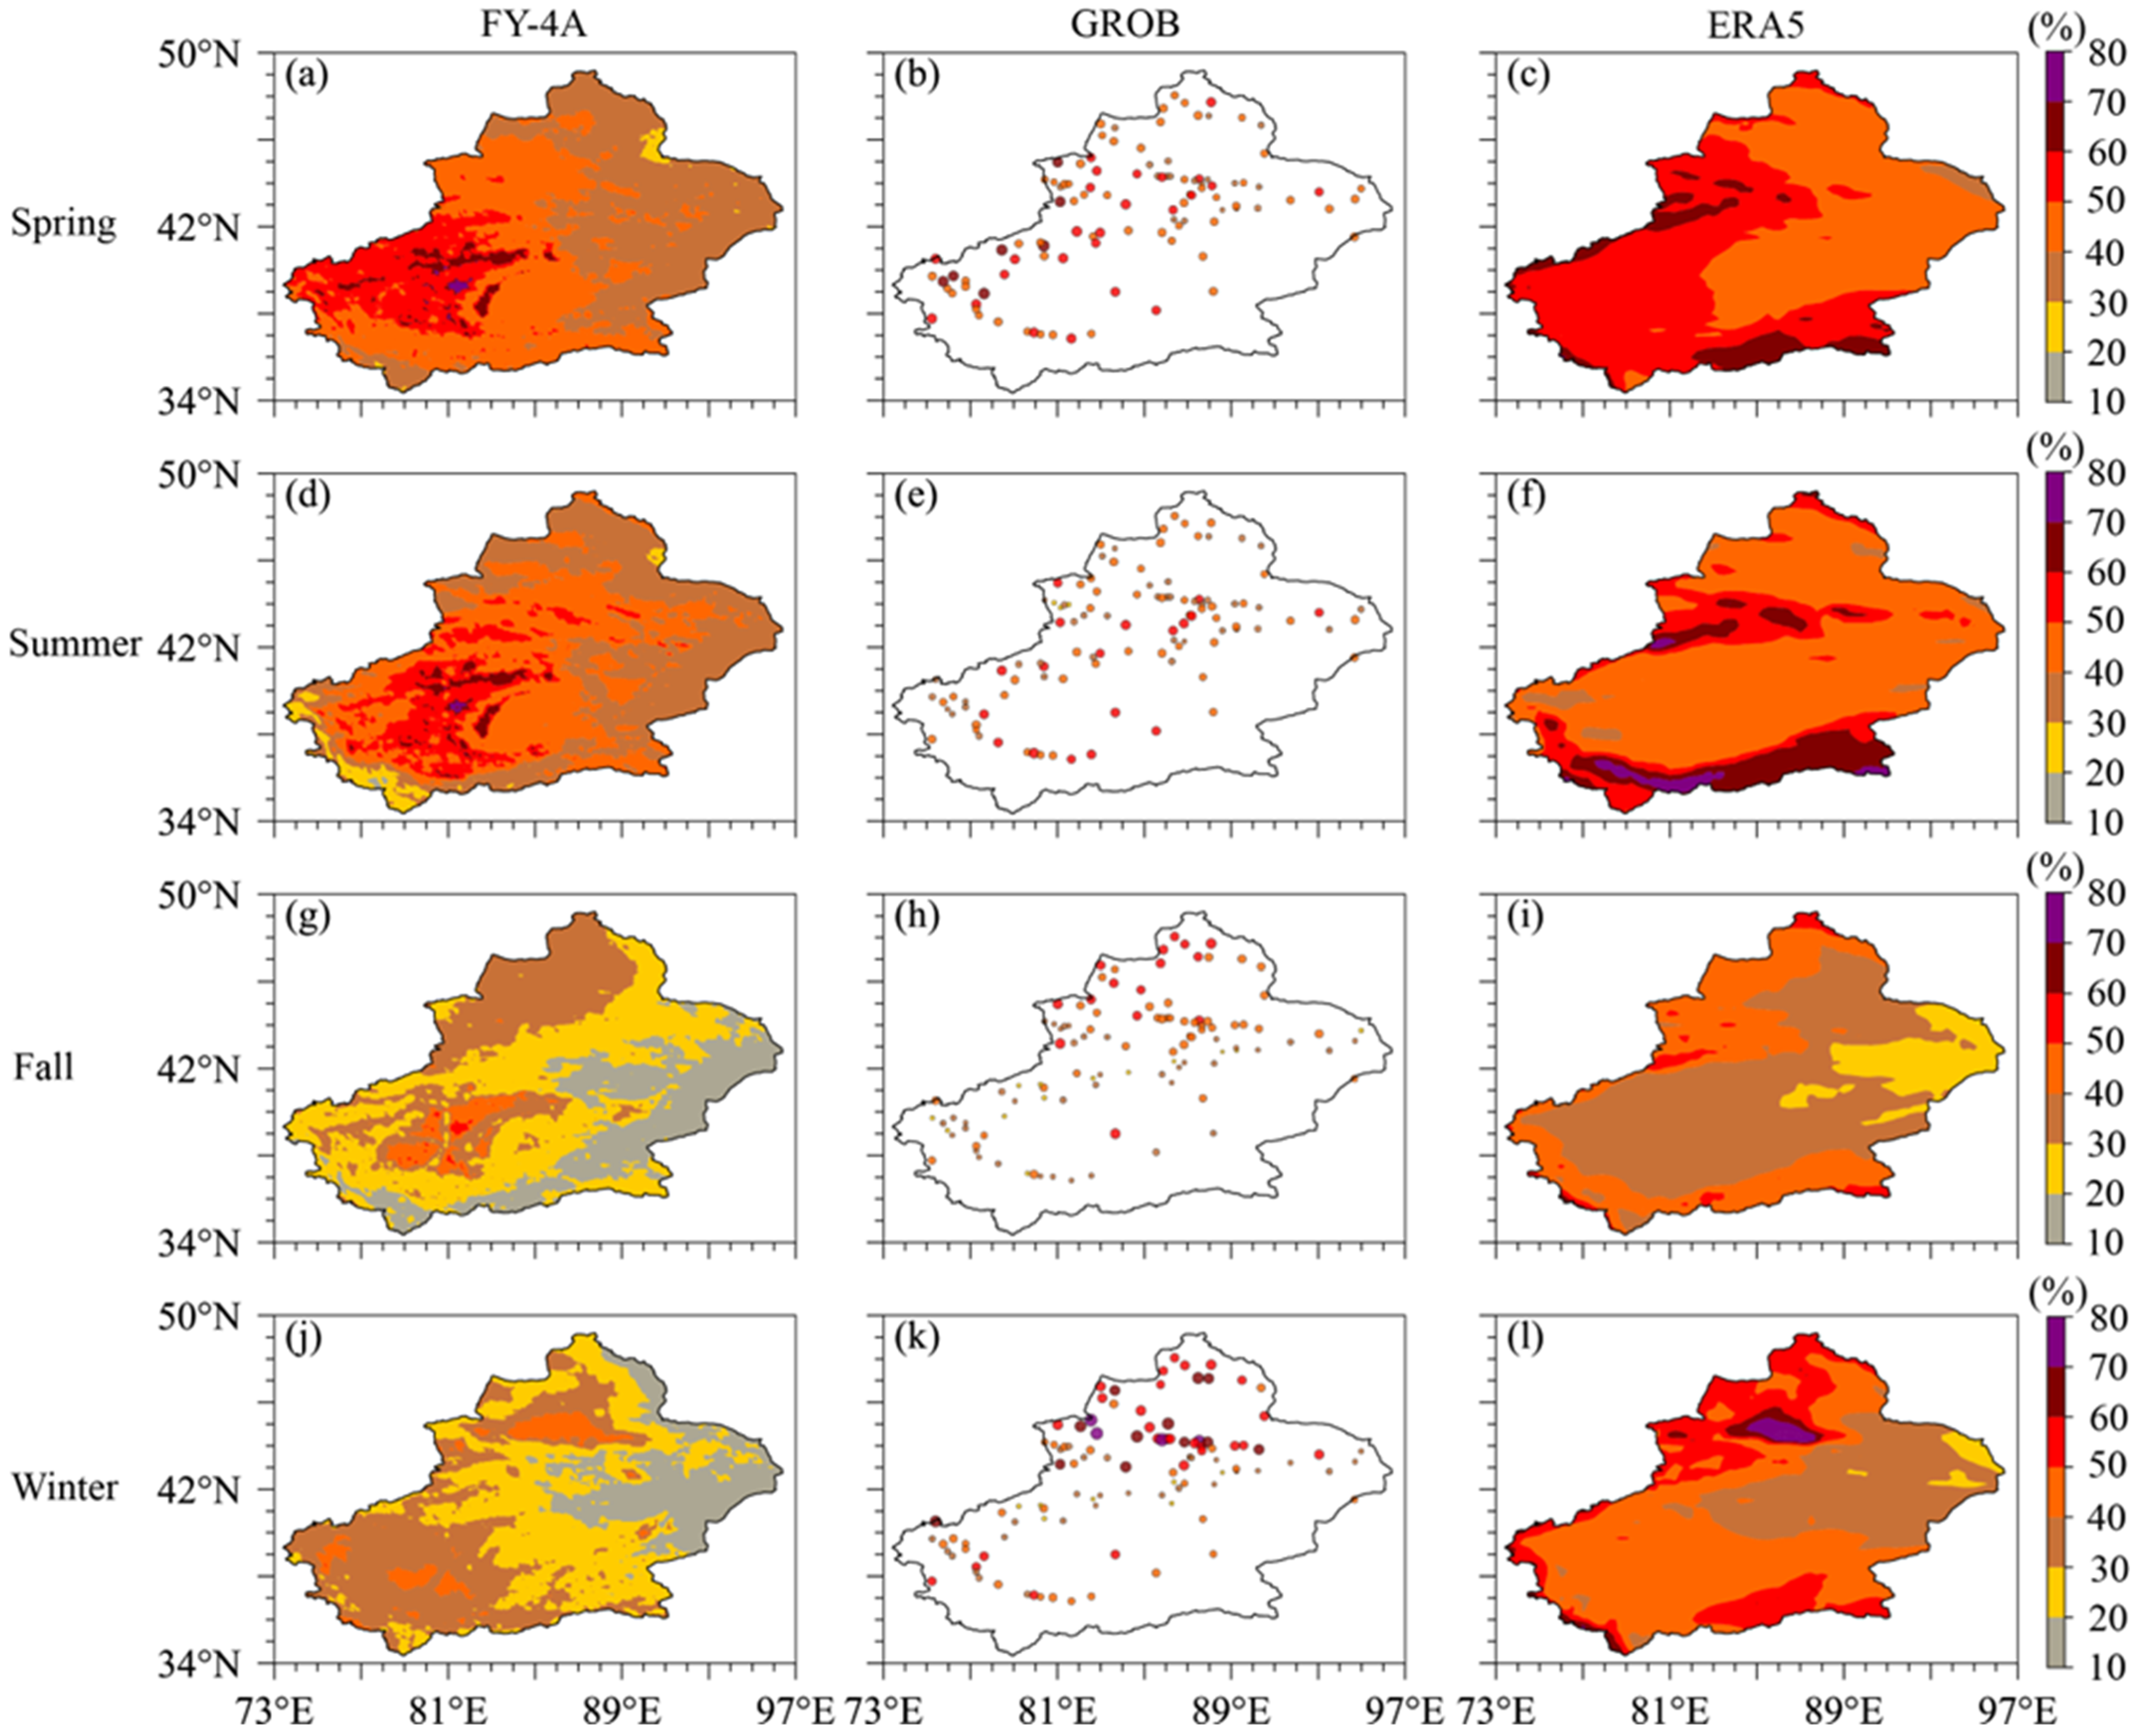
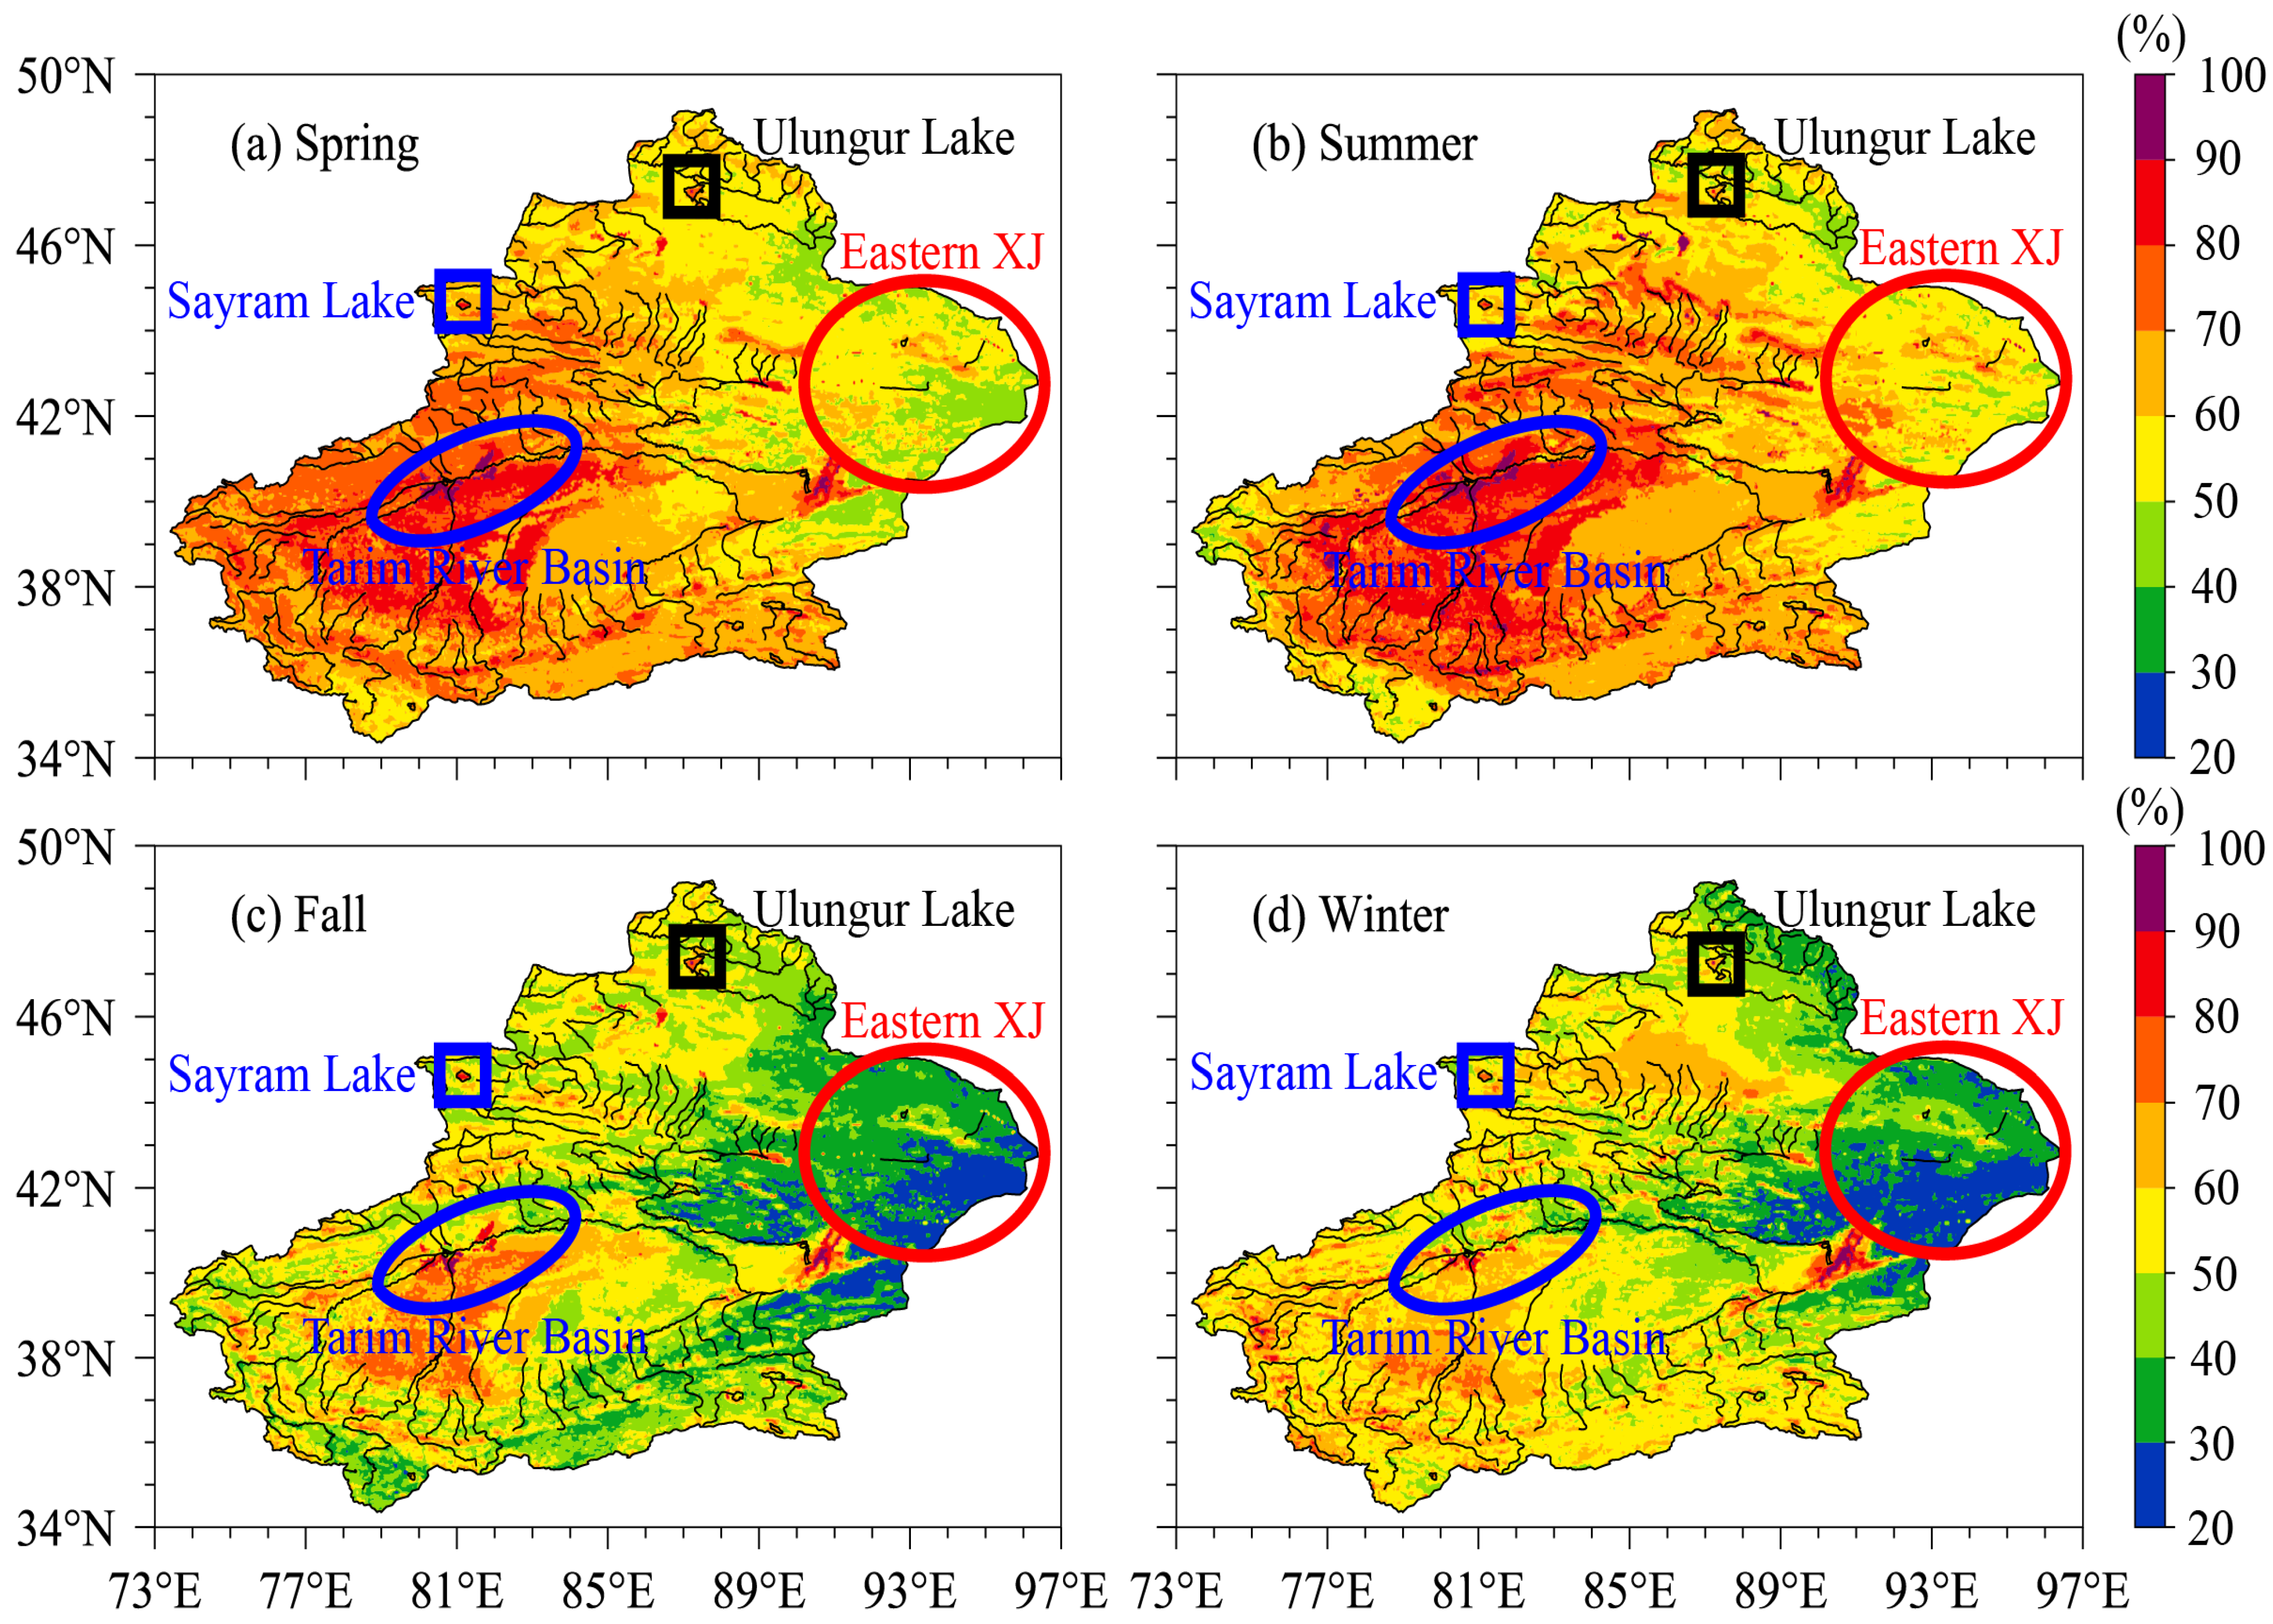
3.1. Seasonal Variation in Total Cloud Cover

The seasonal variation in the spatial distribution of total cloud cover (TCC) frequency from FY-4A, ground observations (GROB) based on 105 national meteorological stations (NMSs) in Xinjiang, China (XJ), and ERA5 during March 2018 to February 2023 is shown in Figure 2. The frequency of TCC from FY-4A was high in the southwest and low in the northeast in spring in XJ. The west of the Tarim Basin was a high-frequency area, with most areas having a frequency of more than 50%, while most areas in the north and east of XJ had a frequency of less than 40% (Figure 2a). The distribution of TCC from FY-4A in summer was similar to that in spring. Compared to spring, the frequency of TCC from FY-4A in summer decreased (increased) in western (eastern) XJ, changing within 10% (Figure 2d). The frequency of TCC from FY-4A in fall was significantly lower than that in summer in almost all areas. Specifically, most areas in the south and east of XJ (the north and west of the Junggar Basin) were reduced by more (less) than 30% (10%), and finally showed a distribution pattern of high in the northwest and low in the southeast (Figure 2g). The frequency of TCC from FY-4A decreased (increased) in the north (south) of the Junggar Basin in winter compared with that in fall, and increased in the Tarim Basin, with most areas changing within 10% (Figure 2j). It can be seen that TCC detected by FY-4A showed significant seasonal variations in XJ, and different regions of XJ exhibited unique characteristics of variation.
Similar to FY-4A, the frequency of TCC from GROB was high in the southwest and low in the northeast in spring in XJ. Specifically, the west of the Tarim Basin and adjacent areas of Tianshan Mountains had the highest frequency, with some NMSs having a frequency of more than 60%, while most NMSs in eastern XJ had a frequency of less than 50% (Figure 2b). The frequency of TCC from GROB decreased by more than 10% in some NMSs in the west of the Tarim Basin and the west of Tianshan Mountains in summer compared with that in spring, while there was little change in most other regions of XJ (Figure 2e). The frequency of TCC from GROB changed significantly in fall compared with that in summer, increasing in the Junggar Basin and decreasing in other regions of XJ, and finally showed a distribution pattern of high in the north and low in the south (Figure 2h). The distribution pattern of TCC from GROB in winter was similar to that in fall, but the frequency of TCC for most NMSs in winter was higher than that in fall, especially in the south of the Junggar Basin (Figure 2k). Similar to FY-4A and GROB, the frequency of TCC from ERA5 was high in the southwest and low in the northeast in spring in XJ. The Tianshan Mountains, the Kunlun Mountains, and their adjacent areas and the western Tarim Basin were high-frequency areas, with a TCC frequency of more than 50%, while the TCC frequency in other areas was 40–50% (Figure 2c). In summer, the Tianshan Mountains, the Kunlun Mountains, and their adjacent areas were high-frequency areas where the frequency of TCC from ERA5 reached over 50%, while the frequency of TCC from ERA5 in the western Tarim Basin decreased most significantly from spring to summer (Figure 2f). From summer to fall, the frequency of TCC from ERA5 decreased in almost all areas, resulting in a distribution of higher TCC frequency in the northwest and lower TCC frequency in the southeast in fall (Figure 2i). From fall to winter, the frequency of TCC from ERA5 increased in almost all areas, especially in the southern Junggar Basin, which increased by more than 30%, forming a high-frequency center of more than 70% in winter (Figure 2l). Overall, the three types of TCC data all showed significant seasonal variations in TCC frequency and exhibited regional differences in XJ.
The violin plot of the seasonal variation in TCC frequencies from FY-4A, GROB, and ERA5 at 105 NMSs in XJ is shown in Figure 3. In spring, the TCC frequency from FY-4A was concentrated between 35% and 50%, with an average (median) of 44.09% (42.45%), and half of NMSs had a TCC frequency of 38–49%. The TCC frequency from GROB (ERA5) was concentrated between 40% (47%) and 54% (55%), with an average of 47.32% (50.49%), and half of NMSs had a TCC frequency of 38–49% (Figure 3a). Among the three types of data, ERA5 had the most concentrated distribution of TCC frequency in spring. The distribution of TCC frequency from FY-4A in summer was similar to that in spring, but slightly decreased overall, with an average of 42.88%. The distribution of TCC frequency from GROB in summer was generally about 4% smaller than that in spring, with an average (median) of 43.17% (43.16%) smaller than that in spring. The TCC frequency from ERA5 in summer was concentrated between 40% and 49%, with an average (median) of 45.81% (44.86%), smaller than that in spring (Figure 3b). The distribution of the TCC frequency from FY-4A in fall was significantly reduced compared to summer, with a significantly smaller distribution range concentrated between 24% and 35%. In fall, the mean (median) was significantly reduced to 27.86% (28.12%) compared to summer. The distribution range of the TCC frequency from GROB in fall was wider than that in summer, concentrated at 29–36% and 41–50%, with an average (median) of 40.19% (40.75%). The TCC frequency from ERA5 in fall decreased overall compared to summer, concentrated at 31–41%, with an average (median) of 36.72% (35.43%) (Figure 3c). The TCC frequency from FY-4A in winter increased overall compared to fall and had a wider distribution range, concentrated at 27–38%, with an average (median) of 30.58% (30.76%). The TCC frequency from GROB (ERA5) in winter increased overall compared to fall and had a wider distribution range, concentrated at 30–60% (45–53%), with an average of 46.93% (46.25%) (Figure 3d). Overall, the TCC frequency from FY-4A had a narrower distribution range in fall compared to other seasons, accompanied by a smaller average TCC frequency. The distribution range of TCC frequency from GROB and ERA5 was significantly wider in winter than in other seasons, and the average TCC frequency in spring (fall) was the highest (lowest) compared to other seasons.
The seasonal variation in the spatial distribution of the difference in TCC frequency among FY-4A, GROB, and ERA5 is shown in Figure 4. The difference in TCC frequency between FY-4A and GROB (the former minus the latter, the same below) was greater (less) than 0 in most NMSs in southern (northern) XJ in spring, and the difference between the two was concentrated between −30% (0) and 0 (20%) in the northern Junggar Basin (western Tarim Basin) (Figure 4a). The difference in TCC frequency between FY-4A and GROB in summer was similar to that in spring (Figure 4d). The difference in TCC frequency between FY-4A and GROB was obviously different between fall and summer. Specifically, the deviation of most NMSs in the Junggar Basin (Tarim Basin) was between −30% (−20) and −10% (10%) in fall (Figure 4g). The difference in TCC frequency between FY-4A and GROB was most obvious in the Junggar Basin in winter, reaching −40% (Figure 4j).
The difference in TCC frequency between FY-4A and ERA5 was less than 0 in most NMSs of XJ in spring, excluding southwestern XJ (Figure 4b). The difference in TCC frequency between FY-4A and ERA5 in northern XJ during summer was similar to that in spring, while the difference between the two in southern XJ during summer was more pronounced than that in spring (Figure 4e). The TCC frequency of FY-4A at almost all NMSs in XJ in fall was lower than that of ERA5 (Figure 4h). The TCC frequency of FY-4A at all NMSs in XJ in winter was lower than that of ERA5, especially in the southern Junggar Basin, with a difference of more than 30% (Figure 4k). Except for the Tianshan Mountains and its surrounding areas, the difference in TCC frequency of ERA5 and OBS in most NMSs in spring, summer, and winter in XJ was within ±10%, while the areas with significant differences in autumn were located in the western Tianshan Mountains and northern XJ (Figure 4c,f,i,l).
The scatterplot of the seasonal variation in TCC frequencies (%) from FY-4A, GROB, and ERA5 at 105 NMSs in XJ is shown in Figure 5. Among all seasons, overall, the TCC frequencies from FY-4A in summer were closest to those from GROB (Figure 5d), followed by spring (Figure 5a), while the TCC frequencies from GROB in fall (Figure 5g) and winter (Figure 5j) were higher than those from FY-4A in most NMSs. For the TCC frequencies from FY-4A and ERA5, some NMSs were closer in summer (Figure 5e), while almost all NMSs had a lower TCC frequency from FY-4A than that from ERA5 in fall (Figure 5h) and winter (Figure 5k). Unlike the scatter distributions of TCC frequencies from FY-4A and GROB, as well as those from FY-4A and ERA5, TCC frequencies from ERA5 and GROB exhibited similarities in fall (Figure 5i) and winter (Figure 5l) (closer to the black dashed line of 1:1 relation). Meanwhile, more than half of 105 NMSs showed that the TCC frequencies from ERA5 were higher than those from GROB in spring (Figure 5c), similar to summer (Figure 5f), while the opposite was true in fall (Figure 5i). Overall, for all seasons, the TCC frequencies from ERA5 and GROB were the closest, while TCC frequencies from FY-4A were only closer to those from ERA5 and GROB in summer.
The violin plot of the seasonal variation in the difference in TCC frequency among FY-4A, GROB, and ERA5 at 105 NMSs in XJ is shown in Figure 6. In spring, the difference in TCC frequency between FY-4A and GROB (the former minus the latter, the same below) was mainly concentrated between −13% and 7%, with an average deviation of −3.23%. Approximately 86% of NMSs in XJ had a difference of −13–3% between FY-4A and ERA5, with an average difference of −6.40% in spring. The difference between ERA5 and OBS was mainly concentrated in −5–10%, with a deviation of −2–8% for half of NMSs, and an average deviation of 3.17% in spring (Figure 6a). In summer, the difference in TCC frequency between FY-4A and GROB was mainly concentrated in the range of −10–9%, and the number of NMSs with a deviation above 0 was almost equivalent to the number of NMSs with a deviation below 0, with an average deviation of −0.03%. The difference in TCC frequency between FY-4A and ERA5 was mainly concentrated between −12% and −2% in summer, with an average deviation of −2.93%, and the range of deviation was significantly larger than that in spring. The difference in TCC frequency between ERA5 and OBS in summer was mainly concentrated at −5–10%, similar to spring, with a deviation of −2–8% for half of NMSs and an average deviation of 2.64% (Figure 6b). In fall, the difference in TCC frequency between FY-4A and OBS was mainly concentrated between −23% and 0%. The number of NMSs with a deviation less than 0 accounted for 89% of the total number of NMSs, which was significantly higher than that in spring and summer. The average deviation was −12.33% in fall, and the deviation amplitude was significantly larger than that in spring and summer. The difference in TCC frequency between FY-4A and ERA5 was mainly concentrated between −15% and −2% in fall, accounting for about 89% of NMSs. The average deviation was −8.86%, and the deviation range was significantly smaller than that in summer. The difference in TCC frequency between ERA5 and OBS was mainly concentrated between −12% and 5% in fall, with a deviation of −9–2% for half of NMSs. Unlike spring and summer, in fall, more than half of NMSs had a deviation of less than 0 (Figure 6c). In winter, the difference in TCC frequency between FY-4A and OBS was mainly concentrated between −30% and 0%, with NMSs with deviation amplitude exceeding 10% accounting for 65% of the total NMSs. The average deviation was −16.35%, and the range and amplitude of deviation were the largest in the four seasons. The difference in TCC frequency between FY-4A and ERA5 was mainly concentrated between −25% and −5% in winter, accounting for about 82% of NMSs. The average deviation was −15.67%, and the amplitude of the deviation was the largest in the four seasons. The difference in TCC frequency between ERA5 and GROB was mainly concentrated between −10% and 8% in winter, with an average and median deviation of about 0 (Figure 6d).

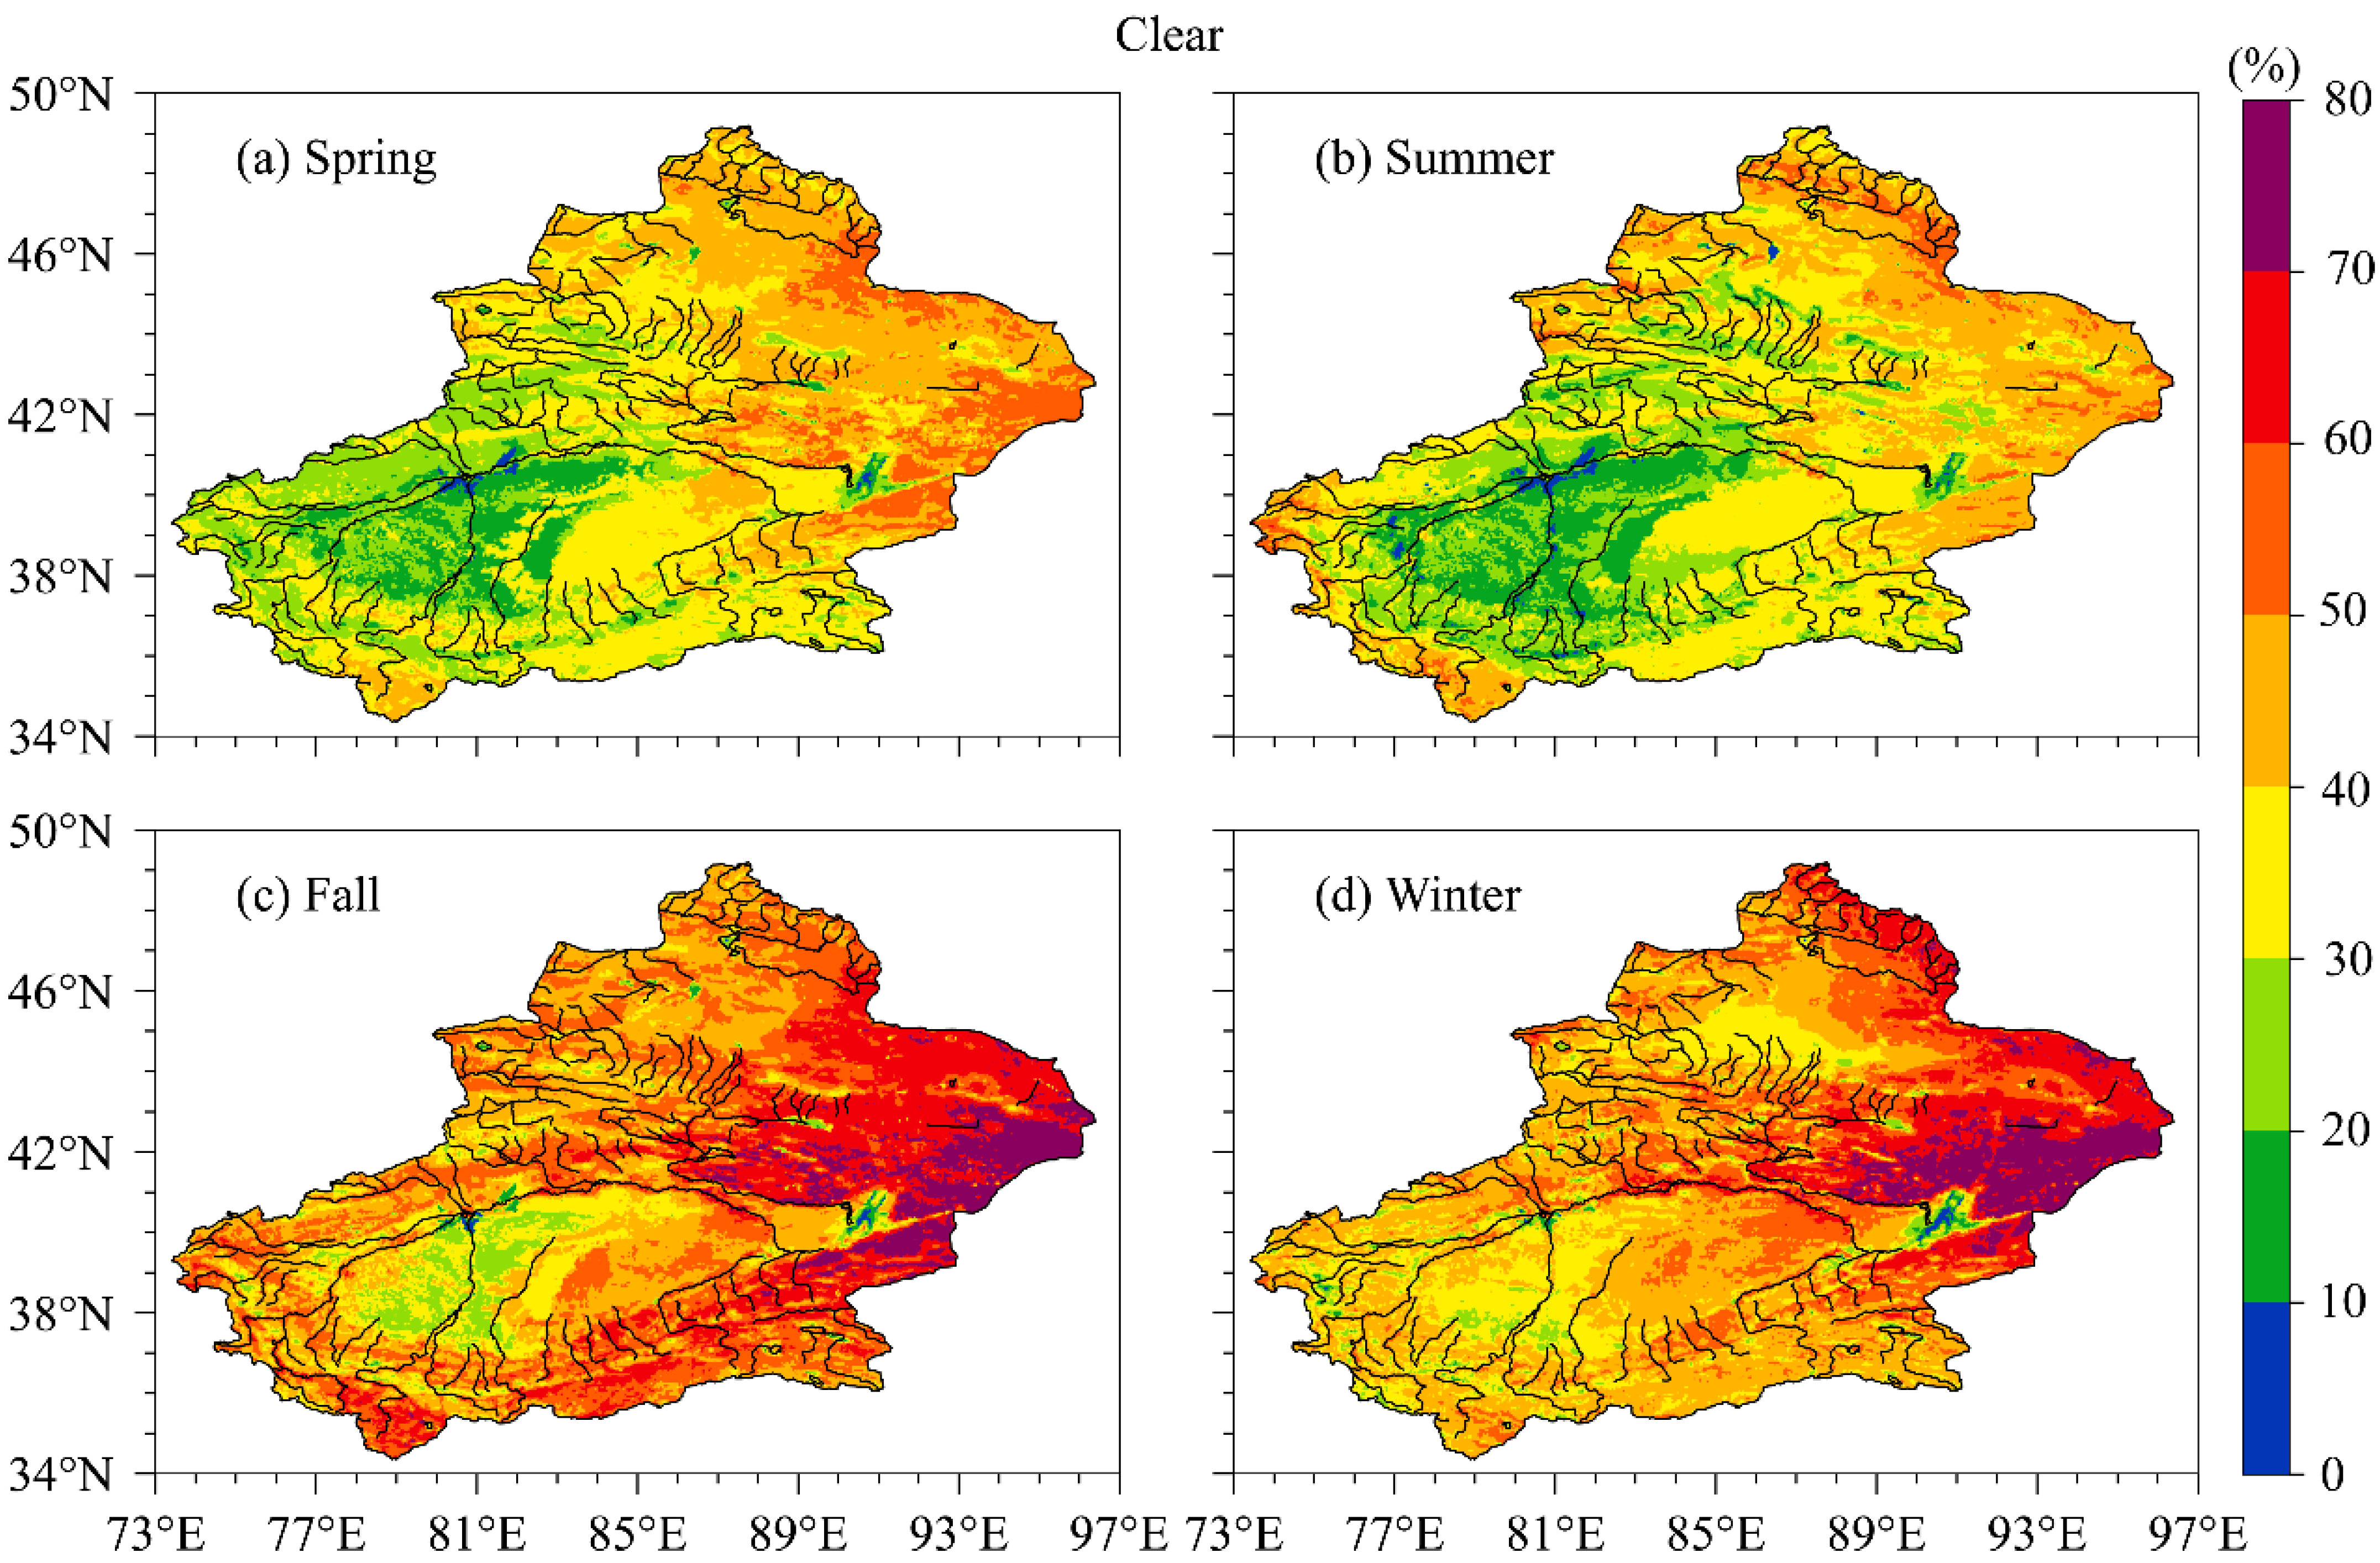
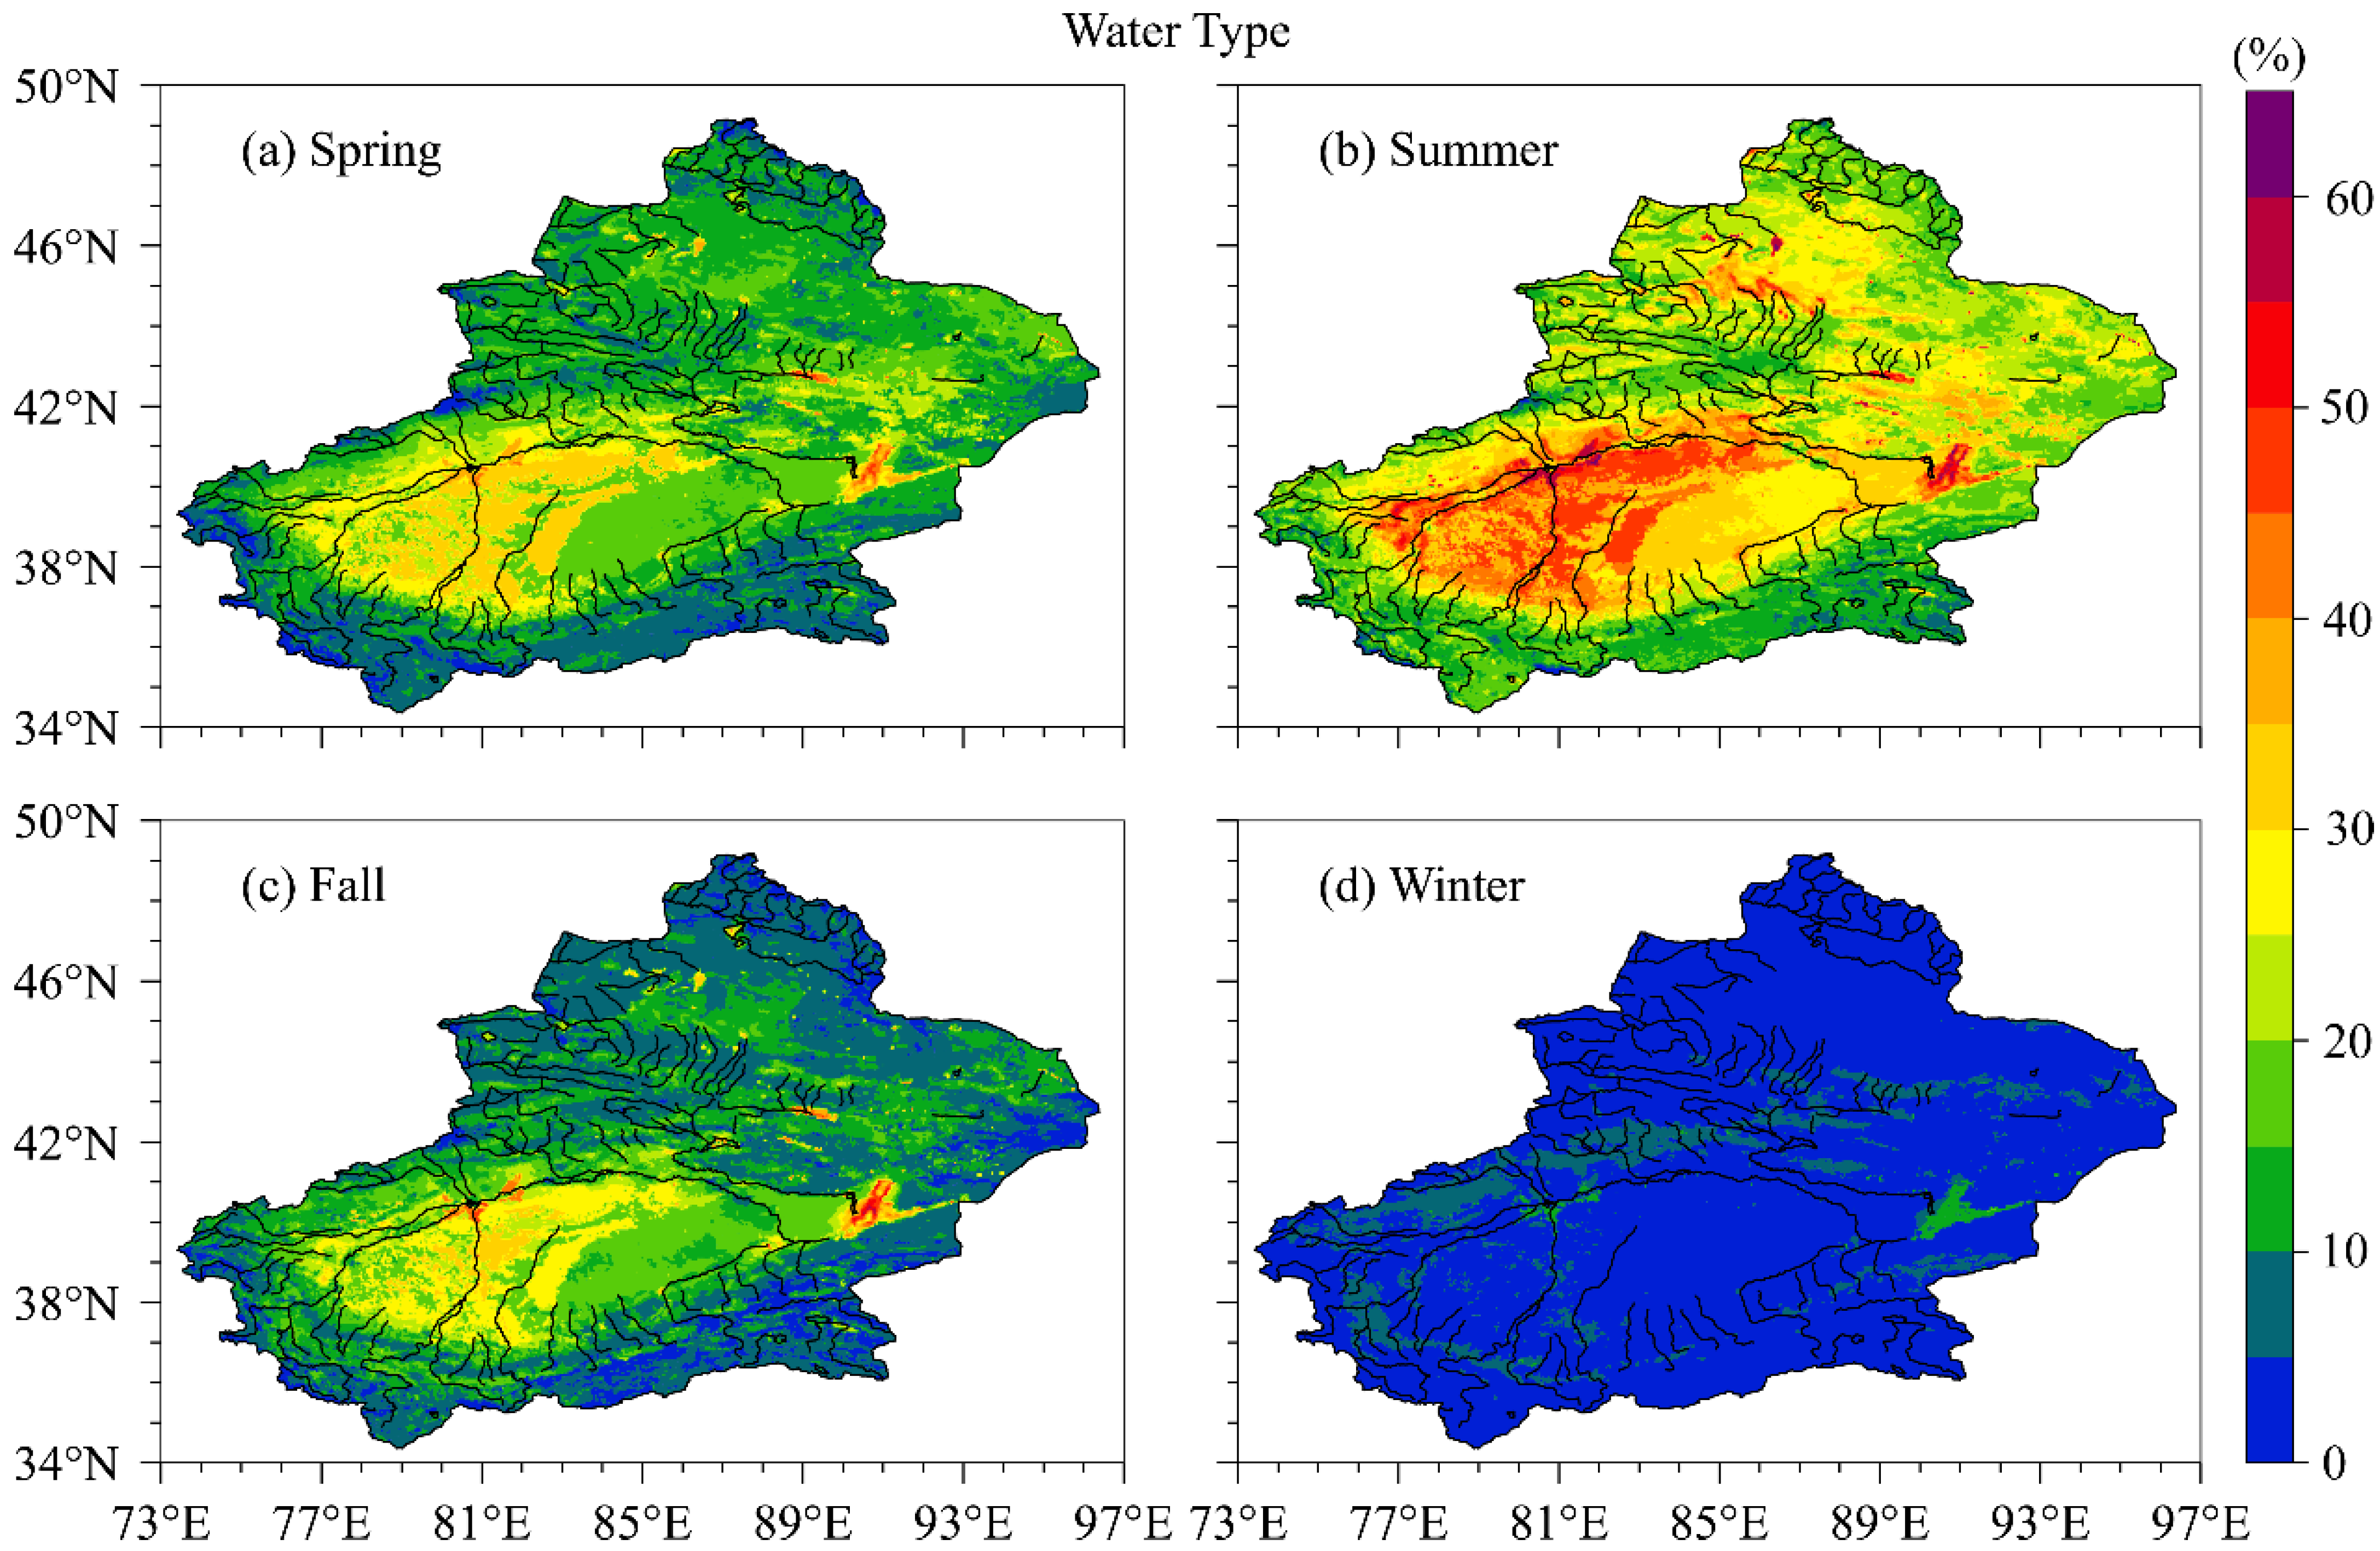
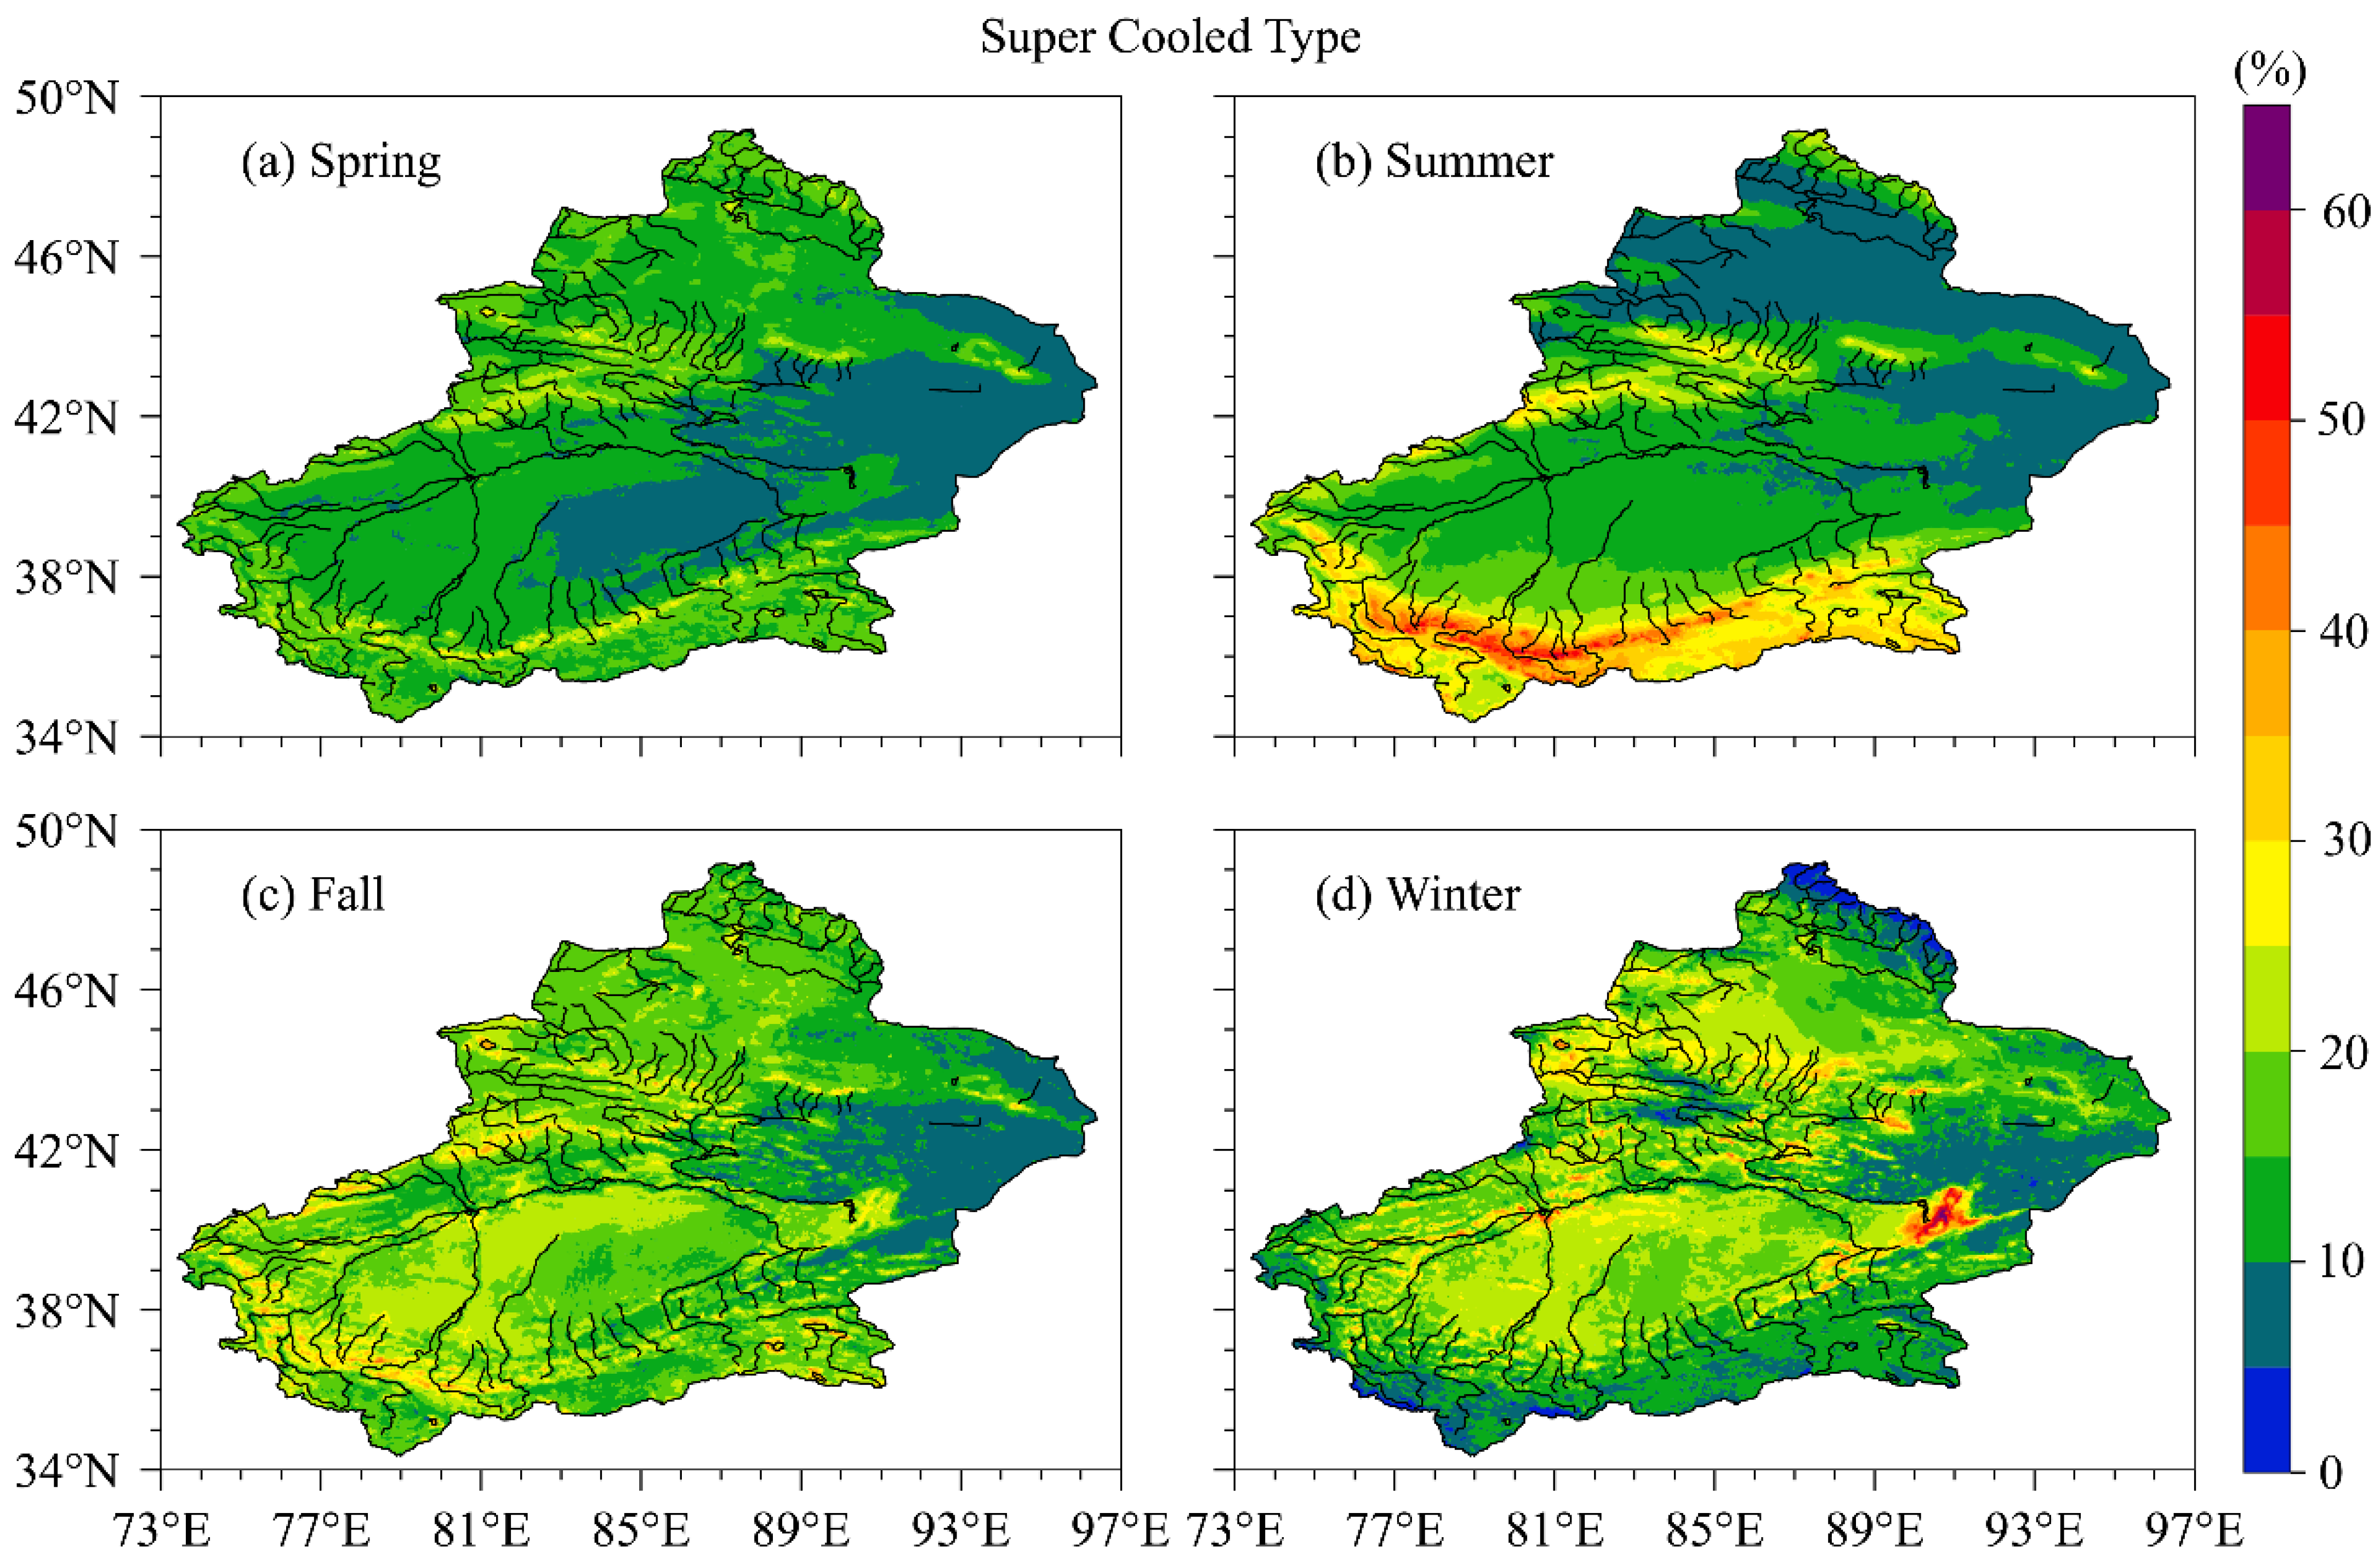
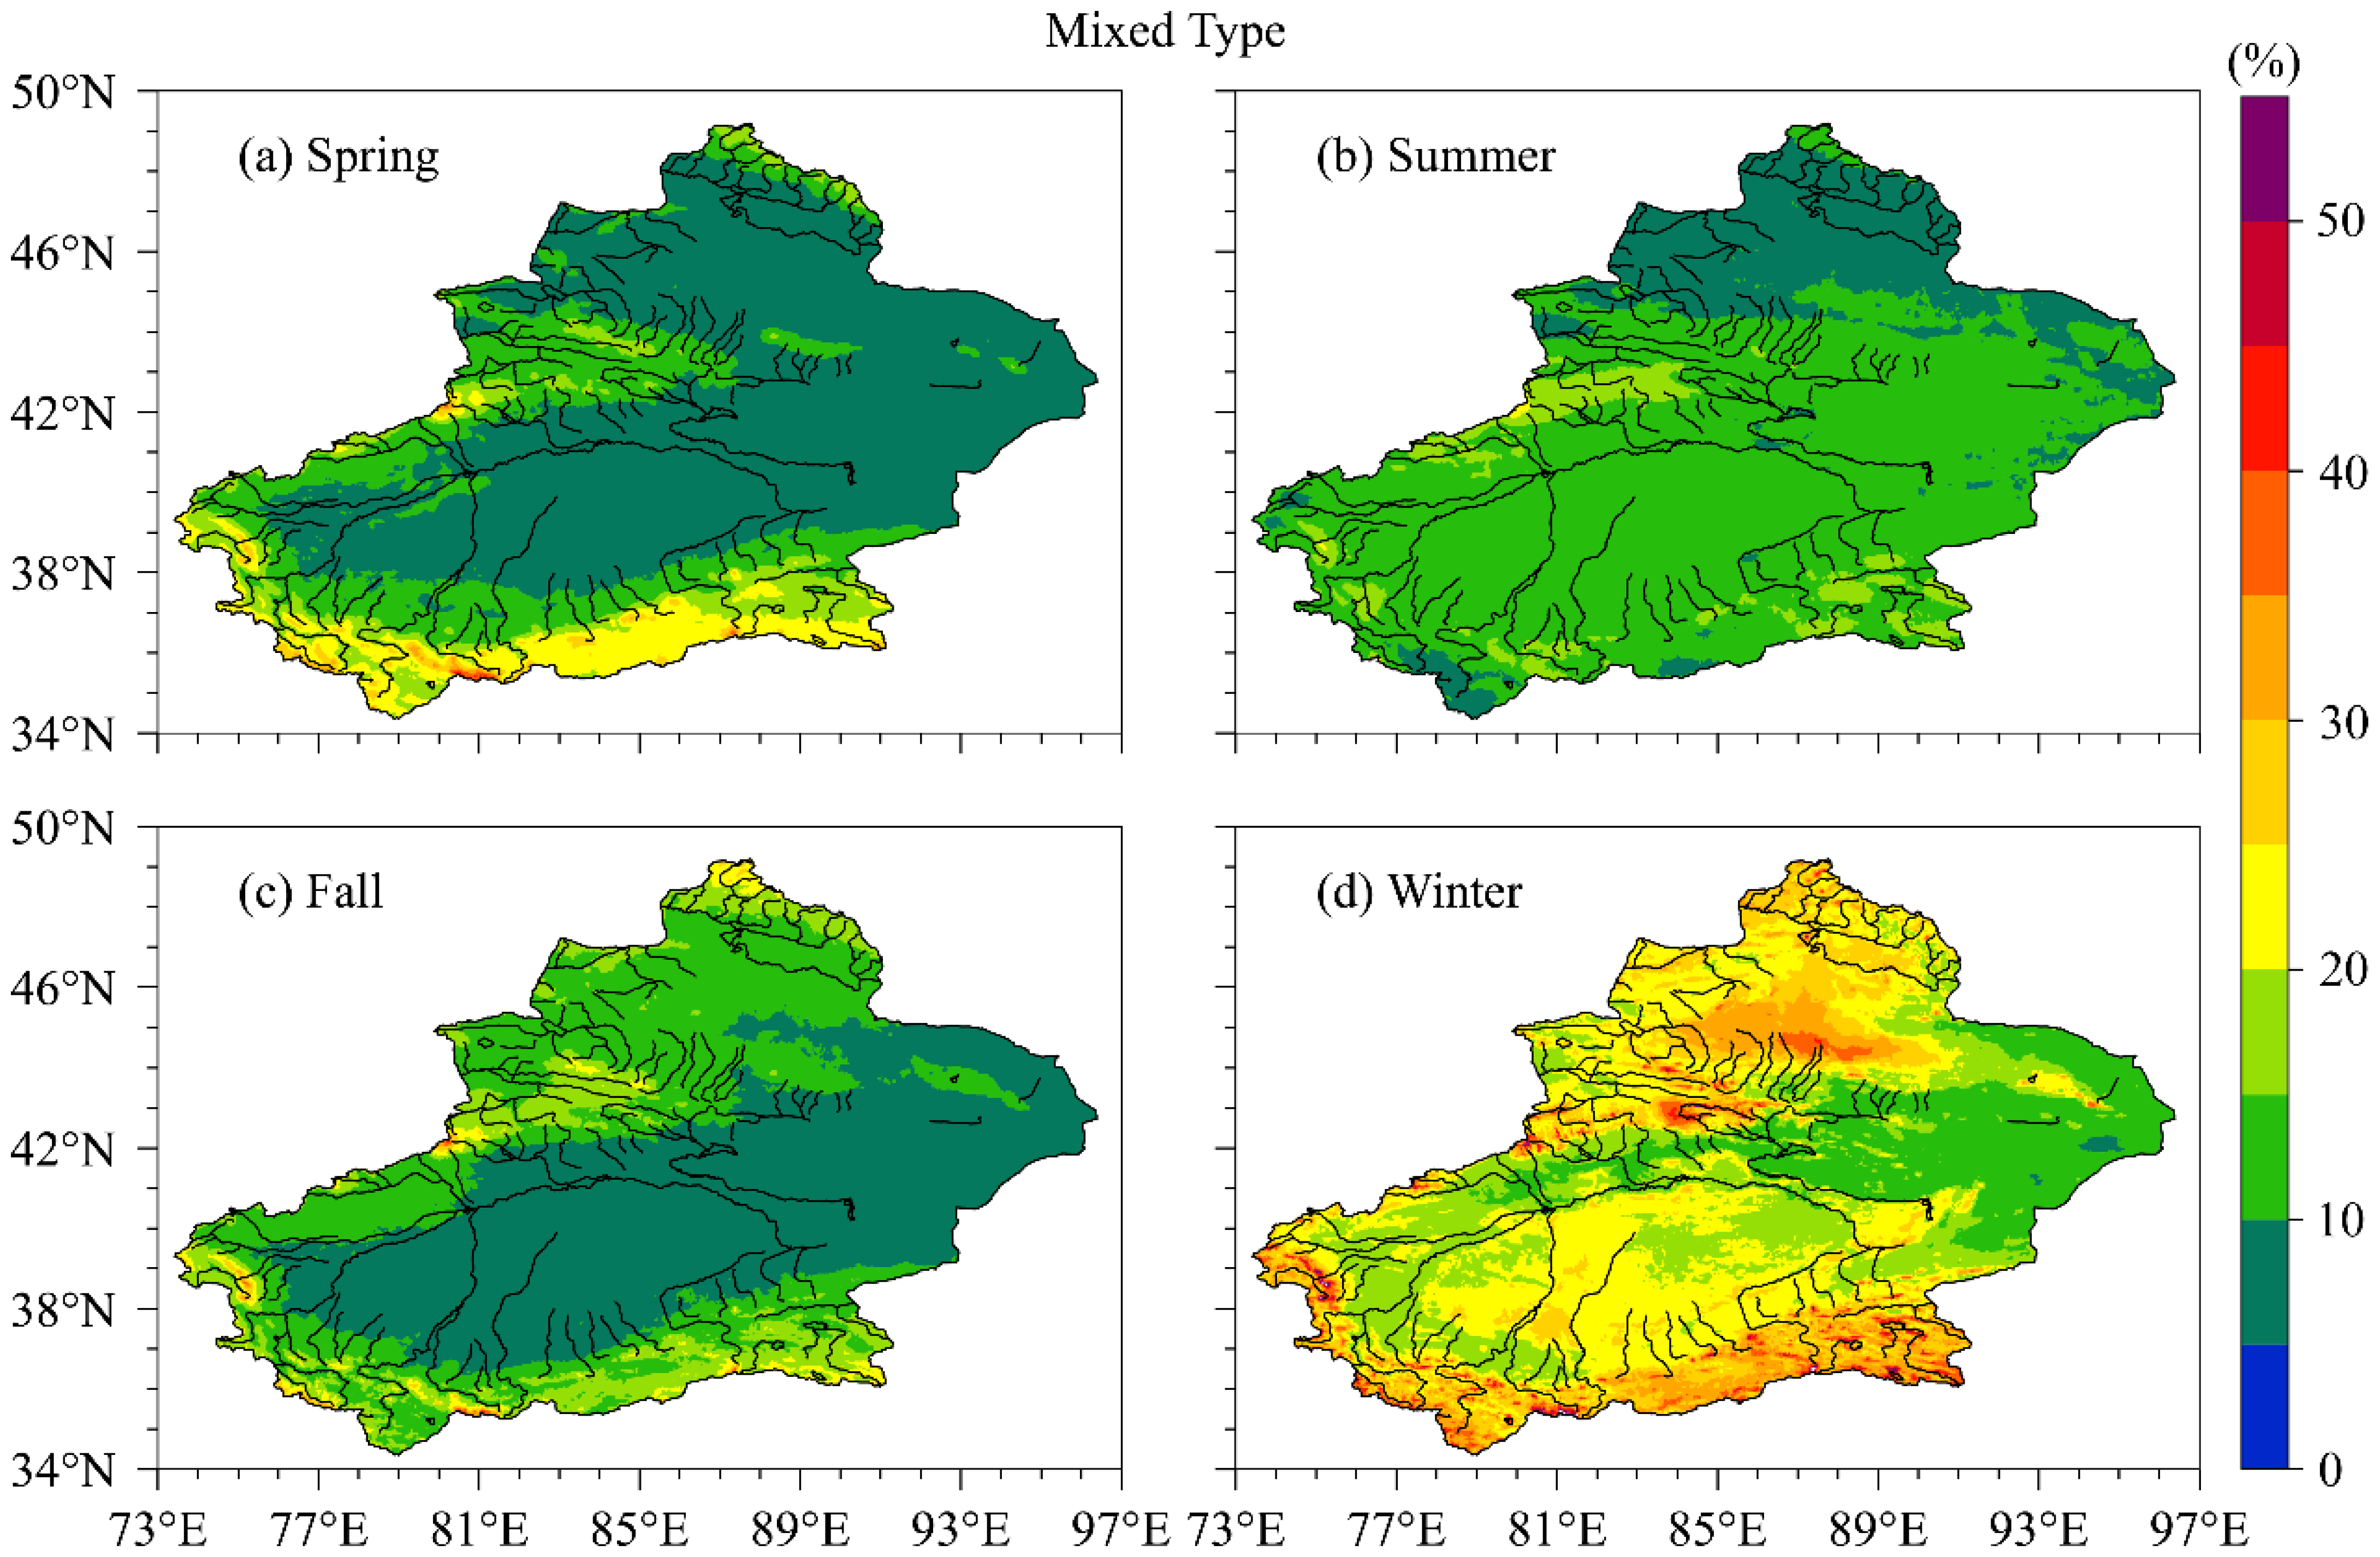
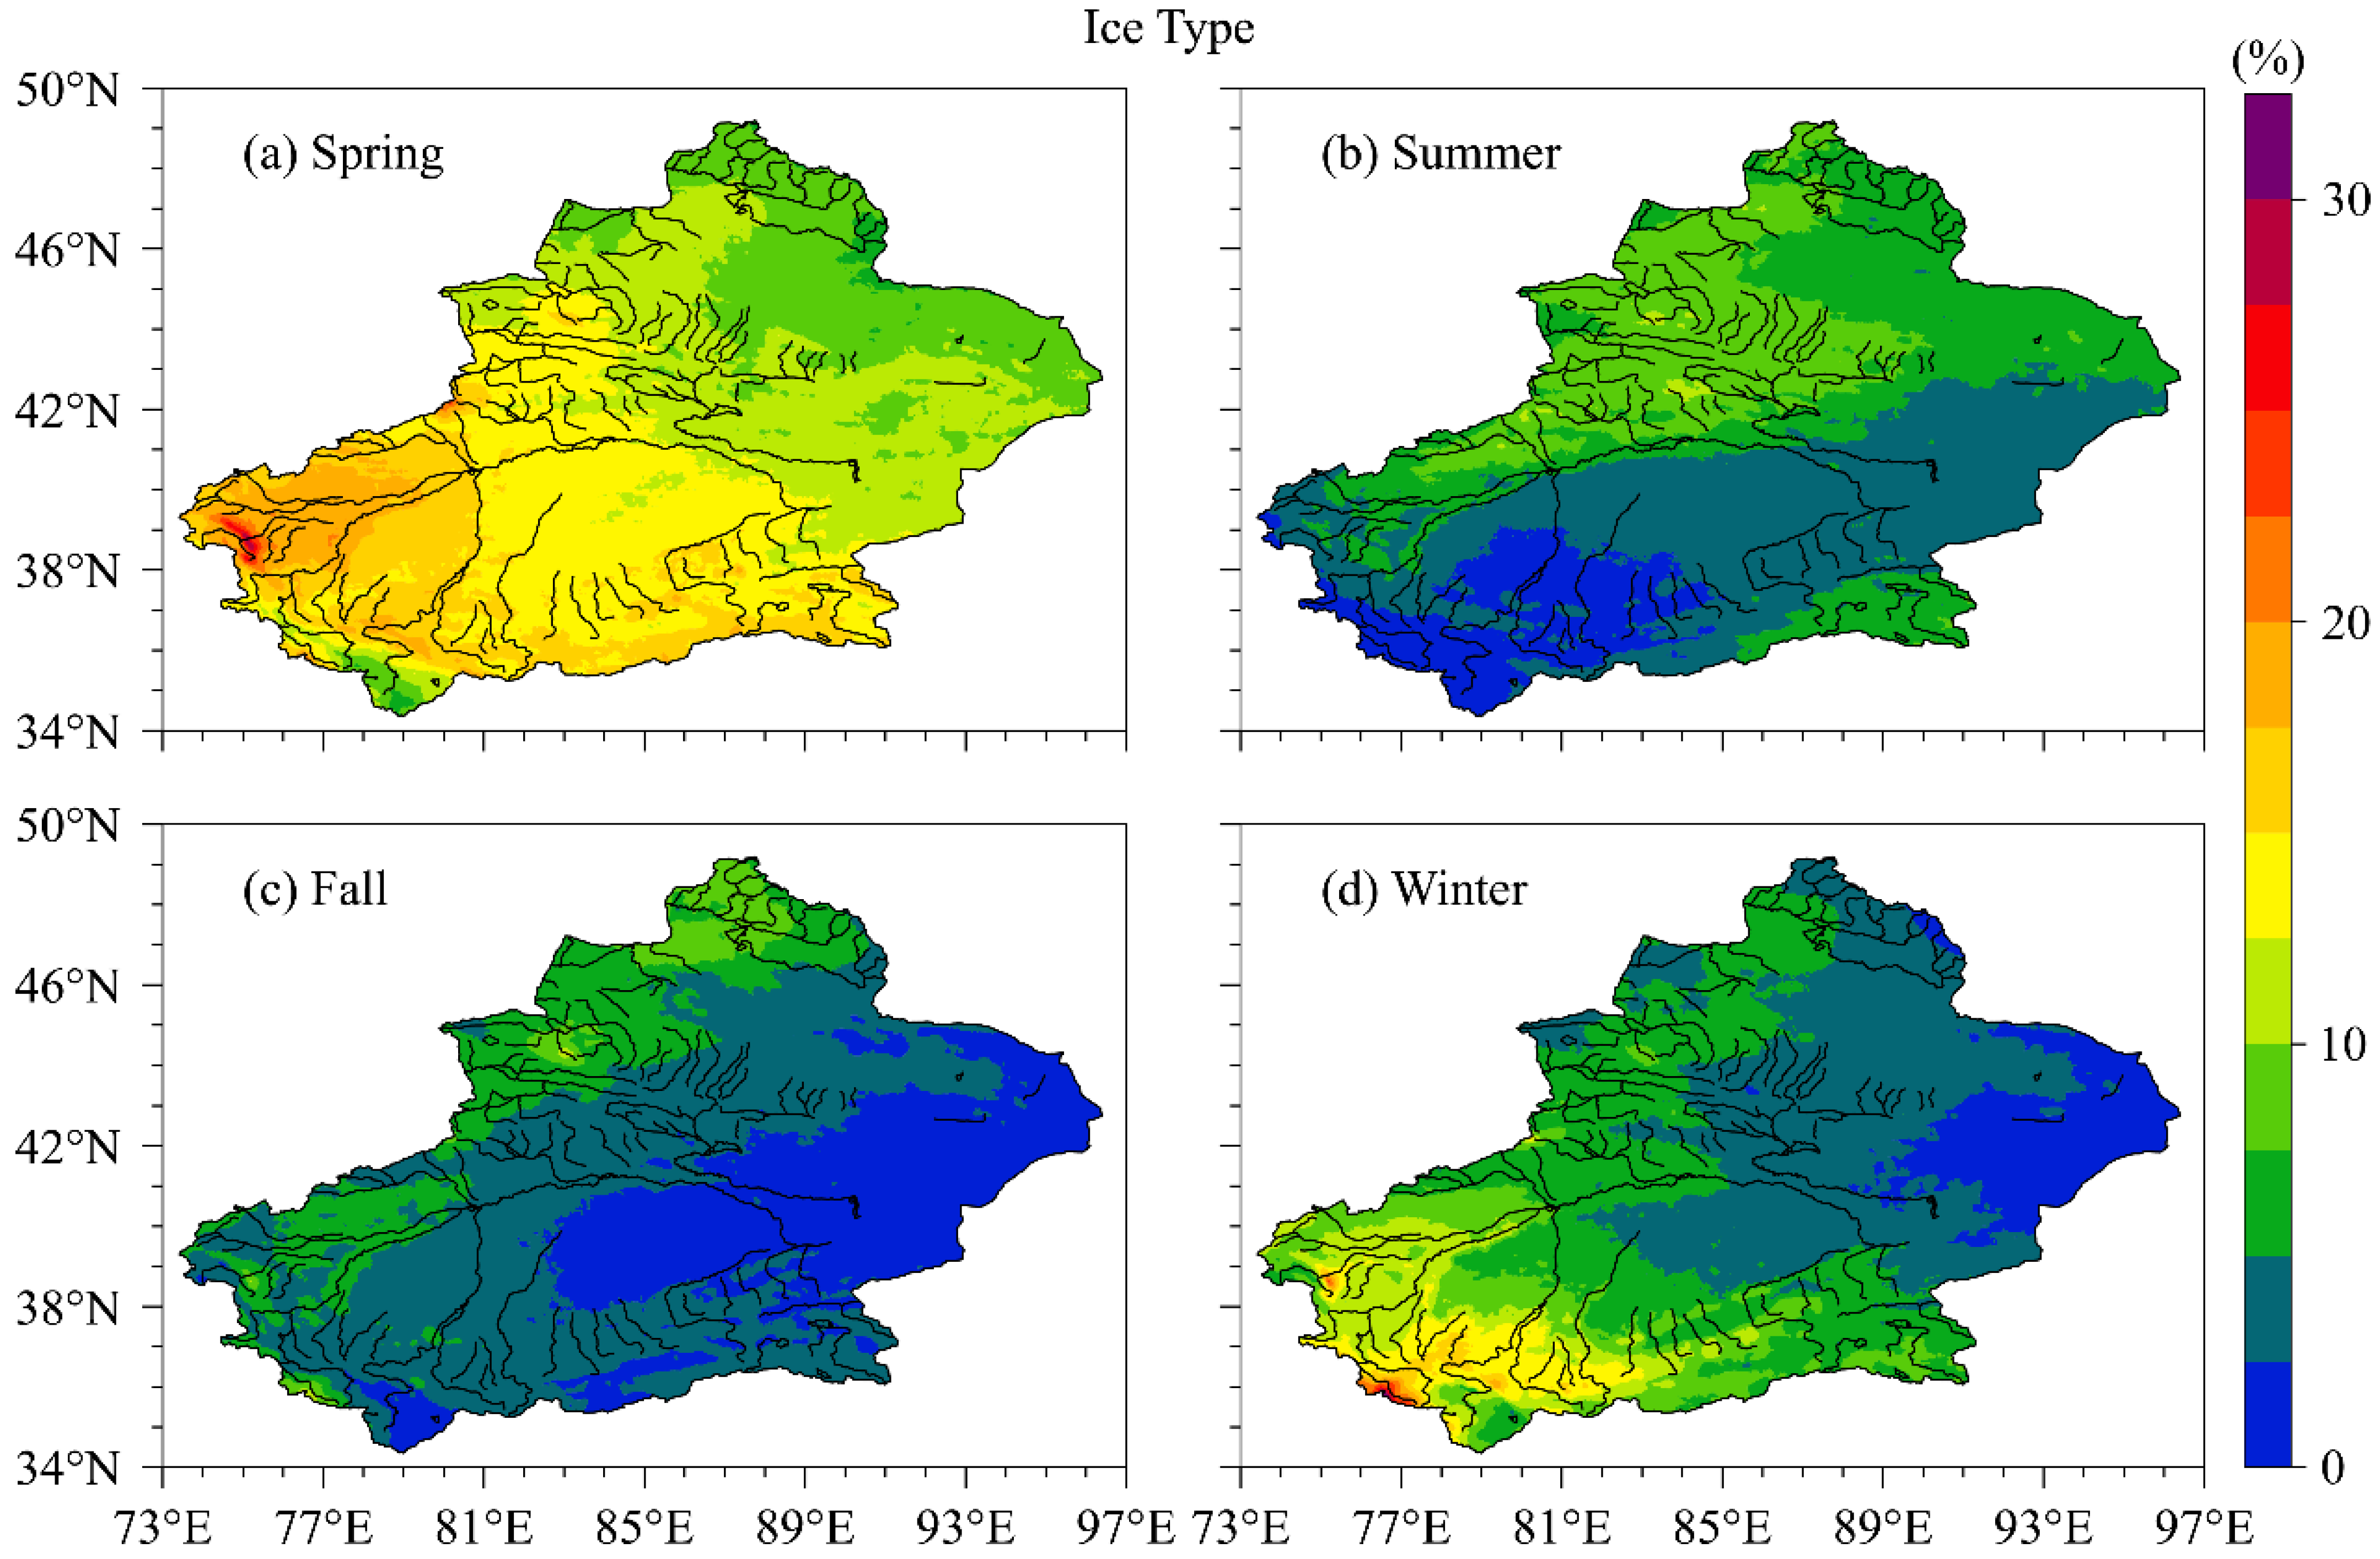
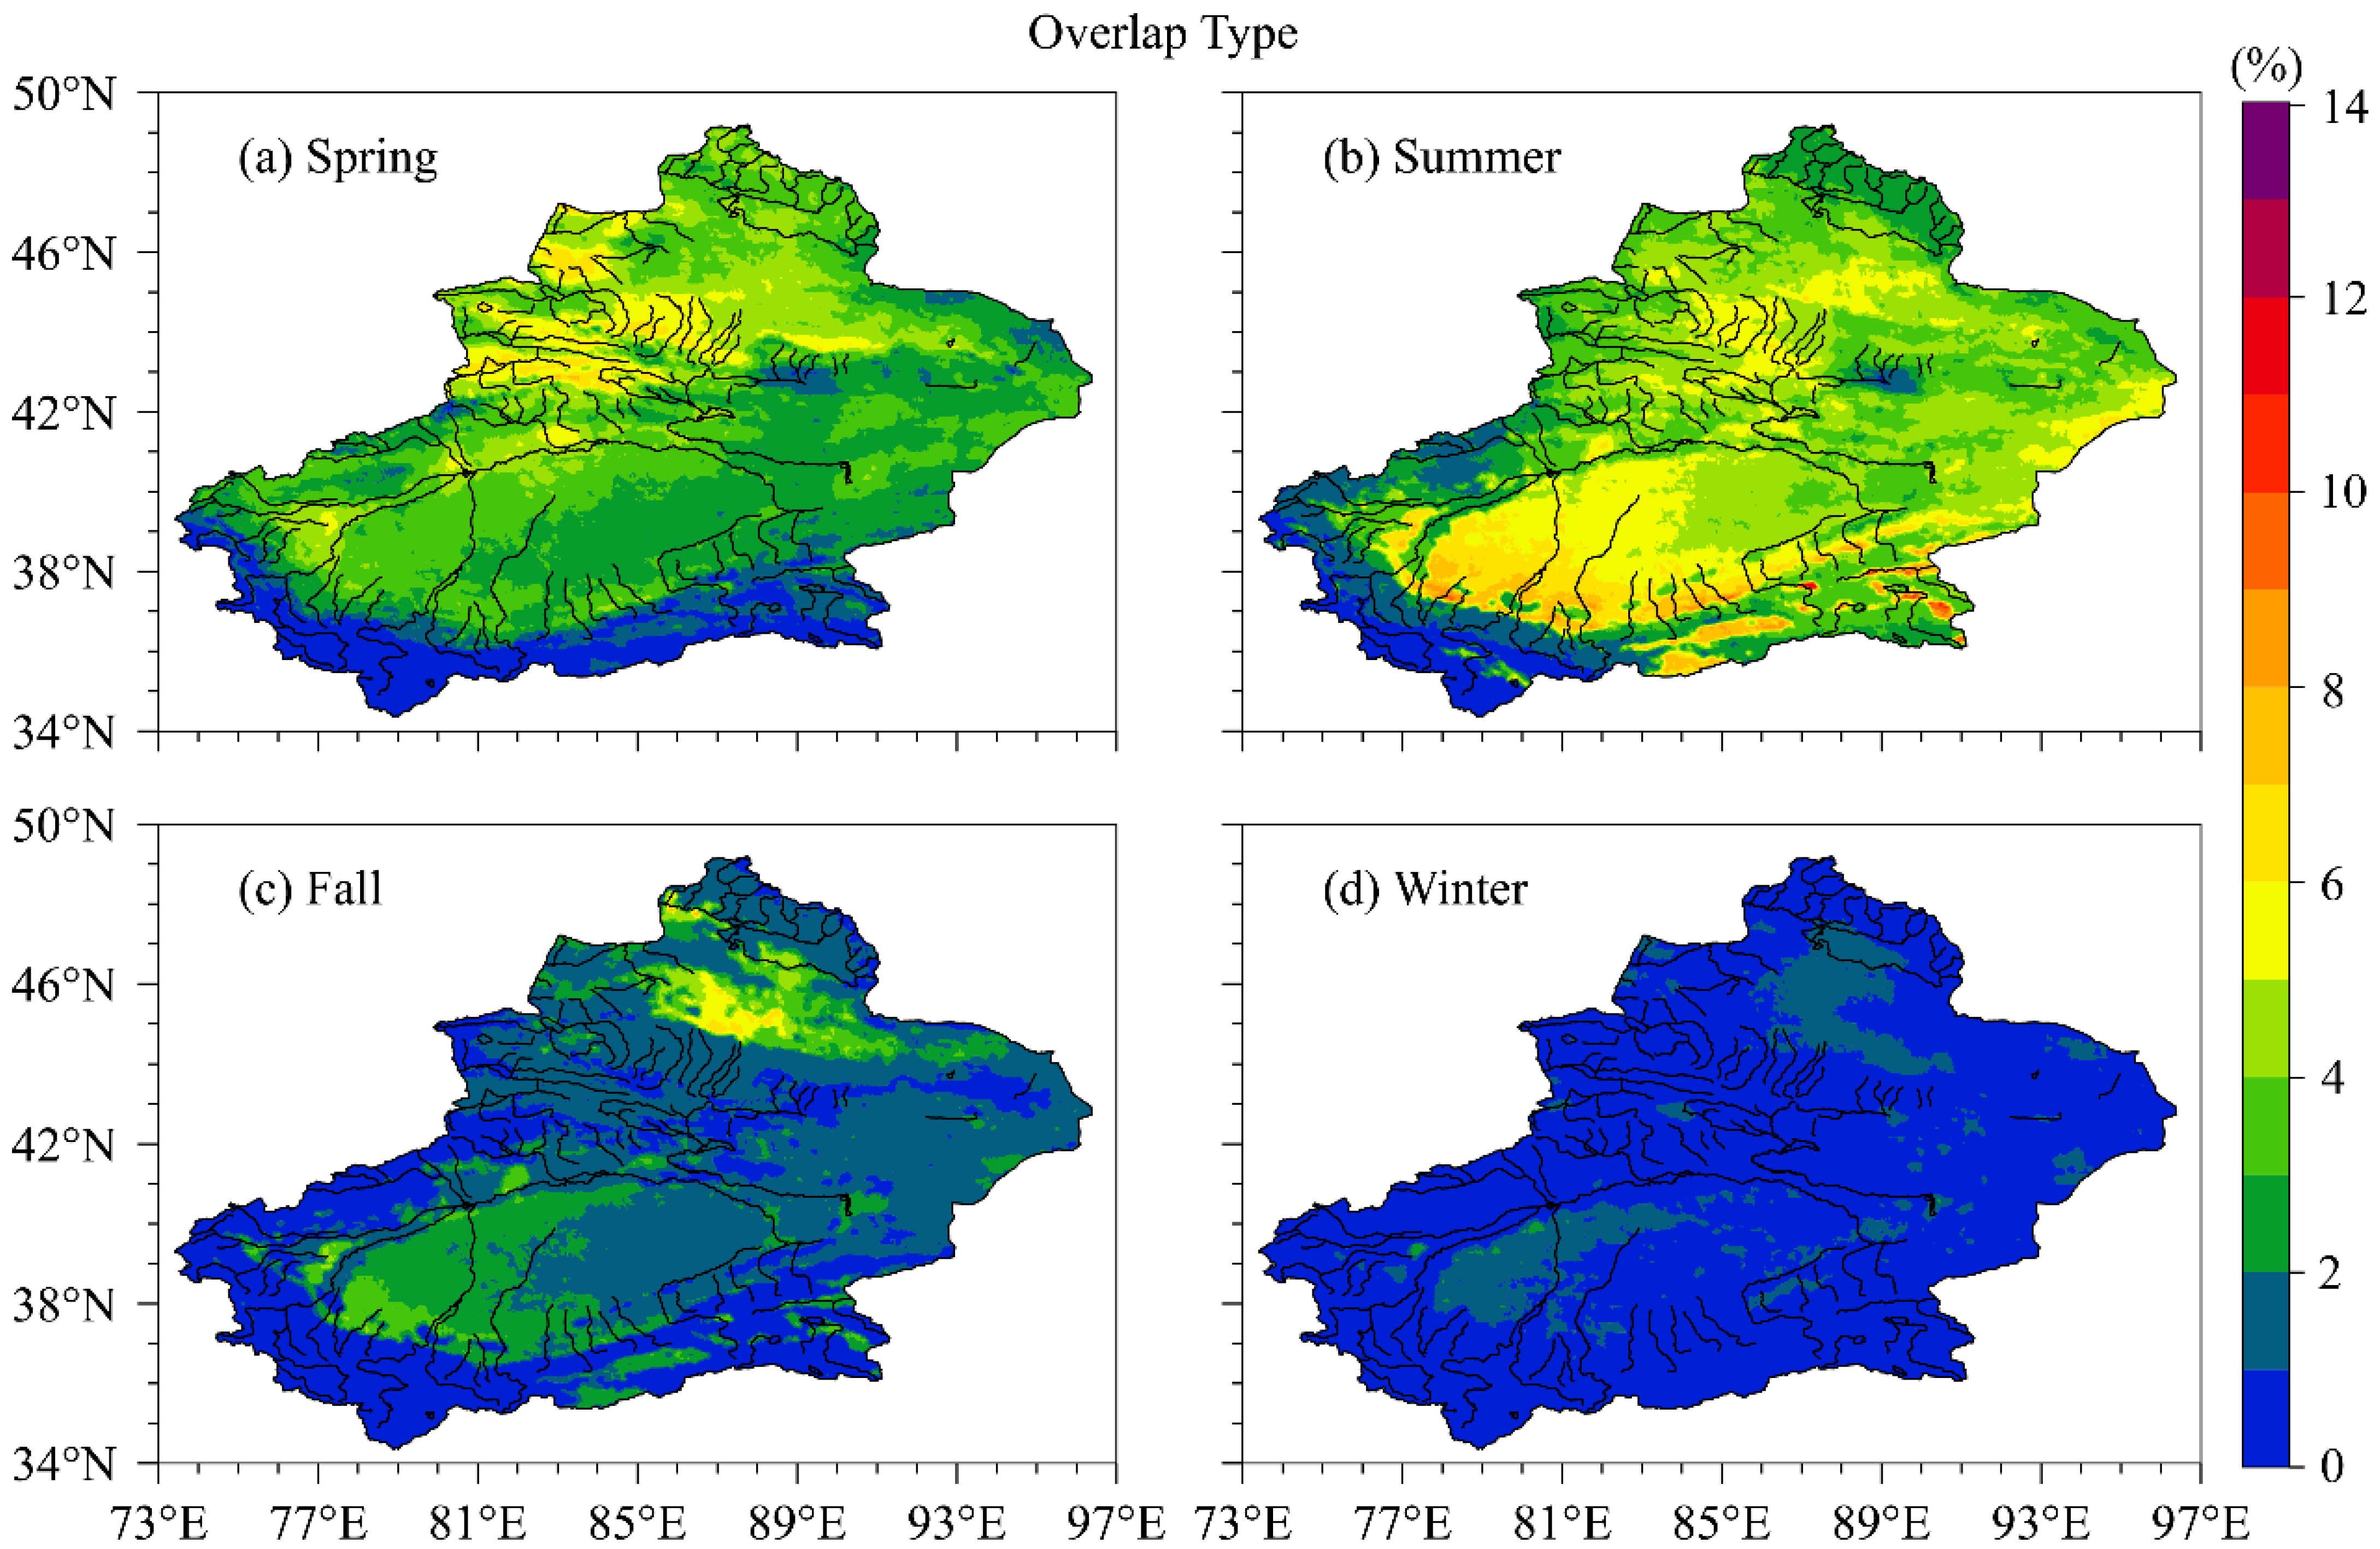
3.2. Seasonal Variation in Cloud Type

The cloud type (CLT) from FY-4A categorizes clouds into seven categories: clear, water-type, supercooled-type, mixed-type, ice-type, cirrus-type, and overlap-type. Figure 7 shows the seasonal variation in the spatial distribution of clear frequency in XJ. In spring, the clear frequency was high in the southwest and low in the northeast. Less than 30% of the low-frequency areas were mainly located in the west of the Tarim Basin, while more than 40% of the high-frequency areas were mainly located in the east and north of XJ (Figure 7a). The spatial distribution of clear frequency in summer was similar to that in spring, but there was an increase in the western Kunlun Mountains and a decrease in eastern XJ (Figure 7b). Compared with spring and summer, the spatial distribution of clear frequency increased significantly in fall, with more than 60% in eastern XJ and more than 40% in the eastern Tarim Basin (Figure 7c). Compared with fall, the clear frequency increased in the western Tarim Basin in winter, and the eastern XJ was still a high-frequency center (Figure 7d). In addition, according to the clear frequency and the corresponding positions of rivers and lakes, the distribution of rivers and lakes may be a factor that affects the clear frequency less in the Tarim Basin, but more in the eastern XJ.
Figure 8 shows the seasonal variation in the spatial distribution of water-type frequency in XJ. In spring, the high-frequency region with a frequency of more than 30% was mainly located in the west of the Tarim Basin, while the low-frequency region with a frequency of less than 15% was located in the Kunlun Mountains, Tianshan Mountains, and Altai Mountains (Figure 8a). The frequency of water-type in summer was significantly higher than that in spring. More than 40% of the high-frequency area was still located in the west of the Tarim Basin, while less than 25% of the low-frequency area was still located in the main mountains of XJ (Figure 8b). The frequency of water-type in fall was significantly lower than that in summer. More than 25% of the high-frequency area was still located in the west of the Tarim Basin, while less than 10% of the low-frequency area was located in the main mountains and eastern XJ (Figure 8c). The frequency of water-type in winter was the lowest among the four seasons, and in most areas of XJ, it was below 5% (Figure 8d). From Figure 8, it can also be seen that rivers and lakes have a positive impact on the spatial distribution of water-type frequency in XJ, especially in the southwest of XJ.
Figure 9 shows the seasonal variation in the spatial distribution of supercooled-type frequency in XJ. The frequency of supercooled-type in spring showed a distribution pattern of high in the west and low in the east in XJ. Specifically, the high-frequency center was located in the high-altitude areas of the Kunlun Mountains and Tianshan Mountains, reaching over 20%, while the low-frequency center was located in eastern XJ, less than 10% (Figure 9a). Compared to spring, the frequency of supercooled-type in summer increased significantly in the Kunlun Mountains, with most of the Kunlun Mountains increasing to over 30% and some areas reaching over 40%, while the Tianshan Mountains were a sub high-frequency center of over 25% (Figure 9b). Compared with summer, the frequency of supercooled-type in fall decreased (increased) in the Kunlun Mountains (Tarim Basin and Junggar Basin), and the Kunlun Mountains and Tianshan Mountains were high-frequency regions of more than 25% (Figure 9c). Compared to fall, the frequency of supercooled-type decreased (increased) in mountainous (basins) areas in winter (Figure 9d). Overall, supercooled-type exhibited significant seasonal distribution characteristics, with high-altitude mountainous areas being the high-frequency zone.
Figure 10 shows the seasonal variation in the spatial distribution of mixed-type frequency in XJ. The high-frequency region of mixed-type in spring was located in mountainous areas and increased with the increase in altitude. The Kunlun Mountains were a high-frequency center of more than 20%, and the Tianshan Mountains and Altai Mountains were a sub high-frequency region of more than 10% (Figure 10a). Compared with spring, the frequency of mixed-type increased in the eastern Tarim Basin and eastern XJ and decreased in the Kunlun Mountains during summer (Figure 10b). Compared with summer, the frequency of mixed-type in fall decreased in the Tarim Basin and increased in the Junggar Basin (Figure 10c). Winter was the season with the highest frequency of mixed-type. The mountain area and the Junggar Basin were high-frequency areas of more than 30%, and other areas were basically below 25% (Figure 10d). The frequency distribution of mixed-type was closely related to terrain, with high mountain areas as the high-frequency center.
Figure 11 shows the seasonal variation in the spatial distribution of ice-type frequency in XJ. In spring, the frequency of ice-type was high in the southwest and low in the northeast. The western Kunlun Mountains was a high-frequency center of more than 25%, while the eastern Junggar Basin was a low-frequency area of less than 10% (Figure 11a). The frequency distribution of ice-type in summer was significantly different from that in spring, with a distribution pattern of high in the north and low in the south in summer (Figure 11b). The frequency distribution of ice-type showed a characteristic of high in the northwest and low in the southeast in fall, with over 5% (less than 2.5%) in the northwest (southeast) of XJ (Figure 11c). The frequency distribution of ice-type showed a characteristic of high in the southwest and low in the northeast in winter, with the western Kunlun Mountains (eastern XJ) being a high-frequency (low-frequency) region of over 15% (less than 5%) (Figure 11d).
Figure 12 shows the seasonal variation in the spatial distribution of cirrus-type frequency in XJ. In spring, the frequency of cirrus-type was the highest in the Tarim Basin, reaching more than 10%, while the Kunlun Mountains and the eastern Junggar Basin were low-frequency regions below 7.5% (Figure 12a). Compared to spring, the frequency of cirrus-type significantly decreased throughout XJ in summer (Figure 12b). In fall, the most cirrus-type appeared in the Tarim Basin, which was a high-frequency area of more than 5%, while the least cirrus-type appeared in the Kunlun Mountains, Altai Mountains, and eastern Xinjiang, which was a low-frequency area of less than 2.5% (Figure 12c). In winter, the frequency of cirrus-type in XJ was high in the southwest and low in the northeast. The Tarim Basin had a high-frequency area of more than 5%, while eastern Xinjiang had a low-frequency area of less than 2.5% (Figure 12d).
Figure 13 shows the seasonal variation in the spatial distribution of overlap-type frequency in XJ. In spring, the Tianshan Mountains and the southern Junggar Basin were high-frequency regions with an overlap-type frequency above 5%, while the Kunlun Mountains were a low-frequency region with an overlap-type frequency below 1% (Figure 13a). In summer, the southern Tarim Basin was a high-frequency region with an overlap-type frequency over 6%, while the western Kunlun Mountains were a low-frequency region with an overlap-type frequency of less than 1% (Figure 13b). In fall, for the frequency of overlap-type, except for the central Junggar Basin, the rest of XJ was lower than that in summer. The central Junggar Basin was a high-frequency center of more than 4%, while the rest of XJ was a low-frequency region of less than 2% (Figure 13c). The distribution pattern of overlap-type frequency was similar in winter and fall, but the frequency further decreased in winter, with the frequency dropping below 2% throughout XJ (Figure 13d).
Figure 14 shows the seasonal variation in the spatial distribution of CLT with the highest frequency among the seven types of CLT. It is worth noting that at any location in XJ during all seasons, neither cirrus-type nor overlap-type were the most frequent CLT, while the other five types of CLT had the highest frequency in at least one specific location in XJ during a certain season. In spring, the frequency of water-type in the central and western Tarim Basin was the highest among the seven types of CLT, the frequency of supercooled-type, ice-type, and mixed-type was the highest in some parts of Kunlun Mountains, and the frequency of clear was the highest in other regions of XJ (Figure 14a). The area with the highest frequency of supercooled-type in summer in XJ significantly increased compared to spring, with some areas of the Kunlun Mountains and Tianshan Mountains dominated by supercooled-type, and the area dominated by water-type further expanded compared to spring (Figure 14b). In fall, except for some areas in the western Tarim Basin that were dominated by water-type, and some areas in the Kunlun Mountains and Tianshan Mountains that were dominated by supercooled-type, the rest of XJ had the highest frequency of clear (Figure 14c). In winter, some areas in the southern Junggar Basin and the Kunlun Mountains were dominated by mixed-type. The frequency of supercooled-type was the highest in some areas of southern Xinjiang, and the frequency of clear was the highest in other areas of Xinjiang (Figure 14d).

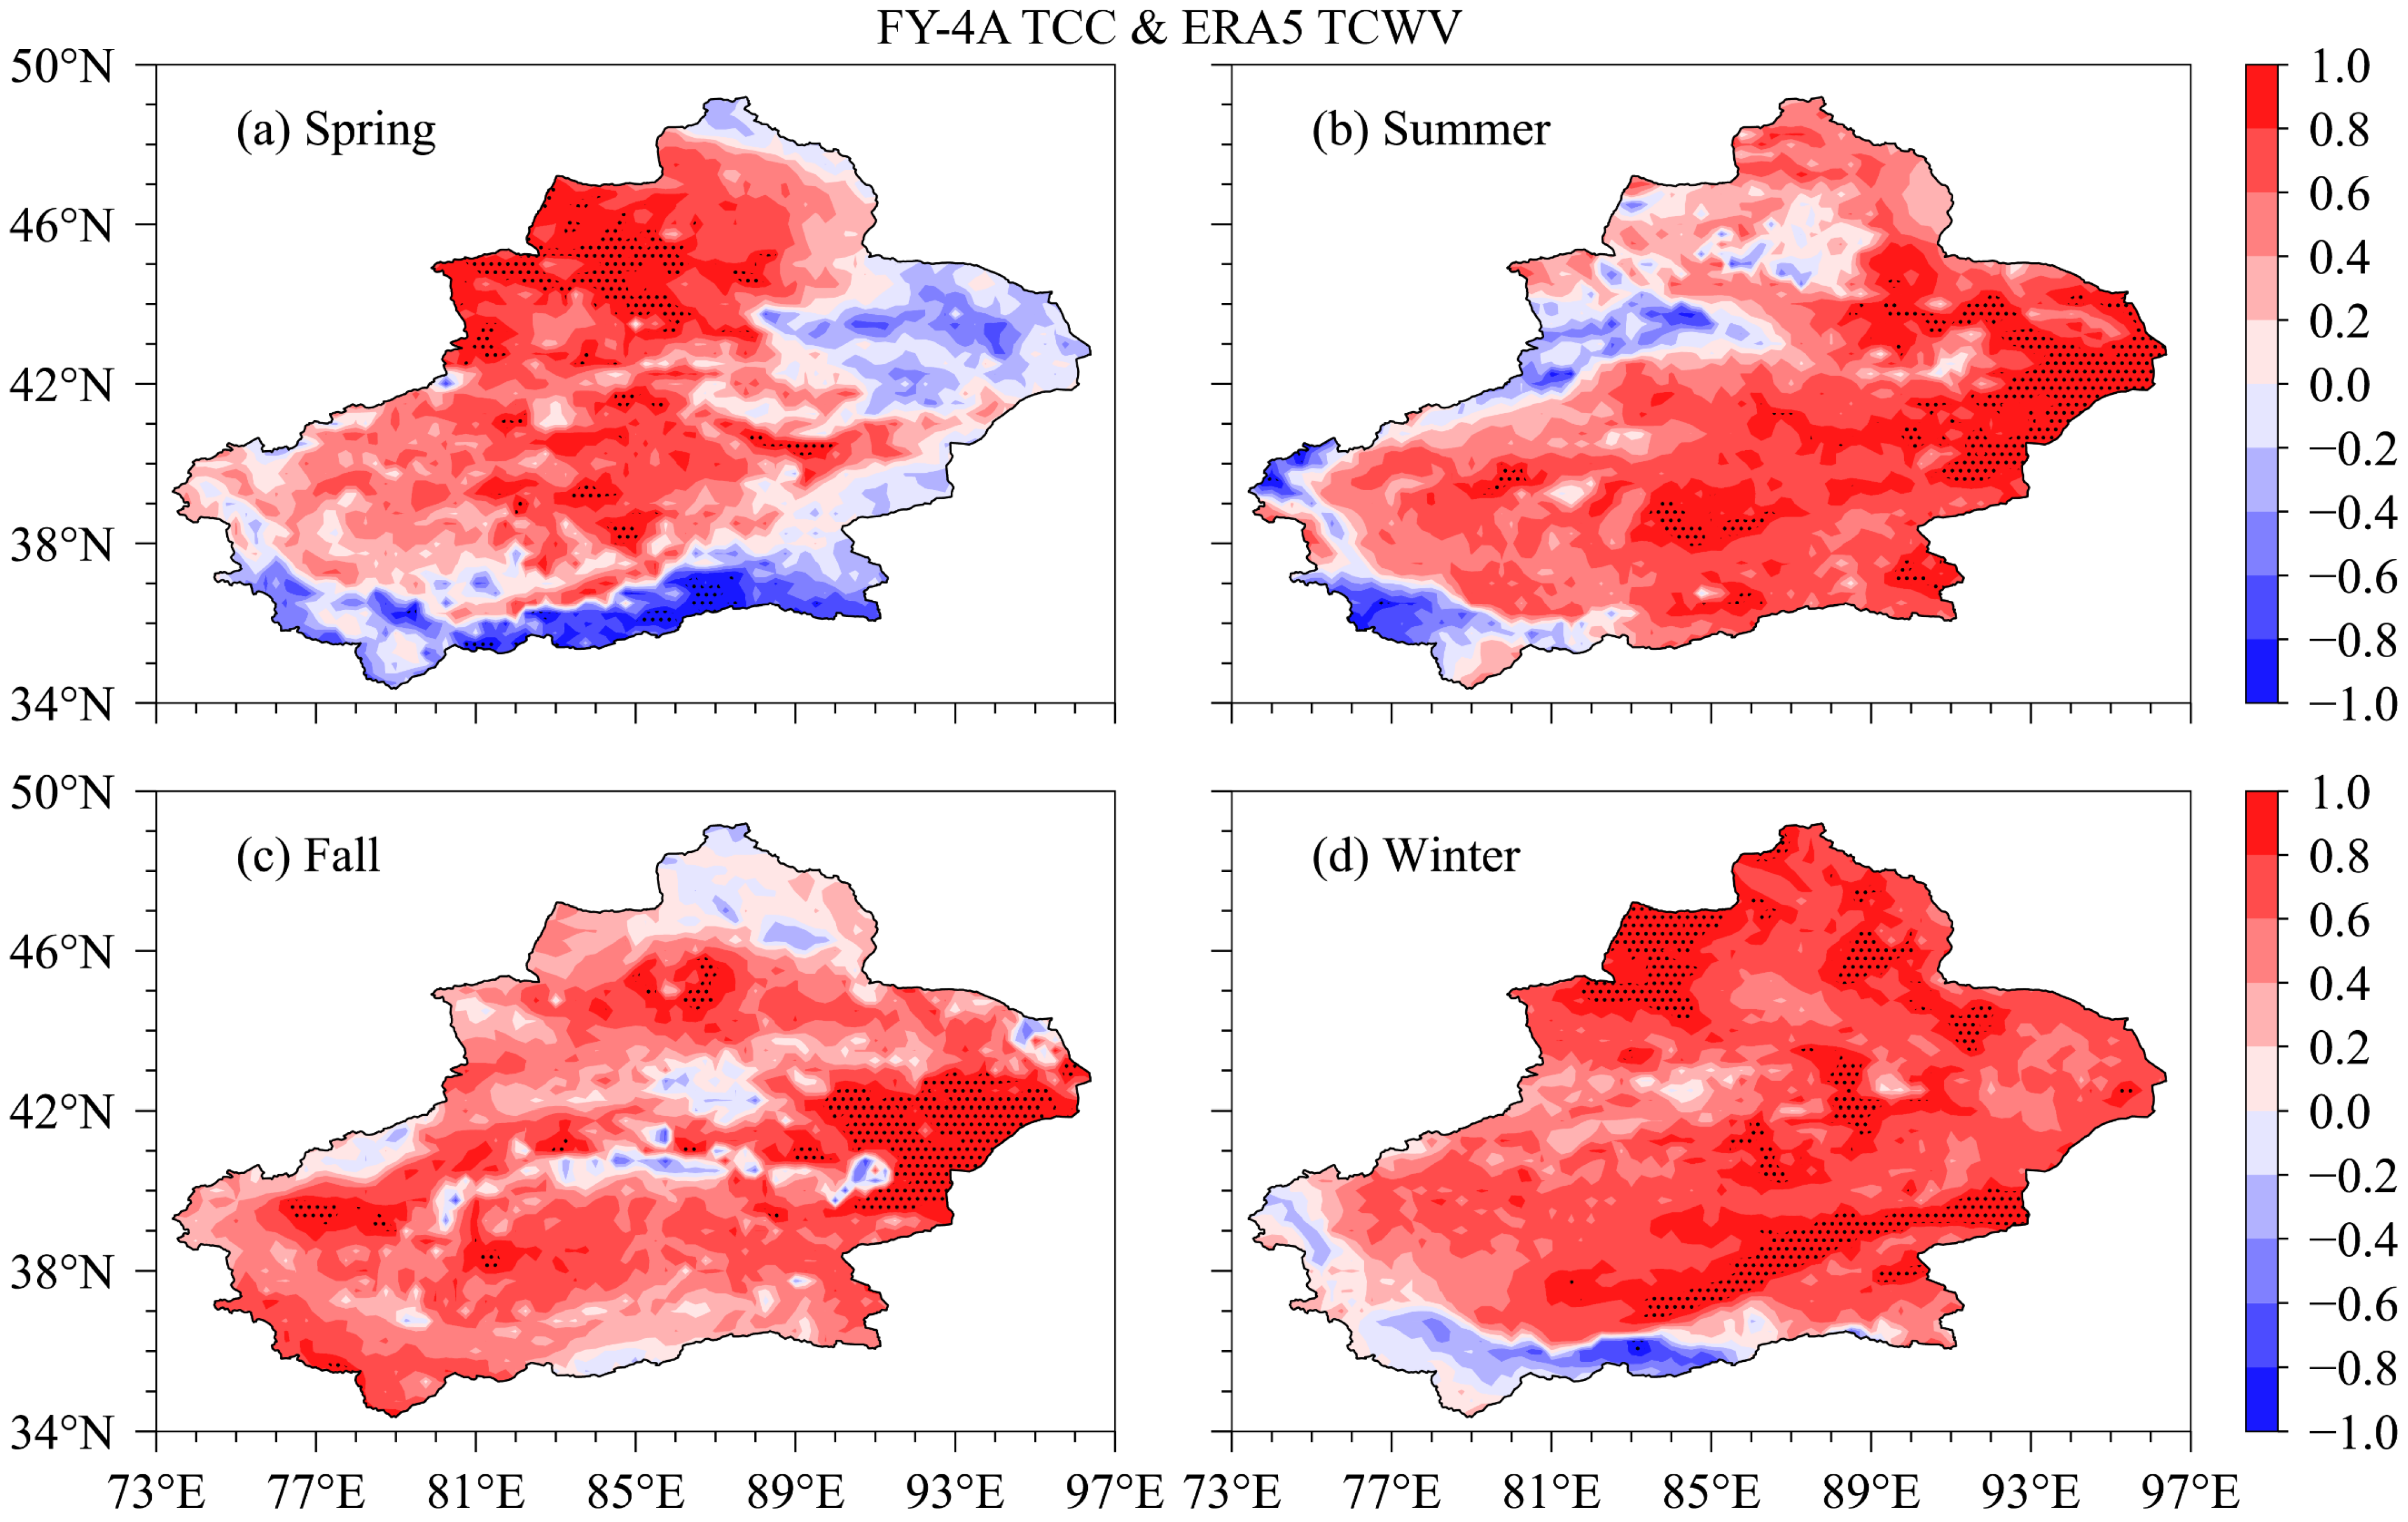
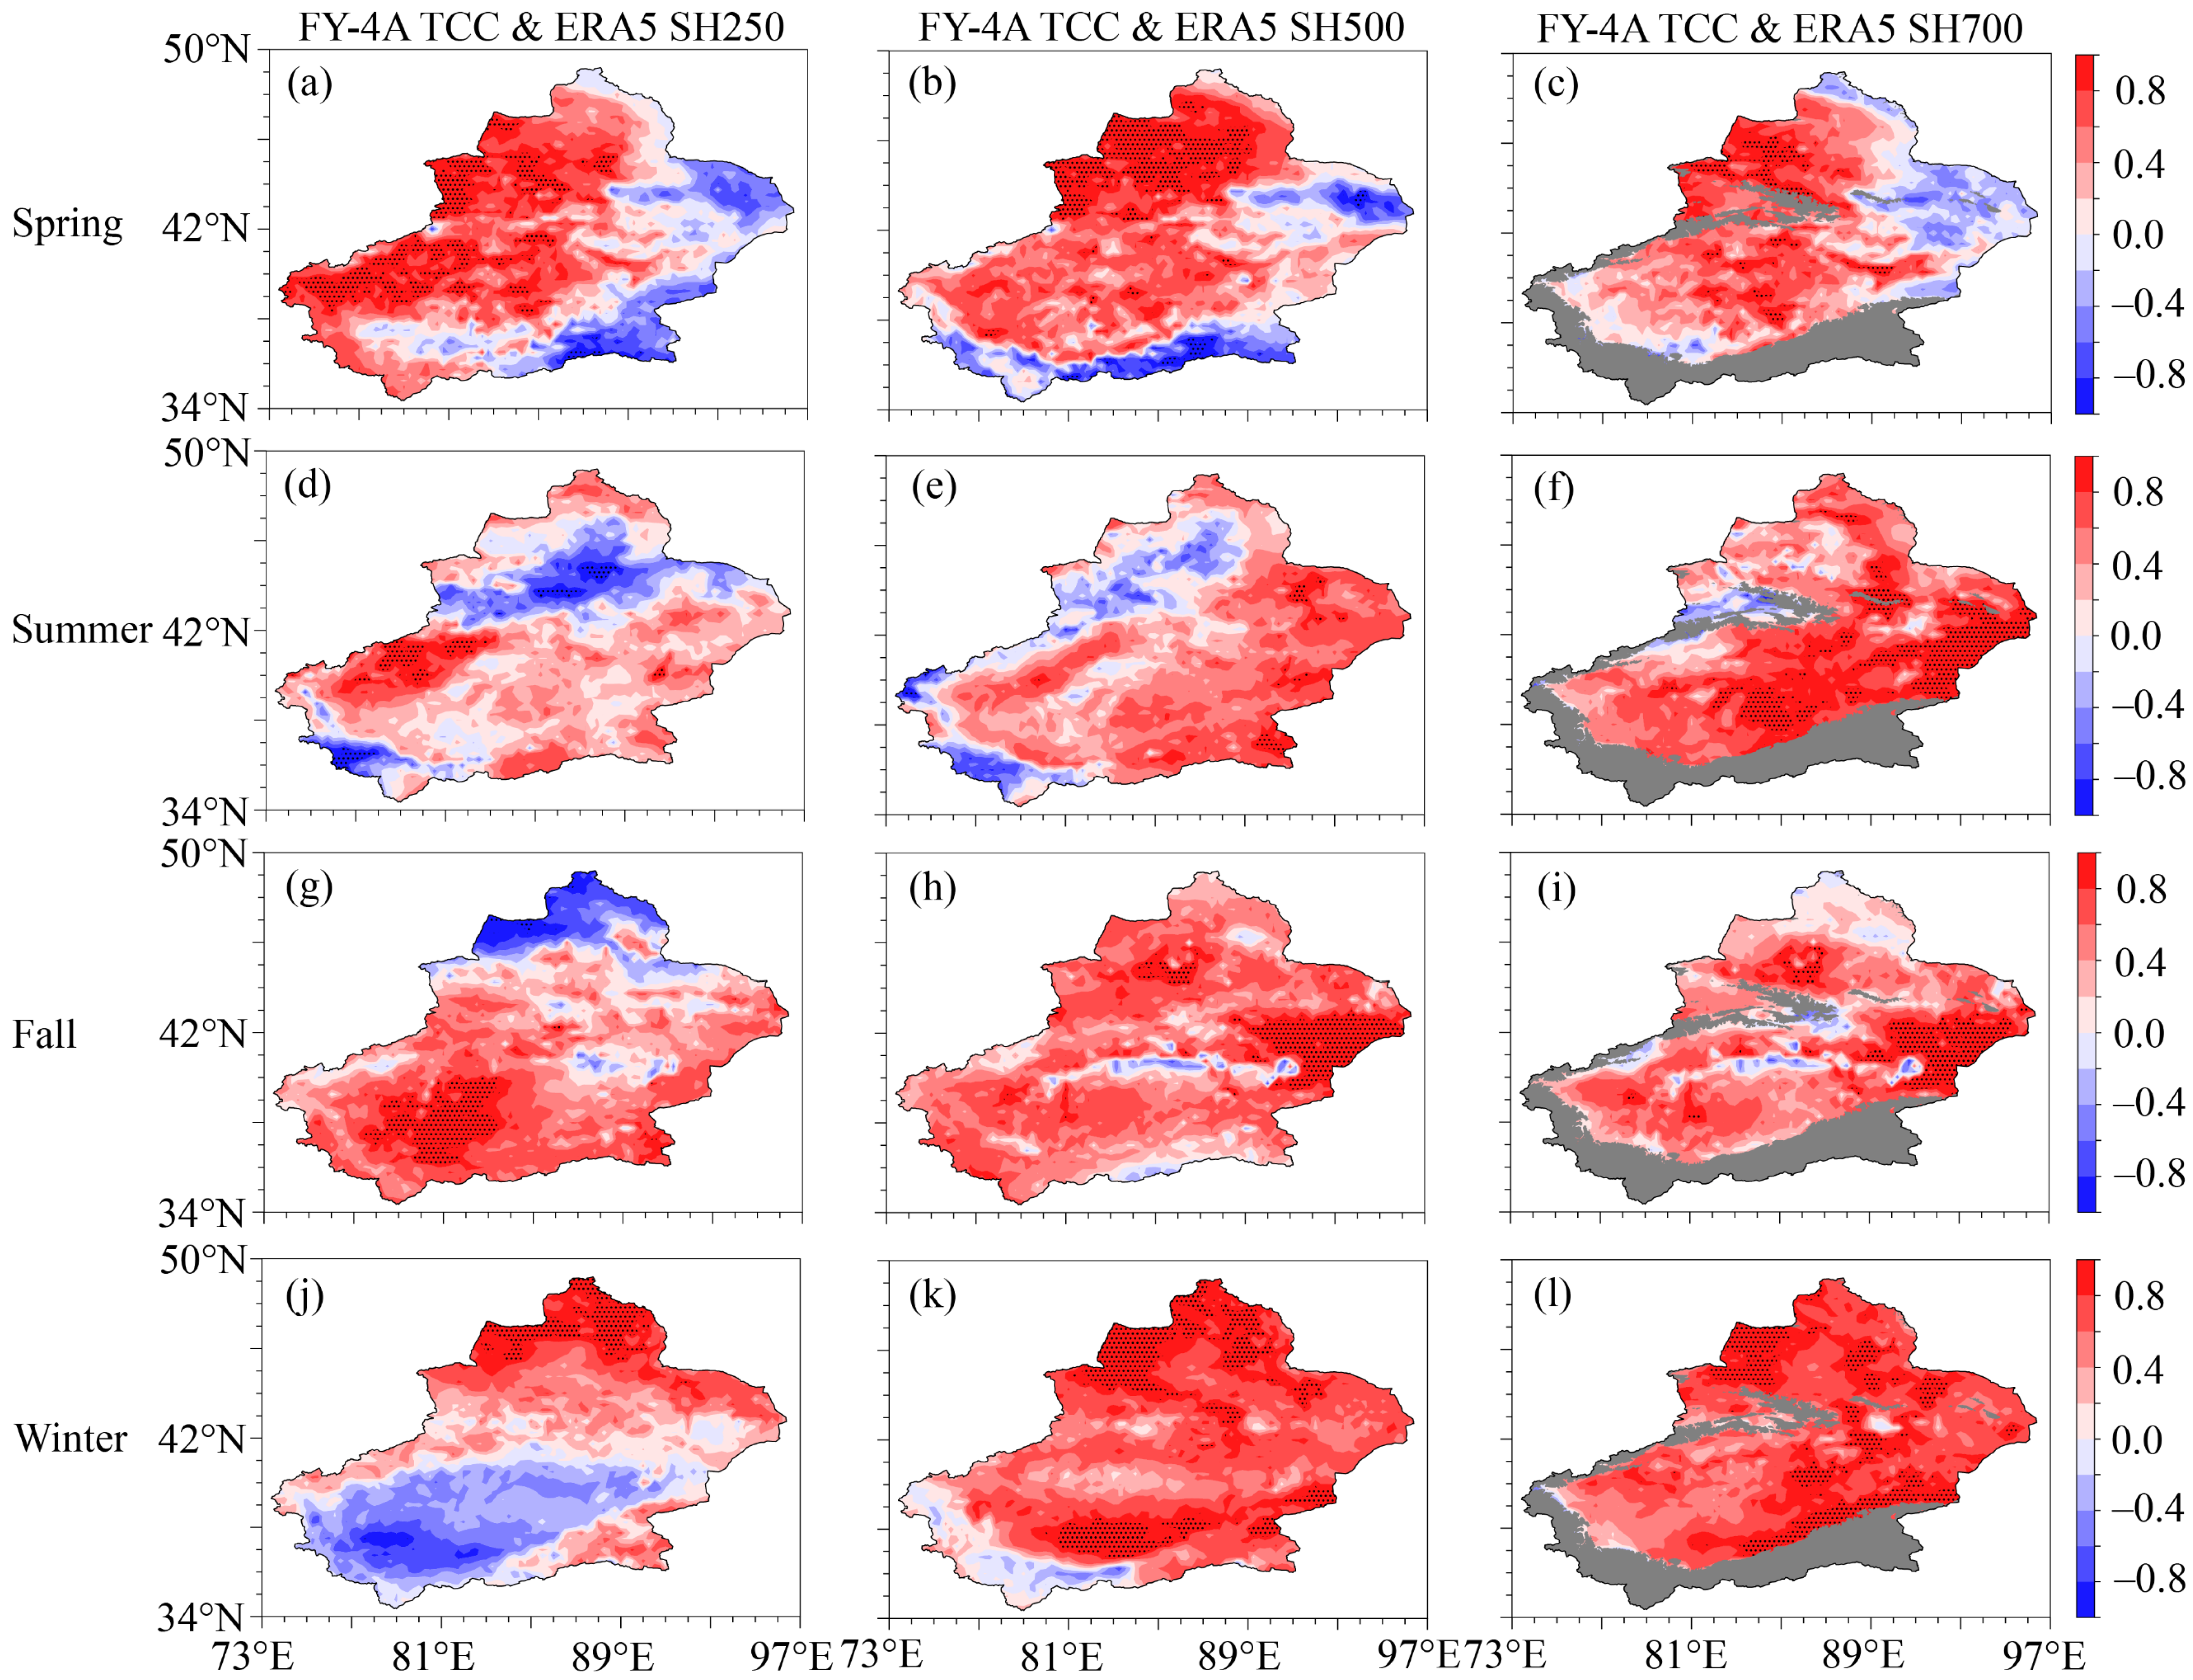
3.3. Correlations between Total Cloud Cover and Water Vapor

Water vapor is a necessary condition for cloud formation, and water vapor varies with geographical location and season. Therefore, the relationship between TCC and water vapor was also analyzed. Figure 15 shows the seasonal variation in the spatial distribution of the correlation between TCC based on FY-4A and total column vertically integrated water vapor (TCWV) based on ERA5 from March 2018 to February 2023 and based on monthly average data in XJ. In spring, except for some areas in eastern XJ, the Kunlun Mountains, and Altai Mountains, most areas in XJ showed a positive correlation, and the positive correlation was significant (passed the significance test with 95% confidence (p < 0.05)) in the northwest of XJ (Figure 15a). Contrary to spring, eastern XJ had a significant positive correlation in summer (Figure 15b). Compared to summer, the positive correlation area further expanded in fall, while the significant positive correlation area was still concentrated in eastern XJ (Figure 15c). In winter, except for some areas of the Kunlun Mountains, most areas of XJ showed a positive correlation, with significant positive correlation areas mainly located in the northern and southeastern XJ (Figure 15d). As shown in Figure 15, the correlation between TCC and TCWV in XJ varied with seasons and geographical locations, but overall, it was mainly positive.
Figure 16 shows the seasonal variation in the spatial distribution of the correlation between TCC based on FY-4A and specific humidity (SH) at 250 hPa, 500 hPa, and 700 hPa based on ERA5 from March 2018 to February 2023 and based on monthly average data in XJ. In spring, except for some areas in eastern XJ, the Kunlun Mountains, and Altai Mountains, most areas in XJ showed a positive correlation, and the positive correlation was significant in western XJ at 250 hPa (Figure 16a), north XJ at 500 hPa (Figure 16b), and northwest XJ at 700 hPa (Figure 16c). Contrary to spring, some areas in northern XJ showed a negative correlation in summer at 250 hPa (Figure 16d) and 500 hPa (Figure 16e). Meanwhile, compared to the correlation at 250 hPa and 500 hPa, most areas in XJ showed a positive correlation at 700 hPa, and there was a significant positive correlation in eastern XJ and southern XJ (Figure 16f). In fall, except for some areas in northern XJ at 250 hPa, most parts of XJ showed a positive correlation at three altitudes, and the positive correlation was significant in southeastern XJ at 250 hPa (Figure 16g), and eastern XJ at 500 hPa (Figure 16h) and 700 hPa (Figure 16i). In winter, except for southern XJ at 250 hPa and some areas of the Kunlun Mountains at 500 hPa, most areas of XJ showed a positive correlation at three altitudes, with significant positive correlation areas mainly located in the northern XJ at 250 hPa (Figure 16j), northern XJ, and southeastern XJ at 500 hPa (Figure 16k) and 700 hPa (Figure 16l). Overall, the positive correlation between TCC and SH at 500 hPa and 700 hPa was stronger than that between TCC and SH at 250 hPa in XJ, especially in winter.

4. Discussion

Clouds have significant impacts on radiation, water cycle, weather, and climate [1,2,3,4,5,6,7,8], and exhibit uneven spatiotemporal distribution due to factors such as seasons, terrain, geographic location, monsoon, and water vapor conditions [15,16,17,18,19,20,21,22,23]. TCC and CLT, as important cloud characteristic parameters, exhibit significant differences worldwide. Previous studies have shown significant differences in both the macro- and microphysical characteristics of precipitation closely related to clouds in XJ compared to other regions of China [26,27,28,29,30,31,32,33]. More importantly, we have obtained the preliminary macro- and microphysical characteristics of clouds in the western Tianshan Mountains of XJ based on ground-based millimeter-wave cloud radar observation data [34,35]. However, little is known about the characteristics of clouds in the entire Xinjiang region. This study attempts to use China’s latest generation geostationary satellite FY-4A to reveal the seasonal variation characteristics of TCC and CLT in XJ, a typical arid area not directly controlled by the monsoon and an upstream area of China’s weather that accounts for about one-sixth of China’s land area [24,25]. Meanwhile, TCC datasets from 105 NMSs in XJ and ERA5 were used for comparison with TCC from FY-4A. Our results provide the seasonal variation characteristics of TCC and CLT in XJ; however, it is worth noting that TCC datasets from three different sources exhibit certain differences. One of the important reasons for these differences is that satellites observe clouds from top to bottom, which may give results different from NMSs observing clouds from the ground up or reanalysis grid values [16,17,54,55]. Meanwhile, the characteristics of sensors, retrieval methods of clouds, as well as spatiotemporal sampling and averaging, all have a significant impact on the observation results and products of satellites [55]. In addition, cloud cover definition and viewing geometry are different between surface observations and satellite products [16]. All these factors may lead to differences in TCC at specific locations and times, even if various observation systems correctly detect clouds [55].
To further illustrate the cloud detection capability of FY-4A in Xinjiang, we focus on several key areas in Figure 17, which shows the seasonal variation in the spatial distribution of cloud frequency in XJ. Although the areas of Sayram Lake (blue rectangle) and Ulungur Lake (black rectangle) are relatively small compared to XJ, FY-4A has well detected that Sayram Lake and Ulungur Lake are cloudier than their surrounding areas, indicating that FY-4A has excellent cloud detection capabilities and there is a close connection between clouds and water in XJ. Similarly, the Tarim River Basin (blue ellipse) is adjacent to mountainous areas and has multiple rivers, making it a high-frequency region for clouds in XJ. On the contrary, eastern Xinjiang (red ellipse) lacks rivers and lakes, thus forming a low-frequency region of clouds in XJ. Meanwhile, Figure 17 also shows significant seasonal variation in the spatial distribution of cloud frequency in XJ. In the future, we will use more satellite products to finely detect the clouds in XJ. The daily variation in clouds and the relationship between clouds and the terrain of XJ are the focus of our attention.

5. Conclusions

Total cloud cover (TCC) datasets from the latest generation of geostationary satellite Fengyun 4A (FY-4A) from 2018 to 2022 were used to investigate the seasonal variation in the spatial distribution of TCC in Xinjiang, China (XJ), combined with the ground observation (GROB) TCC datasets from 105 national meteorological stations (NMSs) in XJ and TCC datasets from ERA5. The analysis revealed that the TCC datasets from FY-4A, GROB, and ERA5 can all well reflect the significant seasonal variation in TCC in XJ, characterized by the highest (lowest) mean TCC in spring (fall), with a distribution pattern of high in the southwest (northwest) and low in the northeast (southeast) in XJ. For 105 NMSs in XJ, the mean TCC of FY-4A in all four seasons was lower than that of GROB, and the two were comparable in spring (44.09% vs. 47.32%) and summer (42.88% vs. 43.17%), while there was a significant difference between the two in fall (27.86% vs. 40.19%) as well as winter (30.58% vs. 46.93%). The TCC of FY-4A was lower (higher) than that of GROB in spring and summer at most NMSs in northern (southern) XJ, while the TCC of FY-4A was lower than that of GROB for the vast majority of NMSs in fall and winter, especially in northern XJ.
Furthermore, the seasonal variation in the spatial distribution of cloud type (CLT) in XJ based on FY-4A, the correlation between TCC based on FY-4A, and meteorological factors based on ERA5 were also analyzed in this study. The seasonal variation in the spatial distribution of different CLT including clear, water-type, supercooled-type, mixed-type, ice-type, cirrus-type, and overlap-type exhibited diverse variation characteristics. Water-type had a high-frequency center of over 30% in the Tarim Basin in summer, while supercooled-water-type had a high-frequency center of over 30% in the Kunlun Mountains in summer. Mixed-type had the highest frequency in winter, and ice-type and cirrus-type had the highest frequency in spring, while overlap-type had the highest frequency in summer. The correlation between TCC and total column vertically integrated water vapor in XJ varied with seasons and geographical locations, characterized by a positive correlation in most areas of XJ. Overall, the positive correlation between TCC and specific humidity (SH) at 500 hPa and 700 hPa was stronger than that between TCC and SH at 250 hPa in XJ, especially in winter.
The above results deepened the knowledge of the seasonal variation in TCC over XJ, a typical arid region, broadened the understanding of the seasonal variation in CLT over XJ, and preliminarily revealed the correlation between TCC and water vapor conditions. Despite the promising findings reported in this study, further research is needed to elucidate the diurnal variations in TCC and CLT over XJ and to apply more vertical observation equipment and satellite products for studying clouds.

Author Contributions

Conceptualization, Y.Z. (Yong Zeng) and L.Y.; data curation, Y.Z. (Yong Zeng), Y.Z. (Yushu Zhou), J.L. and X.L.; formal analysis, Y.Z. (Yong Zeng); funding acquisition, L.Y. and Y.Z. (Yong Zeng); methodology, Y.Z. (Yong Zeng), Z.T. and Y.J.; project administration, X.L., Z.T. and Y.J.; resources, Y.Z. (Yong Zeng) and L.Y.; supervision, A.A., Y.Z. (Yushu Zhou) and L.Y.; writing—original draft, Y.Z. (Yong Zeng); writing—review and editing, Y.Z. (Yong Zeng). All authors have read and agreed to the published version of the manuscript.

Funding

This research was funded by Tianshan Mountains Talent Project (Grant No. 2022TSYCLJ0003), National Natural Science Foundation of China (Grant No. 42305080), Key Research and Development Program of Xinjiang Uygur Autonomous Region (Grant No. 2023B03019-1), Natural Science Foundation of Xinjiang Uygur Autonomous Region (Grant No. 2022D01B227), S&T Development Fund of IDM (Grant No. KJFZ202401).

Data Availability Statement

The raw data supporting the conclusions of this article will be made available by the authors on request.

Acknowledgments

The authors would like to thank National Satellite Meteorological Centre for providing the data of FY-4A, Xinjiang Meteorological Information Center for providing the data of TCC from GROB based on 105 NMSs, and European Centre for Medium Range Weather Forecasts for providing the data of ERA5. Thanks also go to the reviewers for thorough comments that really helped to improve the manuscript.

Conflicts of Interest

The authors declare no conflict of interest.

References

  1. Zhou, C.; Zelinka, M.D.; Klein, S.A. Impact of decadal cloud variations on the Earth’s energy budget. Nat. Geosci. 2016, 9, 871–874. [Google Scholar] [CrossRef]
  2. Butt, N.; New, M.; Malhi, Y.; da Costa, A.C.L.; Oliveira, P.; Silva-Espejo, J.E. Diffuse radiation and cloud fraction relationships in two contrasting Amazonian rainforest sites. Agric. For. Meteorol. 2010, 150, 361–368. [Google Scholar] [CrossRef]
  3. Zelinka, M.D.; Hartmann, D.L. Why is longwave cloud feedback positive? J. Geophys. Res. Atmos. 2010, 115, 1–16. [Google Scholar] [CrossRef]
  4. Ramanathan, V.; Crutzen, P.J.; Kiehl, J.T.; Rosenfeld, D. Aerosols, climate, and the hydrological cycle. Science 2001, 294, 2119–2124. [Google Scholar] [CrossRef] [PubMed]
  5. Stephens, G.L. Cloud feedbacks in the climate system: A critical review. J. Clim. 2005, 18, 237–273. [Google Scholar] [CrossRef]
  6. Stephens, G.L.; Vane, D.G.; Boain, R.J.; Mace, G.G.; Sassen, K.; Wang, Z.; Mitrescu, C. The cloudsat mission and the A-train—A new dimension of space-based observations of clouds and precipitation. Bull. Am. Meteorol. Soc. 2002, 83, 1771–1790. [Google Scholar] [CrossRef]
  7. Brient, F.; Schneider, T.; Tan, Z.; Bony, S.; Qu, X.; Hall, A. Shallowness of tropical low clouds as a predictor of climate models’ response to warming. Clim. Dynam. 2016, 47, 433–449. [Google Scholar] [CrossRef]
  8. Wang, T.; Wong, S.; Fetzer, E.J. Cloud regime evolution in the Indian monsoon intraseasonal oscillation: Connection to large-scale dynamical conditions and the atmospheric water budget. Geophys. Res. Lett. 2015, 42, 9465–9472. [Google Scholar] [CrossRef]
  9. Liu, Y.; Wu, W.; Jensen, M.P.; Toto, T. Relationship between cloud radiative forcing, cloud fraction and cloud albedo, and new surface-based approach for determining cloud albedo. Atmos. Chem. Phys. 2011, 11, 7155–7170. [Google Scholar] [CrossRef]
  10. Moron, V.; Camberlin, P.; Aellig, R.; Champagne, O.; Fink, A.H.; Knippertz, P.; Philippon, N. Diurnal to interannual variability of low-level cloud cover over western equatorial Africa in May–October. Int. J. Climatol. 2023, 43, 6038–6064. [Google Scholar] [CrossRef]
  11. Li, J.; Mao, J.; Wang, F. Comparative study of five current reanalyses in characterizing total cloud fraction and top-of-the-atmosphere cloud radiative effects over the Asian monsoon region. Int. J. Climatol. 2017, 37, 5047–5067. [Google Scholar] [CrossRef]
  12. Zhao, W.; Zhang, N.; Sun, J. Spatiotemporal variations of cloud amount over the Yangtze River Delta, China. J. Meteorol. Res. 2014, 28, 371–380. [Google Scholar] [CrossRef]
  13. Wu, H.; Xu, X.; Luo, T.; Yang, Y.; Xiong, Z.; Wang, Y. Variation and comparison of cloud cover in MODIS and four reanalysis datasets of ERA-interim, ERA5, MERRA-2 and NCEP. Atmos. Res. 2023, 281, 106477. [Google Scholar] [CrossRef]
  14. Matuszko, D.; Bartoszek, K.; Soroka, J. Long-term variability of cloud cover in Poland (1971–2020). Atmos. Res. 2022, 268, 106028. [Google Scholar] [CrossRef]
  15. Deng, C.; Li, J.; Li, J.; Li, R.; Zhang, W.; Zhao, Y.; Zhao, Y.X.; Jian, B. Long-term changes in the diurnal cycle of total cloud cover over the Tibetan Plateau. Atmos. Res. 2023, 295, 106992. [Google Scholar] [CrossRef]
  16. Sun, B.; Free, M.; Yoo, H.L.; Foster, M.J.; Heidinger, A.; Karlsson, K.G. Variability and trends in US cloud cover: ISCCP, PATMOS-x, and CLARA-A1 compared to homogeneity-adjusted weather observations. J. Clim. 2015, 28, 4373–4389. [Google Scholar] [CrossRef]
  17. Free, M.; Sun, B.; Yoo, H.L. Comparison between total cloud cover in four reanalysis products and cloud measured by visual observations at US weather stations. J. Clim. 2016, 29, 2015–2021. [Google Scholar] [CrossRef]
  18. Lei, Y.; Letu, H.; Shang, H.; Shi, J. Cloud cover over the Tibetan Plateau and eastern China: A comparison of ERA5 and ERA-Interim with satellite observations. Clim. Dynam. 2020, 54, 2941–2957. [Google Scholar] [CrossRef]
  19. Dommo, A.; Philippon, N.; Vondou, D.A.; Sèze, G.; Eastman, R. The June–September low cloud cover in western central Africa: Mean spatial distribution and diurnal evolution, and associated atmospheric dynamics. J. Clim. 2018, 31, 9585–9603. [Google Scholar] [CrossRef]
  20. Bao, S.; Letu, H.; Zhao, J.; Shang, H.; Lei, Y.; Duan, A.; Shi, J. Spatiotemporal distributions of cloud parameters and their response to meteorological factors over the Tibetan Plateau during 2003–2015 based on MODIS data. Int. J. Climatol. 2019, 39, 532–543. [Google Scholar] [CrossRef]
  21. Barnes, M.L.; Miura, T.; Giambelluca, T.W. An assessment of diurnal and seasonal cloud cover changes over the Hawaiian Islands using Terra and Aqua MODIS. J. Clim. 2016, 29, 77–90. [Google Scholar] [CrossRef]
  22. Ahmadi, M.; Dadashi-Roudbari, A.; Akbari-Azirani, T.; Nasiri-Khuzani, B. Seasonal and annual segregation of liquid water and ice clouds in Iran and their relation to geographic components and precipitation. Theor. Appl. Climatol. 2020, 140, 963–982. [Google Scholar] [CrossRef]
  23. Manara, V.; Brunetti, M.; Wild, M.; Maugeri, M. Variability and trends of the total cloud cover over Italy (1951–2018). Atmos. Res. 2023, 285, 106625. [Google Scholar] [CrossRef]
  24. Chen, Y.; Li, W.; Deng, H.; Fang, G.; Li, Z. Changes in Central Asia’s Water Tower: Past, present and future. Sci. Rep. 2016, 6, 35458. [Google Scholar] [CrossRef] [PubMed]
  25. Zhang, J.B.; Deng, Z.F. A Generality of Rainfall in Xinjiang; Meteorological Press: Beijing, China, 1987; pp. 1–10. (In Chinese) [Google Scholar]
  26. Yang, L.M.; Li, X.; Zhang, G.X. Some advances and problems in the study of heavy rain in Xinjiang. Clim. Environ. Res. 2011, 16, 188–198. (In Chinese) [Google Scholar]
  27. Zeng, Y.; Yang, L. Triggering mechanism of an extreme rainstorm process near the Tianshan Mountains in Xinjiang, an arid region in China, based on a numerical simulation. Adv. Meteorol. 2020, 2020, 8828060. [Google Scholar] [CrossRef]
  28. Zeng, Y.; Tong, Z.; Jiang, Y.; Zhou, Y. Microphysical characteristics of seasonal rainfall observed by a Parsivel disdrometer in the Tianshan Mountains, China. Atmos. Res. 2022, 280, 106459. [Google Scholar] [CrossRef]
  29. Zeng, Y.; Yang, L.; Zhou, Y.; Tong, Z.; Jiang, Y. Statistical characteristics of summer season raindrop size distribution in the western and central Tianshan Mountains in China. J. Meteor. Soc. Jpn. 2022, 100, 855–872. [Google Scholar] [CrossRef]
  30. Zeng, Y.; Yang, L.; Zhou, Y.; Tong, Z.; Jiang, Y.; Chen, P. Characteristics of orographic raindrop size distribution in the Tianshan Mountains, China. Atmos. Res. 2022, 278, 106332. [Google Scholar] [CrossRef]
  31. Zeng, Y.; Yang, L.; Tong, Z.; Jiang, Y.; Chen, P.; Zhou, Y. Characteristics and applications of summer season raindrop size distributions based on a PARSIVEL2 disdrometer in the western Tianshan Mountains (China). Remote Sens. 2022, 14, 3988. [Google Scholar] [CrossRef]
  32. Zeng, Y.; Li, J.; Yang, L.; Li, H.; Li, X.; Tong, Z.; Jiang, Y.; Liu, J.; Zhang, J.; Zhou, Y. Microphysical characteristics of raindrop size distribution and implications for dual-polarization radar quantitative precipitation estimations in the Tianshan Mountains, China. Remote Sens. 2023, 15, 2668. [Google Scholar] [CrossRef]
  33. Zeng, Y.; Yang, L.; Li, J.; Jiang, Y.; Tong, Z.; Li, X.; Li, H.; Liu, J.; Lu, X.; Zhou, Y. Seasonal variation of microphysical characteristics for different rainfall types in the Tianshan Mountains of China. Atmos. Res. 2023, 295, 107024. [Google Scholar] [CrossRef]
  34. Zeng, Y.; Yang, L.; Zhang, Z.; Tong, Z.; Li, J.; Liu, F.; Zhang, J.; Jiang, Y. Characteristics of clouds and raindrop size distribution in Xinjiang, using cloud radar datasets and a disdrometer. Atmosphere 2020, 11, 1382. [Google Scholar] [CrossRef]
  35. Zhang, J.; Li, H.; Zeng, Y.; Yang, L.; Li, J. Macro-and microphysical characteristics of snowfall and non-snowfall clouds in the West Tianshan Mountains of China based on cloud radar. Meteorol. Atmos. Phys. 2022, 134, 98. [Google Scholar] [CrossRef]
  36. Duan, A.; Wu, G. Change of cloud amount and the climate warming on the Tibetan Plateau. Geophys. Res. Lett. 2006, 33, L2270. [Google Scholar] [CrossRef]
  37. Free, M.; Sun, B. Trends in US total cloud cover from a homogeneity-adjusted dataset. J. Clim. 2014, 27, 4959–4969. [Google Scholar] [CrossRef]
  38. Min, M.; Wu, C.; Li, C.; Liu, H.; Xu, N.; Wu, X.; Chen, L.; Wang, F.; Sun, F.; Qin, D.; et al. Developing the science product algorithm testbed for Chinese next-generation geostationary meteorological satellites: Fengyun-4 series. J. Meteorol. Res. 2017, 31, 708–719. [Google Scholar] [CrossRef]
  39. Wang, X.; Min, M.; Wang, F.; Guo, J.; Li, B.; Tang, S. Intercomparisons of cloud mask products among fengyun-4a, himawari-8, and modis. IEEE Trans. Geosci. Remote Sens. 2019, 57, 8827–8839. [Google Scholar] [CrossRef]
  40. Xu, W.; Lyu, D. Evaluation of cloud mask and cloud top height from Fengyun-4A with MODIS cloud retrievals over the Tibetan Plateau. Remote Sens. 2021, 13, 1418. [Google Scholar] [CrossRef]
  41. Yang, J.; Zhang, Z.; Wei, C.; Lu, F.; Guo, Q. Introducing the new generation of Chinese geostationary weather satellites, Fengyun-4. Bull. Am. Meteorol. Soc. 2017, 98, 1637–1658. [Google Scholar] [CrossRef]
  42. Schmit, T.J.; Griffith, P.; Gunshor, M.M.; Daniels, J.M.; Goodman, S.J.; Lebair, W.J. A closer look at the abi on the goes-r series. Bull. Am. Meteorol. Soc. 2017, 98, 681–698. [Google Scholar] [CrossRef]
  43. Bessho, K.; Date, K.; Hayashi, M.; Ikeda, A.; Imai, T.; Inoue, H.; Kumagai, Y.; Miyakawa, T.; Murata, H.; Ohno, T.; et al. An introduction to himawari-8/9-japan’s new-generation geostationary meteorological satellites. J. Meteorol. Soc. Jpn. 2016, 94, 151–183. [Google Scholar] [CrossRef]
  44. Lai, R.; Teng, S.; Yi, B.; Letu, H.; Min, M.; Tang, S.; Liu, C. Comparison of cloud properties from Himawari-8 and FengYun-4A geostationary satellite radiometers with MODIS cloud retrievals. Remote Sens. 2019, 11, 1703. [Google Scholar] [CrossRef]
  45. Chen, Y.; Li, W.; Chen, S.; Zhang, A.; Fu, Y. Linkage between the vertical evolution of clouds and droplet growth modes as seen from FY-4A AGRI and GPM DPR. Geophys. Res. Lett. 2020, 47, e2020GL088312. [Google Scholar] [CrossRef]
  46. Liu, X.; Wang, Y.; Huang, J.; Yu, T.; Jiang, N.; Yang, J.; Zhan, W. Assessment and calibration of FY-4A AGRI total precipitable water products based on CMONOC. Atmos. Res. 2022, 271, 106096. [Google Scholar] [CrossRef]
  47. Zhou, Y.; Wang, X.; Xu, C. Comprehensive evaluation of the precipitable water vapor products of Fengyun satellites via GNSS data over mainland China. Atmos. Res. 2024, 300, 107235. [Google Scholar] [CrossRef]
  48. Shi, B.; Yang, C.; Min, J.; Sha, L. Impact of a new bias correction predictor for FY-4A AGRI all-sky data assimilation on typhoon forecast. J. Geophys. Res. Atmos. 2023, 128, e2023JD039063. [Google Scholar] [CrossRef]
  49. Wang, M.; Chen, Y.; Zhou, Y.; Li, Q. Comparative analysis of application effects of three cloud parameters of FY-4A in a rainstorm case. Torrential Rain Disasters 2022, 41, 396–404. (In Chinese) [Google Scholar]
  50. Zhang, Q.; Ren, J.; Xiao, H.; Wang, J.; Xiao, D. Characteristics of MCC from convective initiation to mature stage over the Sichuan basin based on FY-4A satellite data. Chin. J. Atmos. Sci. 2021, 45, 863–873. (In Chinese) [Google Scholar]
  51. Cui, L.; Guo, W.; Ge, W.; Yan, Y.; Luo, S. Comparisons of cloud top parameter of FY-4A satellite and its typhoon application research. Plateau Meteorol. 2020, 39, 196–203. (In Chinese) [Google Scholar]
  52. Chen, F.; Yu, Z.; Yang, M.; Ito, E.; Wang, S.; Madsen, D.B.; Wünnemann, B. Holocene moisture evolution in arid central Asia and its out-of-phase relationship with Asian monsoon history. Quat. Sci. Rev. 2008, 27, 351–364. [Google Scholar] [CrossRef]
  53. Huang, W.; Feng, S.; Chen, J.; Chen, F. Physical mechanisms of summer precipitation variations in the Tarim Basin in northwestern China. J. Clim. 2015, 28, 3579–3591. [Google Scholar] [CrossRef]
  54. Wu, W.; Liu, Y.; Betts, A.K. Observationally based evaluation of NWP reanalyses in modeling cloud properties over the Southern Great Plains. J. Geophys. Res. 2012, 117, D12202. [Google Scholar]
  55. Wu, W.; Liu, Y.; Jensen, M.P.; Toto, T.; Foster, M.J.; Long, C.N. A comparison of multiscale variations of decade-long cloud fractions from six different platforms over the Southern Great Plains in the United States. J. Geophys. Res. Atmos. 2014, 119, 3438–3459. [Google Scholar] [CrossRef]
Figure 1. The terrain height (shadow, km) in Xinjiang, China.
Remotesensing 16 02803 g001
Figure 2. The seasonal variation in the spatial distribution of TCC frequency from FY-4A (left), ground observations (GROB) based on 105 NMSs in XJ (middle), and ERA5 (right). The spatial distribution of TCC frequency from FY-4A in (a) spring, (d) summer, (g) fall, and (j) winter, the spatial distribution of TCC frequency from GROB in (b) spring, (e) summer, (h) fall, and (k) winter, and the spatial distribution of TCC frequency from ERA5 in (c) spring, (f) summer, (i) fall, and (l) winter.
Remotesensing 16 02803 g002
Figure 3. The violin plot of the seasonal variation in TCC frequencies (%) from FY-4A, GROB, and ERA5 at 105 NMSs in XJ, showing the mean (white line), median (white dot), interquartile range (rectangle), the 5th and 95th percentiles (whiskers), and the kernel density estimation (translucent shadow).
Remotesensing 16 02803 g003
Figure 4. The seasonal variation in the spatial distribution of the difference in TCC frequency among FY-4A, GROB, and ERA5. FY-4A minus GROB (left) in (a) spring, (d) summer, (g) fall, and (j) winter, FY-4A minus ERA5 (middle) in (b) spring, (e) summer, (h) fall, and (k) winter, and ERA5 minus GROB (right) in (c) spring, (f) summer, (i) fall, and (l) winter.
Remotesensing 16 02803 g004
Figure 5. Scatterplot of the seasonal variation in TCC frequencies (%) from FY-4A, GROB, and ERA5 at 105 NMSs in XJ. TCC frequencies from GROB versus those from FY-4A in (a) spring, (d) summer, (g) fall, and (j) winter, TCC frequencies from ERA5 versus those from FY-4A in (b) spring, (e) summer, (h) fall, and (k) winter, and TCC frequencies from ERA5 versus those from GROB in (c) spring, (f) summer, (i) fall, and (l) winter. The black dashed line represents the 1:1 relation.
Remotesensing 16 02803 g005
Figure 6. Same as Figure 3 but for the difference in TCC frequency among FY-4A, GROB, and ERA5.
Remotesensing 16 02803 g006
Figure 7. The seasonal variation in the spatial distribution of clear frequency in XJ. The black line represents the main rivers and lakes in XJ.
Remotesensing 16 02803 g007
Figure 8. Same as Figure 7 but for water-type.
Remotesensing 16 02803 g008
Figure 9. Same as Figure 7 but for supercooled-type.
Remotesensing 16 02803 g009
Figure 10. Same as Figure 7 but for mixed-type.
Remotesensing 16 02803 g010
Figure 11. Same as Figure 7 but for ice-type.
Remotesensing 16 02803 g011
Figure 12. Same as Figure 7 but for cirrus-type.
Remotesensing 16 02803 g012
Figure 13. Same as Figure 7 but for overlap-type.
Remotesensing 16 02803 g013
Figure 14. The seasonal variation in the spatial distribution of CLT with the highest frequency among the seven types of CLT.
Remotesensing 16 02803 g014
Figure 15. The seasonal variation in the spatial distribution of the correlation between TCC based on FY-4A and TCWV based on ERA5 from March 2018 to February 2023 based on monthly average data in XJ. Regions that pass the significance test with 95% confidence (p < 0.05) are displayed as black dots, the same below.
Remotesensing 16 02803 g015
Figure 16. The seasonal variation in the spatial distribution of the correlation between TCC based on FY-4A and SH at 250 hPa (a,d,g,j), 500 hPa (b,e,h,k), and 700 hPa (c,f,i,l) based on ERA5 from March 2018 to February 2023 and based on monthly average data in XJ. Gray shadows represent terrain above 3 km.
Remotesensing 16 02803 g016
Figure 17. The seasonal variation in the spatial distribution of cloud frequency in XJ. The blue and black rectangles, as well as the blue and red ellipses, represent Sayram Lake, Ulungur Lake, Tarim River Basin, and eastern XJ, respectively.
Remotesensing 16 02803 g017
Disclaimer/Publisher’s Note: The statements, opinions and data contained in all publications are solely those of the individual author(s) and contributor(s) and not of MDPI and/or the editor(s). MDPI and/or the editor(s) disclaim responsibility for any injury to people or property resulting from any ideas, methods, instructions or products referred to in the content.

