Article

On Unsupervised Multiclass Change Detection Using Dual-Polarimetric SAR Data

1
Energy and Mineral Resources Engineering, Sejong University, 209, Neungdong-ro, Gwangjin-gu, Seoul 05006, Republic of Korea
2
Satellite Application Division, Korea Aerospace Research Institute, 169-84, Gwahak-ro, Yuseong-gu, Daejeon 34133, Republic of Korea
*
Author to whom correspondence should be addressed.
Remote Sens. 2024, 16(15), 2858; https://doi.org/10.3390/rs16152858
Submission received: 25 June 2024 / Revised: 25 July 2024 / Accepted: 31 July 2024 / Published: 5 August 2024

Abstract

:
Change detection using SAR data has been an active topic in various applications. Because conventional change detection identifies signal changes in single-pol radar observations, they cannot separately detect different kinds of change associated with different ground parameters. In this study, we investigated the comprehensive use of dual-pol parameters and proposed a novel dual-pol-based change detection framework utilizing different dual-pol scatter-type indicators. To optimize the exploitation of dual-pol change information, we presented a two-step processing strategy that divides the multiclass change detection process into a binary detection step that identifies the presence of changes and the classification step that distinguishes the types of change. In the detection stage, each dual-pol parameter was considered as an independent information source. Assuming potential conflict between dual-pol parameters, a disjunctive combination of detection results from different dual-pol parameters was applied to obtain the final detection result. In the classification step, an unsupervised change classification strategy was proposed based on the change direction and magnitude of the dual-pol parameters within the change class. Experimental results exhibited significantly improved detectability across a wide change spectrum compared with previous dual-pol-based change detection approaches. They also demonstrated the possibility of distinguishing different semantic changes without in situ ground data.

1. Introduction

Understanding natural and anthropogenic changes on the Earth’s surface is an important task in various fields, including land management, disaster response, and local and regional environmental monitoring. The synthetic aperture radar (SAR) remote sensing technology can be one of the most effective tools for change detection and monitoring due to its all-weather and day and night imaging capability. In this context, change detection using SAR data has been an active research topic in various applications.
In general, SAR change detection has been performed using single-polarization SAR backscatter images acquired at different times with the same observation configurations. The detection of changes between the temporal acquisitions can be performed in either a supervised or unsupervised way. From an operational point of view, however, unsupervised change detection methods have been widely used due to the cost of collecting ground reference information for temporal SAR data. Unsupervised change detection studies have focused on the effective comparison and emphasis of radiometric changes between temporal acquisitions. Two main approaches, such as statistical distance measures with algebraic transformation [1,2,3,4,5] and information-theoretic dissimilarity measures [6,7,8,9,10], have been widely used to highlight and delineate changed areas. These approaches have demonstrated good performance in detecting specific changes of interest. Nonetheless, because in principle they identify changes in the radiometric properties of single-channel radar observations, they have an intrinsic limitation of not being able to separately detect the different kinds of change associated with different ground parameters. Multichannel observation with different polarization configurations having different sensitivities to ground parameters can be an effective tool to overcome the limitations of single-channel SAR change detection. Because most current spaceborne SAR systems operate the dual-polarization (dual-pol) observation mode as their baseline mission, change detection that effectively utilizes dual-pol observables is particularly important in the application of SAR data.
The dual-pol systems transmit a single polarization signal, either horizontal (h) or vertical (v), and receive the scattered wave in two coherent polarization channels, resulting in either h h - v h or h v - v v configurations. In 2009, Moser and Serpico [11] proposed a dual-pol change detection method through Markov random field-based information fusion, considering dual-pol intensities as a separate information source. It was used for clear-cut detection in forest areas, and it was experimentally verified that higher detection performance could be obtained by using dual-pol intensities rather than single-pol observations [12]. Instead of exploiting the dual-pol channels separately, several recent studies proposed change detection methods to statistically test the differences in the temporal observation matrices based on the 2 × 2 dual-pol covariance matrix. In 2015, Nielsen et al. [13] discussed the dual-pol Wishart test statistic, which was originally used for the equality test of two fully polarimetric (quad-pol) covariance matrices and presented that statistically meaningful change signals in agricultural areas can be obtained from bi-temporal dual-pol SAR data. Ferrentino et al. [14] also exploited the dual-pol covariance matrix for change detection problems. They analyzed the change matrix between the temporal acquisitions. To maximize change information, they applied the Lagrange optimization method with a generic projection vector and proposed an eigenvalue-based change metric. It was applied to detect earthquake damages in central Italy using dual-pol Sentinel-1 data collected in both ascending and descending orbits [15]. The dual-pol change detection metric provided a successful damage detection performance, particularly in densely urbanized areas.
These studies illustrated that the change detection performance can be improved by using dual-pol observation, but it is still difficult to understand different types of change occurring in a complex ground environment by determining the presence and absence of changes in the SAR observation. In this context, several recent studies have explored extending the binary detection problem to multiclass changes. Nielsen et al. [16] extended their study on the dual-pol Wishart test statistic to determine the direction of changes. Using the Loewner order, which calculates the definiteness of the difference of the covariance matrices, the change pixels were categorized into positive semidefinite, negative semidefinite, or indefinite classes. Experimental results have illustrated that one can distinguish the appearance or disappearance of targets against natural backgrounds by tracking the direction of change. This method was applied to assess cyclone-induced damage in urban areas [17]. Change detection results using bi-temporal dual-pol Sentinel-1 SAR data showed good agreement with the observed weather data. In addition, the direction of changes can be interpreted as a damage proxy indicating either demolition or reconstruction.
The detection of the direction of changes was further extended to the detection of several possible multiclass problems in [18]. Based on the two different intensities in dual-pol observation, the authors proposed a dual-pol change vector extension method. The change information in the dual-pol intensities space was transformed into the 2-D polar domain, which can highlight both magnitude and directions. They presented a two-step statistical detection strategy along the magnitude and direction of change domains and an automatic decision of the number of change classes contained in the dual-pol intensities. This method showed high performance in a flood monitoring experiment. Two change classes, such as flooded and water body-disappeared areas, could be detected separately. It has also been tested for another two-class change detection problem, the building construction and vegetation clear-cut scenario, and provided successful detection results. The performance of the dual-pol change vector approach was further confirmed for the other data set containing three change classes: sea swell decrease, vegetation increase, and vegetation decrease.
Multiclass change detection approaches infer changes on the ground indirectly through temporal intensity variations of SAR signals. Thus, it is possible to extract multiclass change information only if different thematic changes cause differences in the change signals of dual-pol intensities. This assumption is often difficult to satisfy in complex environments where various types of change are mixed, such as vegetation phenology, dynamics of environmental conditions, disasters, and anthropic activities [19]. For example, vegetation growth, soil tillage, and structural construction may cause increases in both co- and cross-pol intensities, which makes it difficult to distinguish different change classes from intensity signals. Even when the thematic changes cause differences in the dual-pol intensities, it is still difficult to understand the semantics of radiometric changes and link intensity changes with the thematic information. Either the development of a better stochastic distance metric or decision strategy cannot improve intrinsic radiometric characteristics and therefore has limitations in resolving these issues.
In this study, we propose an alternative dual-pol change detection framework utilizing dual-pol parameters. Observation of polarimetric scattering responses not only increases the number of independent measurements but also provides the possibility to identify and classify the scattering mechanisms of ground scatterers. In this context, we explore the potential of dual-pol scattering mechanism indicators in improving the discriminability of multiclass changes and obtaining semantic change information. In addition, because we focus on the importance of observations in the extraction of semantic change information, we further analyze how selective polarization combinations of different dual-pol modes [20] affect the performance of multiclass change detection. The rest of the manuscript is organized as follows. The proposed change detection strategy is described from the methodological viewpoint in Section 2. Experimental results on simulated dual-pol SAR data from the Jet Propulsion Laboratory’s uninhabited aerial vehicle SAR (UAVSAR) data are presented in Section 3. The performance of the proposed algorithm is further discussed in Section 4, and conclusions are drawn in Section 5.

2. Dual-Pol Multiclass Change Detection

2.1. Dual-Pol Parameters

Dual-pol SAR observation can be considered as a special case or subspace of the quad-pol system. In general, the incident and scattered waves of a quad-pol SAR can be completely described by the two-dimensional orthogonal basis. Then, one can consider the ground scatterer as a mathematical operator that takes one 2-D incident wave vector E i and changes that into another scattered wave vector E s , which are related by the complex 2 × 2 scattering matrix [ S ] , defined as
E h s E v s = e j k r r S h h S h v S v h S v v E h i E v i
Here, S q p is the complex scattering element of p transmission and q reception polarization states, which describes the scattering characteristics of an object. Due to the complexity of the system and the loss of spatiotemporal observation coverage, space-borne SAR instruments often operate in the dual-pol mode, which employs a single polarization transmission and a coherent dual-channel reception.
The dual-pol radar is not capable of reconstructing the complete scattering matrix [ S ] but instead measures only a column of the scattering matrix. For the h-pol and v-pol transmissions, the basic scattering measurements of a pixel, k h and k v , respectively, can be written as
k h = S h h S h v S v h S v v 1 0 = S h h S v h ,     k v = S h h S h v S v h S v v 0 1 = S h v S v v
In general, the received wave of a pixel is the coherent sum of the waves scattered from individual scattering centers. To characterize the stochastic properties of the natural objects, the covariance matrix is often used for the target scattering descriptor. The dual-pol covariance matrix [ C 2 p ] with p transmitter polarization state (either h or v ) can be obtained by the outer products of the averaged target vectors, such as
C 2 p = k p k p * T = S h p S h p * S h p S v p * S v p S h p * S v p S v p *
Based on the observed dual-pol covariance matrix, several dual-pol scattering descriptors can be defined to characterize the target’s scattering properties. The diagonal terms of the covariance matrix C 11 = | S h p | 2 and C 22 = | S v p | 2 are the backscatter intensities, which have been widely used for conventional change detection studies. The complex cross-product term in the off-diagonal element of the covariance matrix conveys the correlation properties between dual-pol channels. Without a loss of generality, it can be described by the dual-pol coherence parameter ρ ,
ρ = S h p S v p * S h p 2 S v p 2
In the case of the natural distributed scatterers for which the scatterer is reflection-symmetric, there will usually be no co- and cross-pol correlation term in distributed scatterers ( ρ 0 ) [21]. When a radar images a man-made structure or sloping scattering surface, however, one can expect non-zero coherence values [22,23].
In interpreting the scattering characteristics of distributed scatterers, it is important to understand the signal depolarization properties. One of the widely used methods for understanding wave depolarization information is through the analysis of the eigenvalue spectrum [24]. The dual-pol covariance matrix is a positive definite Hermitian matrix, and its two eigenvalues λ 1 and λ 2 are both real and non-negative eigenvalues. The covariance matrix from a single or point target has a single non-zero eigenvalue, while all eigenvalues are identical for noise-like scatterers. General scattering phenomena lie between these two extremes. In the literature, several parameters have been used to characterize the level of depolarization in the radar signals. One of the widely used parameters is the degree of polarization D o P , defined as D o P = 1 4 | [ C 2 ] | / ( t r ( C 2 ) ) 2 [25]. In the case of dual-pol observation, the degree of polarization is equivalent to the relative strength among the first and the second eigenvalues [26,27], such that
D o P = λ 1 λ 2 λ 1 + λ 2 = P 1 P 2
where P i is the normalized eigenvalue P i = λ i / ( λ 1 + λ 2 ) , which can be considered as the probability of the eigenstates. It lies between zero and one and provides information on the scattering depolarization, which is zero for random scattering and one for completely polarizedsignals.
Another widely used scalar measure of depolarization is the scattering entropy H . It is defined as the distribution of probabilities across a set of eigenstates, such that
H = P 1 log 2 P 1 P 2 log 2 P 2
The entropy indicates the scattering randomness of a target that ranges from zero for a single scatter to one for a random scatter. The depolarizing or stochastic scattering process mainly occurs in the vegetated area. Similar to the vegetation indices of optical remote sensing, some studies have proposed a radar vegetation index ( R V I ) to highlight depolarizing scattering characteristics in vegetated areas. Kim and Van Zyl [28] proposed a vegetation index using the ratio of cross-pol intensity to total scattering intensity, and Chang et al. [29] improved the interpretation of the depolarization system by adding the concept of degree of polarization. More recently, Mandal et al. [27] proposed the dual-pol R V I , incorporating both the degree of polarization and dominant eigenvalue to better emphasize the stochastic nature of depolarizing scatterers. It can be expressed in terms of eigenvalues, such as
R V I = 1 D o P · P 1
A recent land cover classification study [30] showed that the separation of cropland and forest in dual-pol data can be improved by applying R V I .
These depolarization parameters are expressed using the normalized eigenvalue P i , and as the sum of two normalized eigenvalues equals one, all three parameters are functions of one variable in the case of dual-pol SAR. Because the depolarization parameters have a functional relationship with each other, we selected R V I , which has been widely used in practical applications due to its higher sensitivity to this vegetation [29] for change detection.

2.2. Dual-Pol Change Detection

Traditional SAR change detection has dealt with the binary classification problem of determining the changed and unchanged classes using one-dimensional backscatter intensity. In this study, we aimed to extend the binary detection to a multiclass detection problem by effectively utilizing different dual-pol scatter-type descriptors. Each of the aforementioned dual-pol parameters may convey different information on the scattering phenomenon. Therefore, the sensitivity of each polarization parameter to the ground objects and their changes can vary significantly across different land cover types. To address these problems with the optimal exploitation of dual-pol change information, we present a two-step processing strategy that divides the multiclass change detection process into a binary detection step that identifies the presence/absence of changes and a classification step that distinguishes the types of change. The overall workflow of the proposed approach for multiclass change detection is summarized in Figure 1.
In this section, we first present the binary change detection step shown in the first block of the processing flowchart. Unsupervised change detection is generally performed based on the change indicator, highlighting the contrast between changed and unchanged areas derived from the temporal SAR data. In the case of dual-pol SAR, a stochastic dissimilarity measure between the dual-pol covariance matrices [13,16] or a magnitude of the algebraic change vector, consisting of the intensity changes of the two dual-pol channels [18], have been used as the change indicator. These approaches of deriving a single integrated change indicator from the dual-pol SAR measurements assume that the information of dual-pol channels is consonant. However, the change information of different dual-pol parameters may be conflicting, and the detection results from different parameters may disagree. In this study, each dual-pol parameter is considered as an independent information source, and the change information of each parameter was exploited separately.
To highlight the change information for the given dual-pol parameter X , we applied the modified log ratio operation [3] to the temporal acquisitions X t 1 and X t 2 , such that
  L X = log m a x ( X t 1 , X t 2 ) m i n ( X t 1 , X t 2 ) = log X t 2 X t 1 =   R X .
where   R X is the conventional log ratio for the dual-pol parameter X . The change indicator   L X can highlight changed areas (both decrease and increase in the magnitude of the dual-pol parameters) in one direction (   L X 0 ), allowing for binary change detection with single decision criteria. Various algorithms have been developed in the literature to derive binary classification from L X . In this study, we adopted one of the simple and widely used unsupervised decision techniques, which is based on the Markov random field (MRF) model [31]. This method has been used in various change detection studies and has proven its performance [32,33,34,35]. Compared with classical thresholding approaches, it has the advantage of mitigating noisy detection results, which is particularly vulnerable in SAR change detection problems, by using spatial contextual information [12,34]. This is particularly important in our study because it is necessary to reduce the accumulation of erroneous detection results of individual dual-pol parameters in deriving a single detection map.
Let Ω X = { Ω n X , Ω c X } be the set of classes associated with unchanged ( Ω n X ) and changed ( Ω c X ) pixels for the change image L X of the dual-pol parameter X of size N . According to the MRF framework, the change detection map can be obtained by minimizing the following energy function U .
U L X , Ω X = k = 1 N log p L X k | Ω X k β I Ω X k
where I Ω X k is the number of occurrences of the class label Ω X k ( Ω n X , Ω c X ) in the neighborhood system of the k t h pixel and β is a constant that controls the contribution of the spatial contextual information. The decision process requires a model for the class conditional probability density function (PDF) p L X | Ω X . Considering positively tailed log ratio data and possible differences in the statistical properties of different dual-pol parameters, we adopted the Nakagami distribution [4,11,18] in this study.
The optimization of the MRF model is generally carried out using an iterative algorithm. In this study, we adopted the iterated conditional models (ICM) algorithm [36] to minimize Equation (9). The ICM method requires an initial change map as the input. Then, it sequentially updates Ω ^ X k for all pixels in the change image L X . For each pixel, the label value causing the lowest energy is chosen. The iteration continues until convergence. Initial change maps and initial estimates of conditional density function parameters for the unchanged and changed classes were obtained using the automatic histogram-based minimum error thresholding algorithm [37].
After deducing the change class from the dual-pol parameters separately, a decision fusion process is required to generate a single change detection map Ω = Ω n , Ω c , where each pixel represents a class label of either unchanged ω n or changed ω c classes by combining the change information of different dual-pol parameters. Here, it is important to note that the choice of combination operator depends on the information to be combined. The change information of different parameters can be combined in either a conjunctive way if they are consonant or disjunctive way if they are conflicting [38]. Here, we assumed conflicting situations between the detection results of different dual-pol parameters where certain ground changes can be uniquely recognized by specific polarimetric parameters [39,40]. For example, buildings built on bare surfaces can be revealed by intensity changes, while a ground change from dense vegetation to a building may be difficult to identify through intensity changes. On the other hand, changes in the reflection symmetry property of the dual-pol signal may not be able to reveal ground changes where crops are planted on bare surfaces, while they may provide important change signals for vegetation-to-building changes that have been difficult to detect due to intensity changes. Considering the potential conflict between the dual-pol parameters, the logical disjunction operator was adopted as a simple way to aggregate detection results from different dual-pol parameters. The final detection result of k t h pixel Ω k can be obtained by taking the logical disjunction of the detection results Ω X k of different dual-pol parameters, such that
Ω k = X S Ω X k
where S is a set of selected dual-pol parameters for the detection step.

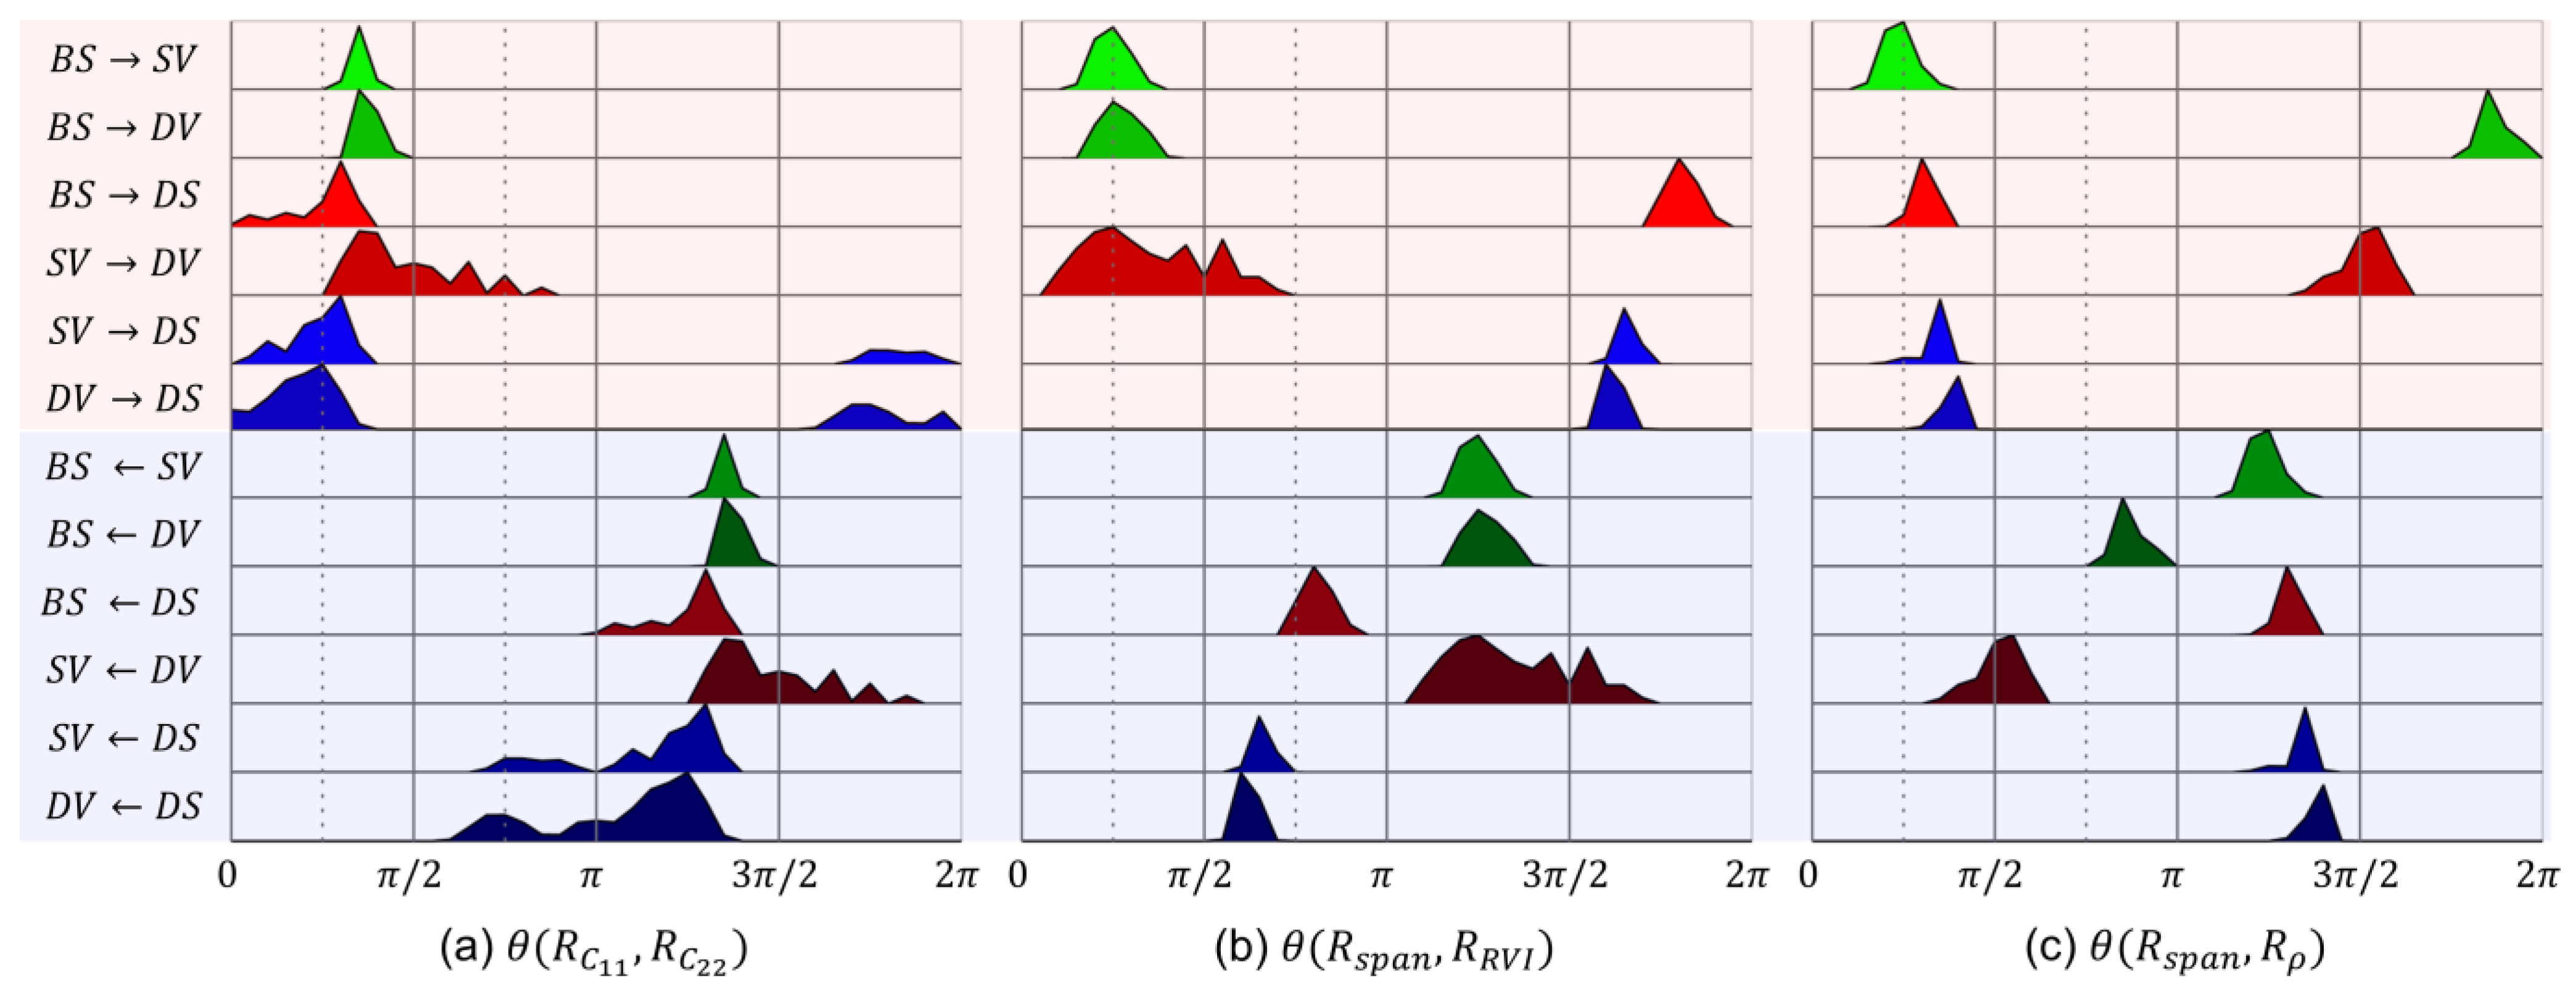
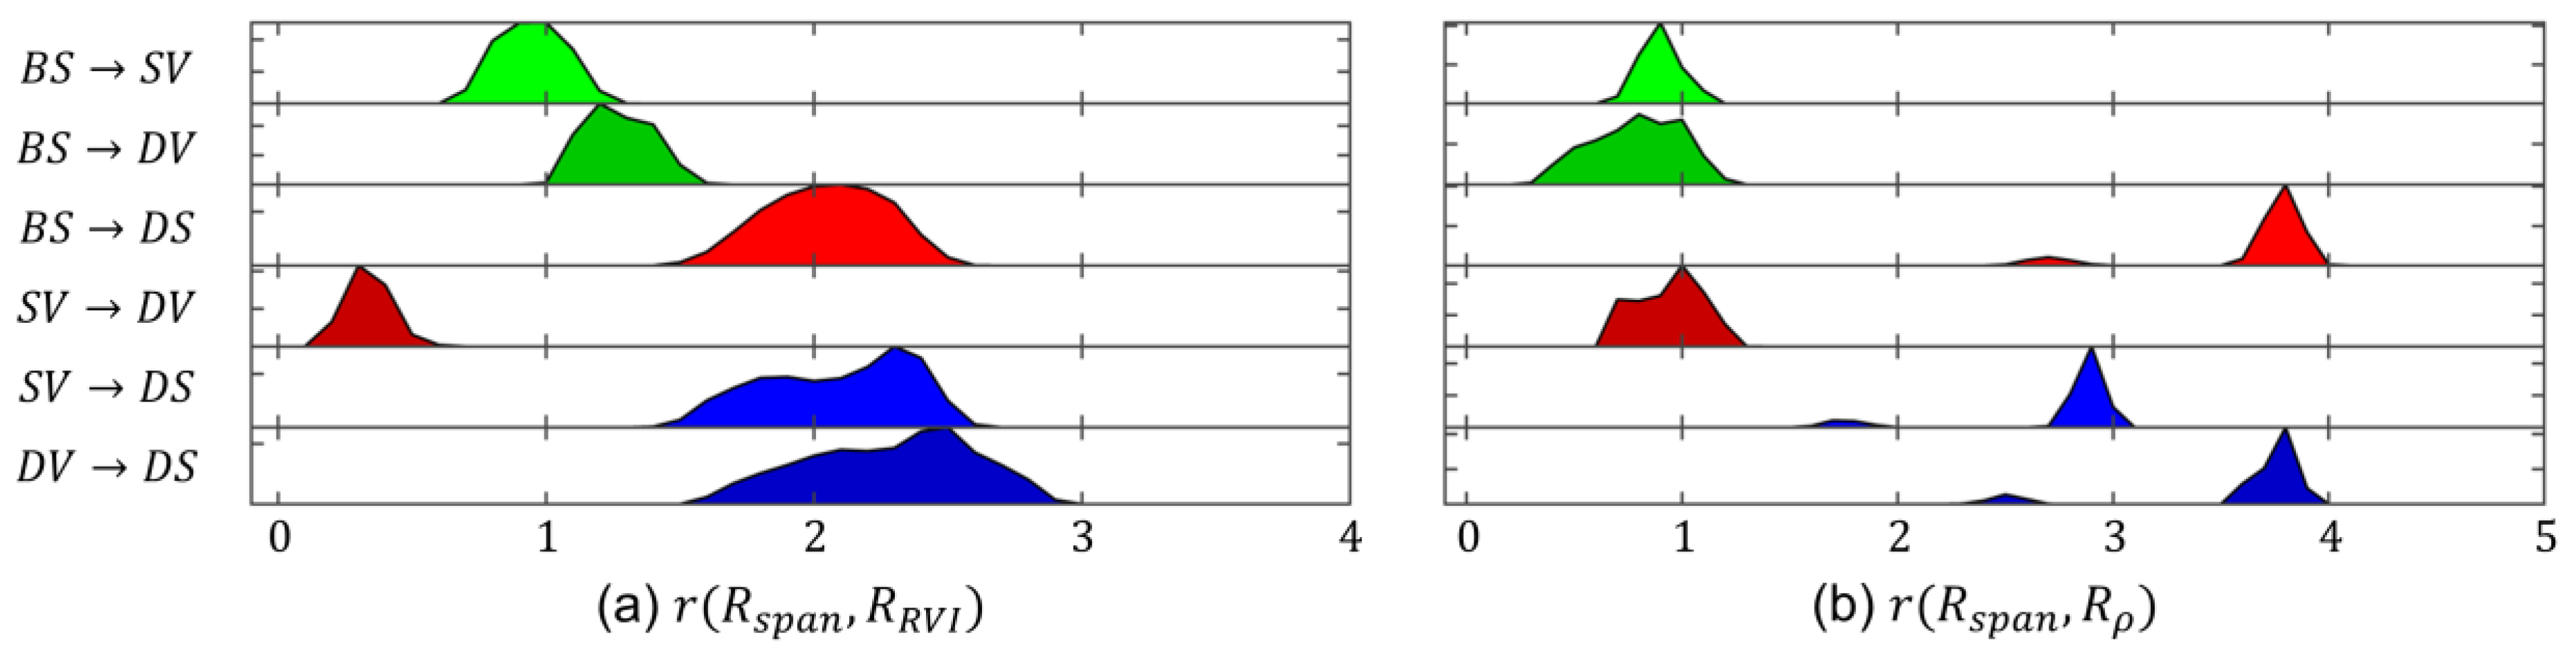
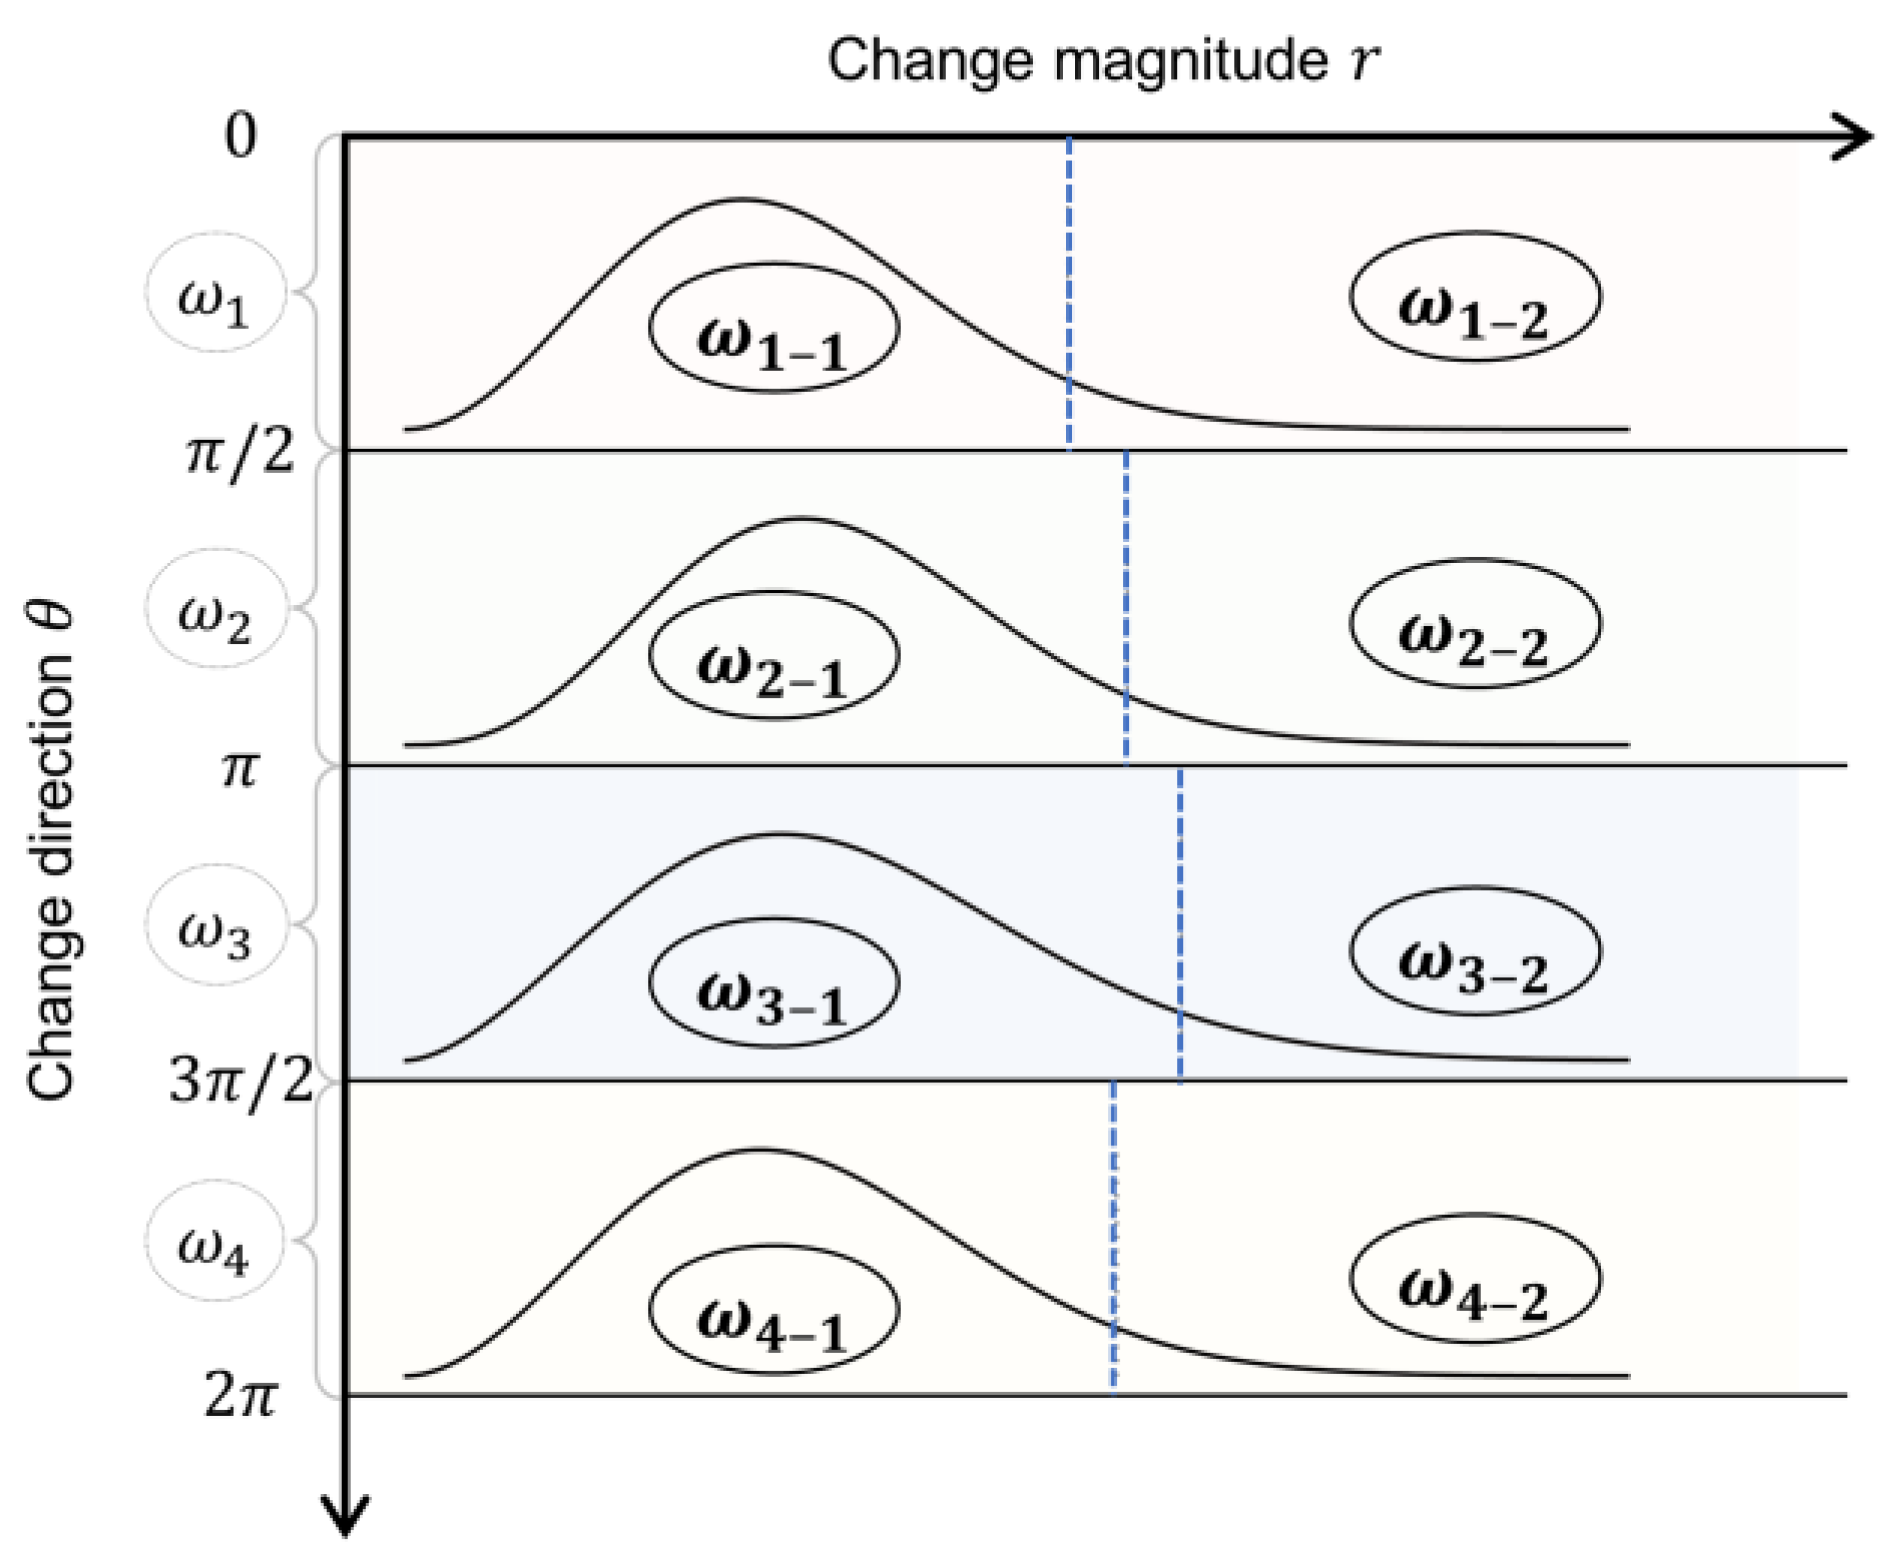
2.3. Dual-Pol Multiclass Change Classification

The change class determined in the detection step may be attributed to different types of ground changes. The classification stage aims to distinguish possible different types of changes within the change class. Focusing only on the change class ω c of the previous step, this corresponds to an unsupervised classification problem where ω c is divided into M different change classes, i.e., Ω c = ω 1 , ω 2 , , ω M , using the temporal dual-pol observations. To explore both the temporal increase and decrease in polarimetric parameters with respect to various semantic changes, we used the directional dual-pol change indicators R X , defined as R X = log X t 2 / X t 1 , as our feature space for the classification step.
Considering several different dual-pol parameters, the separation of the Ω c into ω m   ( m = 1 , 2 , , M ) classes can be performed by applying clustering techniques to multidimensional features R X . Here, it is worth noting that one can infer semantic change information by examining the relationship between dual-pol change indicators, as different dual-pol parameters can be interpreted as physical scatter-type indicators that can respond differently to different types of change. Therefore, we focused on the decision making that relies on the response of R X according to the change in the physical scattering mechanism of the surface and the implementation of the change classification process based on it. There have been many studies on the unsupervised estimation of the scattering mechanism from quad-pol observations [41]. However, in the case of dual-pol SAR, there has been a lack of dedicated studies reporting how dual-pol parameters respond to different types of scattering mechanism changes.
To understand the change information contained in the different polarimetric parameters, we performed simple simulation experiments using theoretical surface ( C S ), dihedral ( C D ), and volume ( C V ) scattering models (see Appendix A). Here, we considered four general land cover types, including bare surface (BS), sparse volume (SV), dense volume (DV), and dihedral structure (DS). The quad-pol scattering covariance matrix C of the selected four land cover classes were simulated using a mixture of simple scattering models, such as
C = P S C S + P D C D + P V [ C V ]
Table 1 summarizes scattering contributions P S , P D , and P V of the surface, dihedral, and volume scattering models, respectively, to simulate the scattering responses of the selected land cover types.
Then, the dual-pol covariance matrices of the h-pol and v-pol transmissions C 2 h and C 2 v , respectively, were generated using Equation (3). Considering four classes, we then have 4 2 2 ! = 12 possible types of changes, as summarized in Table 2.
Based on the simulated dual-pol covariance matrix, we analyzed how multidimensional dual-pol change indicators respond to various ground changes. In particular, we focused on exploring the information structure of the dual-pol observation and revealing which dual-pol parameters can effectively classify different types of change. To effectively analyze the relationship between dual-pol parameters and devise a practical change classification method, we used the change vector analysis concept [42,43] that represents the change detection problem in terms of the magnitude r and direction θ of change between the two selected dual-pol parameter pair R X 1 and R X 2 .
r = ( R X 1 ) 2 + ( R X 2 ) 2
θ = t a n 1 ( R X 2 / R X 1 )
In conventional change vector analysis, various types of possible changes are usually identified through the direction variable. Figure 2 shows the histogram of direction variables of selected dual-pol parameter pairs for the h-pol transmission cases. Here, we selected three different dual-pol parameter pairs, such as (1) intensities, (2) intensity and depolarization, and (3) intensity and coherence. Of the twelve types of change in Figure 2, the top six shown on the red background and the bottom six shown on the blue background indicate changes in opposite directions to each other.
Therefore, the following analysis only focuses on the former six types of change. Let us first look at the relationship between the two intensities of the dual-pol channels, which has been widely used in most change detection studies for dual-pol SAR data. Figure 2a illustrates that the change directions of dual-pol intensities for different types of change are all similar, making it difficult to separate change classes. On the other hand, by analyzing dual-pol parameters together with scattering intensity, certain types of changes can be discriminated, as shown in Figure 2b,c. Here, the intensity parameter was replaced with the overall intensity for a 2-D representation of the change vector. The overall intensity can be expressed by the s p a n of the covariance matrix, such as
s p a n = T r [ C 2 p ] = S h p 2 + S v p 2
Using the R V I parameter together with the overall intensity (Figure 2b), three cases of the vegetation increase (types 1, 2, and 4 in Table 1) exhibit change detections in which both the intensity and R V I increase ( θ [ 0 , π / 2 ] ). In contrast, the other three changes related to building construction correspond to change detections in which the intensity increases but R V I decreases ( θ [ 3 π / 2 , 2 π ] ). Figure 2c shows the change direction in overall intensity and polarimetric coherence for different types of change. By using the coherence parameter along with the overall intensity, different types of vegetation change, such as types 1, 2, and 4, can be distinguished in the direction variable.
Because the change direction information is related to the changes in the scattering mechanism of the two dual-pol parameters, we can apply a simple decision rule to the direction variable that categorizes the direction axis into four sectors related to the increase or decrease in the two selected dual-pol parameters. Then, the k t h change pixel is assigned to one of the change classes c m ( m = 1 , , 4 ) according to the following decision rule:
k ω m   m = 1 , , 4 ,     i f   m 1 2 π θ k < m 2 π  
Although simulation experiments exhibit the possibility of distinguishing change types using polarization information, there are limitations to classifying various change classes exclusively with the direction variable. The direction variable in the s p a n - R V I pair cannot successfully distinguish between different vegetation changes, and the change direction of the s p a n -coherence pair has a limitation in confusing the vegetation and building changes. It illustrates that changes in the scattering mechanism delivered by dual-pol SAR signals may not be sufficiently sensitive for discriminating various semantic changes.
Among semantic changes that appear similar in terms of scattering mechanisms, some land-cover transitions may have larger change signals than others. In this case, the change magnitude can be supplementary information for the multiclass change classification problem. Figure 3 shows the histogram of the magnitude variable r of the s p a n - R V I and s p a n -coherence parameter pairs. For the overall intensity and R V I pair shown in Figure 3a, different vegetation-related changes (types 1, 2, and 4) with similar change directions show minor differences in change magnitudes. On the other hand, the change magnitude of the overall intensity and coherence pair shown in Figure 3b can clearly distinguish the change from soil to vegetation (type 1) and the change from soil to building (type 3), which exhibit the same change direction. In this case, the change magnitude can be used to define subclasses of the corresponding changes in the scattering mechanism, which is determined by the change direction.
In an automatic determination of subclasses in a particular scattering mechanism change class, it may be difficult to assume the presence of distinguishable subclasses in advance. Instead of examining the joint distribution for all subclasses, this study adopted a simple method of determining subclasses based on the tail probability of the probability distribution of the change magnitude as illustrated in Figure 4. Let p ( r | ω m ) be the PDF of the change magnitude belonging to class ω m corresponding to the m t h sector of the direction variable. Analogously with the previous section, we adopted the Nakagami distribution model for the PDF of the change magnitude. Considering a positively tailed log ratio distribution, pixels corresponding to the right tail of p ( r | ω m ) can be assumed to be a different group corresponding to the larger change magnitude. Then, the m t h change class ω m can be divided into two subclasses based on the tail threshold T m .
ω m ω m - 1 , r T m ω m - 2 , r > T m
The threshold value T m for the m t h change class can be obtained from the PDF and predefined tail probability α by solving the following equation numerically.
T m p r | ω m d r = α

3. Experimental Results

3.1. Data Set for Experiments

As mentioned above, the dual-pol systems can have different configurations, such as h h - v h and h v - v v , depending on the transmitter polarization state. Here, it is worth noting that sensitivity to ground parameters may vary depending on the channel configuration of the dual-pol SAR data. Because the changes in land cover type between the two periods are complex and various, it is important to compare the performance of dual-pol SAR-based multiclass change detection with different configurations. Therefore, we applied the proposed method to a bi-temporal dual-pol SAR data set simulated from the quad-pol SAR data to evaluate the multiclass change detection method of h h - v h and h v - v v configurations. In this study, the quad-pol SAR data set was acquired by the NASA/JPL UAVSAR L-band airborne sensor. It consists of two bi-temporal images taken over Los Banos, California, USA, on 19 July 2013 and 19 February 2016, respectively. Then, the dual-pol SAR data sets for the h h - v h (Figure 5a,b) and h v - v v (Figure 5c,d) configurations were generated from quad-pol data using Equations (2) and (3). All images with a size of 1024 × 1024 pixels were precisely co-registered, and the Lee sigma filter [44] was applied before analysis to reduce the speckle effect in change detection.
Between the two temporal SAR data, various types of changes occurred, including the construction of residential buildings, the removal of farm buildings, and phenological variations in agricultural areas. A sophisticated reference change map for various change types is essential to evaluate the performance of multiclass change detection algorithms. Therefore, we generated the reference change map of the study area based on the multispectral images taken around the same time at the bi-temporal SAR data acquisitions. The Landsat 8 image on 30 July 2013 and the Sentinel-2 image on 15 February 2016 were used as reference images for the earlier and later SAR data, respectively. In order to understand land cover changes between the two periods, each multispectral image was classified as shown in Figure 6a,b, respectively. Four major land cover types were identified for both periods, including bare soil (So), short/sparse vegetation in farmlands (SC), high/dense crops (HC), and buildings (Bu). In addition, we identified noticeable within-class changes corresponding to soil tillage from the visual interpretation of the optical and SAR images. Therefore, the reference change map including nine different change types was manually generated based on the classification results and visual interpretations, as shown in Figure 6c.

3.2. Results of Change Detection

First of all, we evaluated the change detection step, that is, the binary classification performance for the presence or absence of changes. The proposed method performs a change detection step from each of the dual-pol parameters included in the selected parameter set S and combines different change maps according to Equation (10) to derive the final detection result. In performing the MRF-based change detection of each selected dual-pol parameter, the contextual parameter β was set to 1.6 [32,39]. To understand the role of dual-pol information in detecting complex changes, we tested four different combinations of dual-pol parameter sets:
  • Intensities: S 1 = { C 11 , C 22 } ;
  • Intensities and coherence: S 2 = { C 11 , C 22 , ρ } ;
  • Intensities and depolarization: S 3 = { C 11 , C 22 , R V I } ;
  • Intensities, coherence, and depolarization: S 4 = { C 11 , C 22 , ρ , R V I } .
Figure 7a–d and Figure 8a–d show the change detection results of the proposed method for the h h - v h and h v - v v configurations, respectively, using the four different dual-pol parameter sets. The results obtained by the proposed approach were compared with the binary change classification results of the two recent studies, such as the Wishart–Loewner method (WL) [16] and the dual-pol change vector analysis method (PVA) [18], as shown in Figure 7e,f for the h h - v h configuration and Figure 8e,f for the h v - v v configuration. The two selected recent studies were also aimed at classifying multiclass changes. To effectively evaluate the change detection step, all change classes of the WL and PVA methods were combined into one change class. Qualitatively comparing the change detection results of the proposed method and the two previous methods with the reference binary change map in Figure 7g and Figure 8g, it can be noticed that the proposed method provides better performance for properly detecting various changes compared with previous methods in both dual-pol configurations.
The accuracy of change detection results was evaluated for the h h - v h and h v - v v configurations as summarized in Table 3 and Table 4, respectively, based on the reference change map. To assess different aspects of the change detection results, several accuracy metrics were considered, including the overall accuracy (OA), F1-score (F1) [45], precision (Pr), detection rate (DR), and false alarm rate (FR). All accuracy metrics clearly showed that the proposed approach performed better than the previous methods in both dual-pol configurations. The detection performance of the proposed approach showed a significant improvement, particularly in the detection rate, which refers to how much of the area where actual changes occurred was detected. It is worth noting that only the detection rate was improved without sacrificing the false alarm rate. Looking at the change detection performance according to the dual-pol parameter set used in the proposed framework, there was a noticeable improvement in the overall detectability in both dual-pol configurations by using depolarization or dual-pol coherence parameters as well as scattering intensities. Among different dual-pol parameter sets, the combination of dual-pol intensities and dual-pol coherence ( S 2 ) was used to obtain the change detection result of the first step in consideration of a possible increase in false alarms that can be problematic in combining multiple parameters.

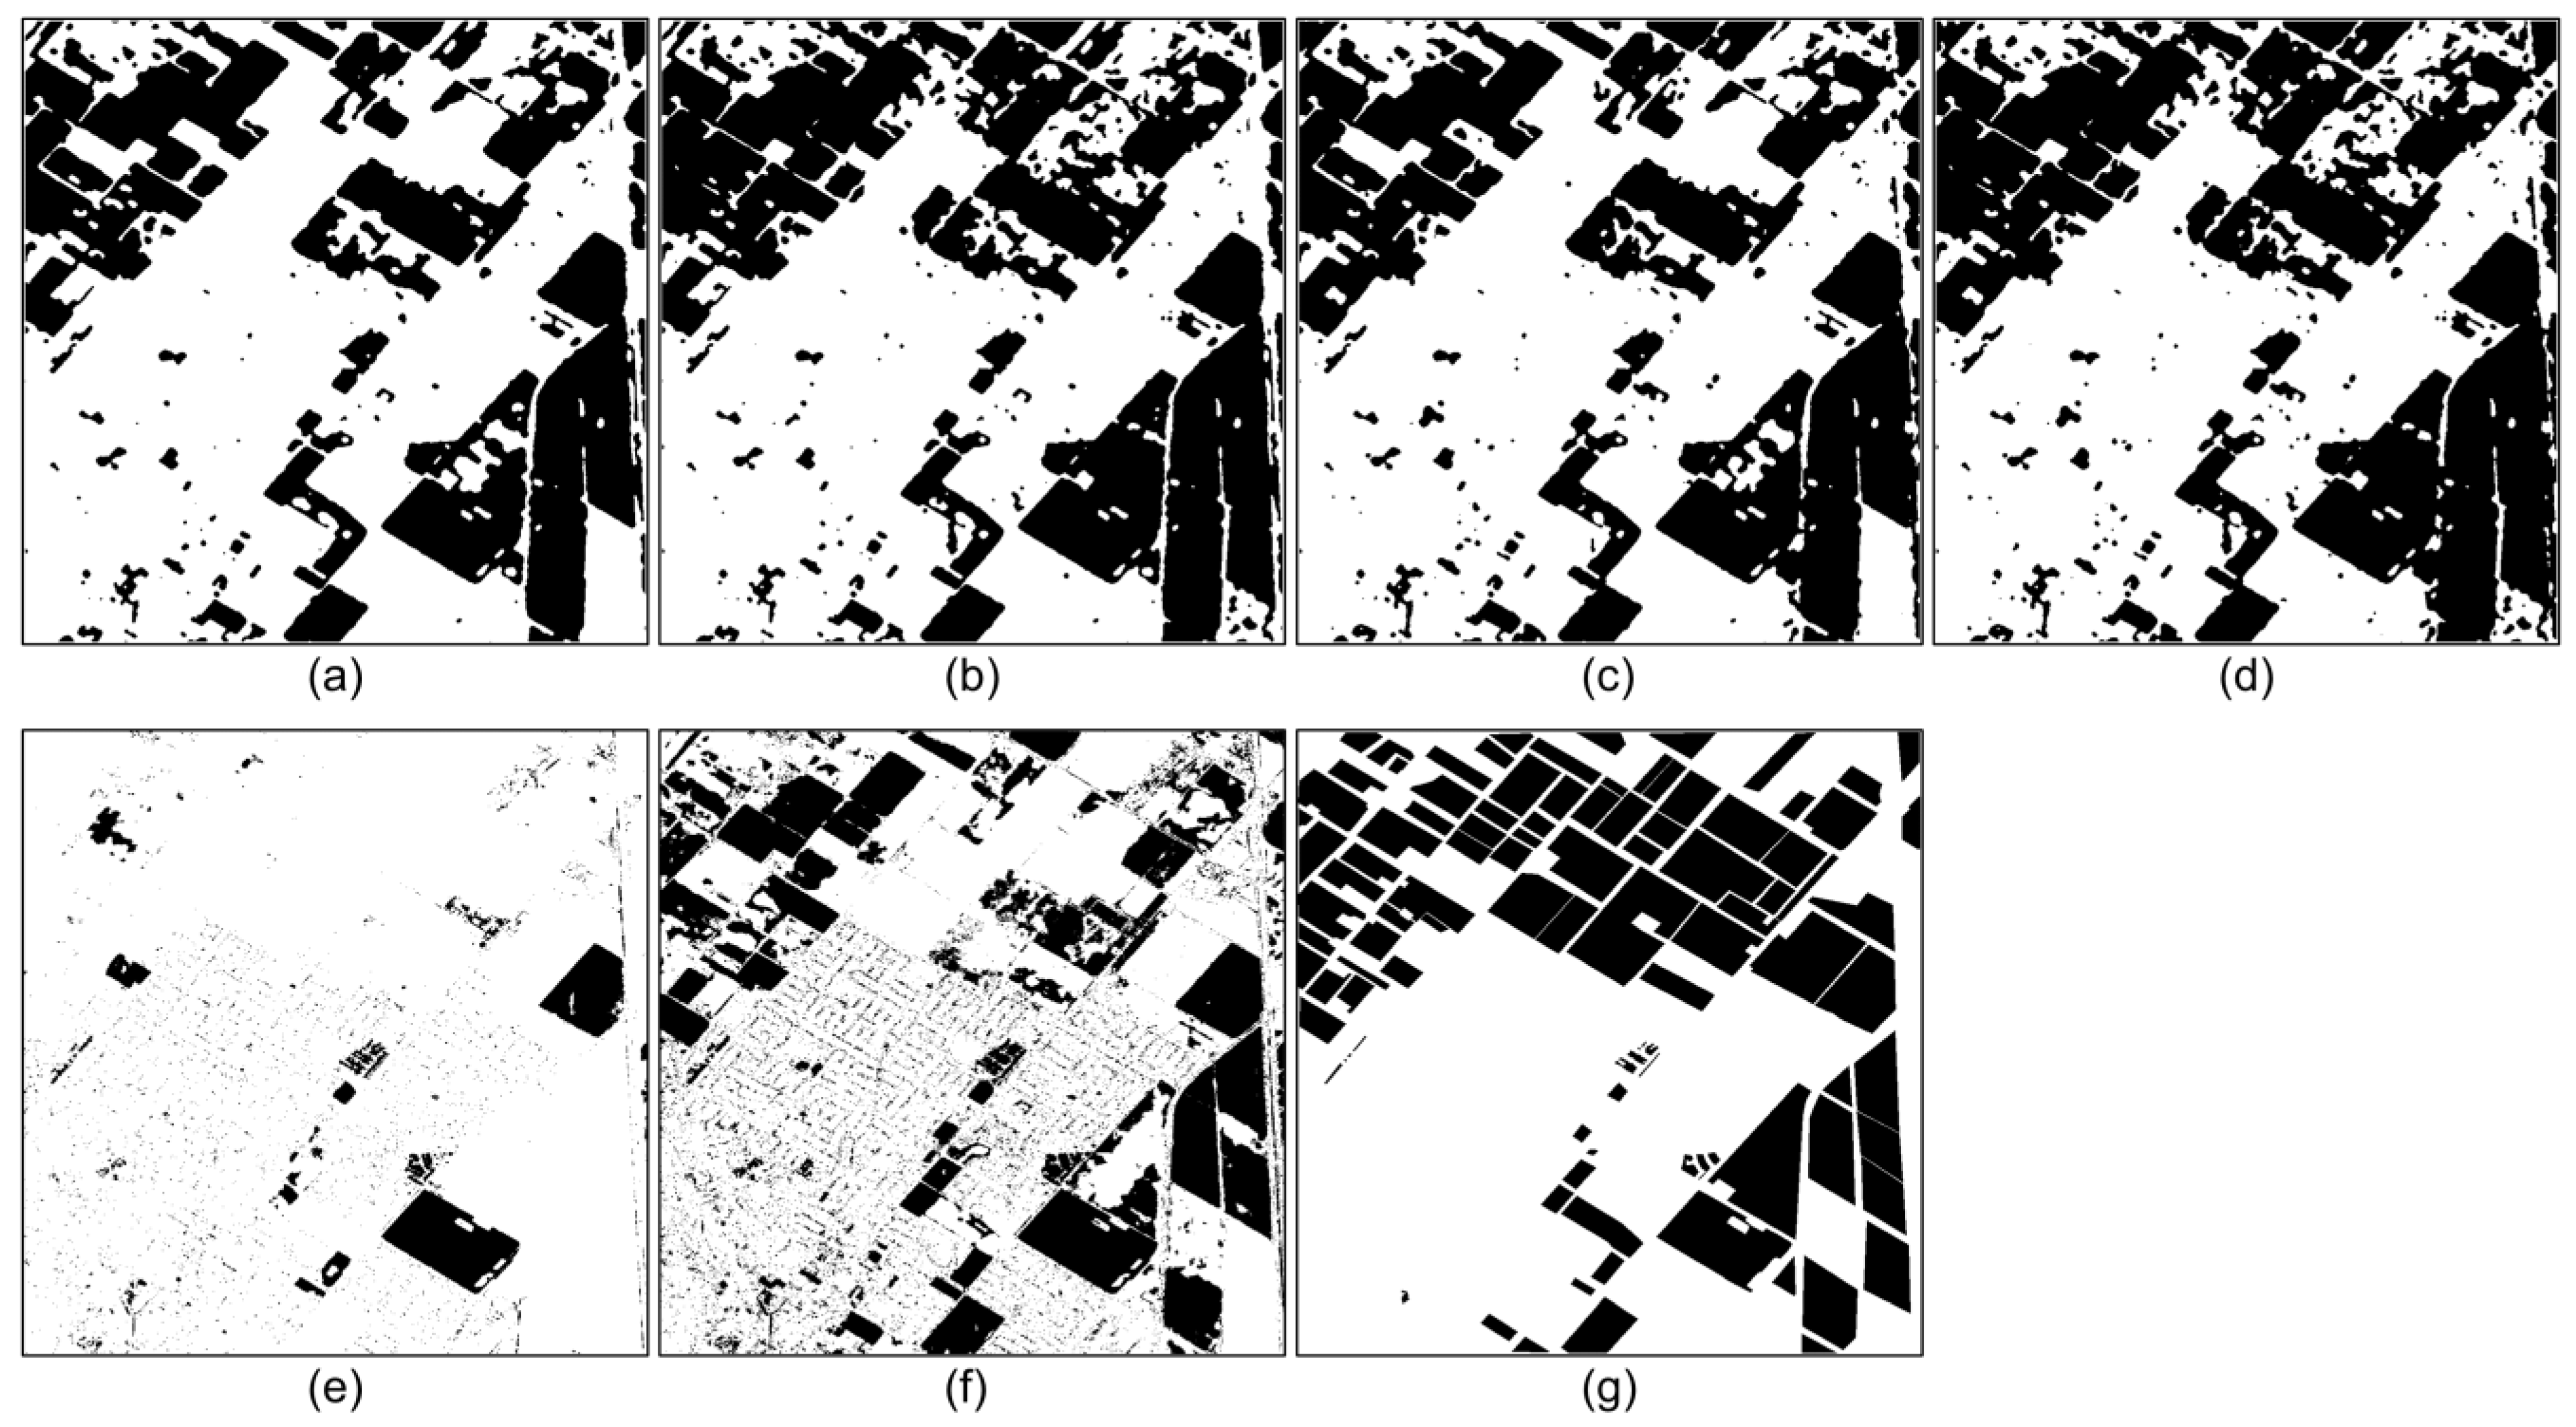
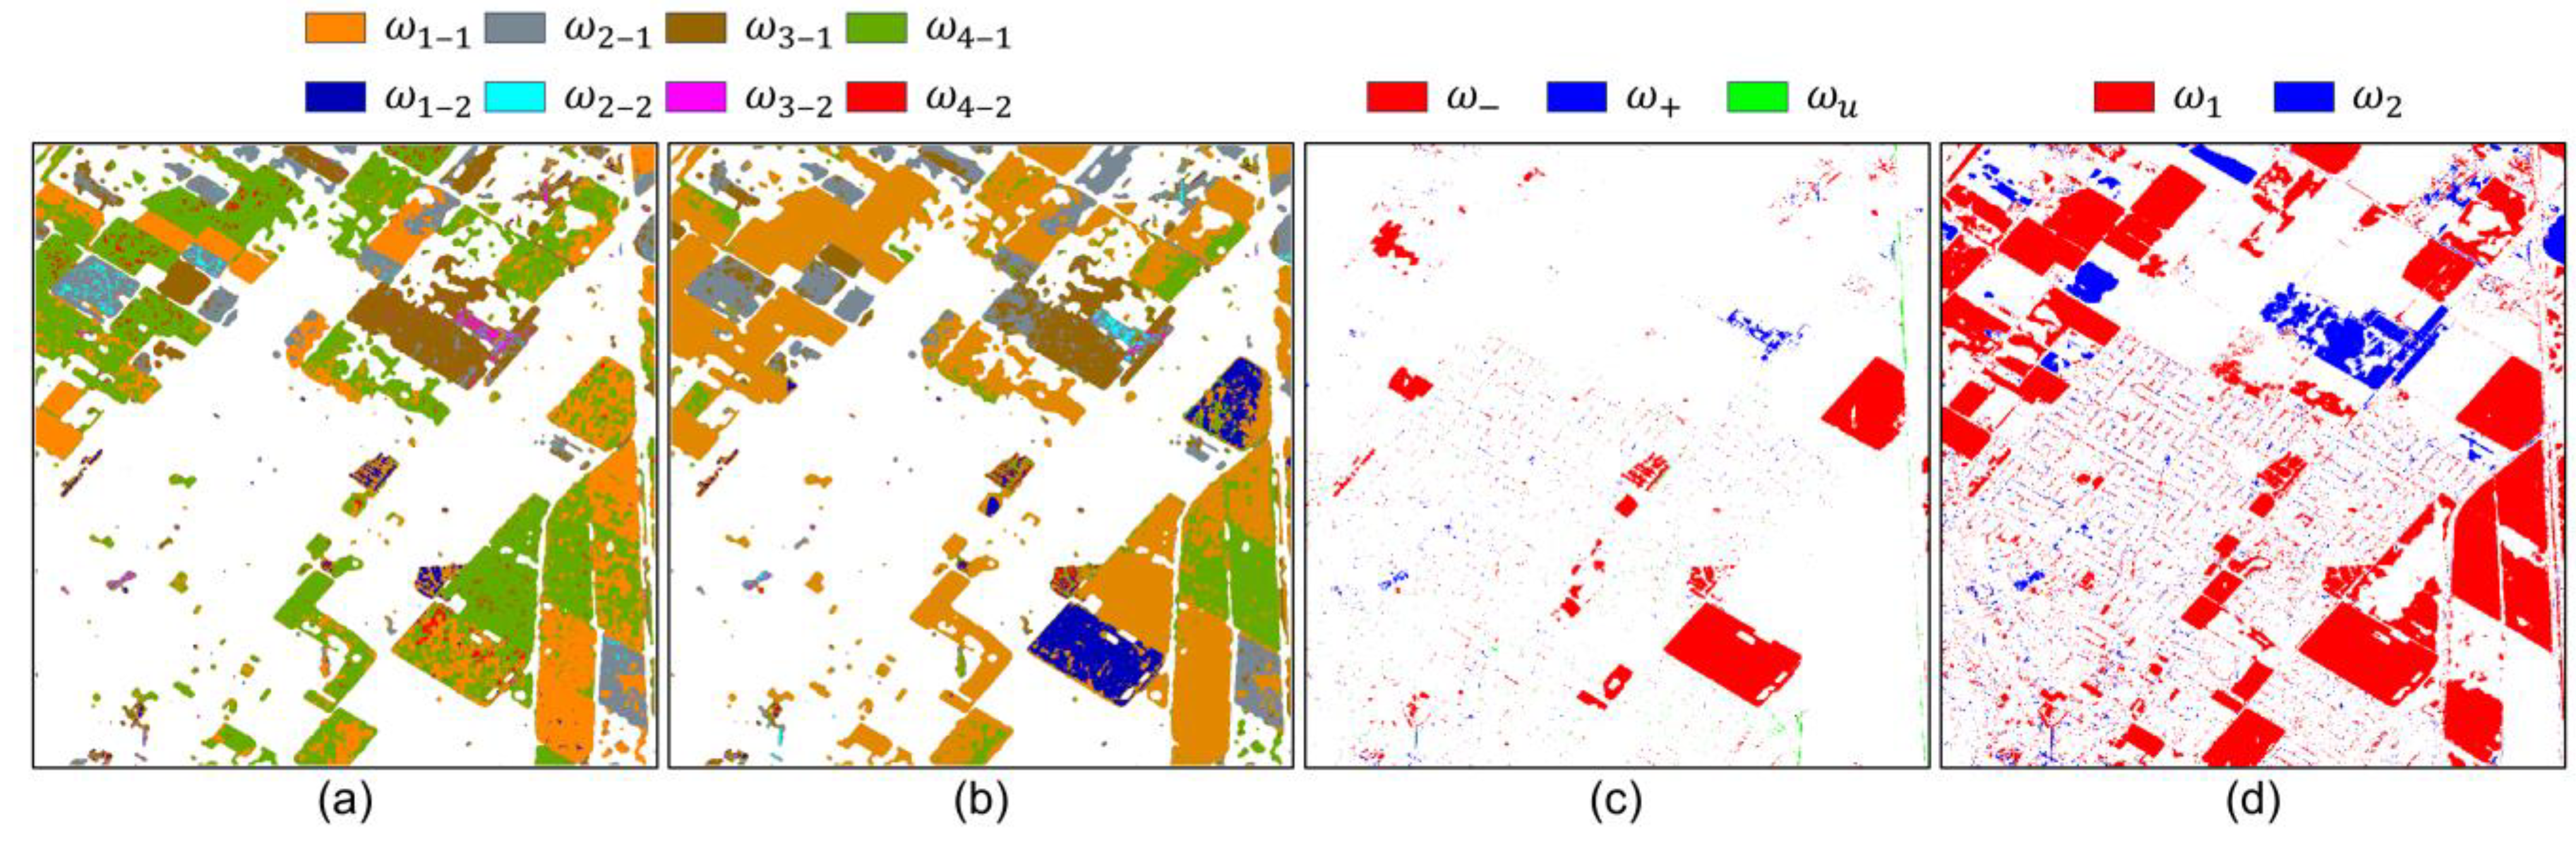
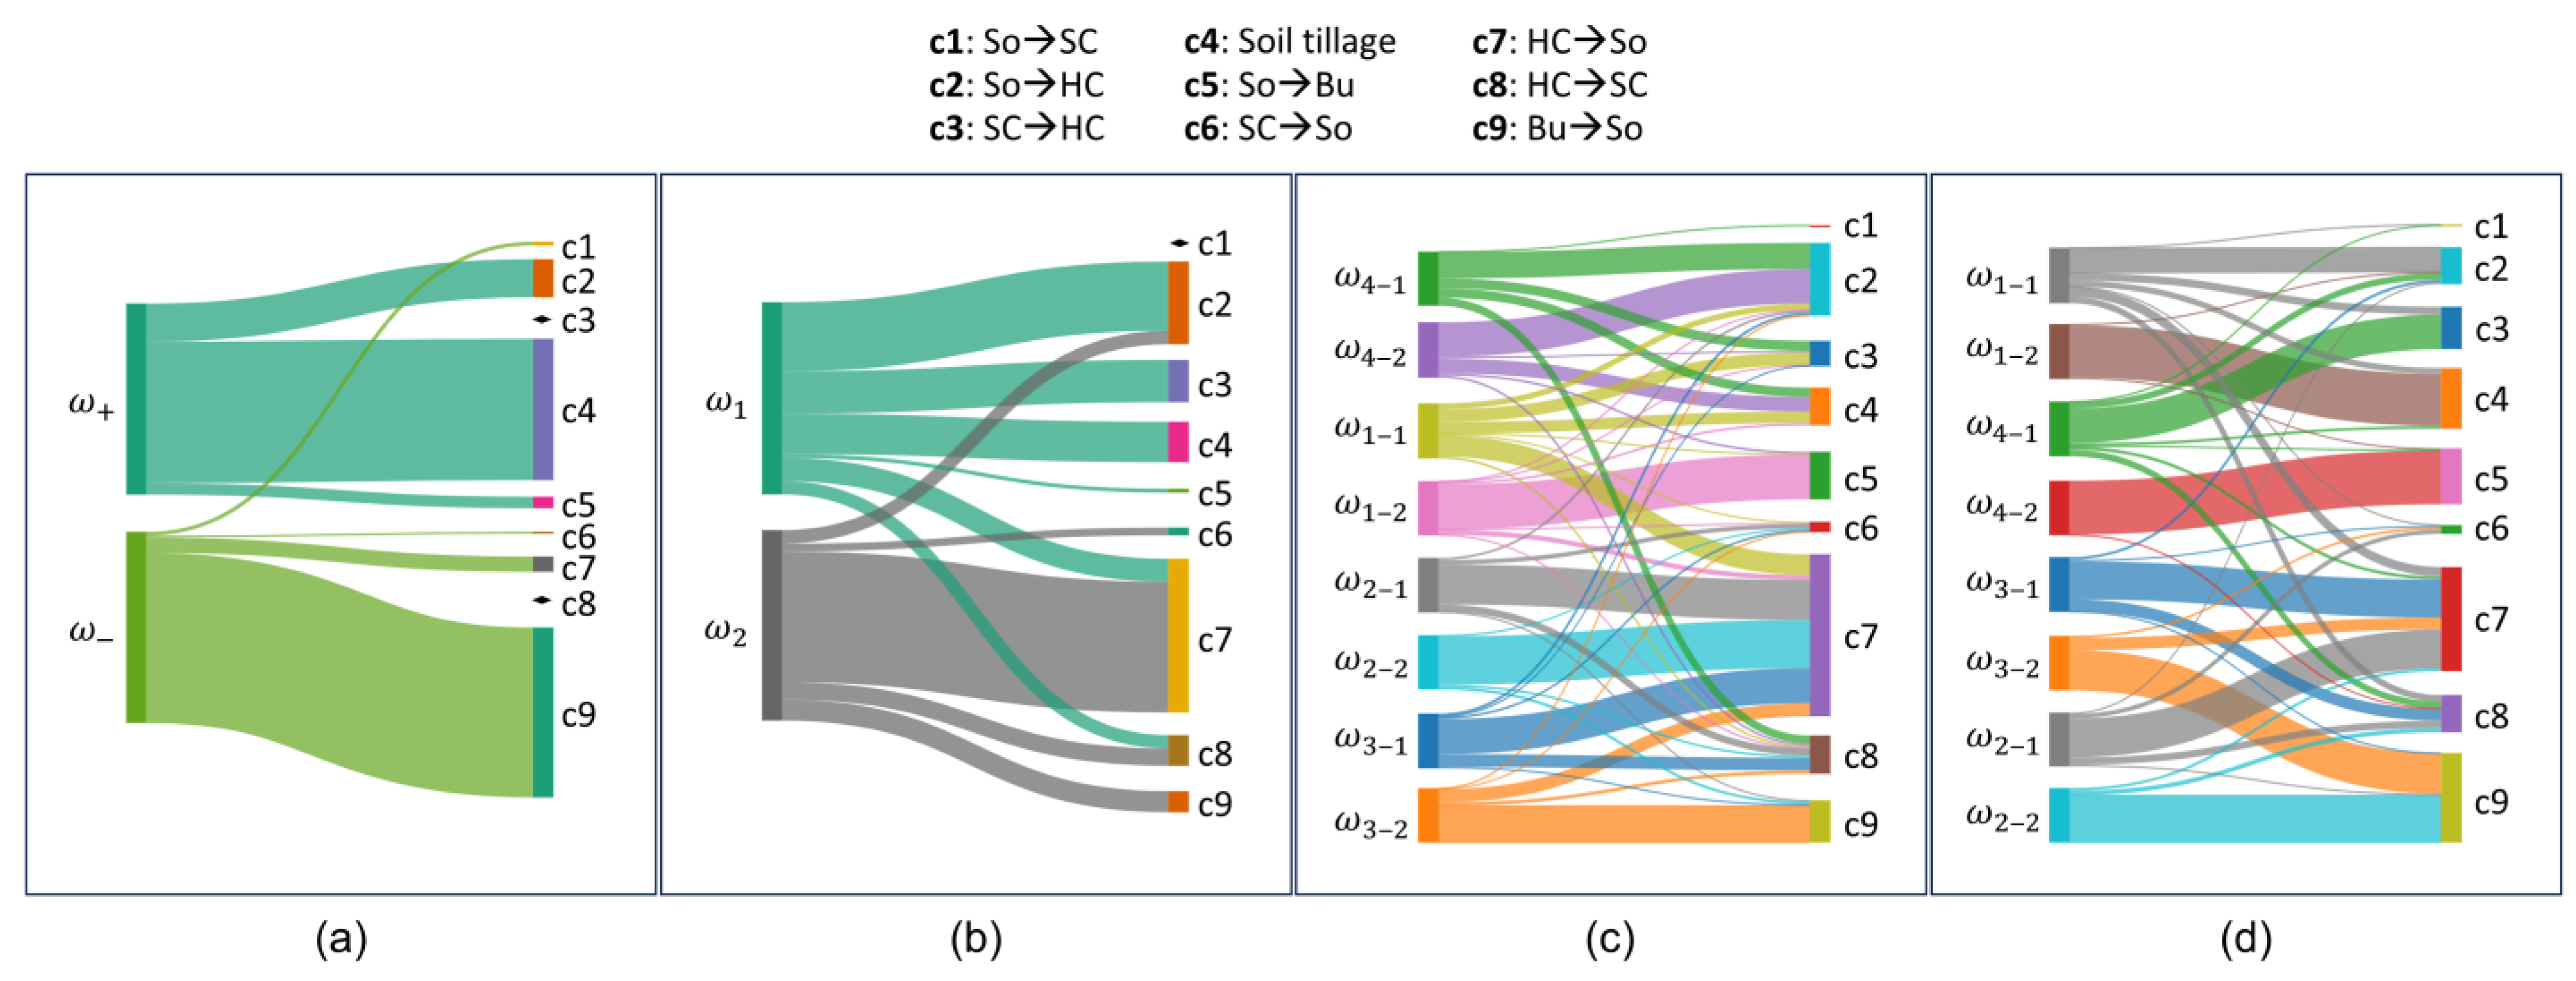
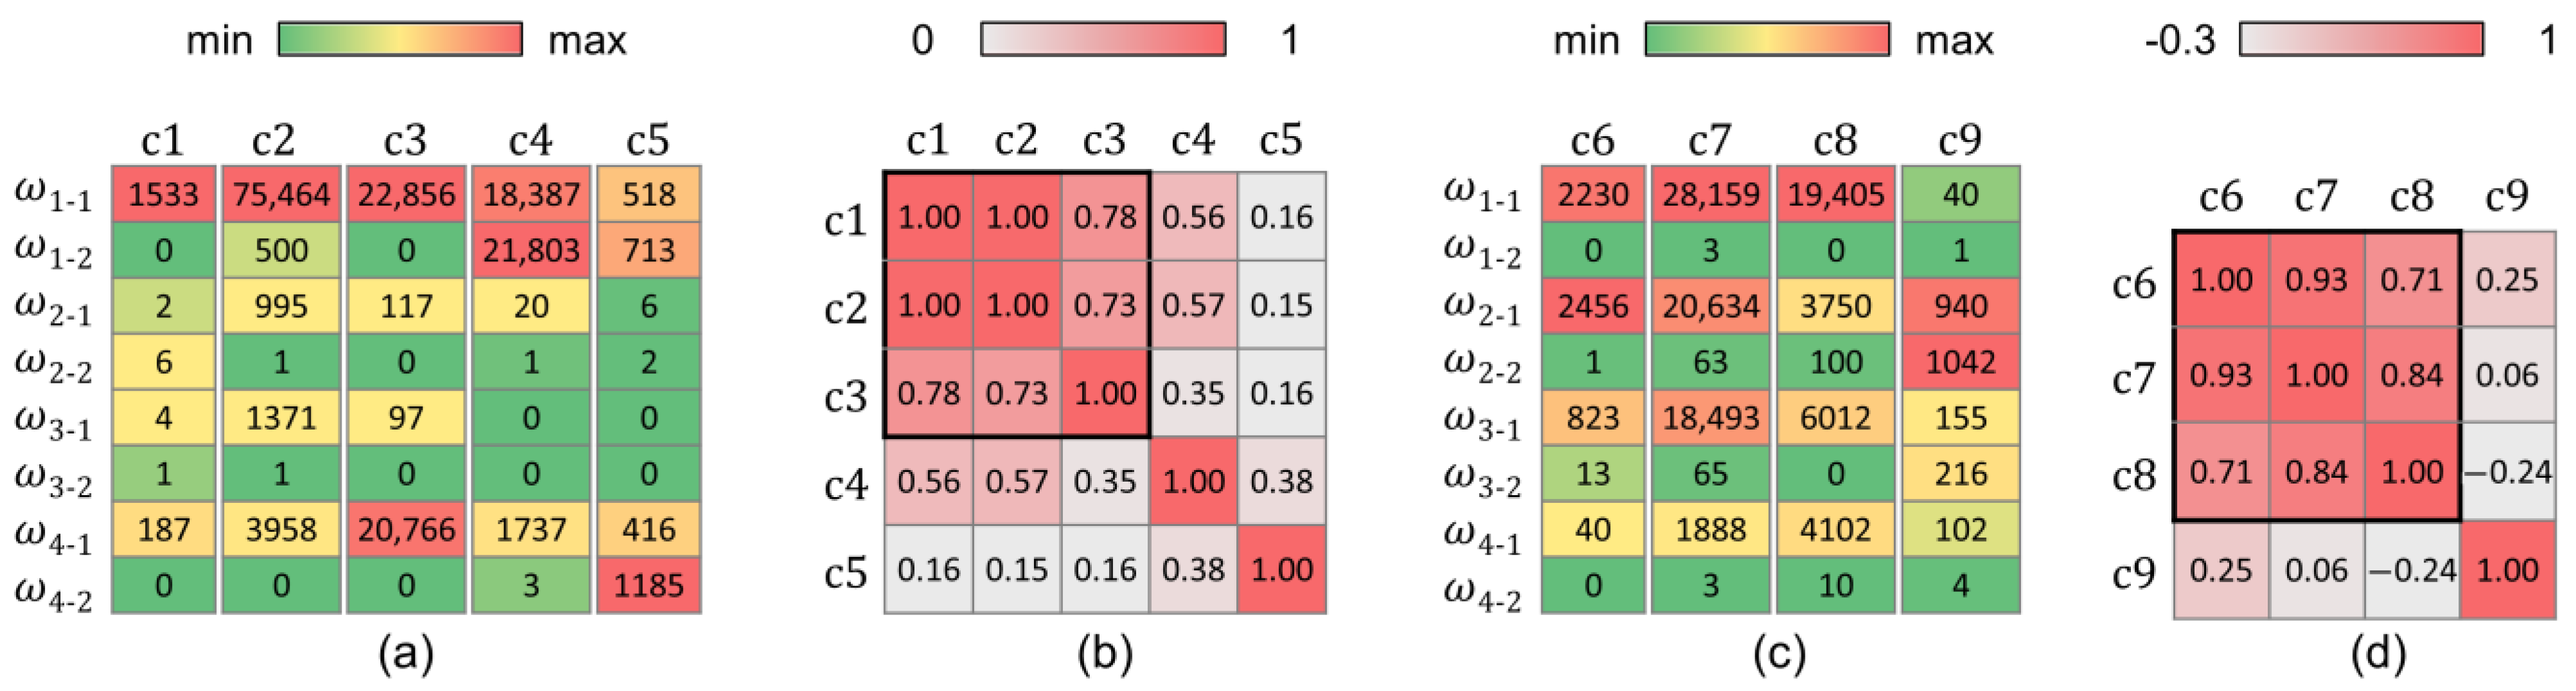
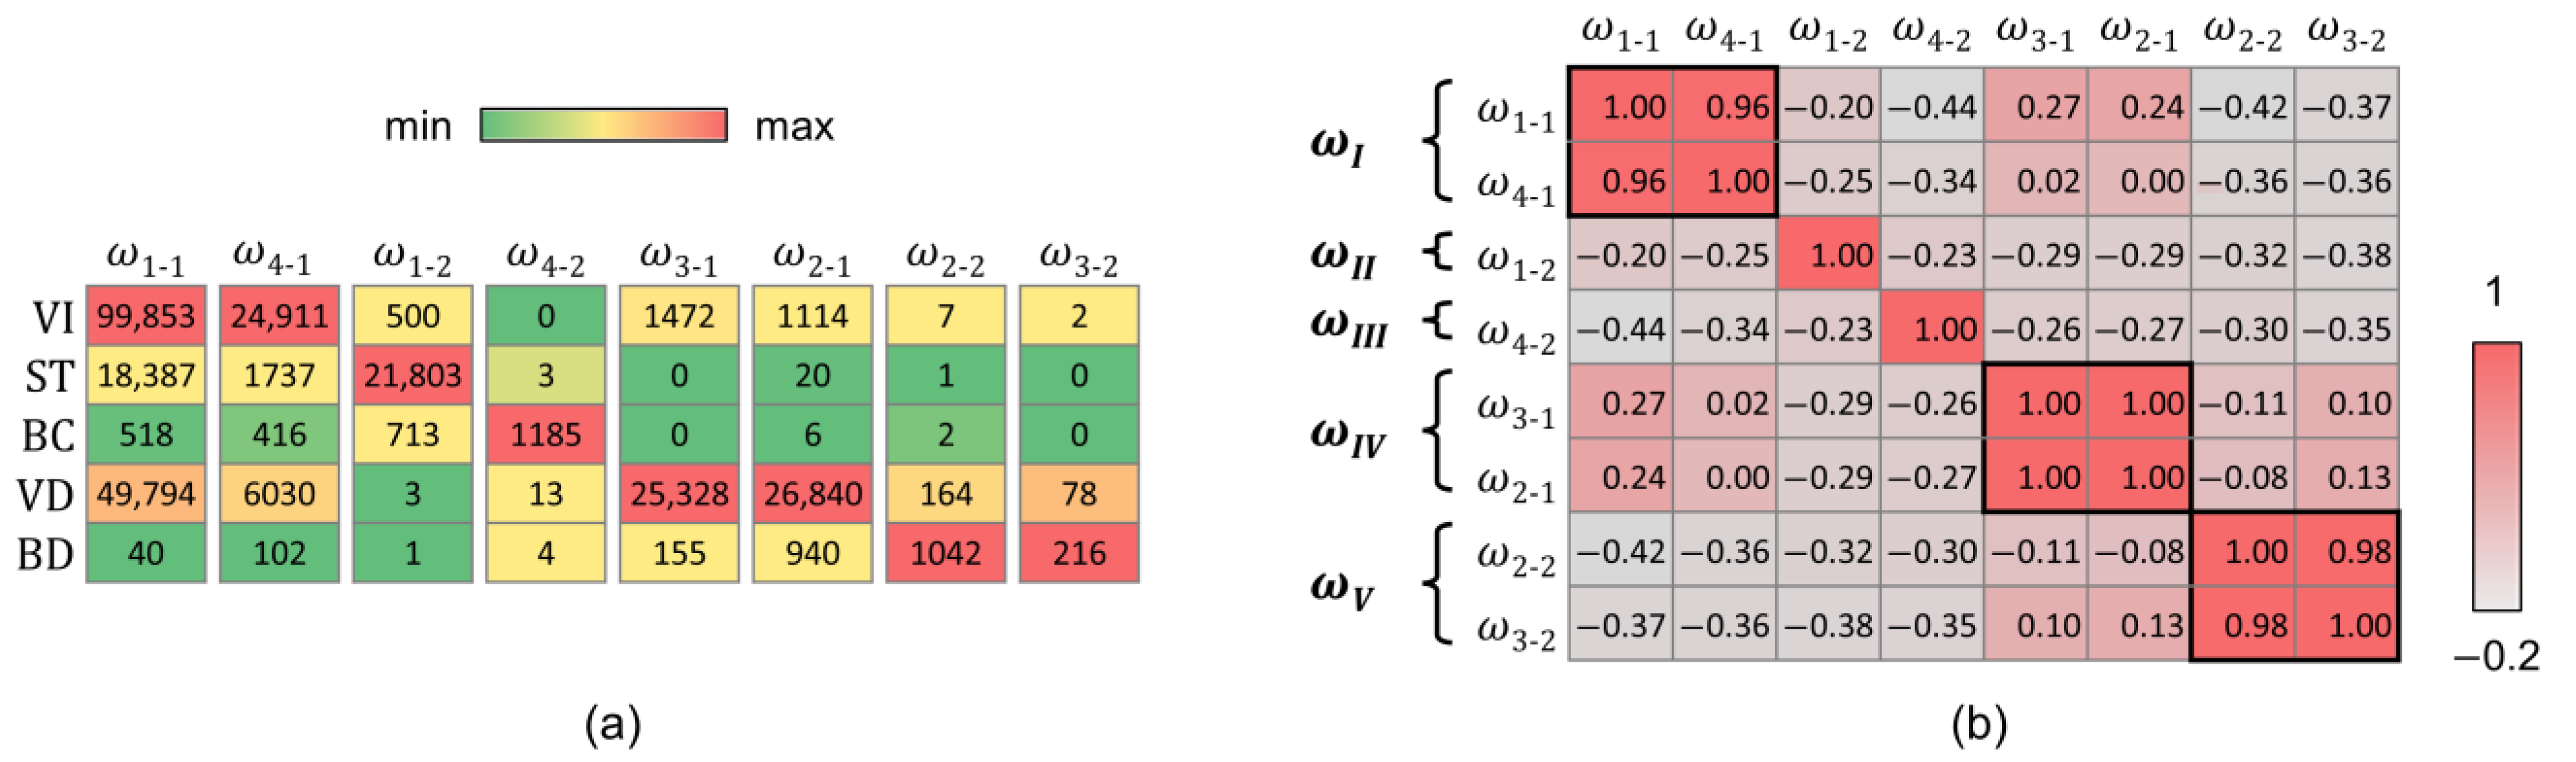
3.3. Results of Multiclass Change Classification

After obtaining the detection map, the proposed unsupervised change classification method based on the change direction and magnitude of the dual-pol parameters was applied to pixels selected as change areas. Here, we evaluated the change classification results obtained from the two selected dual-pol parameters pairs, i.e., { s p a n , ρ } and { s p a n , R V I }.
Figure 9 shows the change classification results for the h h - v h configuration. Figure 9a,b display the results obtained from the proposed method. Despite a simple crisp decision boundary on the change direction and magnitude plane, we can identify the change in a crop patch with a uniform change class for both dual-pol parameter pairs. For comparison, the change classification results of the selected previous studies, such as WL and PVA methods, are presented in Figure 9c and Figure 9d, respectively. The WL method examines the definiteness of the difference of the covariance matrices and determines whether it is positive definite ω + , negative definite ω , or indefinite ω u . In the case of the PVA method, the change classification is performed by using the change direction of the two dual-pol intensities C 11 and C 22 . The direction variable is assumed to be a mixture of different change classes, and the multiclass change classification is performed by determining threshold values using the expectation-maximization algorithm with the generalized Gaussian model. The experimental results clearly show that the proposed method can distinguish different types of vegetation changes as compared with the two previous methods. Comparing the results with the reference change map in Figure 6c, the distinction between changes related to artificial structures and changes in vegetation, which was difficult to achieve in previous methods, could be obtained through the proposed method.
To understand the discriminability of change classes of SAR data for different semantic changes, the relationship between the change classification results and reference change map was examined using a Sankey diagram, as shown in Figure 10. The left node of the diagram corresponds to the radar-based change classes, and the right node is the reference land cover change. Each flow indicates the percentage of each change class linked to the land cover change. Figure 10a,b show that the two change classes of the WL method and PVA method were mostly associated with two types of change: the change related to the increase in overall scattering intensity (c1–c5 classes) and the change related to the decrease in scattering intensity (c6–c9 classes). Both of the previous methods could separate the construction (c5) and removal (c9) of buildings into two change classes, but land cover changes commonly associated with an increase in scattering intensity, e.g., building construction and vegetation growth (c1–c4), were indistinguishable from each other. On the other hand, Figure 10c,d show that the proposed method not only increases the number of change classes but also provides the potential to distinguish different semantic changes without being completely biased to certain types of change or missing specific changes.
Experimental results reveal the usefulness of dual-pol parameters other than scattering intensity in distinguishing change types; however, there is a significant difference in the performance of dual-pol parameters to classify change types. In the case of utilizing dual-pol coherence shown in Figure 10c, one change class confused several semantic changes or different change classes corresponded to one semantic change, making it difficult to distinguish between different types of change particularly related to vegetation. Nonetheless, the s p a n , ρ pair was able to separate building changes from vegetation-related changes. On the other hand, the use of the dual-pol R V I together with the overall scattering intensity provided more stable change classification results for both vegetation-related and building changes, as shown in Figure 10d.
The Sankey diagram allows for an interpretation of the semantic meaning of each radar-based change class derived from the change direction and magnitude of the s p a n , R V I pair. Change classes ω 1 - 1 and ω 1 - 2 (increases in both the scattering intensity and R V I ) were mainly related to changes from soil to high crop and soil tillage, respectively. Change classes ω 2 - 1 and ω 2 - 2 (decreased scattering intensity and increased R V I ) could be interpreted as the change from high crop to soil and building removal, respectively. Change classes ω 3 - 1 and ω 3 - 2 (decreases in both scattering intensity and R V I ) were also mostly associated with changes from high crops to soil and building removal, respectively. It illustrates that it was difficult to further distinguish between change classes using the R V I among the changes related to the reduced scattering intensity. On the other hand, change classes ω 4 - 1 and ω 4 - 2 (increased scattering intensity and decreased R V I ) were mainly related to changes from short deviation to high crop and building construction, respectively.
Figure 11 and Figure 12 are the change classification results for the h v - v v configuration. The overall results were similar to those of the h h - v h configuration, and the advantages of the proposed method over previous methods can also be identified. However, several different points can also be identified between the change classification results obtained in the h v - v v and h h - v h configurations. In the case of the s p a n , ρ pair shown in Figure 11a and Figure 12c, the change classification result distinguished between building changes and vegetation-related changes, but there was a significant difference in the change classes in the two different dual-pol configurations. It suggests that the co-pol and cross-pol coherence are sensitive to the selection of polarization basis in characterizing the scattering mechanism, making it difficult to expect consistent performance. On the other hand, Figure 9b and Figure 11b illustrate that similar change classification results can be obtained from the s p a n , R V I pair in both dual-pol configurations. However, as can be seen from Figure 12d, the results of the h v - v v mode exhibited a slightly reduced discriminatory ability to link one change class to one land cover change compared with the h h - v h configuration.

4. Discussion

The previous change classification methods could distinguish low-level change between two change classes, such as increased or decreased scattering intensity. This study extended the change classification scheme into multiple change types in the dual-pol SAR data using the scattering intensity and randomness information. However, we could also identify that some change classes unable to distinguish between land cover changes, and it was unclear whether all semantic changes can be distinguished in the classification of changes in SAR data. Therefore, we further investigated the distinguishable land cover changes, the semantic meaning of the change class, and the performance of the change classification results.
First, we examined which semantic changes can be effectively distinguished in the SAR change classes. For this purpose, the compositions and correlations of SAR change classes under the conditions of the reference land cover changes related to the increase (or decrease) in scattering intensity were analyzed. Figure 13a shows the composition of SAR change classes for the reference land cover changes related to the increase in scattering intensity (c1–c5), and Figure 13b shows the correlation coefficient between each land cover changes composed of these SAR-based change classes. Among them, changes in the type of vegetation increase (c1, c2, and c3) show significantly high correlation coefficients with each other, suggesting that those changes are difficult to clearly distinguish from each other in the dual-pol SAR signals. Figure 13c,d show the composition of the SAR change classes for the reference land cover changes related to the decrease in scattering intensity (c6–c9) and their correlations, respectively. Similarly, it illustrates that land cover changes in the form of reduced vegetation (c6, c7, and c8) could not be clearly distinguished from each other in the dual-pol SAR signals. Consequently, land cover changes in the study area that can be classified via dual-pol SAR data were redefined into five types, such as (1) vegetation increase (VI), (2) soil tillage (ST), (3) building construction (BC), (4) vegetation decrease (VD), and (5) building removal (BR). Here, VI was a combination of three change types related to vegetation increase (c1, c2, and c3), and VD was defined by combining the three change types related to vegetation decrease (c6, c7, and c8).
Then, it is required to clarify the relationship between SAR change classes and these five semantic changes to evaluate the dual-pol SAR change classification results. Figure 14a shows the areal composition of five semantic change types for total areas classified into each SAR change class. The SAR change classes that divided the change direction and magnitude variables of the s p a n , R V I pair into eight sectors distinguished the five semantic changes without omitting specific ones, but some classes provided duplicative change information. To investigate the SAR change classes that can effectively classify semantic changes, the correlation between each SAR change class composed of semantic changes was examined as shown in Figure 14b. Change classes ω 1 - 1 and ω 4 - 1 , which change in the direction of increasing scattering intensity while having relatively small change magnitude, provide similar semantic change information, so the two classes can be merged into one, denoted by ω I . The remaining ω 1 - 2 and ω 4 - 2 classes were denoted as ω I I and ω I I I , respectively. Likewise, the change classes ω 2 and ω 3 in the direction in which the scattering intensity decreases can be considered to provide similar semantic information and are merged into one (classes ω I V and ω V in Figure 14b).
A comparison of five SAR change classes ( ω I ω V ) with the five semantic reference land cover changes allows for a quantitative assessment of the change classification results. Table 5 and Table 6 show the confusion matrices of the change classification results obtained from the h h - v h and h v - v v configurations, respectively. The accuracy of change classification was evaluated using the overall accuracy. The classification results of the h h - v h and h v - v v polarization modes showed overall accuracies of about 71% and 61%, respectively. Because there have been few studies on multiclass change classification using SAR data, a one-to-one comparative assessment of the results with previous studies was not possible. Nonetheless, it can be confirmed that utilizing dual-pol SAR data can resolve multiclass change detection problems with an overall accuracy of about 60–70%, and an improvement in change classification accuracy of about 10% points can be expected by using the h h - v h configuration as compared with the h v - v v configuration.
To understand the difference between the change detection results of the two dual-pol configurations, we further explored how the polarization parameters differ according to the observation configuration. As dual-pol observation is a subspace of fully polarimetric signals, we can infer the nature of the dual-pol parameters according to the observation mode by evaluating how the polarimetric parameters of each dual-pol mode differ from those of quad-pol SAR. The comparative evaluation was performed for the overall scattering intensity, s p a n , and scattering randomness parameters used for change classification. Here, polarimetric entropy H , which is easy to compare with the quad-pol case, was used instead of R V I as a parameter indicating scattering randomness.
Figure 15a,b show the ratio between the changes of polarimetric parameter X derived from the quad-pol SAR ( R X q u a d ) and that from each dual-pol mode ( R X h h v h and R X h v v v , respectively). To reduce scatterer-dependent variations in the comparative analysis, polarimetric parameters were calculated exclusively for the ST class, which shows the most significant difference in change detection performance depending on the dual-pol configuration. The horizontal and vertical axes represent the comparison results for s p a n and H parameters, respectively, and the blue dashed lines indicate the case where the dual-pol and quad-pol parameters are identical. In both s p a n and H , the ratios between the dual-pol and quad-pol parameters are significantly off of the identical line, suggesting that the change analysis with dual-pol data is bound to be worse than expected from quad-pol data.
Comparing Figure 15a,b, the dual-pol parameters of the h h - v h and h v - v v configurations exhibit notable differences in their relationship with the quad-pol parameters. In the case of the h v - v v configuration, the temporal changes in dual-pol entropy, in particular, were significantly different from that estimated from the quad-pol data. There are some cases where the ratios between the dual-pol and quad-pol entropy were even negative (marked by a red ellipse), which represents that the estimation of change directions was opposite between dual-pol and quad-pol cases. It suggests that the ground changes associated with increased scattering randomness can be misinterpreted as a reduced change. Consequently, the performance degradation of the h v - v v configuration can be attributed to the loss of depolarization information of the dual-pol observation.

5. Conclusions

This study has investigated a multiclass change detection problem in bi-temporal dual-pol SAR data. We demonstrated the intrinsic ambiguities of conventional scattering intensities in distinguishing between complex and diverse land cover changes. To effectively detect and classify various change types, we focused on exploring the comprehensive use of various dual-pol parameters. In this study, a new multiclass change detection and classification scheme using a polarimetric change vector feature space has been proposed to identify multiple change information using dual-pol SAR data. We have reported significant improvements in the conventional change analysis in two main aspects: (1) the detection of a wide spectrum of land cover changes by combining independent change information from different dual-pol parameters; and (2) the identification of different semantic change information. The proposed method can retrieve change information in an automatic and unsupervised way without ancillary in situ information. Given the heterogeneous change scenarios associated with natural and anthropogenic changes, it may extend the applicability of SAR remote sensing technology in understanding complex changes occurring on the Earth’s surface.
Despite these advantages, the proposed change detection strategy also has limitations. Thresholding for automated detection or classification can vary across regions of interest, even for similar types of changes. This is a limitation inherent in all unsupervised change detection strategies based on the thresholding technique. An improved decision-making strategy that can solve these challenges is required for an operational application of SAR data. Another issue to consider arises from the characteristics of the dual-pol SAR data. Our experiments showed a significant difference in detection and classification performance according to dual-pol configurations. Dual-pol SAR observes different subspaces of the quad-pol scattering matrix depending on the observation configuration. Experimental results illustrated the influence of intrinsic characteristics of the dual-pol parameters on the practical applications of dual-pol SAR data.
This problem of losing scattering information in dual-pol observations is inevitable in the application of dual-pol SAR. Considering the importance of polarization parameters in analyzing complex change scenarios, it is clear that the quad-pol SAR is an important observation tool, providing more practical information in the detection of changes occurring on Earth’s surface. As an extension of this work, the optimal exploitation of quad-pol scattering observables for automatic change recognition in heterogeneous change scenarios is planned to be addressed in our future study.

Author Contributions

Conceptualization, M.K. and S.-E.P.; methodology, M.K. and S.-E.P.; software, M.K. and S.-E.P.; validation, M.K. and S.-E.P.; formal analysis, M.K.; investigation, M.K.; resources, M.K. and S.-J.L.; data curation, M.K. and S.-J.L.; writing—original draft preparation, M.K. and S.-E.P.; writing—review and editing, M.K., S.-J.L. and S.-E.P.; visualization, M.K. and S.-E.P.; supervision, S.-E.P.; project administration, S.-E.P. and S.-J.L.; funding acquisition, S.-E.P. All authors have read and agreed to the published version of the manuscript.

Funding

This work was supported by the “Satellite Information Application” program of the Korea Aerospace Research Institute (KARI) and in part by the National Research Foundation of Korea (NRF) grant funded by the Korean government (MSIT) (NRS-2023-00222563).

Data Availability Statement

The original contributions presented in the study are included in the article, further inquiries can be directed to the corresponding author.

Acknowledgments

The authors would like to thank the JPL UAVSAR team for providing the polarimetric SAR data set.

Conflicts of Interest

The authors declare no conflicts of interest.

Appendix A

In this appendix, simple scattering models for the surface, dihedral, and volumetric scattering mechanisms and their model parameters used in the simulation experiments are presented. All scattering models used in this study describe the scattering phenomena in terms of the polarimetric coherency matrix [ T ] to predict the fully polarimetric scattering response effectively. We used the original model formulation in the simulations and transformed it to the covariance matrix [ C ] form using a unitary transformation matrix shown in Equation (A1) [21] to produce a dual-pol scattering response.
C = 1 2 1 1 0 0 0 2 1 1 0 T 1 0 1 1 0 1 1 2 0
For modeling the scattering response, we implemented the extended Bragg model [46,47]. The scattering from randomly rough surfaces can be described as
T S = 1 β * e 2 σ 2 0 β e 2 σ 2 1 2 β 2 ( 1 + e 8 σ 2 ) 0 0 0 1 2 β 2 ( 1 e 8 σ 2 )
The polarimetric scattering element β is given by
β = B h B v B h + B v
where B h and B v are the Bragg scattering coefficients:
B h = c o s   θ ε r s i n 2 θ c o s   θ + ε r s i n 2 θ B v = ε r 1 { s i n 2 θ ε r ( 1 + s i n 2 θ ) } ( ε r c o s   θ + ε r s i n 2 θ ) 2
In the given incidence angle θ , The complex scattering element β depends only on the dielectric constant ( ε r ) of the scattering media. The parameter σ was introduced to account for the scattering depolarization with the increase in surface roughness. Therefore, two model parameters need to be determined to predict the surface scattering responses. In each realization of the scattering response, the roughness parameter σ was fixed at 0.5 for simplicity, and the dielectric constant ε r , which can be significantly changed in different temporal conditions, varied in the range from 5 to 15.
A dihedral scatter type is required to predict SAR signals for vertical structures such as man-made objects or tree trunks. It can be modeled as a Fresnel reflection on two orthogonal surfaces A and B [21,24], such as
[ T D ] = α 2 α 0 α * 1 0 0 0 0
The scattering element α is given by
α = R h A R h B R v A R v B R h A R h B + R v A R v B
where R h i and R v i ( i { A ,   B } ) are the Fresnel reflection coefficients:
R h i = c o s θ i ε r i s i n 2 θ i c o s θ i + ε r i s i n 2 θ i R v i = ε r i c o s θ i ε r i s i n 2 θ i ε r i c o s θ i + ε r i s i n 2 θ i
Here, ε r A and ε r B are dielectric constants for the ground surface and vertical structure, respectively, θ A is the incidence angle, and θ B is defined by π / 2 θ A . The scattering response of a dihedral corner reflector in which the orientation is matched with the radar coordinate can be effectively explained by the double-reflection model. However, as the dihedral structures in built-up areas can be situated in various directions, the dihedral scattering model should account for the possible mismatch between the radar and scatterer’s coordinates.
The dihedral scattering model that allows for the rotated vertical structures can be written in the general form [48,49] as
[ T D ] = U T D U T
where
[ U ] = 1 0 0 0 cos 2 ψ sin 2 ψ 0 sin 2 ψ cos 2 ψ
where ψ is the angle mismatch between radar coordinates and the axis of symmetry. In the simulation of the dihedral scattering, the dielectric constant of the surface A, ε r A , was set to be the same as the soil dielectric constant, ε r . And, the dielectric constant of the surface B, ε r B , was selected as a parameter reflecting various dihedral structures. For the simulation of man-made objects, the ψ was set to vary in the range of 0 ° to 35 ° in each realization.
The volume scattering phenomena are one of the most difficult to model among various scattering mechanisms due to the complex geometric and dielectric conditions of various scatterers within volume layers. In this study, a simplified volumetric scattering model [50] was implemented. Assuming a distribution of particles with a predominant shape and permittivity, the scattering from the volume layer can be described as
[ T V ] = 1 g c δ 0 g c δ * 1 2 ( 1 + g ) | δ | 2 0 0 0 1 2 ( 1 g ) | δ | 2
The particle anisotropy δ ( | δ | [ 0,1 ] ) describes the shape of a particle independently of the particle distribution. Another two parameters g and g c were introduced to account for the particle distribution, which can be written as
g = I 2 κ I 0 κ g c = I 1 κ I 0 κ
where I n are the modified Bessel functions of the n th order. Here, the parameter κ represents the degree of concentration of the particle distribution, which is related to the degree of orientation randomness τ , such as
τ = I 0 ( κ ) e κ
Therefore, the two parameters δ and κ should be specified for volume scattering simulations. In this study, we assumed a volume layer composed of vertical dipoles, i.e., δ = 1 , while the orientation randomness τ was set to vary in the range of 0.2 to 1 in each realization.

References

  1. Rignot, E.J.; Van Zyl, J.J. Change detection techniques for ERS-1 SAR data. IEEE Trans. Geosci. Remote Sens. 1993, 31, 896–906. [Google Scholar] [CrossRef]
  2. Bazi, Y.; Bruzzone, L.; Melgani, F. An unsupervised approach based on the generalized Gaussian model to automatic change detection in multitemporal SAR images. IEEE Trans. Geosci. Remote Sens. 2005, 43, 874–887. [Google Scholar] [CrossRef]
  3. Gong, M.; Cao, Y.; Wu, Q. A neighborhood-based ratio approach for change detection in SAR images. IEEE Geosci. Remote Sens. Lett. 2012, 9, 307–311. [Google Scholar] [CrossRef]
  4. Ban, Y.; Yousif, O.A. Multitemporal spaceborne SAR data for urban change detection in China. IEEE J. Sel. Topics Appl. Earth Observ. Remote Sens. 2012, 5, 1087–1094. [Google Scholar] [CrossRef]
  5. Hou, B.; Wei, Q.; Zheng, Y.; Wang, S. Unsupervised change detection in SAR image based on Gauss-log ratio image fusion and compressed projection. IEEE J. Sel. Topics Appl. Earth Observ. Remote Sens. 2014, 7, 3297–3317. [Google Scholar] [CrossRef]
  6. Ing Lada, J.; Mercier, G. A new statistical similarity measure for change detection in multitemporal SAR images and its extension to multiscale change analysis. IEEE Trans. Geosci. Remote Sens. 2007, 45, 1432–1445. [Google Scholar] [CrossRef]
  7. Chatelain, F.; Tourneret, J.Y.; Inglada, J.; Ferrari, A. Bivariate gamma distributions for image registration and change detection. IEEE Trans. Image Process. 2007, 16, 1796–1806. [Google Scholar] [CrossRef]
  8. Mercier, G.; Moser, G.; Serpico, S.B. Conditional copulas for change detection in heterogeneous remote sensing images. IEEE Trans. Geosci. Remote Sens. 2008, 46, 1428–1441. [Google Scholar] [CrossRef]
  9. Brunner, D.; Lemoine, G.; Bruzzone, L. Earthquake damage assessment of buildings using VHR optical and SAR imagery. IEEE Trans. Geosci. Remote Sens. 2010, 48, 2403–2420. [Google Scholar] [CrossRef]
  10. Aiazzi, B.; Alparone, L.; Baronti, S.; Garzelli, A.; Zoppetti, C. Nonparametric change detection in multitemporal SAR images based on mean-shift clustering. IEEE Trans. Geosci. Remote Sens. 2013, 51, 2022–2031. [Google Scholar] [CrossRef]
  11. Moser, G.; Serpico, S.B. Unsupervised change detection from multichannel SAR data by Markovian data fusion. IEEE Trans. Geosci. Remote Sens. 2009, 47, 2114–2128. [Google Scholar] [CrossRef]
  12. Pantze, A.; Santoro, M.; Fransson, J.E. Change detection of boreal forest using bi-temporal ALOS PALSAR backscatter data. Remote Sens. Environ. 2014, 155, 120–128. [Google Scholar] [CrossRef]
  13. Nielsen, A.A.; Conradsen, K.; Skriver, H. Change detection in full and dual polarization, single-and multifrequency SAR data. IEEE J. Sel. Topics Appl. Earth Observ. Remote Sens. 2015, 8, 4041–4048. [Google Scholar] [CrossRef]
  14. Ferrentino, E.; Marino, A.; Nunziata, F.; Migliaccio, M. A dual–polarimetric approach to earthquake damage assessment. Int. J. Remote Sens. 2019, 40, 197–217. [Google Scholar] [CrossRef]
  15. Ferrentino, E.; Nunziata, F.; Bignami, C.; Graziani, L.; Maramai, A.; Migliaccio, M.; Stramondo, S. On the combination of dual-polarization Sentinel-1 ascending/descending orbiting passes to estimate damage due to the 2016 Central Italy earthquake. IEEE J. Sel. Topics Appl. Earth Observ. Remote Sens. 2022, 15, 9509–9518. [Google Scholar] [CrossRef]
  16. Nielsen, A.A.; Skriver, H.; Conradsen, K. The Loewner order and direction of detected change in Sentinel-1 and Radarsat-2 data. IEEE Geosci. Remote Sens. Lett. 2020, 17, 242–246. [Google Scholar] [CrossRef]
  17. Malmgren-Hansen, D.; Sohnesen, T.; Fisker, P.; Baez, J. Sentinel-1 change detection analysis for cyclone damage assessment in urban environments. Remote Sens. 2020, 12, 2409. [Google Scholar] [CrossRef]
  18. Pirrone, D.; Bovolo, F.; Bruzzone, L. A novel framework based on polarimetric change vectors for unsupervised multiclass change detection in dual-pol intensity SAR images. IEEE Trans. Geosci. Remote Sens. 2020, 58, 4780–4795. [Google Scholar] [CrossRef]
  19. Bruzzone, L.; Bovolo, F. A novel framework for the design of change-detection systems for very-high-resolution remote sensing images. Proc. IEEE 2013, 101, 609–630. [Google Scholar] [CrossRef]
  20. Braun, A.; Offermann, E. Polarimetric information content of Sentinel-1 for land cover mapping: An experimental case study using quad-pol data synthesized from complementary repeat-pass acquisitions. Front. Remote Sens. 2022, 3, 905713. [Google Scholar] [CrossRef]
  21. Cloude, S.R.; Pottier, E. A review of target decomposition theorems in radar polarimetry. IEEE Trans. Geosci. Remote Sens. 1996, 34, 498–518. [Google Scholar] [CrossRef]
  22. Velotto, D.; Bentes, C.; Tings, B.; Lehner, S. First comparison of Sentinel-1 and TerraSAR-X data in the framework of maritime targets detection: South Italy case. IEEE J. Ocean. Eng. 2016, 41, 993–1006. [Google Scholar] [CrossRef]
  23. Park, S.E.; Moon, W.M.; Pottier, E. Assessment of scattering mechanism of polarimetric SAR signal from mountainous forest areas. IEEE Trans. Geosci. Remote Sens. 2012, 50, 4711–4719. [Google Scholar] [CrossRef]
  24. Cloude, S. Polarisation: Applications in Remote Sensing; Oxford University Press: London, UK, 2009. [Google Scholar]
  25. Wolf, E. Coherence properties of partially polarized electromagnetic radiation. Nuovo Cim. 1959, 13, 1165–1181. [Google Scholar] [CrossRef]
  26. Raney, R.K. Hybrid-polarity SAR architecture. IEEE Trans. Geosci. Remote Sens. 2007, 45, 3397–3404. [Google Scholar] [CrossRef]
  27. Mandal, D.; Kumar, V.; Ratha, D.; Dey, S.; Bhattacharya, A.; Lopez-Sanchez, J.M.; McNairn, H.; Rao, Y.S. Dual polarimetric radar vegetation index for crop growth monitoring using Sentinel-1 SAR data. Remote Sens. Environ. 2020, 247, 111954. [Google Scholar] [CrossRef]
  28. Kim, Y.; Van Zyl, J. Comparison of forest parameter estimation techniques using SAR data. In Proceedings of the IEEE 2001 International Geoscience and Remote Sensing Symposium, Sydney, Australia, 9–13 July 2001. [Google Scholar]
  29. Chang, J.G.; Shoshany, M.; Oh, Y. Polarimetric radar vegetation index for biomass estimation in desert fringe ecosystems. IEEE Trans. Geosci. Remote Sens. 2018, 56, 7102–7108. [Google Scholar] [CrossRef]
  30. Huang, Y.; Meng, M.; Hou, Z.; Wu, L.; Guo, Z.; Shen, X.; Zheng, W.; Li, N. Land cover classification of SAR based on 1DCNN-MRF model using improved dual-polarization radar vegetation index. Remote Sens. 2023, 15, 3221. [Google Scholar] [CrossRef]
  31. Geman, S.; Geman, D. Stochastic relaxation, Gibbs distributions, and the Bayesian restoration of images. IEEE Trans. Pattern Anal. Machine Intell. 1984, PAMI-6, 721–741. [Google Scholar] [CrossRef]
  32. Bruzzone, L.; Prieto, D.F. Automatic analysis of the difference image for unsupervised change detection. IEEE Trans. Geosci. Remote Sens. 2000, 38, 1171–1182. [Google Scholar] [CrossRef]
  33. Chen, Y.; Cao, Z. An improved MRF-based change detection approach for multitemporal remote sensing imagery. Signal Process. 2013, 93, 163–175. [Google Scholar] [CrossRef]
  34. Yousif, O.; Ban, Y. Improving SAR-based urban change detection by combining MAP-MRF classifier and nonlocal means similarity weights. IEEE J. Sel. Topics Appl. Earth Observ. Remote Sens. 2014, 7, 4288–4300. [Google Scholar] [CrossRef]
  35. Solarna, D.; Moser, G.; Serpico, S.B. A Markovian approach to unsupervised change detection with multiresolution and multimodality SAR data. Remote Sens. 2018, 10, 1671. [Google Scholar] [CrossRef]
  36. Besag, J. On the statistical analysis of dirty pictures. J. Roy. Stat. Soc. Ser. B Methodol. 1986, 48, 259–302. [Google Scholar] [CrossRef]
  37. Moser, G.; Serpico, S.B. Generalized minimum-error thresholding for unsupervised change detection from SAR amplitude imagery. IEEE Trans. Geosci. Remote Sens. 2006, 44, 2972–2982. [Google Scholar] [CrossRef]
  38. Bloch, I. Information combination operators for data fusion: A comparative review with classification. IEEE Trans. Syst. Man Cybern. A Syst. Hum. 1996, 26, 52–67. [Google Scholar] [CrossRef]
  39. Park, S.E.; Yamaguchi, Y.; Kim, D.J. Polarimetric SAR remote sensing of the 2011 Tohoku earthquake using ALOS/PALSAR. Remote Sens. Environ. 2013, 132, 212–220. [Google Scholar] [CrossRef]
  40. Park, S.E.; Yamaguchi, Y.; Singh, G.; Yamaguchi, S.; Whitaker, A.C. Polarimetric SAR response of snow-covered area observed by multi-temporal ALOS PALSAR fully polarimetric mode. IEEE Trans. Geosci. Remote Sens. 2014, 52, 329–340. [Google Scholar] [CrossRef]
  41. Lee, J.S.; Pottier, E. Polarimetric Radar Imaging: From Basics to Applications; CRS Press: Boca Raton, FL, USA, 2017. [Google Scholar]
  42. Malila, W.A. Change Vector Analysis: An Approach for Detecting Forest Changes with Landsat. In Proceedings of the LARS Symposia, West Lafayette, IN, USA, 3–6 June 1980. [Google Scholar]
  43. Bovolo, F.; Bruzzone, L. A theoretical framework for unsupervised change detection based on change vector analysis in polar domain. IEEE Trans. Geosci. Remote Sens. 2007, 45, 218–236. [Google Scholar] [CrossRef]
  44. Lee, J.S.; Wen, J.H.; Ainsworth, T.L.; Chen, K.S.; Chen, A.J. Improved sigma filter for speckle filtering of SAR imagery. IEEE Trans. Geosci. Remote Sens. 2009, 47, 202–213. [Google Scholar]
  45. Goutte, C.; Gaussier, E. A probabilistic interpretation of precision, recall and F-score, with implication for evaluation. In Proceedings of the European Conference on Information Retrieval, Santiago de Compostela, Spain, 21–23 March 2005. [Google Scholar]
  46. Schuler, D.L.; Lee, J.S.; Kasilingam, D.; Nesti, G. Surface roughness and slope measurements using polarimetric SAR data. IEEE Trans. Geosci. Remote Sens. 2002, 40, 687–698. [Google Scholar] [CrossRef]
  47. Hajnsek, I.; Pottier, E.; Cloude, S.R. Inversion of surface parameters from polarimetric SAR. IEEE Trans. Geosci. Remote Sens. 2003, 41, 727–744. [Google Scholar] [CrossRef]
  48. Lee, J.S.; Schuler, D.L.; Ainsworth, T.L. Polarimetric SAR data compensation for terrain azimuth slope variation. IEEE Trans. Geosci. Remote Sens. 2000, 38, 2153–2163. [Google Scholar]
  49. Kimura, H. Radar polarization orientation shifts in built-up areas. IEEE Geosci. Remote Sens. Lett. 2008, 5, 217–221. [Google Scholar] [CrossRef]
  50. Neumann, M.; Ferro-Famil, L.; Reigber, A. Estimation of forest structure, ground, and canopy layer characteristics from multibaseline polarimetric interferometric SAR data. IEEE Trans. Geosci. Remote Sens. 2010, 48, 1086–1104. [Google Scholar] [CrossRef]
Figure 1. The workflow of proposed approaches for multiclass change detection using the bi-temporal dual-pol SAR data.
Remotesensing 16 02858 g001
Figure 2. Histogram of the change direction θ of selected dual-pol parameter pairs. (a) Dual-pol intensities ( R C 11 and R C 22 ), (b) overall intensity ( R s p a n ) and depolarization ( R R V I ), and (c) overall intensity ( R s p a n ) and coherence ( R ρ ) for the h-pol transmission case.
Remotesensing 16 02858 g002
Figure 3. Histogram of the change magnitude r of dual-pol parameter pairs. (a) Overall intensity ( R s p a n ) and depolarization ( R R V I ) and (b) overall intensity ( R s p a n ) and coherence ( R ρ ) for the h-pol transmission case.
Remotesensing 16 02858 g003
Figure 4. Illustration of the multiclass change classification.
Remotesensing 16 02858 g004
Figure 5. Dual-pol SAR images for experimental validation. Color composite of the h h - v h configuration (red: h h ; green: v h ; blue: h h / v h ), acquired on (a) 19 July 2013 and (b) 19 February 2016. Color composite of the h v - v v configuration (red: v v ; green: h v ; blue: v v / h v ), acquired on (c) 19 July 2013 and (d) 19 February 2016.
Remotesensing 16 02858 g005
Figure 6. Land cover classification results from (a) the Landsat 8 image on 30 July 2013 and (b) Sentinel-2 image on 15 February 2016. (c) The manually generated reference change map for the study area.
Remotesensing 16 02858 g006
Figure 7. Change detection results (back: changed; white: unchanged) for the h h - v h configuration obtained from the proposed method using four different combinations of dual-pol parameter sets: (a) S 1 = { C 11 , C 22 } ; (b) S 2 = { C 11 , C 22 , ρ } ; (c) S 3 = { C 11 , C 22 , R V I } ; and (d) S 4 = { C 11 , C 22 , ρ ,   R V I } . The change detection results derived from the (e) WL [16] and (f) PVA [18] methods. (g) The reference binary change map.
Remotesensing 16 02858 g007
Figure 8. Change detection results for the h v - v v configuration obtained from the proposed method using four different combinations of dual-pol parameter sets: (a) S 1 = { C 11 , C 22 } ; (b) S 2 = { C 11 , C 22 , ρ } ; (c) S 3 = { C 11 , C 22 , R V I } ; and (d) S 4 = { C 11 , C 22 , ρ , R V I } . The change detection results derived from the (e) WL and (f) PVA methods. (g) The reference binary change map.
Remotesensing 16 02858 g008
Figure 9. Multiclass change classification results for the h h - v h configuration derived from the (a) { s p a n , ρ } and (b) { s p a n , R V I } parameter pairs. The change classification results derived from the (c) WL and (d) PVA methods.
Remotesensing 16 02858 g009
Figure 10. Sankey diagrams between SAR change classes of the h h - v h configuration and the reference change map. SAR change classes were obtained by the (a) WL and (b) PVA methods in the previous study, and the proposed method with (c) { s p a n , ρ } and (d) { s p a n , R V I } parameter pairs.
Remotesensing 16 02858 g010
Figure 11. Multiclass change classification results for h v - v v configuration derived from the (a) { s p a n , ρ } and (b) { s p a n , R V I } parameter pairs. The change classification results derived from the (c) WL and (d) PVA methods.
Remotesensing 16 02858 g011
Figure 12. Sankey diagrams between SAR change classes of the h v - v v configuration and the reference change map. SAR change classes obtained by the (a) WL and (b) PVA methods in the previous study and the proposed method with (c) { s p a n , ρ } and (d) { s p a n , R V I } parameter pairs.
Remotesensing 16 02858 g012
Figure 13. (a) The composition of the SAR change classes for the reference land cover changes related to the increase in scattering intensity; (b) the correlation coefficient between each land cover change composed of SAR-based change classes. (c) The composition of the SAR change classes for the reference land cover changes related to the decrease in scattering intensity; (d) the correlation coefficient between each land cover change composed of SAR-based change classes.
Remotesensing 16 02858 g013
Figure 14. (a) The composition of the semantic change classes for the SAR change classes; (b) the correlation coefficient between each SAR-based change classes composed of semantic change classes.
Remotesensing 16 02858 g014
Figure 15. Two-dimensional histograms of the ratio between the changes of the polarimetric parameter derived from the quad-pol SAR ( R q u a d ) and that from each dual-pol data in the (a) h h - v h configuration ( R h h v h ) and (b) h v - v v configuration ( R h v v v ). The blue dashed lines represent the case where the dual-pol and quad-pol parameters are identical.
Remotesensing 16 02858 g015
Table 1. Scattering contributions of ground surface, double-bounce, and vegetation scattering models for the simulation of scattering responses from four land cover types.
Bare
Surface (BS)
Sparse
Volume (SV)
Dense
Volume (DV)
Dihedral
Structure (DS)
P S (dB)min−19−21−21−23
max−17−19−19−21
P D (dB)min−36−19−26−4
max−34−17−24−2
P V (dB)min−36−16−11−26
max−34−14−9−24
Table 2. Lists of the possible change types between the four land cover types.
Change Type Pre   ( t 1 ) Class Post   ( t 2 ) Class
1Bare Surface (BS)Sparse Volume (SV)
2Bare Surface (BS)Dense Volume (DV)
3Bare Surface (BS)Dihedral Structure (DS)
4Sparse Volume (SV)Dense Volume (DV)
5Sparse Volume (SV)Dihedral Structure (DS)
6Dense Volume (DV)Dihedral Structure (DS)
7Sparse Volume (SV)Bare Surface (BS)
8Dense Volume (DV)Bare Surface (BS)
9Dihedral Structure (DS)Bare Surface (BS)
10Dense Volume (DV)Sparse Volume (SV)
11Dihedral Structure (DS)Sparse Volume (SV)
12Dihedral Structure (DS)Dense Volume (DV)
Table 3. Summary of change detection accuracies of different approaches obtained for the h h - v h configuration.
OAF1PrDRFA
WL0.59840.18080.56620.10760.0577
PVA0.70130.58140.68790.50340.1600
Proposed ( S 1 )0.77280.70200.76340.64980.1411
Proposed ( S 2 )0.81130.77030.77240.76830.1586
Proposed ( S 3 )0.77470.71070.75450.67160.1531
Proposed ( S 4 )0.80910.77130.76160.78120.1713
Table 4. Summary of change detection accuracies of different approaches obtained for the h v - v v configuration.
OAF1PrDRFA
WL0.59240.09970.55440.05480.0308
PVA0.67220.51280.66130.41870.1502
Proposed ( S 1 )0.74580.64950.75180.57170.1323
Proposed ( S 2 )0.76990.70570.74600.66950.1598
Proposed ( S 3 )0.73880.69130.67350.71010.2412
Proposed ( S 4 )0.74780.71270.67160.75920.2602
Table 5. Comparison of SAR change classes derived from the h h - v h configuration with reference land cover changes.
VISTBCVDBR
ω I 124,76420,12493455,824142
ω I I 50021,80371331
ω I I I 031185134
ω I V 258620652,1681095
ω V 9122421258
Overall Accuracy: 71.0%
Table 6. Comparison of SAR change classes derived from the h v - v v configuration with reference land cover changes.
VISTBCVDBR
ω I 99,81540,03342547,268277
ω I I 2556156569325
ω I I I 570170979
ω I V 32160446,1521208
ω V 8001099863
Overall Accuracy: 60.8%
Disclaimer/Publisher’s Note: The statements, opinions and data contained in all publications are solely those of the individual author(s) and contributor(s) and not of MDPI and/or the editor(s). MDPI and/or the editor(s) disclaim responsibility for any injury to people or property resulting from any ideas, methods, instructions or products referred to in the content.

