
Enhancing Remote Sensing Object Detection with K-CBST YOLO: Integrating CBAM and Swin-Transformer


Abstract
1. Introduction
- (1)
- This study proposes a module that integrates the CBAM mechanism with the Swin-Transformer to serve as a backbone for feature extraction. In this module, the Swin-Transformer performs global modeling of the feature map to obtain comprehensive background information, and the CBAM further extracts the features of key areas, thereby enhancing the model’s focus on critical regions. The combined use of both mechanisms effectively enhances the accuracy with which small targets are detected against complex backgrounds.
- (2)
- This study proposes a detection network based on the K-Means algorithm. During the detection stage, an adaptive method for adjusting the K value is designed to enhance the model’s generalization ability, thus enabling effective handling of images with uneven distributions. The enhanced K-Means algorithm identifies target distribution areas within images, thereby enhancing the accuracy with which multi-target remote sensing images with uneven distributions are detected.
- (3)
- This study proposes a smooth Non-Maximum Suppression algorithm. The core principle of this algorithm is to smoothly suppress the confidence scores of overlapping candidate boxes, thereby retaining more potentially useful information. This approach enhances the detection accuracy and recall rate of dense or overlapping targets, thus reducing the risk of missed detections due to excessive suppression.
2. Related Works
3. Materials and Methods
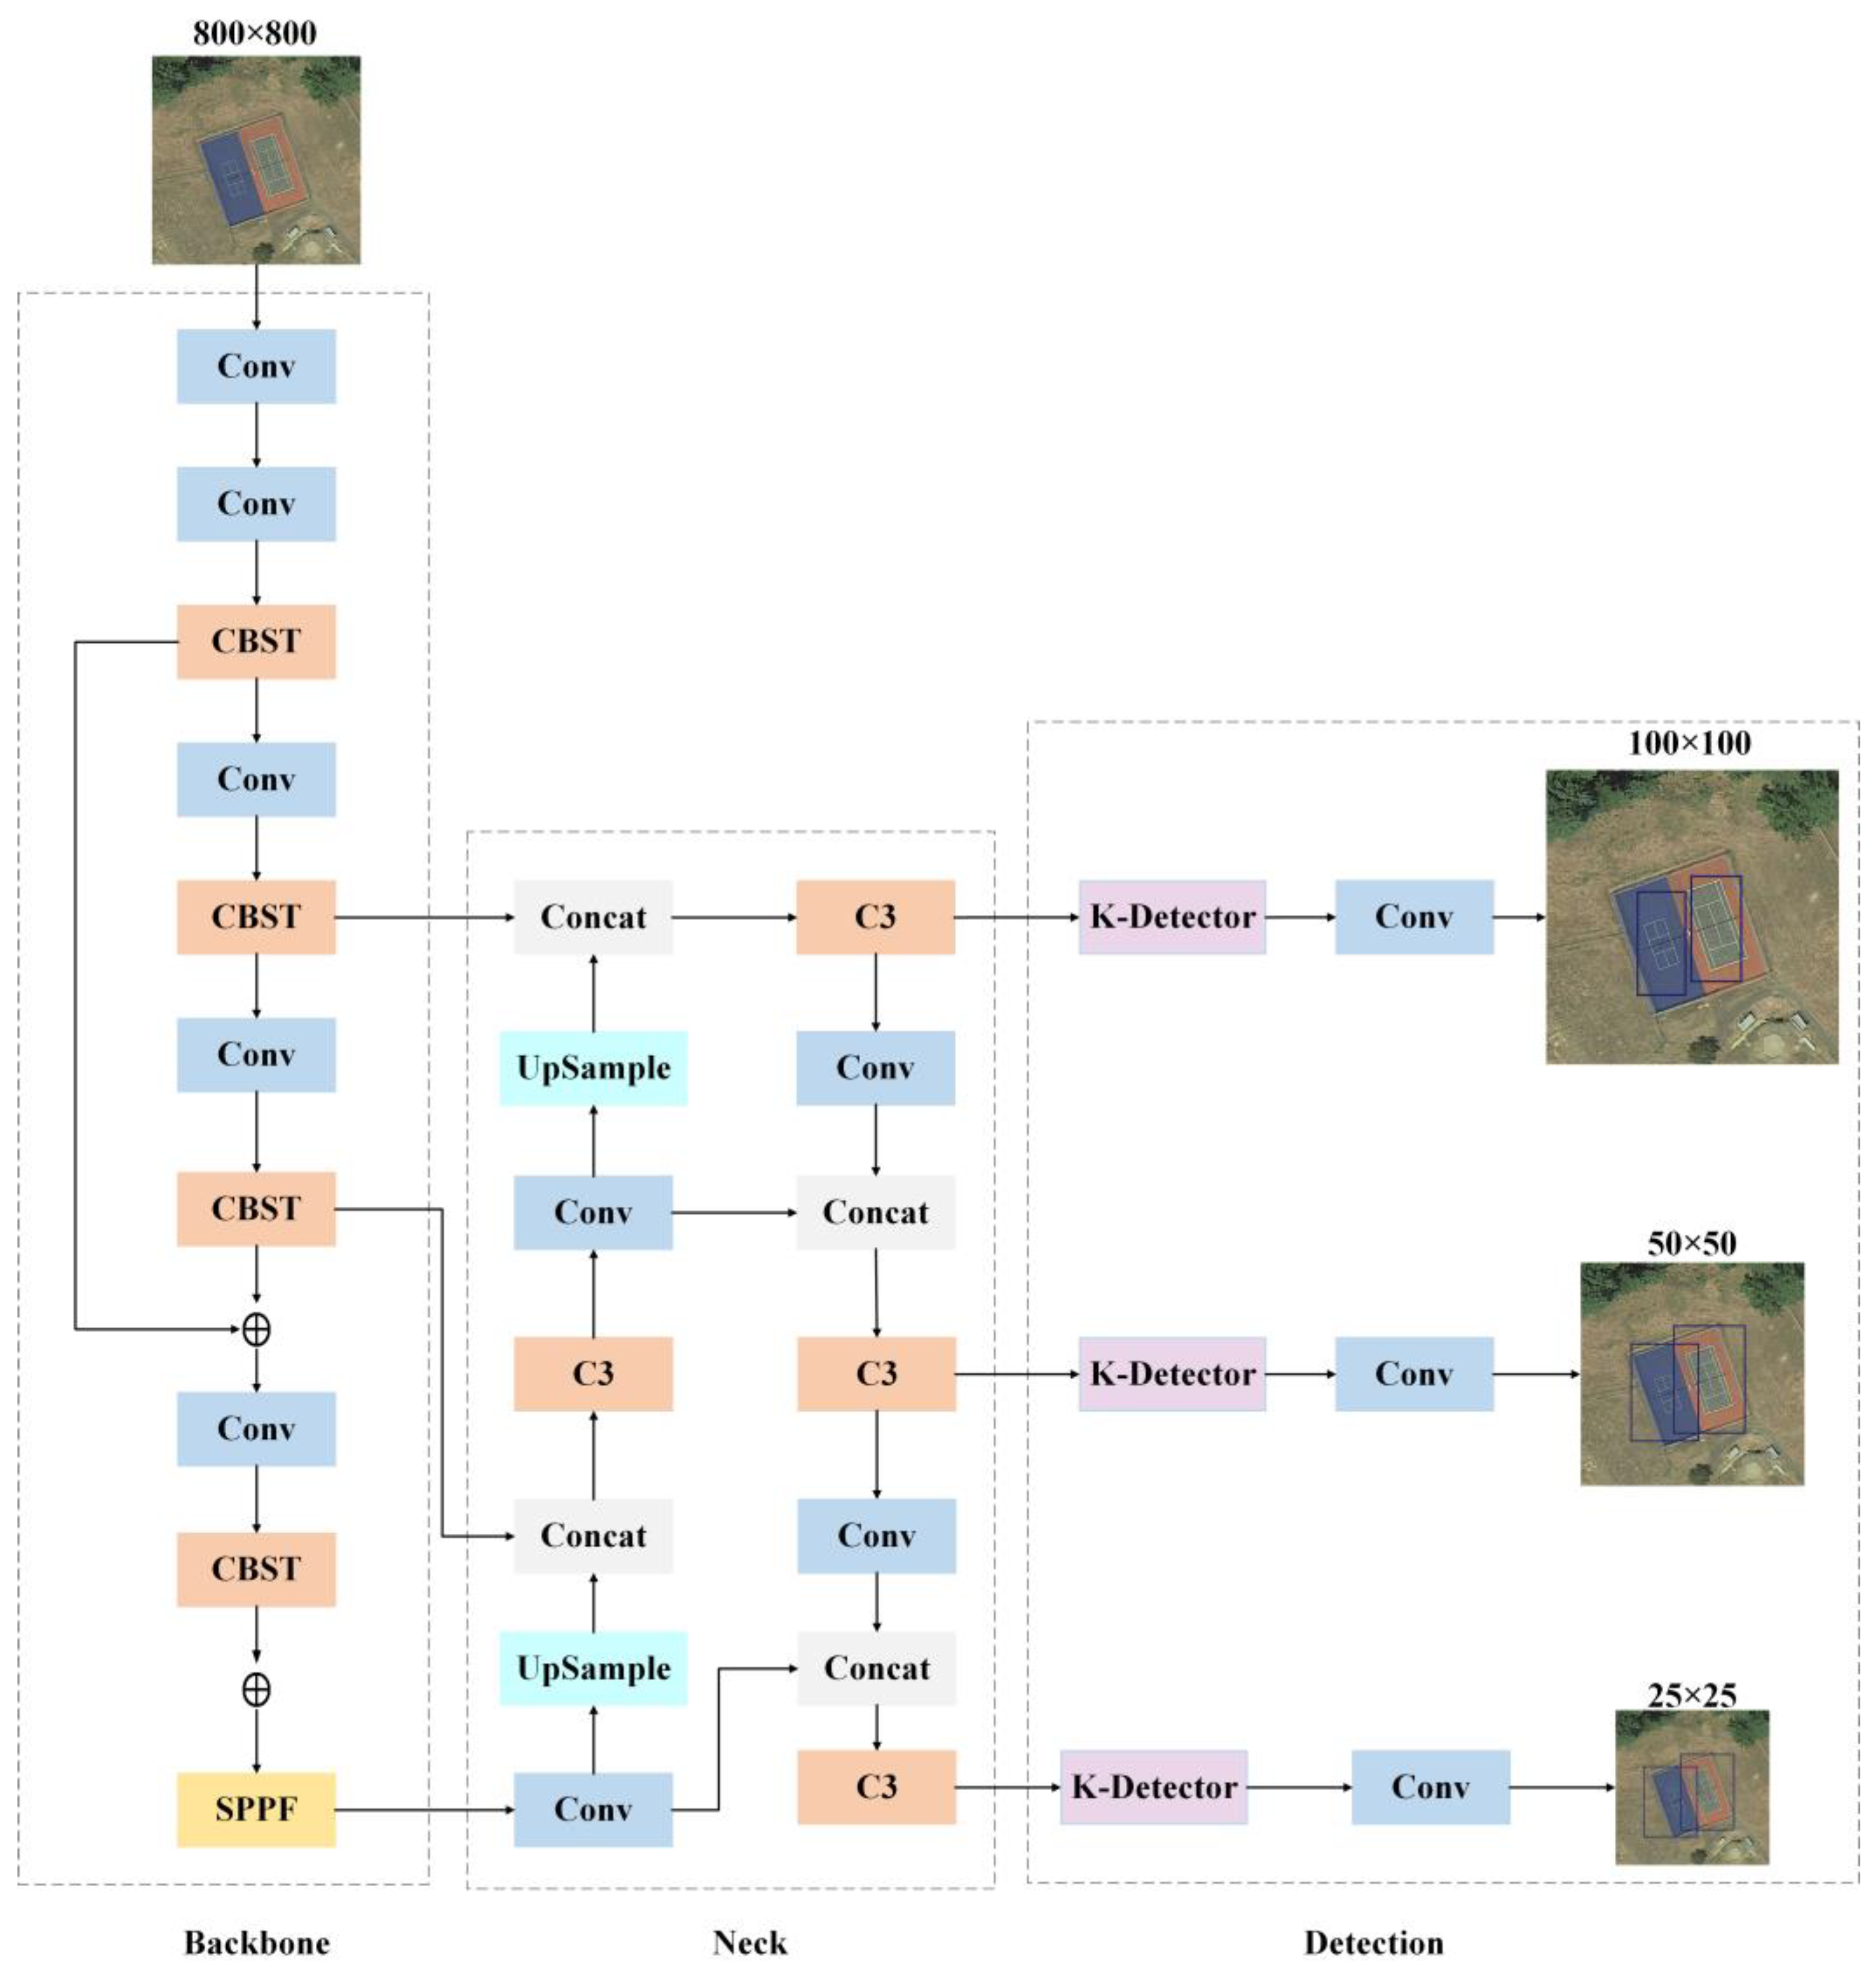
3.1. Overall Framework
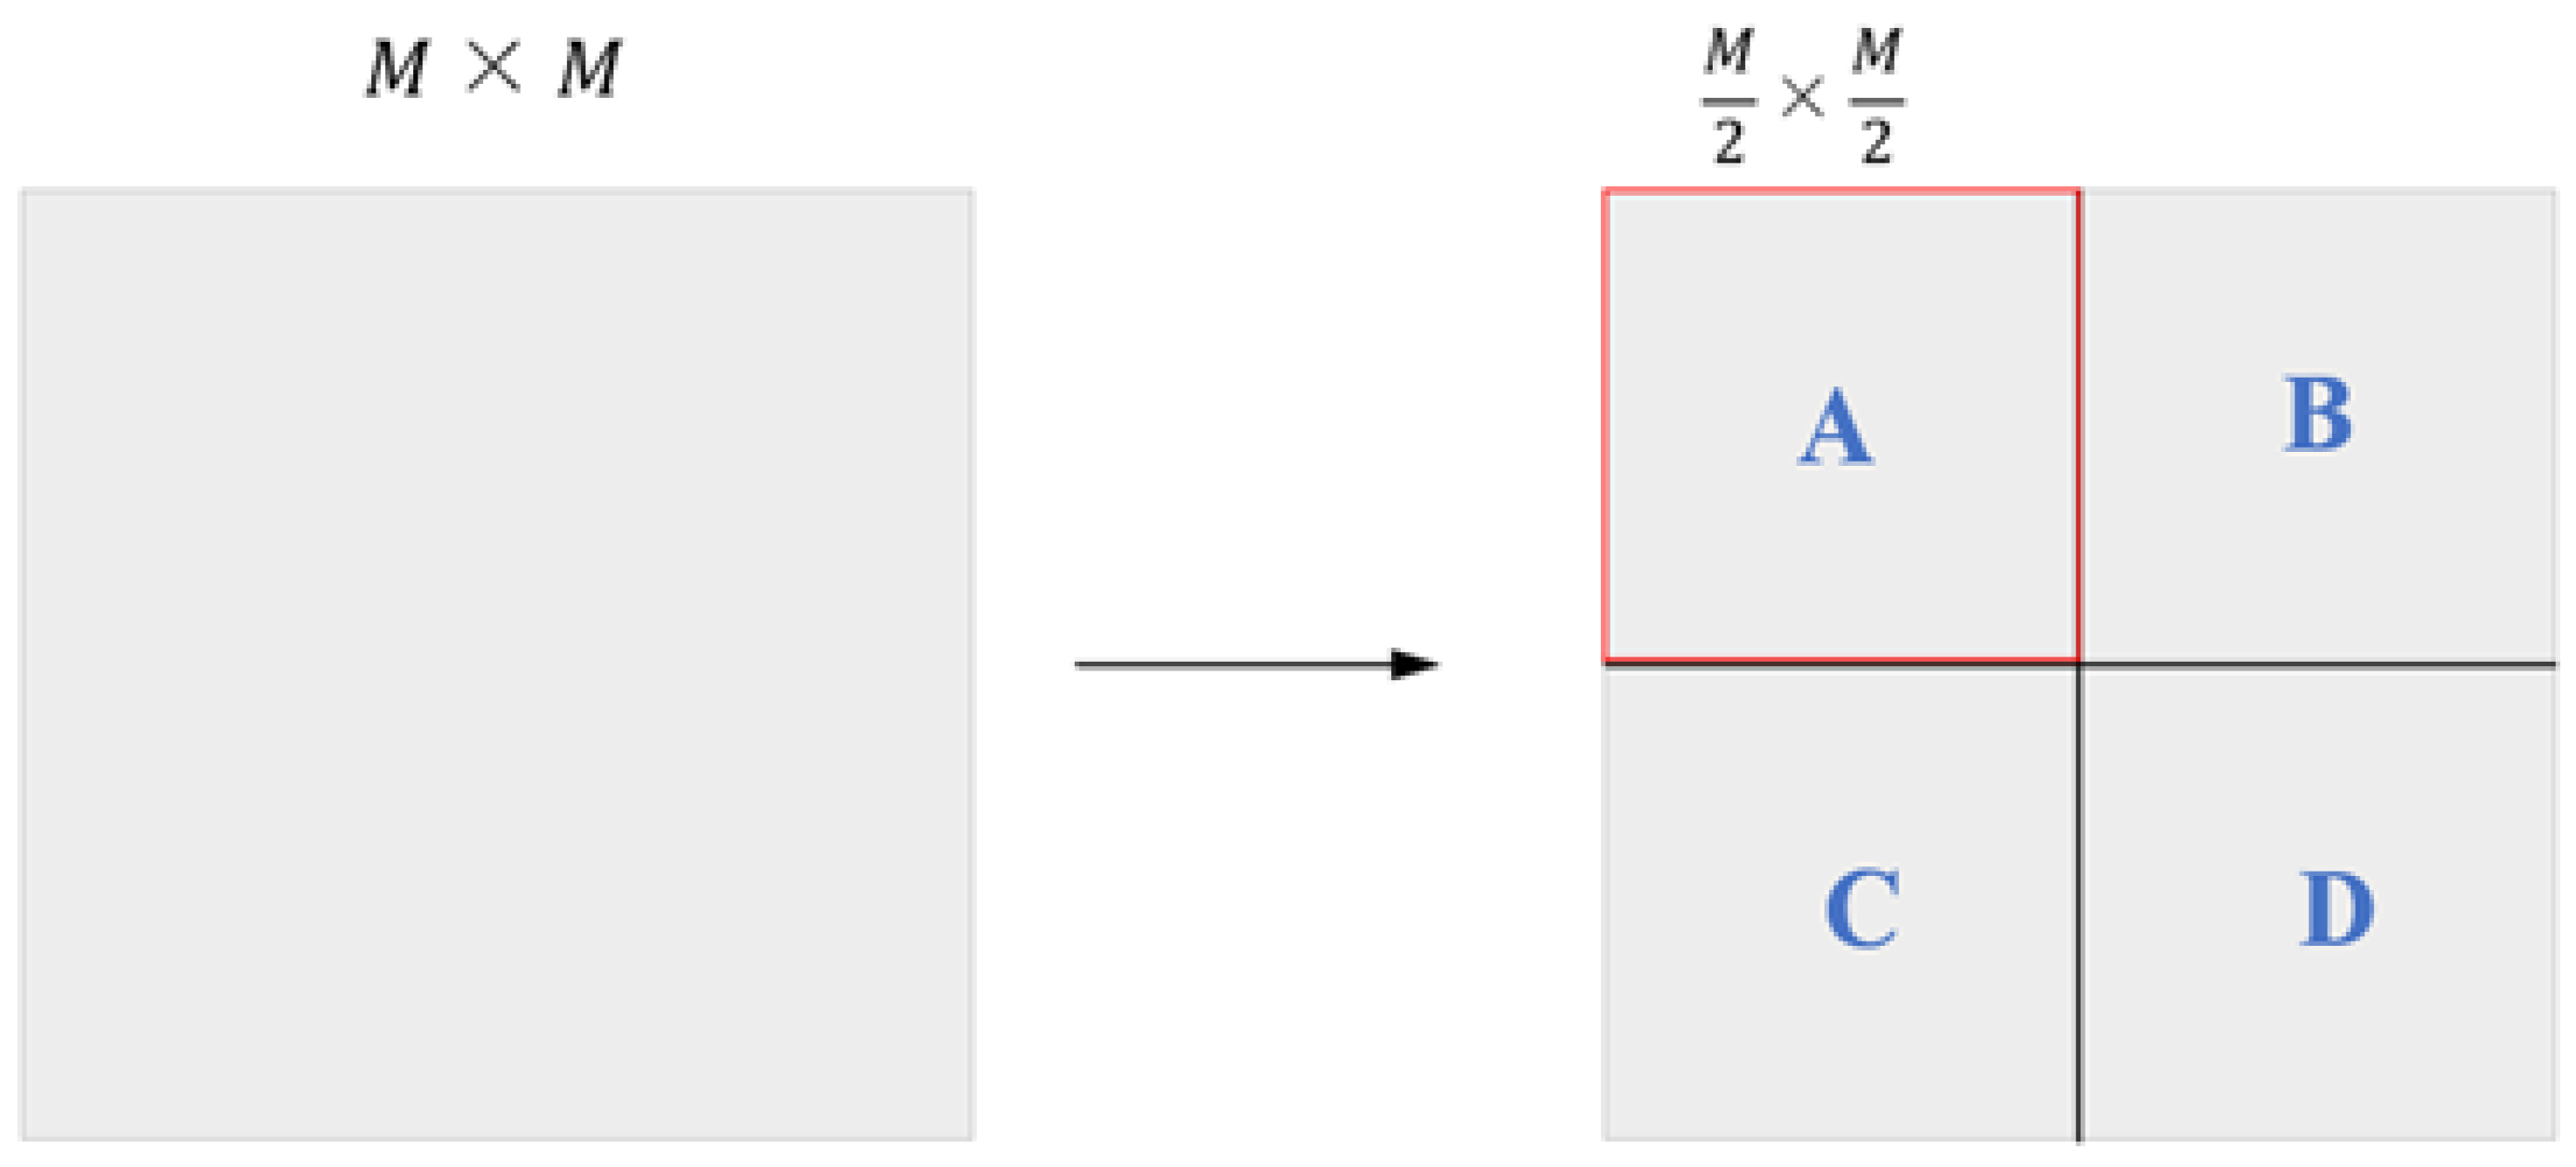
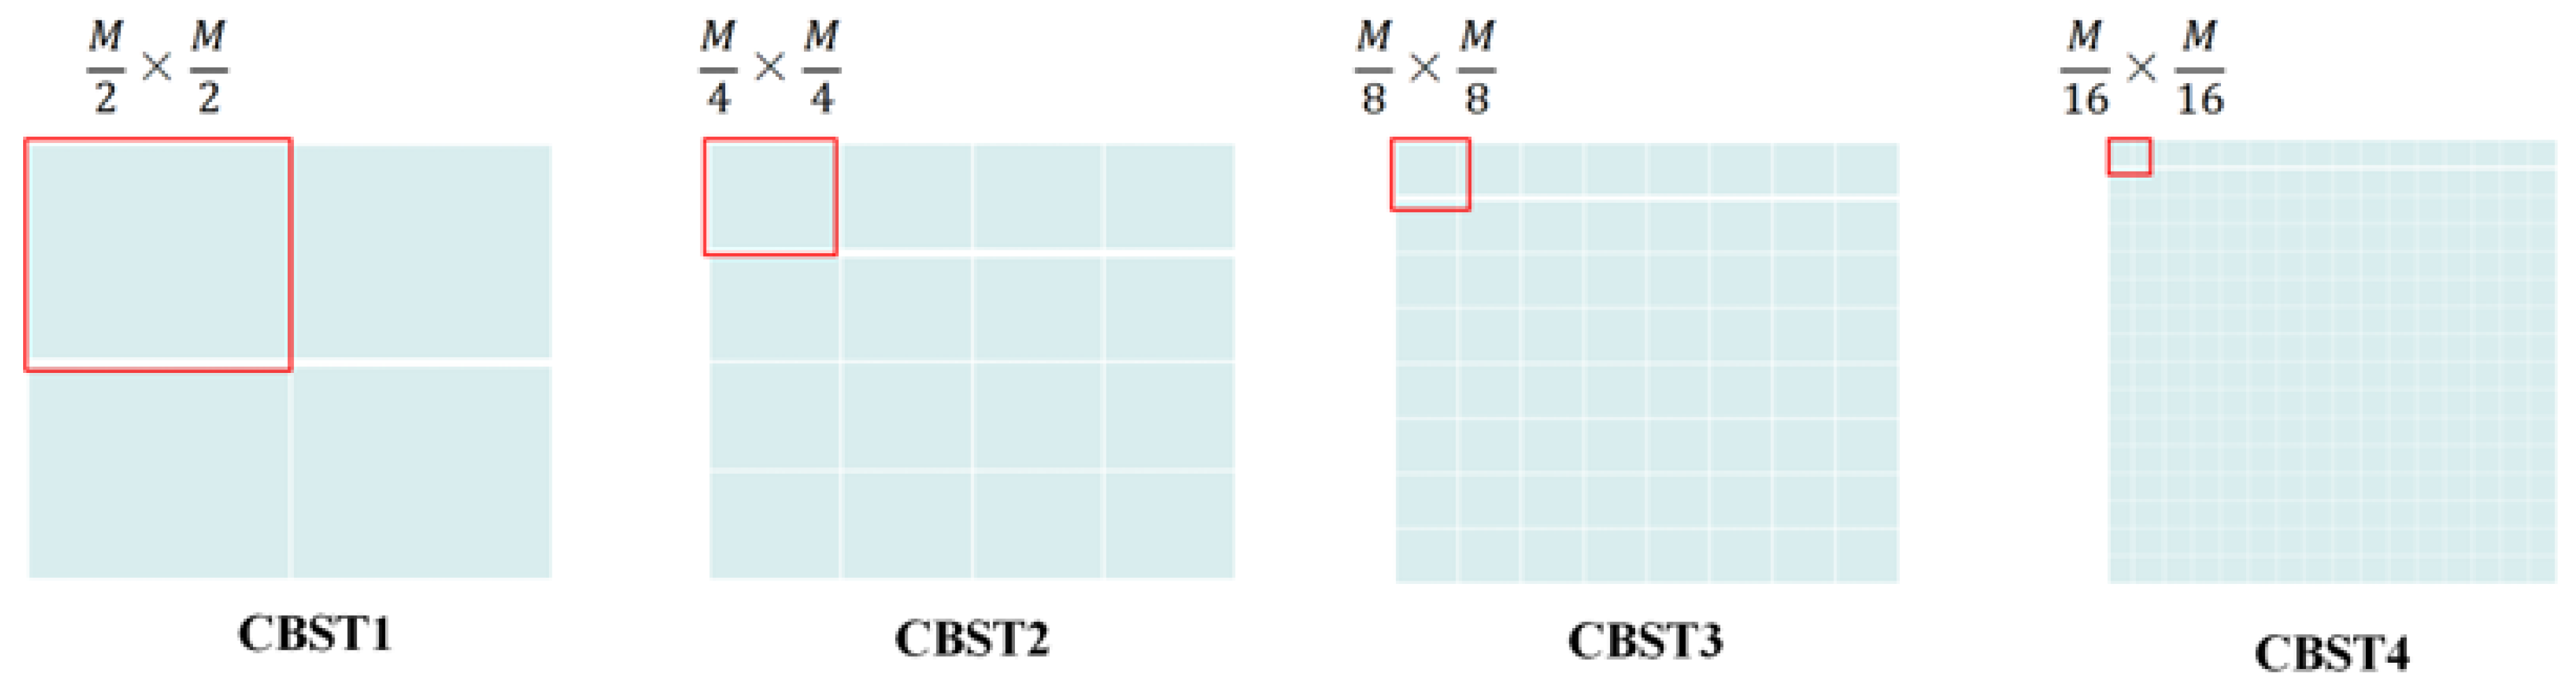
3.2. CBST Module
3.3. K-Detector
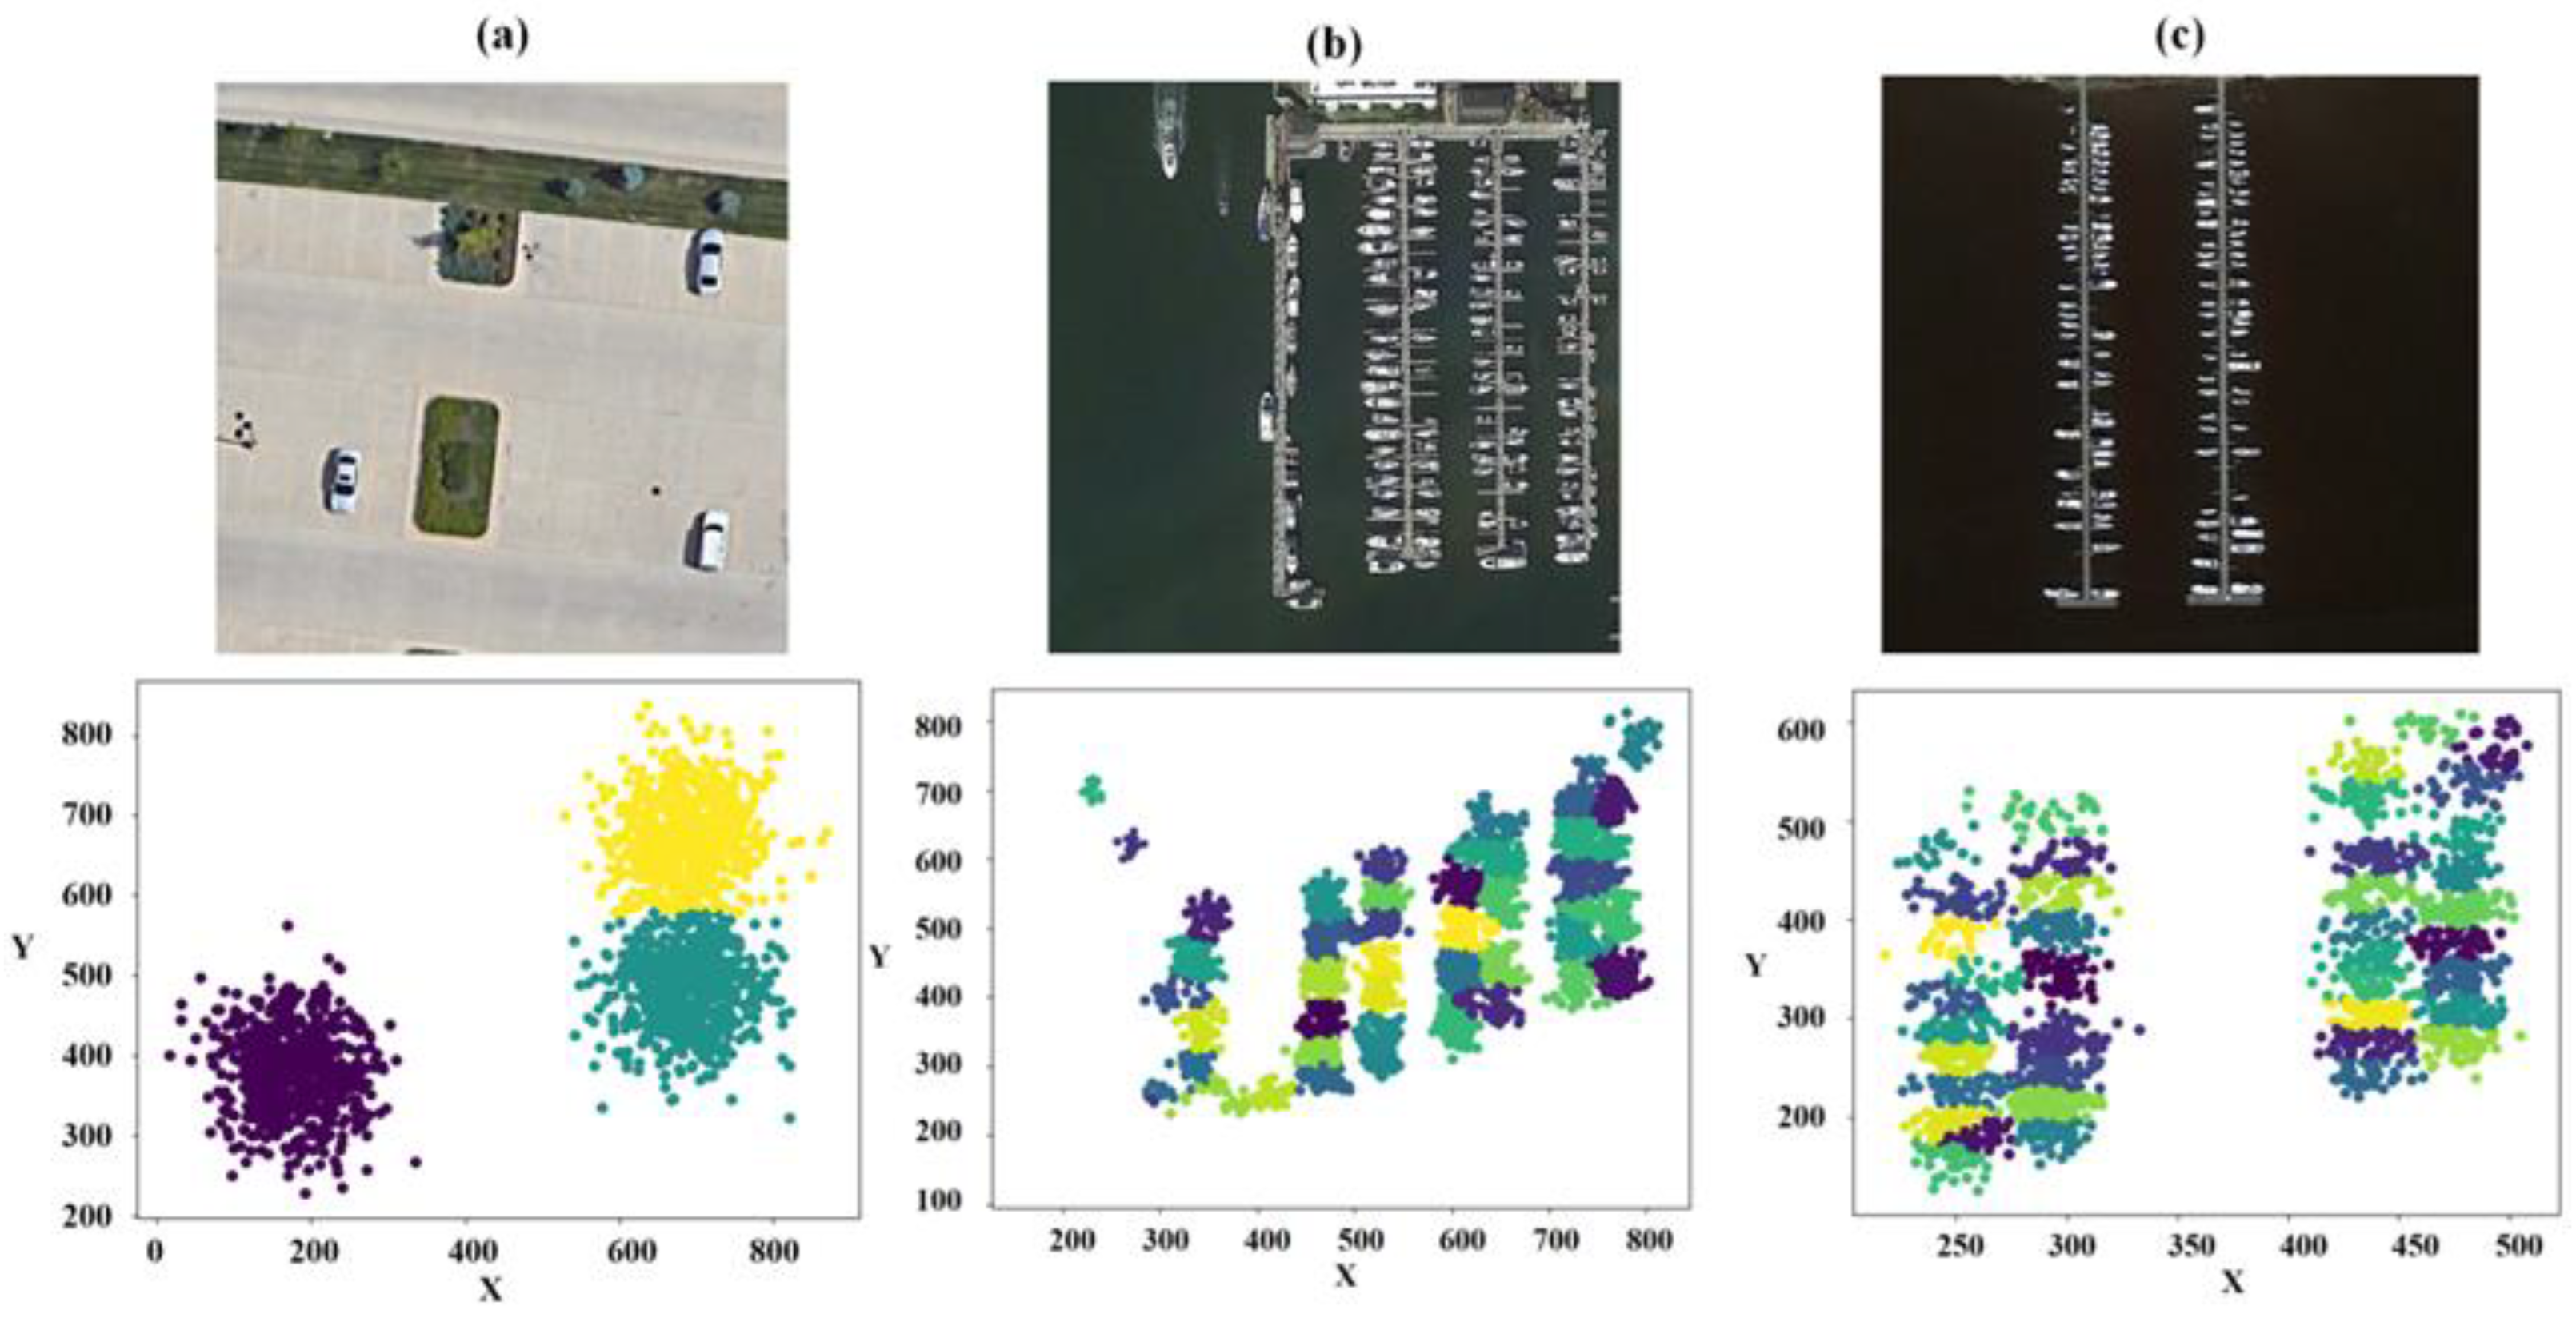
3.3.1. Adaptive Dynamic K-Means Clustering Algorithm
- (1)
- K data points are randomly selected as initial cluster centers.
- (2)
- Each data point in the dataset is assigned to the cluster whose center is closest to it.
- (3)
- The mean of all data points within each cluster is calculated, and the cluster center’s position is updated accordingly.
- (4)
- Steps 2 and 3 are repeated until the cluster centers no longer change significantly or until the predetermined number of iterations is reached.
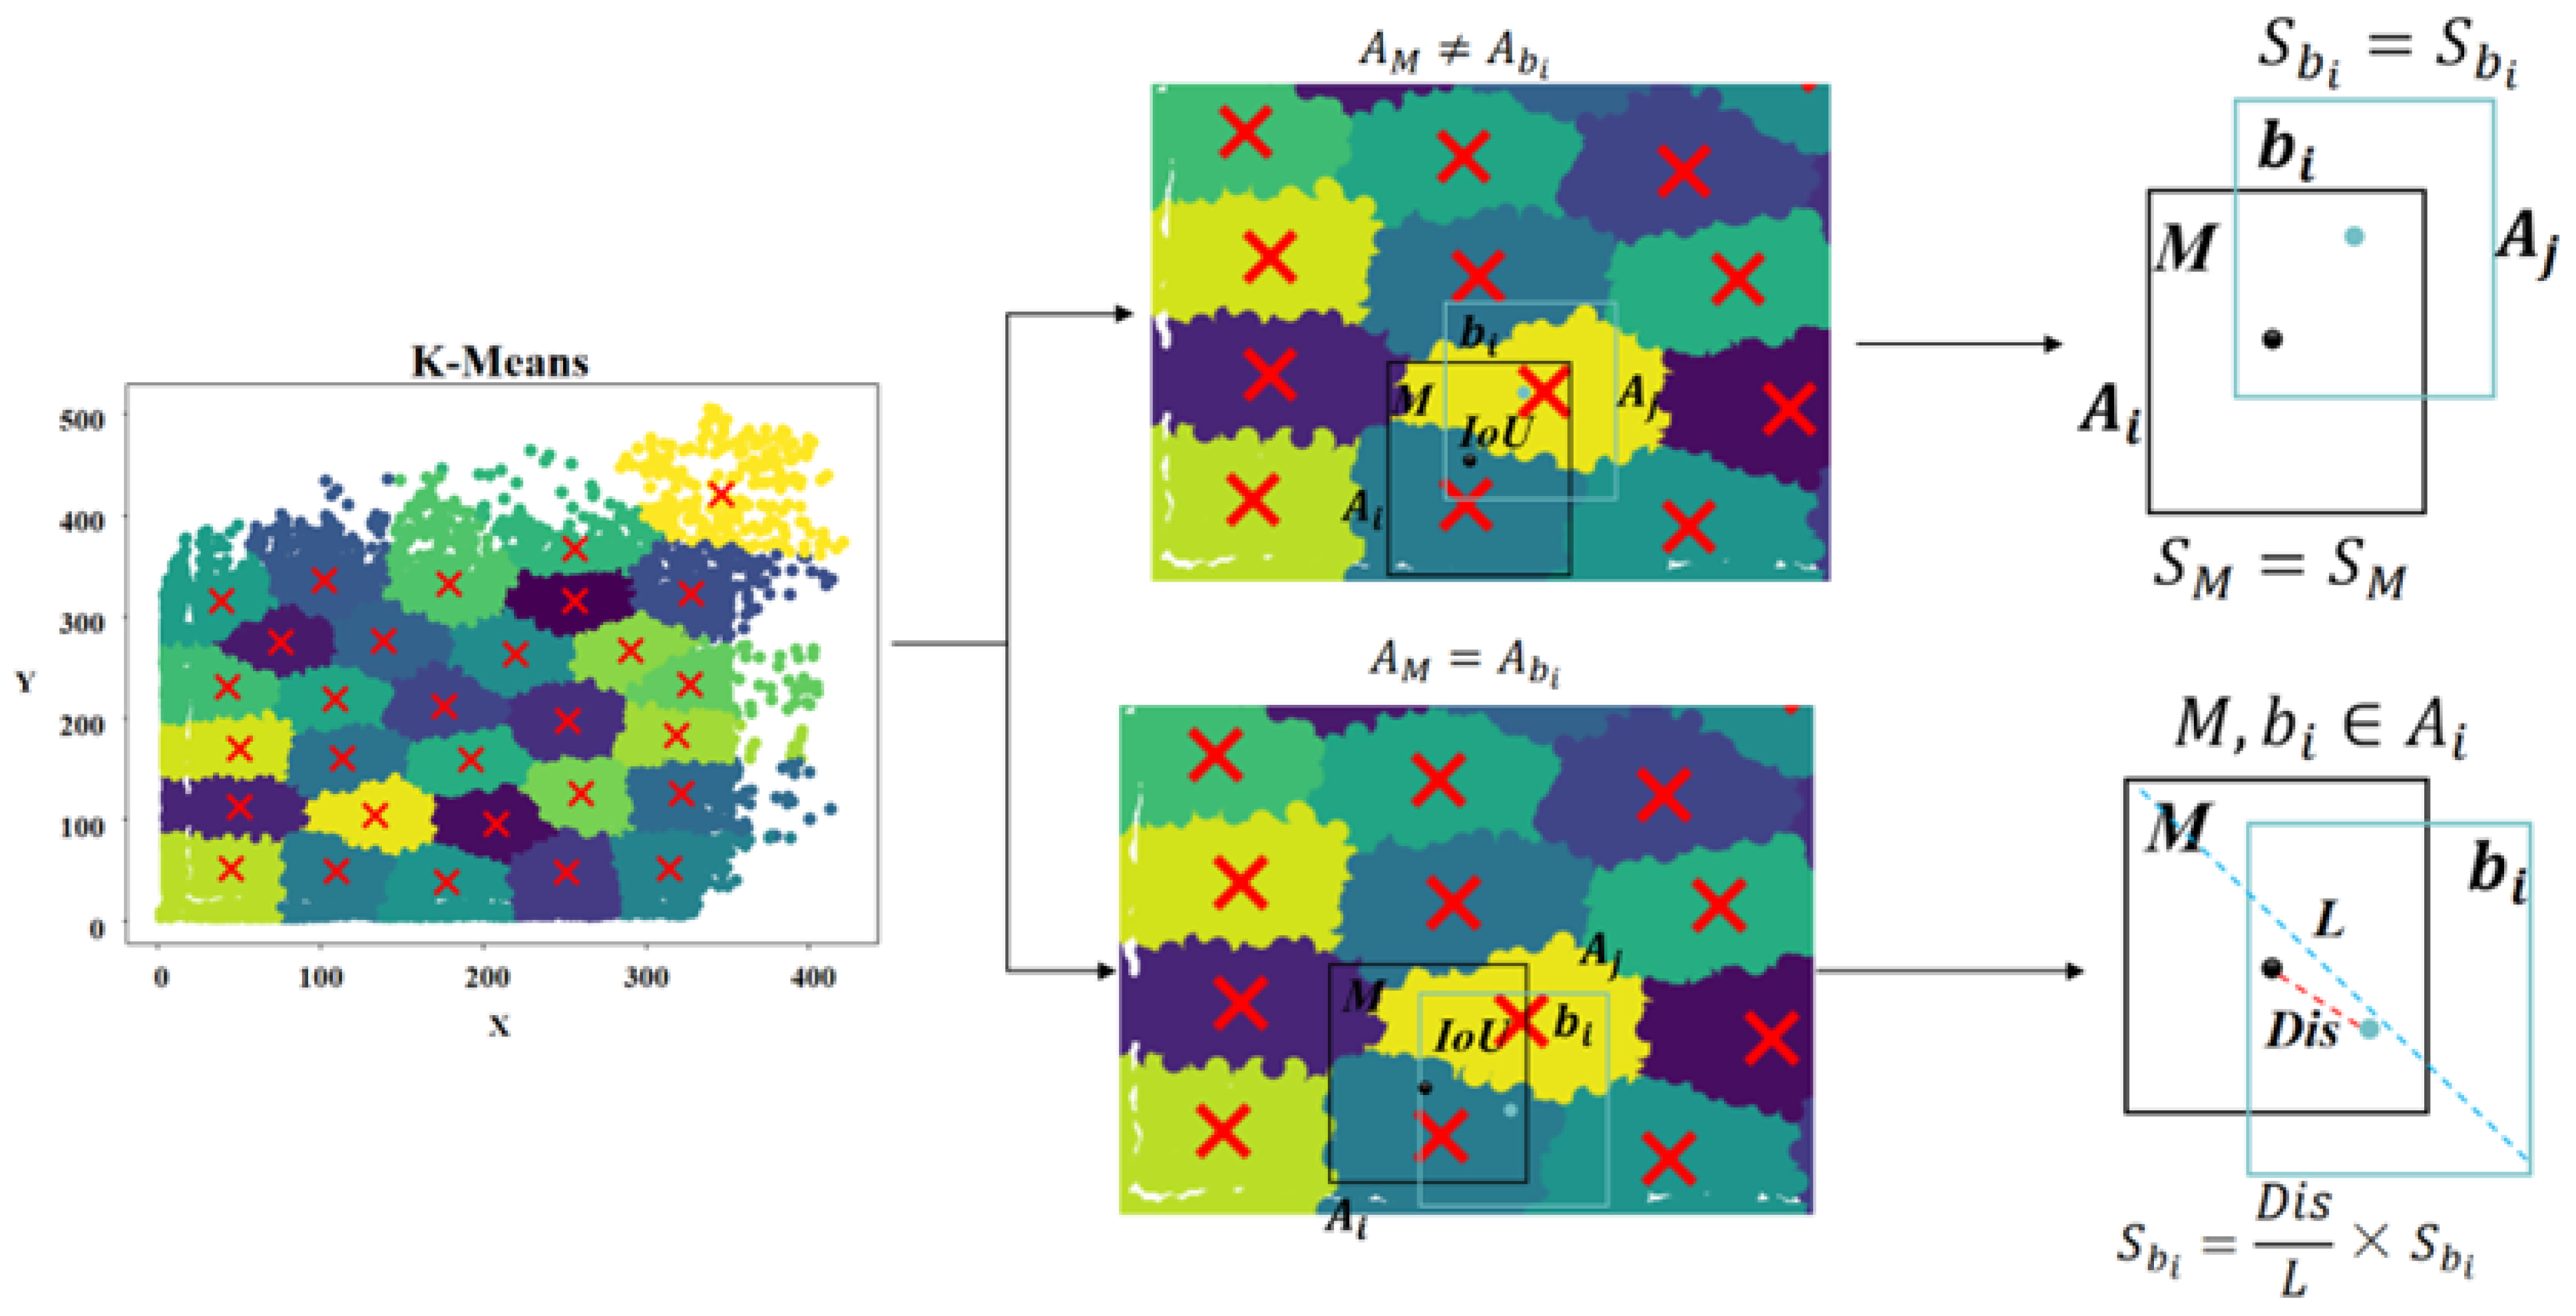
3.3.2. Smooth Non-Maximum Suppression Algorithm
- (1)
- If the center points of candidate boxes M and belong to different clusters, i.e., , M and are candidate boxes generated through the prediction of different targets. Therefore, the overlapping candidate box is retained, meaning its confidence value remains unchanged, as illustrated in the following Formula (11).
- (2)
- If the center points of candidate boxes M and belong to the same cluster, i.e., , candidate boxes M and may be prediction results for the same target, requiring the confidence score of the overlapping candidate box to be re-adjusted. However, when assessing targets that are too densely distributed or visually highly overlapping, the clustering results from adaptive dynamic K-Means alone cannot directly determine whether M and are predictions of the same target. Therefore, this paper employs a smooth Non-Maximum Suppression algorithm to reduce the confidence score of candidate box . This algorithm calculates the ratio of the Euclidean distance between the center points of candidate boxes M and to the diagonal length of their minimum enclosing bounding box. This ratio is then used as the weight coefficient for to suppress its confidence score and thereby reduce its interference with the detection results. The core principle of this algorithm is the gradual reduction in the importance of overlapping candidate boxes during detection, which allows the brute-force deletion approach of the traditional NMS algorithm to be circumvented. This approach allows more potentially valid candidate boxes to be retained during the detection stage. The specific calculation process is as follows:
4. Experimental Evaluations
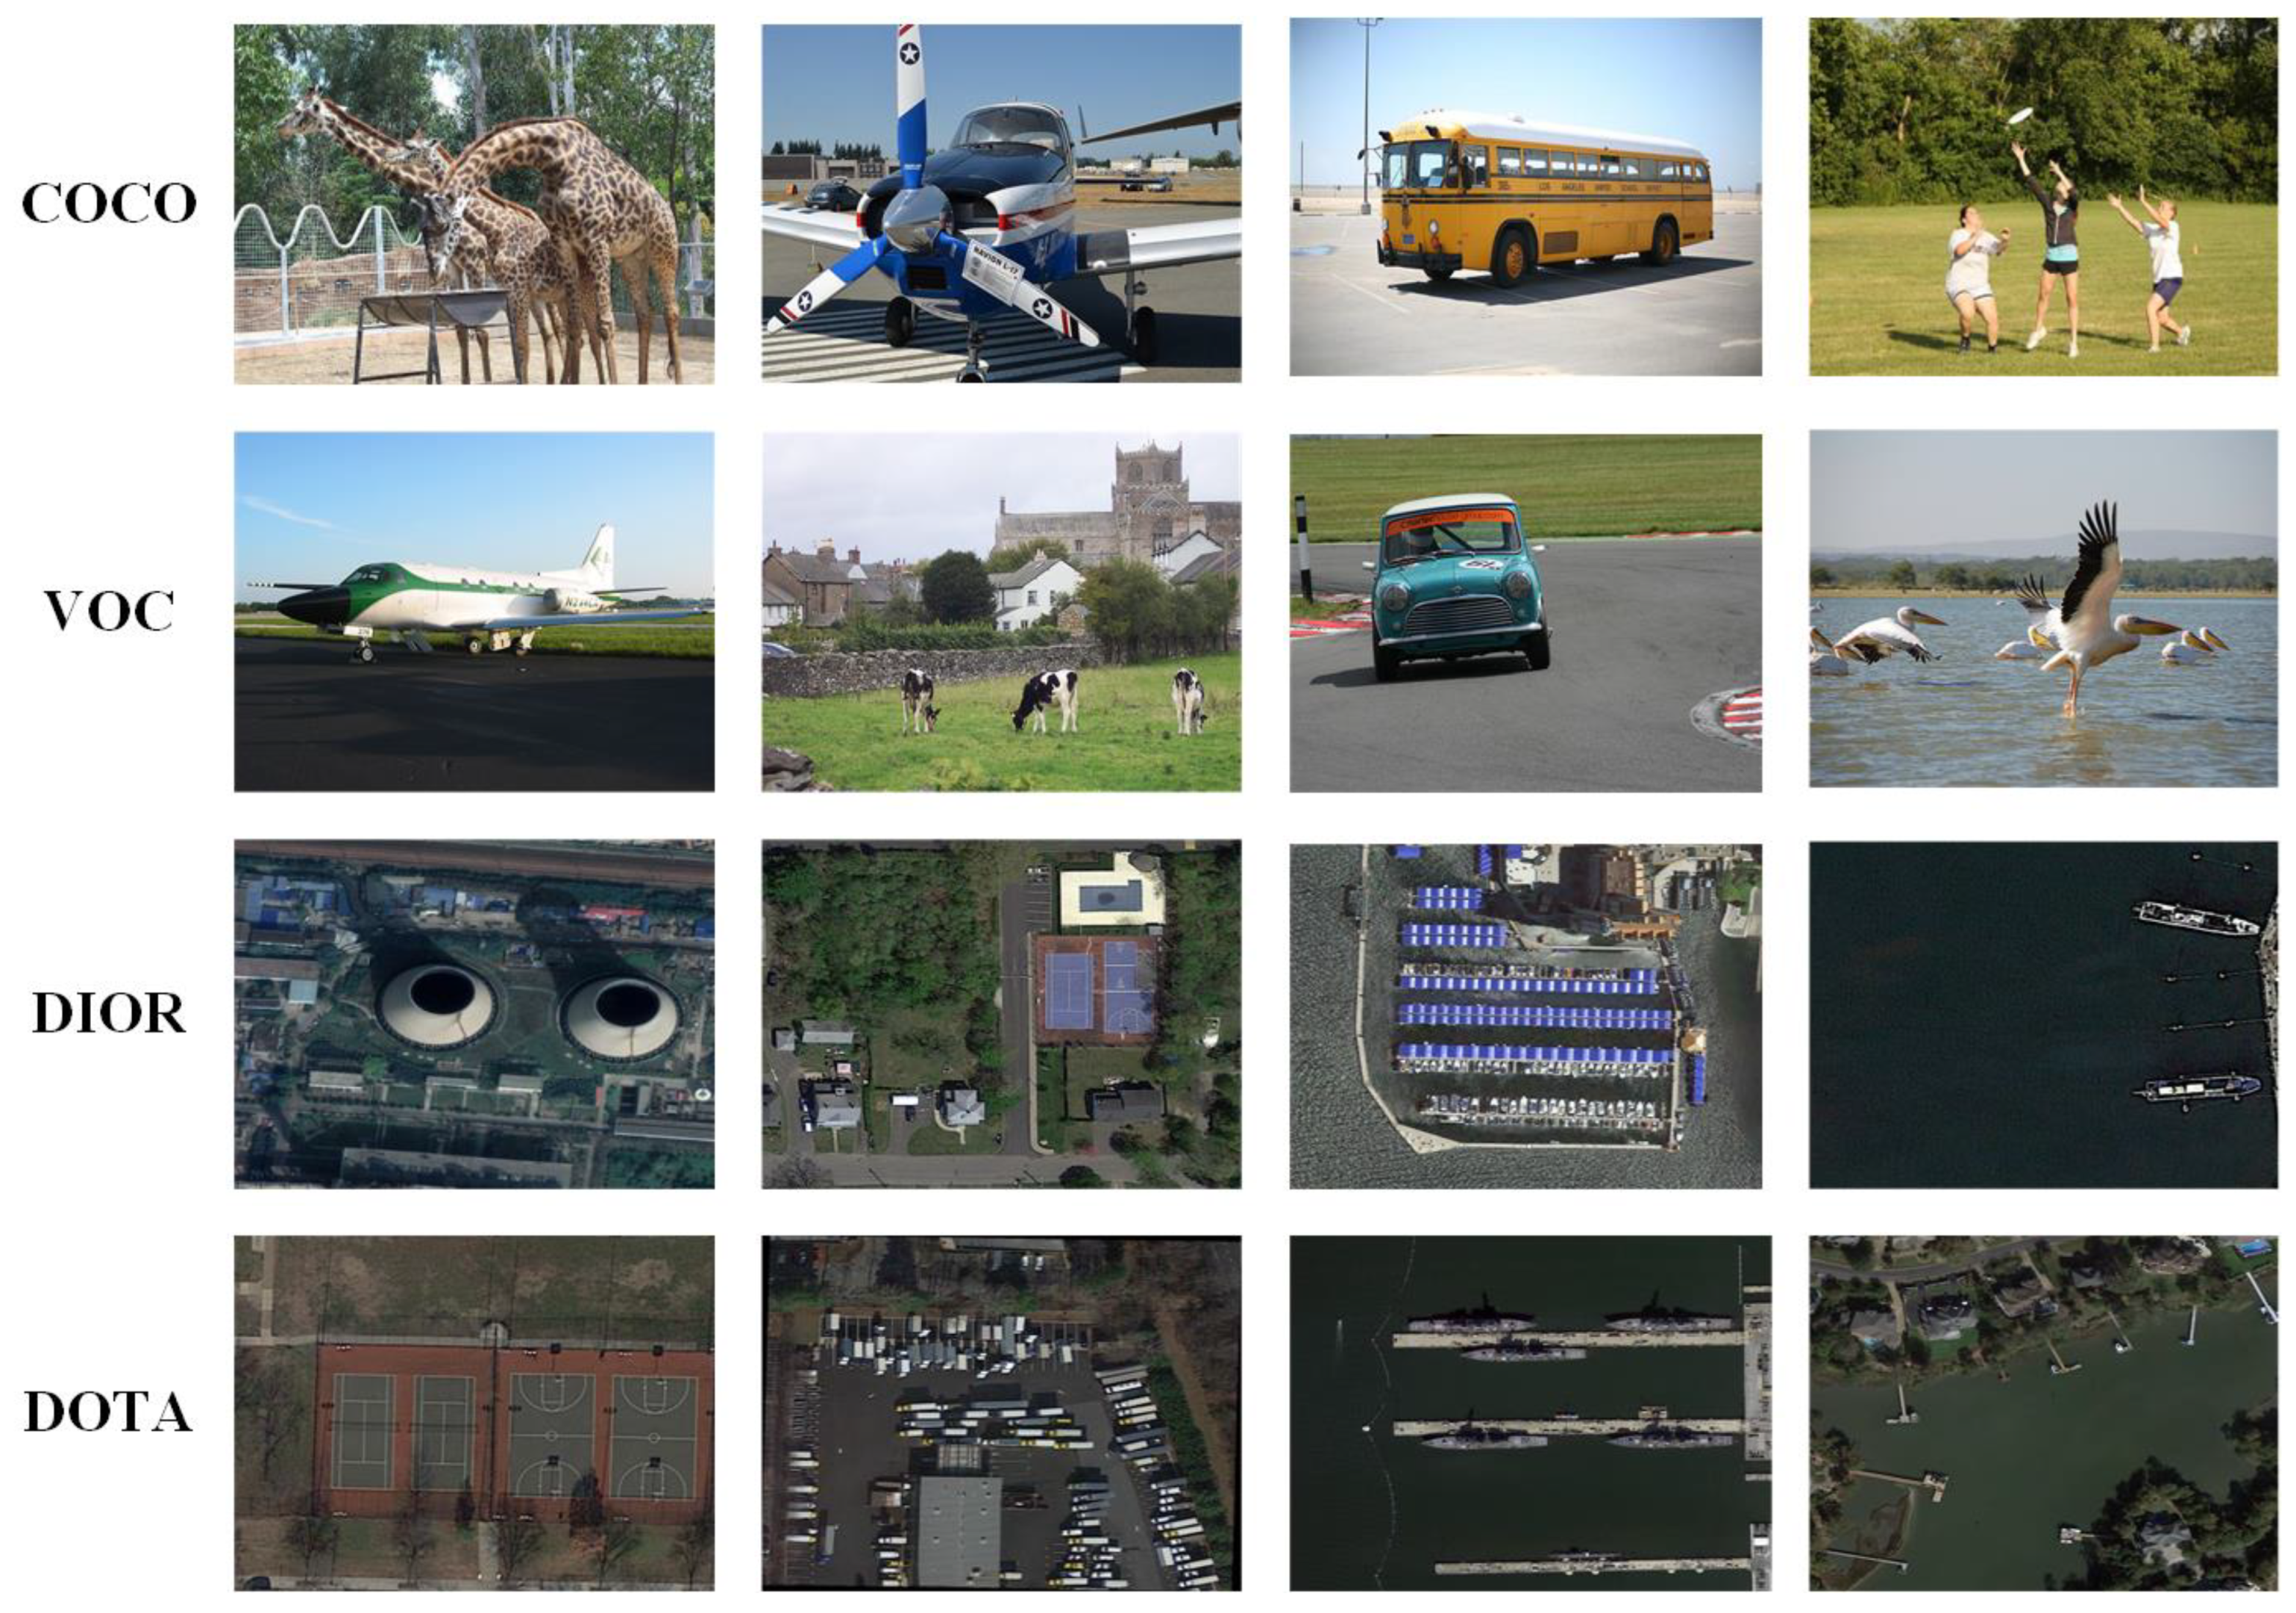
4.1. Experimental Dataset
4.2. Experimental Details and Evaluation Indicators
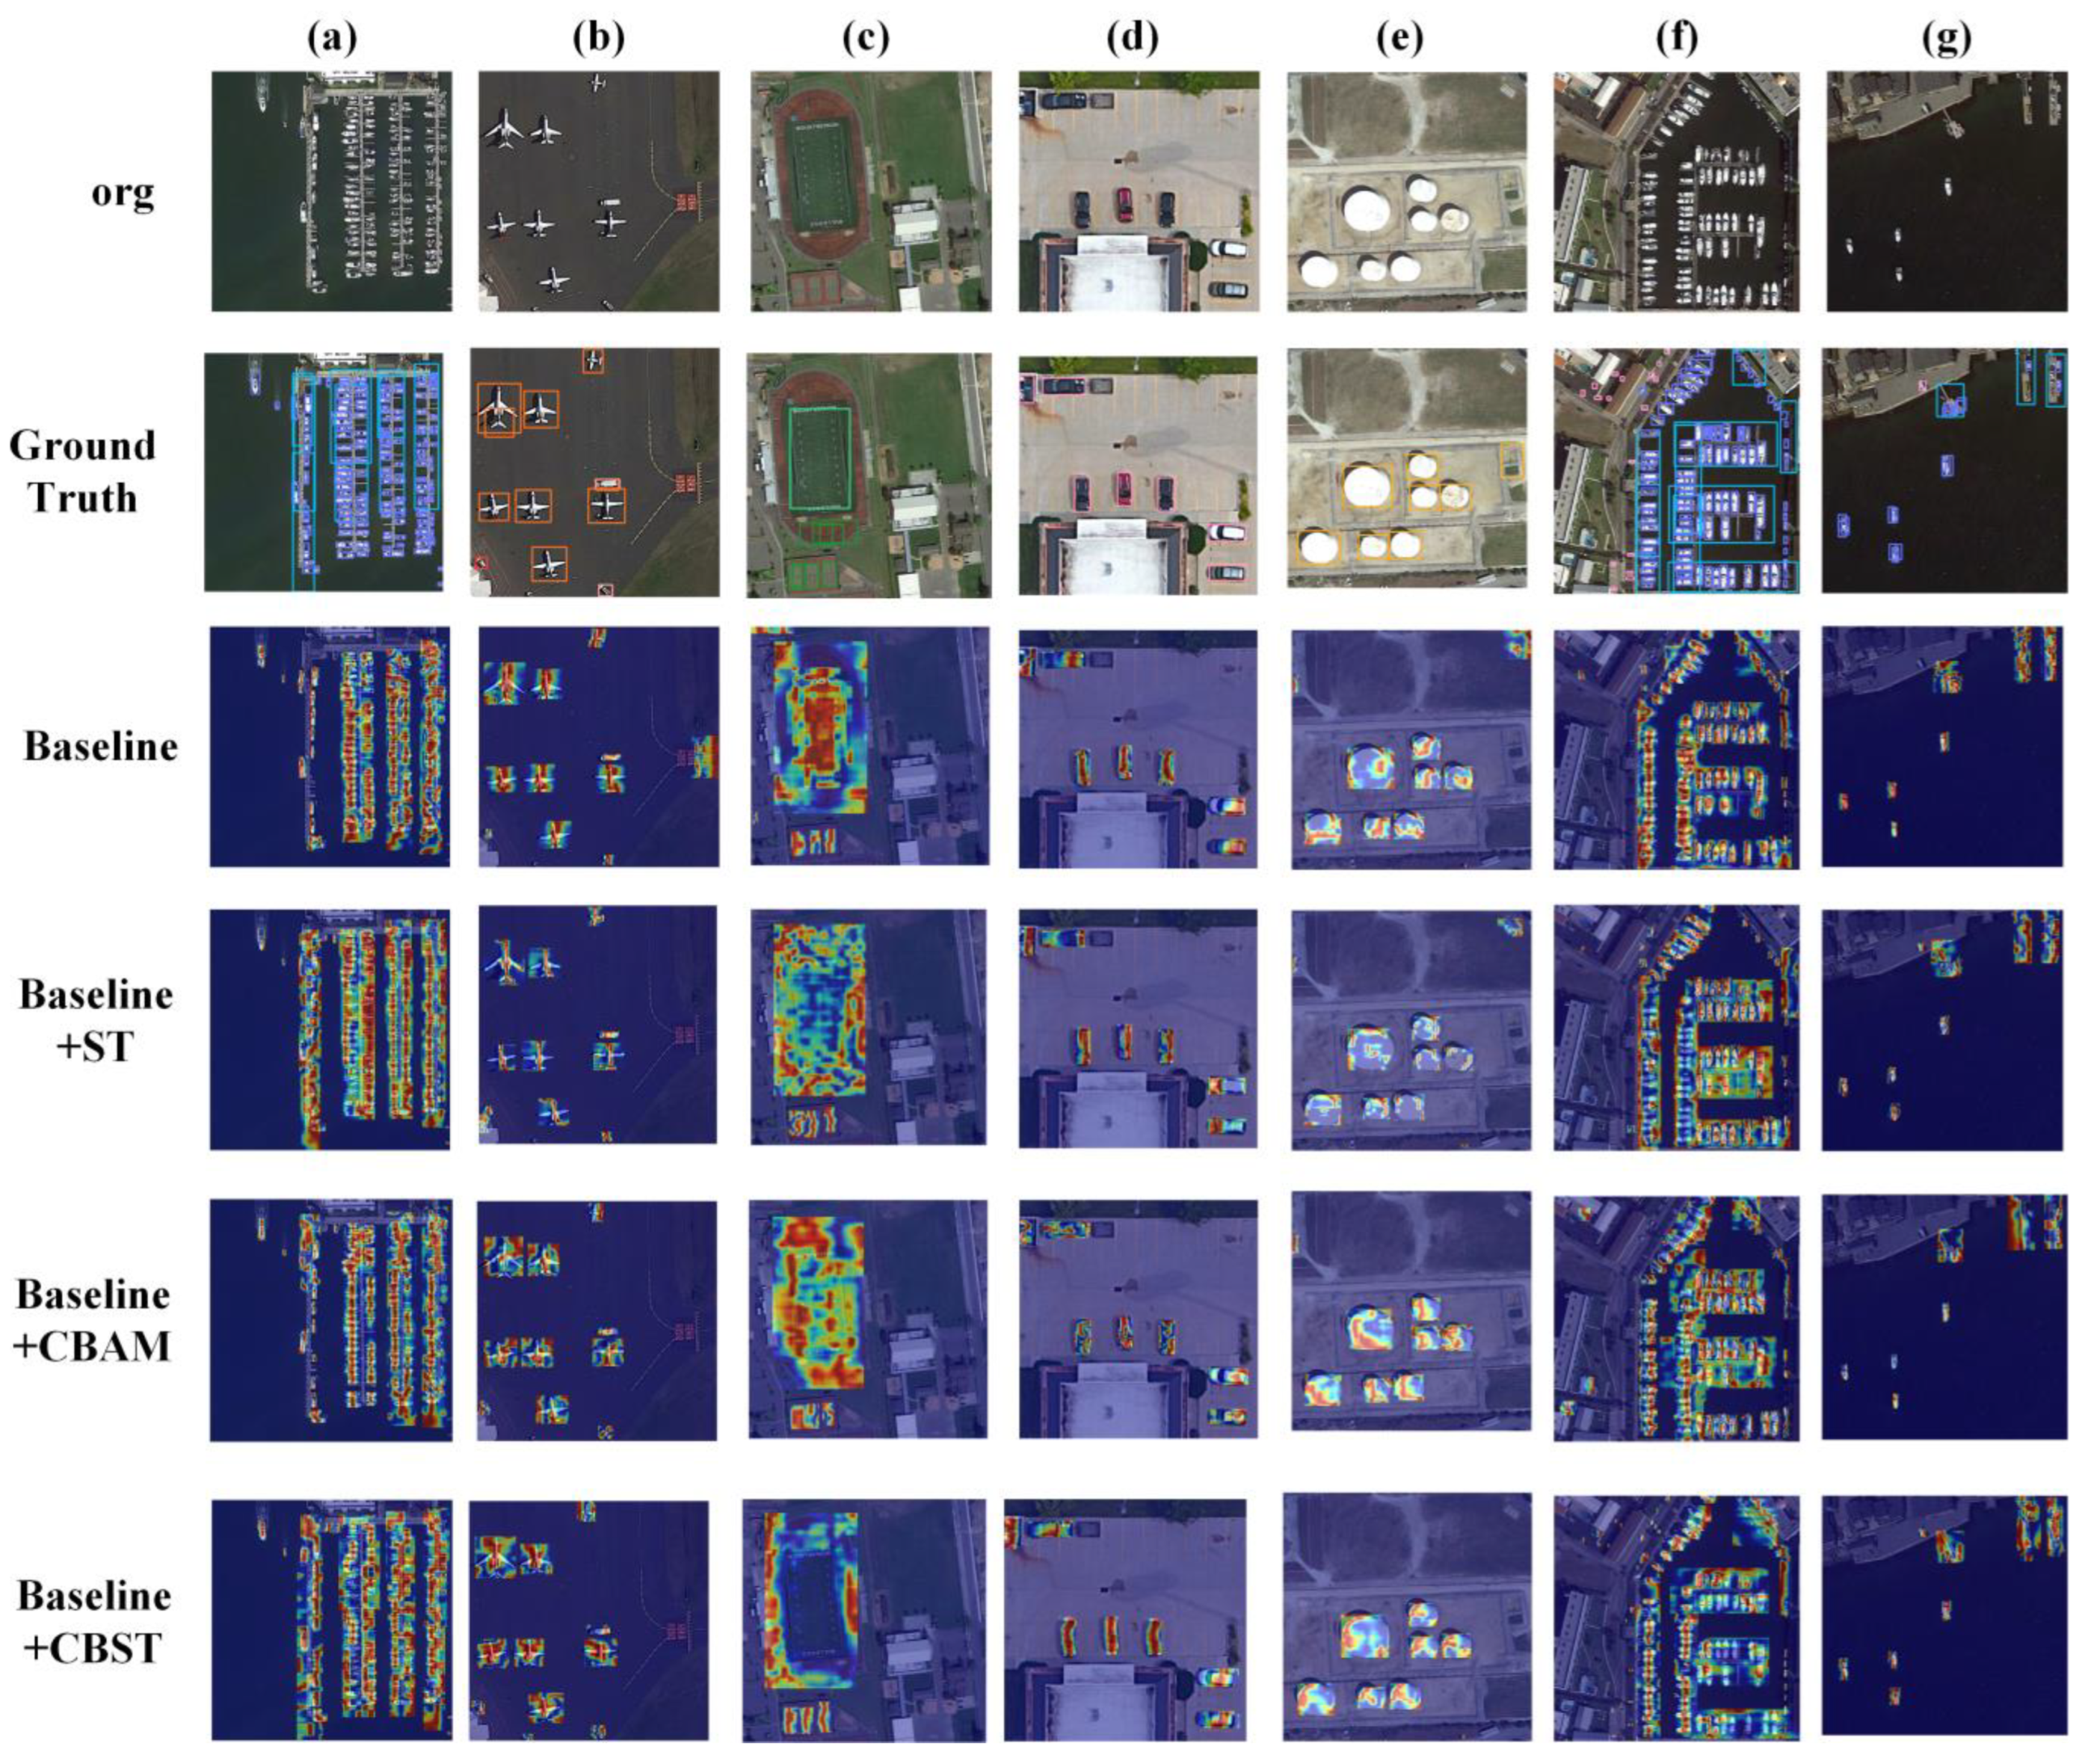
4.3. Experimental Results
- (1)
- Ablation experiments
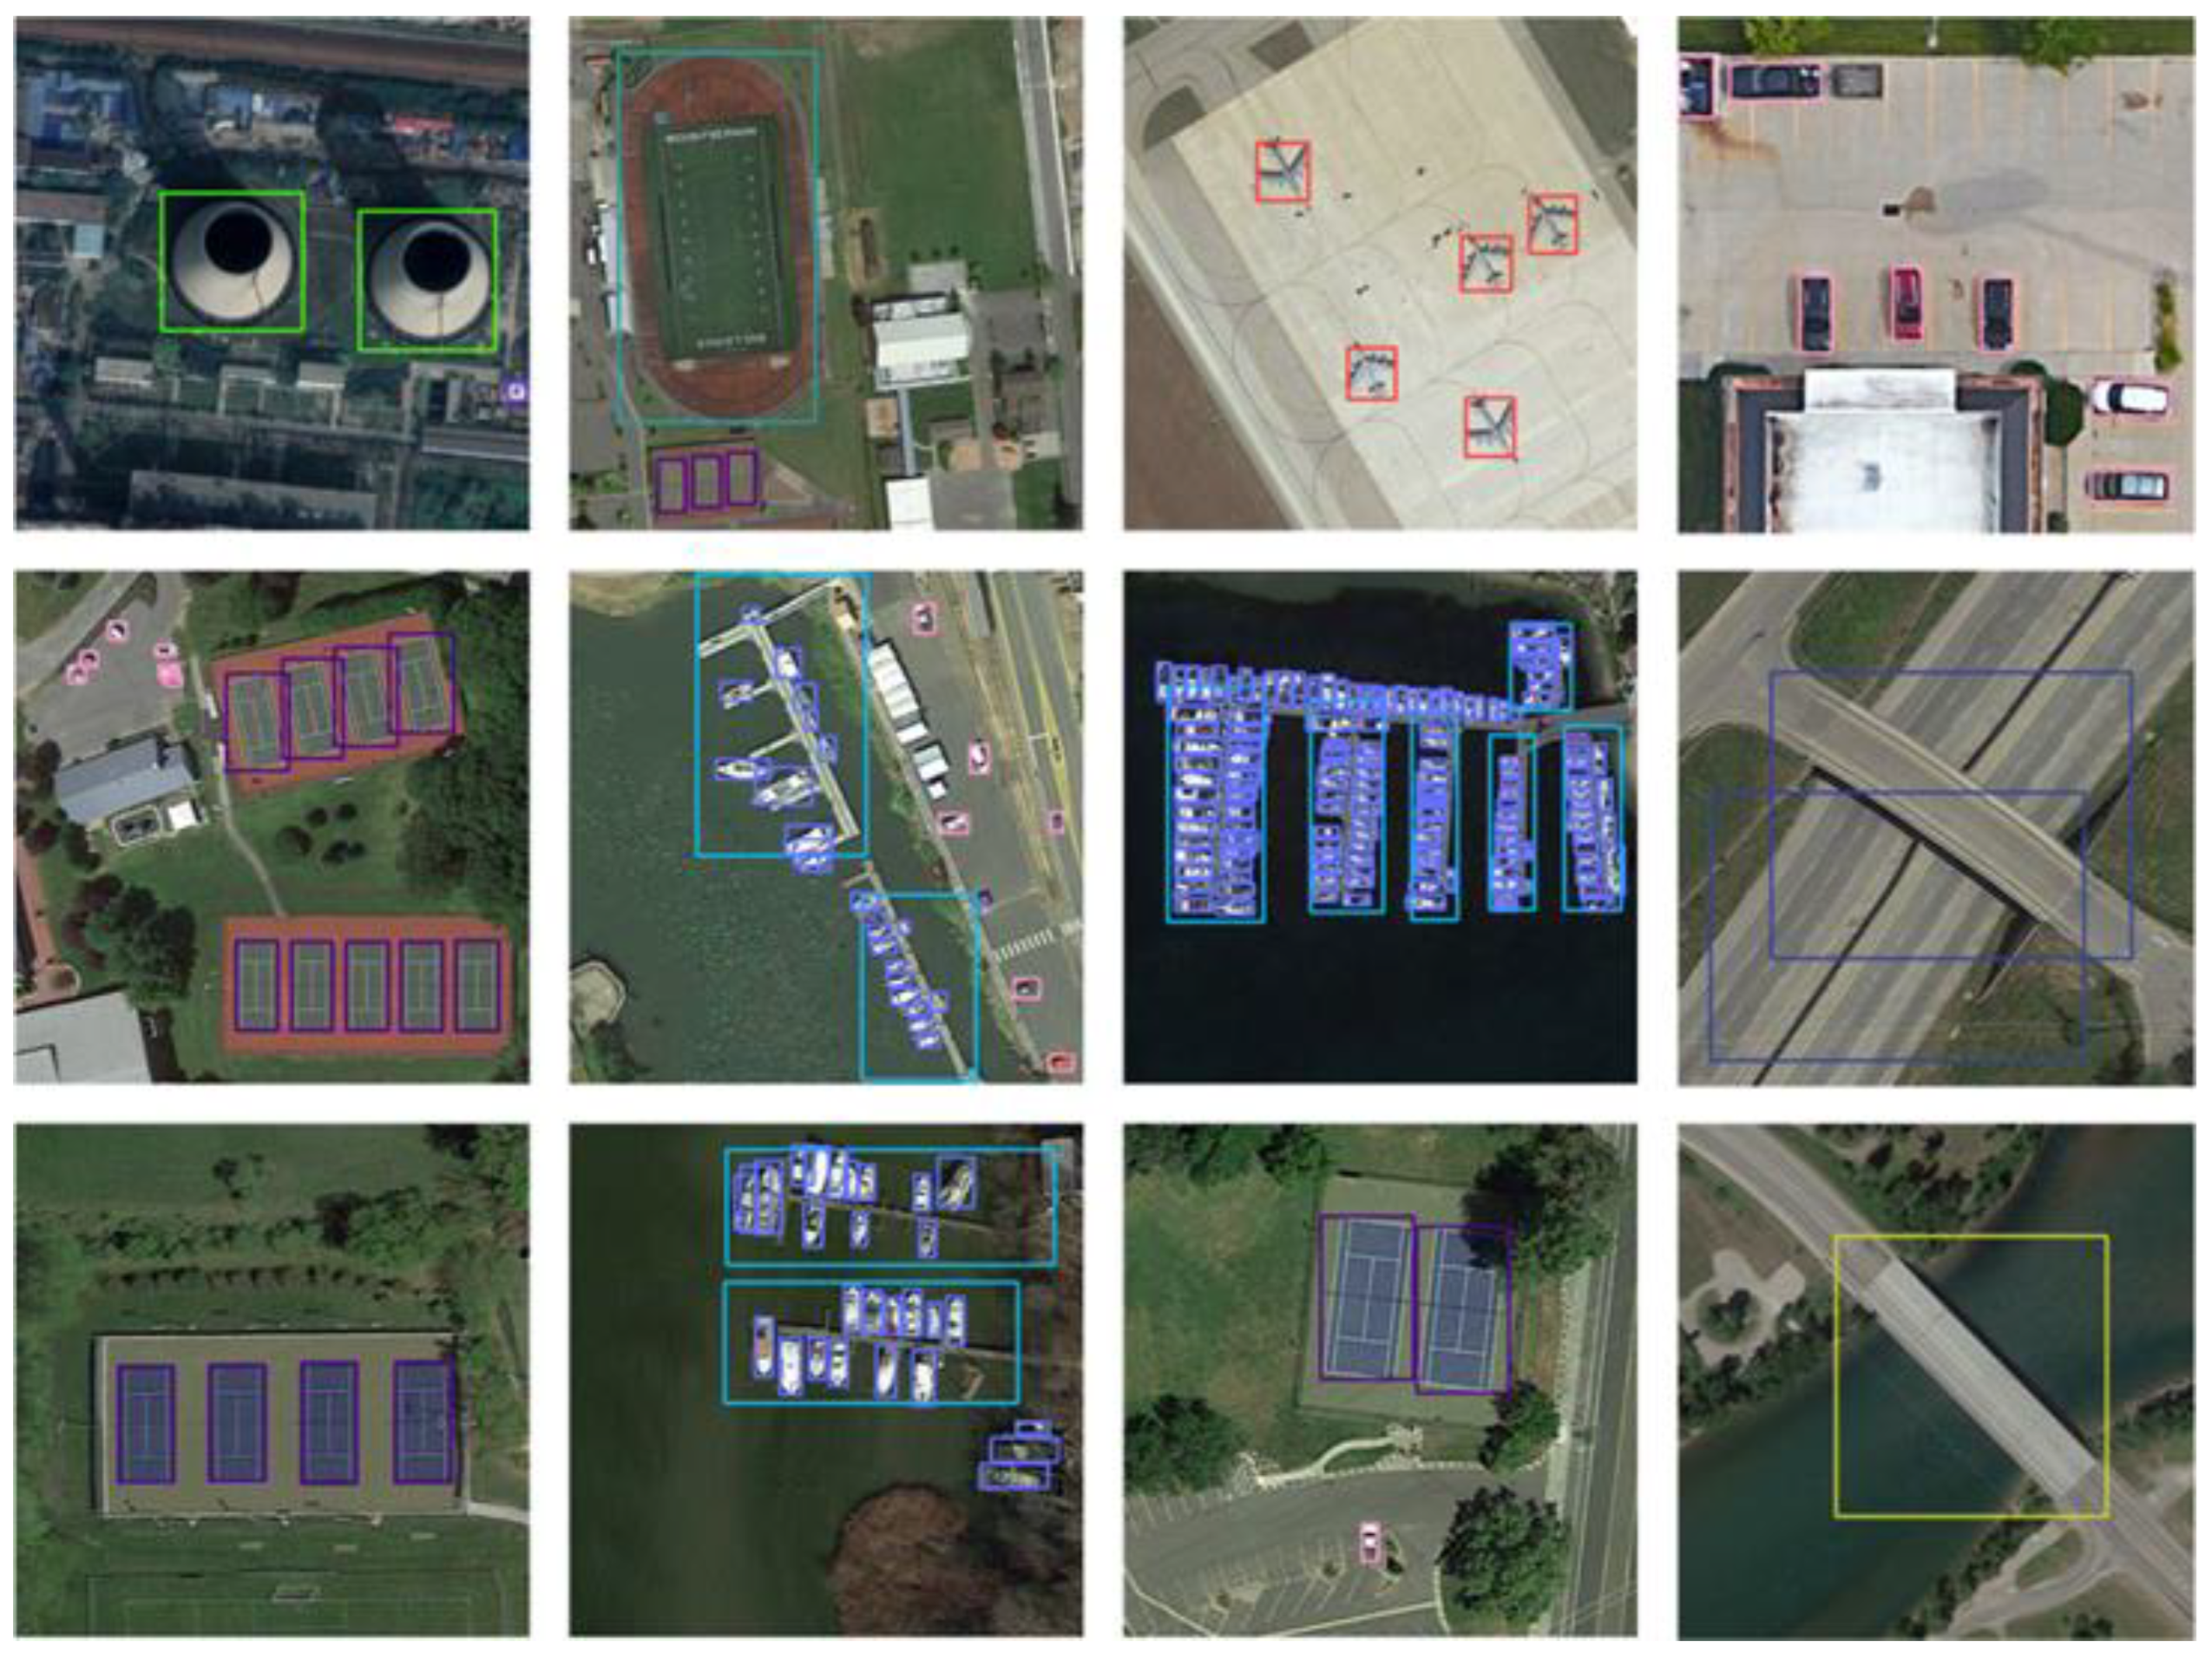
- (2)
- Comparative experiments
5. Conclusions
Author Contributions
Funding
Data Availability Statement
Conflicts of Interest
References
- Girshick, R.; Donahue, J.; Darrell, T.; Malik, J. Rich feature hierarchies for accurate object detection and semantic segmentation. In Proceedings of the IEEE Conference on Computer Vision and Pattern Recognition, Columbus, OH, USA, 23–28 June 2014; pp. 580–587. [Google Scholar]
- Girshick, R. Fast r-cnn. In Proceedings of the IEEE International Conference on Computer Vision, Santiago, Chile, 7–13 December 2015; pp. 1440–1448. [Google Scholar]
- Liu, W.; Anguelov, D.; Erhan, D.; Szegedy, C.; Reed, S.; Fu, C.Y.; Berg, A.C. Ssd: Single shot multibox detector. In Proceedings of the Computer Vision–ECCV 2016: 14th European Conference, Amsterdam, The Netherlands, 11–14 October 2016; Springer: Berlin/Heidelberg, Germany, 2016; Volume 14, pp. 21–37. [Google Scholar]
- Redmon, J.; Divvala, S.; Girshick, R.; Farhadi, A. You only look once: Unified, real-time object detection. In Proceedings of the IEEE Conference on Computer Vision and Pattern Recognition, Las Vegas, NV, USA, 27–30 June 2016; pp. 779–788. [Google Scholar]
- Lin, T.Y.; Goyal, P.; Girshick, R.; He, K.; Dollár, P. Focal loss for dense object detection. In Proceedings of the IEEE International Conference on Computer Vision, Venice, Italy, 22–29 October 2017; pp. 2980–2988. [Google Scholar]
- Ren, S.; He, K.; Girshick, R.; Sun, J. Faster r-cnn: Towards real-time object detection with region proposal networks. IEEE Trans. Pattern Anal. Mach. Intell. 2016, 39, 1137–1149. [Google Scholar] [CrossRef] [PubMed]
- Carion, N.; Massa, F.; Synnaeve, G.; Usunier, N.; Kirillov, A.; Zagoruyko, S. End-to-end object detection with transformers. In Proceedings of the European Conference on Computer Vision, Glasgow, UK, 23–28 August 2020; Springer: Berlin/Heidelberg, Germany, 2020; pp. 213–229. [Google Scholar]
- Liu, Z.; Lin, Y.; Cao, Y.; Hu, H.; Wei, Y.; Zhang, Z.; Guo, B. Swin transformer: Hierarchical vision transformer using shifted windows. In Proceedings of the IEEE/CVF International Conference on Computer Vision, Montreal, BC, Canada, 11–17 October 2021; pp. 10012–10022. [Google Scholar]
- Chu, X.; Tian, Z.; Wang, Y.; Zhang, B.; Ren, H.; Wei, X.; Shen, C. Twins: Revisiting the design of spatial attention in vision transformers. Adv. Neural Inf. Process. Syst. 2021, 34, 9355–9366. [Google Scholar]
- Bochkovskiy, A.; Wang, C.Y.; Liao, H.Y.M. Yolov4: Optimal speed and accuracy of object detection. arXiv 2020, arXiv:2004.10934. [Google Scholar]
- Ding, J.; Xue, N.; Long, Y.; Xia, G.S.; Lu, Q. Learning RoI transformer for oriented object detection in aerial images. In Proceedings of the IEEE/CVF Conference on Computer Vision and Pattern Recognition, Long Beach, CA, USA, 15–20 June 2019; pp. 2849–2858. [Google Scholar]
- Yang, X.; Yang, J.; Yan, J.; Zhang, Y.; Zhang, T.; Guo, Z.; Fu, K. Scrdet: Towards more robust detection for small, cluttered and rotated objects. In Proceedings of the IEEE/CVF International Conference on Computer Vision, Seoul, Republic of Korea, 27 October–2 November 2019; pp. 8232–8241. [Google Scholar]
- Zhang, T.; Zhang, X.; Zhu, X.; Wang, G.; Han, X.; Tang, X.; Jiao, L. Multistage enhancement network for tiny object detection in remote sensing images. IEEE Trans. Geosci. Remote Sens. 2024, 62, 1–12. [Google Scholar] [CrossRef]
- Biswas, D.; Tešić, J. Domain adaptation with contrastive learning for object detection in satellite imagery. IEEE Trans. Geosci. Remote Sens. 2024, 62, 1–15. [Google Scholar] [CrossRef]
- Yang, X.; Jiao, L.; Li, Y.; Liu, X.; Liu, F.; Li, L.; Yang, S. Relation Learning Reasoning Meets Tiny Object Tracking in Satellite Videos. IEEE Trans. Geosci. Remote Sens. 2024, 62, 1–16. [Google Scholar] [CrossRef]
- Woo, S.; Park, J.; Lee, J.Y.; Kweon, I.S. Cbam: Convolutional block attention module. In Proceedings of the European Conference on Computer Vision (ECCV), Munich, Germany, 8–14 September 2018; pp. 3–19. [Google Scholar]
- Hosang, J.; Benenson, R.; Schiele, B. A convnet for non-maximum suppression. In Proceedings of the Pattern Recognition: 38th German Conference, GCPR 2016, Hannover, Germany, 12–15 September 2016; Springer: Berlin/Heidelberg, Germany, 2016; Volume 38, pp. 38192–38204. [Google Scholar]
- Li, K.; Wan, G.; Cheng, G.; Meng, L.; Han, J. Object detection in optical remote sensing images: A survey and a new benchmark. Isprs J. Photogramm. Remote Sens. 2020, 159, 296–307. [Google Scholar] [CrossRef]
- Xia, G.S.; Bai, X.; Ding, J.; Zhu, Z.; Belongie, S.; Luo, J.; Zhang, L. DOTA: A large-scale dataset for object detection in aerial images. In Proceedings of the IEEE Conference on Computer Vision and Pattern Recognition, Salt Lake City, UT, USA, 18–23 June 2018; pp. 3974–3983. [Google Scholar]
- Yang, X.; Sun, H.; Fu, K.; Yang, J.; Sun, X.; Yan, M.; Guo, Z. Automatic ship detection in remote sensing images from google earth of complex scenes based on multiscale rotation dense feature pyramid networks. Remote Sens. 2018, 10, 132. [Google Scholar] [CrossRef]
- Ming, Q.; Miao, L.; Zhou, Z.; Dong, Y. CFC-Net: A critical feature capturing network for arbitrary-oriented object detection in remote-sensing images. IEEE Trans. Geosci. Remote Sens. 2021, 60, 1–14. [Google Scholar] [CrossRef]
- Yao, Y.; Cheng, G.; Wang, G.; Li, S.; Zhou, P.; Xie, X.; Han, J. On improving bounding box representations for oriented object detection. IEEE Trans. Geosci. Remote Sens. 2022, 61, 1–11. [Google Scholar] [CrossRef]
- Azimi, S.M.; Vig, E.; Bahmanyar, R.; Körner, M.; Reinartz, P. Towards multi-class object detection in unconstrained remote sensing imagery. In Proceedings of the Asian Conference on Computer Vision, Perth, Australia, 2–6 December 2018; Springer: Berlin/Heidelberg, Germany, 2018; pp. 150–165. [Google Scholar]


| Evaluation Indicator | Models | |||||||
|---|---|---|---|---|---|---|---|---|
| Baseline | +ST | +CBAM | +K-Detector | +ST + K-Detector | +CBAM + K-Detector | +CBST | +CBST + K-Detector | |
| P_best | 0.648 | 0.730 | 0.718 | 0.702 | 0.743 | 0.714 | 0.752 | 0.754 |
| R_best | 0.554 | 0.617 | 0.608 | 0.643 | 0.656 | 0.639 | 0.629 | 0.662 |
| mAP | 0.648 | 0.664 | 0.632 | 0.685 | 0.660 | 0.631 | 0.660 | 0.683 |
| mAP50:95 | 0.40 | 0.401 | 0.371 | 0.398 | 0.410 | 0.373 | 0.423 | 0.418 |
| Train speed | 614 ms | 632 ms | 618 ms | 654 ms | 659 ms | 657 ms | 645 ms | 671 ms |
| Test speed | 4.86 ms | 5.27 ms | 4.97 ms | 7.15 ms | 7.35 ms | 6.95 ms | 5.89 ms | 7.37 ms |
| Param | 13.61 MB | 13.77 MB | 13.87 MB | 14.30 MB | 14.68 MB | 14.96 MB | 13.97 MB | 15.44 MB |
| Accuracy | Detection Algorithm | |||||||
|---|---|---|---|---|---|---|---|---|
| Faster RCNN | Yolov4 | RetinaNet | R-DFPN | CFC-Net | ROI Transformer | QPDet | K-CBST YOLO | |
| APL | 0.638 | 0.814 | 0.626 | 0.783 | 0.923 | 0.633 | 0.632 | 0.926 |
| APO | 0.616 | 0.493 | 0.722 | 0.809 | 0.489 | 0.379 | 0.414 | 0.416 |
| BF | 0.669 | 0.671 | 0.682 | 0.766 | 0.716 | 0.712 | 0.720 | 0.923 |
| BC | 0.846 | 0.726 | 0.848 | 0.903 | 0.812 | 0.875 | 0.886 | 0. 781 |
| BR | 0.280 | 0.395 | 0.505 | 0.338 | 0.589 | 0.407 | 0.412 | 0. 368 |
| CH | 0.730 | 0.726 | 0.767 | 0.678 | 0.909 | 0.726 | 0.726 | 0. 885 |
| DAM | 0.445 | 0.366 | 0.545 | 0.513 | 0.463 | 0.269 | 0.288 | 0. 387 |
| ESA | 0.526 | 0.568 | 0.564 | 0.579 | 0.505 | 0.681 | 0.690 | 0. 606 |
| ETS | 0.423 | 0.599 | 0.471 | 0.509 | 0.574 | 0.787 | 0.789 | 0. 609 |
| GF | 0.712 | 0.602 | 0.749 | 0.736 | 0.688 | 0.690 | 0.701 | 0. 529 |
| GTF | 0.659 | 0.661 | 0.677 | 0.674 | 0.661 | 0.827 | 0.830 | 0. 744 |
| HA | 0.486 | 0.523 | 0.427 | 0.501 | 0.623 | 0.477 | 0.478 | 0. 516 |
| OP | 0.501 | 0.518 | 0.526 | 0.558 | 0.540 | 0.556 | 0.555 | 0. 564 |
| SH | 0.716 | 0.802 | 0.680 | 0.743 | 0.724 | 0.812 | 0.812 | 0. 919 |
| STA | 0.340 | 0.654 | 0.466 | 0.584 | 0.836 | 0.782 | 0.722 | 0. 899 |
| STO | 0.634 | 0.707 | 0.471 | 0.629 | 0.838 | 0.703 | 0.627 | 0. 812 |
| TC | 0.775 | 0.866 | 0.774 | 0.726 | 0.883 | 0.816 | 0.891 | 0. 922 |
| TS | 0.403 | 0.434 | 0.400 | 0.487 | 0.398 | 0.549 | 0.581 | 0.338 |
| VE | 0.459 | 0.501 | 0.371 | 0.482 | 0.552 | 0.433 | 0.434 | 0. 726 |
| WM | 0.698 | 0.735 | 0.719 | 0.707 | 0.754 | 0.655 | 0.654 | 0. 786 |
| mAP | 0.578 | 0.603 | 0.590 | 0.623 | 0.660 | 0.639 | 0.642 | 0.683 |
| Accuracy | Detection Algorithm | ||||||
|---|---|---|---|---|---|---|---|
| Faster RCNN | ICN | ROI Transformer | R-DFPN | QPDet | SCRDet | K-CBST YOLO | |
| PL | 0.884 | 0.814 | 0.886 | 0.809 | 0.896 | 0.902 | 0.895 |
| BD | 0.731 | 0.743 | 0.785 | 0.658 | 0.837 | 0.819 | 0.833 |
| BR | 0.449 | 0.477 | 0.434 | 0.338 | 0.541 | 0.553 | 0.659 |
| GTF | 0.591 | 0.703 | 0.759 | 0.589 | 0.739 | 0.733 | 0.676 |
| SV | 0.733 | 0.649 | 0.688 | 0.558 | 0.789 | 0.721 | 0.801 |
| LV | 0.715 | 0.678 | 0.737 | 0.509 | 0.831 | 0.776 | 0.912 |
| SH | 0.771 | 0.70 | 0.836 | 0.548 | 0.883 | 0.781 | 0.809 |
| TC | 0.908 | 0.908 | 0.907 | 0.903 | 0.909 | 0.909 | 0.655 |
| BC | 0.789 | 0.791 | 0.773 | 0.663 | 0.866 | 0.824 | 0.643 |
| ST | 0.839 | 0.782 | 0.815 | 0.687 | 0.848 | 0.864 | 0.836 |
| SBF | 0.486 | 0.536 | 0.584 | 0.487 | 0.620 | 0.645 | 0.933 |
| RA | 0.630 | 0.629 | 0.535 | 0.518 | 0.655 | 0.634 | 0.818 |
| HA | 0.622 | 0.670 | 0.628 | 0.551 | 0.742 | 0.758 | 0.772 |
| SP | 0.650 | 0.642 | 0.589 | 0.513 | 0.701 | 0.782 | 0.809 |
| HC | 0.562 | 0.502 | 0.477 | 0.359 | 0.582 | 0.601 | 0.695 |
| mAP | 0.691 | 0.682 | 0.696 | 0.579 | 0.762 | 0.753 | 0.784 |
Disclaimer/Publisher’s Note: The statements, opinions and data contained in all publications are solely those of the individual author(s) and contributor(s) and not of MDPI and/or the editor(s). MDPI and/or the editor(s) disclaim responsibility for any injury to people or property resulting from any ideas, methods, instructions or products referred to in the content. |
© 2024 by the authors. Licensee MDPI, Basel, Switzerland. This article is an open access article distributed under the terms and conditions of the Creative Commons Attribution (CC BY) license (https://creativecommons.org/licenses/by/4.0/).
Share and Cite
Cheng, A.; Xiao, J.; Li, Y.; Sun, Y.; Ren, Y.; Liu, J. Enhancing Remote Sensing Object Detection with K-CBST YOLO: Integrating CBAM and Swin-Transformer. Remote Sens. 2024, 16, 2885. https://doi.org/10.3390/rs16162885
Cheng A, Xiao J, Li Y, Sun Y, Ren Y, Liu J. Enhancing Remote Sensing Object Detection with K-CBST YOLO: Integrating CBAM and Swin-Transformer. Remote Sensing. 2024; 16(16):2885. https://doi.org/10.3390/rs16162885
Chicago/Turabian StyleCheng, Aonan, Jincheng Xiao, Yingcheng Li, Yiming Sun, Yafeng Ren, and Jianli Liu. 2024. "Enhancing Remote Sensing Object Detection with K-CBST YOLO: Integrating CBAM and Swin-Transformer" Remote Sensing 16, no. 16: 2885. https://doi.org/10.3390/rs16162885
APA StyleCheng, A., Xiao, J., Li, Y., Sun, Y., Ren, Y., & Liu, J. (2024). Enhancing Remote Sensing Object Detection with K-CBST YOLO: Integrating CBAM and Swin-Transformer. Remote Sensing, 16(16), 2885. https://doi.org/10.3390/rs16162885