Article

Quantifying Carbon Use Efficiency: Unraveling the Impact of Climate Change and Ecological Engineering on Vegetation in the Three Rivers Source Region

by
Yixia Luo
1,2,3,
Hengyi Duan
4,
Jing Pan
2,3,
Xue Gao
5,
Jilong Chen
2,3,
Shengjun Wu
2,3 and
Daming Tan
5,*
1
School of River and Ocean Engineering, Chongqing Jiaotong University, Chongqing 400074, China
2
Chongqing Institute of Green and Intelligent Technology, Chinese Academy of Sciences, Chongqing 401122, China
3
Chongqing College of Chinese Academy of Sciences, Chongqing 400714, China
4
Upper Changjiang River Bureau of Hydrological and Water Resources Survey, Chongqing 400020, China
5
Institute of Agricultural Resources and Environment, Tibet Academy of Agricultural and Animal Husbandry Science, Lhasa 850000, China
*
Author to whom correspondence should be addressed.
Remote Sens. 2024, 16(16), 2909; https://doi.org/10.3390/rs16162909
Submission received: 29 May 2024 / Revised: 23 July 2024 / Accepted: 30 July 2024 / Published: 9 August 2024

Abstract

:
Carbon use efficiency (CUE) was identified as a pivotal parameter for elucidating the carbon cycle within ecosystems. It signified the efficiency with which light energy was transformed into organic matter by vegetation. In light of the challenges posed by global warming, it was deemed essential to gain a comprehensive understanding of the fluctuations and determinants of CUE. Despite the significance of this topic, the current research on factors influencing CUE remained incomplete, notably lacking in exploration of the impacts of ecological engineering on CUE. The objective of this study is to elucidate the influences of climate change and ecological engineering on CUE, quantifying their effects using residual analysis. Additionally, it aims to analyze the primary factors contributing to the fluctuations in CUE. Our findings indicated an average CUE of 0.8536 (±0.0026) with minor interannual variation. In the Three Rivers Source region, CUE is jointly influenced by ecological engineering (30.88%) and climate change (69.12%). Notably, climatic factors predominantly regulate CUE, accounting for approximately 90.20% of its regional variations, with over 44.70% of areas exhibiting contributions exceeding 80%. Moreover, the impact of evapotranspiration on CUE surpasses that of precipitation and temperature, while factors such as elevation and vegetation types also play significant roles. This study showed the quantification of climate change and ecological engineering effects on CUE, which would hold substantial implications for predicting and evaluating global carbon cycling.

1. Introduction

Carbon use efficiency (CUE) is a pivotal metric, defined as the ratio of net primary production (NPP, g C m−1 yr−1) to gross primary production (GPP, g C m−1 yr−1). It exemplifies the capacity of plants to transform atmospheric carbon [1,2,3,4]. The global carbon cycle remains of paramount concern [5,6], with vegetation CUE playing a pivotal role in determining the rates of carbon cycling and turnover in terrestrial ecosystems [7,8]. Nevertheless, the quantitative assessment of the impact of climate change and anthropogenic activities on vegetation CUE is fraught with difficulties [9,10,11]. Ecological engineering represents a pivotal methodology for the restoration of regional ecological functions through human intervention. It is, therefore, crucial to quantify the responses of vegetation CUE to ecological engineering and climate-driven factors in order to enhance our understanding of carbon sequestration dynamics.
In previous studies, methodological challenges in calculating vegetation CUE have often led to it being perceived as a constant parameter, obscuring inherent variation [2,12,13,14,15,16]. However, as research has progressed, a growing number of factors have been identified that influence the CUE of vegetation. There is evidence that vegetation CUE is influenced by a variety of factors, including climatic conditions, geographic location, altitude, vegetation type, CO2 concentration, soil fertility, and stand age [4,16,17,18,19,20,21,22]. At present, research on CUE has produced extensive findings at both regional and global scales. However, studies specifically addressing CUE at the local scale remain limited [21]. Previous research has mainly examined the spatiotemporal patterns of CUE at regional or global scales [23,24], focusing on the driving factors of precipitation and temperature. Few studies have examined the effects of ecosystem types and water stress on CUE [22]. Globally, CUE shows a pronounced latitudinal gradient, with higher values at higher latitudes. It shows a non-linear decrease with increasing temperature but is relatively stable with increasing precipitation [25]. There is also a strong latitudinal gradient in CUE in China. However, there are slight variations in the response of CUE to temperature and precipitation, with both factors decreasing CUE as they increase [22]. In particular, the response of CUE to temperature and precipitation in Ningxia Province in northern China shows some deviations from global observations [26]. Evapotranspiration is crucial to the life activities of vegetation, regulating both photosynthesis and autotrophic respiration [27,28], and is, therefore, a key factor influencing CUE. In China, ecological engineering included reforestation, farmland reclamation, and water conservation. These measures were aimed at halting ecological degradation. They also aimed to improve regional vegetation conditions and restore the ecological environment [29]. Previous research has often overlooked the effects of evapotranspiration and ecological engineering on CUE, resulting in significant gaps in our understanding of this issue. To address these gaps, dynamic evapotranspiration data were integrated, and the effects of ecological engineering were considered. This integration was essential for a more comprehensive understanding of the factors driving changes in vegetation CUE under varying environmental conditions.
The Three Rivers Source region encompasses the headwaters of the Yangtze, Yellow, and Lancang Rivers. It is located in the heartland of the Qinghai-Tibet Plateau. This region is often referred to as the “Water Tower of China” [29]. Since 1978, the Three Rivers Source region has experienced significant ecological degradation and a drastic decline in ecosystem services. These changes have largely been attributed to intensified human activities and unsustainable resource exploitation. Recognizing this ecological crisis, various stakeholders have emphasized its importance. Consequently, in 2005, the State Council sanctioned ‘The general planning on ecological conservation and restoration in the Three Rivers Source region nature reserve in Qinghai Province’. The project’s principal objective was the implementation of measures designed to safeguard the natural forest, promote afforestation, conserve soil and water resources, and protect wildlife. These measures were implemented with the aim of enhancing the ecological environment of the Three Rivers Source region and arresting the ongoing deterioration of the ecosystem. This plan paved the way for the establishment of a nature reserve and the initiation of ecological conservation and restoration efforts in the Three Rivers Source region. As a predominantly alpine and sparsely populated region, human intervention in the Three Rivers Source region since 2005 has focused on ecological engineering. Given these characteristics, the Three Rivers Source region emerged as an exemplary research site. This site offered invaluable opportunities to study the effects of ecological engineering and climate change on vegetation CUE.
In the present study, MODIS products (GPP and NPP) were used to calculate a 20-year continuous remote sensing CUE dataset. Variables such as climate (temperature, precipitation and evapotranspiration), vegetation types, and elevation were integrated. Our objectives were as follows: (1) to investigate the spatiotemporal variation characteristics of CUE in the Three Rivers Source region and its influencing factors, and (2) to quantify the contributions of ecological engineering and climate change to variations in CUE. The results deepened the understanding of regional changes in carbon cycling related to human activities and climate change.

2. Materials and Methods

2.1. Data Collection

To analyze the dynamics of CUE between 2001 and 2020, we used a long-term time series of GPP and NPP. The GPP and NPP datasets, derived from the MOD17A2H product available on Google Earth Engine (https://earthengine.google.com/, accessed on 5 January 2023), provide an annual temporal resolution and a spatial resolution of 500 m over the Three Rivers Source region. Prior to analysis, the data underwent preprocessing steps, including filtering based on MODIS product documentation and quality control bits, as well as resampling and projection adjustments. The utility of this dataset spans a range of studies, facilitating the investigation of temporal and spatial patterns at regional and global scales related to crop yield estimation, productivity, and carbon cycling [30,31]. In addition, the normalized difference vegetation index (NDVI) dataset was obtained from the MOD13A1 product, with a temporal resolution of 16 days and a spatial resolution of 500 m. This dataset serves as a continuity index to the previously established National Oceanic and Atmospheric Administration-Advanced Very High Resolution Radiometer (NOAA-AVHRR)-derived NDVI. Furthermore, the Leaf Area Index (LAI) dataset was obtained from the MOD15A2H product, which has a temporal resolution of 8 days and a spatial resolution of 500 m. Similar to the GPP data, both NDVI and LAI datasets were accessed from the Google Earth Engine platform(https://earthengine.google.com/, accessed on 5 January 2023).
Climate factors, namely temperature, precipitation, and evapotranspiration, were integral to this study. Temperature and precipitation data spanning from 2001 to 2020 [32], with a resolution of 1 km, were sourced from the monthly temperature and precipitation dataset available at https://data.tpdc.ac.cn/ (accessed on 7 January 2023). This dataset was meticulously crafted by downscaling the global 0.5° climate dataset from CRU and the high-resolution global climate dataset from WorldClim, employing the Delta space downscaling methodology. Furthermore, the dataset’s credibility is bolstered by its validation against data from 496 distinct meteorological observation points, ensuring robust validation outcomes. Moreover, evapotranspiration data covering the period from 2001 to 2020, possessing a spatial resolution of 500 m, were accessed from the Google Earth Engine platform (accessed on 7 January 2023). Notably, the updated iteration of the PML-V2 [33] evapotranspiration product rectifies limitations observed in its predecessor. Specifically, this version addresses challenges associated with LAI data corrections and addresses data gaps, enhancing the dataset’s overall reliability and applicability for this study.
This study utilized a Digital Elevation Model (DEM) sourced from the SRTM V3 (https://lpdaac.usgs.gov/products/srtmgl1v003/, accessed on 5 January 2023) product, made available by NASA’s Jet Propulsion Laboratory (JPL). This DEM boasts a resolution of 1 arc-second, equivalent to approximately 30 m, providing detailed topographical insights essential for the research. Additionally, the vegetation distribution data categorized vegetation into 11 distinct groups or types, encompassing classifications, such as scrubs, meadows, steppes, among others. This comprehensive dataset was furnished by the “Environmental & Ecological Science Data Center for West China, National Natural Science Foundation of China” and can be accessed at http://westdc.westgis.ac.cn (accessed on 5 January 2023).

2.2. Analysis Methods

2.2.1. Estimation of Carbon Use Efficiency

The carbon use efficiency of vegetation is quantified as the ratio of net primary productivity to gross primary productivity.
C U E = N P P G P P = G P P R a G P P
where:
  • CUE represents the carbon use efficiency of vegetation.
  • NPP denotes the net primary productivity of vegetation, measured in g C/m2.
  • GPP stands for the gross primary productivity of vegetation, quantified in g C/m2.
  • Ra signifies the vegetation autotrophic respiration, expressed in g C/m2.

2.2.2. Sen’s Slope Estimator and Mann–Kendall Test

Sen’s slope [34] and the Mann–Kendall test [35,36] were used for their robustness as non-parametric methods. These methods were used to effectively detect trends in time-series data without requiring specific distributional assumptions [37,38,39]. Thus, Sen’s slope trend analysis method was used to examine the temporal dynamics of CUE, while the significance of the observed trends was rigorously assessed using the Mann–Kendall test.
Sen’s slope estimator is calculated as follows:
s l o p e = M e d i a n x j x i j i ,   j > i
where xi and xj represent sequential values at times i and j, respectively. An upward trend is denoted by a positive slope (>0), whereas a downward trend is signified by a negative slope (<0) [40].
The calculation of the Mann–Kendall test statistic is as follows:
S = i = 1 n 1 j = i 1 n S g n x j x i
S g n x j x i = 1 x j x i > 0 0 x j x i = 0 1 x j x i < 0
where xi and xj denote sequential values at times i and j, respectively, and n represents the dataset’s record length, the number of years.
Z = S 1 V A R S S > 0 0 S = 0 S + 1 V A R S S < 0
V A R S = n n 1 2 n + 5 i = 1 m t i t i 1 2 t i + 5 18
where n represents the total number of values in the sequence, m signifies the count of repeated values within the sequence and denotes the number of repeated data values in the ith group. A positive value of Z suggests an increasing trend, whereas a negative value of Z suggests a decreasing trend. The significance level is ascertained based on the absolute value of Z [40,41].
Based on the results derived from Sen’s slope trend combined with the Mann–Kendall significance test, the observed change trends were categorized into six distinct classifications: extremely significant increase (slope > 0,|S| > 2.58), significant increase (slope > 0,1.96 < |S| < 2.58), non-significant increase (slope > 0,|S| < 1.96), non-significant decrease (slope < 0,|S| < 1.96), significant decrease (slope < 0,1.96 < |S| < 2.58), and extremely significant decrease (slope < 0,|S| > 2.58). Here, slope denotes the calculated trend slope, and |S| represents the absolute value of the Mann–Kendall test statistic S.

2.2.3. Pearson Correlation Analysis

Pearson correlation analysis [42] was employed to elucidate the statistical relationship between vegetation CUE and climate factors, namely temperature, precipitation, and evapotranspiration. A positive correlation between two factors is inferred when the correlation coefficient is positive. Conversely, a negative correlation coefficient indicates that the two factors are negatively correlated.

2.2.4. Residual Analysis

The residual analysis method was employed to ascertain the impact of climate change and ecological engineering on the CUE dynamics in the Three River Headwaters region at the pixel level. A multiple linear regression model was established to estimate CUE, incorporating temperature, precipitation, and evapotranspiration as variables. The residual between the observed CUE and the predicted CUE serves as the influence exerted by human activities on CUE [43,44].

3. Results

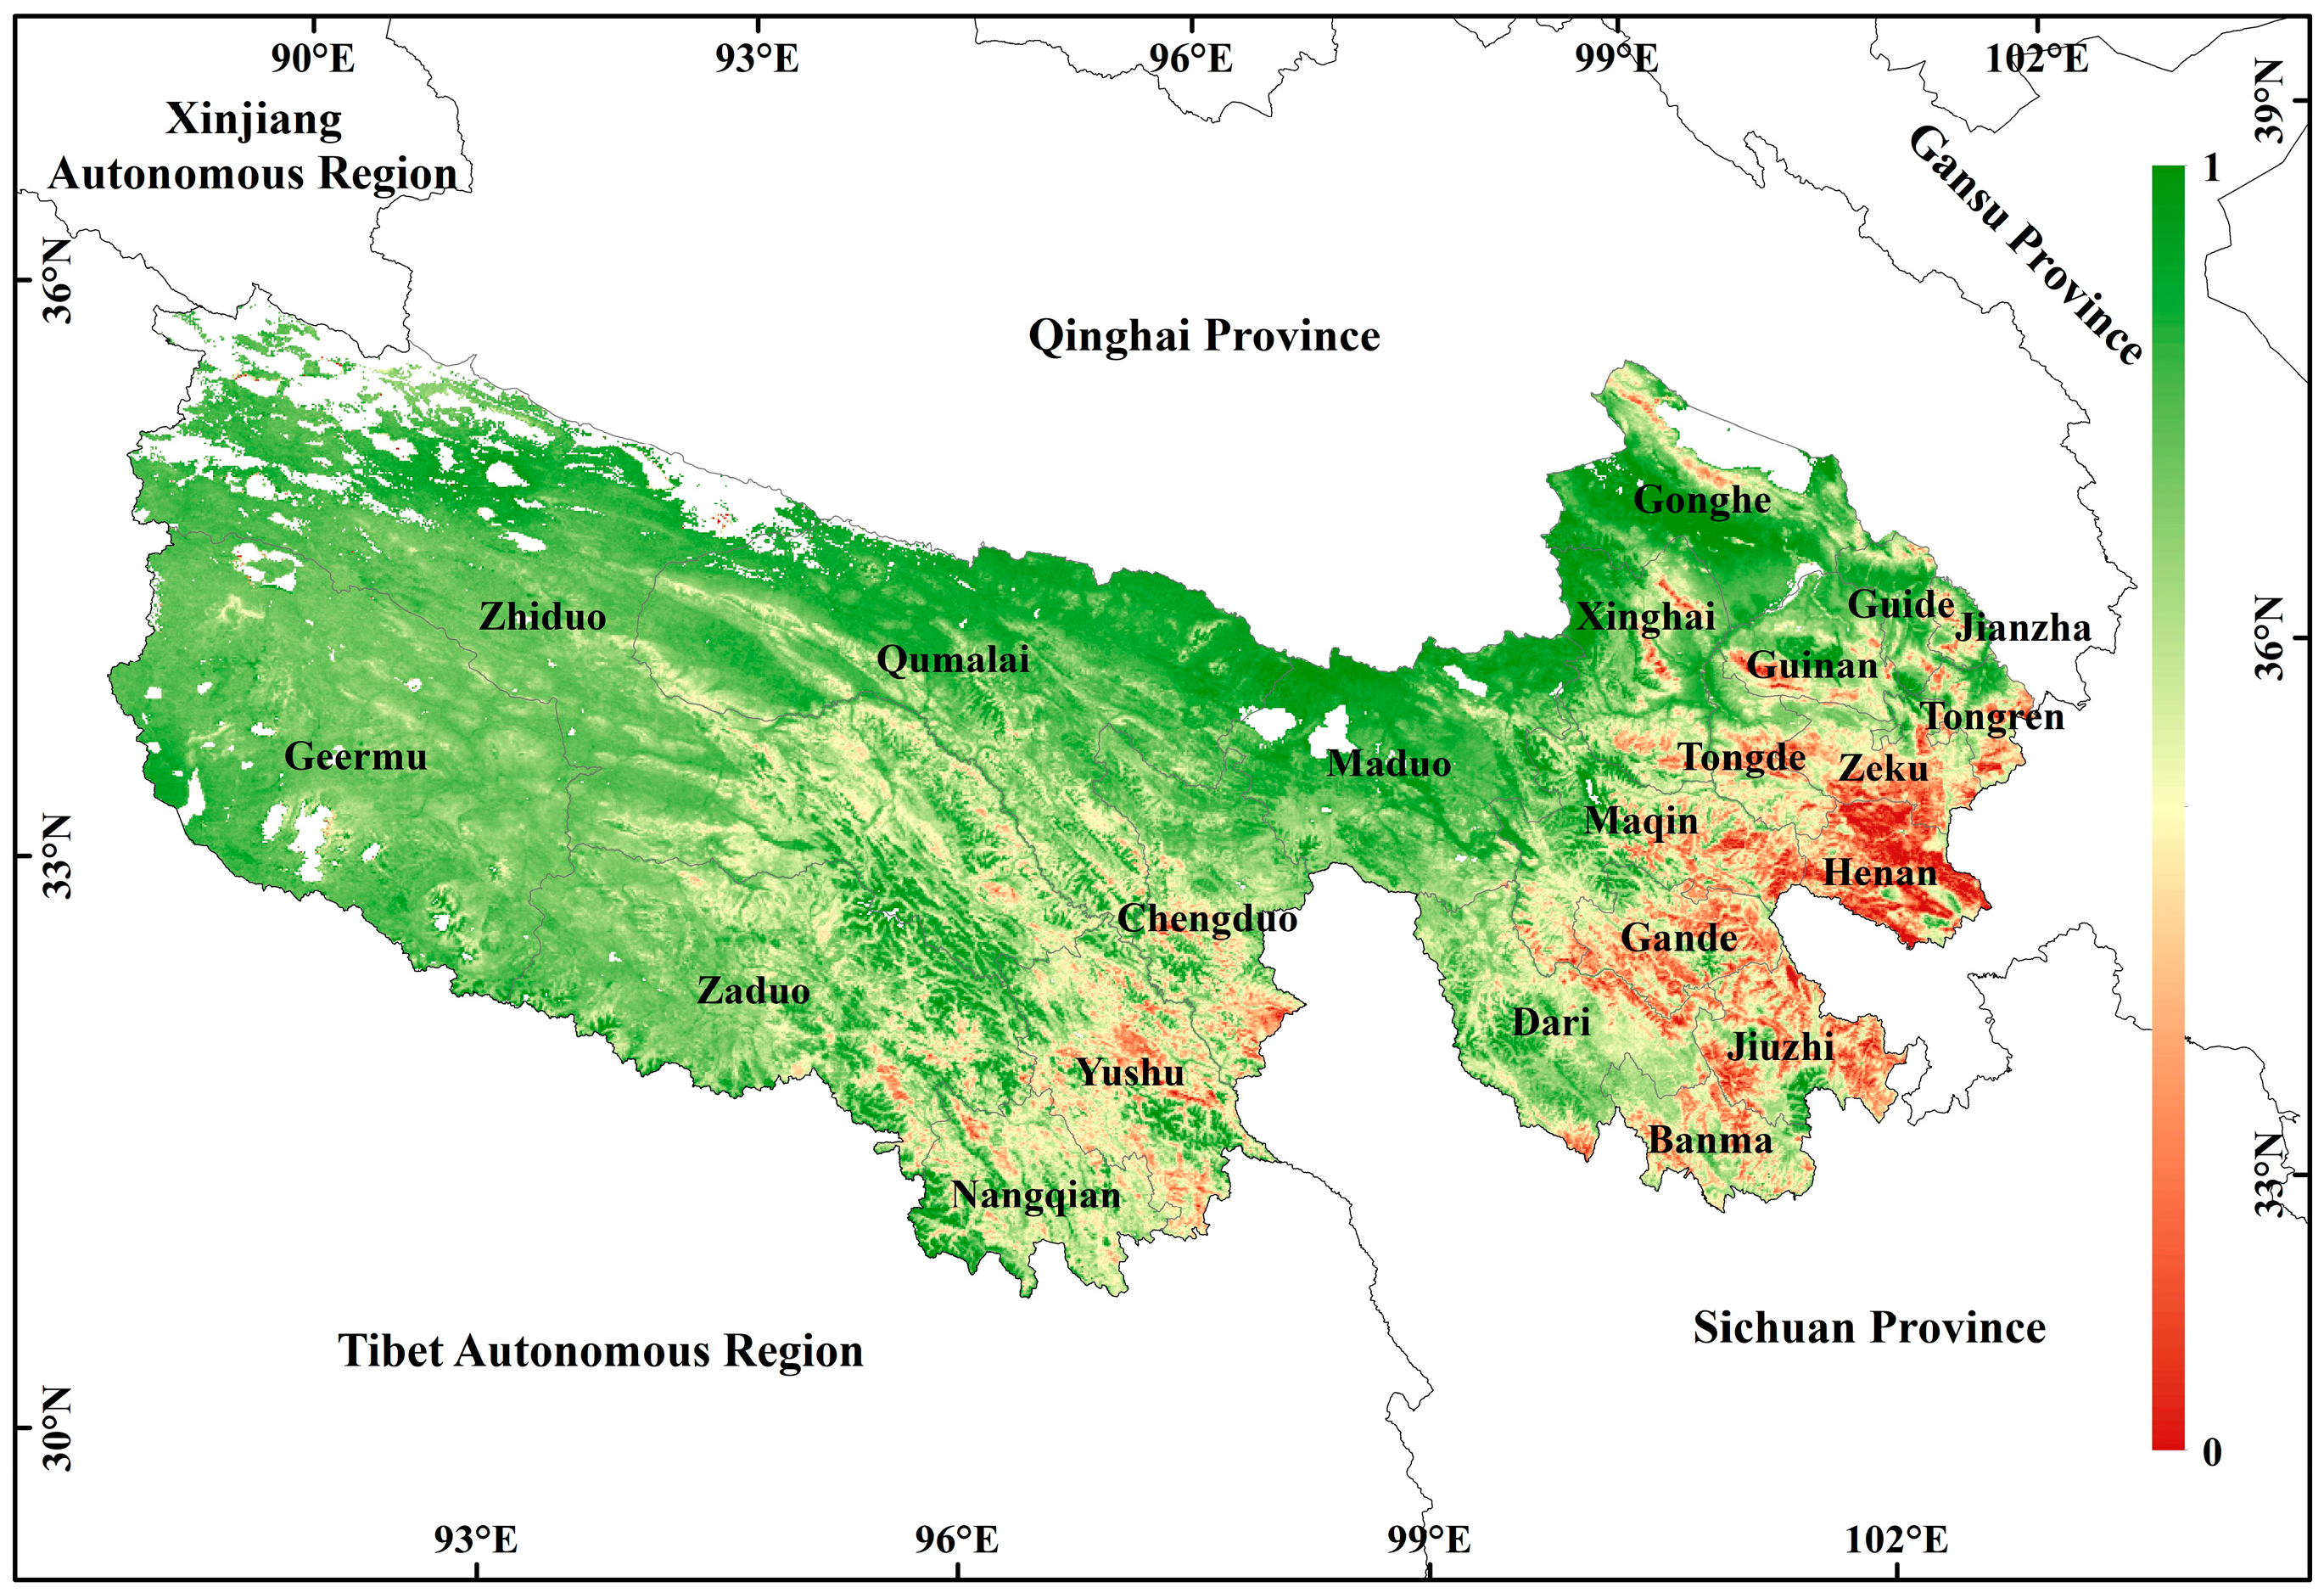
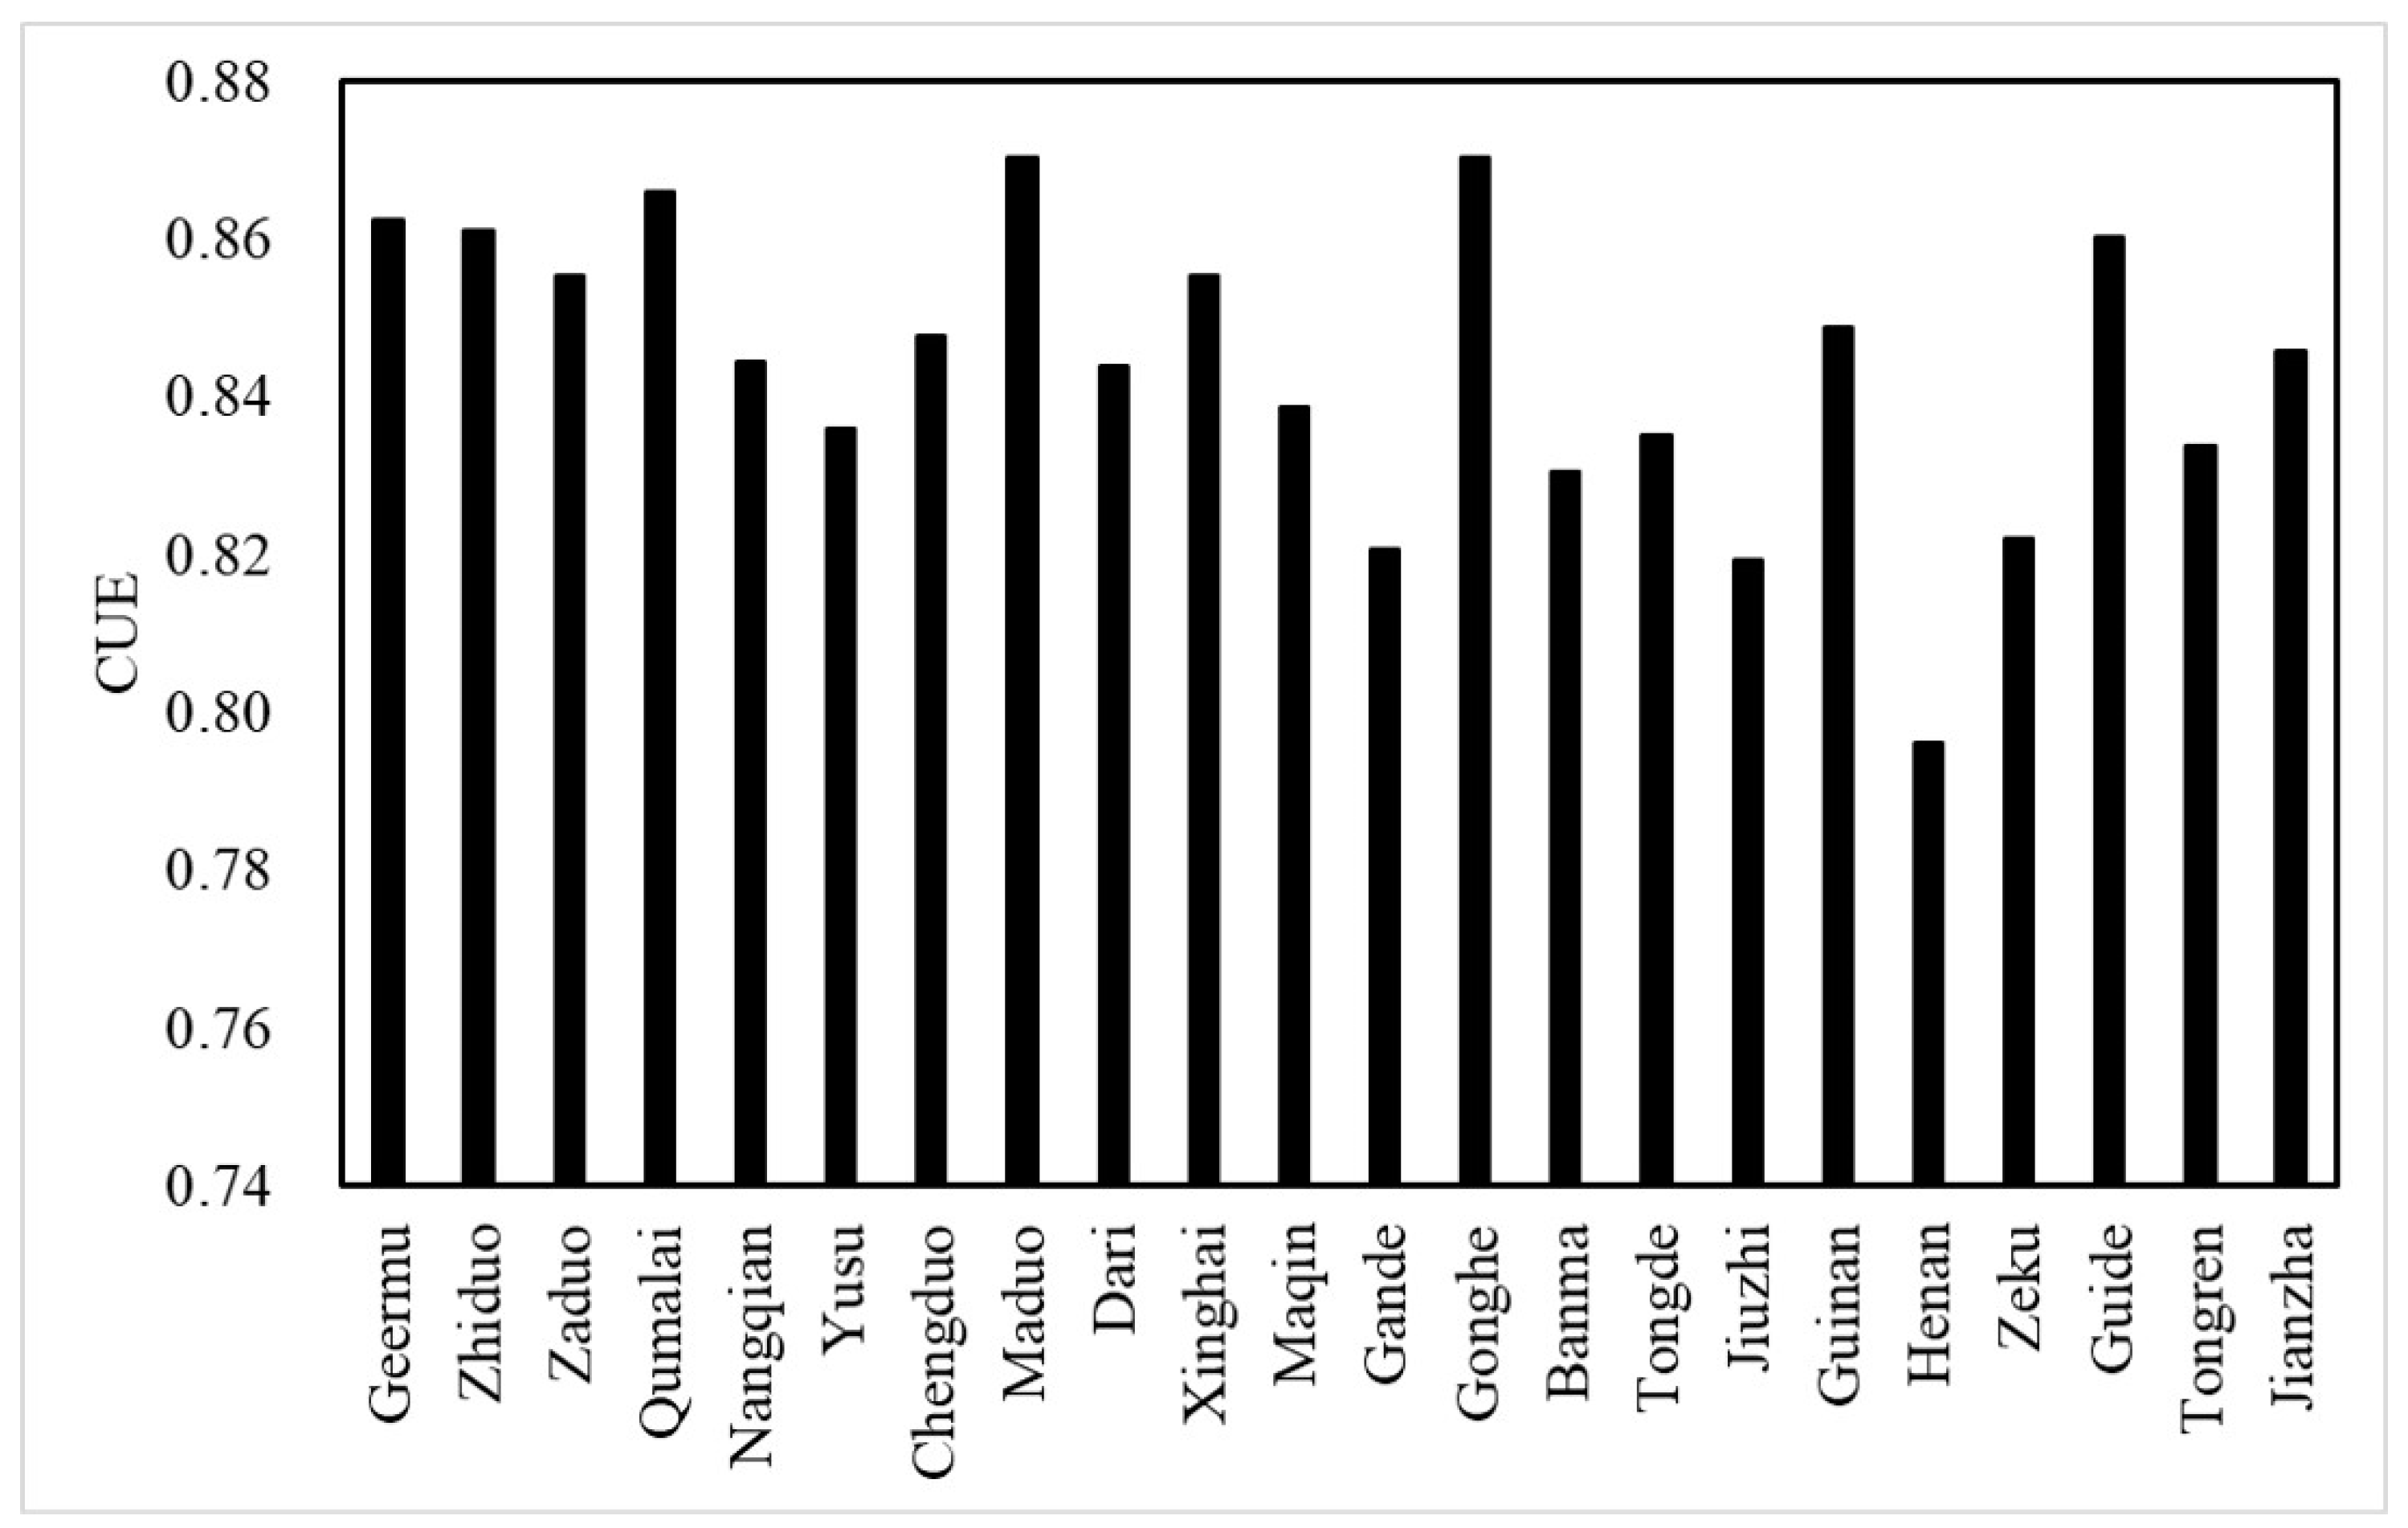
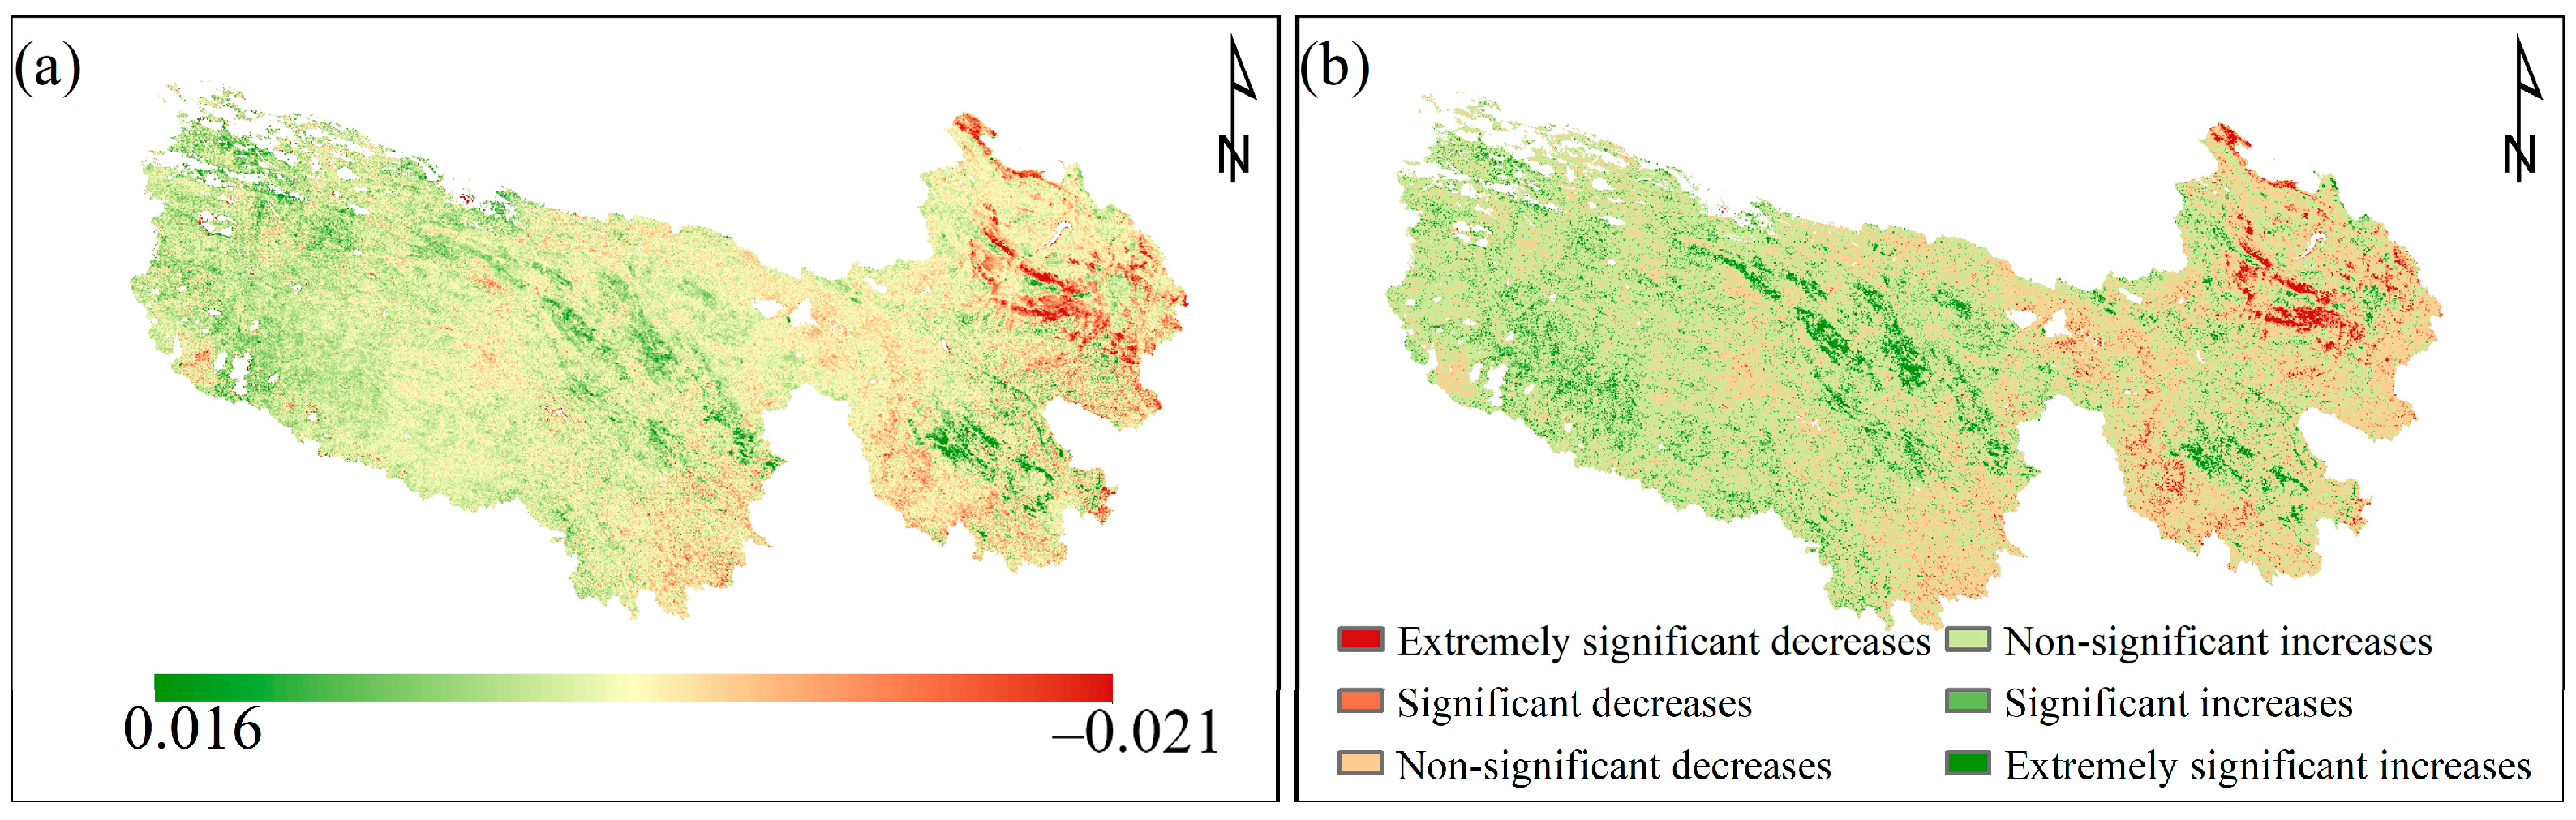
3.1. Spatial Distribution and Change of CUE

The multiannual average CUE for the whole Three Rivers Source region was calculated to be 0.8536 between 2001 and 2020. The values ranged from 0.70 to 1.00, with a standard deviation of 0.0237, as shown in Figure 1. The limited interannual variability observed in CUE underlines its pronounced annual stability. Furthermore, this stability highlights the substantial carbon sequestration capacity of the Three Rivers Source region.
Spatially, the CUE shows a distinct gradient. It increases from the south-eastern to the north-western regions of the Three Rivers Source region. Variations in CUE due to different vegetation types in the region are the main reason for such a spatial distribution. Among the 21 county-level administrative divisions in the Three Rivers Source Region, most had an average CUE above 0.8, with Henan Mongolian Autonomous County having a slightly lower value of 0.7963. In particular, CUE values were significantly elevated in the north and north-west of the eastern periphery of the Three Rivers Source region, for example, in Qumalai (0.8660), Maduo (0.8704) and Gonghe (0.8703). In contrast, regions such as Henan and Jiuzhi had relatively lower CUE values, with a recorded value of 0.8192. The north-western area including Zhiduo, which is the headwaters of the Chumar River (a vital source of water for the Yangtze River), showed a fragmented CUE distribution pattern. This variability can be attributed to several factors specific to the region, including high elevations, abundant lakes, and sparse vegetation cover, as shown in Figure 2.
As shown in Figure 3, the average annual CUE within the Three Rivers Source region varied between 0.8501 and 0.8578. Such values, which consistently exceed 0.85, mean that the vegetation in the Three Rivers Source region not only has a high CUE but also has a robust capacity for carbon sequestration. Over the two-decade period, particularly high levels of CUE were recorded in 2002 and 2017, while comparatively lower levels were recorded in 2004, 2010, and 2020. The data highlight a relatively stable CUE trajectory over the last 20 years, with a standard deviation of 0.0021 and a range of 0.0077. This stability is further underlined by the peak annual rate of change of 0.0053 (p = 0.0437) per year. However, there was a noticeable fluctuation in the CUE trend. While overall stability was maintained, there was an observable pattern of decline followed by an increase over the 20-year period.
The rate of CUE variation within the Three Rivers Source region ranges from −0.0215 to 0.0165 per year, culminating in an average decadal shift of 0.0018. Geographically, the CUE trend is decreasing in eastern zones and increasing in western zones. A remarkable 68.84% of the region, particularly in places like Geermu, Zhiduo, Qumalai, Gande, and Jiuzhi, shows an upward trend in CUE. Conversely, the eastern sectors, which include Tongde, Guinan, and Zeku, tend to show declining CUE.
Overall, the CUE trajectory of the Three Rivers Source region suggests a slow but steady growth pattern. An overwhelming 68.48% of the regions reflected an upward trend in CUE. A staggering 84.33% of regions did not reach the significance level. In addition, regions with extreme increases and decreases in CUE accounted for 3.90% and 1.19%, respectively. There were 8.48% and 2.10% of regions with significant CUE increases and decreases, respectively. Most regions, 56.46% and 27.87%, respectively, showed insignificant increases and decreases in CUE (Figure 4).

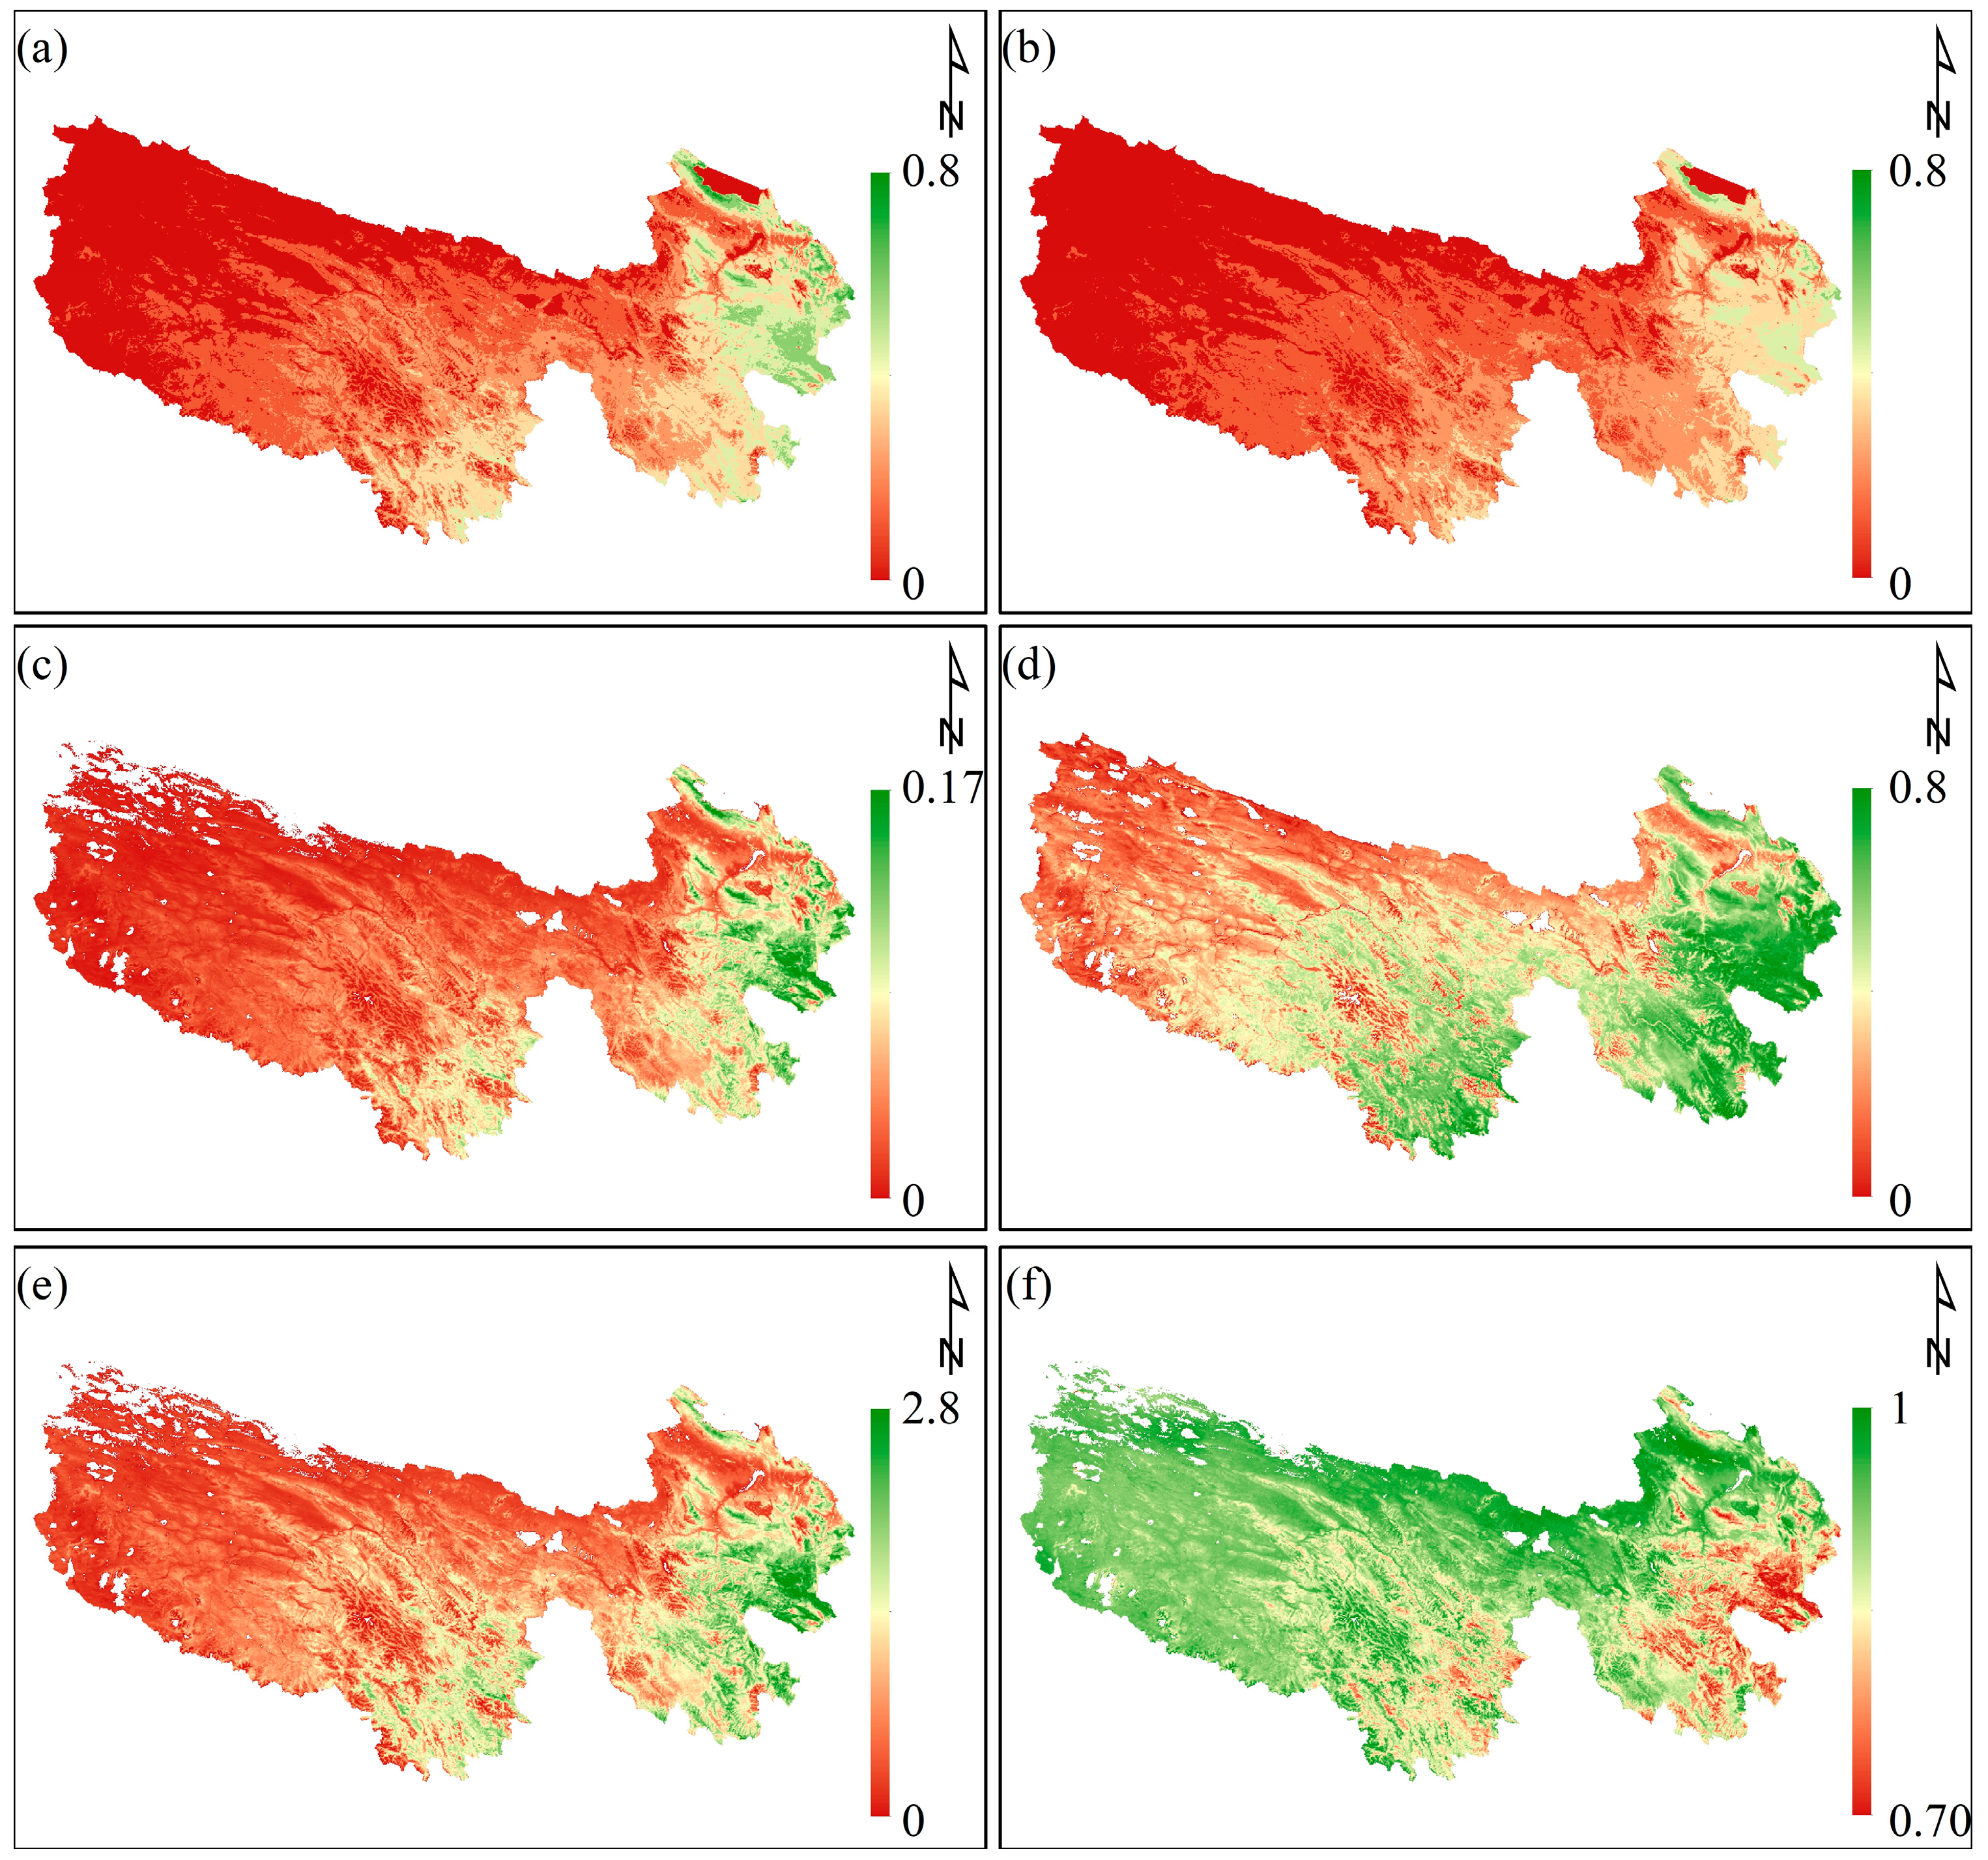
3.2. Carbon Allocation and Interannual Spatial Distribution Characteristics of Vegetation Parameters

During the period 2001 to 2020, GPP, NPP, and autotrophic respiration showed fluctuating growth with consistent trends, except for autotrophic respiration in 2012. At the same time, different growth patterns were observed for LAI and NDVI. Although there were similarities in their overall trends, there were occasional discrepancies in the inter-annual variations. The trend in autotrophic respiration closely mirrored that of LAI, with a pronounced correlation between vegetation autotrophic respiration and corresponding leaf area. This correlation highlights the interdependence and mutual influence between these vital parameters of the vegetation over the period of time studied.
The mean values for GPP, NPP, and autotrophic respiration ranged from 0 to 0.79 kg C/m2, 0 to 0.68 kg C/m2, and 0 to 0.17 kg C/m2, respectively. The mean values were 0.18 kg C/m2 for GPP, 0.16 kg C/m2 for NPP, and 0.03 kg C/m2 for autotrophic respiration. The standard deviations associated with the means are 0.1410, 0.1146, and 0.0271, respectively. These metrics highlight considerable spatial disparities and pronounced heterogeneity in vegetation productivity across the Three Rivers Source region. It is noteworthy that GPP, NPP, and autotrophic respiration exhibit analogous spatial distribution patterns within the Three Rivers Source region. However, these observed patterns differ from the spatial distribution characteristics of CUE, as shown in Figure 5. Spatially, trends in vegetation productivity and autotrophic respiration increased from north-west to south-east within the Three Rivers Source region. These trends showed a strong correlation with different altitudes.
Mean values for NDVI and LAI within the Three Rivers Source region ranged from 0 to 0.7 and 0 to 2.8, respectively. The mean values were 0.2 for NDVI and 0.35 for LAI. The corresponding standard deviations were 0.1 and 0.2. In spatial terms, both the NDVI and the LAI show a consistent increasing trend from the north-west to the south-east of the Three Rivers Source region. This observed spatial trend aligns closely and follows the distribution patterns of GPP and NPP but contrasts sharply with that of CUE. In particular, significant negative correlations can be seen between NDVI, LAI, and CUE with correlation coefficients of −0.72 and −0.86, respectively. Furthermore, the spatial patterns of LAI and autotrophic respiration showed a high degree of consistency, with a correlation coefficient of 0.94. This highlights the robust relationship between LAI and autotrophic respiration within the Three Rivers Source region.

3.3. Spatial Correlation Analysis of CUE and Climate Variability

The climate trends observed in the Three Rivers Basin are consistent with global patterns in the context of global climate change. Evapotranspiration, with a growth rate of 5.0163 mm per year, shows a particularly pronounced increase. In this study, the Pearson correlation coefficient was calculated with the objective of evaluating the relationship between CUE and climate variables. Subsequently, the significance of the correlation was evaluated through the application of the T-test. The correlation coefficients for CUE with temperature, precipitation, and evapotranspiration within the Three Rivers Source region from 2001 to 2020 ranged from −0.86 to 0.83, −0.84 to 0.85, and −0.93 to 0.89, respectively (Figure 6). Specifically, 1.12%, 2.34%, and 4.93% of the regions showed significance at the 99% confidence level for temperature, precipitation, and evapotranspiration, respectively. In addition, 4.36%, 7.01%, and 9.77% of the regions showed significance at the 95% confidence level for the respective variables. The correlation between CUE and evapotranspiration was particularly noteworthy. It surpassed the correlations with temperature and precipitation in both numerical magnitude and geographic range of significance. Significant positive correlations were clustered around Geermu, Qumalai, and Chengduo. In contrast, significant negative correlations were mainly found in the regions around Ngoring and in the areas around Tongde, Xinghai and Gonghe. Conversely, the relationship between CUE and temperature within the Three Rivers Source region appeared to be relatively weak. An overwhelming 94.52% of areas showed correlations that were neither significantly positive nor negative.
The correlation between the CUE and the climatic variables shows that there are distinct regional patterns within the Three Rivers Source area. In particular, the spatial distribution of CUE showed similarities with temperature and evapotranspiration. Positive correlations were found predominantly in the western Three Rivers Source region, while negative correlations were more common in the eastern region. Conversely, the positive correlation between CUE and precipitation was concentrated in the eastern part of the Three Rivers Source region. The western region showed mainly negative correlations. Western areas, such as Xinghai, Guinan, Tongde, Yushu, Dari, and Henan, are notable areas of reduced CUE within the Three Rivers Source region. In these areas, both significant and non-significant negative correlations were observed between CUE and the climatic variables of temperature, precipitation, and evapotranspiration. All of these variables showed an upward trend. There is a notable anomaly in certain areas of the eastern Three Rivers Source region, such as Tongde, Kuze, and Guinan, where CUE shows a significant negative correlation with precipitation. Interestingly, neighboring regions characterized by similar vegetation types, altitudes, temperatures, and other environmental conditions show a strong and contrasting correlation. This nuanced pattern suggests an increased sensitivity of the steppe CUE to evapotranspiration variations within these specific zones of the eastern Three Rivers Source region.

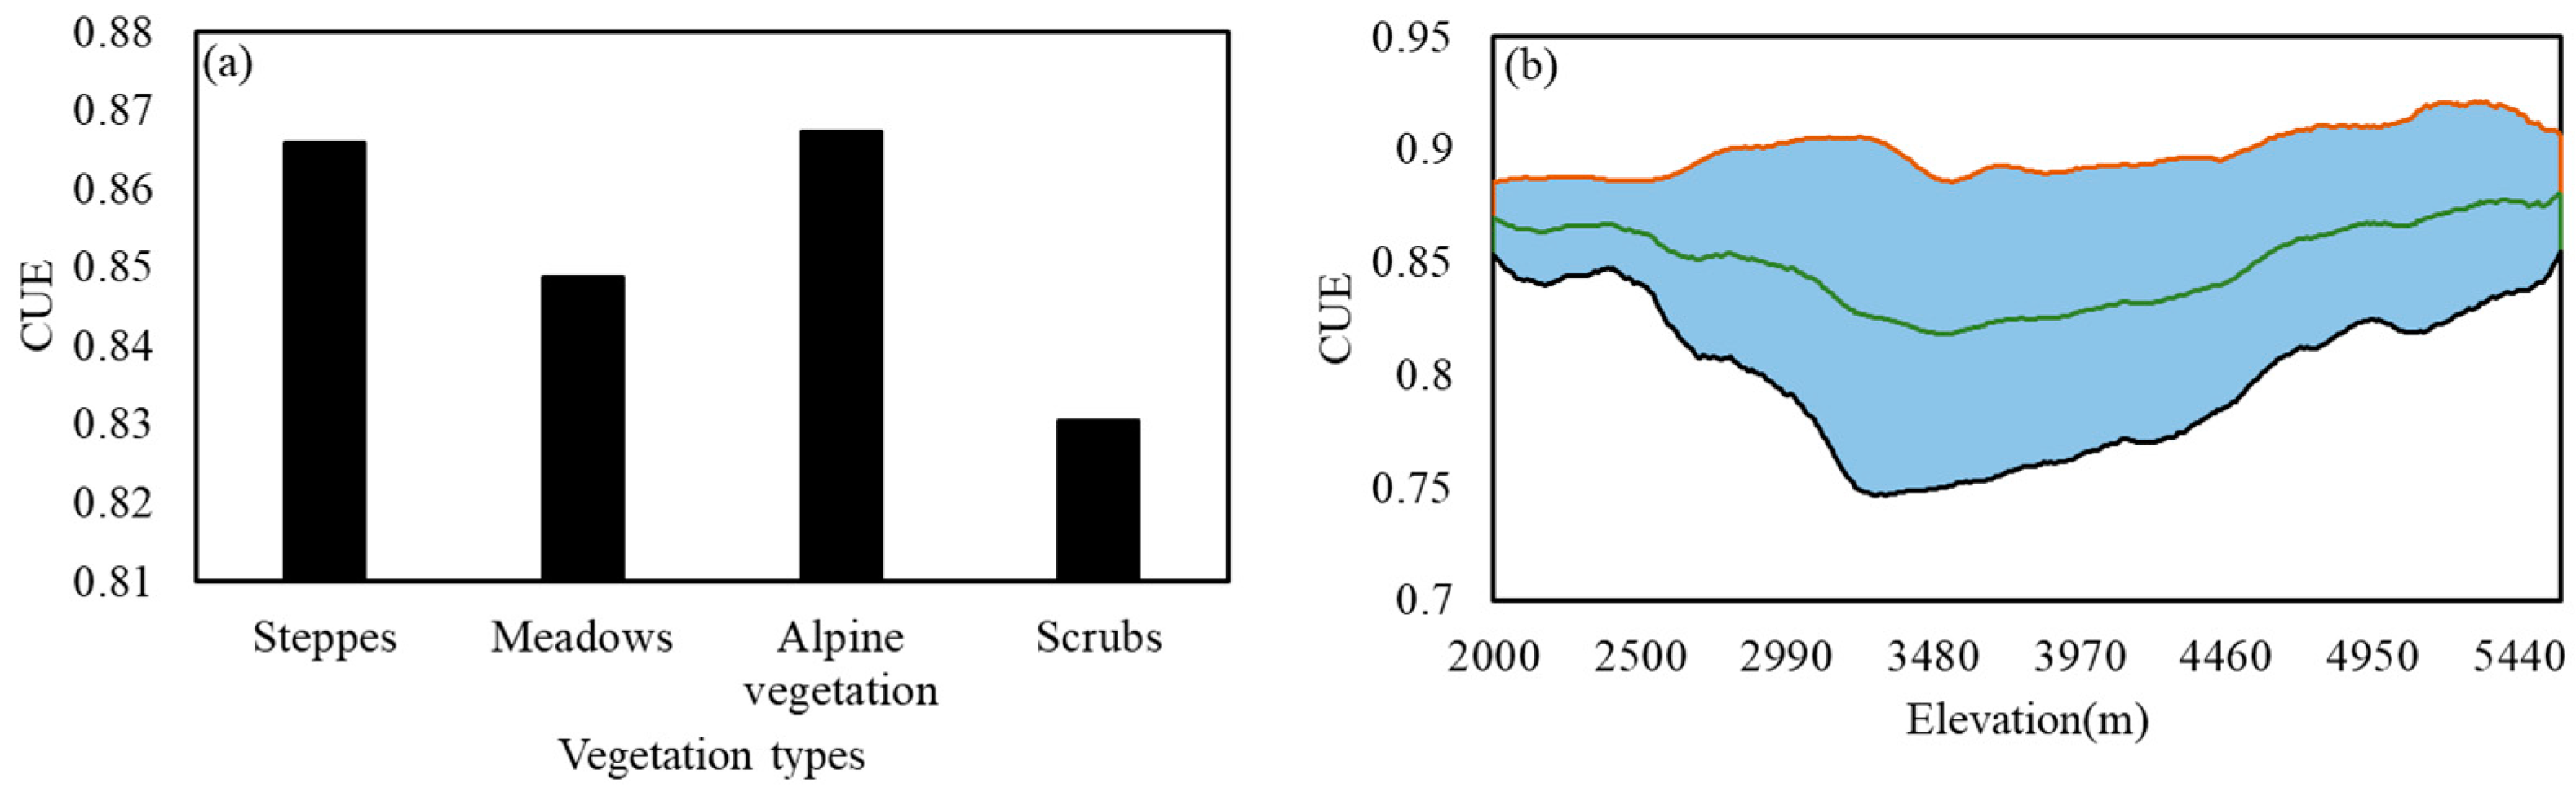
3.4. Impact of Vegetation Types and Elevation Changes on CUE

The Three Rivers Source region is a quintessential high-altitude region in China, located in the south-eastern expanse of the Qinghai-Tibet Plateau. The altitudes in this area range from 1960 m to 6520 m, with an overwhelming 92.14% of the area falling between 3500 m and 5500 m. The vegetation within the TRSR can be broadly classified into six different categories: alpine vegetation, steppes, meadows, forests, scrubs, and crops. In particular, steppes, meadows, alpine vegetation, and scrubs dominated the landscape. They accounted for about 22.31%, 56.89%, 10.16%, and 6.15% of the total vegetated area, respectively (Figure 7).
In view of the key role of vegetation in the modulation of carbon sequestration capacity, its influence on CUE is essential. CUE dynamics are significantly influenced by structural differences in vegetation and its response to climatic changes. In terms of carbon sequestration capacity, the vegetation types are ranked from highest to lowest (Figure 8a): alpine vegetation (0.8673), steppes (0.8658), meadows (0.8488), and scrubs (0.8305). A nuanced pattern is revealed as the elevation gradient interacts with the CUE dynamics. Specifically, CUE demonstrates an initial decline followed by an ascent concerning elevations. Below 3500 m, increases in elevation correlate with decreases in CUE, whereas between 3500 m and 6520 m, increases in elevation correlate with increases in CUE (Figure 8b). A clear pattern emerges when vegetation types are juxtaposed with CUE variations across altitudes. Steppes, meadows, and shrublands show a congruent trend, with an initial decrease in CUE followed by an increase. In contrast, alpine vegetation shows a unidirectional increase in CUE, consistent with its distribution mainly above the 3500 m threshold.

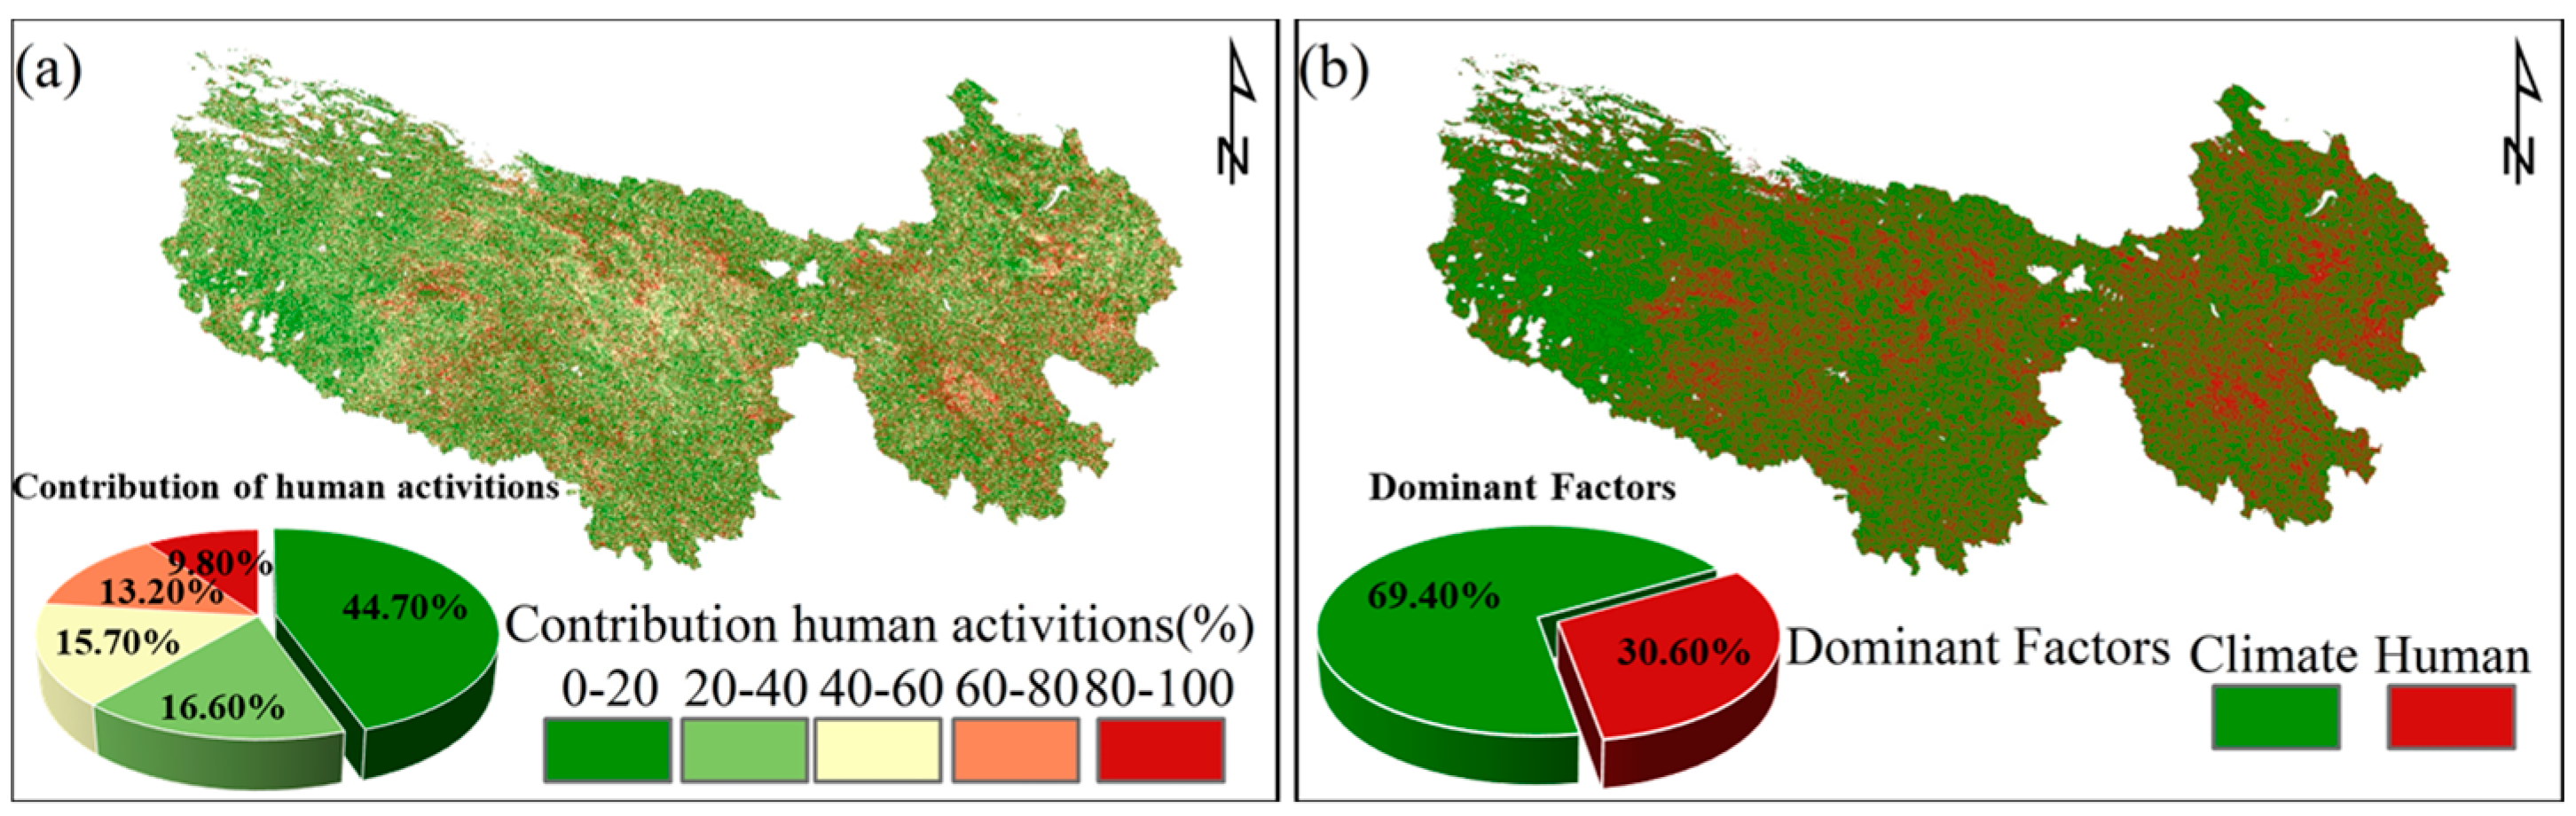
3.5. Contribution of Climate Change and Ecological Engineering to CUE

In the course of the Three Rivers Source ecological conservation project, both ecological engineering and climate change were identified as key drivers of CUE dynamics. The weighted average statistics derived from the contribution calculation results of each pixel revealed that their respective contributions to the CUE were 30.88% and 69.12%. Specifically, the regions in which CUE is correlated with climatic changes cover about 90.20% of the area of the Three Rivers Source region. This compares to 55.30% of CUE influenced by ecological engineering. Looking more closely at the magnitude of these contributions, about 44.70% of the Three Rivers Source region manifests a robust influence of climate change on CUE variations, exceeding the 80% threshold. At the same time, the impact of ecological technology on CUE exceeds 80% in around 9.80% of the region (Figure 9b). These figures underline a predominant influence of climate change over ecological engineering in shaping CUE variation in most areas of the Three Rivers Source region.
Furthermore, when looking at areas where one factor was the dominant influence on CUE, some 69.40% of the region was more strongly influenced by climate change. This was characterized by contributions of more than 50%. These zones are mainly located around the ordinary protected areas and key protected areas of the Three Rivers Source region. Conversely, ecological engineering had a dominant influence on CUE variation in about 30.60% of the region (Figure 9b). This was mainly concentrated in key protected areas, such as Suojiaquma, Dangqu, and the Maixiu Protected Area.

4. Discussion

4.1. Effects of Vegetation on CUE

The results of our study are consistent with the observations of Chen and Yu [22], particularly with regard to CUE trends in relation to latitude and longitude. Their study described an initial increase in CUE, followed by a decrease with increasing latitude. There was also a decreasing trend in CUE from west to east over the entire longitude. The results of our study have been corroborated by global studies looking at how CUE varies.
It is nevertheless essential to acknowledge that a number of variables are involved in the formation of CUE. These include longitude, latitude, altitude, climatic conditions, the status of vegetation growth, and specific vegetation types, among other factors. The relationship between vegetation CUE and its growth status is of significant consequence. The analysis of key metrics, including GPP, NPP, autotrophic respiration, LAI, and NDVI, provides invaluable insights into the state of vegetation growth. A nuanced understanding of the temporal trajectories and spatial distributions of these ecosystems enhances our comprehension of the carbon dynamics that occur within them.
Our research revealed an intriguing pattern, whereby the spatial distribution of LAI is closely aligned with that of autotrophic respiration. This observation indicates the possibility of a correlation between plant autotrophic respiration and LAI. As illustrated in Figure 5, there is a positive correlation between LAI and GPP of vegetation. Nevertheless, the CUE is observed to decline as the LAI increases. This indicated that an increase in leaf area necessitated greater energy input to sustain essential plant life activities. This was particularly the case in alpine regions, where the higher energy demands of vegetation resulted in a reduction in CUE. Previous studies have shown that plant autotrophic respiration is related to biomass. In China, regions situated at high altitudes display a higher mass-specific respiration rate in comparison to other regions. This finding may provide an explanation for the negative correlation between LAI and CUE observed in the Three Rivers Source Region [34].
The diverse characteristics inherent to different vegetation types, including variations in light energy absorption, water utilization efficiency, nutrient uptake, growth cycles, and phenological attributes, contribute to distinct CUE under varying climatic regimes [45,46,47]. Our findings highlighted the significant impact of vegetation types on CUE variations. The CUE efficiency was found to decline in the following descending order: alpine vegetation, steppes, meadows, and scrubs. The eastern and southern sectors of the Three Rivers Source region are predominantly characterized by meadows and scrubs, with meadows being notably widespread. A nuanced spatial heterogeneity was observed in the south-eastern Three Rivers Source region, where meadows exhibited negative correlations with temperature, precipitation, and evapotranspiration. In contrast, the data from the north-western regions indicated a positive correlation. The data indicated that shrubs in the northern Three Rivers Source region exhibited positive correlations with temperature, precipitation, and evapotranspiration. In contrast, their southern counterparts demonstrated consistent negative correlations. The steppes, concentrated in the northern expanse of the Three Rivers Source region, exhibited a gradient of correlations. In particular, the correlations between temperature and precipitation exhibited a notable shift from positive in the western regions to negative in the eastern zones. Moreover, the correlation between steppes and precipitation exhibited a shift from a positive association in the northern regions to a negative one in the southern areas. The distribution of alpine vegetation, which is mainly found in the high-altitude areas of the western Three Rivers Source region, exhibited disparate correlation patterns with a range of climate variables. The data indicated a positive correlation with temperature, a negative correlation with precipitation, and a positive correlation with evapotranspiration. A comprehensive analysis of climatic trends over two decades was conducted, with a particular focus on the comparison between these trends and the spatial distribution patterns of vegetation, as well as their responsiveness to climatic shifts. This analysis revealed that differential vegetation responses to climatic variations have resulted in the creation of spatial heterogeneities in CUE across the Three Rivers Source region.

4.2. Influence of Climatic Factors on CUE Dynamics

The relationship between climatic factors and CUE has been the subject of extensive study, which has revealed complex interactions that influence GPP and NPP across a range of scales [48,49,50]. The results of our study demonstrate that temperature and precipitation exert a pronounced influence on CUE in the Three Rivers Source region.
The impact of temperature fluctuations on CUE is contingent upon the thermal context of the region in question [51]. In warmer climates, an increase in temperature results in elevated respiratory costs, which, in turn, lead to a reduction in productivity and storage efficiency. This phenomenon is reflected in a decline in CUE as temperatures rises [52,53]. Conversely, in regions with lower temperatures, the energy required to maintain living tissues is reduced, resulting in decreased respiratory costs and elevated CUE [17]. It is interesting to note that our data indicated a significant reduction in autotrophic respiration even in colder environments with temperature increases [54,55]. This suggested a more complex response that could have resulted in an extension of the growing season and an increase in GPP, thereby enhancing CUE [56,57]. Our findings indicate that altitude exerts a pivotal influence on CUE. We observed that at higher altitudes, where temperatures are typically lower, there is an increase in CUE values [51,58]. This finding is significant in the context of global warming, where alpine regions may become critical carbon sinks due to their higher CUE.
Furthermore, precipitation exerts a significant influence on CUE. It was observed that there was an inverse relationship between CUE and precipitation levels in the Three Rivers Source region. This finding was consistent with the results of global analyses, which demonstrated a decline in CUE with increasing precipitation, particularly in areas with initially low precipitation rates [25,51,58,59]. As precipitation increases, several factors, such as soil oxygen availability, root respiration, and cloud cover dynamics, contribute to this decline in CUE. In regions with cooler and drier climates, the combined impact of temperature and precipitation on CUE is more significant, underscoring the pivotal role of precipitation in shaping CUE dynamics [22].
Evapotranspiration, which encompasses both soil evaporation and plant transpiration, emerges as a pivotal determinant influencing CUE [60,61,62,63,64]. The results demonstrated a positive correlation between augmented evapotranspiration rates and augmented gross ecosystem productivity. This lends support to the notion that elevated transpiration rates facilitate enhanced carbon dioxide uptake by vegetation. This relationship is mediated by stomatal activities [27,28], whereby increased transpiration results in larger and longer stomatal openings, thereby facilitating greater carbon sequestration [65]. As a direct consequence, a significant rise in CUE was observed in conjunction with rising evapotranspiration levels. This finding lends further support to the hypothesis that there is a positive feedback mechanism between transpiration and productivity.
In conclusion, our study emphasizes the complex relationship between climatic variables and CUE in the Three Rivers Source region, demonstrating the substantial influence of temperature, precipitation, and evapotranspiration. The findings of our study offer significant insights into the influence of regional climate change on carbon dynamics, emphasizing the pivotal role of evapotranspiration in shaping alterations in CUE.

4.3. Ecological Engineering’s Impact on CUE

It is imperative to recognize the pivotal role of ecological engineering in bolstering vegetation health and, by extension, enhancing CUE. The primary objective of ecological engineering is to enhance surface vegetation coverage while reducing the necessity for human intervention, with the ultimate objective of improving vegetation vitality. A review of historical data from the Three Rivers Source region reveals evidence of vegetation degradation occurring during the late 20th century. This decline was attributed to the combined effects of climatic changes and human activities, which have exerted a significant impact on the region’s ecosystems. During this phase, CUE exhibited a notable decline, with a rate of change of −0.0022 per decade. However, a paradigm shift was discernible post-2005, marked by the systematic implementation of diverse ecological restoration interventions within the Three Rivers Source region. This strategic endeavor has resulted in a noteworthy resurgence in CUE, with a positive trend emerging at a rate of 0.0027 per decade.
Ecological engineering has been demonstrated to be an effective technique for enhancing vegetation growth and increasing carbon sequestration capabilities, as evidenced by the findings of Tong et al. [66]. It follows that the revitalization of vegetation inevitably results in enhanced productivity, with CUE dynamics defined by a complex interplay of multiple factors. The research insights from the colder regions of the Qinghai-Tibet Plateau indicated that the metabolic demands of the vegetation were relatively subdued. Consequently, the NPP growth trajectory was observed to exceed that of the GPP. This dynamic ultimately results in an increase in CUE, as demonstrated by Peng et al. [67]. In contrast, in warmer terrains, the autotrophic respiration growth trajectory is the dominant process, outstripping that of vegetation productivity. This results in a contrasting CUE paradigm [68]. Further evidence from Akihiko [58] corroborates the hypothesis that autotrophic respiration is subject to modulation compared to biomass. This emphasizes the adaptive modulation of respiration in ecosystems where resources are limited. Our empirical findings are in accordance with the existing literature, indicating that CUE is typically higher in frigid regions compared to their warmer counterparts. Following the implementation of ecological engineering interventions, a notable increase in regional vegetation biomass is observed, accompanied by a reduction in autotrophic respiration. It is of particular significance to note that this transformation was underpinned by a considerable increase in CUE. This lends support to the hypothesis that ecological engineering played a pivotal role in fostering favorable CUE dynamics within the Three Rivers Source region.

4.4. Uncertainty

In this study, we made use of residual analysis to assess the impact of human activities on the CUE. Although this method is widely used and effective in environmental research, it has inherent limitations. We acknowledged data limitations. Our study covered 20 years, whereas the World Meteorological Organization recommends a minimum of 30 years for climate trend analysis. Despite these limitations, we continue to learn more. To enhance the rigor and reliability of future studies, it is recommended that different analytical methods be integrated and that higher-quality data be employed. This would facilitate a comprehensive evaluation of the impact of human activities on ecosystems.

5. Conclusions

The Three Rivers Source region demonstrated a noteworthy capacity for carbon sequestration, with an average CUE of 0.8536 and relatively stable annual CUE, exhibiting only minor fluctuations. A notable shift in CUE trajectories was observed following the commencement of the ecological conservation project in 2005, underscoring the pivotal role of ecological engineering. The changes in CUE observed in the Three Rivers Source region were driven by both ecological engineering and climate change. In particular, ecological engineering was found to account for 30.88% of the CUE dynamics, while climate change was identified as a more significant driver, accounting for 69.12% of the CUE dynamics. Among the climatic factors, such as temperature, precipitation, and evapotranspiration, evapotranspiration was identified as the key driver of CUE variability, with precipitation being secondary. Although temperature also had an impact, its influence on CUE dynamics in the region was relatively minor.

Author Contributions

Conceptualization, J.C. and Y.L.; data curation, Y.L., H.D. and J.P.; formal analysis, Y.L. and H.D.; funding acquisition, J.C., D.T. and S.W.; methodology, X.G., S.W., J.C. and Y.L.; software, Y.L. and J.P.; supervision, D.T. and S.W.; visualization, J.P.; writing—original draft, Y.L., X.G. and J.C.; writing—review and editing, X.G., J.C., D.T. and S.W. All authors have read and agreed to the published version of the manuscript.

Funding

This research was funded by Chongqing Municipal Bureau of Water Resource (5000002021BF40001), the National Natural Science Foundation of China (No. 42371071, 42061015), Water Resources Bureau of Chongqing Municipal (CQS23C01036).

Data Availability Statement

Vegetation parameters and PML-V2 used in this paper can be downloaded from Google Earth Engine. The Climate data can be collected from National Tibetan Plateau/Third Pole Environment Data Center (https://data.tpdc.ac.cn/, accessed on 7 January 2023). The SRTM V3 data were obtained from the “Environmental & Ecological Science Data Center for West China, National Natural Science Foundation of China” (http://westdc.westgis.ac.cn, accessed on 5 January 2023).

Conflicts of Interest

The authors declare that the research was conducted in the absence of any commercial or financial relationships that could be construed as a potential conflict of interest.

References

  1. Valentini, R.; Matteucci, G.; Dolman, A.; Schulze, E.; Rebmann, C.; Moors, E.; Granier, A.; Gross, P.; Jensen, N.; Pilegaard, K.; et al. Respiration as the main determinant of carbon balance in European forests. Nature 2000, 404, 861–865. [Google Scholar] [CrossRef]
  2. Gifford, R. Plant respiration in productivity models: Conceptualisation, representation and issues for global terrestrial carbon-cycle research. Funct. Plant Biol. 2003, 30, 171–186. [Google Scholar] [CrossRef]
  3. Manzoni, S.; Taylor, P.; Richter, A.; Porporato, A.; Ågren, G. Environmental and stoichiometric controls on microbial carbon-use efficiency in soils. New Phytol. 2012, 196, 79–91. [Google Scholar] [CrossRef] [PubMed]
  4. Campioli, M.; Vicca, S.; Luyssaert, S.; Bilcke, J.; Ceschia, E.; Chapin, F.; Ciais, P.; Fernández-Martínez, M.; Malhi, Y.; Obersteiner, M.; et al. Biomass production efficiency controlled by management in temperate and boreal ecosystems. Nat. Geosci. 2015, 8, 843–846. [Google Scholar] [CrossRef]
  5. Falkowski, P.; Scholes, R.; Boyle, E.; Canadell, J.; Canfield, D.; Elser, J.; Gruber, N.; Hibbard, K.; Högberg, P.; Linder, A.; et al. The global carbon cycle: A test of our knowledge of earth as a system. Science 2000, 290, 291–296. [Google Scholar] [CrossRef] [PubMed]
  6. IPCC. Climate Change 2013: The physical science basis. In Contribution of Working Group I to the Fifth Assessment Report of the Intergovernmental Panel on Climate Change; Stocker, T., Qin, D., Plattner, G., Tignor, M., Allen, S., Boschung, J., Nauels, A., Xia, Y., Bex, V., Midgley, P., et al., Eds.; Cambridge University Press: Cambridge, UK, 2013; pp. 33–115. [Google Scholar]
  7. Ise, T.; Litton, C.; Giardina, C.; Ito, A. Comparison of modeling approaches for carbon partitioning: Impact on estimates of global net primary production and equilibrium biomass of woody vegetation from MODIS GPP. J. Geophys. Res. Biogeosciences 2010, 115, G04025. [Google Scholar] [CrossRef]
  8. Schimel, D.; Pavlick, R.; Fisher, J.; Asner, G.; Saatchi, S.; Townsend, P.; Miller, C.; Frankenberg, C.; Hibbard, K.; Cox, P. Observing terrestrial ecosystems and the carbon cycle from space. Glob. Change Biol. 2015, 21, 1762–1776. [Google Scholar] [CrossRef] [PubMed]
  9. Lu, F.; Hu, H.; Sun, W.; Zhu, J.; Liu, G.; Zhou, W.; Zhang, Q.; Shi, P.; Liu, X.; Wu, X.; et al. Effects of national ecological restoration projects on carbon sequestration in China from 2001 to 2010. Proc. Natl. Acad. Sci. USA 2018, 115, 4039–4044. [Google Scholar] [CrossRef]
  10. Hou, J.; Du, L.; Liu, K.; Hu, Y.; Zhu, Y. Characteristics of vegetation activity and its responses to climate change in desert/grassland biome transition zones in the last 30 years based on GIMMS3g. Theor. Appl. Climatol. 2019, 136, 915–928. [Google Scholar] [CrossRef]
  11. Chen, C.; Park, T.; Wang, X.; Piao, S.; Xu, B.; Chaturvedi, R.; Fuch, R.; Brovkin, V.; Ciais, P.; Fensholt, R.; et al. China and India lead in greening of the world through land-use management. Nat. Sustain. 2019, 2, 122–129. [Google Scholar] [CrossRef]
  12. Gifford, R. The global carbon cycle: A viewpoint on the missing sink. Funct. Plant Biol. 1994, 21, 1–15. [Google Scholar] [CrossRef]
  13. Gifford, R. Whole plant respiration and photosynthesis of wheat under increased CO2 concentration and temperature: Long-term vs. short-term distinctions for modelling. Glob. Chang. Biol. 1995, 1, 385–396. [Google Scholar] [CrossRef]
  14. Dewar, R.; Medlyn, B.; Mcmurtrie, R. A mechanistic analysis of light and carbon use efficiencies. Plant Cell Environ. 1998, 21, 573–588. [Google Scholar] [CrossRef]
  15. Medlyn, B.; Dewar, R. Comment on the article by R.H. Waring, J.J. Landsberg and M. Williams relating net primary production to gross primary production. Tree Physiol. 1999, 19, 137–138. [Google Scholar] [CrossRef]
  16. De Lucia, E.; Drake, J.; Thomas, R.; Gonzalez-Meler, M. Forest carbon use efficiency: Is respiration a constant fraction of gross primary production? Glob. Chang. Biol. 2007, 13, 1157–1167. [Google Scholar] [CrossRef]
  17. Ryan, M.; Lavigne, M.; Gower, S. Annual carbon cost of autotrophic respiration in boreal forest ecosystems in relation to species and climate. J. Geophys. Res. Atmos. 1997, 102, 28871–28883. [Google Scholar] [CrossRef]
  18. Amthor, J. The McCree–de Wit–Penning de Vries–Thornley respiration paradigms: 30 years later. Ann. Bot. 2000, 86, 1–20. [Google Scholar] [CrossRef]
  19. Cheng, W.; Sims, D.; Luo, Y.; Coleman, J.; Johnson, D. Photosynthesis, respiration, and net primary production of sunflower stands in ambient and elevated atmospheric CO2 concentrations: An invariant NPP: GPP ratio? Glob. Change Biol. 2000, 6, 931–941. [Google Scholar] [CrossRef]
  20. Giardina, C.; Ryan, M.; Binkley, D.; Fownes, J. Primary production and carbon allocation in relation to nutrient supply in a tropical experimental forest. Glob. Change Biol. 2003, 9, 1438–1450. [Google Scholar] [CrossRef]
  21. Yang, Y.; Wang, Z.; Li, J.; Gang, C.; Zhang, Y.; Odeh, I.; Qi, J. Assessing the spatiotemporal dynamic of global grassland carbon use efficiency in response to climate change from 2000 to 2013. Acta Oecologica 2017, 81, 22–31. [Google Scholar] [CrossRef]
  22. Chen, Z.; Yu, G. Spatial variations and controls of carbon use efficiency in China’s terrestrial ecosystems. Sci. Rep. 2019, 9, 19516. [Google Scholar] [CrossRef] [PubMed]
  23. Law, B.; Turner, D.; Campbell, J.; Sun, O.; Van Tuyl, S.; Ritts, W.; Cohen, W. Disturbance and climate effects on carbon stocks and fluxes across Western Oregon USA. Glob. Chang. Biol. 2004, 10, 1429–1444. [Google Scholar] [CrossRef]
  24. Metcalfe, D.; Meir, P.; Aragão, L.; Lobo-do-Vale, R.; Galbraith, D.; Fisher, R.; Chaves, M.; Maroco, J.; Costa, A.; Almeida, S.; et al. Shifts in plant respiration and carbon use efficiency at a large-scale drought experiment in the eastern Amazon. New Phytol. 2010, 187, 608–621. [Google Scholar] [CrossRef] [PubMed]
  25. He, Y.; Piao, S.; Li, X.; Chen, A.; Qin, D. Global patterns of vegetation carbon use efficiency and their climate drivers deduced from MODIS satellite data and process-based models. Agric. For. Meteorol. 2018, 256, 150–158. [Google Scholar] [CrossRef]
  26. Du, L.; Gong, F.; Zeng, Y.; Ma, L.; Qiao, C.; Wu, H. Carbon use efficiency of terrestrial ecosystems in desert/grassland biome transition zone: A case in Ningxia province, northwest China. Ecol. Indic. 2020, 120, 106971. [Google Scholar] [CrossRef]
  27. Van Rooyen, N.; Van Rooyen, M.; Theron, G.; Grobbelaar, N. The vegetation of the Roodeplaat Dam Nature Reserve. VI. Photosynthesis and transpiration in woody plants with special reference to an evergreen tree Olea europaea subsp. africana. South Afr. J. Bot. 1986, 52, 301–308. [Google Scholar] [CrossRef]
  28. Boegh, E.; Soegaard, H.; Broge, N.; Hasager, C.; Jensen, N.; Schelde, K.; Thomsen, A. Airborne multispectral data for quantifying leaf area index, nitrogen concentration, and photosynthetic efficiency in agriculture. Remote Sens. Environ. 2002, 81, 179–193. [Google Scholar] [CrossRef]
  29. Shao, Q.; Cao, W.; Fan, J.; Huang, L.; Xu, X. Effects of an ecological conservation and restoration project in the Three-River Source Region, China. J. Geogr. Sci. 2017, 27, 183–204. [Google Scholar] [CrossRef]
  30. Tang, X.; Liu, D.; Song, K.; Munger, J.; Zhang, B.; Wang, Z. A new model of net ecosystem carbon exchange for the deciduous-dominated forest by integrating MODIS and flux data. Ecol. Eng. 2011, 37, 1567–1571. [Google Scholar] [CrossRef]
  31. Fu, G.; Sun, W.; Yu, C.; Zhang, X.; Shen, Z.; Li, Y.; Yang, P.; Zhou, N. Clip** alters the response of biomass production to experimental warming: A case study in an alpine meadow on the Tibetan Plateau, China. J. Mt. Sci. 2015, 12, 935–942. [Google Scholar] [CrossRef]
  32. Peng, S.; Ding, Y.; Liu, W.; Li, Z. 1 km monthly temperature and precipitation dataset for China from 1901 to 2017. Earth Syst. Sci. Data 2019, 11, 1931–1946. [Google Scholar] [CrossRef]
  33. Zhang, Y.; Kong, D.; Gan, R.; Chiew, F.; McVicar, T.; Zhang, Q.; Yang, Y. Coupled estimation of 500m and 8-day resolution global evapotranspiration and gross primary production in 2002–2017. Remote Sens. Environ. 2019, 222, 165–182. [Google Scholar] [CrossRef]
  34. Akihiko, I. Constraining size-dependence of vegetation respiration rates. Sci. Rep. 2020, 10, 4304. [Google Scholar]
  35. Hirsch, R.; Slack, J.; Smith, R. Techniques of trend analysis for monthly water quality data. Water Resour. Res. 1982, 18, 107–121. [Google Scholar] [CrossRef]
  36. Mann, H. Non-parametric tests against trend. Econometrica 1945, 13, 245–259. [Google Scholar] [CrossRef]
  37. Kendall, M. Rank Correlation Measures. In Charles Griffin, 4th ed.; Charles Griffin: London, UK, 1975. [Google Scholar]
  38. Zhang, Y.; Kang, S.; Ward, E.; Ding, R.; Zhang, X.; Zheng, R. Evapotranspiration components determined by sap flow and microlysimetry techniques of a vineyard in northwest china: Dynamics and influential factors. Agric. Water Manag. 2011, 98, 1207–1214. [Google Scholar] [CrossRef]
  39. Nooni, I.; Wang, G.; Hagan, D.; Lu, J.; Ullah, W.; Li, S. Evapotranspiration and its Components in the Nile River Basin Based on Long-Term Satellite Assimilation Product. Water 2019, 11, 1400. [Google Scholar] [CrossRef]
  40. Tong, S.; Zhang, J.; Bao, Y.; Lai, Q.; Lian, X.; Li, N.; Bao, Y. Analyzing vegetation dynamic trend on the Mongolian Plateau based on the Hurst exponent and influencing factors from 1982–2013. J. Geogr. Sci. 2018, 28, 595–610. [Google Scholar] [CrossRef]
  41. Partal, T.; Kahya, E. Trend analysis in Turkish precipitation data. Hydrol. Process. Int. J. 2006, 20, 2011–2026. [Google Scholar] [CrossRef]
  42. Xia, J.; Yi, G.; Zhang, T.; Zhou, X.; Miao, J.; Bie, X. Interannual variation in the start of vegetation growing season and its response to climate change in the Qinghai–Tibet Plateau derived from MODIS data during 2001 to 2016. J. Appl. Remote Sens. 2019, 13, 048506. [Google Scholar] [CrossRef]
  43. Evans, J.; Geerken, R. Discrimination between climate and human-induced dryland degradation. J. Arid Environ. 2004, 57, 535–554. [Google Scholar] [CrossRef]
  44. Wessels, K.; Prince, S.; Malherbe, J.; Small, J.; Frost, P.; VanZyl, D. Can human-induced land degradation be distinguished from the effects of rainfall variability? A case study in South Africa. J. Arid Environ. 2007, 68, 271–297. [Google Scholar] [CrossRef]
  45. Zhang, M.; Li, X.; Wang, H.; Deng, F.; Li, X.; Mi, X. Effects of converting natural grasslands into planted grasslands on ecosystem respiration: A case study in Inner Mongolia, China. J. Arid Land 2017, 9, 38–50. [Google Scholar] [CrossRef]
  46. Fang, Q.; Wang, G.; Liu, T.; Xue, B.; Yinglan, A. Controls of carbon flux in a semi-arid grassland ecosystem experiencing wetland loss: Vegetation patterns and environmental variables. Agric. For. Meteorol. 2018, 259, 196–210. [Google Scholar] [CrossRef]
  47. Yang, C.; Li, G.; Yan, L.; Wu, J.; Li, J.; Liu, S.; Lu, Y. Effects of different vegetation types on ecosystem respiration in semiarid Loess Hilly Region, Central Gansu Province, China. Ecol. Indic. 2022, 145, 109683. [Google Scholar] [CrossRef]
  48. Yu, G.; Zhu, X.; Fu, Y.; He, H.; Wang, Q.; Wen, X.; Li, X.; Zhang, M.; Zhang, L.; Su, W.; et al. Spatial patterns and climate drivers of carbon fluxes in terrestrial ecosystems of China. Glob. Chang. Biol. 2013, 19, 798–810. [Google Scholar] [CrossRef] [PubMed]
  49. Chen, Z.; Yu, G.; Ge, J.; Sun, X.; Hirano, T.; Saigusa, N.; Wang, Q.; Zhu, X.; Zhang, Y.; Zhang, J.; et al. Temperature and precipitation control of the spatial variation of terrestrial ecosystem carbon exchange in the Asian region. Agric. For. Meteorol. 2013, 182, 266–276. [Google Scholar] [CrossRef]
  50. Wei, S.; Yi, C.; Fang, W.; Hendrey, G. A global study of GPP focusing on light-use efficiency in a random forest regression model. Ecosphere 2017, 8, e01724. [Google Scholar] [CrossRef]
  51. Zhang, Y.; Xu, M.; Chen, H.; Adams, J. Global pattern of NPP to GPP ratio derived from MODIS data: Effects of ecosystem type, geographical location and climate. Glob. Ecol. Biogeogr. 2009, 18, 280–290. [Google Scholar] [CrossRef]
  52. Potter, C.; Randerson, J.; Field, C.; Matson, P.; Vitousek, P.; Mooney, H.; Klooster, S. Terrestrial ecosystem production: A process model based on global satellite and surface data. Glob. Biogeochem. Cycles 1993, 7, 811–841. [Google Scholar] [CrossRef]
  53. Malhi, Y. The productivity, metabolism and carbon cycle of tropical forest vegetation. J. Ecol. 2012, 100, 65–75. [Google Scholar] [CrossRef]
  54. Atkin, O.; Evans, J.; Ball, M.; Lambers, H.; Pons, T. Leaf respiration of snow gum in the light and dark. Interactions between temperature and irradiance. Plant Physiol. 2000, 122, 915–924. [Google Scholar] [CrossRef]
  55. Bolstad, P.; Reich, P.; Lee, T. Rapid temperature acclimation of leaf respiration rates in Quercus alba and Quercus rubra. Tree Physiol. 2003, 23, 969–976. [Google Scholar] [CrossRef]
  56. Piao, S.; Friedlingstein, P.; Ciais, P.; Viovy, N.; Demarty, J. Growing season extension and its impact on terrestrial carbon cycle in the Northern Hemisphere over the past 2 decades. Glob. Biogeochem. Cycles 2007, 21, GB3018. [Google Scholar] [CrossRef]
  57. Piao, S.; Luyssaert, S.; Ciais, P.; Janssens, I.; Chen, A.; Cao, C.; Fang, J.; Friedlingstein, P.; Luo, Y.; Wang, S. Forest annual carbon cost: A global-scale analysis of autotrophic respiration. Ecology 2010, 91, 652–661. [Google Scholar] [CrossRef]
  58. Kwon, Y.; Larsen, C. Effects of forest type and environmental factors on forest carbon use efficiency assessed using MODIS and FIA data across the eastern USA. Int. J. Remote Sens. 2013, 34, 8425–8448. [Google Scholar] [CrossRef]
  59. Chambers, J.; Tribuzy, E.; Toledo, L.; Crispim, B.; Higuchi, N.; Santos, J.; Araújo, A.; Kruijt, B.; Nobre, A.; Trumbore, S. Respiration from a tropical forest ecosystem: Partitioning of sources and low carbon use efficiency. Ecol. Appl. 2004, 14, 72–88. [Google Scholar] [CrossRef]
  60. Alfieri, J.; Xiao, X.; Niyogi, D.; Pielke Sr, R.; Chen, F.; LeMone, M. Satellite-based modeling of transpiration from the grasslands in the Southern Great Plains, USA. Glob. Planet. Chang. 2009, 67, 78–86. [Google Scholar] [CrossRef]
  61. Monteith, J. Does transpiration limit the growth of vegetation or vice versa? J. Hydrol. 1988, 100, 57–68. [Google Scholar] [CrossRef]
  62. Law, B.; Falge, E.; Gu, L.; Baldocchi, D.; Bakwin, P.; Berbigier, P.; Davis, K.; Dolman, A.J.; Falk, M.; Fuentes, J.; et al. Environmental controls over carbon dioxide and water vapor exchange of terrestrial vegetation. Agric. For. Meteorol. 2002, 113, 97–120. [Google Scholar] [CrossRef]
  63. Berry, S.; Roderick, M. Gross primary productivity and transpiration flux of the Australian vegetation from 1788 to 1988 AD: Effects of CO2 and land use change. Glob. Chang. Biol. 2004, 10, 1884–1898. [Google Scholar] [CrossRef]
  64. Vesala, T.; Suni, T.; Rannik, Ü.; Keronen, P.; Markkanen, T.; Sevanto, S.; Grönholm, T.; Smolander, S.; Kulmala, H.; Ojansuu, R.; et al. Effect of thinning on surface fluxes in a boreal forest. Glob. Biogeochem. Cycles 2005, 19, GB2001. [Google Scholar] [CrossRef]
  65. Jardine, K.; Cobello, L.; Teixeira, L.; East, M.; Levine, S.; Gimenez, B.; Robles, E.; Spanner, G.; Koven, C.; Xu, C.; et al. Stem respiration and growth in a central Amazon rainforest. Trees 2022, 36, 991–1004. [Google Scholar] [CrossRef]
  66. Tong, X.; Brandt, M.; Yue, Y.; Horion, S.; Wang, K.; Keersmaecker, W.; Tian, F.; Schurgers, G.; Xiao, X.; Luo, Y.; et al. Increased vegetation growth and carbon stock in China karst via ecological engineering. Nat. Sustain. 2018, 1, 44–50. [Google Scholar] [CrossRef]
  67. Peng, D.; Zhang, B.; Wu, C.; Huete, A.; Gonsamo, A.; Lei, L.; Ponce-Campos, G.; Liu, X.; Wu, Y. Country-level net primary production distribution and response to drought and land cover change. Sci. Total Environ. 2017, 574, 65–77. [Google Scholar] [CrossRef] [PubMed]
  68. Wu, L.; Wang, S.; Bai, X.; Tian, Y.; Luo, G.; Wang, J.; Li, Q.; Chen, F.; Deng, Y.; Yang, Y.; et al. Climate change weakens the positive effect of human activities on karst vegetation productivity restoration in southern China. Ecol. Indic. 2020, 115, 106392. [Google Scholar] [CrossRef]
Figure 1. Spatial distribution of annual mean CUE of vegetation CUE in the Three Rivers Source region from 2001 to 2020.
Remotesensing 16 02909 g001
Figure 2. Annual mean vegetation CUE in Three Rivers Source region from 2001 to 2020 by county.
Remotesensing 16 02909 g002
Figure 3. Annual variation of vegetation CUE in the Three Rivers Source region.
Remotesensing 16 02909 g003
Figure 4. The CUE trend distribution (a) and its significance test (b) in the Three Rivers Source region from 2001 to 2020.
Remotesensing 16 02909 g004
Figure 5. Spatial distribution of annual mean values of vegetation GPP (a), NPP (b), autotrophic respiration (c), NDVI (d), LAI (e) and CUE (f) in Three Rivers Source region from 2001 to 2020.
Remotesensing 16 02909 g005
Figure 6. Spatial distribution of correlation coefficient and significance test between vegetation CUE and temperature (a,b), precipitation (c,d) and evapotranspiration (e,f) in Three Rivers Source region.
Remotesensing 16 02909 g006
Figure 7. The land cover types (a) and DEM (b) in Three Rivers Source region.
Remotesensing 16 02909 g007
Figure 8. The mean CUE along with vegetation types (a) and elevation (b) in Three Rivers Source region, The orange, green, and black lines represent the maximum, average, and minimum values of the CUE at a certain elevation.
Remotesensing 16 02909 g008
Figure 9. Contribution of climate change and ecological engineering to CUE. (a) A map showing the spatial distribution of human contribution to CUE; (b) A map showing the spatial distribution of key factors leading to CUE changes.
Remotesensing 16 02909 g009
Disclaimer/Publisher’s Note: The statements, opinions and data contained in all publications are solely those of the individual author(s) and contributor(s) and not of MDPI and/or the editor(s). MDPI and/or the editor(s) disclaim responsibility for any injury to people or property resulting from any ideas, methods, instructions or products referred to in the content.

