Technical Note

Latitudinal Characteristics of Nighttime Electron Temperature in the Topside Ionosphere and Its Dependence on Solar and Geomagnetic Activities

1
State Key Laboratory of Space Weather, National Space Science Center, Chinese Academy of Sciences, Beijing 100090, China
2
College of Earth Sciences, University of Chinese Academy of Sciences, Beijing 100049, China
3
High Altitude Observatory, NSF National Center for Atmospheric Research, Boulder, CO 80301, USA
4
College of Meteorology and Oceanography, National University of Defense Technology, Changsha 410073, China
*
Author to whom correspondence should be addressed.
Remote Sens. 2024, 16(16), 2946; https://doi.org/10.3390/rs16162946
Submission received: 21 June 2024 / Revised: 7 August 2024 / Accepted: 9 August 2024 / Published: 12 August 2024

Abstract

:
This study investigates the latitudinal characteristics of the nighttime electron temperature, as observed by the Defense Meteorological Satellite Program F16 satellite, and its dependence on solar and geomagnetic activities between 2013 and 2022 in the topside ionosphere, only for the winter hemispheres. The electron temperature in both hemispheres exhibited a low-temperature zone at the equator and a double high-temperature zone at the sub-auroral and auroral latitudes along the magnetic latitude. In addition, we further studied the temperature crest/trough positions in the temperature zone at different latitudes. As the solar activity intensity decreased (increased), the temperature trough position at the equator shifted from the Southern (Northern) to the Northern (Southern) Hemisphere, and the temperature double-crest positions at the sub-auroral and auroral latitudes gradually approached (moved away from) each other. Furthermore, during the geomagnetic disturbance time, the temperature double-crest positions both moved toward lower latitudes, but the temperature trough position was not sensitive to geomagnetic activity. Our analysis demonstrates that the values and correlations of the electron temperature and density varied in different temperature characteristic zones (the temperature crest/trough positions ±2°), possibly due to the different energy control factors of the electrons at different latitudes. This may also indirectly indicate the energy coupling process between the topside ionosphere and different regions at different latitudes.

1. Introduction

The topside ionosphere (~hmF2—1500 km) is a critical region of the ionosphere, connecting the plasmasphere and magnetosphere upward and the F2 peak region of the ionosphere downward [1] (hmF2 represents the peak height of the F2 region, which depends on the latitude, local time, season, and solar activity). It is located among regions with entirely different dominant physical processes. The electron temperature, which can reflect the energy evolution of the ionosphere well, is one of the key parameters for studying ionospheric characteristics. Furthermore, the latitudinal characteristics of the electron temperature in the topside ionosphere are more expressive of the coupling and energy exchange process among the plasmasphere, ionosphere, and thermosphere.
The electron temperature at nighttime at different latitudes has different variations and features in the topside ionosphere [2,3,4,5,6,7,8]. Over the equatorial and low latitudes, there are several interesting phenomena at different local times (LTs). At sunset, the electron temperature exhibits significant periodic variation in longitude [9]. In the early morning sector, the electron temperature at low latitudes increases sharply and reaches its maximum at sunrise, called the “morning overshoot”, where the low electron density is heated up by local photoelectrons [7,10,11,12,13,14]. During the post-sunset and pre-midnight periods, the electron temperature has a trough around the magnetic equator with a bimodal structure [3,15,16,17,18]. The temperature trough originates from the increase in the plasma density caused by the adiabatic expansion of the plasma and the pre-reversal enhancement of the eastward electric field boosting the upward vertical E × B drift, and the temperature bimodal is generated by the combined effect of a reverse plasma fountain and nighttime plasma cooling [19]. In the mid-latitude region, the electron temperature during the post-midnight and predawn periods exhibits significant enhancement at the middle latitudes in the North American and Atlantic (Southern Oceania) sectors in the Northern (Southern) Hemisphere (NH (SH)) [5,20]. This enhancement is attributed to photoelectrons originating from the conjugate sunlit hemisphere, and its longitudinal distribution is controlled by the local time and geomagnetic field [5,6,8,20,21]. In the sub-auroral region, the electron temperature on the nightside has a significant peak in the latitudinal profile, caused by the heat transfer from the ring current, which occupies the electron density trough [22,23]. As a result, these latitudinal phenomena at different local times make describing and modeling the latitude profiles of the electron temperature and its dependence on solar and geomagnetic activities more difficult.
In recent decades, numerous reports have investigated the latitudinal variation in the electron temperature on the topside ionosphere under different solar activity conditions [24,25,26,27,28,29,30,31,32,33]. For example, in the equatorial and low-latitude regions at ~500 km observed by the SROSS C2 satellite, the monthly average electron temperature during the daytime and nighttime positively correlated with the solar activity [25]. Moreover, the annual mean of electron temperature also follows the annual mean solar flux [24,25,26]. In addition, the amplitude of “morning overshoot” at this region was also negative to the solar flux at ~450 km, as observed by the CHAMP satellite [12], and positive to the solar flux at ~600 km, as observed by Hinotori satellites [10,27] and ground-based radars [11]. In the middle latitude region, the variation in the electron temperature with solar activity is complex and related to the electron density at different altitudes, according to the Arecibo and Millstone Hill ISRs [28,29]. Liang et al. [20] investigated the electron temperature and density in this region at predawn, which, in 2014 (a solar maximum year), were higher than that in 2018 (a solar minimum year). Furthermore, Bilitza et al. [30] reported a comprehensive study on the mid-latitude electron temperature and density based on 22 satellites data at ~550–850 km. They suggested that whereas density always increased with solar activity, temperature could increase, decrease, or stay constant depending on the specific altitude, LT, and season. In the sub-auroral region, the electron temperature showed no significant solar cycle variation, whatever its magnitude or peak location [22], but it was sensitive to geomagnetic storms [23]. More comprehensively, Truhlik et al. [31,32] researched the global latitudinal variation in the electron temperature under different solar activity levels using 19 satellites at 550, 850, 1400, and 2000 km. They found that the electron temperature variations with solar activity were generally small (a few 100 K) and showed a more complex variation pattern for daytime and at 550 and 850 km heights. Recently, Pignalberi et al. [33] further studied the variation in the electron temperature under different solar activity conditions for all local times using Swarm B satellite data at ~500 km. They indicated that the largest electron temperature variation with solar activity was found at high latitudes in the winter season, where the electron temperature showed a marked decreasing trend with the solar activity in the polar cusp and auroral regions and, more importantly, at the sub-auroral latitudes in the nightside sector. However, the complexity of the latitude characteristics of the electron temperature changing with the altitude, LT, and other factors makes the research still insufficient.
This paper not only focuses on the latitudinal characteristics of the electron temperature and its corresponding variations with solar and geomagnetic activities but also explores the movement of the different latitude temperature zones and the relationship between the electron temperature and density in the temperature zones as the solar and geomagnetic activities change, which may provide more supplementary information to the latitudinal characteristics of the topside ionosphere. To investigate these issues, we analyzed the electron temperature and density data of the Defense Meteorological Satellite Program (DMSP) F16 from 2013 to 2022 during geomagnetic quiet and disturbance times. Section 2 introduces the data and methods used in this study. Section 3 provides a detailed description of the magnetic latitude characteristics of the electron temperature and the dependence of its position and values in the different magnetic latitudes on solar and geomagnetic activities. Section 4 discusses the relationship between the electron temperature and density in different magnetic latitude zones. Section 5 presents the conclusion of this study.

2. Datasets, Statistical Methods, and Models
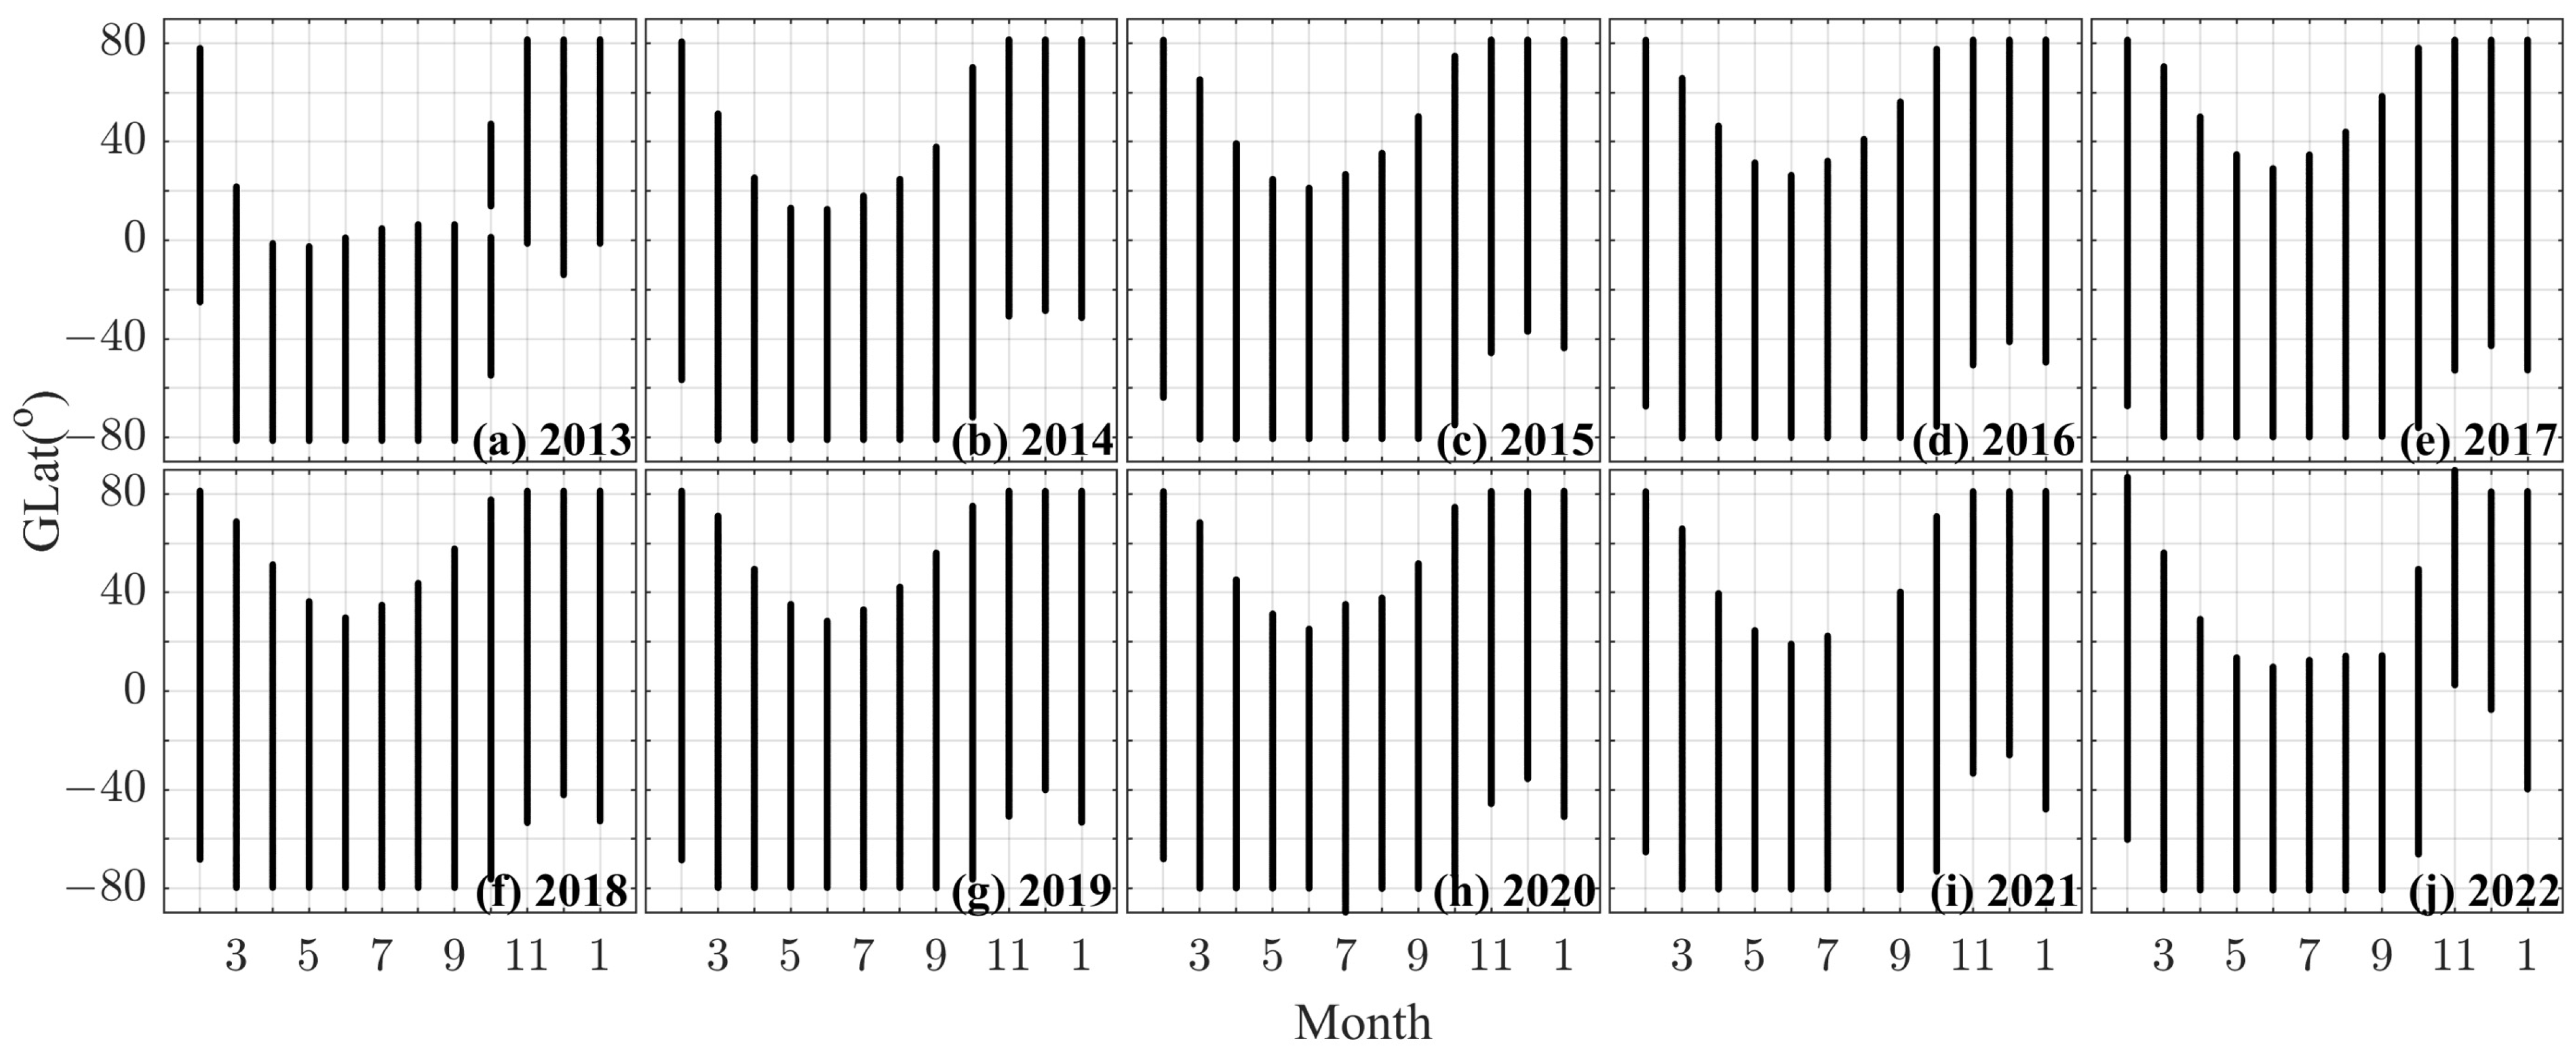
2.1. Datasets

The DMSP F16 satellite is a solar-synchronous polar-orbit satellite launched on 18 October 2003. Its orbital inclination, height, and period are 98°, ~835–860 km, and ~101 min, respectively. The distance in longitude between two consecutive tracks is ~25°. The satellite carries the Special Sensor for Ions, Electrons, and Scintillation (SSIEs), which includes two analysis modes: the Electron Langmuir Probe (EP) and Retarding Potential Analyzer (RPA), both of which can provide electron and ion temperature and density data [34]. The SSIEs provides rich data for the topside ionosphere. In addition, the orbit’s satellite solar local time (LT) is almost fixed, making ionospheric measurements unique and more conducive to studying ionospheric characteristics. The electron temperature and density from the EP mode of the SSEIs, with a 4 s resolution between 2013 and 2022 (the 24th solar cycle), were used in this study. During this time, the LT of the ascending (descending) orbit was ~0400–0600 LT (~1600–1800 LT). The geomagnetic index (3-h ap) and solar index (F10.7) were obtained from the OMINI website (https://cdaweb.gsfc.nasa.gov/, accessed on 10 August 2024).

2.2. Methods

During the daytime, the energy balance of the ionosphere is more complex, attributed to the ionization and recombination caused by solar extreme ultraviolet (EUV) radiation. So, we focused only on the nighttime ionosphere with the “cold” background temperature. First, we selected the ascending orbit and retained the nighttime data based on the local solar zenith angle (SZA) of 100° as the local sunrise time [35], selecting data with SZA ≥ 100° as nighttime. Then, we further divided the seasons into the Spring Equinox (February to April), the Autumn Equinox (August to October), the December Solstice (November to December and January), and the June Solstice (May to July). Unfortunately, after screening nighttime, the Spring and Autumn Equinox data were mainly distributed in the SH, with fewer points in the NH, as seen in Figure A1 in Appendix A. Furthermore, the December (June) Solstice data were mainly distributed in the NH (SH), especially in 2013 and 2022. Therefore, this study focused only on the nighttime ionosphere under winter conditions in both hemispheres (i.e., the December (June) Solstice for the NH (SH)) based on the above data situation. In addition, we filtered the all-day data that met the ap < 7 for the day and the daily average of Ap ≥ 15, categorizing them into geomagnetic quiet and disturbance times, respectively. Finally, we calculated the global and magnetic latitudinal averages. The global distribution was obtained by binning and averaging on 5° × 5° longitude–latitude grids. The magnetic zonal mean distribution was binned and averaged on a 1° magnetic latitude (MLAT) grid.

2.3. Models

The International Reference Ionosphere (IRI) model is an empirical model based on the ground and space observations of the ionosphere from 60 to 2000 km, which can provide the primary ionosphere parameters, such as the electron density and temperature, ion composition, density, and temperature, etc. [36]. The latest version of the IRI is the IRI-2020. For the electron temperature on the topside, it contains the BIL-1995 model [37,38,39], and the updated TBT-2012 model adds the variation in the electron temperature with solar activity (SA) dependence (TBT-2012+SA) [31,32,40]. Four options now exist for the electron density on the topside: IRI-2001, IRI-2001cor, NeQuick, and COR2 ([36] and the references in Section 3.1). The new update of the electron density in the IRI-2020 is the COR2, which adds a solar activity-dependent correction function to the IRI-2001cor model to solve the underestimation in years with extremely low solar activity [41]. The updates of the other parameters can be found in the study by Bilitza et al. [36]. In this study, we used the default options of TBT-2012+SA for the electron temperature and COR2 for the electron density. Furthermore, we recorded the along-orbit information, i.e., the day of the year, year, month, day, month, universal time (hour, min, and sec), geo-latitude, geo-longitude, and height as the input parameters for running the IRI-2020 model to obtain a one-to-one comparison between the satellite observations and model simulations. Moreover, the results of the IRI-2020 model simulations underwent the same data procedures, as described in Section 2.2. The Fortran code of the IRI-2020 model is available at https://irimodel.org/ (accessed on 10 August 2024).

3. Results

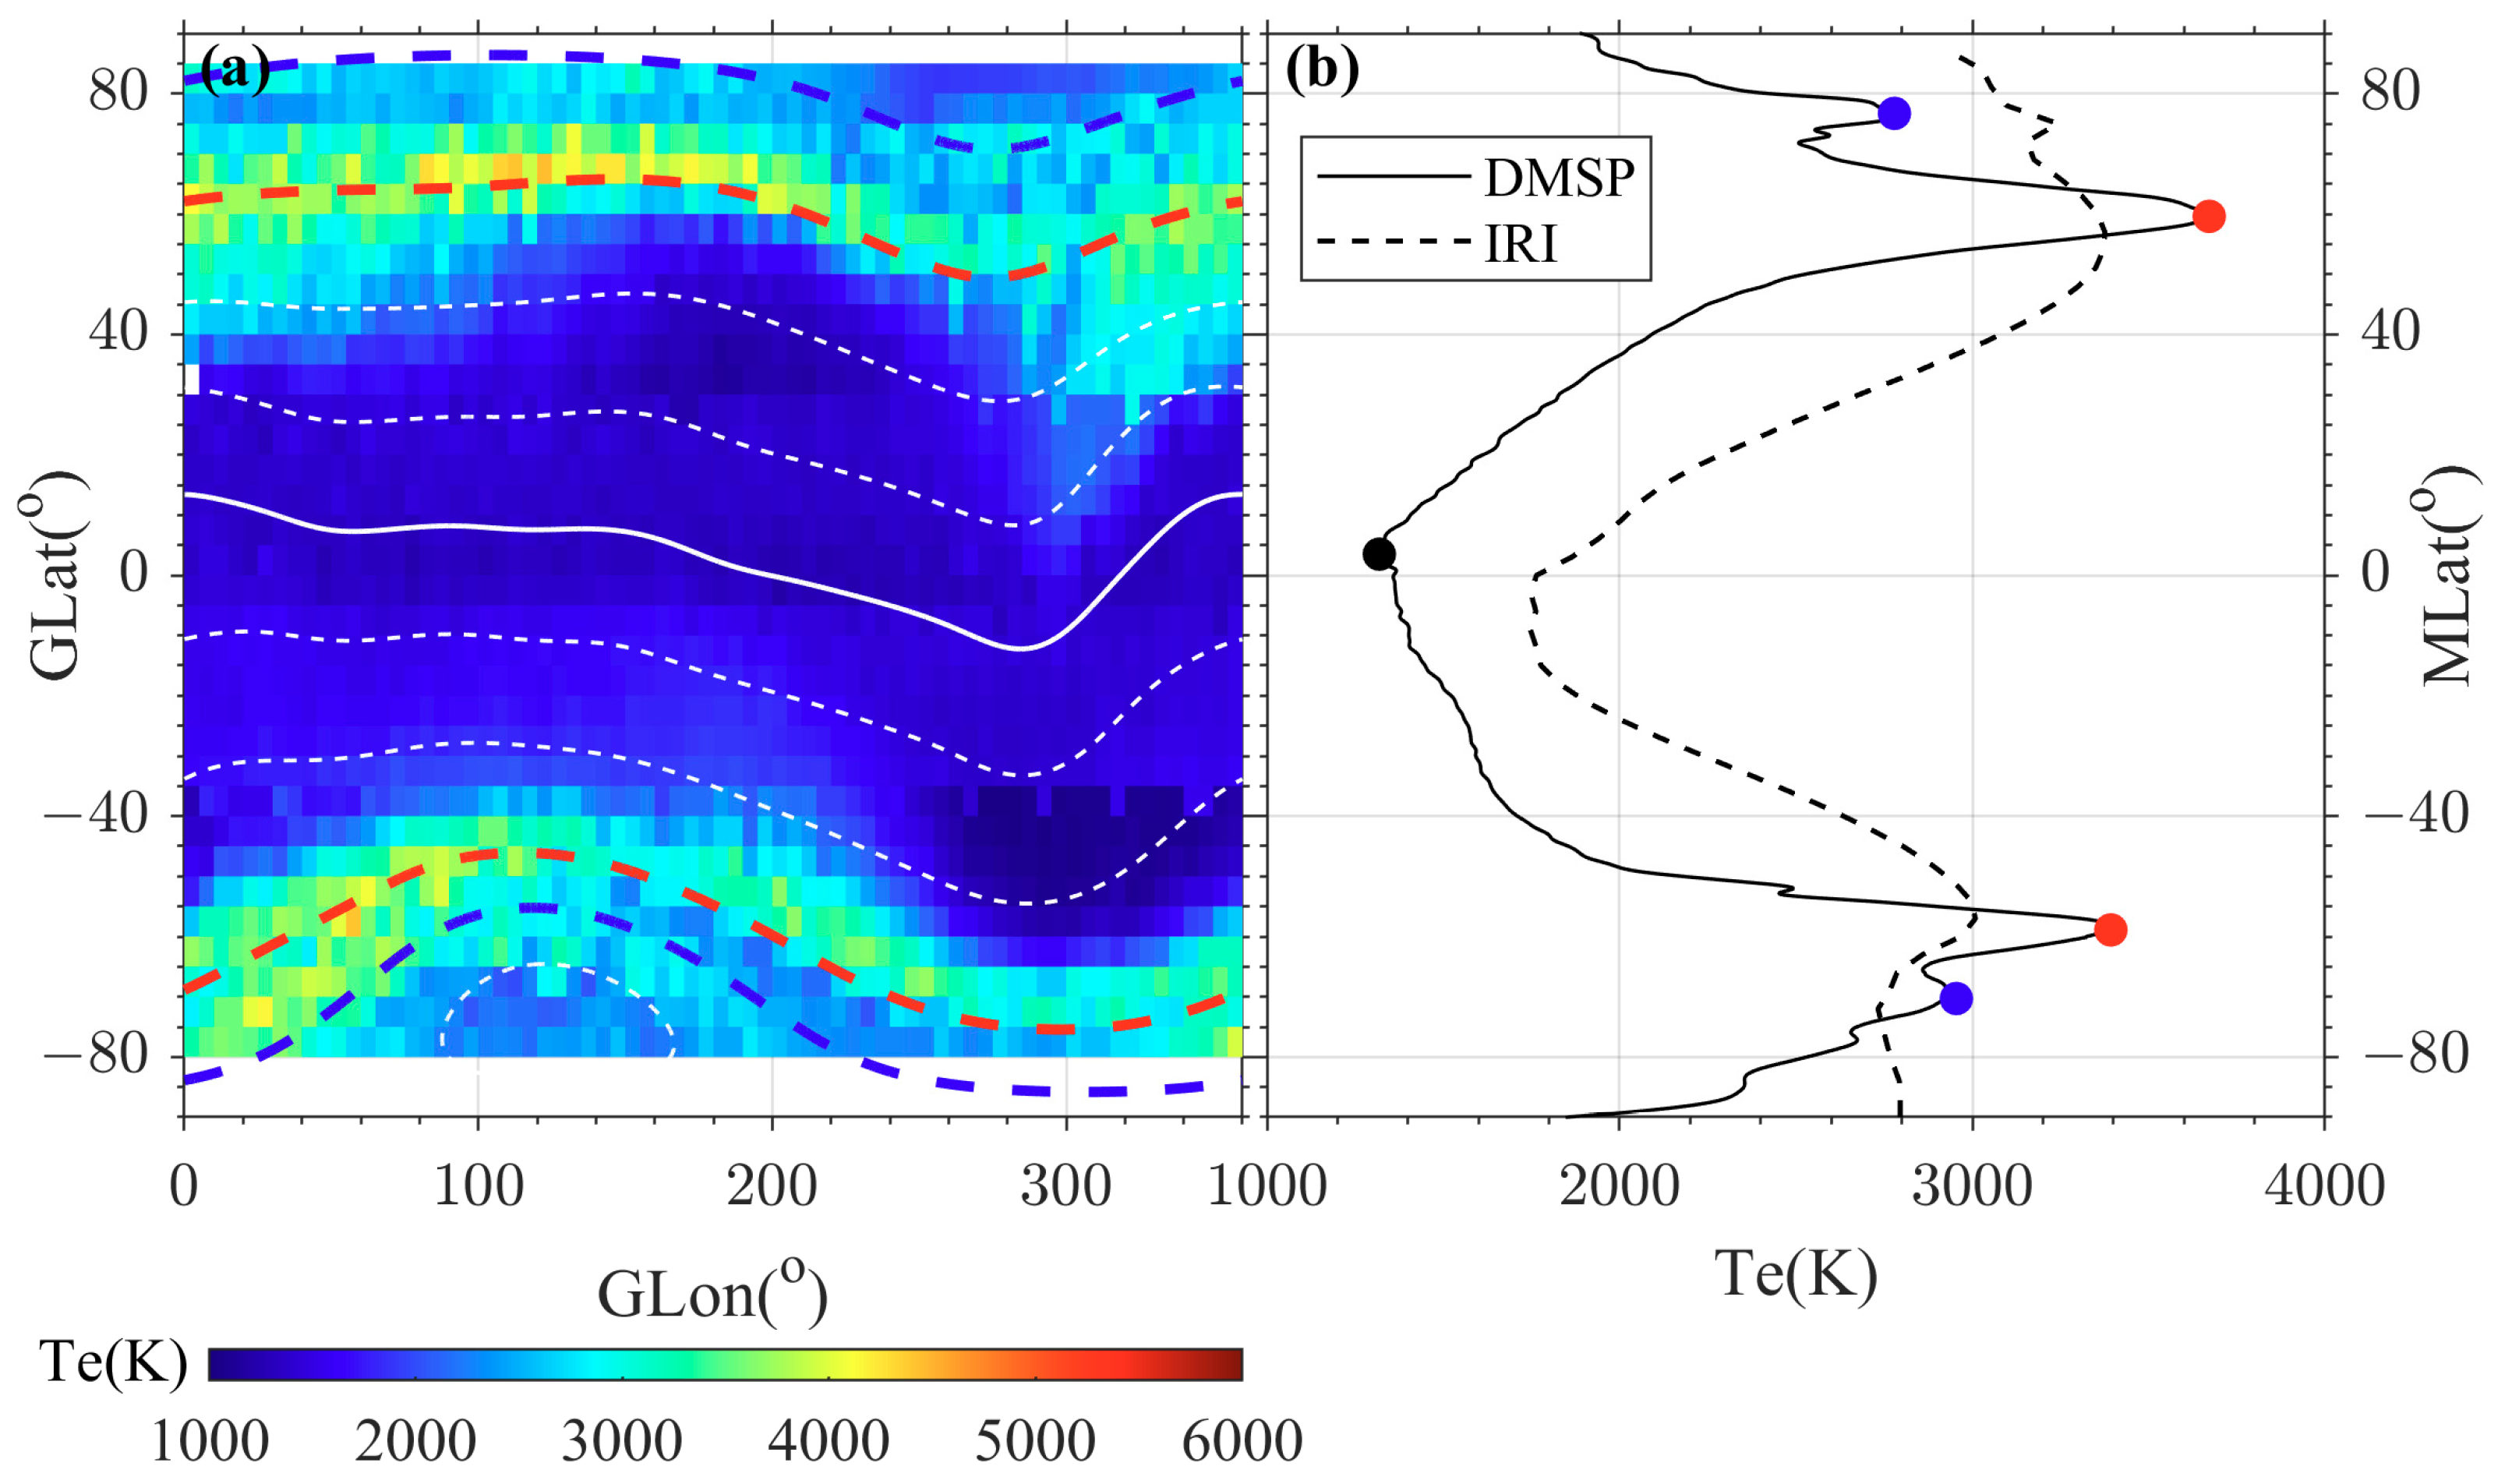
3.1. Magnetic Latitudinal Characteristics of Electron Temperature

The nighttime electron temperature has consistent latitudinal characteristics in different sectors. Figure 1 shows an example of the global distribution and magnetic latitude distribution of the electron temperature. Similar results for other years are not presented here. The electron temperature from low to high magnetic latitudes in different sectors exhibited low temperatures at the equator, high temperatures in the mid-latitude ionosphere trough at sub-auroral latitudes (around ±60° MLAT, red dashed line), which is the sub-auroral temperature enhancement phenomenon [22,23], and high temperatures at the auroral latitude (around 80° MLAT (−70° MLAT) in the NH (SH), i.e., blue dashed line), as shown in Figure 1a. In other words, there are three special temperature zones along the magnetic latitude in both the NH and SH, including the dual high-temperature zone at the sub-auroral and auroral latitudes and the low-temperature zone at the equator. However, the temperature zone at the auroral latitude in the SH was not as significant as that in the NH, as shown in Figure 1a. These nighttime patterns are consistent with the observations of the Swarm B satellite at ~500 km by Pignalberi et al. [33,42], but those at high latitudes are more pronounced, like observations during the daytime at ~500 km. We further conducted magnetic latitudinal averaging (black solid line) and then recorded the temperature trough positions (black dot) at the equator and the temperature bimodal positions (red and blue dots) at the sub-auroral and auroral latitudes, as shown in the temperature characteristic positions in Figure 1b. Then, to further explore its movement, we investigated the variation in the temperature and density value and the relationship between them in the temperature characteristic zones (the temperature trough/crest position ±2°) under different solar and geomagnetic activity conditions.
In addition, we also conducted a one-by-one comparison with the IRI-2020 model (black dash line). The latitudinal variation in the electron temperature of the IRI simulation is almost consistent with the DMSP observation overall. They both exhibited a low-temperature zone at the equator and a high-temperature zone at the sub-auroral latitude along the magnetic latitude in both hemispheres. The IRI also had a weak high-temperature zone at the auroral latitude in the NH, but failed in the SH. However, the electron temperature value showed differences in the different latitudes. The electron temperature of the IRI model at mid-low latitudes (−55~55° MLAT) (sub-auroral latitudes (around ±60° MLAT)) in both hemispheres showed an overestimation of ~600 K (underestimation of ~400 K). At the auroral latitude in the NH (70~90° MLAT), the IRI model showed an overestimation of 400~1000 K. However, at −70 ± 5°MLAT (−75~−90° MLAT) in the SH, the IRI showed an underestimation (overestimation) of ~200 K (~500 K).

3.2. Movement of Temperature Characteristic Positions

The temperature characteristic positions, whether during geomagnetic quiet time (circle solid line in Figure 2) or during disturbance time (triangle dash line in Figure 2), move regularly with solar activity, but their movement directions and net displacement differ. Figure 2(a1) presents the annual average variation in the F10.7, showing that 2014–2017, 2018–2019, and 2020–2022 were the declining, extremely low, and rising years of solar activity, respectively. For the temperature trough position at the equator (Figure 2(a2)), it shifted from the SH to the NH as the F 10.7 ¯ weakened, and then returned to the SH as the F 10.7 ¯ increased. In addition, it remained at ~7° N when F 10.7 ¯ 90 between 2016 and 2021. The temperature crest position at the sub-auroral latitude (Figure 2b) in both hemispheres moved to a higher (lower) latitude as the F 10.7 ¯ weakened (increased), with a maximum displacement of 6–7°. However, the movement direction of the crest position at auroral latitudes was opposite to that at sub-auroral latitudes. Its displacement was also less than that at sub-auroral latitudes. In the NH (Figure 2(c1)), it moved to a lower (higher) latitude as the F 10.7 ¯ weakened (increased), with a maximum displacement of ~2°. In the SH (Figure 2(c2)), it also moved to a lower latitude as the F 10.7 ¯ weakened between 2013 and 2016. Nevertheless, we did not seek out the crest position at the auroral latitude of SH when F 10.7 ¯ < 90 between 2017 and 2021. We speculate that the crest position at the auroral latitude may have submerged into the high-temperature zone at the sub-auroral latitude because the two high-temperature zones at the sub-auroral and auroral latitudes were relatively closer, as shown in Figure 2(b2,c2). In addition, the temperature crest positions at the sub-auroral and auroral latitudes in both hemispheres moved toward lower latitudes, but that at the equator latitude was not moving much, comparing the geomagnetic disturbance time (triangle dash line) with the geomagnetic quiet time (circle solid line). At the sub-auroral latitude, the crest position in the NH (SH) had a maximum displacement of ~4° (~2°). At the auroral latitude, the crest position in the NH (SH) had a maximum displacement of ~2° (~4°). It can be seen that the temperature crest positions at the sub-auroral and auroral latitudes in both hemispheres gradually approached (moved away from) each other as the F 10.7 ¯ weakened (increased) and moved toward the lower latitudes during the geomagnetic disturbance time.
The temperature characteristic positions in the NH and SH are asymmetric with respect to the magnetic equator. For the temperature crest position at the sub-auroral latitude, its average in the NH (SH) was 61.7° MLAT (−61.2° MLAT) (58.1° MLAT (−59.4° MLAT)) during the geomagnetic quiet (disturbance) time. The difference between the two hemispheres was 0.5° MLAT (1.8° MLAT) during the geomagnetic quiet (disturbance) time. For the temperature crest position at the auroral latitude, its average in the NH (SH) was 76.1° MLAT (−69.1° MLAT) (73.9° MLAT (−67.9° MLAT)) during the geomagnetic quiet (disturbance) time. The difference between the two hemispheres was 7° MLAT (6° MLAT) during the geomagnetic quiet (disturbance) time. During the geomagnetic disturbances time, there was a difference in the temperature crest position at the sub-auroral latitude between the two hemispheres, while that at the auroral latitude differed significantly during the geomagnetic quiet time.

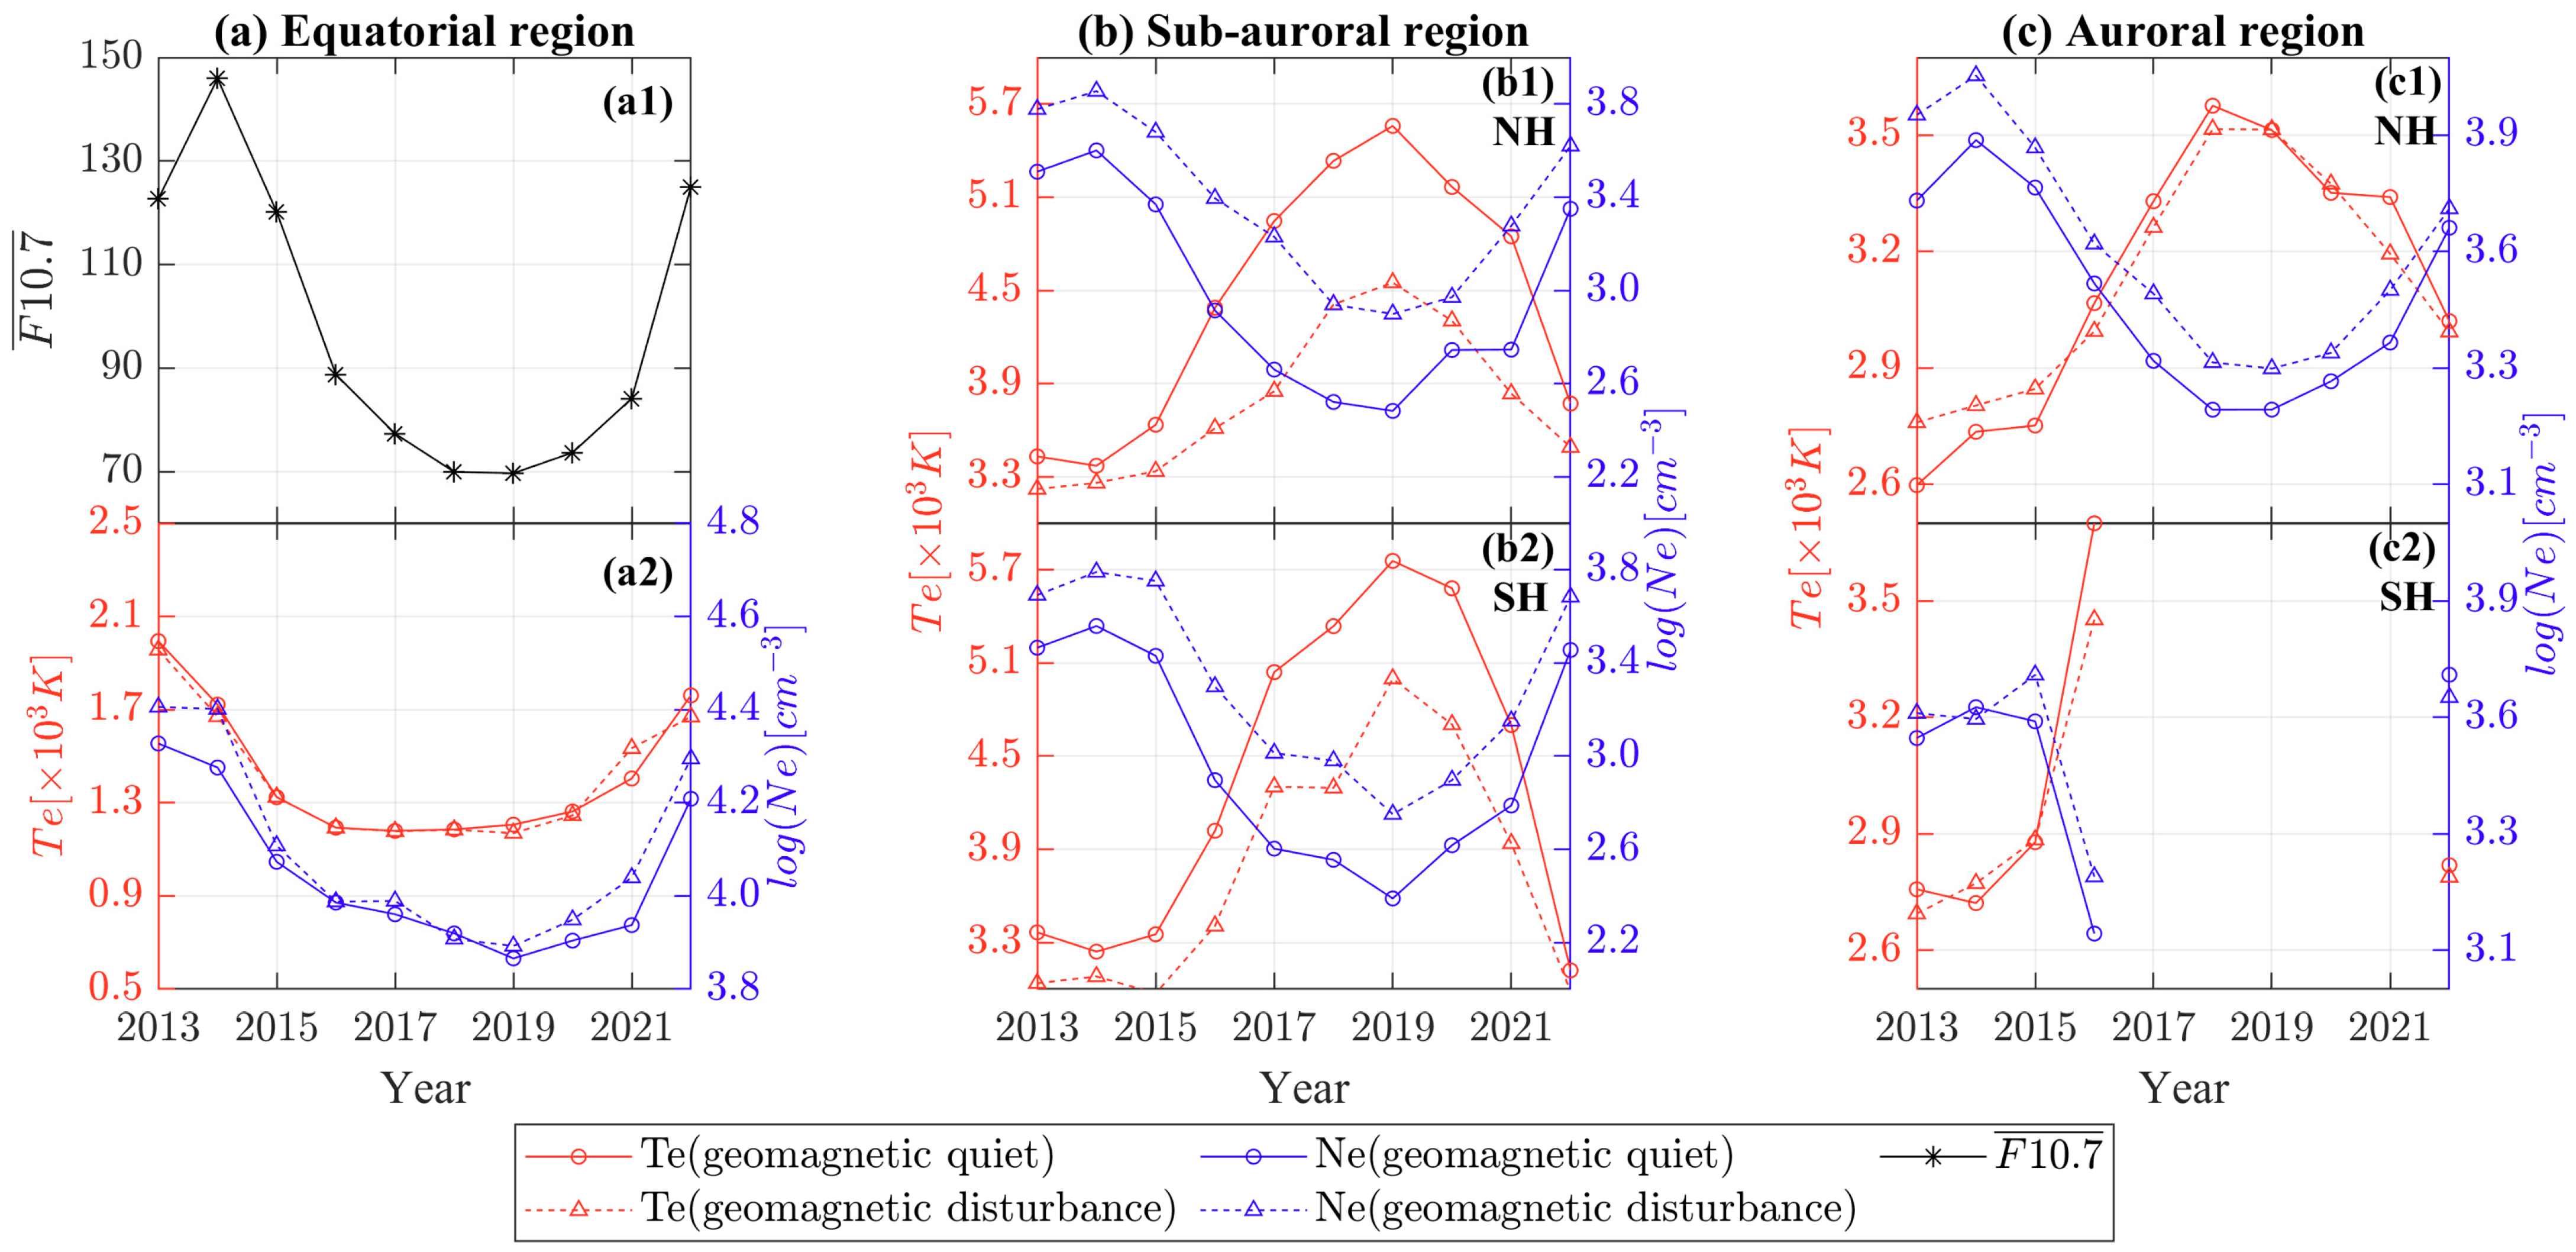
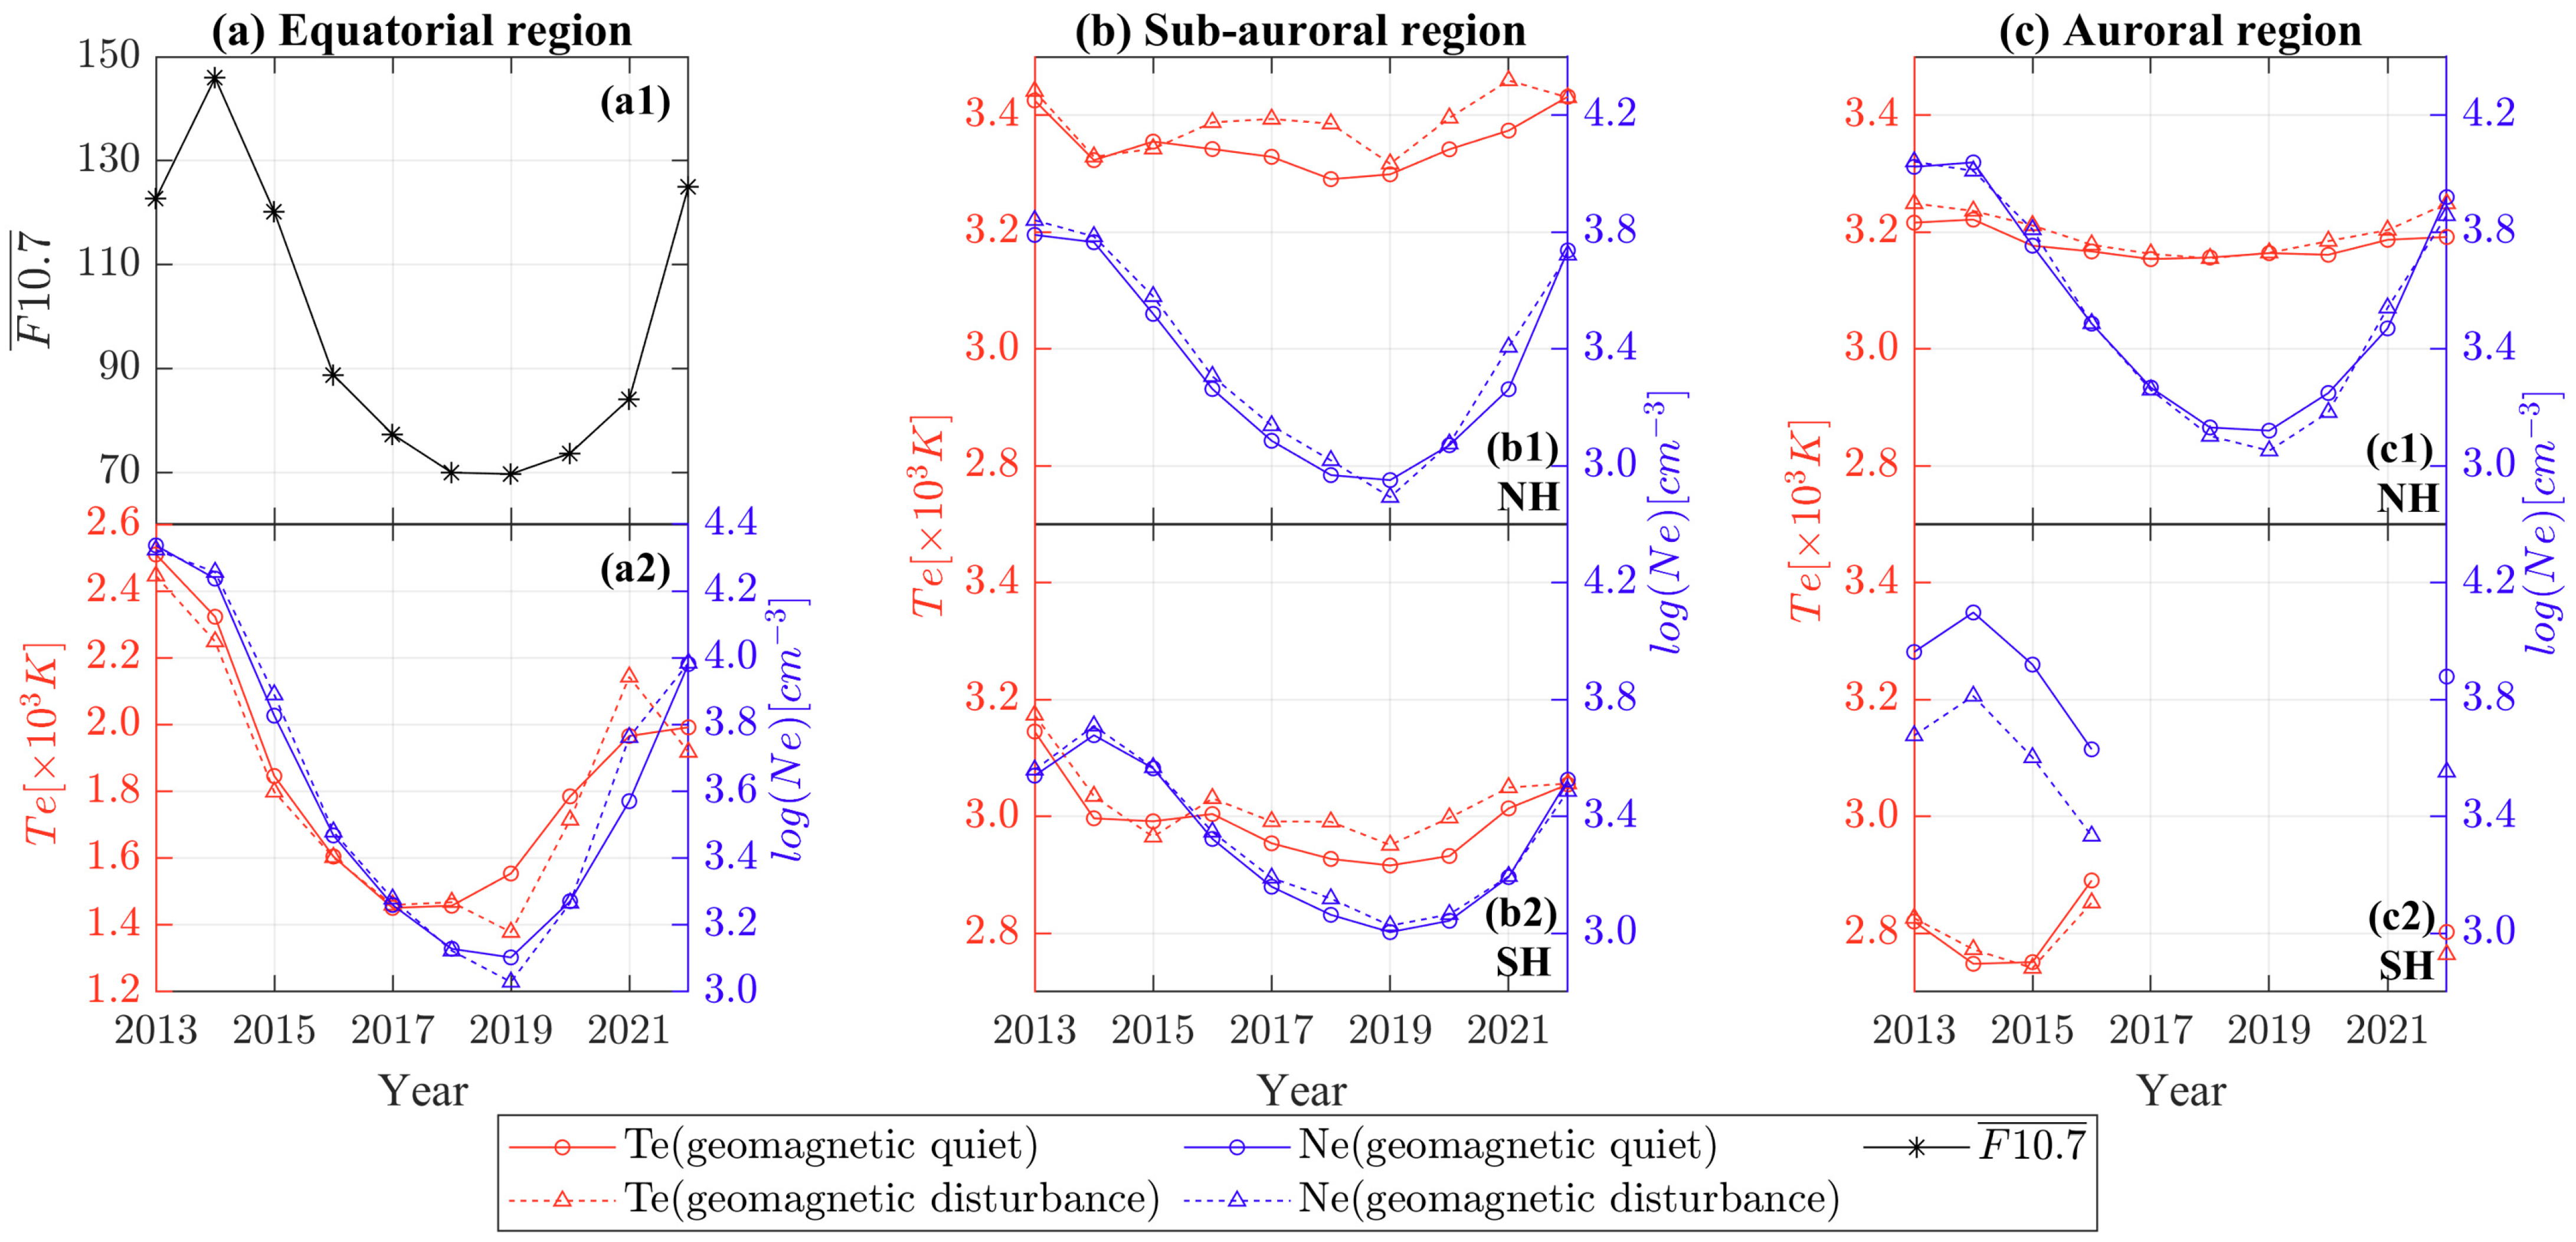
3.3. Variations in the Electron Temperature and Density Value

The electron temperature values in different characteristic zones (the temperature crest/trough position ±2°) showed distinct responses to solar and geomagnetic activities. In the equator temperature zone (Figure 3(a2)), the electron temperature (red line) decreased (increased) as the F 10.7 ¯ decreased (increased), indicating a direct proportionality between the two, similar to the results at ~500 km [24,25,26]. The maximum temperature difference, which varied with F 10.7 ¯ , was ~800 K. In the sub-auroral (Figure 3b) and auroral (Figure 3c) temperature zones, high temperatures corresponded to a low F 10.7 ¯ , indicating an anti-correlation between the two. The electron temperature in the sub-auroral temperature zone highly depended on the F 10.7 ¯ and was not as insensitive to the solar cycle as Fok et al. [22] suggested. Moreover, Pignalberi et al. [33] also reported that at these two regions for winter hemispheres, there was a relationship between the electron temperature and solar activity: electron temperature at high solar activity (SA) ≤ that at moderate SA ≤ that at low SA, particularly in the nightside sector, which is consistent with our results. During geomagnetic quiet (red circle solid line) and disturbance (red triangle dash line) times, the maximum temperature differences that varied with the F 10.7 ¯ in the sub-auroral temperature zone in the NH (SH) (Figure 3(b1,b2)) were ~2200 K (~2600 K) and ~1100 K (~2000 K), respectively. The influence of geomagnetic activity on the electron temperature in this region is consistent with the DE-2 satellite data [22,23]. The maximum temperature difference in the auroral temperature zone was ~1000 K in both hemispheres. In addition, during the geomagnetic disturbance time (red triangle dash line), the temperature in the auroral temperature zone (Figure 3b) was lower than that during the geomagnetic quiet time (red circle solid line). However, geomagnetic activity had little impact on the temperature in the equator (Figure 3(a2)) and the auroral temperature zone (Figure 3c), where the temperature did not change significantly.
For the electron density, it (blue lines) decreased (increased) as the F 10.7 ¯ decreased (increased), regardless of the temperature zone (Figure 3(a2) and Figure 3b,c). These are similar to the previous results in that the electron density was directly proportional to the solar activity intensity [43,44]. In the equator temperature zone (Figure 3(a2)), the variation in the electron temperature (red lines) with the F 10.7 ¯ was similar to that of the density, while that in the sub-auroral and auroral temperature zones (Figure 3b,c) was the opposite. In other words, low (high) solar activity corresponded to a low (high) electron temperature and density in the equator temperature zone. In contrast, in the sub-auroral and auroral temperature zones, low (high) solar activity corresponded to a low (high) electron density and high (low) electron temperature. In addition, the density during the geomagnetic disturbance time (blue triangle dash line) was higher than that during the geomagnetic quiet time (blue circle solid line), which was more pronounced in the sub-auroral temperature zone (Figure 3b). But the temperature in the equator and auroral temperature zones was not sensitive to geomagnetic activity. Wang et al. [7] used the Thermosphere Ionosphere Nested Grid (TING) model to study the effect of geomagnetic storms on the electron temperature and density. Their results suggested that a positive storm, resulting in a density increase consistent with Figure 3(a2) and Figure 3b, occurred at the mid-low magnetic latitudes during predawn. Nevertheless, our results show an increase in density at auroral latitudes, as shown in Figure 3c, which is inconsistent with the ionospheric negative storm in this region [7]. The distinct variations in the electron density and temperature in the different latitude temperature zones may be modulated by different factors.
Furthermore, the electron density simulated by the IRI model and that observed by the DMSP observations were exhibited consistently under different solar and geomagnetic activities, but there were significant differences in the electron temperature. For the electron density (blue line in Figure 4), a decreasing (increasing) trend with the F 10.7 ¯ decreasing (increasing) characterized all temperature zones. The geomagnetic activity seemed to have little effect on the variation in the electron density. For the electron temperature (red line in Figure 4), there was also a negative correlation between it and the F 10.7 ¯ in the equator temperature zone, consistent with the DMSP observations (Figure 3(a2)). However, the electron temperature in the sub-auroral temperature region (Figure 4b) showed a decreasing trend, followed by an increasing trend, and then a further decrease, followed by an increase as the F 10.7 ¯ varied, which was quite complex. The maximum temperature difference, which varied with the F 10.7 ¯ , was only ~300 K and much lower than the DMSP of ~1000–2600 K (red line in Figure 3b). In the auroral temperature region, the electron temperature in the NH (Figure 4(c1)) had a decreasing (increasing) trend, with the F 10.7 ¯ decreasing (increasing), but that in the SH (Figure 4(c2)) was the opposite. Furthermore, the electron temperature variations with the solar activity were quite small (~100 K). In addition, the electron temperature in the equator (sub-auroral/auroral) temperature zone was an overestimation (underestimation) of ~400 K (~1000/650 K) on average. The density in the equator (auroral) temperature zone had a slight underestimation between 2016 and 2020. At the sub-auroral temperature zone, the density values obtained by the IRI model and the DMSP observation were almost consistent during the geomagnetic disturbance time. An overestimation of the IRI model was exhibited during the geomagnetic quiet time. Perhaps observations by the DMSP F16 satellite can better supplement the variations in the electron temperature at 850 km in the IRI model in the future.

4. Discussion

The variation in the electron temperature value in the nighttime ionosphere is mainly controlled by the thermal balance of heating (soft electrons (<1 keV), heat conduction from the plasmasphere and magnetosphere along the magnetic field line), and cooling (collisions with neutral and ions) effects [45,46]. The heating effect of electrons at nighttime exhibits a latitude preference. Soft electrons at nighttime mainly precipitate in the polar region [47]. On the one hand, the heat transfer from the ring current is concentrated at sub-auroral latitudes [23]. In addition, heat conduction, originating from the heat flux stored in the plasmasphere during the day, mainly heats cold electrons at night along the magnetic field lines downward [48]. The heating process at low latitudes is restrained because of the proximity to the horizontal magnetic field lines [8]. However, the cooling effect, mainly due to the Coulomb collision of electron ions, is proportional to the square of the electron density, indicating that the electron density affects the variation in the temperature at all latitudes (i.e., there is no latitude preference like heating effect). Therefore, this study mainly discusses the relationship between the electron temperature and density in different temperature zones under different solar and geomagnetic activities. In addition to considering the variations in their values in Section 3.3, the correlation between the two is also considered.
In the equator temperature zone, the relationship between the electron temperature and density is relatively complex. This complexity could be verified from the correlation in Figure 5(a2), which was either negative (2013, 2017–2019) or positive (2014–2016 and 2020–2022) during both the geomagnetic quiet (circle solid line) and disturbance times (triangle dash line), following the changes in the F 10.7 ¯ . Furthermore, the correlation was not affected by the geomagnetic activity. It is noted that even though the correlations were weak, they still had references because the significance test p-values of the correlations were all less than 0.5, as shown in Table A1 in Appendix B. This negative or positive correlation also manifested in different longitudes, as observed by the DEMETER satellite (at ~2230 LT) between 2006 and 2009 at a height of ~600 km [49]. Su et al. [49] further discussed that, during low geomagnetic activity, there might be a thermal equilibrium between electrons, ions, and neutrals, contributing to positive or negative correlations depending on the electron densities. Moreover, a negative correlation was also characterized at a low latitude during ~0400–0900 LT (the LT of the DMSP was 0400–0600 LT) using Swarm B satellite data at a height of ~500 km from 2014 to 2022 [50]. Pignalberi et al. [50] highlighted that the negative correlation pattern strongly depended on the electron density and occurred when the equatorial ionization anomaly (EIA) disappeared. However, Figure 5(a2) presents the alternating positive and negative correlations under different solar activities. In addition, this region’s background thermosphere may also play an essential role in the electron density and temperature variation [48], which could directly alter the value and structure of the electron temperature and density in this region [9,18,51]. The above processes may play a different role, further interact, and couple, resulting in a complex relationship between the electron density and temperature, as shown in Figure 5(a2).
In the sub-auroral temperature zone, the relationship between the electron temperature and density is the simplest, as shown in Figure 5b. The negative correlation between the two was maintained under different solar years and geomagnetic activities. Furthermore, the solar and geomagnetic activities also influenced the correlation variation. The correlation followed an increase as the F 10.7 ¯ weakened, except during the geomagnetic quiet time in the NH (circle solid line in Figure 5(b1)). In Figure 5(b1,b2), the correlations during the geomagnetic disturbance time (triangle dash line) in the NH (SH) were lower (higher) than those during the geomagnetic quiet time (circle solid line) except for 2017–2018 (2013–2015). This anti-correlation was consistent with the previous study at other lower altitudes [22,23,49,50]. The zone was co-located with the ionosphere density trough corresponding to a low electron density, which could reduce collisional cooling [50]. On the other hand, the heat flux of the plasmasphere along the magnetic field lines downward to lower altitudes [48,49] and the heat transfer of the hot ring current ions from the inner magnetosphere [22] were more efficient in this zone. These would lead to a negative correlation. Moreover, the movement at this temperature zone, as shown in Figure 2b, may be further explained by the density trough location. Previous studies have shown that the density trough moves with the plasmasphere position [52] and could push toward lower magnetic latitudes during geomagnetic storms [53,54]. Additionally, the trough position at nighttime shifted toward higher magnetic latitudes during periods of low solar activity [55]. These results agree with the movement of the temperature zone, as shown in Figure 2b.
In the auroral temperature zone, the relationship between the electron temperature and density is the most complex due to the complex energy balance situation. Figure 5(c1) shows that the correlations in the NH were not solely negative or positive, and its variations are coincident with the variation in the F 10.7 , ¯ though the correlations were weak (the significance test p-values of the correlations were all less than 0.5, as shown in Table A1 in Appendix B). Furthermore, the correlations were weakly negative (positive) when F 10.7 ¯ < 90 ( F 10.7 ¯ 90 ). However, the correlations in the SH, shown in Figure 5(c2), were always negative and weakened as the F 10.7 ¯ decreased. Pignalberi et al. [50] reported that the electron temperature and density in this zone at ~500 km presented a single anti-correlation consistent with the process of the sub-aurora zone. They also highlighted that the small patches of positive correlation were observed at noon and very high latitudes (~80° MLAT) in the summer hemisphere, associated with the precipitation of high-energy plasma particles at the cusp. Even if the positive correlation in our study occurred at lower latitudes (73~77°/−73~−65° MLAT) than those and in the winter, not summer hemispheres, we speculate that the positive correlation attribution may be consistent with them, i.e., the energy particle precipitation. In addition, the high-latitude temperature peak structures may correspond to the double-layer structure of the plasmasphere, which only appears during the geomagnetic storm times [38], and is co-located with the density trough position at high latitudes [2,56]. This may have contributed to the negative correlation in this zone. Furthermore, our analyses verifies that the high-magnetic-latitude temperature peak structure has always existed in both hemispheres during geomagnetic quiet and disturbance times. Additionally, this zone also constantly had other processes, such as ion-neutral frictional heating, thermoelectric transport, thermal conduction, Joule heating, collision coupling with thermal ions, etc. [57]. Under different solar and geomagnetic activity conditions, the dominant factors of energy control may vary, leading to a complex relationship between the electron temperature and density and not just a single negative correlation, as previously reported.
As discussed above, the energy-controlled terms in different latitudinal temperature zones vary, reflecting the coupling process between the ionosphere and different regions. Furthermore, the variations in the magnetic latitude and correlation between the electron temperature and density based on the DMSP satellite observations have provided more insights into the topside ionosphere. However, the discussion in this study is limited because of the lack of observations and models. In future work, we hope to further study the dynamic processes of the topside ionosphere by adding more key information, such as heat flux into and out of the plasmasphere, Joule heating from the magnetosphere, background temperature, and wind measurement or modeling in the thermosphere.

5. Conclusions

This study utilized the electron temperature and density observed by the DMSP F16 satellite to investigate the magnetic latitudinal variations in the electron temperature and the movement of different latitude temperature zones from 2013 to 2022 during the geomagnetic quiet (all day ap < 7) and disturbance (Ap ≥ 15) times. The electron temperature at nighttime in both hemispheres exhibited a low-temperature zone at the equator (around −20~10° MLAT) and a double high-temperature zone at the sub-auroral (around ±55~65° MLAT) and auroral latitudes (around 73~77°/−73~−65° MLAT).
Furthermore, the temperature crest/trough positions in the temperature zones at different latitudes presented regular movements with solar and geomagnetic activities. As solar activity decreased (increased), the temperature trough position at the equator moved from the SH (NH) to the NH (SH), and the temperature double-crest positions at the sub-auroral and auroral latitudes in both hemispheres moved closer to (further away from) each other. Additionally, during the geomagnetic disturbance times, both crests moved toward lower latitudes, but there were almost no changes in the trough’s position.
In addition, the relationship between the electron temperature and density based on variations in the values and correlations between the two in different characteristic zones (the temperature crest/trough position ±2°) is widely divergent, being simplest at the sub-auroral latitudes and more complex at the equatorial and auroral latitudes. This may also reflect the coupling process between the topside ionosphere and other regions due to different energy balances at different latitudes. More data and simulations are needed in the future to investigate the specific processes further.

Author Contributions

J.X. and J.L. (Jianyun Liang): conceptualization and supervision; J.L (Jianyun Liang).: investigation, methodology, software, formal analysis, and writing—original draft preparation; K.W., J.X., J.L. (Jianyun Liang), and J.L. (Ji Luo): writing—review and editing. All authors have read and agreed to the published version of the manuscript.

Funding

This work is supported by the National Natural Science Foundation of China, grant 41831073.

Data Availability Statement

The DMSP satellite data can be downloaded at https://www.ncei.noaa.gov/data/dmsp-space-weather-sensors/access/ (accessed on 10 August 2024). The 3-h ap and F10.7 index data can be obtained at https://cdaweb.gsfc.nasa.gov/ (accessed on 10 August 2024). The Fortran code of the IRI-2020 model is available at https://irimodel.org/ (accessed on 10 August 2024).

Acknowledgments

We thank the NOAA FTP for making available the DMSP data, the OMNI database for offering the 3-h ap and F10.7 indices, and the Working Group on IRI of the Committee on Space Research (COSPAR) and the International Union of Radio Science (URSI) for providing the IRI model and software.

Conflicts of Interest

The authors declare no conflicts of interest.

Appendix A

Figure A1. The latitudinal distribution of the monthly data during the nighttime with a local solar zenith angle (SZA) ≥100° from 2013 to 2022.
Remotesensing 16 02946 g0a1

Appendix B

The significance test results of the correlation coefficients between the electron temperature and density, corresponding to Figure 5.
Table A1. The significance level of Pearson’s correlation coefficient between the electron temperature (Te) and density (Ne) in the different characteristic zones (crest/trough position ±2°).
YearEquatorSub-Auroral LatitudeAuroral Latitude
NHSHNHSH
QuietDisturbanceQuietDisturbanceQuietDisturbanceQuietDisturbanceQuietDisturbance
20132.23 × 10−222.57 × 10−2406.89 × 10−945.5 × 10−3074.3 × 10−2281.08 × 10−901.87 × 10−365.0 × 10−1392.77 × 10−64
20145.28 × 10−300.001001.1 × 10−2383.5e × 10−28706.5 × 10−1715.4 × 10−11103.8 × 10−1184.66 × 10−74
20155.0 × 10−1064.2 × 10−2311.9 × 10−202005.2 × 10−1638.41 × 10−123.1 × 10−1771.1 × 10−2383.44 × 10−58
20161.99 × 10−314.15 × 10−5902.4 × 10−302003.10 × 10−175.39 × 10−703.0 × 10−248
20178.17 × 10−692.26 × 10−2600001.03 × 10−281.45 × 10⁻⁷NanNan
20189.3 × 10−1611.15 × 10−6200004.9 × 10−1431.11 × 10−43NanNan
20195.50 × 10−442.91 × 10−2706.0 × 10−257008.1 × 10−1505.16 × 10−7NanNan
20207.2 × 10−2961.0 × 10−1050007.2 × 10−2131.47 × 10−885.19 × 10−40NanNan
202107.4 × 10−13400005.46 × 10−260.00119NanNan
20220.0001651.45 × 10−9001.1 × 10−17902.59 × 10−161.74 × 10−2102.6 × 10−188
Note: If the significance level is less than 0.05, the null hypothesis that there is no correlation between the Te and Ne is rejected.

References

  1. Schunk, R.W.; Nagy, A.F. Ionospheres: Physics, Plasma Physics, and Chemistry, 2nd ed.; Cambridge Atmospheric and Space Science Series; Cambridge University Press: Cambridge, UK, 2009. [Google Scholar]
  2. Horwitz, J.L.; Brace, L.H.; Comfort, R.H.; Chappell, C.R. Dual-spacecraft measurements of plasmasphere-ionosphere coupling. J. Geophys. Res. 1986, 91, 11203–11216. [Google Scholar] [CrossRef]
  3. Su, Y.Z.; Oyama, K.I.; Bailey, G.J.; Takahashi, T.; Watanabe, S. Spatial and temporal variations of the electron temperature at equatorial anomaly latitudes. Adv. Space Res. 1996, 18, 83–86. [Google Scholar] [CrossRef]
  4. Kakinami, Y.; Balan, N.; Liu, J.Y.; Oyama, K.I. Predawn ionospheric heating observed by Hinotori satellite. J. Geophys. Res. Space Phys. 2010, 115, A01304. [Google Scholar] [CrossRef]
  5. Chao, C.K.; Su, S.Y.; Yeh, H.C. Presunrise ion temperature enhancement observed at 600 km low- and mid-latitude ionosphere. Geophys. Res. Lett. 2003, 30, 1187. [Google Scholar] [CrossRef]
  6. Chao, C.K.; Su, S.Y.; Huba, J.D.; Oyama, K.I. Modeling the presunrise plasma heating in the low-to midlatitude topside ionospheres. J. Geophys. Res. 2010, 115, A09304. [Google Scholar] [CrossRef]
  7. Wang, W.; Burns, A.G.; Killeen, T.L. A numerical study of the response of ionospheric electron temperature to geomagnetic activity. J. Geophys. Res. 2006, 111, A11301. [Google Scholar] [CrossRef]
  8. Kil, H.; Paxton, L.J.; Schaefer, R.K. Simultaneous detection of signatures of conjugate photoelectrons in the ionosphere and thermosphere. J. Geophys. Res. Space Phys. 2022, 127, e2021JA030121. [Google Scholar] [CrossRef] [PubMed]
  9. Ren, Z.; Wan, W.; Liu, L.; Zhao, B.; Wei, Y.; Yue, X.; Heelis, R.A. Longitudinal variations of electron temperature and total ion density in the sunset equatorial topside ionosphere. Geophys. Res. Lett. 2008, 35, L05108. [Google Scholar] [CrossRef]
  10. Oyama, K.-I.; Balan, N.; Watanabe, S.; Takahashi, T.; Isoda, F.; Bailey, G.J.; Oya, H. Morning overshoot of Te enhanced by downward plasma drift in the equatorial topside ionosphere. J. Geomagn. Geoelectr. 1996, 48, 959–966. [Google Scholar] [CrossRef]
  11. Otsuka, Y.; Kawamarura, S.; Balan, N.; Fukao, S.; Bailey, G.J. Plasma temperature variations in the ionosphere over the middle and upper atmosphere radar. J. Geophys. Res. Space Phys. 1998, 103, 20705–20713. [Google Scholar] [CrossRef]
  12. Stolle, C.; Liu, H.; Truhlík, V.; Lühr, H.; Richards, P.G. Solar flux variation of the electron temperature morning overshoot in the equatorial F region. J. Geophys. Res. 2011, 116, A04308. [Google Scholar]
  13. Alexander, L.T. Diurnal variation of electron and ion temperatures with altitude. Int. J. Appl. Sci. Technol. 2014, 4, 163–168. [Google Scholar]
  14. Yang, T.-Y.; Park, J.; Kwak, Y.-S.; Oyama, K.-I.; Minow, J.I.; Lee, J.-J. Morning overshoot of electron temperature as observed by the Swarm constellation and the International Space Station. J. Geophys. Res. Space Phys. 2020, 125, e2019JA027299. [Google Scholar] [CrossRef]
  15. Hanson, W.B.; Naggy, A.F.; Moffett, R.J. Ogo-6 measurements of super cooled plasma in the equatorial exosphere. J. Geophys. Res. 1973, 78, 751–756. [Google Scholar] [CrossRef]
  16. Oyama, K.; Abdu, M.A.; Balan, N.; Bailey, G.J.; Watanabe, S.; Takahashi, T.; de Paula, E.R.; Batista, I.S.; Isoda, F.; Oya, H. High electron temperature associated with the prereversal enhancement in the equatorial ionosphere. J. Geophys. Res. 1997, 102, 417–424. [Google Scholar] [CrossRef]
  17. Pavlov, A.V.; Fukao, S.; Karwamura, S. Comparison of the measured and modelled electron densities, and electron and ion temperatures in the low-latitude ionosphere during 12–21 March 1988. Ann. Geophys. 2004, 22, 2747–2763. [Google Scholar] [CrossRef]
  18. Ryu, K.; Kwak, Y.; Kim, Y.H.; Park, J.; Lee, J.; Min, K. Variation of the topside ionosphere during the last solar minimum period studied with multi satellite measurements of electron density and temperature. J. Geophys. Res. Space Phys. 2016, 121, 7269–7286. [Google Scholar] [CrossRef]
  19. Balan, N.; Oyama, K.I.; Bailey, G.J.; Fukao, S.; Watanabe, S.; Abdu, M.A. A plasma temperature anomaly in the equatorial topside ionosphere. J. Geophys. Res. 1997, 102, 7485–7492. [Google Scholar] [CrossRef]
  20. Liang, J.; Xu, J.; Zhang, Q.; Liu, J.; Zhang, Y.; Zhang, S.; Wang, X.; Xing, Z.; Wu, K. Global distribution of electron temperature enhancement at mid-low latitudes observed by DMSP F16 satellite. J. Geophys. Res. Space Phys. 2023, 128, e2023JA031513. [Google Scholar] [CrossRef]
  21. Kil, H.; Schaefer, R.K.; Paxton, L.J.; Jee, G. The far ultraviolet signatures of conjugate photoelectrons seen by the Special Sensor Ultraviolet Spectrographic Imager. Geophys. Res. Lett. 2020, 47, e2019GL086383. [Google Scholar] [CrossRef]
  22. Fok, M.-C.; Kozyra, J.U.; Brace, L.H. Solar cycle variation in the subauroral electron temperature enhancement: Comparison of AE-C and DE 2 satellite observations. J. Geophys. Res. Space Phys. 1991, 96, 1861–1866. [Google Scholar] [CrossRef]
  23. Prolss, G.W. Subauroral electron temperature enhancement in the nighttime ionosphere. Ann. Geophys. 2006, 24, 1871–1885. [Google Scholar] [CrossRef]
  24. Bhuyan, P.K.; Chamua, M.; Subrahmanyam, P.; Garg, S.C. Diurnal, seasonal and latitudinal variations of electron temperature measured by the SROSS C2 satellite at 500 km altitude and comparison with the IRI. Ann. Geophys. 2002, 20, 807–815. [Google Scholar] [CrossRef]
  25. Chamua, M.; Bhuyan, P.K.; Subrahmanyam, P.; Garg, S.C. Diurnal, seasonal, latitudinal and solar cycle variation of electron temperature in the topside f-region of the indian zone ionosphere. Ann. Geophys. 2007, 25, 1995–2006. [Google Scholar] [CrossRef]
  26. Sharma, D.K.; Rai, J.; Israil, M.; Subrahmanyam, P. Diurnal, seasonal and latitudinal variations of ionospheric temperatures of the topside f region over the indian region during solar minimum (1995–1996). J. Atmos. Solar-Terr. Phys. 2005, 67, 269–274. [Google Scholar] [CrossRef]
  27. Watanabe, S.; Oyama, K.-I.; Abdu, M.A. Computer simulations of electron and ion densities and temperatures in the equatorial F region and comparison with Hinotori results. J. Geophys. Res. 1996, 100, 14581–14590. [Google Scholar] [CrossRef]
  28. Zhang, S.-R.; Holt, J.M. Ionospheric plasma temperatures during 1976–2001 over Millstone Hill. Adv. Space Res. 2004, 33, 963–969. [Google Scholar] [CrossRef]
  29. Lei, J.; Roble, R.G.; Wang, W.; Emery, B.A.; Zhang, S.-R. Electron temperature climatology at Millstone Hill and Arecibo. J. Geophys. Res. Space Phys. 2007, 112, A02302. [Google Scholar] [CrossRef]
  30. Bilitza, D.; Truhlik, V.; Richards, P.; Abe, T.; Triskova, L. Solar cycle variations of mid-latitude electron density and temperature: Satellite measurements and model calculations. Adv. Space Res. 2007, 39, 779–789. [Google Scholar] [CrossRef]
  31. Truhlik, V.; Bilitza, D.; Triskova, L. Latitudinal variation of the topside electron temperature at different levels of solar activity. Adv. Space Res. 2009, 44, 693–700. [Google Scholar] [CrossRef]
  32. Truhlik, V.; Triskova, L.; Bilitza, D.; Podolska, K. Variations of daytime and nighttime electron temperature and heat flux in the upper ionosphere, topside ionosphere and lower plasmasphere for low and high solar activity. J. Atmos. Solar-Terr. Phys. 2009, 71, 2055–2063. [Google Scholar] [CrossRef]
  33. Pignalberi, A.; Truhlik, V.; Giannattasio, F.; Coco, I.; Pezzopane, M. Mid- and High-Latitude Electron Temperature Dependence on Solar Activity in the Topside Ionosphere through the Swarm B Satellite Observations and the International Reference Ionosphere Model. Atmosphere 2024, 15, 490. [Google Scholar] [CrossRef]
  34. Delorey, D.E.; Pruneau, P.N.; Parsons, C.M. Database Development for the DMSP SSIES Experiment; Technical Report GL-TR-89-0066; Air Force Geophysics Laboratory, Hanscom Air Force Base: Bedford, MA, USA, 1989. [Google Scholar]
  35. Giraud, A.; Petit, M. Ionospheric Techniques and Phenomena. Geophys. Astrophys. Monogr. 1978, 13, 284. [Google Scholar]
  36. Bilitza, D.; Pezzopane, M.; Truhlik, V.; Altadill, D.; Reinisch, B.W.; Pignalberi, A. The International Reference Ionosphere model: A review and description of an ionospheric benchmark. Rev. Geophys. 2022, 60, e2022RG000792. [Google Scholar] [CrossRef]
  37. Bilitza, D. Implementation of the new electron temperature model in IRI. Adv. Space Res. 1985, 5, 117–121. [Google Scholar] [CrossRef]
  38. Brace, L.H.; Theis, R.F. Global empirical models of ionospheric electron temperature in the upper F-region and plasmasphere based on in situ measurements from atmosphere explorer C, ISIS 1 and ISIS 2 satellites. J. Atmos. Terr. Phys. 1981, 43, 1317–1343. [Google Scholar] [CrossRef]
  39. Spenner, K.; Plugge, R. Empirical model of global electron temperature distribution between 300 and 700 km based on data from AEROS-A. J. Geophys. 1979, 46, 43–56. [Google Scholar]
  40. Truhlik, V.; Bilitza, D.; Třísková, L. A new global empirical model of the electron temperature with inclusion of the solar activity variations for IRI. Earth Planets Space 2012, 64, 531–543. [Google Scholar] [CrossRef]
  41. Bilitza, D.; Xiong, C. A solar activity correction term for the IRI topside electron density model. Adv. Space Res. 2021, 68, 2124–2137. [Google Scholar] [CrossRef]
  42. Pignalberi, A.; Giannattasio, F.; Truhlik, V.; Coco, I.; Pezzopane, M.; Consolini, G.; De Michelis, P.; Tozzi, R. On the Electron Temperature in the Topside Ionosphere as Seen by Swarm Satellites, Incoherent Scatter Radars, and the International Reference Ionosphere Model. Remote Sens. 2021, 13, 4077. [Google Scholar] [CrossRef]
  43. Kutiev, I.; Marinov, P. Topside sounder model of scale height and transition height characteristics of the ionosphere. Adv. Space Res. 2007, 39, 759–766. [Google Scholar] [CrossRef]
  44. Chen, Y.; Liu, L.; Le, H. Solar activity variations of nighttime ionospheric peak electron density. J. Geophys. Res. 2008, 113, A11306. [Google Scholar] [CrossRef]
  45. Schunk, R.W.; Nagy, A.F. Electron temperatures in the F region ionosphere: Theory and observations. Rev. Geophys. Space Phys. 1978, 16, 355–399. [Google Scholar] [CrossRef]
  46. Watanabe, S.; Oyama, K.-I. Effects of neutral wind on the electron temperature at a height of 600 km in the low latitude region. Ann. Geophys. 1996, 14, 290–296. [Google Scholar] [CrossRef]
  47. Newell, P.T.; Feldstein, Y.I.; Galperin, Y.I.; Meng, C.I. Morphology of nightside precipitation. J. Geophys. Res. Space Phys. 1996, 101, 10737–10748. [Google Scholar] [CrossRef]
  48. Watanabe, S.; Oyama, K.I.; Abe, T. Electron temperature structure around mid-latitude ionospheric trough. Planet. Space Sci. 1989, 37, 1453–1460. [Google Scholar] [CrossRef]
  49. Su, F.; Wang, W.; Burns, A.G.; Yue, X.; Zhu, F. The correlation between electron temperature and density in the topside ionosphere during 2006–2009. J. Geophys. Res. Space Phys. 2015, 120, 10724–10739. [Google Scholar] [CrossRef]
  50. Pignalberi, A.; Giannattasio, F.; Truhlik, V.; Coco, I.; Pezzopane, M.; Alberti, T. Investigating the main features of the correlation between electron density and temperature in the topside ionosphere through Swarm satellites data. J. Geophys. Res. Space Phys. 2024, 129, e2023JA032201. [Google Scholar] [CrossRef]
  51. Bankov, L.; Heelis, R.; Parrot, M.; Berthelier, J.-J.; Marinov, P.; Vassileva, A. WN4 effect on longitudinal distribution of different ion species in the topside ionosphere at low latitudes by means of DEMETER, DMSP-F13 and DMSP-F15 data. Ann. Geophys. 2009, 27, 2893–2902. [Google Scholar] [CrossRef]
  52. Chen, C.Y.; Liu, T.J.Y.; Lee, I.T.; Rothkaehl, H.; Przepiorka, D.; Chang, L.C.; Matyjasiak, B.; Ryu, K.; Oyama, K. The midlatitude trough and the plasmapause in the nighttime ionosphere simultaneously observed by DEMETER during 2006–2009. J. Geophys. Res. Space Phys. 2018, 123, 5917–5932. [Google Scholar] [CrossRef]
  53. Yang, N.; Le, H.; Liu, L. Statistical analysis of ionospheric mid-latitude trough over the northern hemisphere derived from GPS total electron content data. Earth Planets Space 2015, 67, 196. [Google Scholar] [CrossRef]
  54. He, S.; Zhang, D.; Hao, Y.; Xiao, Z. Statistical study on the occurrence of the ionospheric mid-latitude trough and the variation of trough minimum location over northern hemisphere. Chin. J. Geophys. 2020, 63, 31–46. (In Chinese) [Google Scholar]
  55. Karpachev, A.T. Variations in the winter troughs’ position with local time, longitude, and solar activity in the Northern and Southern Hemispheres. J. Geophys. Res. Space Phys. 2019, 124, 8039–8055. [Google Scholar] [CrossRef]
  56. Horwitz, J.L.; Comfort, R.H.; Richards, P.G.; Chandler, M.O.; Chappell, C.R.; Anderson, P.; Hanson, W.B.; Brace, L.H. Plasmasphere-ionosphere coupling: 2. ion composition measurements at plasmaspheric and ionospheric altitudes and comparison with modeling results. J. Geophys. Res. Space Phys. 1990, 95, 7949–7959. [Google Scholar] [CrossRef]
  57. Schunk, R.W. A mathematical model of the middle and high latitude ionosphere. Pure Appl. Geophys. 1988, 127, 255–303. [Google Scholar] [CrossRef]
Figure 1. Global distribution (a) of DMSP observations and magnetic latitude variation (b) in the electron temperature observed by the DMSP (black solid line) and simulated by the IRI-2020 model (black dash line) at nighttime in the winter hemisphere during geomagnetic quiet time using 2015 as an example. The black, red, and blue dots represent the temperature trough position at the magnetic equator and the crest positions at the middle and high magnetic latitudes. The white solid line represents the magnetic equator, and the dashed lines represent the magnetic latitude line at 20° intervals.
Remotesensing 16 02946 g001
Figure 2. Variation in the temperature characteristic positions with the solar activity year at the equator (a2), the sub-auroral latitude (b) in the NH (b1) and SH (b2), and the auroral latitude (c) in the NH (c1) and SH (c2) for local winter conditions during the geomagnetic quiet (circle solid line) and disturbance (triangle dash line) time. (a1) represents the annual average F10.7.
Remotesensing 16 02946 g002
Figure 3. Variations in the electron temperature (red line) and density (blue line) within the temperature characteristic zones (crest/trough positions ±2°) at the equator (a2), the sub-auroral latitudes (b) in the NH (b1) and SH (b2), and the auroral latitudes (c) in the NH (c1) and SH (c2) for local winter conditions during the geomagnetic quiet (circle solid line) and disturbance (triangle dash line) time. (a1) represents the annual average F10.7.
Remotesensing 16 02946 g003
Figure 4. Variations in the electron temperature (red line) and density (blue line) for the IRI-2020 simulations within the temperature characteristic zones (crest/trough positions ±2°) at the equator (a2), the sub-auroral latitudes (b) in the NH (b1) and SH (b2), and the auroral latitudes (c) in the NH (c1) and SH (c2) for local winter conditions during the geomagnetic quiet (circle solid line) and disturbance (triangle dash line) time. (a1) represents the annual average F10.7.
Remotesensing 16 02946 g004
Figure 5. Pearson’s correlation coefficient between the electron temperature and density in the temperature characteristic zones at the equator (a2), the sub-auroral latitude (b) in the NH (b1) and SH (b2), and the auroral latitude (c) in the NH (c1) and SH (c2) for local winter conditions during the geomagnetic quiet (circle solid line) and disturbance (triangle dash line) times. (a1) represents the annual average F10.7. All coefficient correlations have a confidence level of 95%, as shown in Appendix B.
Remotesensing 16 02946 g005
Disclaimer/Publisher’s Note: The statements, opinions and data contained in all publications are solely those of the individual author(s) and contributor(s) and not of MDPI and/or the editor(s). MDPI and/or the editor(s) disclaim responsibility for any injury to people or property resulting from any ideas, methods, instructions or products referred to in the content.

