Article

Identification and Deformation Characteristics of Active Landslides at Large Hydropower Stations at the Early Impoundment Stage: A Case Study of the Lianghekou Reservoir Area in Sichuan Province, Southwest China

1
State Key Laboratory of Geohazard Prevention and Geoenvironment Protection, Chengdu University of Technology, Chengdu 610059, China
2
Chengdu Engineering Co., Ltd., Power Construction Corporation, Chengdu 610072, China
*
Author to whom correspondence should be addressed.
Remote Sens. 2024, 16(17), 3175; https://doi.org/10.3390/rs16173175
Submission received: 28 June 2024 / Revised: 16 August 2024 / Accepted: 26 August 2024 / Published: 28 August 2024
(This article belongs to the Topic Landslides and Natural Resources)

Abstract

:
Reservoir impoundment imposes a significant triggering effect on bank landslides. Studying the early identification of landslides and their stability concerning reservoir water levels and rainfall is vital for guaranteeing the safety of residents and infrastructure in reservoir regions. This study proposed a method for establishing a dynamic inventory of active landslides at large hydropower stations using integrated remote sensing techniques, demonstrated at Lianghekou Reservoir. We employed interferometric stacking synthetic aperture radar (stacking-InSAR) technology, small baseline subset interferometric synthetic aperture radar (SBAS-InSAR) technology, and optical satellite images to identify and catalogue active landslides. Moreover, we conducted field investigations to examine the deformation characteristics of landslides. Finally, Pearson’s correlation analysis was employed to evaluate the response between deformation values, reservoir water levels, and rainfall. The results revealed 75 active landslides, including 12 long-term active landslides before impoundment and 63 new landslides after impoundment, which were primarily concentrated in the Waduo and Yazho–Zatou regions. The correlation coefficient between landslide deformation values and the reservoir level was high (0.93), while the correlation coefficient with rainfall was low (0.57). The results of this research offer a crucial foundation for preventing and mitigating landslides in reservoir areas.

1. Introduction

The initial impoundment of a reservoir and its subsequent operation can affect slope stability [1], not only activating ancient landslides but also inducing new landslides, thereby rendering the reservoir area susceptible to geohazards [2,3,4,5]. For example, from 1941 to 1953, 49% of landslides near the Grand Coulee Dam occurred during the initial impoundment, and 30% occurred during drawdown periods [6,7]. In the Three Gorges Reservoir area, the initial impoundment to the highest water level triggered 137 landslides, with an additional 136 landslides occurring after the first rise–fall cycle, while 20, 8, 11, 6, and 10 landslides occurred during the subsequent cycles [8,9,10]. Large hydropower stations like Xiluodu and Baihetan experienced more active landslides at the early impoundment stage. However, the number of landslides decreased as these stations transitioned to normal operation, and the stability of slopes improved [11,12,13,14]. Previous studies have indicated that reservoir water level fluctuations constitute the key triggering factor of landslides at large hydropower stations. Additionally, there is a notable correlation between landslide deformation and seasonal rainfall [15,16,17]. Therefore, early identification and monitoring landslides in reservoir areas, along with quantifying the relationship between landslide deformation and contributing factors, are crucial for effective prevention, control, and mitigation in reservoir areas [18,19].
Due to the complex topography and its notable extent in reservoir areas, traditional methods for identifying and monitoring landslides involve time-consuming and labor-intensive processes. Conversely, interferometric synthetic aperture radar (InSAR) technology offers an efficient alternative for analyzing interferometric information to obtain surface deformation [20]. InSAR technology provides several advantages, including high monitoring accuracy, extensive coverage, superior spatial resolution, and all-weather and all-day operation capabilities, rendering it widely employed in landslide research [21,22,23,24]. The main detection methods are the differential interferometric synthetic aperture radar (D-InSAR), persistent scatterer interferometric synthetic aperture radar (PS-InSAR) [25], small baseline subset interferometric synthetic aperture radar (SBAS-InSAR) [26], and interferometric stacking synthetic aperture radar (stacking-InSAR) [27]. Compared with the D-InSAR technique, stacking-InSAR technology can effectively suppress atmospheric and topographic errors, providing better insights into the range and morphological features of deformation [28]. By setting a specific spatial–temporal baseline threshold, SBAS-InSAR increases the number of connected interferometric pairs, enabling singular value decomposition (SVD) to derive deformation rates and cumulative deformation [29]. This method is better suited for detecting landslide deformation in mountainous areas compared with PS-InSAR technology [30,31,32].
Since the planning and construction of the Lianghekou Reservoir area, relatively few studies have focused on landslides in this region. In 2007, Shen Junhui et al. identified nine relatively large landslides in the Yalong River and analyzed their development patterns and causes [33]. In 2023, Wang Yian et al. proposed a method for the automatic detection and updating of landslide hazards based on InSAR technology, identifying a total of 127 landslides in the Lianghekou Reservoir area, including 18 newly activated landslides following water impoundment [34]. While previous studies have made progress in this field, they predominantly depended on single remote sensing methods and lacked integrated analysis with ground-based surveys. Furthermore, they did not attempt to quantify active landslides at different stages or analyze the quantitative correlation between deformation, reservoir water levels, and rainfall. Therefore, this paper utilized integrated remote sensing technologies to establish a dynamic catalogue of active landslides at the Lianghekou Hydropower Station and analyzed the deformation characteristics and patterns of typical landslides. Additionally, Pearson’s correlation analysis was employed to evaluate the relationships among deformation values, reservoir water levels, and rainfall.

2. Study Area

Lianghekou Hydropower Station, situated in Yajiang County, Ganzi Tibetan Autonomous Prefecture, Sichuan Province, China (Figure 1a,b), serves as the pivotal reservoir power station on the main stem of the Yalong River. The dam lies approximately 2 km downstream from the confluence of the Yalong River and its tributary, the Xianshui River. The reservoir area consists of three parts: the Yalong River, the Xianshui River, and the Qingda River (Figure 1c). The water storage plan is divided into three stages. The first stage (R-1) spanned from November 2020 to April 2021, during which the water level rose from 2610.0 to 2675.5 m. The second stage (R-2) spanned from May 2021 to April 2023, during which the water level increased to 2785.0 m. The third stage (R-3) extends from May 2023 to March 2024, during which the water level will reach a normal storage level of 2865.0 m (Figure 1d).
The Lianghekou reservoir is characterized by a typical alpine canyon landscape with complex geological formations. The exposed strata primarily comprise Triassic shallow metamorphic sandstone and slate. The main tectonic structure is the Yajiang Arc fold zone, with the apex of the arc facing south. The reservoir area exhibits limited fault development, with only small secondary faults observed (Figure 1e). The seismic zoning map indicates that the study area falls within the medium-risk zone (potential seismic intensity VI). No seismic events have been recorded in the study area or its vicinity from 2017 to 2024 (Figure 1b). Thus, it can be inferred that earthquakes have a minimal impact on landslides within the reservoir area.

3. Data and Methodology
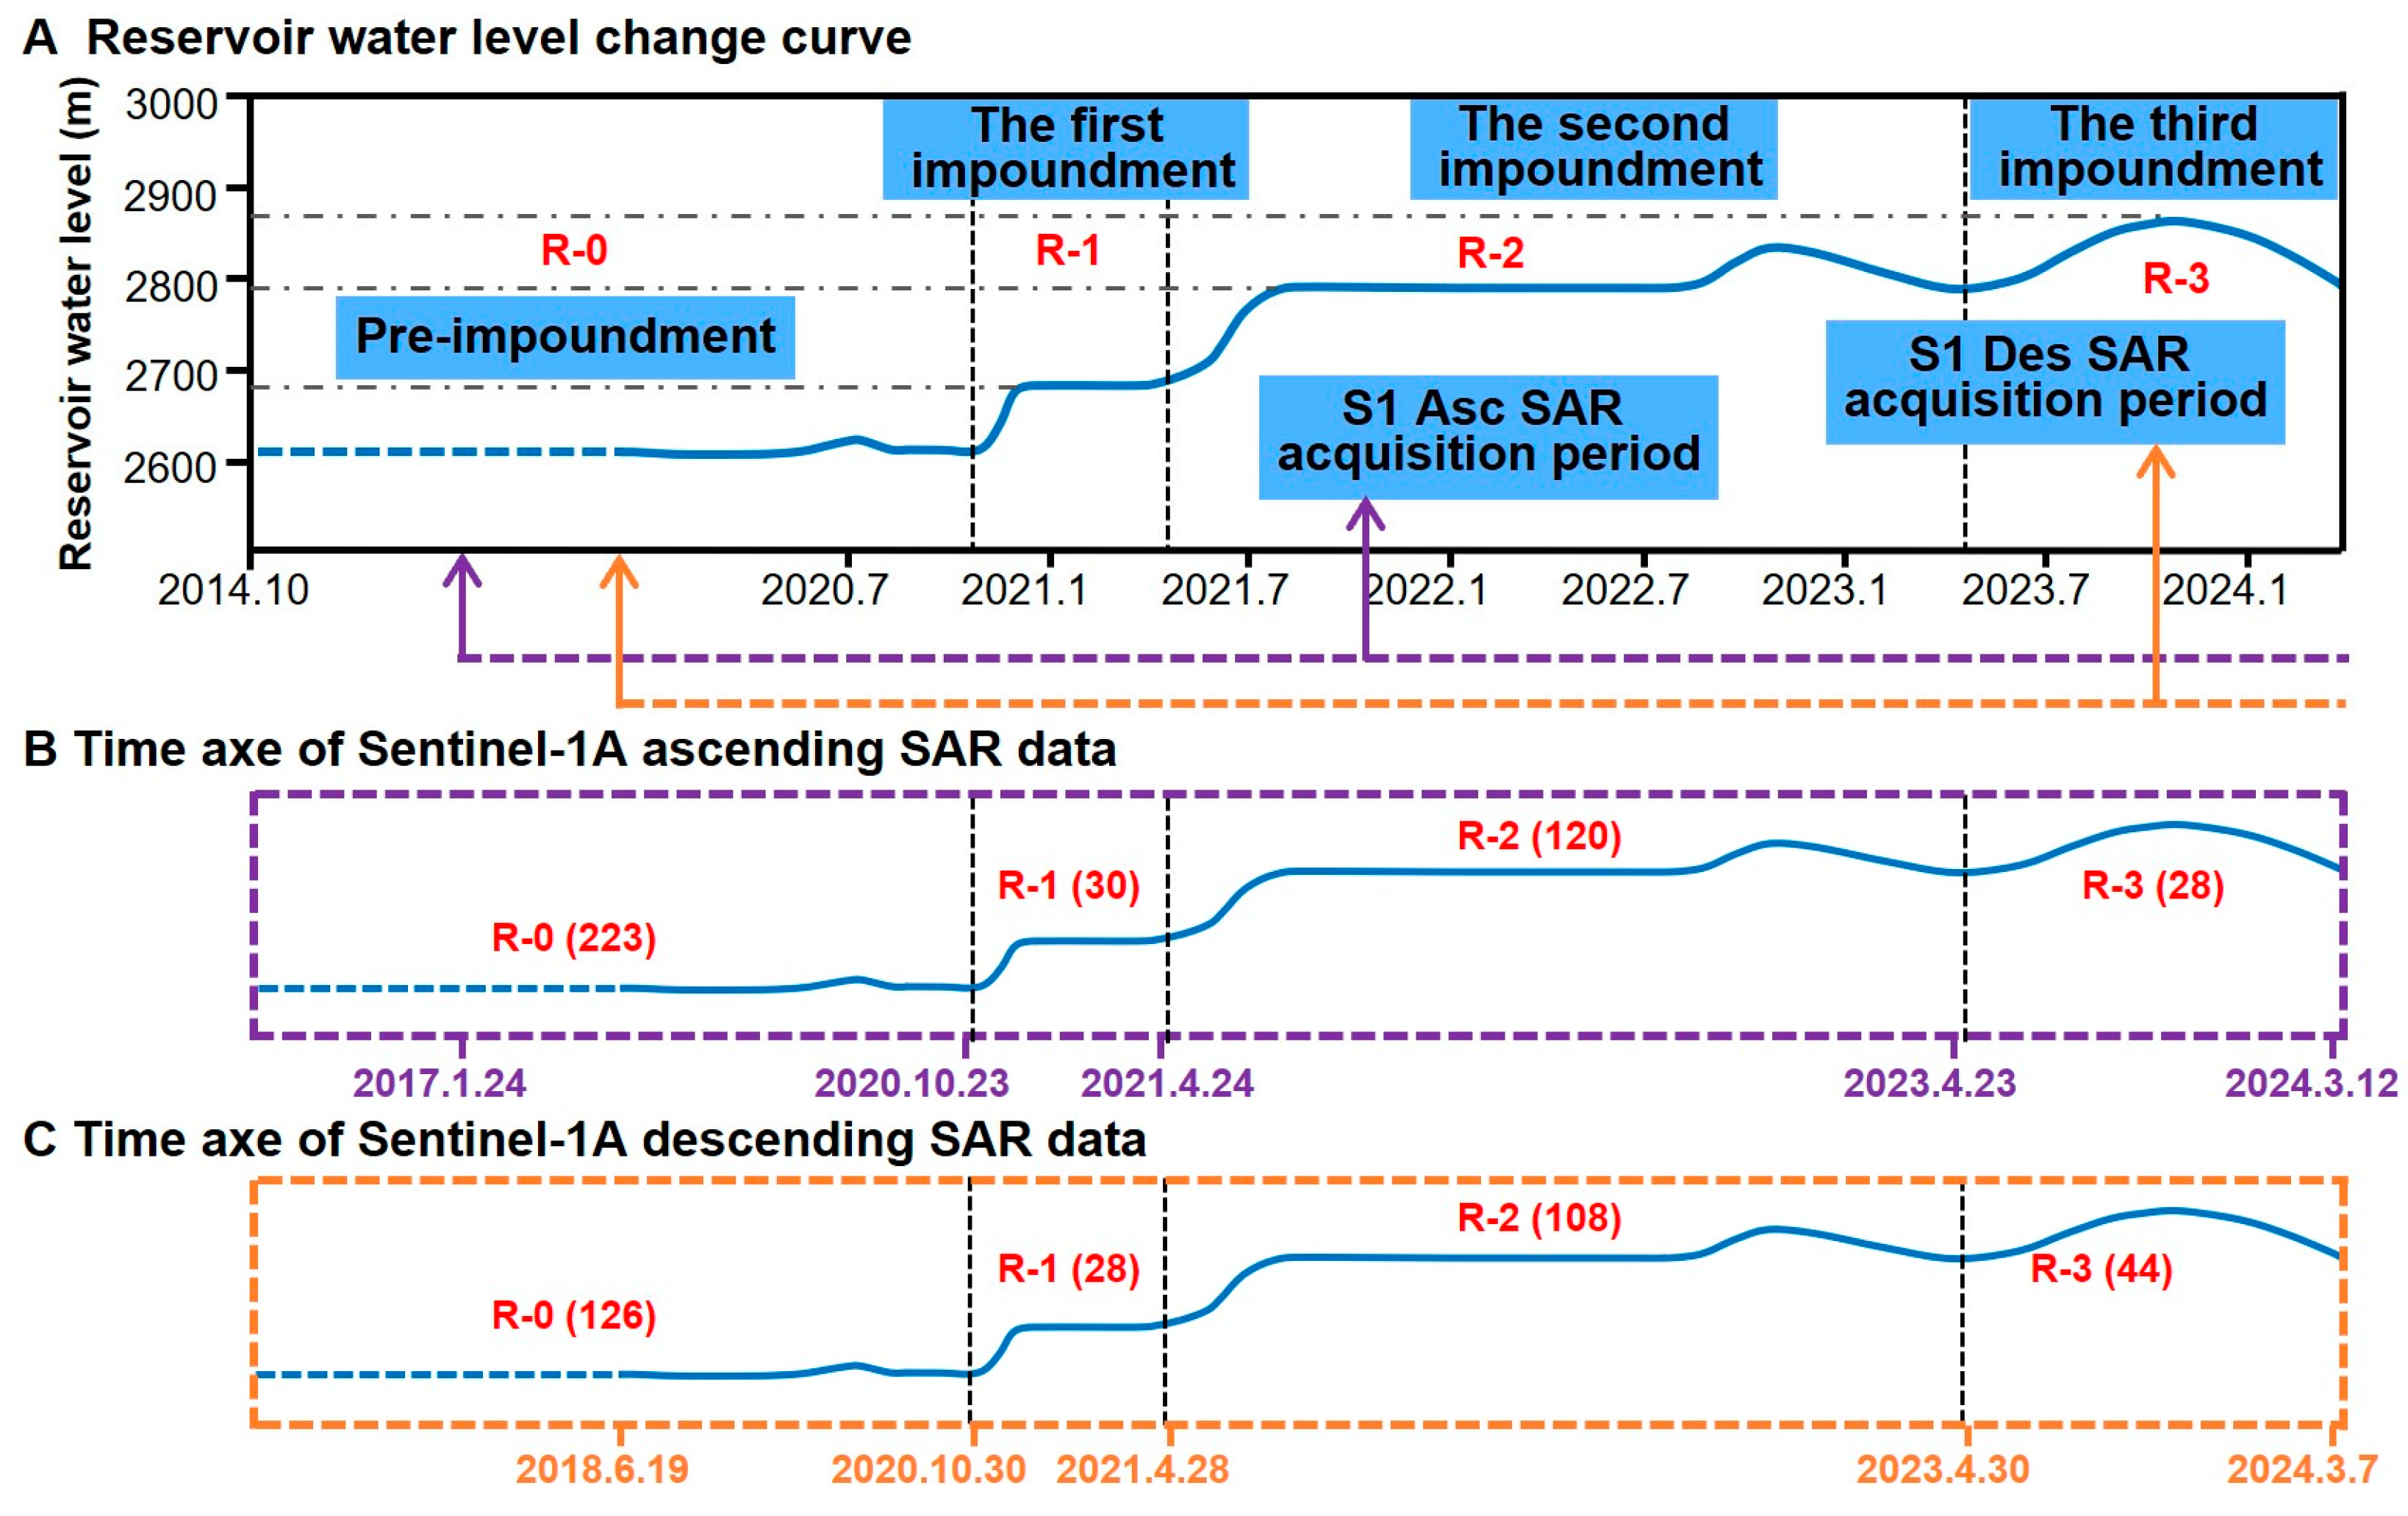
3.1. Data

We gathered Sentinel-1A radar images covering the study area (Figure 1b), including both ascending images along path 26 and descending images along path 135. The fundamental parameters of SAR dataset are listed in Table 1. To correct the baseline error of the interferograms, precise orbiting ephemeris data of the Sentinel-1A satellite were also collected. Additionally, digital elevation model (DEM) data from the advanced land observing satellite (ALOS), with a resolution of 12.5 m, were acquired for suitability analysis of SAR data, terrain phase removal during processing, and geocoding assistance.
In addition, Gaofen-2 satellite images (0.8 m resolution) covering the study area were gathered, and remote sensing data platforms such as Google Earth Pro and Sky Map were utilized for landslide identification. UAV and airborne LiDAR data were also collected, primarily for analyzing the topography, geomorphology, signs of deformation, and structural attributes of landslides. In the subsequent analysis, reservoir water levels and rainfall data were used. Daily samples were collected for both variables. Rainfall data, covering the period from 24 January 2017 to 12 March 2024, were obtained from the Daofu meteorological station (Figure 1c). Reservoir water level data, supplied by Chengdu Engineering Corporation Limited, Power China, were recorded from 9 January 2020 to 12 March 2024.

3.2. Methods

The methodological approach of this study involved three key steps, as illustrated in Figure 2. First, stacking-InSAR technology was employed to determine the deformation area and analyze the morphological features and signs of deformation in combination with high-resolution optical satellite images for identifying landslide boundaries, and establishing a dynamic landslide inventory. Then, SBAS-InSAR, UAV, airborne LiDAR, and field investigations were utilized to conduct a detailed analysis of the deformation characteristics and patterns of typical landslides, integrating rainfall and reservoir water levels data. Finally, Pearson’s correlation analysis was employed to evaluate the relationships among deformation values, reservoir water levels, and rainfall.

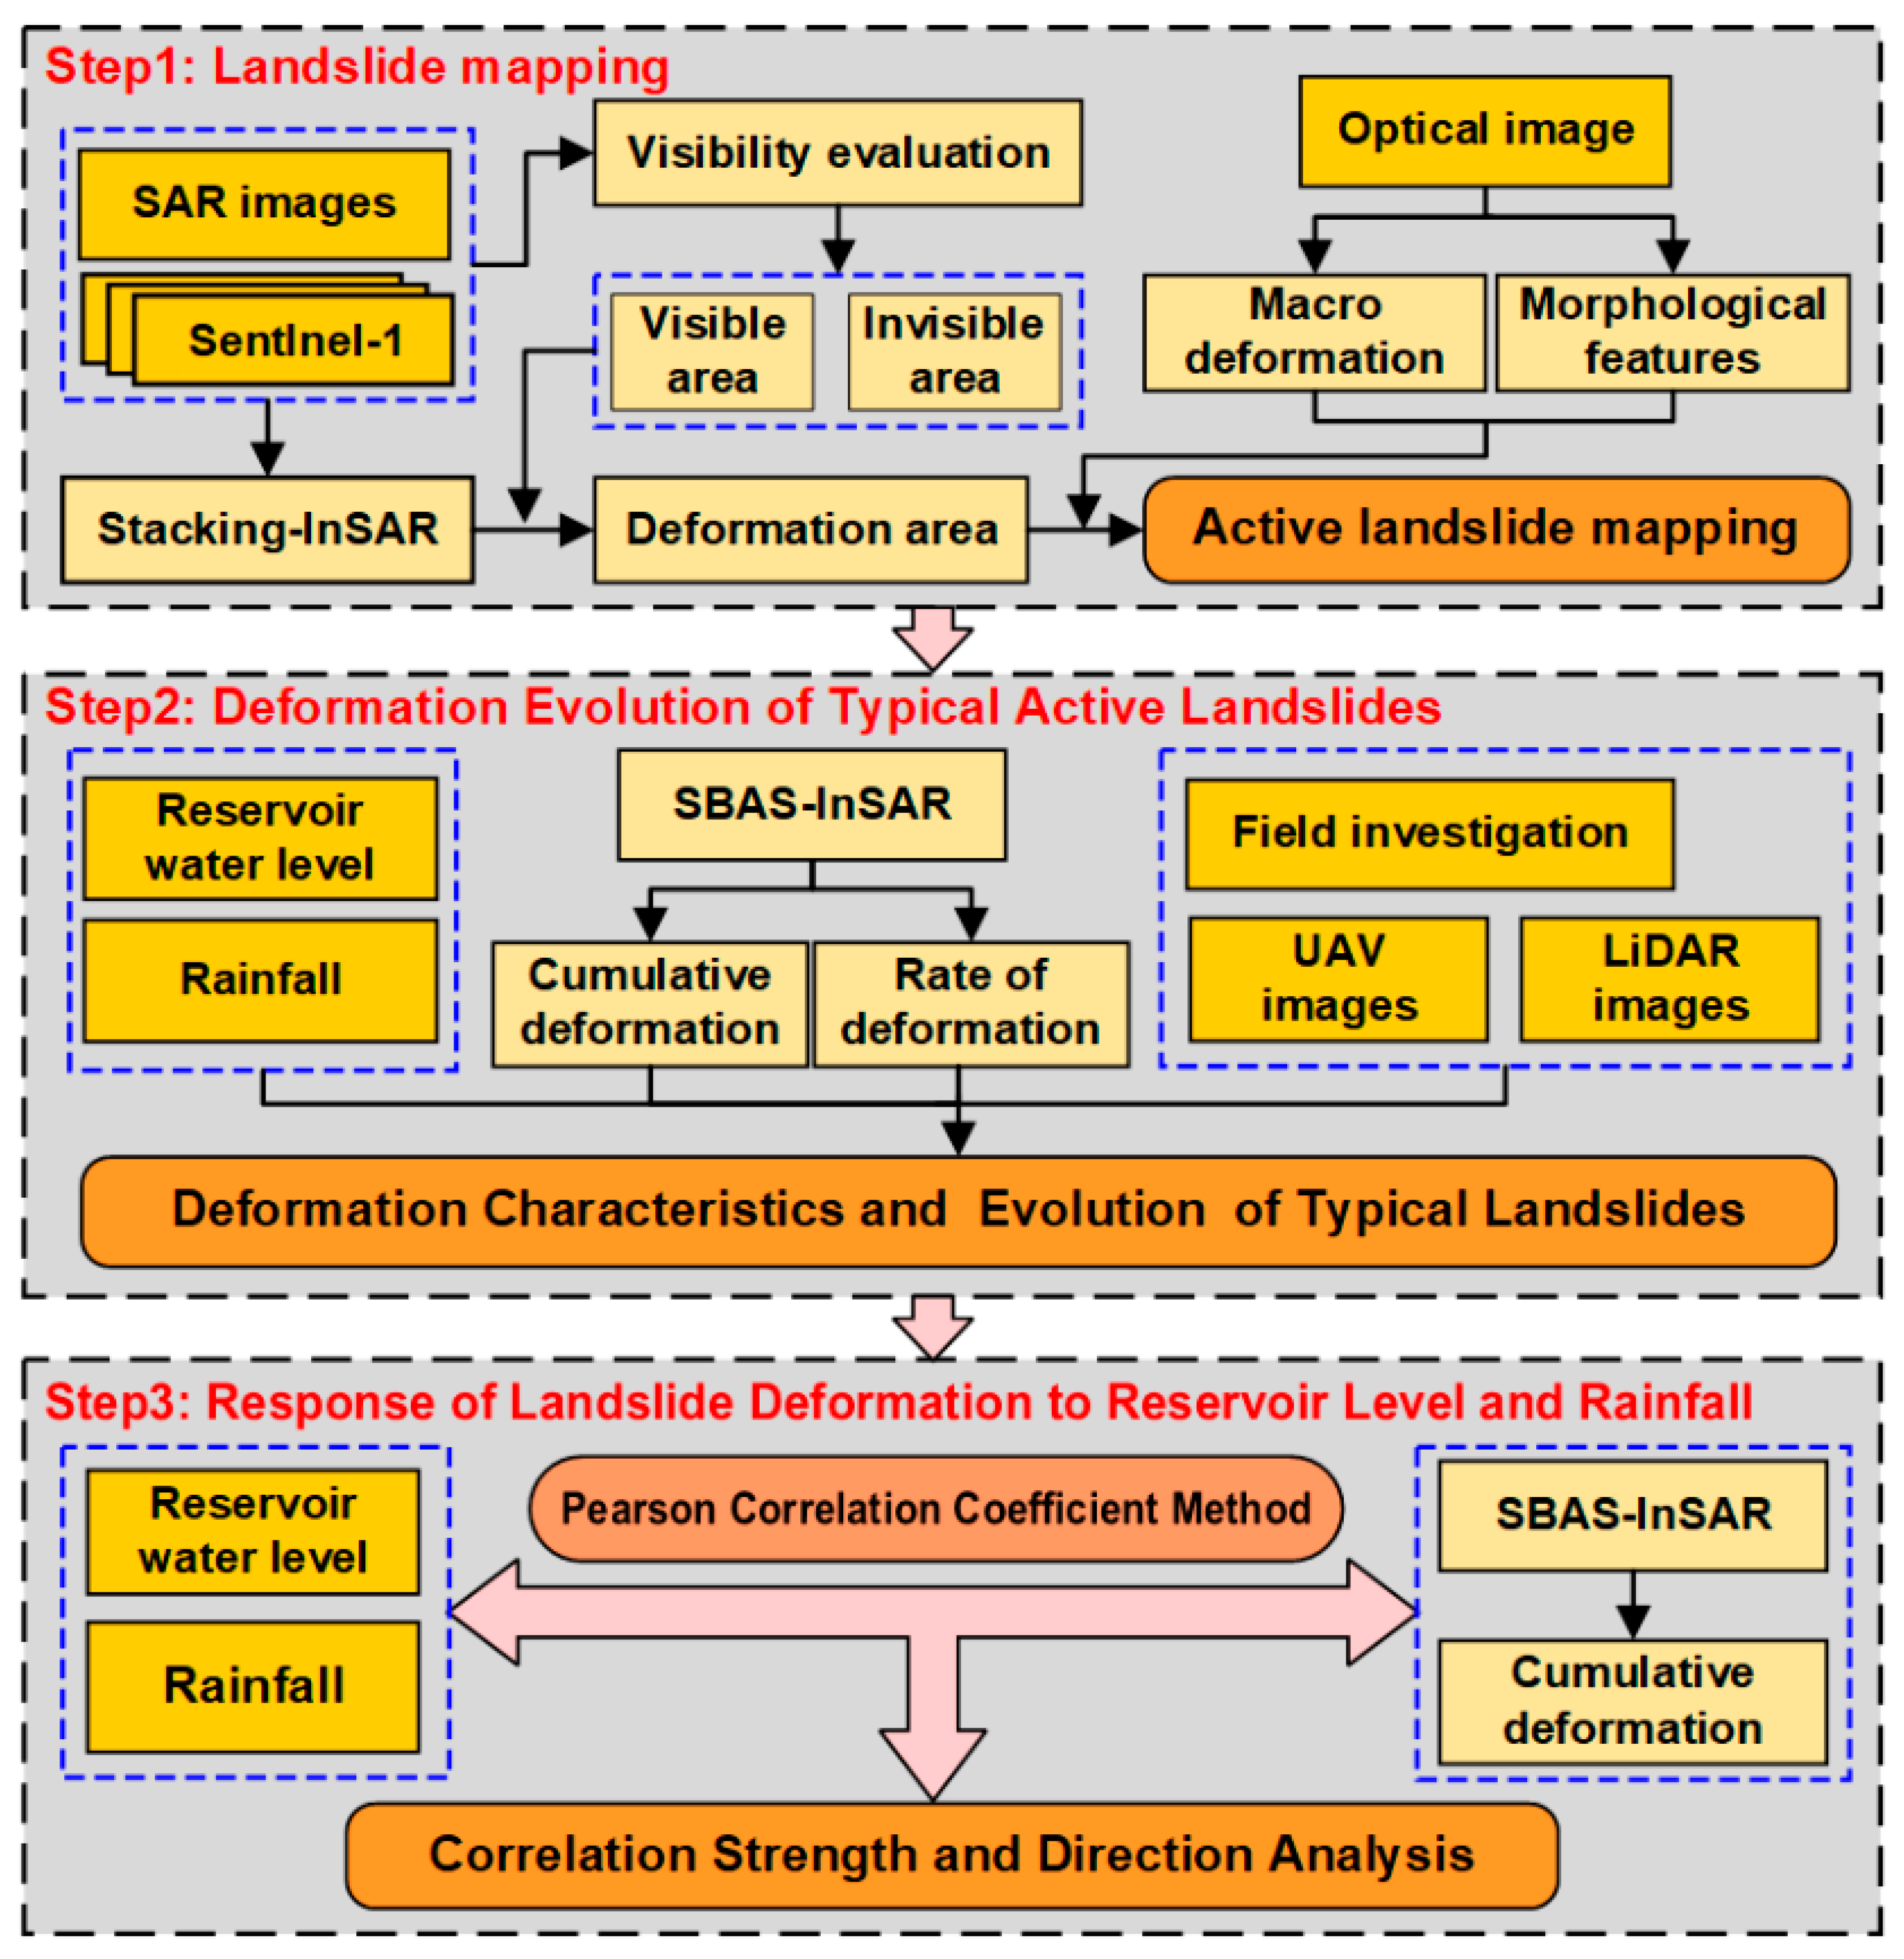
3.2.1. Identification of Active Landslides

In this study, stacking-InSAR technology was employed to detect surface deformation. This technique can provide more accurate surface deformation information by stacking the de-entangled phases of multiple differential interferograms and applying weighted averaging, with the time baseline serving as a weighting factor. The application of this process effectively mitigates the impact of atmospheric and DEM errors. Figure 3A shows the water storage plan of the Lianghekou Hydropower Station, which can be divided into four stages. To establish a dynamic active landslide inventory for determining the number of active landslides during different phases, ascending and descending track data were categorized based on the impoundment plan (Figure 3B,C). The data were processed using GAMMA software (v18.04) to generate stacked phase maps of each phase for identifying deformation anomaly areas. Figure 4 shows the stacked phase maps obtained at each stage, wherein the denser interference fringes and greater color changes indicate greater deformation phase. These characteristics delineate deformation anomaly regions (depicted in yellow).
Surface deformation is caused not only by landslides but also by snow and ice melting and human engineering activities (depicted in red). Deformation resulting from human engineering activities is mainly due to the flooding of old roads at lower elevations after water storage and local deformation due to new road construction (Figure 5a,b). Moreover, the deformation caused by snow and ice melting is mainly manifested in the aggregated strip-shaped deformation areas (Figure 5c,d). Notably, only a part of the landslide may be detected with the InSAR technique, which does not represent its complete shape (Figure 6). Therefore, it is essential to verify the identified deformation anomaly area using optical satellite images and to delineate the boundary of the landslide. Landslide identification criteria are classified into two primary categories: morphological features and macro-deformations. Morphological features include armchair or tongue-shaped boundaries, the landslide scarp at the rear edge, mid-slope characteristics such as terraces or closed depressions, and compression of river channels at the front edge. Macro-deformations include rear-edge fissures, localized collapses, and secondary landslides at the front edge [35] (Figure 7).

3.2.2. Temporal Analysis of Deformation in Active Landslides

To analyze the time series deformation characteristics of landslides, SBAS-InSAR technology was used to extract historical deformation variables and annual average deformation rate data. The SBAS-InSAR technique relies on short spatio-temporal baselines to generate sequence interferograms from multi-master images. First, the differential interferometric phase undergoes spatial filtering. Subsequently, slowly decorrelating filtered phase pixel are identified based on average spatial coherence. This is followed by three-dimensional phase untangling and singular value decomposition being performed to solve the single principal image phase sequence. Finally, a filtering technique is used to separate the atmospheric delay phases to obtain information on terrain elevation errors and deformation sequences [27].

3.2.3. Pearson Correlation Analysis

Although the time series deformations for landslides obtained by SBAS-InSAR can be used to analyze the relationships with potential triggers, these analyses often lack quantitative information. To bridge this gap, this paper employs Pearson’s correlation coefficient method for quantitative analysis to evaluate the relationship between deformation values, reservoir water levels, and rainfall. Pearson’s correlation coefficient, representing the covariance normalized by the product of the standard deviations of two variables, can be computed using the following formula:
r = σ x y σ x 2 σ y 2
where r represents the Pearson correlation coefficient, σ x denotes the standard deviation of variable X, σ y denotes the standard deviation of variable Y, σ x y and denotes the covariance between variables X and Y. The value range is (−1, 1). An |r| value close to 1 indicates a higher correlation between variables X and Y. When |r| ≥ 0.8, the variables exhibit high correlation; when 0.5 ≤ |r| < 0.8, the correlation is moderate; when 0.3 ≤ |r| < 0.5, the correlation is weak; and when |r| < 0.3, the variables are essentially uncorrelated [36].
To ensure temporal consistency in the Pearson correlation analysis, data on rainfall, reservoir water levels, and deformation were collected at regular intervals. Although the Sentinel-1A satellite has a fixed 12-day revisit cycle, some images may be missing or excluded during processing, which results in an uneven temporal distribution of deformation values. To address this issue, linear interpolation was employed to fill in the missing data. Notably, linear interpolation introduces only constant or DC components in the frequency domain, thus avoiding the introduction of spurious periodicities [37]. Rainfall and reservoir water level data, initially collected daily, were downsampled to align with the InSAR time series, using 12-day cumulative rainfall and 12-day average water levels as representative values for each time point.

4. Results

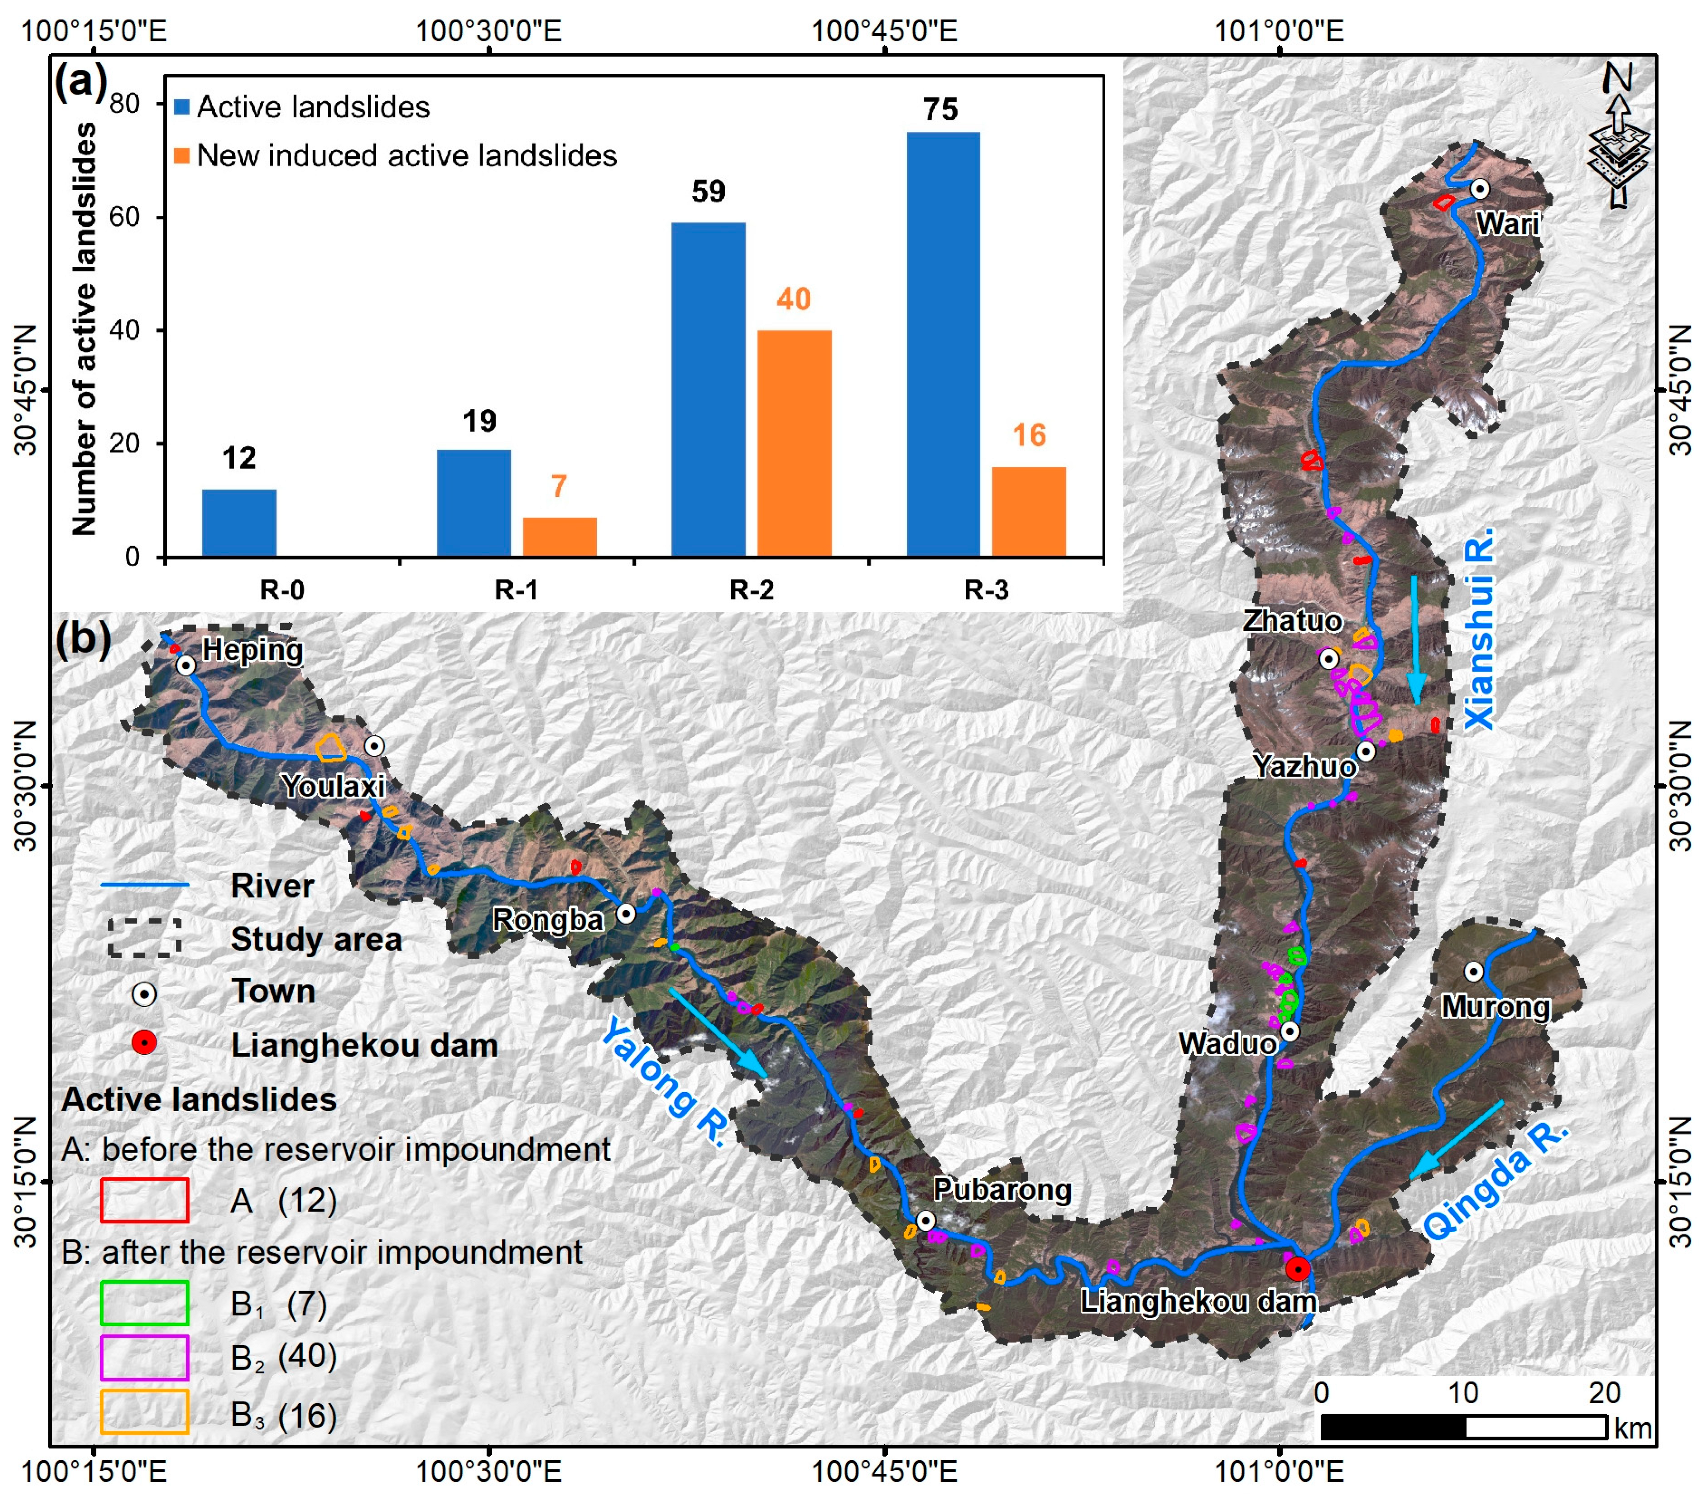
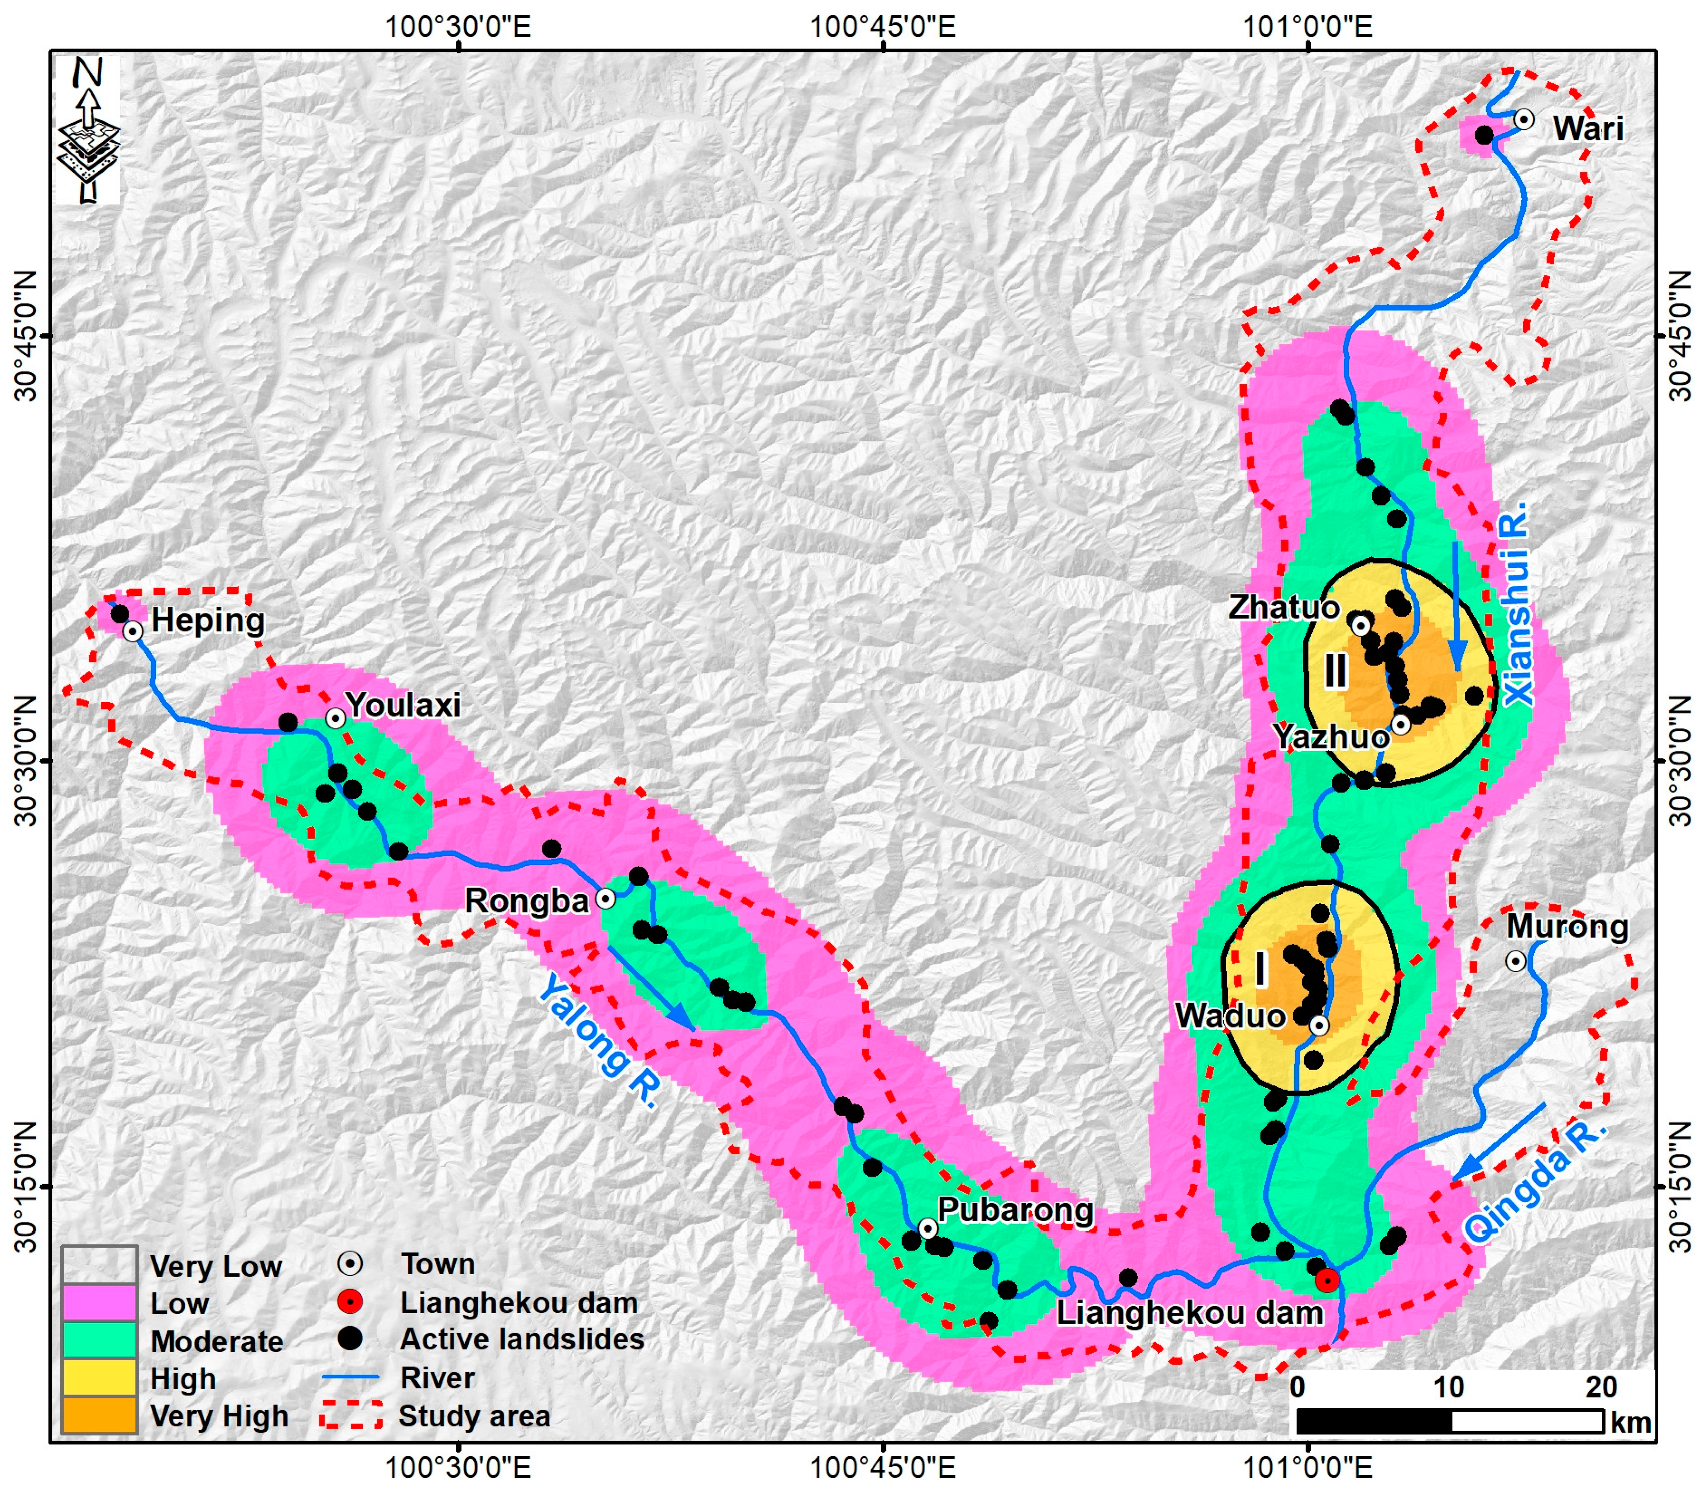
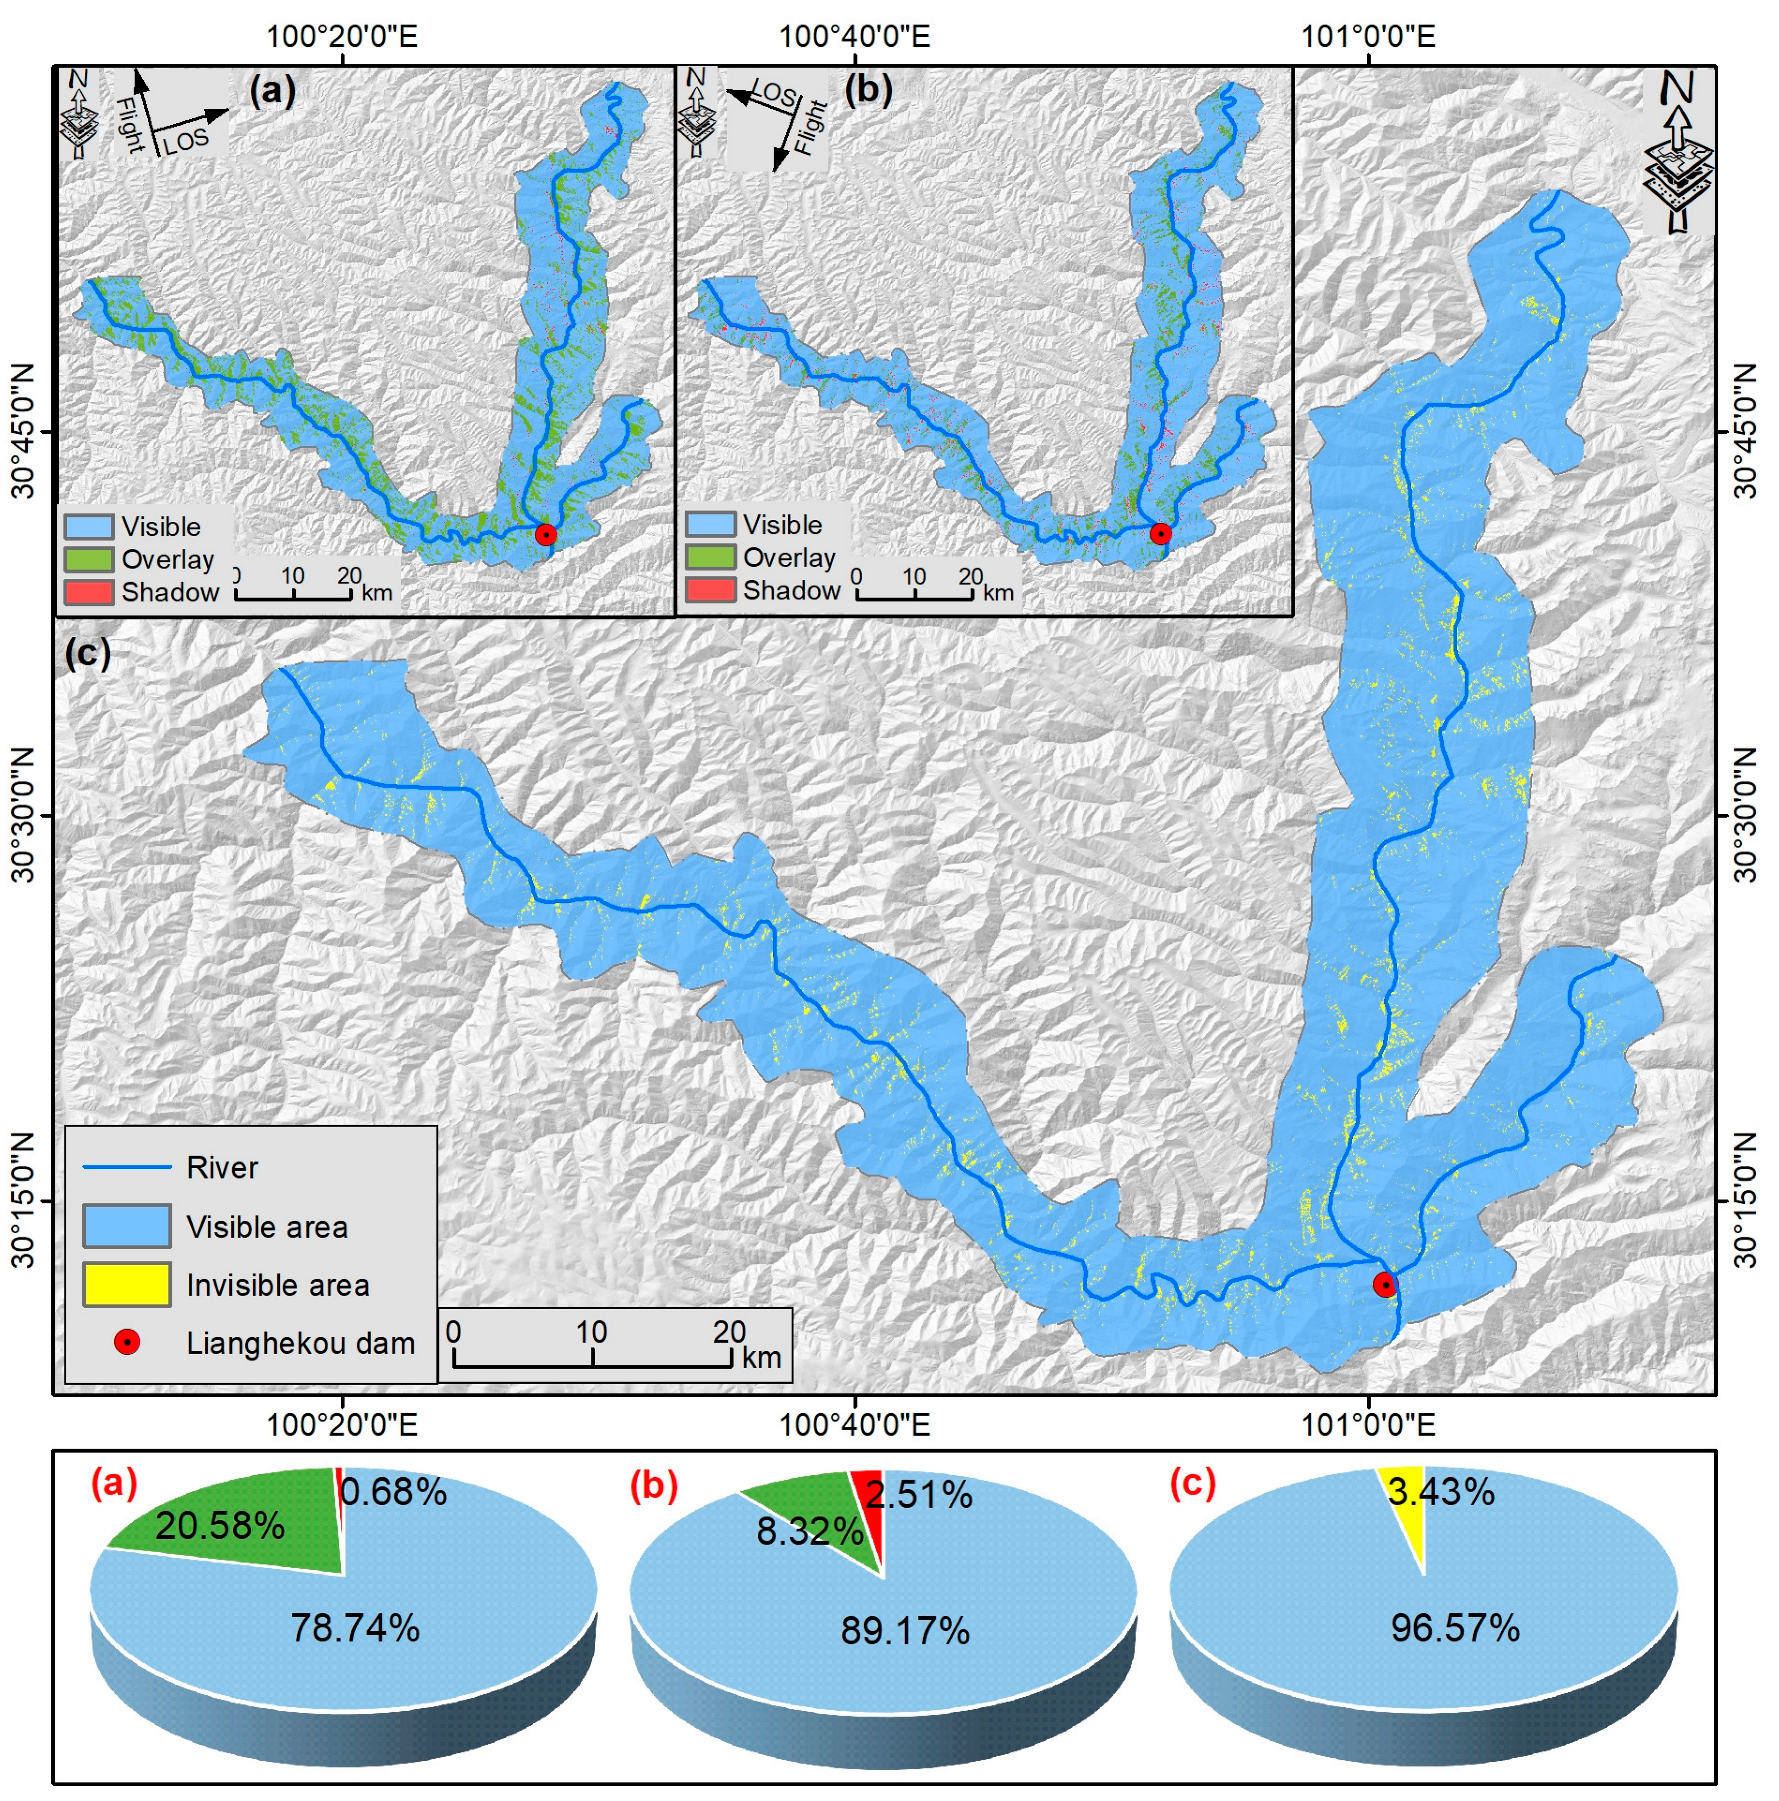
4.1. Active Landslide Identification Results

A total of 75 active landslides were identified in this study, including 12 long-term active landslides before water storage and 63 new landslides after water storage. The results revealed that as the water level gradually increased, the number of active landslides also progressively increased, with the greatest number of new landslides occurring at the R-2 stage. The number of active landslides at each stage is shown in Figure 8a. Specifically, 19 landslides were identified at the R-1 stage, including 7 newly observed landslides; 59 landslides were observed at the R-2 stage, including 40 newly identified landslides; and 75 active landslides were noted at the R-3 stage, with 16 new landslides (Figure 8b).
The identified active landslides were mainly concentrated in the Xianshui River, totaling 47 locations, accounting for 62.7% of all landslides, and their distribution exhibited obvious asymmetry, mainly concentrated on the right bank, with 34 locations, followed by the Yalong River, with 26 locations, accounting for 34.7% of all landslides. Moreover, the distributions of landslides on the two banks were very consistent, with 15 and 11 locations on the left and right banks, respectively. In contrast, geohazards in the Qingdao River area were less extensive, occurring at only two locations, representing 2.7% of all landslides (Table 2). The Gaussian kernel density of landslides was calculated using the kernel density analysis tool in ArcGIS software (v10.8), and the outcomes are depicted in Figure 9. Along the banks of the Xianshui River, there were two notably concentrated areas: Zone I and II. Zone I was located in the Waduo region, covering approximately 128.6 km2, with a total of 17 active landslides and an average density of about 0.1 landslides/km2. Zone II was located in the Yazhuo–Zatou region, covering approximately 157.1 km2, with a total of 20 active landslides and an average density of about 0.1 landslides/km2. The distribution of landslides along the Yalong River was very uniform, with no notable local concentration.

4.2. Deformation Characteristics of Typical Active Landslides

To investigate the deformation characteristics and patterns of active landslides, this study focused on two representative landslides: the Boluzi landslide (which was active for a long period before impoundment) and the Waduo landslide (which was activated after impoundment). Both landslides are significant in scale, and their potential destabilization poses considerable risks to local residents and major infrastructure projects along reservoir banks.

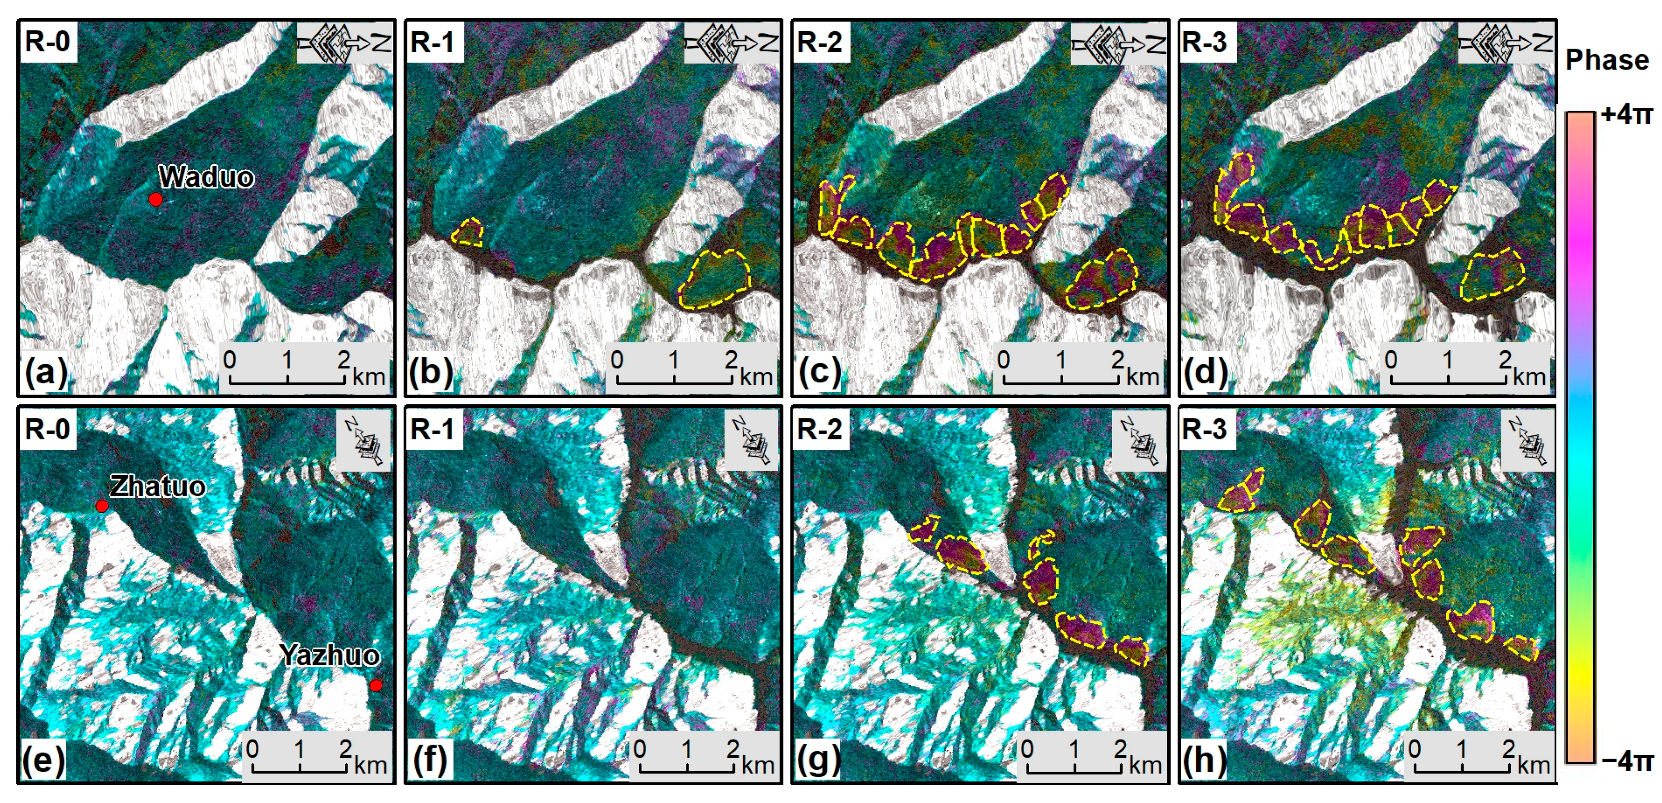
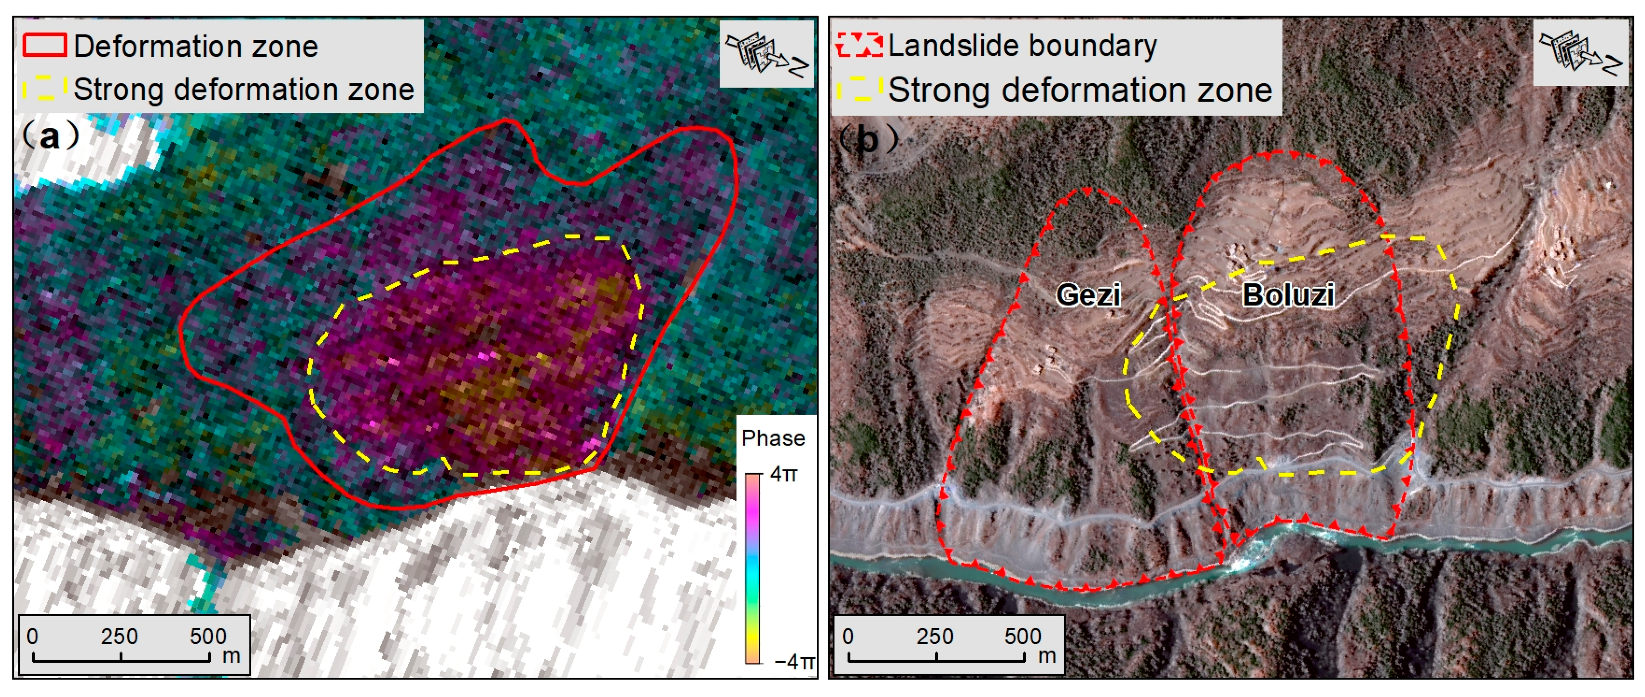
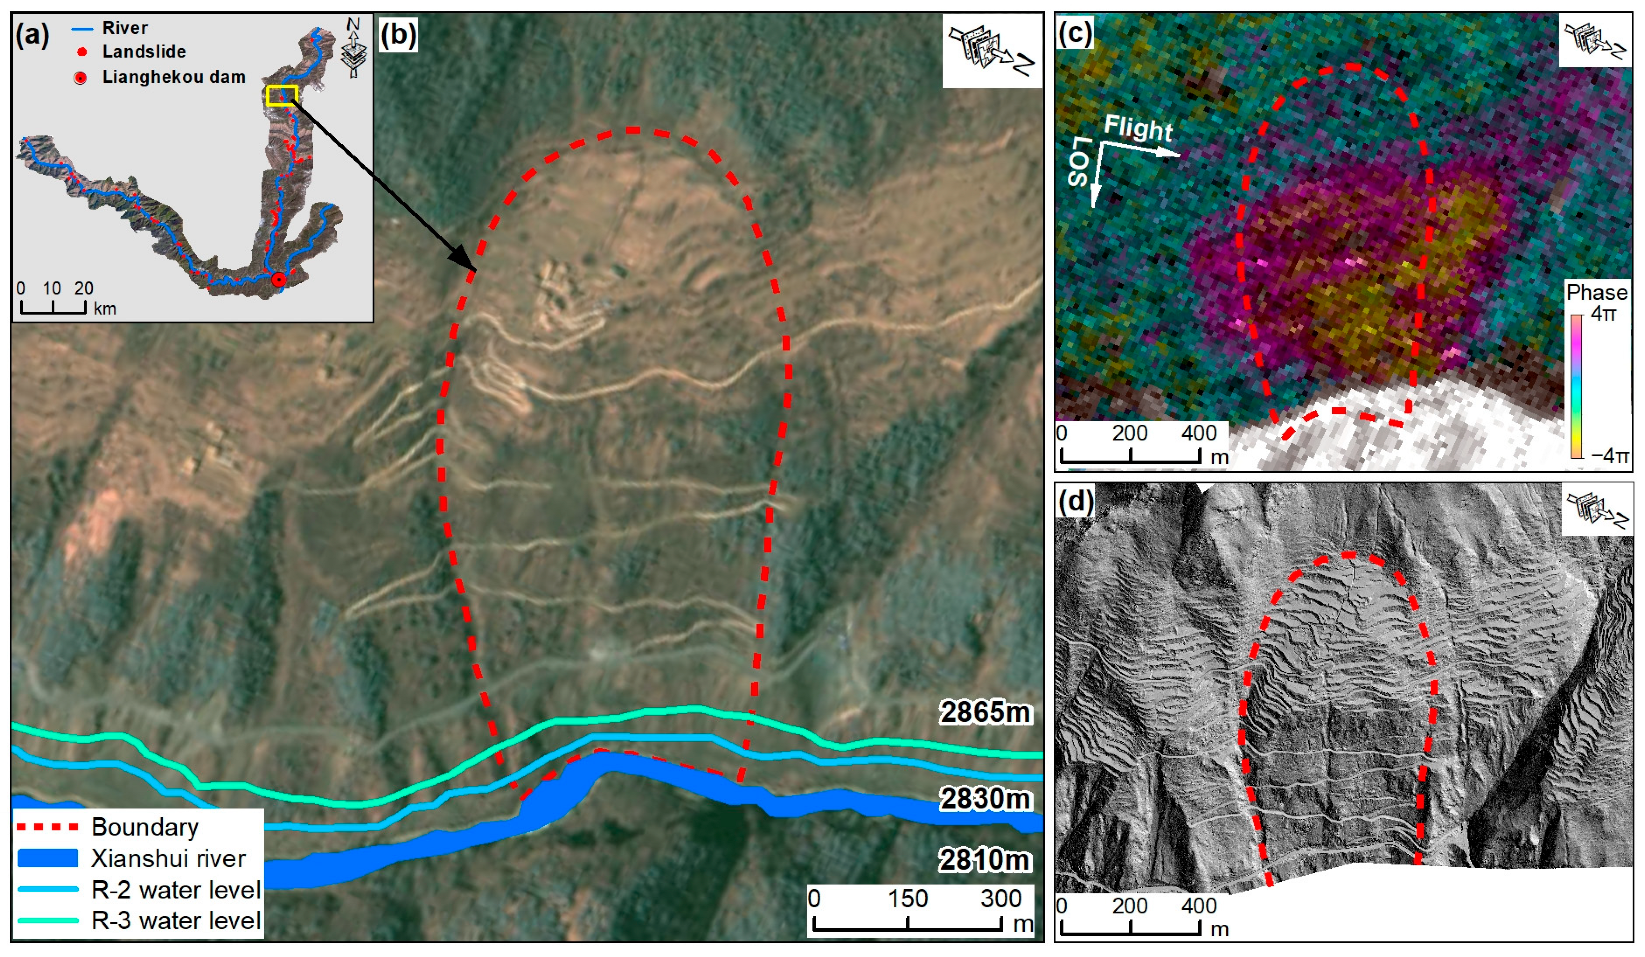
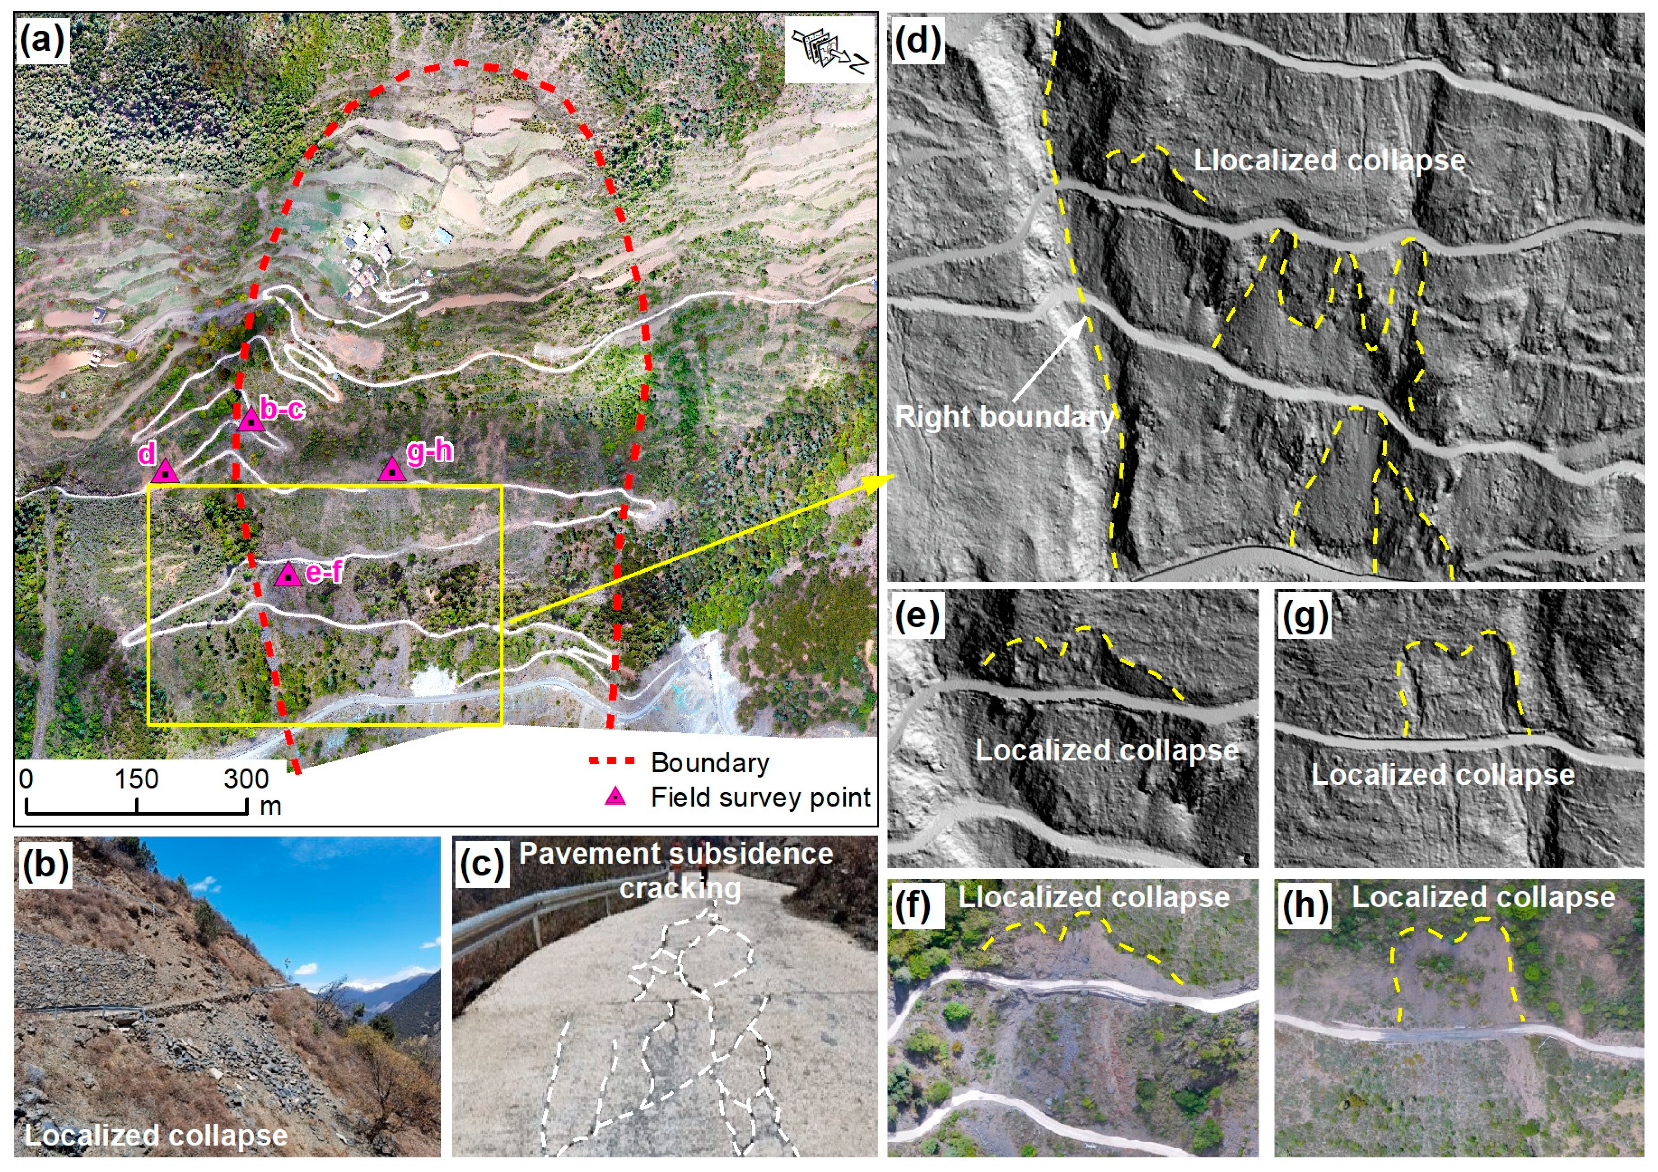
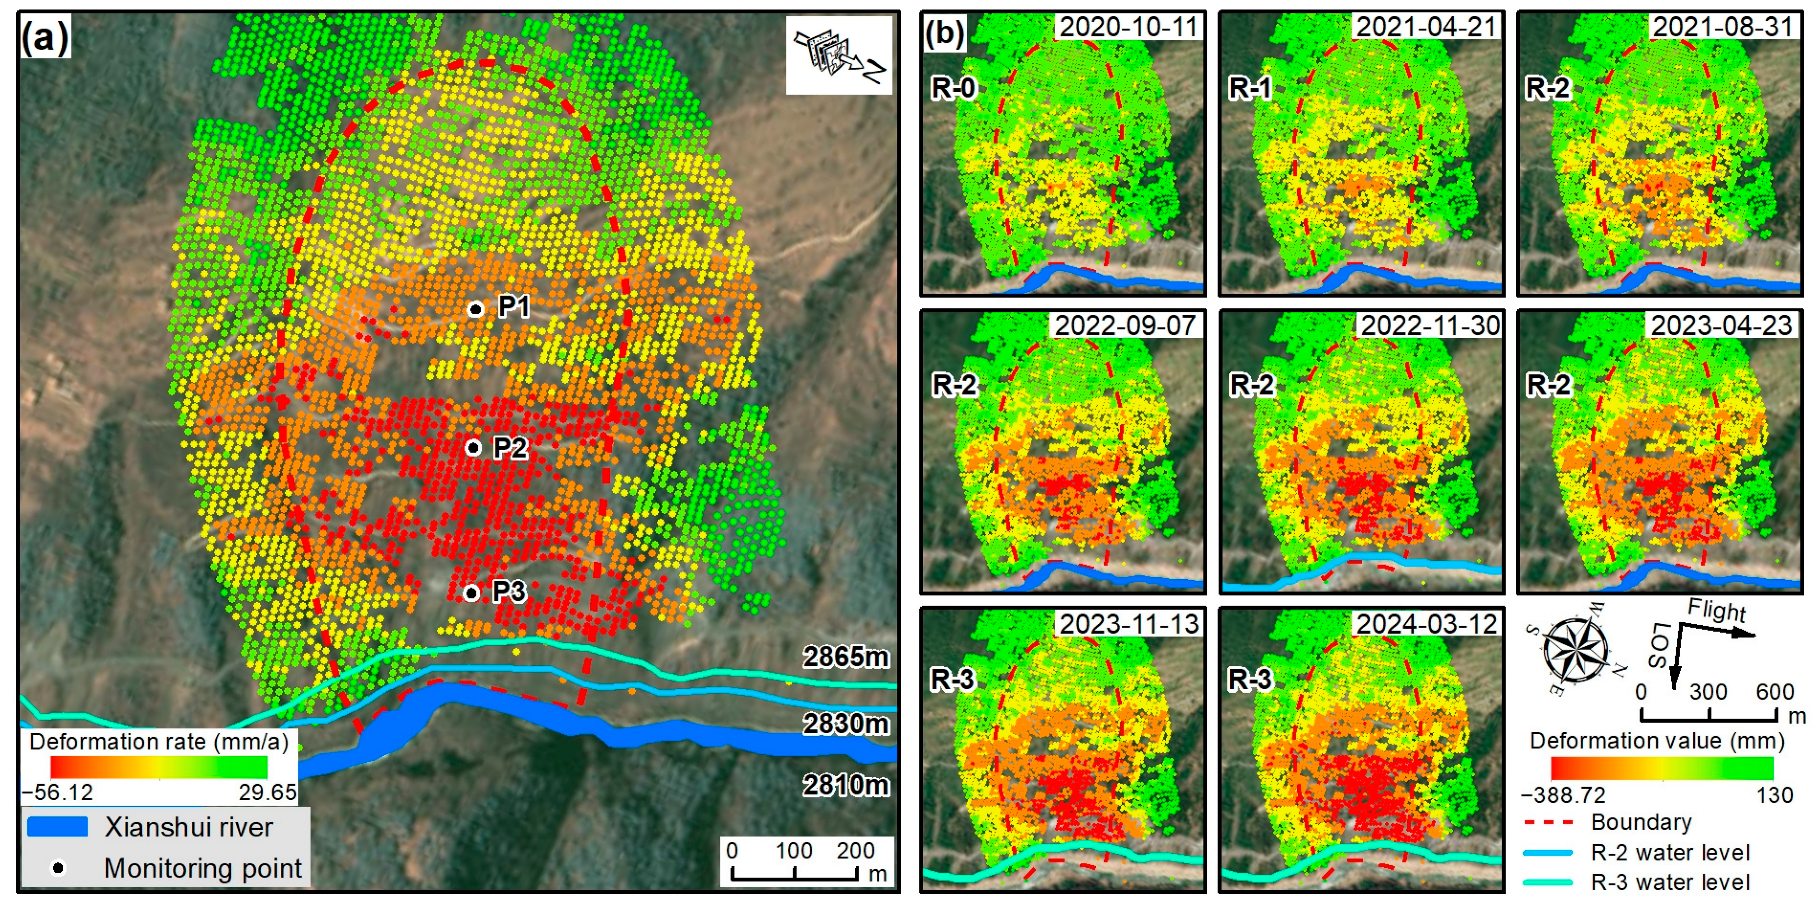
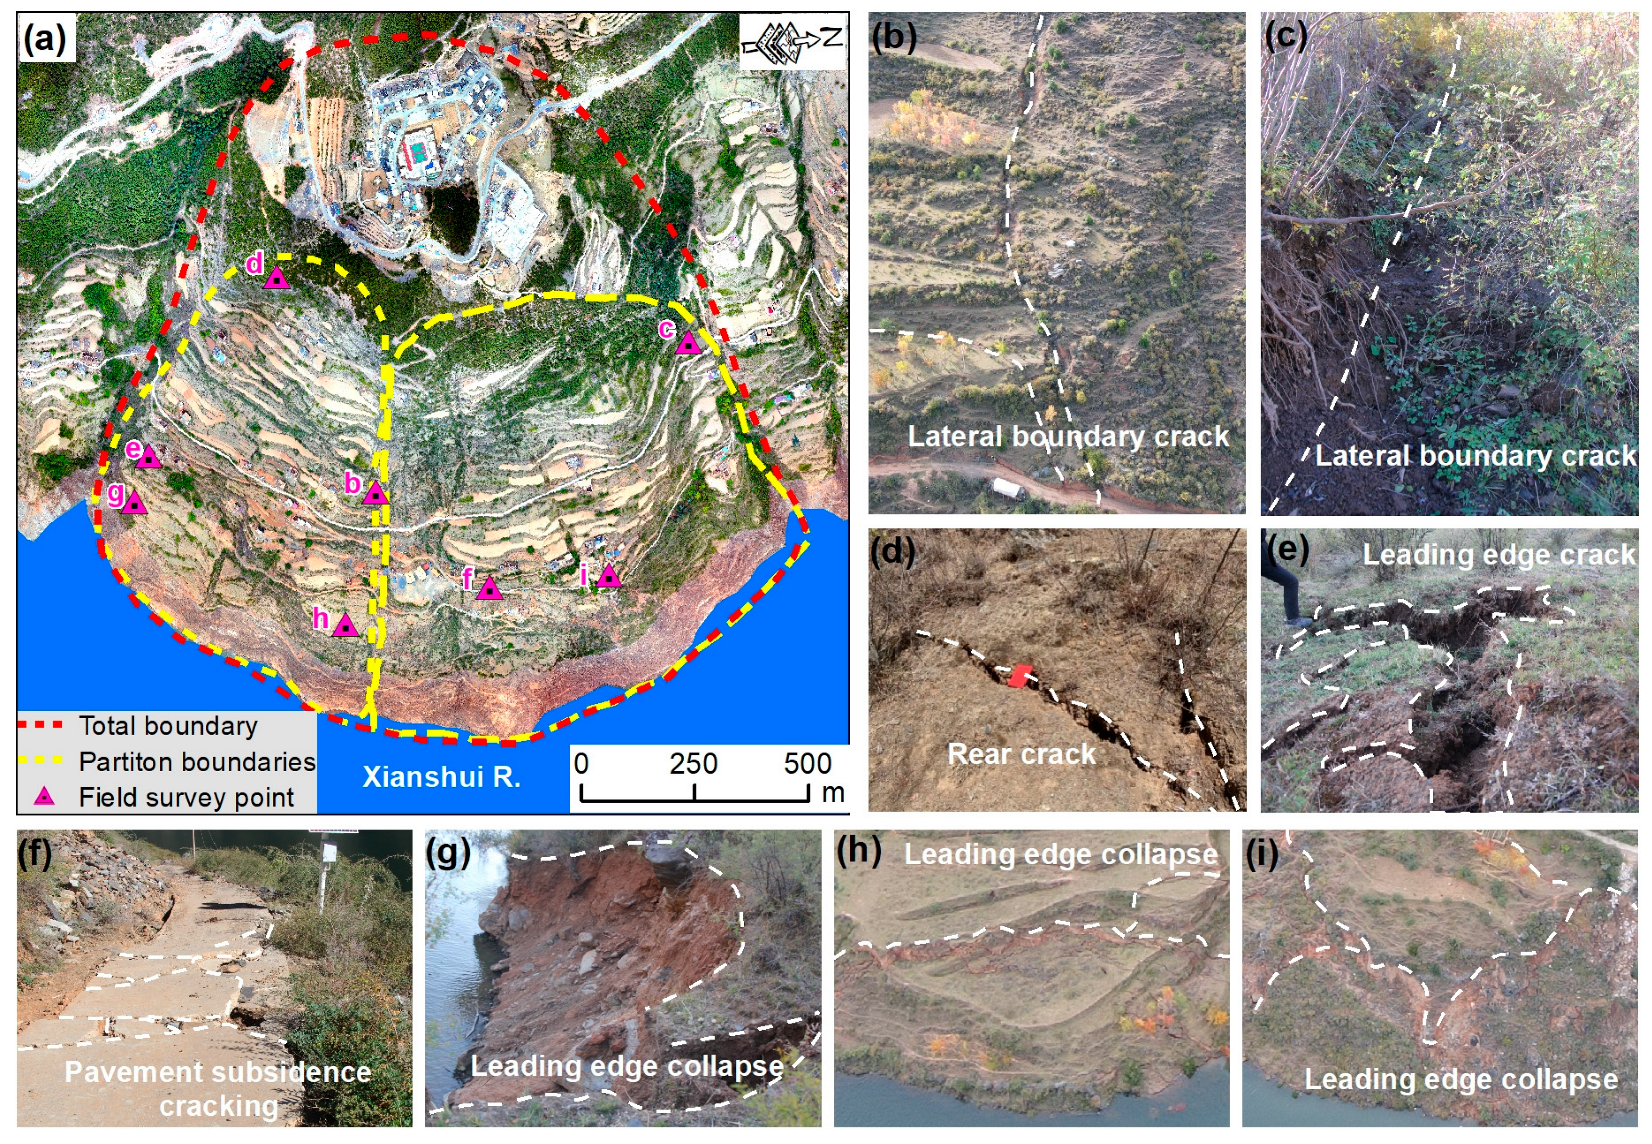
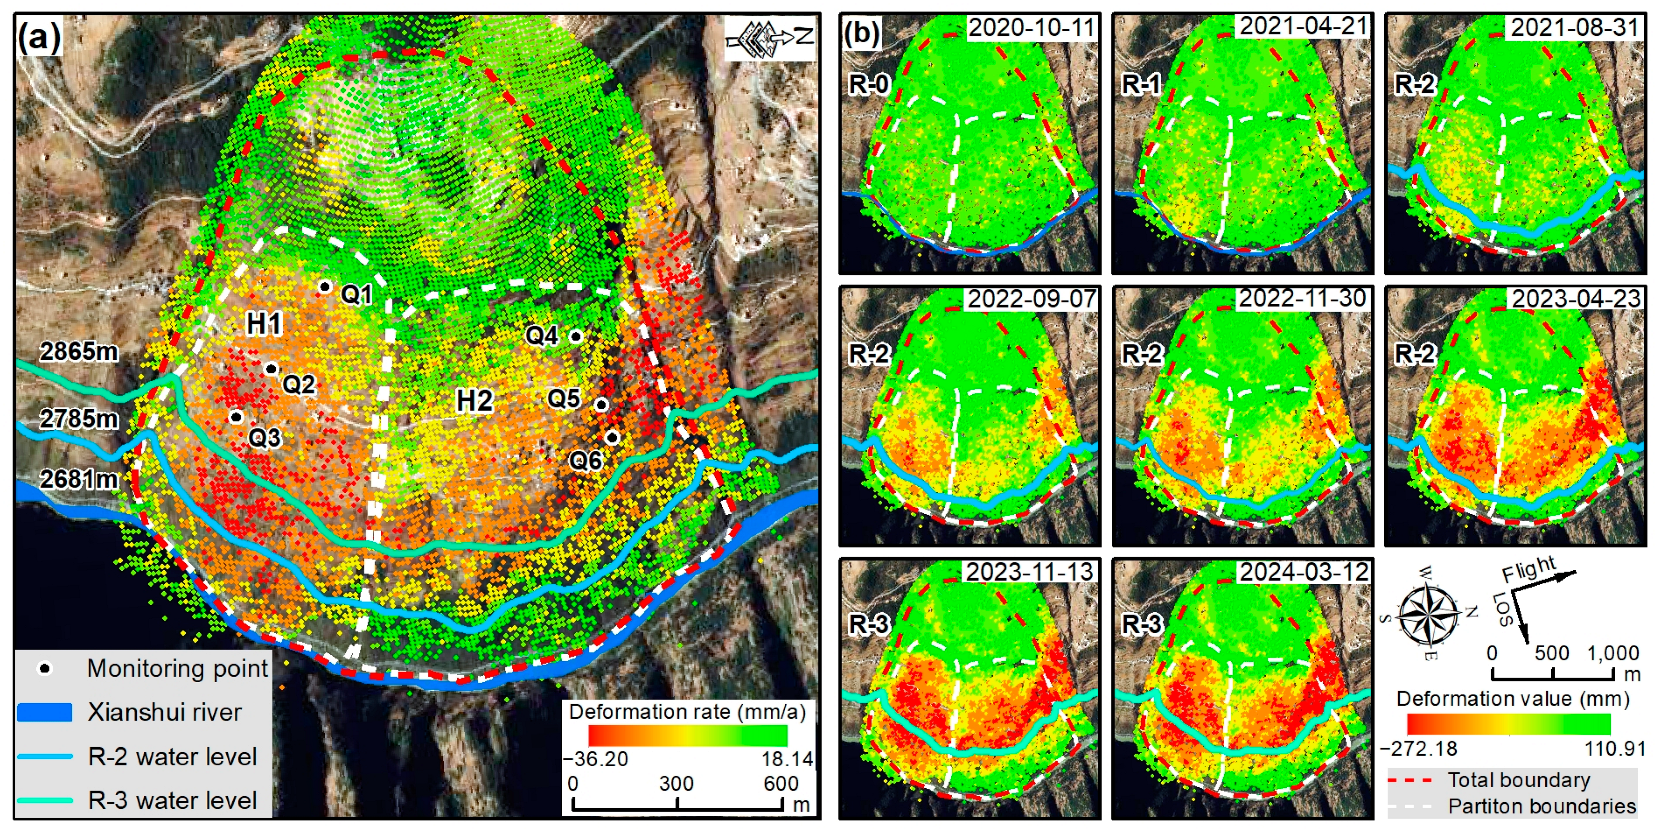
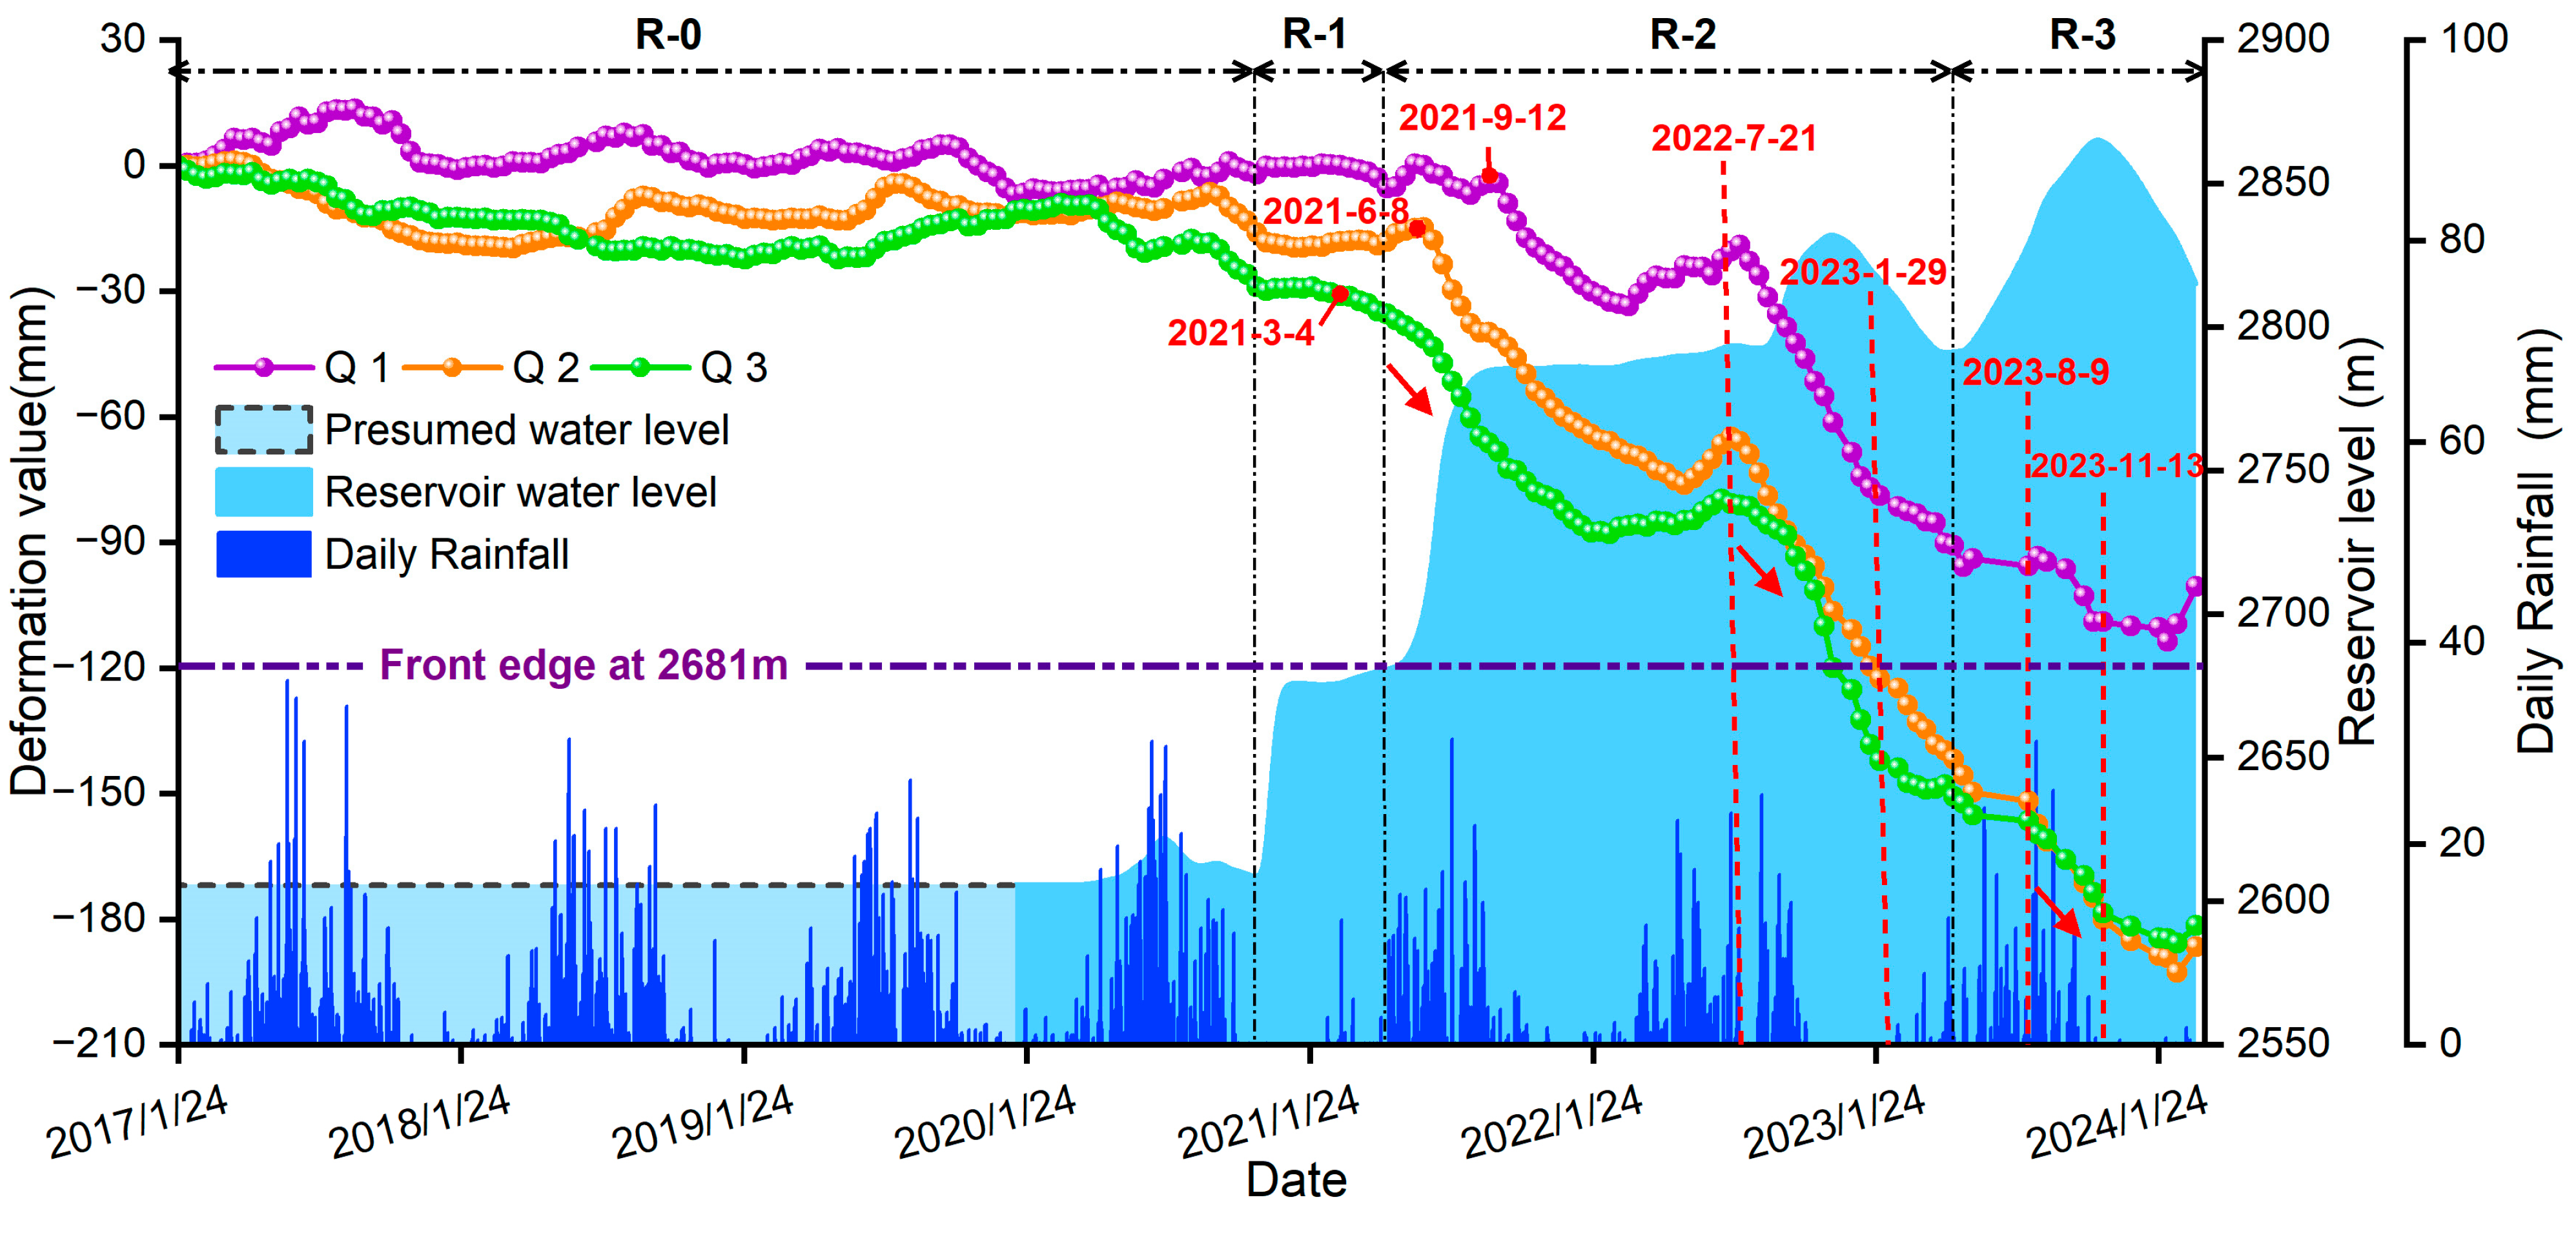
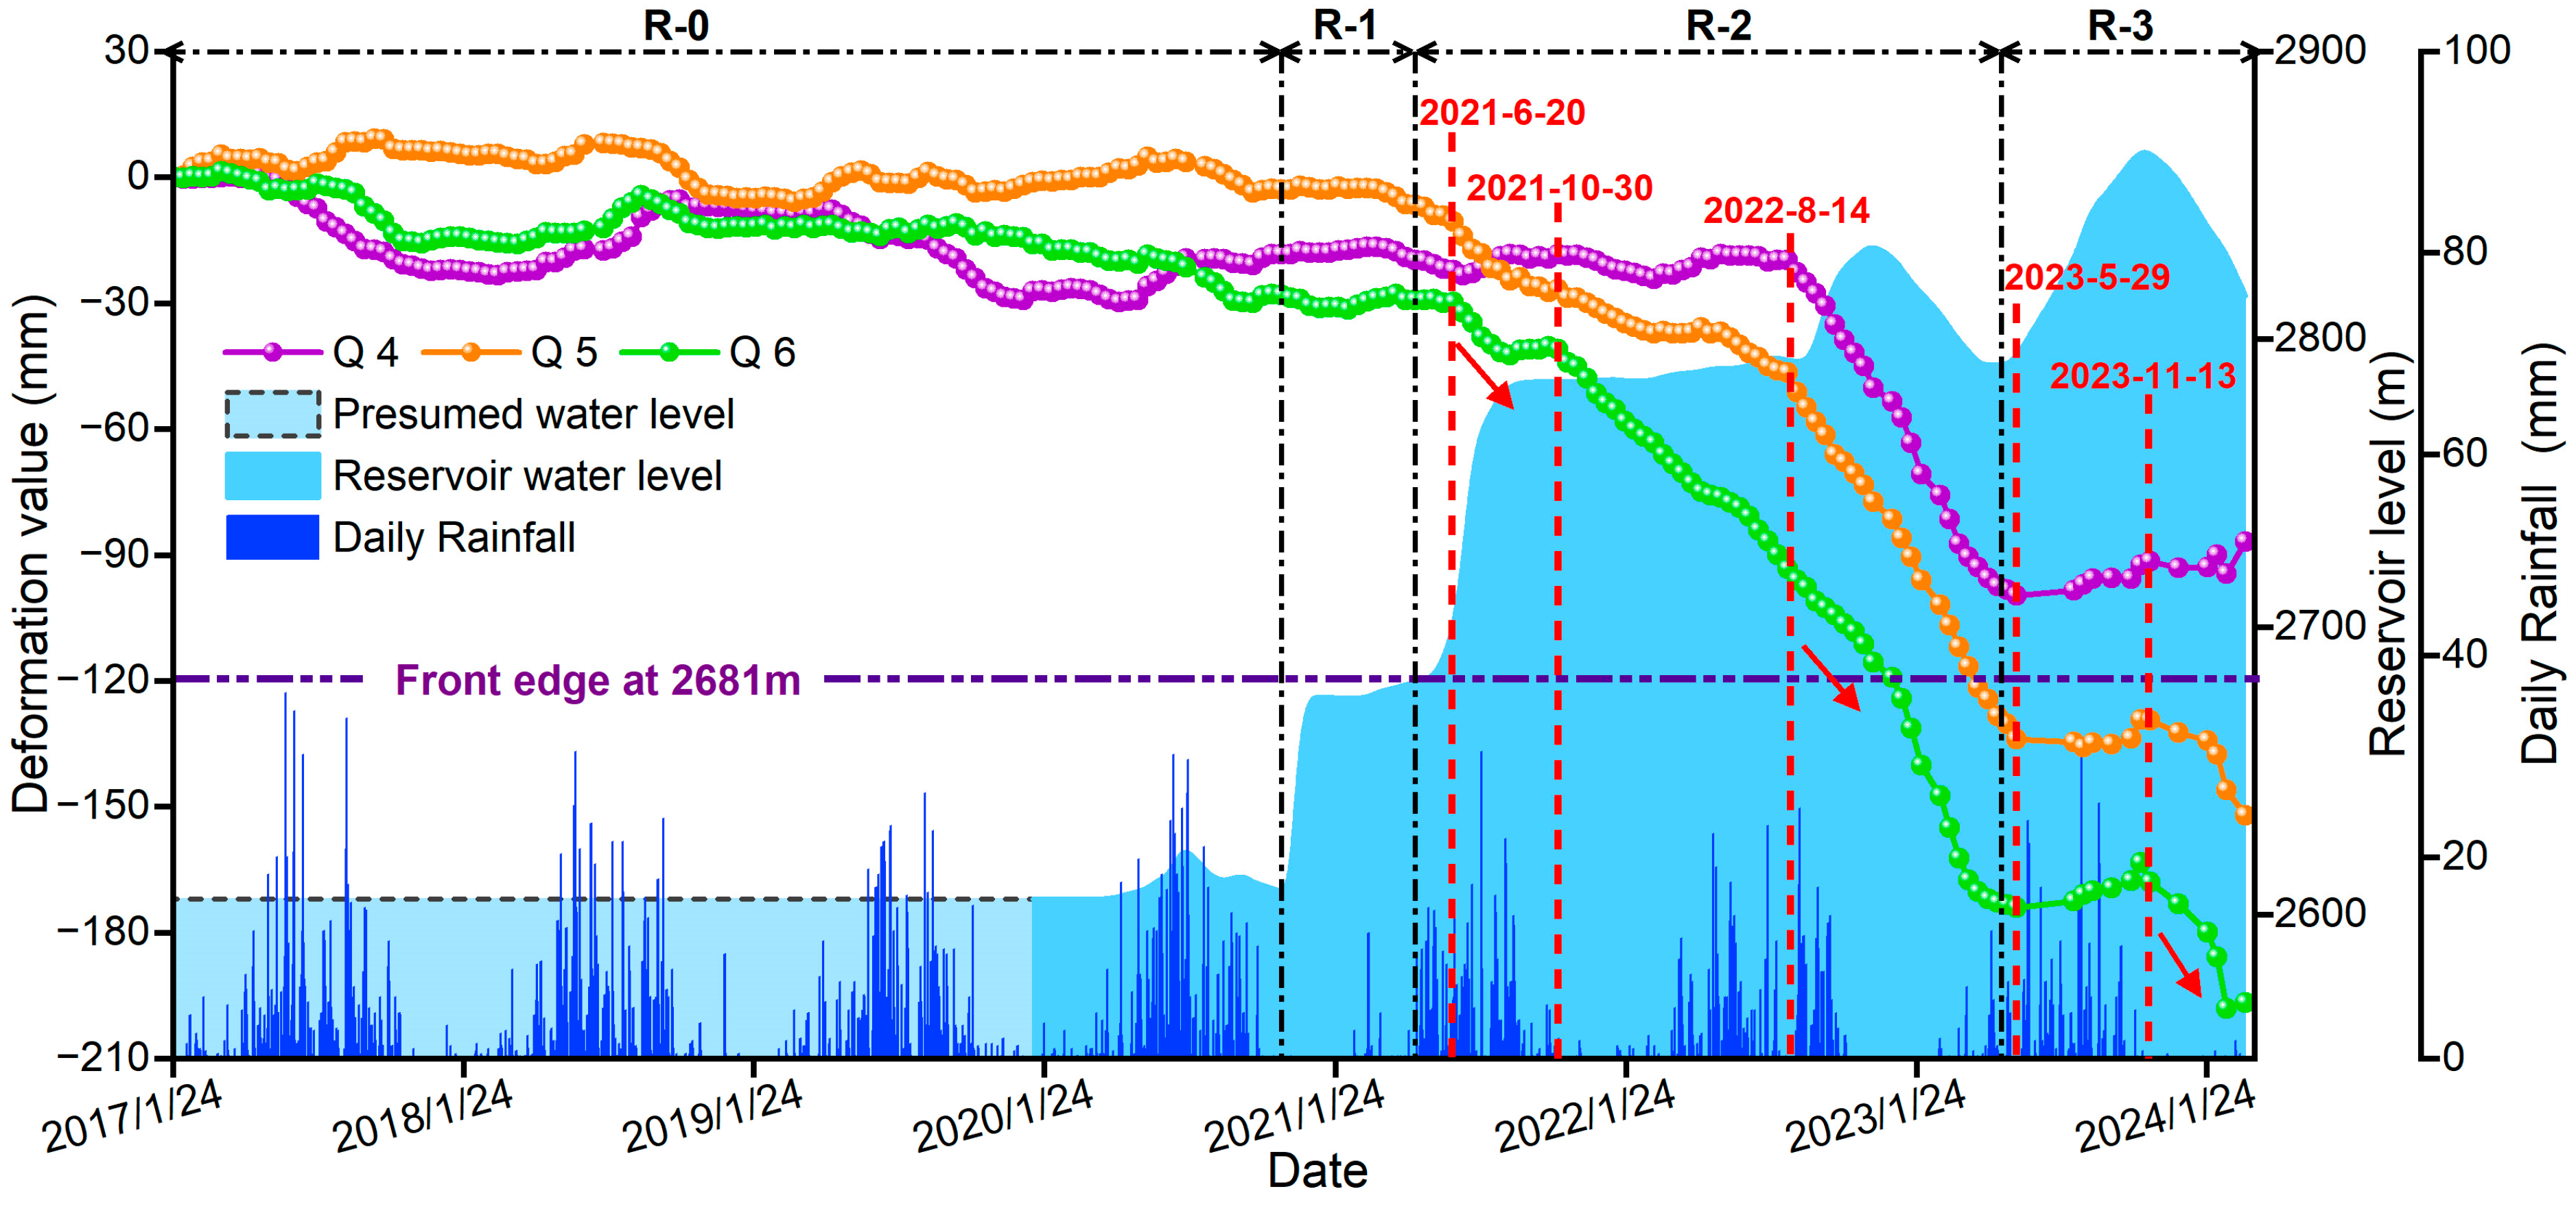
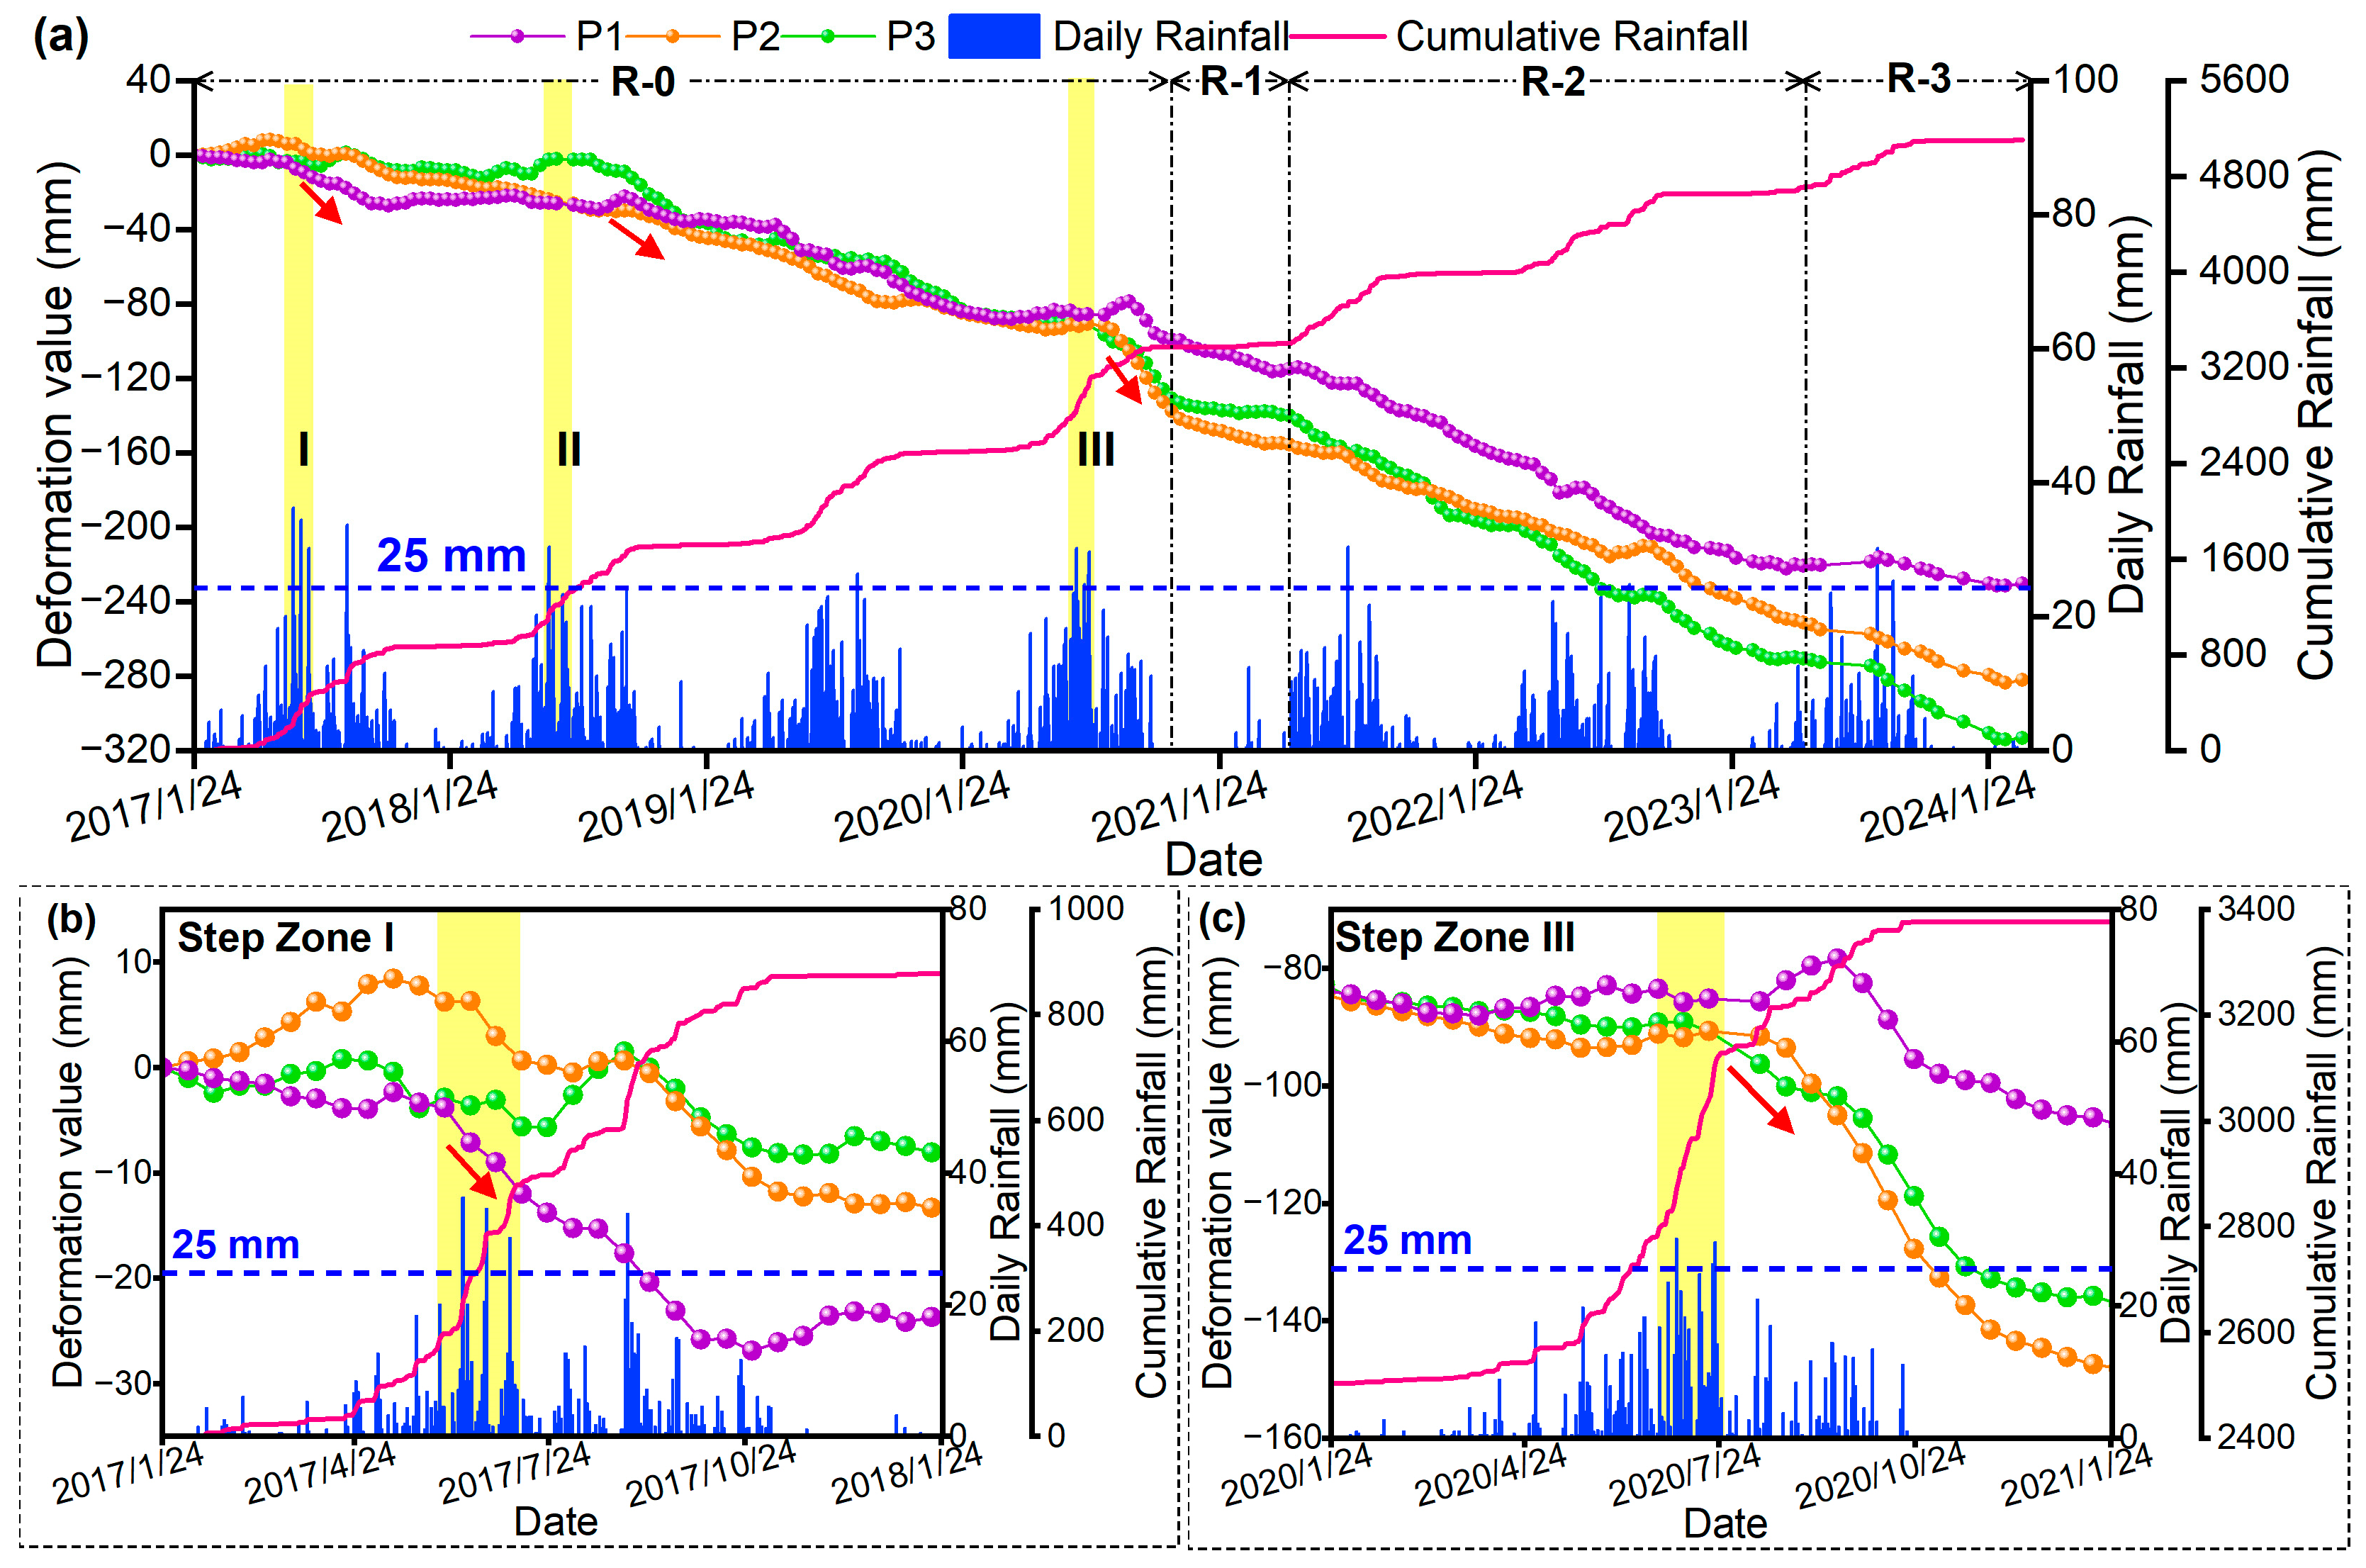
4.2.1. Boluzi Landslide

The Boluzi landslide, which was a long-term active landslide before water storage, is located 64.3 km from the dam site (Figure 10a). It measures approximately 920.3 m in length, 601.8 m in width, and an area of approximately 0.48 km2. As depicted in Figure 10b, the water level at the forefront of the slope was 2810.0 m. Notably, during stage R-1 and the early part of stage R-2, the water level did not inundate the Boluzi landslide. However, in the later part of stage R-2, the water level rose to 2830.0 m, submerging the leading edge of the slope. During the R-3 stage, the highest water level of 2865.0 m was attained. According to the airborne LiDAR data analysis and field investigation, multiple overburden collapse slides were found at the forefront of the slope, and localized creeping, collapse, and sliding resulted in multiple transverse and lateral fissures in the through roads. Localized creeping and landslides led to several transverse cracks and misplaced platforms in the highway, among which the cracking and damage on both sides of the highway in the central gully of the accumulation body were the most significant, with cracks spreading 2–8 cm and misplaced platforms of 2–5 cm (Figure 11).
To analyze the historical deformation characteristics of the landslide, we used ArcGIS software (v10.8) to plot the distribution of the annual average deformation rate (Figure 12a) and the cumulative deformation at selected moments (Figure 12b). Additionally, time series deformation curves were plotted for three monitoring sites (Figure 12a). The monitoring results indicated that the slope had a maximum annual average deformation rate of −56.1 mm/a and a maximum cumulative deformation of −388.7 mm. The middle and lower parts exhibited the largest deformation, with deformation at the forefront of the slope becoming increasingly significant over time. Analysis of the time series curves revealed that the deformation trends at the three monitoring points were similar, with all points showing continuous deformation and localized “step” phenomena (Figure 13). The deformation magnitude increased progressively from the rear to the mid-front of the landslide, indicating a traction-type movement characteristic.

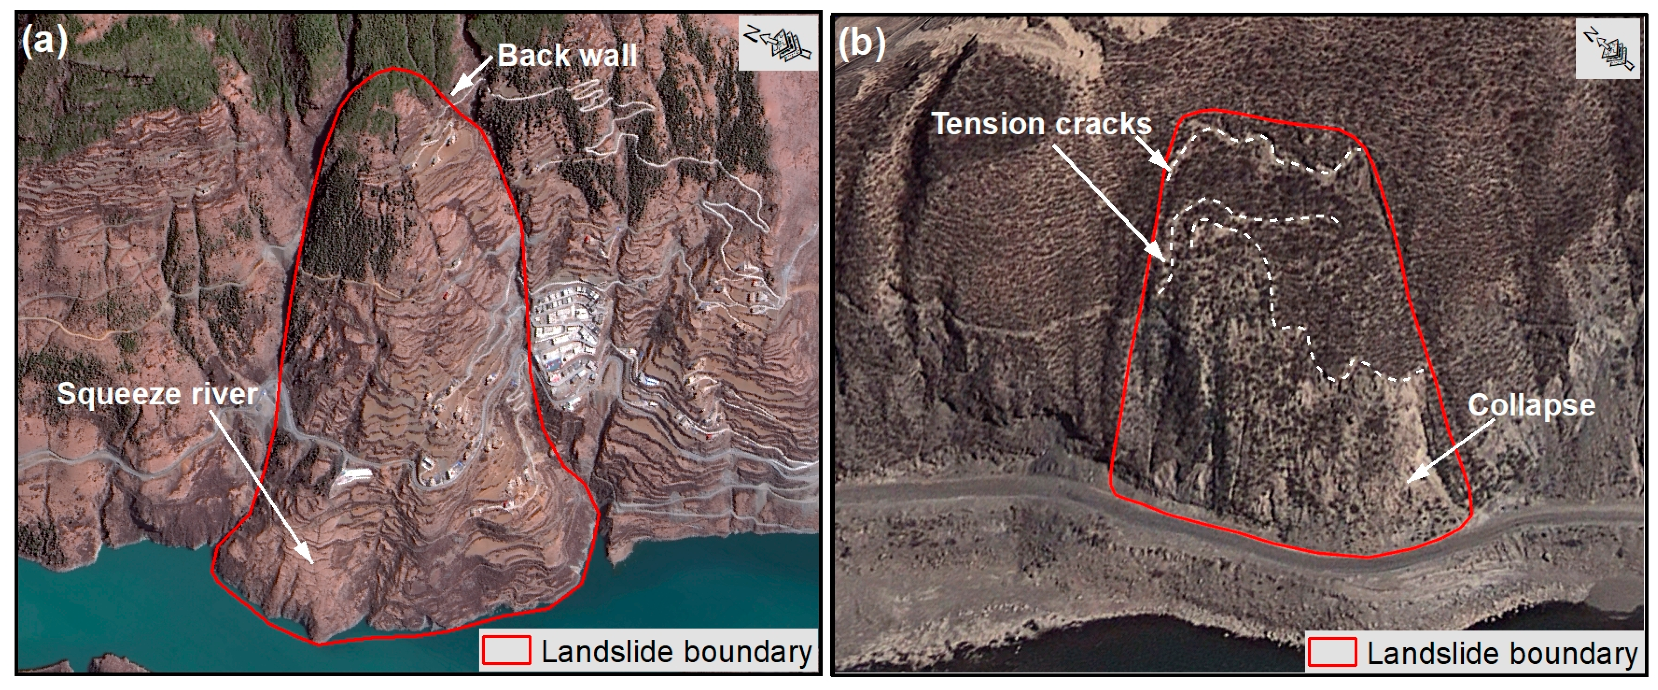
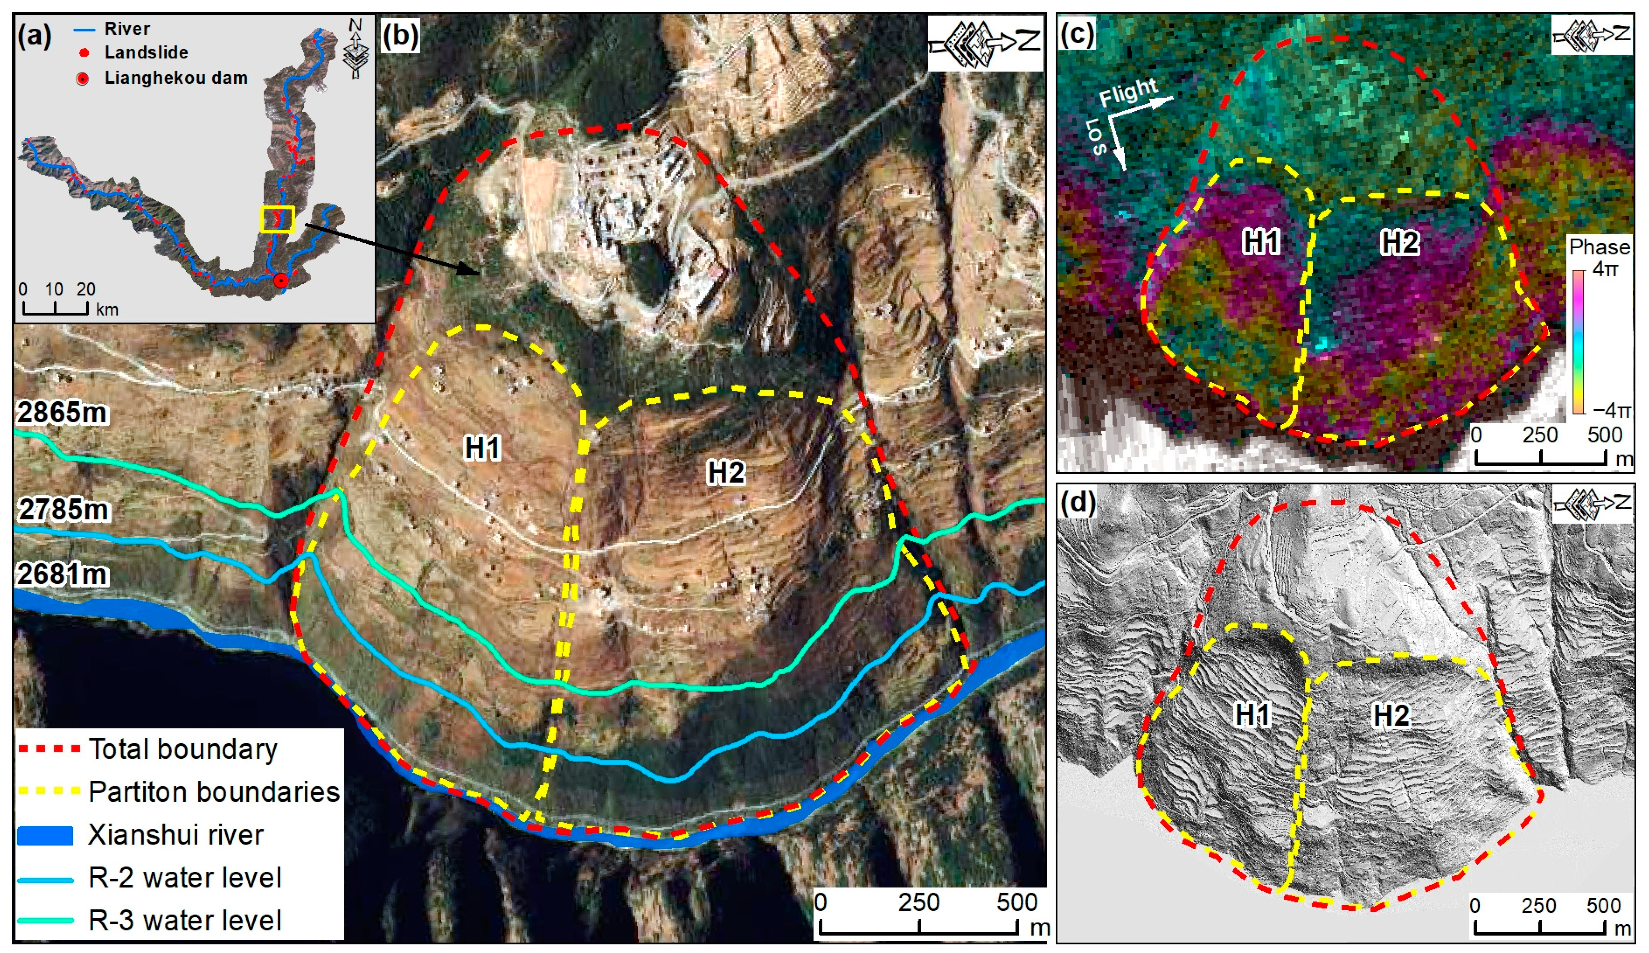
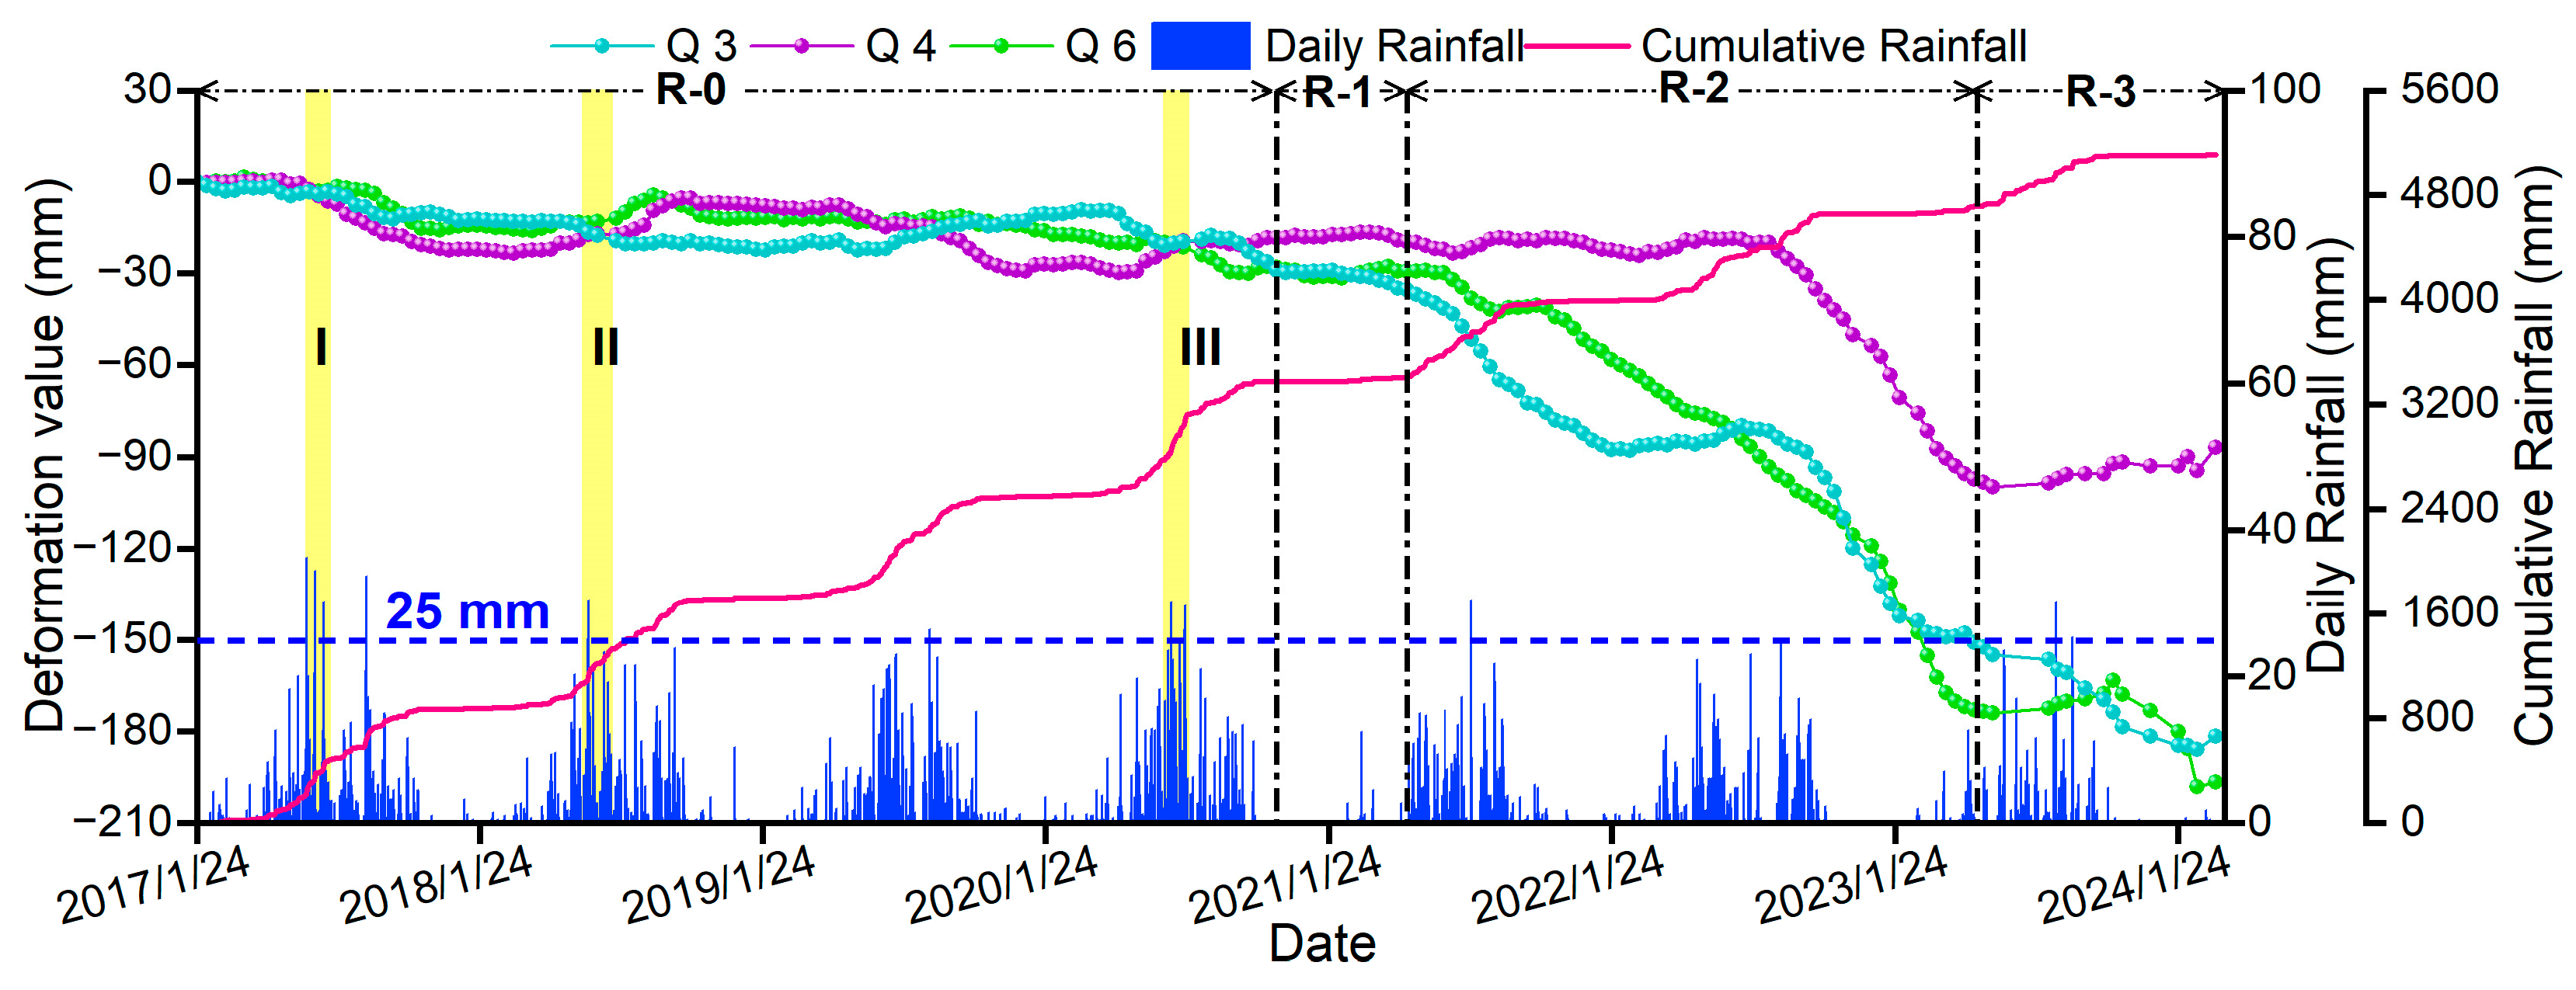
4.2.2. Waduo Landslide

The Waduo landslide, which was activated after impoundment, is located 9.4 km from the dam site (Figure 14a). According to the Stacking-InSAR results, combined with the topography, geomorphology, and structural characteristics of the bank slope, the Waduo landslide can be divided into two secondary landslides, H1 and H2 (Figure 14b). H1 measures approximately 1060.6 m long and 620.2 m wide, covering an area of approximately 0.5 km2, while H2 is approximately 1018.0 m long and 837.4 m wide, covering an area of approximately 0.8 km2. As depicted in Figure 14b, the water level at the forefront of the slope was 2681.0 m. At the R-1 stage, the forefront of the slope remained unaffected by inundation. It gradually became submerged during the R-2 stage as the water level increased, reaching a maximum of 2865.0 m at the R-3 stage. Airborne LiDAR analysis and field investigations revealed numerous cracks distributed along the slope. Localized collapses and multistage transverse cracks, due to erosion and scouring by reservoir water, were observed at the foot of the slope. These cracks ranged from 10 to 30 cm in width and extended from 50 to 100 m in length (Figure 15).
To analyze the time series deformation characteristics of the landslide, we plotted the distribution of the annual average deformation rate (Figure 16a) and the cumulative deformation at selected moments (Figure 16b). Additionally, time series deformation curves (Figure 16a) were obtained for six monitoring points selected on the slope. The monitoring results indicated that the slope had a maximum annual average deformation rate of −36.2 mm/a and a maximum cumulative deformation of −272.2 mm, with the middle and lower parts exhibiting the largest deformation. There was no apparent deformation before the R-1 stage. However, at the R-2 stage, with increasing reservoir water level, the deformation increased. This deformation continued to increase at the R-3 stage.
As shown in Figure 17 and Figure 18, the monitoring points displayed deformation before the R-2 Stage. As reservoir water levels increased, the front edge of the landslide was eroded, triggering deformation in the landslide body. Fluctuations in the reservoir water levels led to noticeable variations in the deformation rate of the landslide during the later stages of monitoring. From the rear to the mid-front of the landslide, the magnitude of deformation increased progressively, and the landslide exhibited characteristics of traction-type movement.

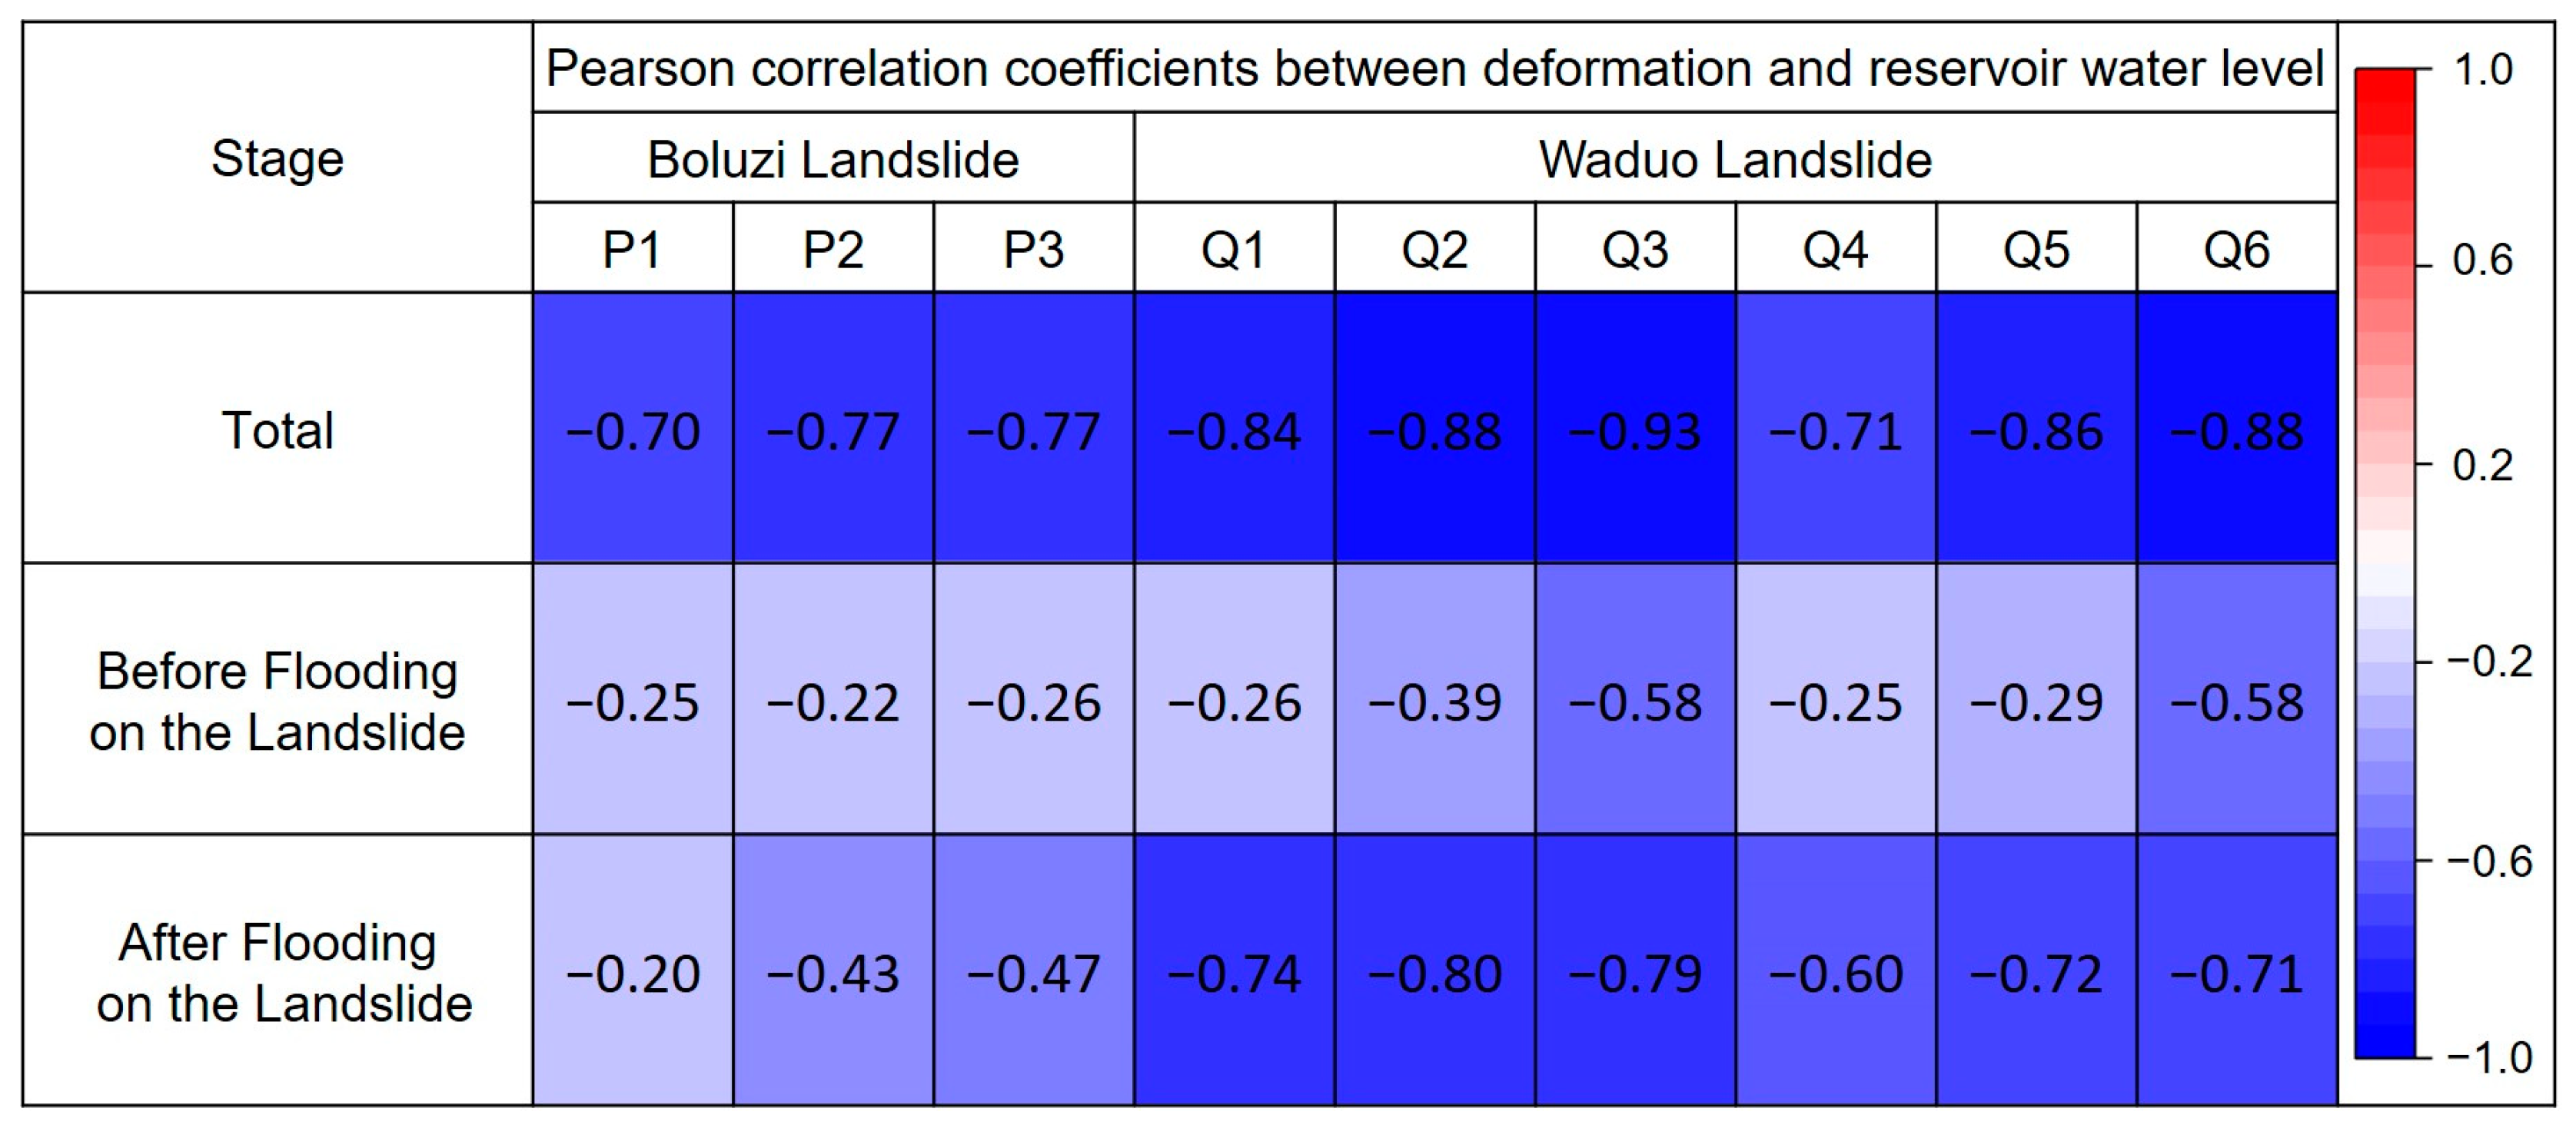
4.3. Landslide Deformation Correlation with Reservoir Water Level and Rainfall

According to the correlation analysis results, the relationship between the deformation of the two landslides and the reservoir water level was relatively low before the reservoir water inundated the front edge of the landslide (Figure 19). However, following inundation, the relationship increased for both landslides, with the Waduo landslide showing a significant negative correlation. In comparison with long-term active landslides, the newly active landslides following inundation were distinctly more sensitive to changes in reservoir water levels.
The correlation analysis of rainfall and landslide deformation revealed distinct characteristics (Figure 20). Although the correlation between landslide deformation and rainfall was generally low, it increased significantly during June and July for both types of deformation. Thus, rainfall in June and July had a significant impact on landslide deformation. Furthermore, at each monitoring point, the correlation between the landslide deformation and reservoir water level was significantly greater than that with rainfall, indicating that fluctuations in the reservoir water levels were the main factor influencing landslide displacement and deformation.

5. Discussion

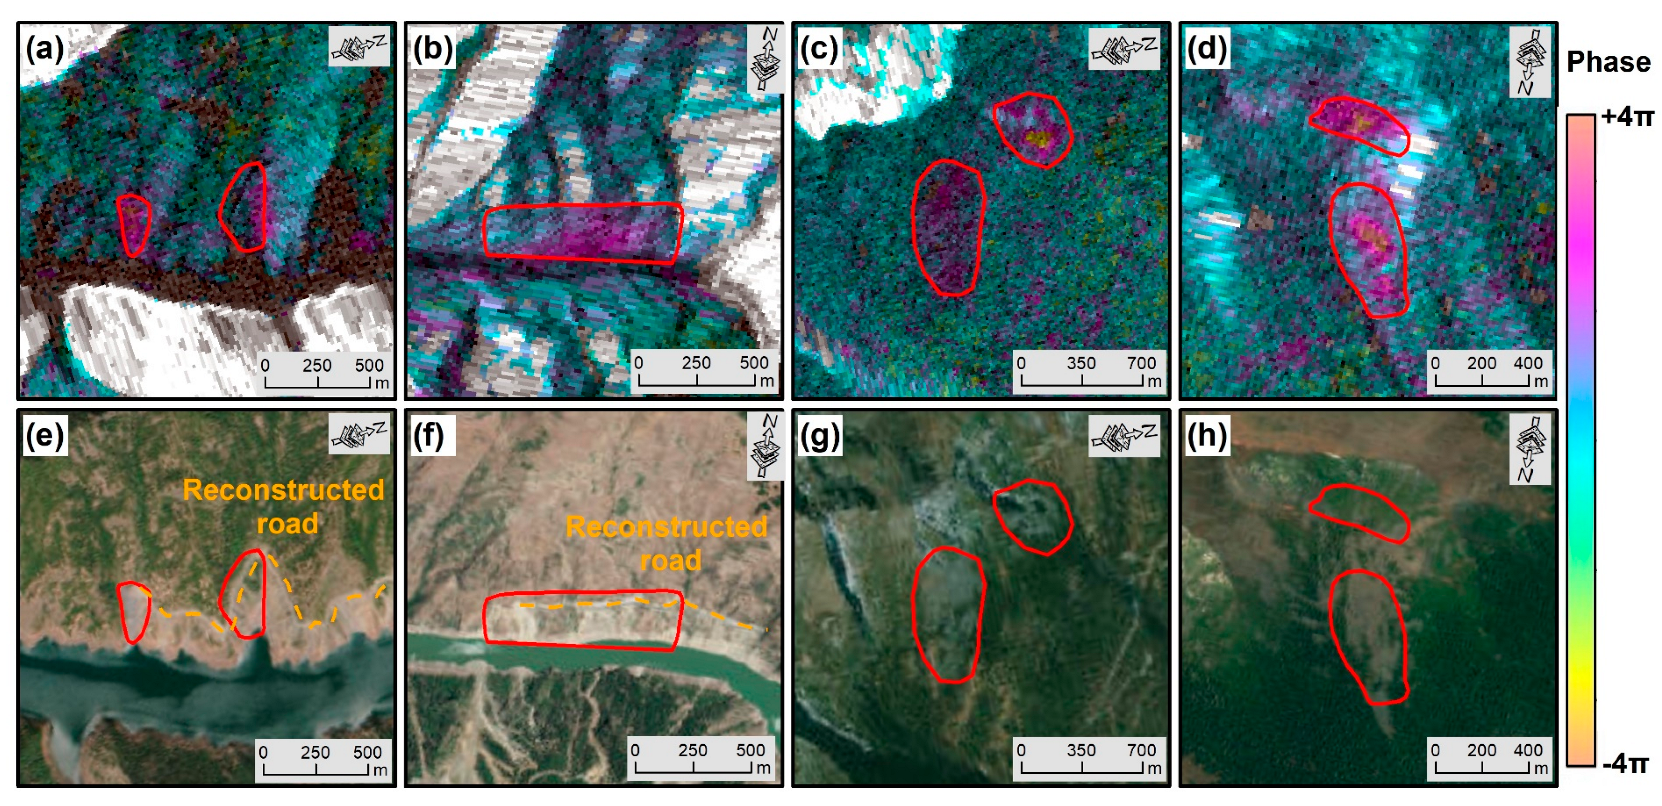
5.1. Effect of the SAR Geometry

In this paper and related studies [38,39,40], it was demonstrated that InSAR technology was an effective and efficient tool for landslide identification and monitoring, but it exhibited certain limitations. The steep topography in the reservoir area affected the radar signal imaging sequence, resulting in geometric distortions such as foreshortening, shadowing, and layover in the SAR imagery. By analyzing SAR data visibility, we found that the ascending track had a visibility area of 78.74% (Figure 21a), while the descending track had 89.17% (Figure 21b). The total visibility area for both ascending and descending track data amounted to 96.57% (Figure 21c). Combining Sentinel-1A’s ascending and descending track data for reservoir area detection significantly expanded the visible coverage of the study area and effectively mitigated the geometric distortions caused by the terrain.
SAR satellites fly northwards or southwards using side-looking geometry imaging. Although the combined visibility area exceeded 90% of the total area after combining the ascending and descending data (Figure 21c), some deformation information along the east–west direction was still not detected. In particular, when the direction of landslide motion was perpendicular to the LOS direction, it resulted in zero displacement component of the landslide in the LOS direction, rendering landslide deformation undetectable. Only Sentinel-1A data were utilized in this study. To improve the accuracy of active landslide detection, deformation monitoring can be conducted using multi-source SAR data.

5.2. Response of Landslide Deformation to Reservoir Water Level

To investigate the impact of reservoir water level fluctuations on landslide deformation, this study analyzed the deformation characteristics of the Boluzi and Waduo landslides under varying reservoir conditions using time series curves.
Both the Boluzi and Waduo landslides exhibited activity influenced by reservoir water impoundment, with the Waduo landslide showing a notably direct response to rising reservoir water levels. Before impoundment, the Waduo landslide exhibited minimal deformation. As the reservoir water level rose to submerge the leading edge of the landslide, deformation initiated, and the rate of deformation progressively increased with the continued rise in water level (Figure 17 and Figure 18). In contrast, the Boluzi landslide did not exhibit a significant increase in deformation rates until the water level surpassed the elevation of its leading edge, at which time the deformation accelerated.
The results indicate that landslides responded only when the reservoir water level exceeded the elevation of their leading edge. Furthermore, the final water level at the Boluzi landslide was not significantly higher than the elevation of its leading edge, which may explain the weaker correlation between the Boluzi landslide and reservoir water levels compared with the Waduo landslide.

5.3. Response of Landslide Deformation to Rainfall

To further elucidate the relationship between landslide deformation and rainfall, a distribution plot of cumulative deformation against daily rainfall was generated. The Boluzi landslide exhibited three distinct stages of acceleration, each associated with short-term intense rainfall events, which accounted for the increased correlation between rainfall and landslide activity observed in June and July. During the third stage of acceleration, the rate of deformation showed the most significant change and persisted the longest, corresponding to the most intense rainfall recorded during the monitoring period (Figure 22). However, following impoundment, due to the reduced intensity of rainfall, the landslide had decreased sensitivity to rainfall events in June and July.
For the Waduo landslide, the correlation with rainfall also increased in June and July. However, during the three acceleration stages at the Boluzi landslide, the Waduo landslide did not display accelerated deformation (Figure 23). This discrepancy can be attributed to the fact that, during the reservoir impoundment period, the intense fluctuations in reservoir water levels coincided with the rainfall events in June and July, resulting in an overall increase in correlation during these months. In summary, for the Boluzi landslide, which has long-term deformation, intense rainfall events led to increased pore water pressure within the landslide, thereby promoting deformation development. In contrast, the Waduo landslide was less affected by rainfall.
Overall, fluctuations in reservoir water levels have a more pronounced impact on landslide deformation compared to rainfall. This is primarily due to the significant and lasting effects of pronounced variations in reservoir water levels on the deep structure and pore water pressure within the landslide body, which modify the stress conditions of the landslide [9,41,42]. In contrast, rainfall influences landslide stability mainly through shallow infiltration and rear-edge fissures, with a shorter duration of impact and limited infiltration depth.

5.4. Limitations and Prospect

The evolution of landslides is influenced by a variety of internal and external factors. Previous studies have predominantly focused on the overall changes in landslides before and after reservoir impoundment [11,14,34], lacking a quantitative analysis of landslide dynamics during different stages of reservoir impoundment. This study addresses this gap by grouping SAR data according to the impoundment schedule and integrating comprehensive remote sensing technologies to develop a dynamic landslide inventory for the Lianghekou Reservoir area. However, we still have some deficiencies.
First, landslide mapping relies on manual visual interpretation, which requires a high level of expertise in landslide identification. To improve both efficiency and accuracy, future research could incorporate deep learning techniques, which offer significant advantages in automation and recognition precision [43].
Secondly, as the reservoir has just entered the operation period, the periodic rise and fall of reservoir levels may trigger new active landslides [44,45]. Therefore, future research should extend the monitoring period to capture the dynamic changes throughout this phase and conduct a more in-depth analysis. Active landslides in the reservoir area exhibit complex responses to fluctuations in water levels and rainfall, influenced by variations in lithology, topography, and hydrological conditions. Given space constraints, this study primarily reveals the deformation characteristics of two representative landslides. Subsequent research should incorporate additional case studies to provide a comprehensive analysis of landslide activity in the reservoir area.

6. Conclusions

In this study, a dynamic active landslide inventory was established for the Lianghekou Reservoir area using integrated remote sensing techniques. A total of 75 active landslides were identified, of which 12 were long-term active landslides before impoundment, and 63 were newly active landslides after impoundment. The number of active landslides showed a progressive increase corresponding to the gradual increase in water level, with the highest number of new landslides occurring during the R-2 stage. The distribution of landslides was spatially differentiated.
The responses of two representative landslides to reservoir water levels and rainfall were analyzed comprehensively. This study identified that variations in reservoir water levels, rather than rainfall, are the primary external factors influencing landslide deformation. Differences exist in the responses of the two representative landslides to reservoir water levels, with inundation depth serving as a critical indicator of the impact of reservoir level fluctuations on landslide activity.
This study effectively analyzed the dynamic evolution of landslides in the reservoir area by integrating various remote sensing techniques with field investigations and established a dynamic landslide inventory. This research provides crucial technical support and practical guidance for the remote sensing identification and monitoring of active landslides during the early impoundment stage of large hydropower stations.

Author Contributions

Conceptualization, X.L. and W.L.; methodology, X.L., W.L. and Q.X.; software, X.L., H.L. and W.Y.; validation, W.L. and Y.S.; formal analysis, X.L., W.L. and S.Z.; investigation, X.L., X.W., D.Z., X.D. and W.L.; resources, W.L.; data curation, X.L., Z.W., X.D. and D.Z.; writing—original draft preparation, X.L.; writing—review and editing, X.L. and W.L.; visualization, X.L.; supervision, W.L.; project administration, W.L.; funding acquisition, W.L. All authors have read and agreed to the published version of the manuscript.

Funding

This research was funded by the National Key Research and Development Program of China (Grant No. 2021YFC3000401), the Key Research and Development Program of Sichuan Province (Grant No. 2023YFS0435), the Yangtze River Joint Research Phase II Program (Grant No. 2022-LHYJ-02-0201), the Project of Ministry and Province Cooperation (Sichuan Geohazard 2023), and the State Key Laboratory of Geohazard Prevention and Geoenvironment Protection Independent Research Project (Grant No. SKLGP2022Z007).

Data Availability Statement

The datasets generated during and/or analyzed during the current study are available from the corresponding author upon reasonable request.

Acknowledgments

Thanks to ESA for providing Sentinel-1A images.

Conflicts of Interest

Author Zhanglei Wu was employed by the company Chengdu Engineering Co., Ltd., Power Construction Corporation. The remaining authors declare that the research was conducted in the absence of any commercial or financial relationships that could be construed as a potential conflict of interest.

References

  1. Tang, H.; Wasowski, J.; Juang, C.H. Geohazards in the three Gorges Reservoir Area, China Lessons learned from decades of research. Eng. Geol. 2019, 261, 105267. [Google Scholar] [CrossRef]
  2. Hu, X.; Wu, S.; Zhang, G.; Zheng, W.; Liu, C.; He, C.; Liu, Z.; Guo, X.; Zhang, H. Landslide displacement prediction using kinematics-based random forests method: A case study in Jinping Reservoir Area, China. Eng. Geol. 2021, 283, 105975. [Google Scholar] [CrossRef]
  3. Zhao, S.; Zeng, R.; Zhang, H.; Meng, X.; Zhang, Z.; Meng, X.; Wang, H.; Zhang, Y.; Liu, J. Impact of Water Level Fluctuations on Landslide Deformation at Longyangxia Reservoir, Qinghai Province, China. Remote Sens. 2022, 14, 212. [Google Scholar] [CrossRef]
  4. Zhang, C.; Yin, Y.; Yan, H.; Li, H.; Dai, Z.; Zhang, N. Reactivation characteristics and hydrological inducing factors of a massive ancient landslide in the three Gorges Reservoir, China. Eng. Geol. 2021, 292, 106273. [Google Scholar] [CrossRef]
  5. Tang, M.; Xu, Q.; Yang, H.; Li, S.; Iqbal, J.; Fu, X.; Huang, X.; Cheng, W. Activity law and hydraulics mechanism of landslides with different sliding surface and permeability in the Three Gorges Reservoir Area, China. Eng. Geol. 2019, 260, 105212. [Google Scholar] [CrossRef]
  6. Jones, F.O. Landslide Conditions along the Ferry County Highway Parallelling Lake Roosevelt from Kettle Falls to the Mouth of the Spokane River, Washington; US Geological Survey: Reston, VA, USA, 1954. [Google Scholar]
  7. Nakamura, K. On reservoir landslide. Bull. Soil Water Conserv. 1990, 10, 53–64. [Google Scholar] [CrossRef]
  8. Yin, Y.; Huang, B.; Wang, W.; Wei, Y.; Ma, X.; Ma, F.; Zhao, C. Reservoir-induced landslides and risk control in Three Gorges Project on Yangtze River, China. J. Rock Mech. Geotech. Eng. 2016, 8, 577–595. [Google Scholar] [CrossRef]
  9. Zhou, J.; Chen, M.; Qu, J.; Hu, Y.; Xia, M.; Jiang, N.; Li, H.; Fan, G. Research and Prospect on Disaster-causing Mechanism and Prevention-control Technology of Reservoir Landslides. Adv. Eng. Sci. Adv. Eng. Sci. 2023, 55, 110–128. [Google Scholar] [CrossRef]
  10. Li, S.; Xu, Q.; Tang, M.; Iqbal, J.; Liu, J.; Zhu, X.; Liu, F.; Zhu, D. Characterizing the spatial distribution and fundamental controls of landslides in the three gorges reservoir area, China. Bull. Eng. Geol. Environ. 2019, 78, 4275–4290. [Google Scholar] [CrossRef]
  11. Tang, F.; Qi, S.; Guo, S.; Zou, Y.; Li, Y.; Lu, X.; Zheng, B.; Song, S.; Hou, X. Spatio-temporal distribution pattern and susceptibility of reservoir-induced landslides in Xiluodu Hydropower Station. J. Eng. Geol. 2022, 30, 609–620. [Google Scholar] [CrossRef]
  12. Li, L.; Wen, B.; Yao, X.; Zhou, Z.; Zhu, Y. InSAR-based method for monitoring the long-time evolutions and spatial-temporal distributions of unstable slopes with the impact of water-level fluctuation: A case study in the Xiluodu reservoir. Remote Sens. Environ. 2023, 295, 113686. [Google Scholar] [CrossRef]
  13. Dai, K.; Shen, Y.; Wu, M.; Feng, W.; Dong, X.; Zhuo, G.; Yi, X. Identification of potential landslides in Baihetan Dam area before the impoundment by combining InSAR and UAV survey. Acta Geod. Cartogr. Sin. 2022, 51, 2069–2082. [Google Scholar] [CrossRef]
  14. Dai, K.; Chen, C.; Shi, X.; Wu, M.; Feng, W.; Xu, Q.; Liang, R.; Zhuo, G.; Li, Z. Dynamic landslides susceptibility evaluation in Baihetan Dam area during extensive impoundment by integrating geological model and InSAR observations. Int. J. Appl. Earth Obs. Geoinf. 2023, 116, 103157. [Google Scholar] [CrossRef]
  15. Wu, T.; Xie, X.; Wu, H.; Zeng, H.; Zhu, X. A Quantitative Analysis Method of Regional Rainfall-Induced Landslide Deformation Response Variation Based on a Time-Domain Correlation Model. Land 2022, 11, 703. [Google Scholar] [CrossRef]
  16. Shi, X.; Wang, J.; Jiang, M.; Zhang, S.; Wu, Y.; Zhong, Y. Extreme rainfall-related accelerations in landslides in Danba County, Sichuan Province, as detected by InSAR. Int. J. Appl. Earth Obs. Geoinf. 2022, 115, 103109. [Google Scholar] [CrossRef]
  17. Tufano, R.; Cesarano, M.; De Vita, P. Probabilistic approaches for assessing rainfall thresholds triggering shallow landslides. The study case of peri-Vesuvian area (Southern Italy). Ital. J. Eng. Geol. Environ. 2019, 105–110. [Google Scholar] [CrossRef]
  18. Xu, Q.; Zhu, X.; Li, W.; Dong, X.; Dai, K.; Jiang, Y.; Lu, H.; Guo, C. Technical progress of space-air-ground collaborative monitoring of landslide. Acta Geod. Cartogr. Sin. 2022, 51, 1416–1436. [Google Scholar] [CrossRef]
  19. Xu, Q. Understanding and Consideration of Related Issues in Early Identification of Potential Geohazards. Geom. Inf. Sci. Wuhan Univ. 2020, 45, 1651–1659. [Google Scholar] [CrossRef]
  20. Xu, Q.; Dong, X.; Li, W. Integrated Space-Air-Ground Early Detection, Monitoring and Warning System for Potential Catastrophic Geohazards. Geom. Inf. Sci. Wuhan Univ. 2019, 44, 957–966. [Google Scholar] [CrossRef]
  21. Lu, H.; Li, W.; Xu, Q.; Dong, X.; Dai, C.; Wang, D. Early Detection of Landslides in the Upstream and Downstream Areas of the Baige Landslide, the Jinsha River Based on Optical Remote Sensing and InSAR Technologies. Geom. Inf. Sci. Wuhan Univ. 2019, 44, 1342–1354. [Google Scholar] [CrossRef]
  22. Chen, B.; Li, W.; Lu, H.; Fu, H.; Zhou, S.; Huang, W. Deformation Analysis of Jungong Ancient Landslide Based on SBAS-InSAR Technology in the Yellow River Mainstream. Geom. Inf. Sci. Wuhan Univ. 2024, 49, 1407–1421. [Google Scholar] [CrossRef]
  23. Feng, W.; Dun, J.; Yi, X.; Zhang, G. Deformation analysis of Woda village old landslide in Jinsha river basin using SBAS-InSARtechnology. J. Eng. Geol. 2020, 28, 384–393. [Google Scholar] [CrossRef]
  24. Zhang, Z.; Xu, S.; Deng, M.; Zeng, Y.; Li, C.; Yao, J. Analysis of Deformation Characteristics of Muchang Ancient Landslide Based on SBAS-InSAR Technology. Sci. Technol. Eng. 2023, 23, 1414–1423. [Google Scholar] [CrossRef]
  25. Ferretti, A.; Prati, C.; Rocca, F. Permanent scatterers in SAR interferometry. IEEE Trans. Geosci. Remote Sens. 2001, 39, 8–20. [Google Scholar] [CrossRef]
  26. Berardino, P.; Fornaro, G.; Lanari, R.; Sansosti, E. A new algorithm for surface deformation monitoring based on small baseline differential SAR interferograms. IEEE Trans. Geosci. Remote Sens. 2002, 40, 2375–2383. [Google Scholar] [CrossRef]
  27. Dai, K.; Liu, G.; Li, Z.; Ma, D.; Wang, X.; Zhang, B.; Tang, J.; Li, G. Monitoring Highway Stability in Permafrost Regions with X-band Temporary Scatterers Stacking InSAR. Sensors 2018, 18, 1876. [Google Scholar] [CrossRef] [PubMed]
  28. Liu, B.; Ge, D.; Wang, S.; Li, M.; Zhang, L.; Wang, Y.; Wu, Q. Combining Application of TOPS and ScanSAR InSAR in Large-Scale Geohazards Identification. Geom. Inf. Sci. Wuhan Univ. 2020, 45, 1756–1762. [Google Scholar] [CrossRef]
  29. Xu, Q.; Pu, C.; Zhao, K.; He, P.; Zhang, H.; Liu, J. Time Series InSAR Monitoring and Analysis of Spatiotemporal Evolution Characteristics of Land Subsidence in Yan’an New District. Geom. Inf. Sci. Wuhan Univ. 2021, 46, 957–969. [Google Scholar] [CrossRef]
  30. Li, W.; Xu, Q.; Lu, H.; Dong, X.; Zhu, Y. Tracking the Deformation History of Large-Scale Rocky Landslides and Its Enlightenment. Geom. Inf. Sci. Wuhan Univ. 2019, 44, 1043–1053. [Google Scholar] [CrossRef]
  31. Liu, X.; Yang, Z.; Guo, C.; Shen, W.; Su, F. Study of Slow-moving Landslide Characteristics Based on the SBAS-InSAR in the Xianshuihe Fault Zone. Geoscience 2017, 31, 965–977. [Google Scholar] [CrossRef]
  32. Yao, J.; Lan, H.; Li, L.; Cao, Y.; Wu, Y.; Zhang, Y.; Zhou, C. Characteristics of a rapid landsliding area along Jinsha River revealed by multi-temporal remote sensing and its risks to Sichuan-Tibet railway. Landslides 2022, 19, 703–718. [Google Scholar] [CrossRef]
  33. Junhui, S.; Manfu, G.; Mingliang, L.; Yuefei, H.U.; Jinlin, Z. Development regularity of landslides in Yalong River reservoir area of Lianghekou hydropower station. Hydrogeol. Eng. Geol. 2007, 34, 6–9. [Google Scholar] [CrossRef]
  34. Wang, Y.; Dong, J.; Zhang, L.; Deng, S.; Zhang, G.; Liao, M.; Gong, J. Automatic detection and update of landslide inventory before and after impoundments at the Lianghekou reservoir using Sentinel-1 InSAR. Int. J. Appl. Earth Obs. Geoinf. 2023, 118, 103224. [Google Scholar] [CrossRef]
  35. Li, W.; Zhan, W.; Lu, H.; Xu, Q.; Pei, X.; Wang, D.; Huang, R.; Ge, D. Precursors to large rockslides visible on optical remote-sensing images and their implications for landslide early detection. Landslides 2023, 20, 1–12. [Google Scholar] [CrossRef]
  36. Gao, H.; YIin, K. Discuss on the correlations between landslides and rainfall and threshold for landslide early-warning and prediction. Rock Soil Mech. 2007, 28, 1055–1060. [Google Scholar] [CrossRef]
  37. Tomás, R.; Li, Z.; Lopez-Sanchez, J.M.; Liu, P.; Singleton, A. Using wavelet tools to analyse seasonal variations from InSAR time-series data: A case study of the Huangtupo landslide. Landslides 2016, 13, 437–450. [Google Scholar] [CrossRef]
  38. Lu, H.; Li, W.; Xu, Q.; Yu, W.; Zhou, S.; Li, Z.; Zhan, W.; Li, W.; Xu, S.; Zhang, P.; et al. Active landslide detection using integrated remote sensing technologies for a wide region and multiple stages: A case study in southwestern China. Sci. Total Environ. 2024, 931, 172709. [Google Scholar] [CrossRef] [PubMed]
  39. Shan, Y.; Xu, Z.; Zhou, S.; Lu, H.; Yu, W.; Li, Z.; Cao, X.; Li, P.; Li, W. Landslide Hazard Assessment Combined with InSAR Deformation: A Case Study in the Zagunao River Basin, Sichuan Province, Southwestern China. Remote Sens. 2024, 16, 99. [Google Scholar] [CrossRef]
  40. Zhou, S.; Chen, B.; Lu, H.; Shan, Y.; Li, Z.; Li, P.; Cao, X.; Li, W. Analysis of the Spatial Distribution and Deformation Types of Active Landslides in the Upper Jinsha River, China, Using Integrated Remote Sensing Technologies. Remote Sens. 2024, 16, 100. [Google Scholar] [CrossRef]
  41. Liao, K.; Wu, Y.; Miao, F.; Li, L.; Xue, Y. Time-varying reliability analysis of Majiagou landslide based on weakening of hydro-fluctuation belt under wetting-drying cycles. Landslides 2021, 18, 267–280. [Google Scholar] [CrossRef]
  42. Yang, Z.; Li, X.; Zhao, Q.; Zhang, Y.; Liu, X. Key influencing factors based distribution regularity and deformation and failure response of colluvial landslides in Three Gorges Reservoir area. J. Eng. Geol. 2021, 29, 617–627. [Google Scholar] [CrossRef]
  43. Zhang, X.; Yu, W.; Pun, M.-O.; Shi, W. Cross-domain landslide mapping from large-scale remote sensing images using prototype-guided domain-aware progressive representation learning. ISPRS J. Photogramm. Remote Sens. 2023, 197, 1–17. [Google Scholar] [CrossRef]
  44. Cojean, R.; Cai, Y.J. Analysis and modeling of slope stability in the Three-Gorges Dam reservoir (China)—The case of Huangtupo landslide. J. Mountain Sci. 2011, 8, 166–175. [Google Scholar] [CrossRef]
  45. Li, C.; Long, J.; Jiang, X.; Fu, Z. Advance and prospect of formation mechanism for reservoir landslides. Bull. Geol. Sci. Technol. 2020, 39, 67–77. [Google Scholar] [CrossRef]
Figure 1. Study area overview. (a) Geographical position within Sichuan Province; (b) coverage of Sentinel-1A satellite imagery and historical earthquake distribution; (c) topographical features and reservoir inundation extent; (d) reservoir water level change curve; (e) stratigraphy and fault distribution.
Remotesensing 16 03175 g001
Figure 2. Flowchart of the technical methodology of this study.
Remotesensing 16 03175 g002
Figure 3. Reservoir water level change curve (A); classification of ascending and descending Sentinel-1A satellite imagery based on reservoir levels (B,C). Note: the number of SAR images utilized is denoted in parentheses.
Remotesensing 16 03175 g003
Figure 4. Cumulative phase maps generated using Stacking-InSAR for different stages: (a,e) R-0 Stage; (b,f) R-1 Stage; (c,g) R-2 Stage; (d,h) R-3 Stage. Note: the circled yellow areas indicate regions of abnormal deformation.
Remotesensing 16 03175 g004
Figure 5. Examples of deformation zones rejected by InSAR technology in the study area. (a,b) Deformation triggered by human engineering activities; (c,d) deformation caused by melting snow and ice; (eh) Optical images corresponding to the deformation zones illustrated in (ad).
Remotesensing 16 03175 g005
Figure 6. (a) Deformation zones identified using stacking-InSAR; (b) Landslide boundaries delineated from optical imagery.
Remotesensing 16 03175 g006
Figure 7. Case study of landslide identification using optical satellite images: (a) Gebu landslide; (b) Maxi landslide.
Remotesensing 16 03175 g007
Figure 8. Active landslides before and after reservoir impoundment. (a) Changes in quantity; (b) distribution characteristics. Notes: A: long-term active landslides before impoundment; B: new active landslides after impoundment; B1: new landslides after one-phase impoundment; B2: new landslides after two-phase impoundment; B3: new landslides after three-phase impoundment. The number in parentheses is the number of active landslides.
Remotesensing 16 03175 g008
Figure 9. Visualization of Gaussian kernel density analysis results of active landslides.
Remotesensing 16 03175 g009
Figure 10. Integrated remote sensing analysis of the Boluzi landslide. (a) Landslide location; (b) optical image; (c) stacking-InSAR annual deformation phase result; (d) airborne LiDAR-based hill shade image.
Remotesensing 16 03175 g010
Figure 11. Airborne LiDAR interpretation results and field investigation of the Boluzi landslide. (a) Digital orthophoto; (b) localized collapse; (c) settlement cracking of the roadbed; (d) right boundary and leading edge of the large deformation zone; (eh) localized collapse.
Remotesensing 16 03175 g011
Figure 12. (a) Annual average deformation rate of the Boluzi landslide (LOS); (b) cumulative deformation at different moments.
Remotesensing 16 03175 g012
Figure 13. Time series plot of cumulative deformation variables, reservoir water level, and rainfall at the three monitoring sites.
Remotesensing 16 03175 g013
Figure 14. Comprehensive remote sensing interpretation of the Waduo landslide. (a) Landslide location; (b) optical image; (c) stacking-InSAR annual deformation phase result; (d) airborne LiDAR-based hill shade image.
Remotesensing 16 03175 g014
Figure 15. Field investigation and airborne LiDAR interpretation results of the Waduo landslide. (a) Digital orthophoto; (b,c) boundary tension cracks; (d) H1 trailing edge cracks; (e) H1 leading edge cracks; (f) H2 roadbed settlement cracking; (g,h) H1 leading edge collapse; (i) H2 leading edge collapse.
Remotesensing 16 03175 g015
Figure 16. (a) Annual average deformation rate of the Waduo landslide (LOS); (b) cumulative deformation at different moments.
Remotesensing 16 03175 g016
Figure 17. Time series plot of cumulative deformation variables, reservoir water levels, and rainfall at three monitoring sites of H1.
Remotesensing 16 03175 g017
Figure 18. Time series plot of cumulative deformation variables, reservoir water levels, and rainfall at three monitoring sites of H2.
Remotesensing 16 03175 g018
Figure 19. Pearson’s correlation coefficients between deformation and reservoir water level.
Remotesensing 16 03175 g019
Figure 20. Pearson’s correlation coefficients between deformation and rainfall.
Remotesensing 16 03175 g020
Figure 21. Sentinel-1A visibility analysis of the study area. (a) Ascending orbit coverage distribution; (b) descending orbit coverage distribution; (c) joint ascending and descending orbit coverage. Pie charts in (ac) illustrate the percentage of the Sentinel-1A data visibility area. Note: colors in the pie charts correspond to the legends in (ac).
Remotesensing 16 03175 g021
Figure 22. (a) Relationship between cumulative displacement, cumulative precipitation, and daily precipitation for the Boluzi landslide; (b) local enlargement of Step Zone I; (c) local enlargement of Step Zone III.
Remotesensing 16 03175 g022
Figure 23. Relationship between cumulative displacement, cumulative precipitation, and daily precipitation for the Waduo landslide.
Remotesensing 16 03175 g023
Table 1. Basic parameters of SAR dataset utilized in this study.
SAR SensorSentinel-1A
Orbital directionAscending/descending
Image modeIW
PolarizationVV
WavelengthC-band (5.6 cm)
Resolution (azimuth/range)5 m × 20 m
Revisit period12 days
Azimuth angle−12.8°/192.74°
Angle of incidence36.94°/39.60°
Collection date24 January 2017 to 12 March 2024
19 June 2018 to 7 March 2024
Scenes401/306
Image coverageAscending track:Path 26: Frame 93/Frame 98
Descending track:Path 135: Frame 488/Frame 493
Table 2. Distribution of active landslides in different watersheds.
RiverTotal
Landslides
Percentage of LandslidesDistributionRight BankLeft Bank
Xianshui R.4762.7%Mainly on the right bank3413
Yalong R.2634.7%Evenly distributed on the two banks1115
Qingda R.22.6%Mainly distributed on the left bank02
Disclaimer/Publisher’s Note: The statements, opinions and data contained in all publications are solely those of the individual author(s) and contributor(s) and not of MDPI and/or the editor(s). MDPI and/or the editor(s) disclaim responsibility for any injury to people or property resulting from any ideas, methods, instructions or products referred to in the content.

