Article

A High-Resolution Distribution Dataset of Paddy Rice in India Based on Satellite Data

by
Xuebing Chen
1,
Ruoque Shen
1,
Baihong Pan
2,
Qiongyan Peng
1,
Xi Zhang
1,
Yangyang Fu
1 and
Wenping Yuan
3,*
1
International Research Center of Big Data for Sustainable Development Goals, School of Atmospheric Sciences, Sun Yat-sen University, Zhuhai 519082, China
2
Department of Microbiology and Plant Biology, University of Oklahoma, Norman, OK 73019, USA
3
Institute of Carbon Neutrality, Sino-French Institute for Earth System Science, College of Urban and Environmental Sciences, Peking University, Beijing 100871, China
*
Author to whom correspondence should be addressed.
Remote Sens. 2024, 16(17), 3180; https://doi.org/10.3390/rs16173180
Submission received: 18 June 2024 / Revised: 21 August 2024 / Accepted: 21 August 2024 / Published: 28 August 2024

Abstract

:
India, as the world’s second-largest rice producer, accounting for 21.7% of global rice production, plays a crucial role in ensuring global food supply stability. However, creating high-resolution rice maps for India, such as those at 10 to 30 m, poses significant challenges due to frequent cloudy weather conditions and the complexities of its agricultural systems. This study used a sample-independent mapping method for rice in India using the synthetic aperture radar (SAR)-based Rice Index (SPRI). We produced 10 m spatial resolution rice distribution maps for three years (i.e., 2018, 2020, and 2022) for 23 states in India, covering 98% of Indian rice production. The method effectively utilized the unique characteristics of rice in the vertical–horizontal (VH) backscatter coefficient time series of Sentinel-1, from ttransplantation to the maturity stage, combined with cloud-free Sentinel-2 imagery. By calculating the SPRI values for each agricultural field object using adaptive parameters, the planting locations of rice were accurately identified. On average, the user, producer, and overall accuracy over all investigated states and union territories was 84.72%, 82.31%, and 84.40%, respectively. Additionally, the regional-scale validation based on the statistical area at the district level showed that the coefficient of determination (R2) ranged from 0.53 to 0.95 for each state, indicating that the spatial distribution of the statistical planted area at the district level was reproduced well.

1. Introduction

Paddy rice, a vital staple crop worldwide, occupies 12% of the world’s arable land and supports over 50% of the global population through its cultivation [1,2,3]. It serves not only as a vital food source but also as a crucial agricultural commodity that contributes to economies worldwide [4]. Rice cultivation significantly affects both water consumption and greenhouse gas emissions. It is estimated that approximately 24–30% of global freshwater resources are used for rice cultivation [5].
More than 90% of rice fields are located in Asia, with India being one of the largest rice producers. India’s rice cultivation spans approximately 45 million hectares, representing more than 20% of the global cultivated area [1]. In India, rice cultivation is influenced by factors including terrain, climate, altitude, soil type, and water availability. These factors result in significant variations in the rice growing seasons across different regions [6,7], contributing to a highly diverse agricultural landscape. The rice cultivation system is exceptionally complex, with the simultaneous planting of multiple varieties, such as pre-Kharif, Kharif, and Rabi rice, across different regions. This diversity in rice types and cropping seasons poses significant challenges for accurate rice mapping in India [8].
Satellite-based datasets are commonly employed for identifying various crop types at regional or national scales due to their ability to offer uninterrupted spatial coverage and temporal continuity [9,10,11]. Based on satellite-based observations, we can also monitor large-scale rice growth and obtain its distribution, providing effective information for decision-making in rice cultivation management and water resource allocation in India [12]. Recent studies have employed distinctive spectral characteristics observed during rice planting and the flooding phase in combination with vegetation and water indices, such as the normalized difference vegetation index (NDVI), land surface water index (LSWI), normalized difference water index (NDWI), and the enhanced vegetation index (EVI), obtained from optical data to extract rice fields [13,14,15,16]. However, in subtropical and tropical regions, the rice growing season typically coincides with cloudy rainy seasons, which limits optical observation capabilities during these critical growth stages [17,18]. As a result, synthetic aperture radar (SAR) data are increasingly used in cloudy regions because it can penetrate clouds and accurately reflect ground targets [19,20,21]. Analyzing SAR time series data enables the extraction of crucial signals that indicate rice growth stages, such as planting, heading, and grain filling. These signals are essential for monitoring rice growth and efficiently managing agricultural production [22]. Multiple studies have validated the effectiveness and feasibility of SAR time series in rice mapping, and this technology is being widely applied in different agricultural research fields [6,23,24,25].
Machine learning methods, such as support vector machine [26], random forests [27,28], and artificial neural networks [29], are widely used for rice identification. These methods utilize a multitude of training samples to train classification models and extract features from SAR data to facilitate automated rice recognition. However, machine learning methods present some shortcomings when applied to rice recognition. First, obtaining large-scale, accurately labeled rice samples is an expensive, labor-intensive, and time-consuming task [30,31]. For example, the Cropland Data Layer (CDL) product produced by the USDA’s National Agricultural Statistics Service (NASS) uses a large amount of annually updated USDA public land unit (CLU) data as a training sample [32]. Second, machine learning approaches are greatly influenced by the representativeness of their training samples, potentially resulting in either overestimating or underestimating the cultivated area within a particular region [28]. Finally, due to the spatial heterogeneity influenced by factors like climate, topography, and agricultural practices, machine learning models often perform well on the training dataset but demonstrate limited transferability when applied to new remote sensing imagery data [33]. However, the limited availability of training datasets constrains the application of machine learning algorithms for generating crop classification products for other countries. Phenology-based methods are frequently employed to map rice across different areas, allowing the acquisition of rice growth characteristics at different periods for rice identification and monitoring [34]. A recent study utilized the time-weighted dynamic time warping method (TWDTW) to develop an approach for identifying dual-season rice. This method compared the temporal variations in SAR signals during the flooding and growth phases of unknown pixels with those of known rice fields. Applied to map dual-season rice in China from 2016 to 2019, it achieved producer and user accuracies of 88.49% and 87.02%, respectively [22].
Currently, there are three main methods for mapping paddy rice fields in India. These methods involve combining various census datasets. Frolking et al. [35] conducted a mapping of rice cropping systems in India at the district level for the period 1999–2000. Several studies have utilized Moderate Resolution Imaging Spectroradiometer (MODIS) surface reflectance products to map the distribution of irrigated rice areas in India at a medium-scale resolution of 500 m [9,10,36]. In addition, Singha et al. [6] employed the random forest classifier to create high-resolution (10 m) seasonal paddy rice maps for Northeast India using cloud-free SAR images from the Sentinel-1 satellite and the Google Earth Engine (GEE) platform. The generated maps covered all three rice growing seasons and showed accurate results, with over 90% accuracy. Despite significant contributions made by these efforts, coarse spatial resolution rice mapping may not adequately capture the small-scale mixed agricultural production of smallholder farmers. Waleed et al. (2022) evaluated the potential of satellites with different resolutions for rice classification and found that the accuracy of rice mapping improved with increasing spatial resolution [37]. However, high-resolution rice maps for small areas are not sufficient to characterize the distribution of national-scale rice plantations. A national-level rice mapping method with high spatial resolution in India is still missing.
In this study, we used the SAR-based rice index (SPRI) approach [3] to produce 10 m resolution maps of rice in India for 2018, 2020, and 2022. The method used adaptive parameters to determine the SPRI for each cropland pixel by capturing the minimum Sentinel-1 VH backscatter during the transplantation period and the maximum VH backscatter during the growth period of rice. These SPRI values were then converted into a rice feature map using a binary classification threshold. Without the need for training samples, the method is able to simultaneously consider intra-class variations of SAR signals and add inter-class differences, achieving accurate mapping for different regions by adaptively considering local conditions. The identification accuracy was evaluated based on the visual interpretation results of high spatial resolution images and agricultural statistics.

2. Materials and Methods
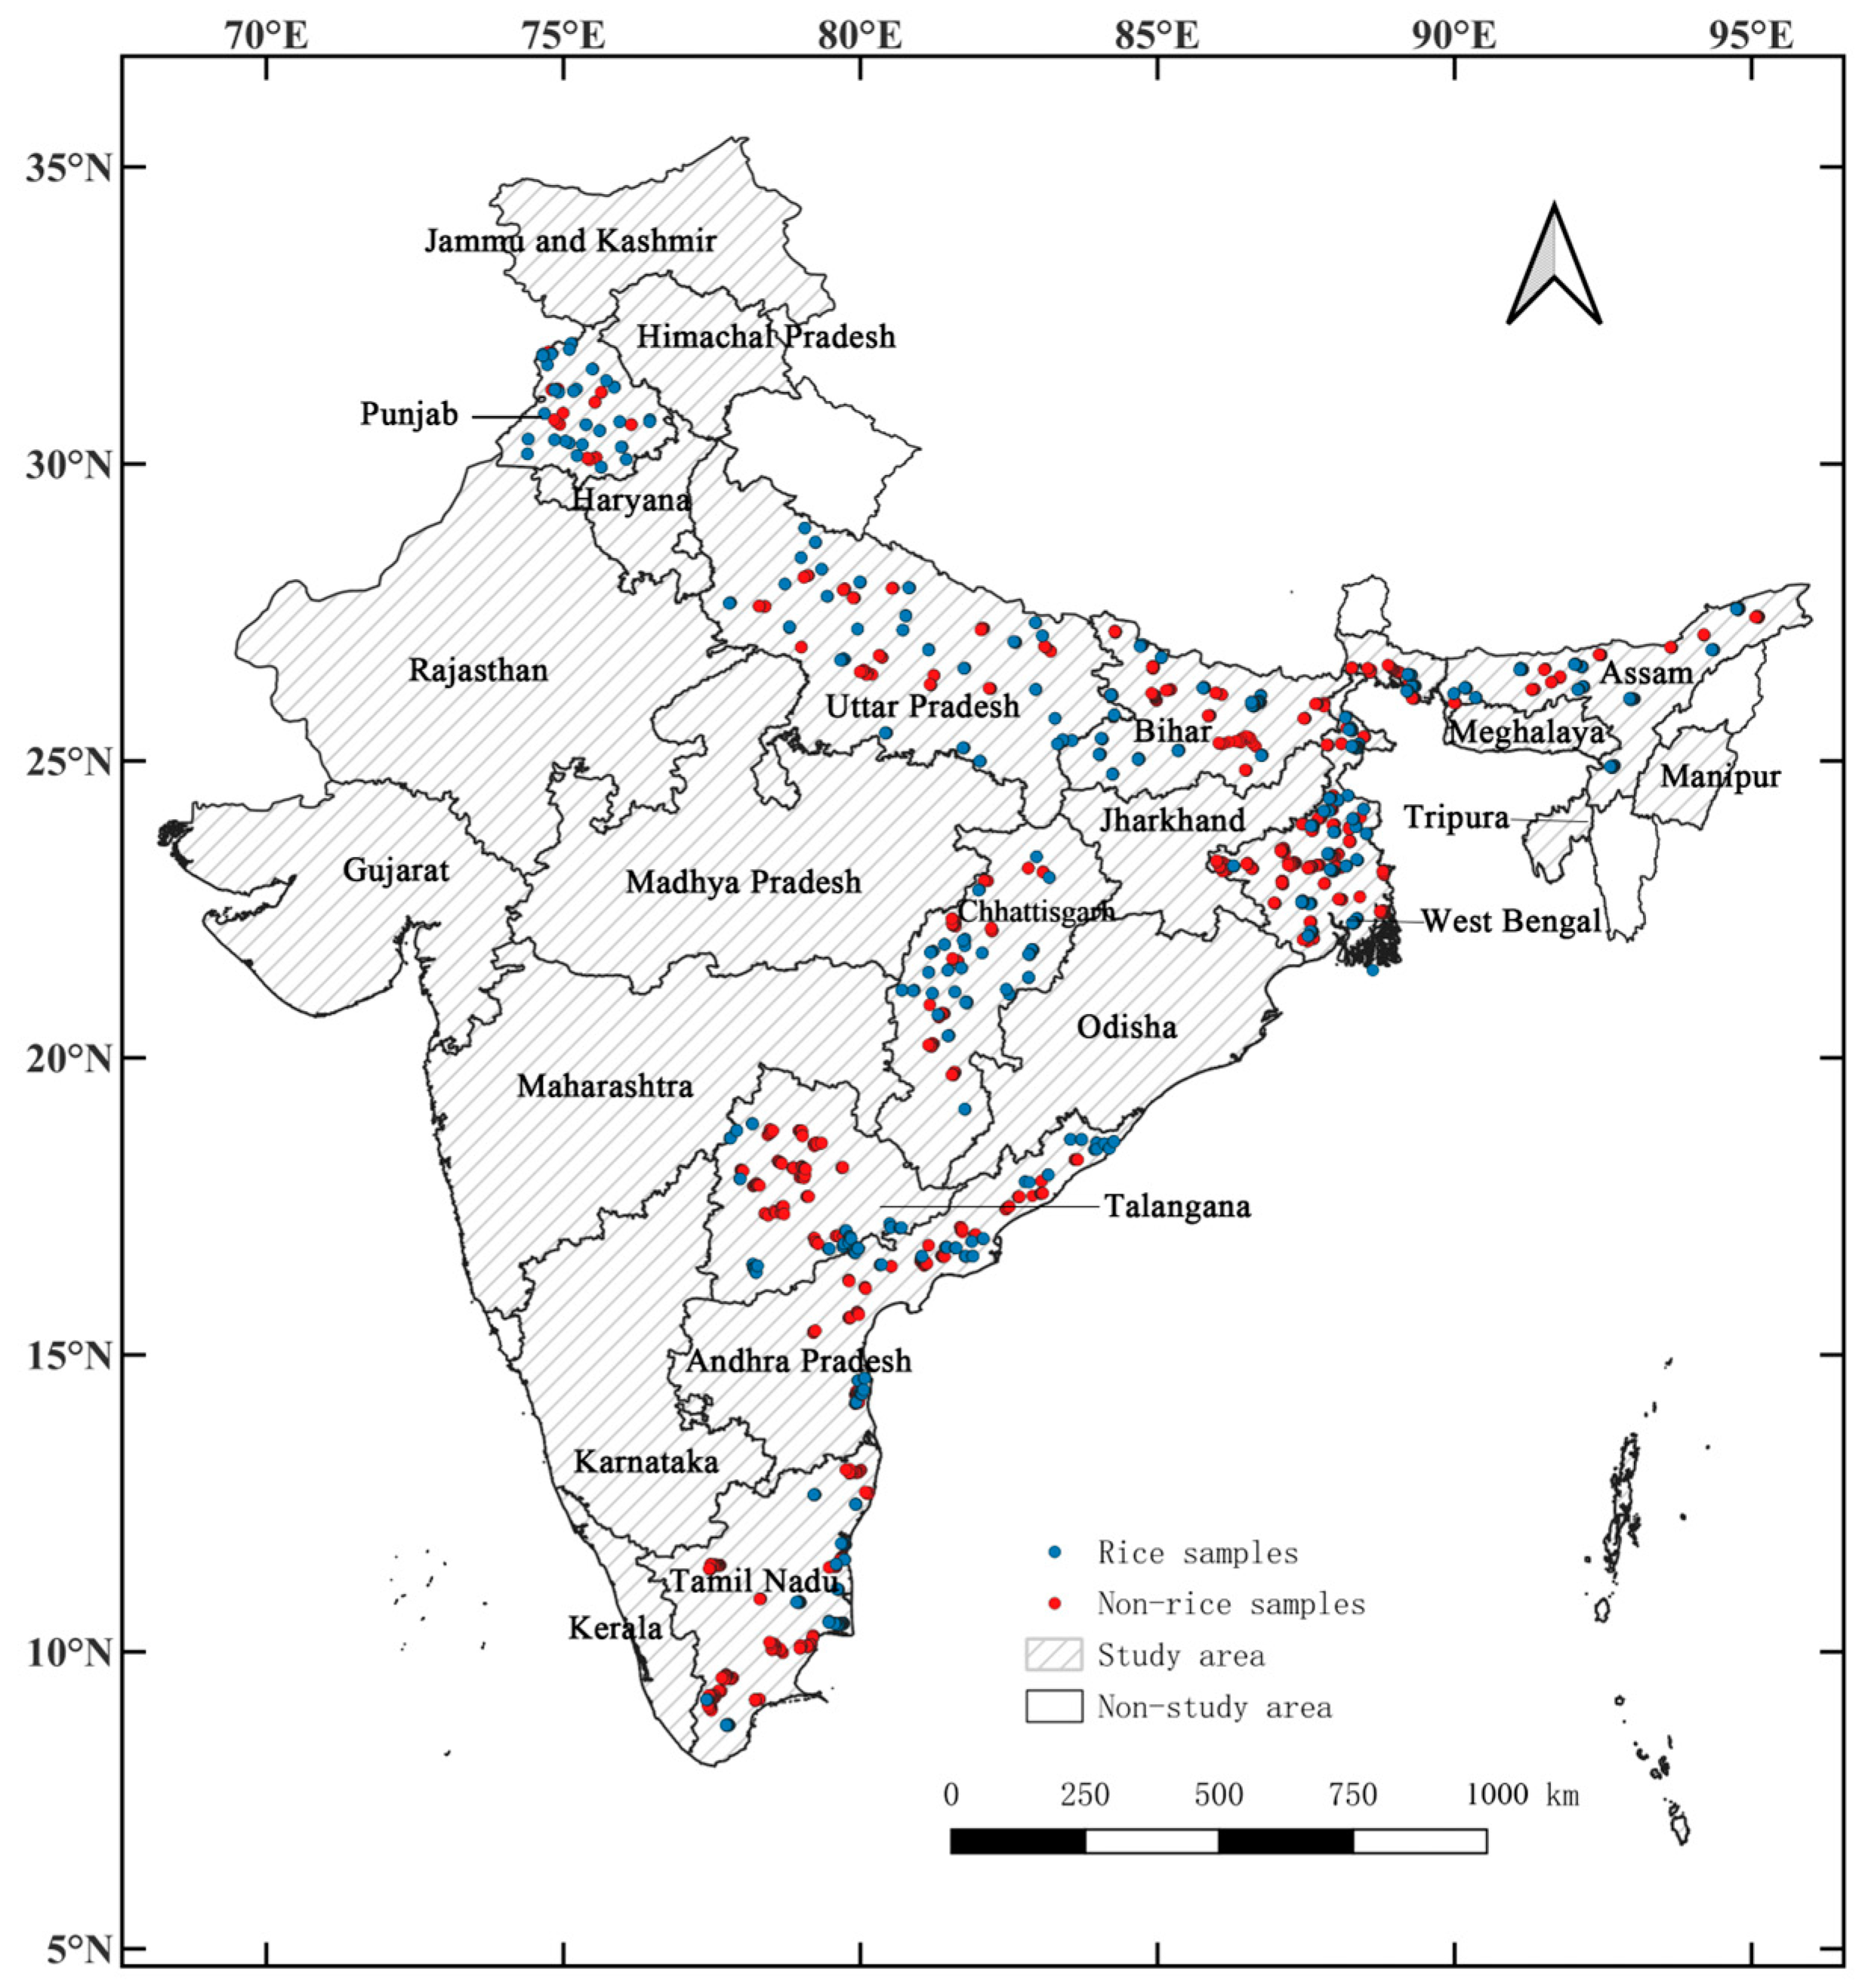
2.1. Study Area

This study focused on mapping rice cultivation in 23 states, which together account for over 98% of the total rice planting area in India. These states included Uttar Pradesh, West Bengal, Chhattisgarh, etc., as specifically shown in Figure 1. India’s diverse climates include tropical wet, tropical dry, subtropical humid, and mountainous zones. The climate is largely influenced by tropical monsoons, resulting in a yearly cycle of a rainy season (June to October), a dry season (March to May), and a cool season (November to February). Monsoons are essential for rice cultivation nationwide. Geographically, India’s predominantly low-lying terrain is well-suited for paddy rice farming.

2.2. Data

In this study, the VH data of Sentinel-1 and the NDVI and NDWI time series of Sentinel-2 were selected to generate rice identification maps. Specifically, calibrated and orthogonally corrected Sentinel-1 Ground Range Detected (GRD, Level 1) data were utilized for producing SAR VH time series, featuring a temporal resolution of 12 days and a spatial resolution of 10 m. During the processing stage, thermal noise removal, radiometric calibration, and radiometric calibration x were conducted for each image. To remove speckle noise from the SAR images, a Savitzky–Golay (SG) filter was applied to the time series data, smoothing it with a filter window size of 5 and a second-order polynomial degree. Moreover, synthetic 12-day NDVI and NDWI time series data from Sentinel-1 and Sentinel-2, each with a 10 m resolution, were employed to capture vegetation and water body characteristics. We finally acquired VH, NDVI, and NDWI data for 2018, 2020, and 2022 and processed them on the GEE platform.
We performed a visual interpretation of the 2018 Google Earth ultra-high-resolution images to validate the accuracy of the method at the field scale. We selected a large rice growing area and acquired 9128 sample points as the validation dataset. Among them, 4622 sample points were identified as rice samples (blue dots in Figure 1), while the remaining 2412 sample points were identified as non-rice samples (red dots in Figure 1). These validation points were selected to represent different land cover scenarios to ensure a comprehensive assessment of the accuracy of the method.
Moreover, the accuracy of the rice distribution was validated with county-level and state-level statistical data sourced from the National Informatics Centre of India (https://aps.dac.gov.in/APY/Public_Report1.aspx, accessed on 5 July 2022). The assessment specifically relied on data from 23 states in 2018.
The rice distribution maps for 2018, 2020, and 2022 for 23 states of India are available at https://doi.org/10.6084/m9.figshare.24228619 [38]. The file format of this product is GeoTIFF, and the spatial datum is WGS84 (EPSG:4326).

2.3. Identification Method of Paddy Rice in India

Rice cultivation in India is categorized into three seasons based on the harvest period: autumn, winter, and summer. In Eastern and Southern India, the favorable year-round average temperatures facilitate continuous rice cultivation, enabling the production of two to three rice crops annually in these regions. In contrast, in the northern and western regions of the country, where winter temperatures are notably lower, rice cultivation is limited to a single crop from May to November. The naming of these three growth seasons corresponds to the timing of rice harvests. Autumn rice is referred to as pre-Khalif rice, mainly planted in the states of Odisha, Bihar, Assam, Kerala, West Bengal, and Tamil Nadu. Pre-Kharif rice is typically sown between May and August, varying marginally across states due to weather conditions and rainfall patterns. The harvest for pre-Kharif rice usually takes place from September to October. The primary rice cultivation season in India is winter rice, i.e., ‘Kharif’. The Kharif sowing time is June–July and harvesting takes place from November to December. The states of Kharif cultivation mainly include Odisha, Bihar, Assam, Kerala, West Bengal, Tamil Nadu, Karnataka, Telangana, Andhra Pradesh, Arunachal Pradesh, Punjab, Jammu and Kashmir, Jharkhand, Himachal Pradesh, Maharashtra, Manipur, Rajasthan, Gujarat, Punjab, Madhya Pradesh, Chhattisgarh, Uttar Pradesh, and Haryana. About 84% of rice in India occurs during this period. Summer rice is termed Rabi rice and is mainly planted in Odisha, Bihar, Assam, Kerala, West Bengal, Tamil Nadu, Karnataka, Telangana, and Andhra Pradesh. The planting and harvesting periods for Rabi rice span from November to February and from March to June, respectively. Rabi rice cultivation occupies just 9% of the total area, primarily featuring early-maturing varieties. The planting and harvesting seasons for autumn, summer, and winter rice are categorized by state, as detailed in Table 1.
This study used the SPRI method [3] to map rice cultivation in 23 states in India for 2018, 2020, and 2022. The SPRI method utilizes the distinctive characteristics of paddy rice during the transplanting–vegetative period within the Sentinel-1 VH backscatter time series: (1) the dynamic range of backscattering during rice growth is greater than that of other crops; (2) during the irrigation period, the backscatter values of rice are similar to those of water bodies; and (3) the backscattering value is close to that of other crops during the vegetative stage [3]. The method defines vegetation and water bodies by setting an upper boundary (referred to as “V-line”) representing the maximum local vegetation intensity (v) and a lower boundary (referred to as “W-line”) representing the local water surface intensity (w) (Figure 2). Then f D , f V , and f W are defined as indicators to quantify the growth and developmental traits of rice (from points p1 to p2 in Figure 2). Crops that possess all three characteristics are identified as rice. SPRI is the product of these three indicators and is calculated as follows:
S P R I = f D × f V × f W
f W = 1 W 2   ,   W = 1   ,   p 1 v p 1 w v w   ,   w p 1 < v 0   ,   p 2 < w  
f V = 1 V 2   ,   V = 1   ,   p 2 w v p 2 v w   ,   w < p 2 v 0   ,   p 2 > v  
f D = 1 1 + e v w 2 D   ,   D = p 2 p 1
where f D   represents the ratio of the dynamic range D of the VH backscatter coefficient to v w during crop growth; the sigmoid function is used to expand the difference between rice and other crops. f V   and f W indicate the proximity of the VH values between rice and water during irrigation and between rice and other crops during the vegetative stage, respectively. v and w stand for the backscatter intensity of the V and W lines, and p 1 and p 2 represent the minimum and maximum values in the VH backscatter coefficient time series for each pixel, respectively. The values of f D ,   f V ,   and f W range from 0 to 1. The closer their product (SPRI) is to 1, the greater the probability that the pixel is rice.
The specific procedure for identifying Indian rice based on the SPRI method is as follows:
1.
Distinguish vegetated and temporary water body areas
In our study, we used NDVI and NDWI to classify the vegetation and temporary water body areas. According to previous studies, a pixel is classified as a vegetated area when its NDVI value is higher than 0.4 [39]. When the NDVI value is higher than 0.4, and the NDWI value is greater than 0, we classify the pixel as a temporary water body [40].
2.
Calculation of V and W line values
We calculated the annual composite maximum of the backscattering intensities for each pixel in the vegetated region, arranged them in order from largest to smallest, and selected the value of the backscattering coefficient on the decile as the value of the V-line. We also calculated the annual composite minimum of the backscattering intensity for each pixel on the water body region, sorted the values from smallest to largest, and selected the value of the backscattering coefficient on the decile as the value of the W line [41].
3.
Calculation of the SPRI value
The SPRI value of each pixel was calculated according to the formula in Equation (1). The SPRI value represents the likelihood of rice cultivation in a pixel, and a higher value indicates a greater probability that the pixel contains rice.
4.
Generation of a rice recognition map
The SPRI values of the pixels to be identified were arranged in descending order, and state-level agricultural statistics were used to determine the threshold value for classification by this index. That is, the N pixels with the highest index value were selected, and the total area of these N pixels was equal to the area of rice cultivation recorded in that state [22,41,42,43,44,45,46,47].
Rice cultivation in India is affected by factors like altitude, climate, soil composition, and water resources, resulting in substantial variations in irrigation schedules across different regions. To enhance the accuracy of rice classification and minimize the impact of other crops, we utilized state-specific VH time series data corresponding to the irrigation periods of rice across states for rice classification. However, there are also overlapping irrigation periods for autumn and winter rice in some triple-season rice areas, which can easily lead to mixed classifications of autumn and winter rice. Here, we used the different harvest periods of these two types of rice to distinguish between autumn and winter rice by increasing the harvest signal. For example, areas in West Bengal with NDVI < 0.3 in December were considered as possible planting areas for autumn rice; areas in Bihar with NDVI < 0.3 in November were considered as likely planting areas for autumn rice; and areas in Odisha with NDVI < 0.3 in November were considered as possible planting areas for autumn rice and vice versa for winter rice.

2.4. Statistical Analysis

This study evaluated the accuracy of the rice distribution maps at the pixel scale and regional scale using visually interpreted samples obtained from Google Earth’s very high-resolution images and county-level statistical areas. By using a confusion matrix to show how the distribution map classifies the survey samples, three evaluation metrics such as producer accuracy (PA), user accuracy (UA), and overall accuracy (OA) were calculated as follows:
P A = T P T P + F P × 100 %
U A = T P T P + F N × 100 %
O A = T P + T N T P + T N + F P + F N × 100 %
where TP represents the number of samples accurately identified as rice. TN represents the number of samples accurately identified as non-rice. FP represents the number of non-rice samples incorrectly classified as rice. FN represents the number of rice samples incorrectly classified as non-rice.
The accuracy of the identified areas was assessed by calculating the coefficient of determination (R2), the relative error (RMAE), and root mean square error (RMSE) in a linear regression of the statistical acreage at the district level from the statistical yearbook and the acreage identified at the district level. The metrics were calculated as follows:
R 2 = 1 i = 1 n ( I A i S A i ) 2 i = 1 n ( S A ¯ S A i ) 2
R M A E = i = 1 n S A i I A i i = 1 n S A i
R M S E = 1 n i = 1 n I A i S A i 2
where SAi and IAi represent the statistical area and identified area of the i-th county, respectively, and n denotes the number of counties in a given province.

2.5. Conceptual Flowchart

Figure 3 illustrates the workflow of the rice mapping method proposed in this study for India, which included the following four steps: (1) Overlay Sentinel-1 VH data with cropland mask products to obtain the VH time series for agricultural fields; (2) Preprocess the VH time series data; (3) Use the SPRI method to generate the distribution map of paddy field planting locations in India; (4) Generate the distribution map using thresholds determined from provincial statistical data. Additionally, this study performed pixel- and regional-scale accuracy assessments of the paddy field planting location distribution map using rice samples obtained through visual interpretation and county-level statistical data and analyzed the spatial distribution characteristics of rice cultivation in India.

3. Results

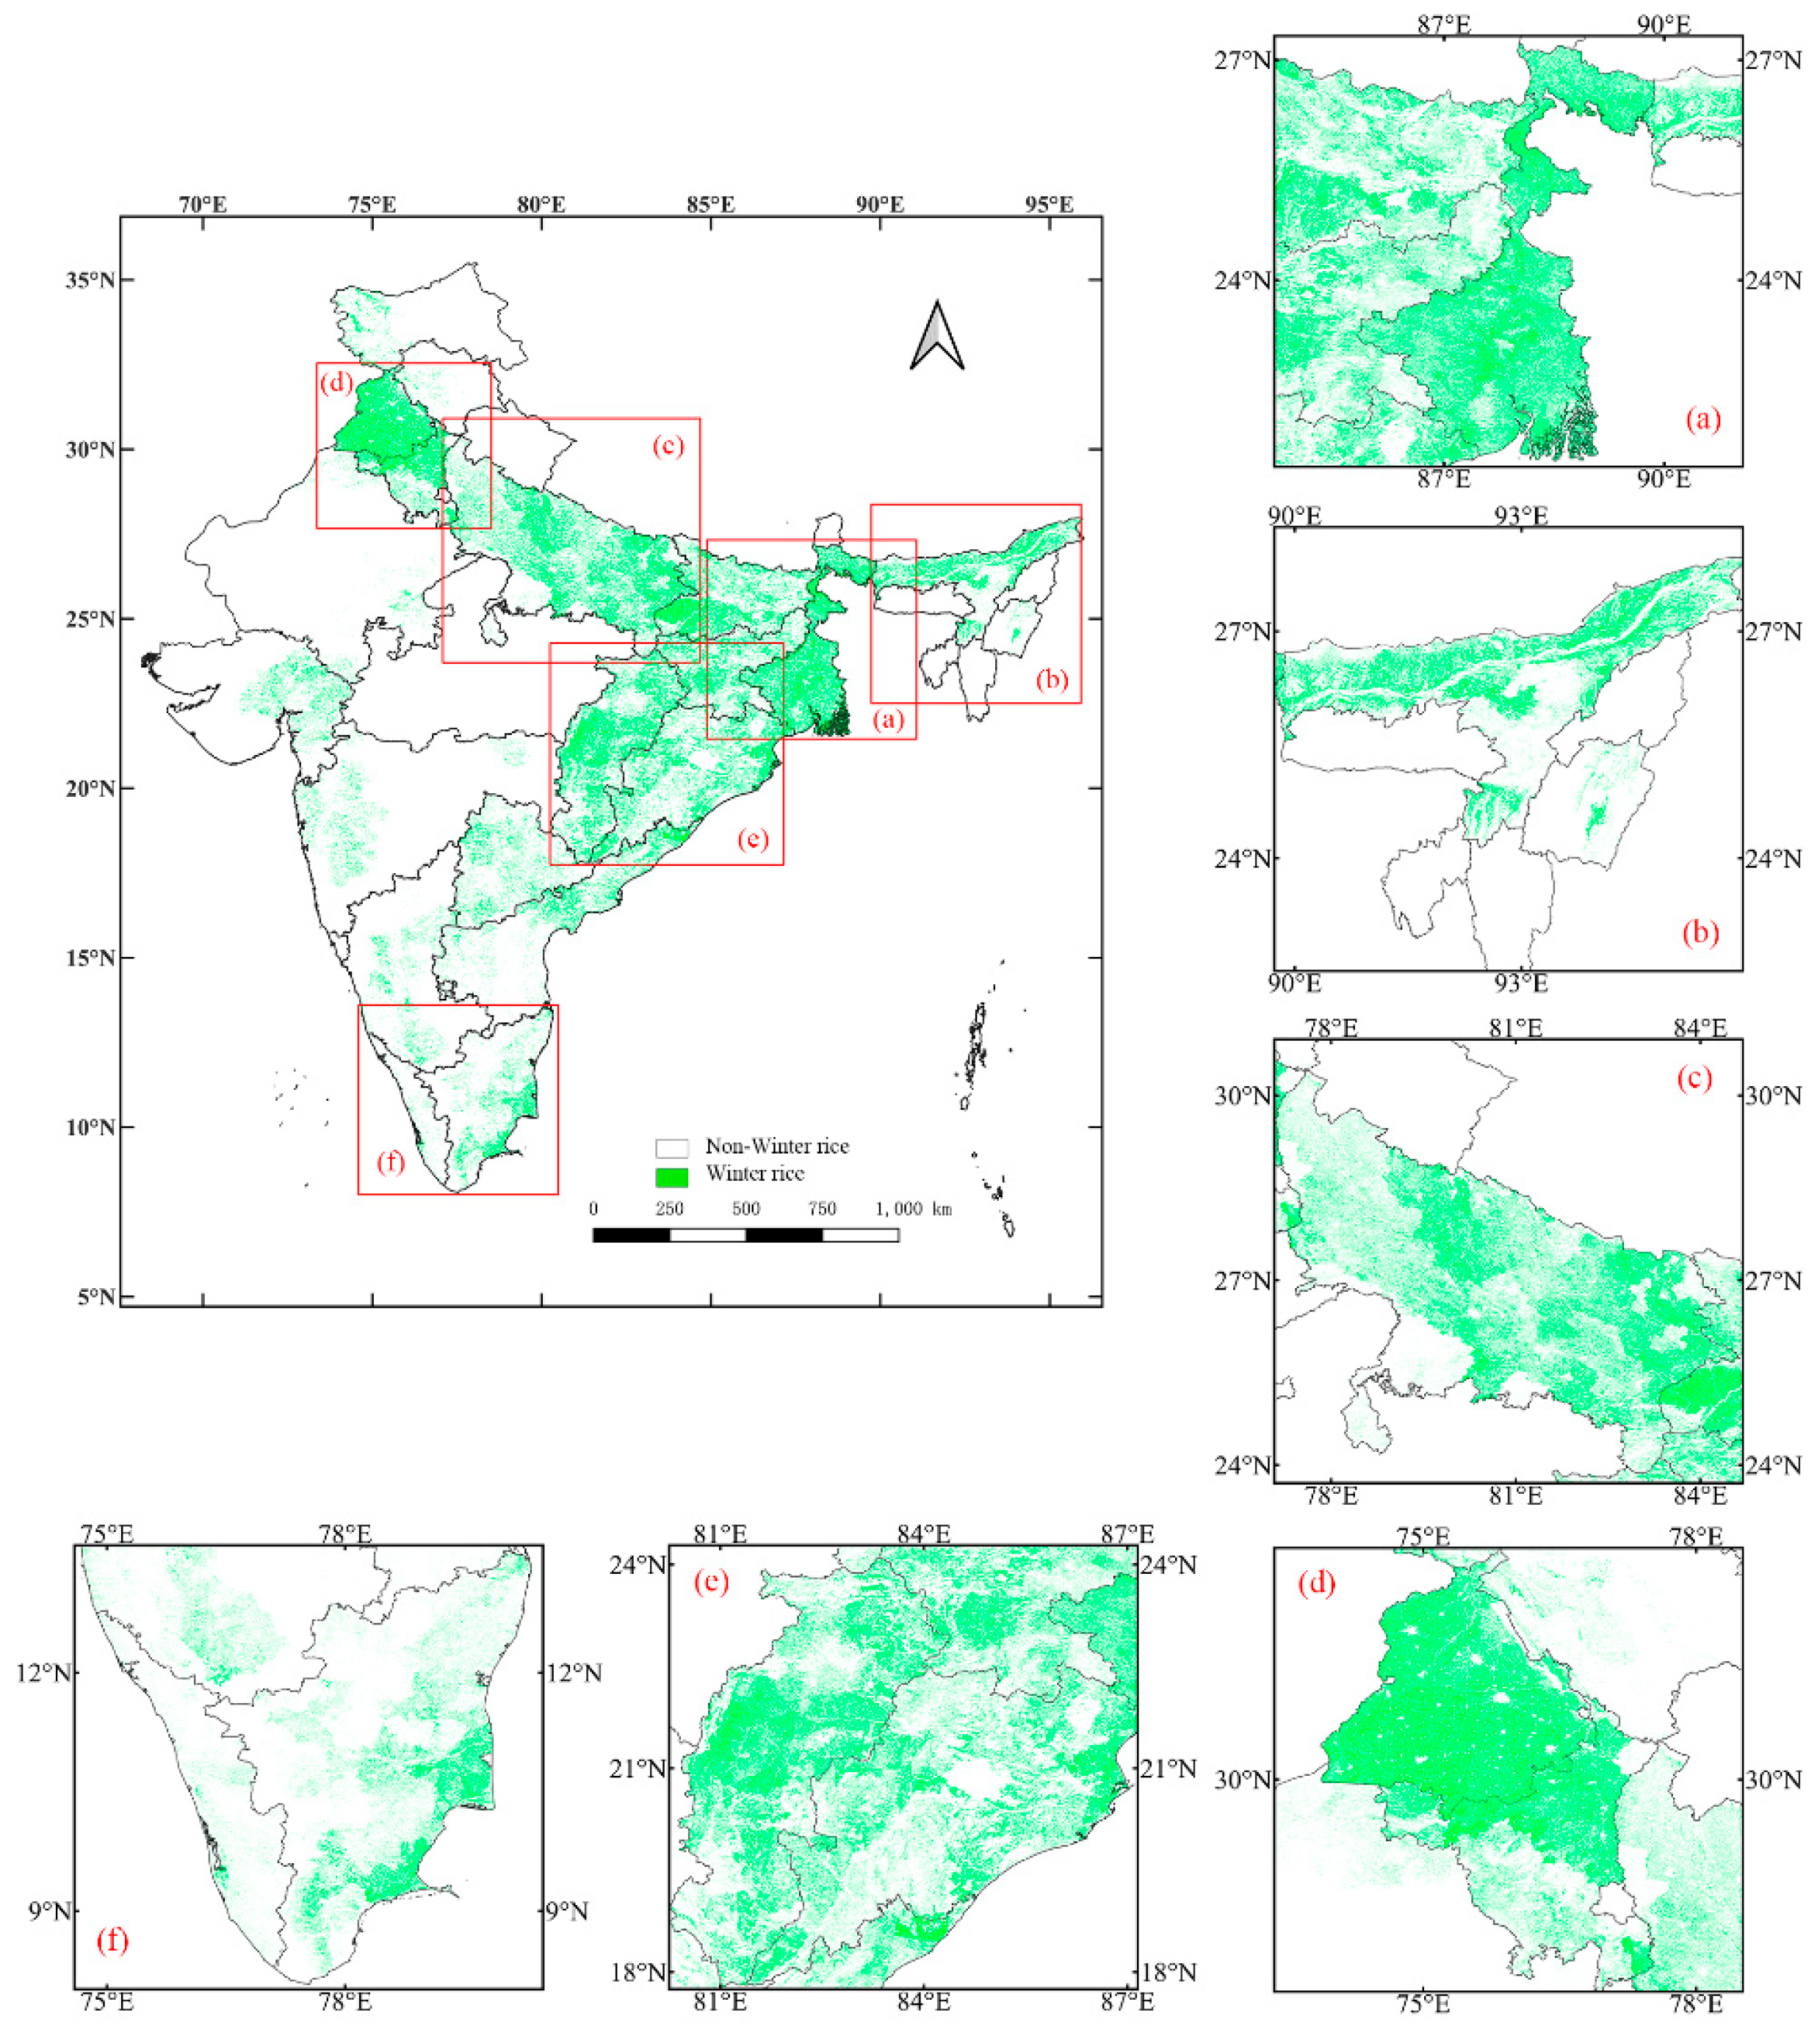
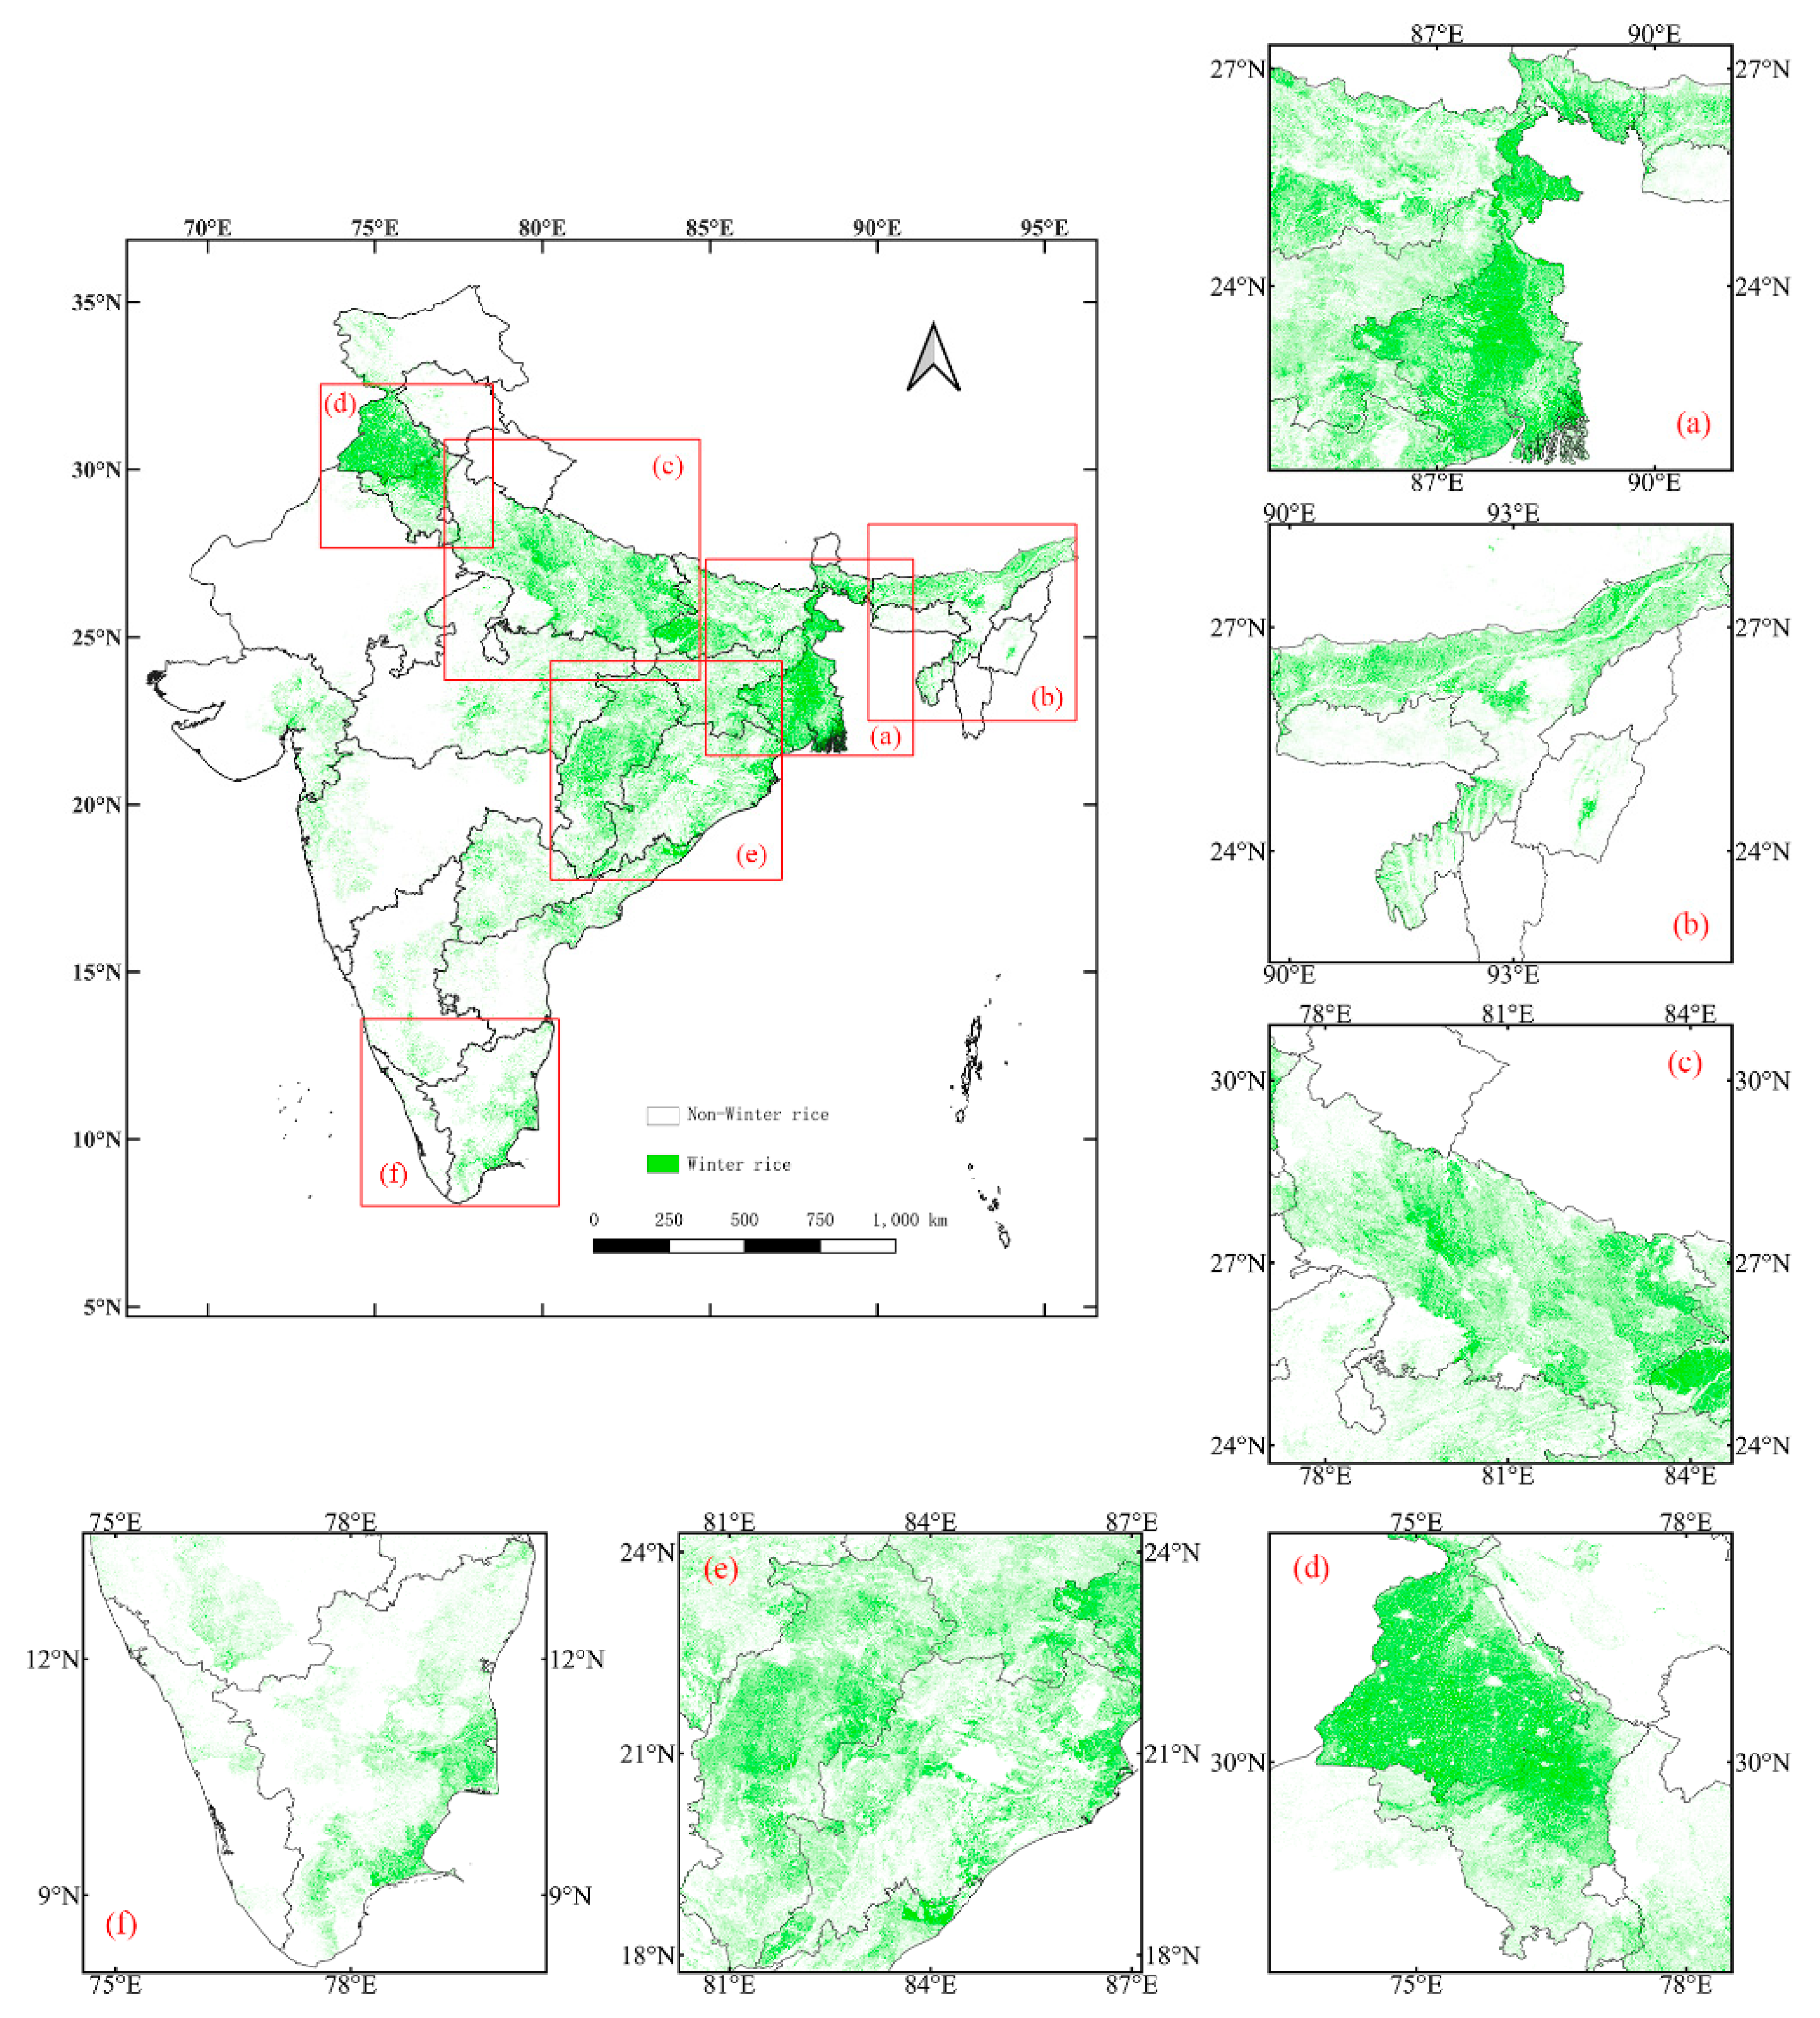
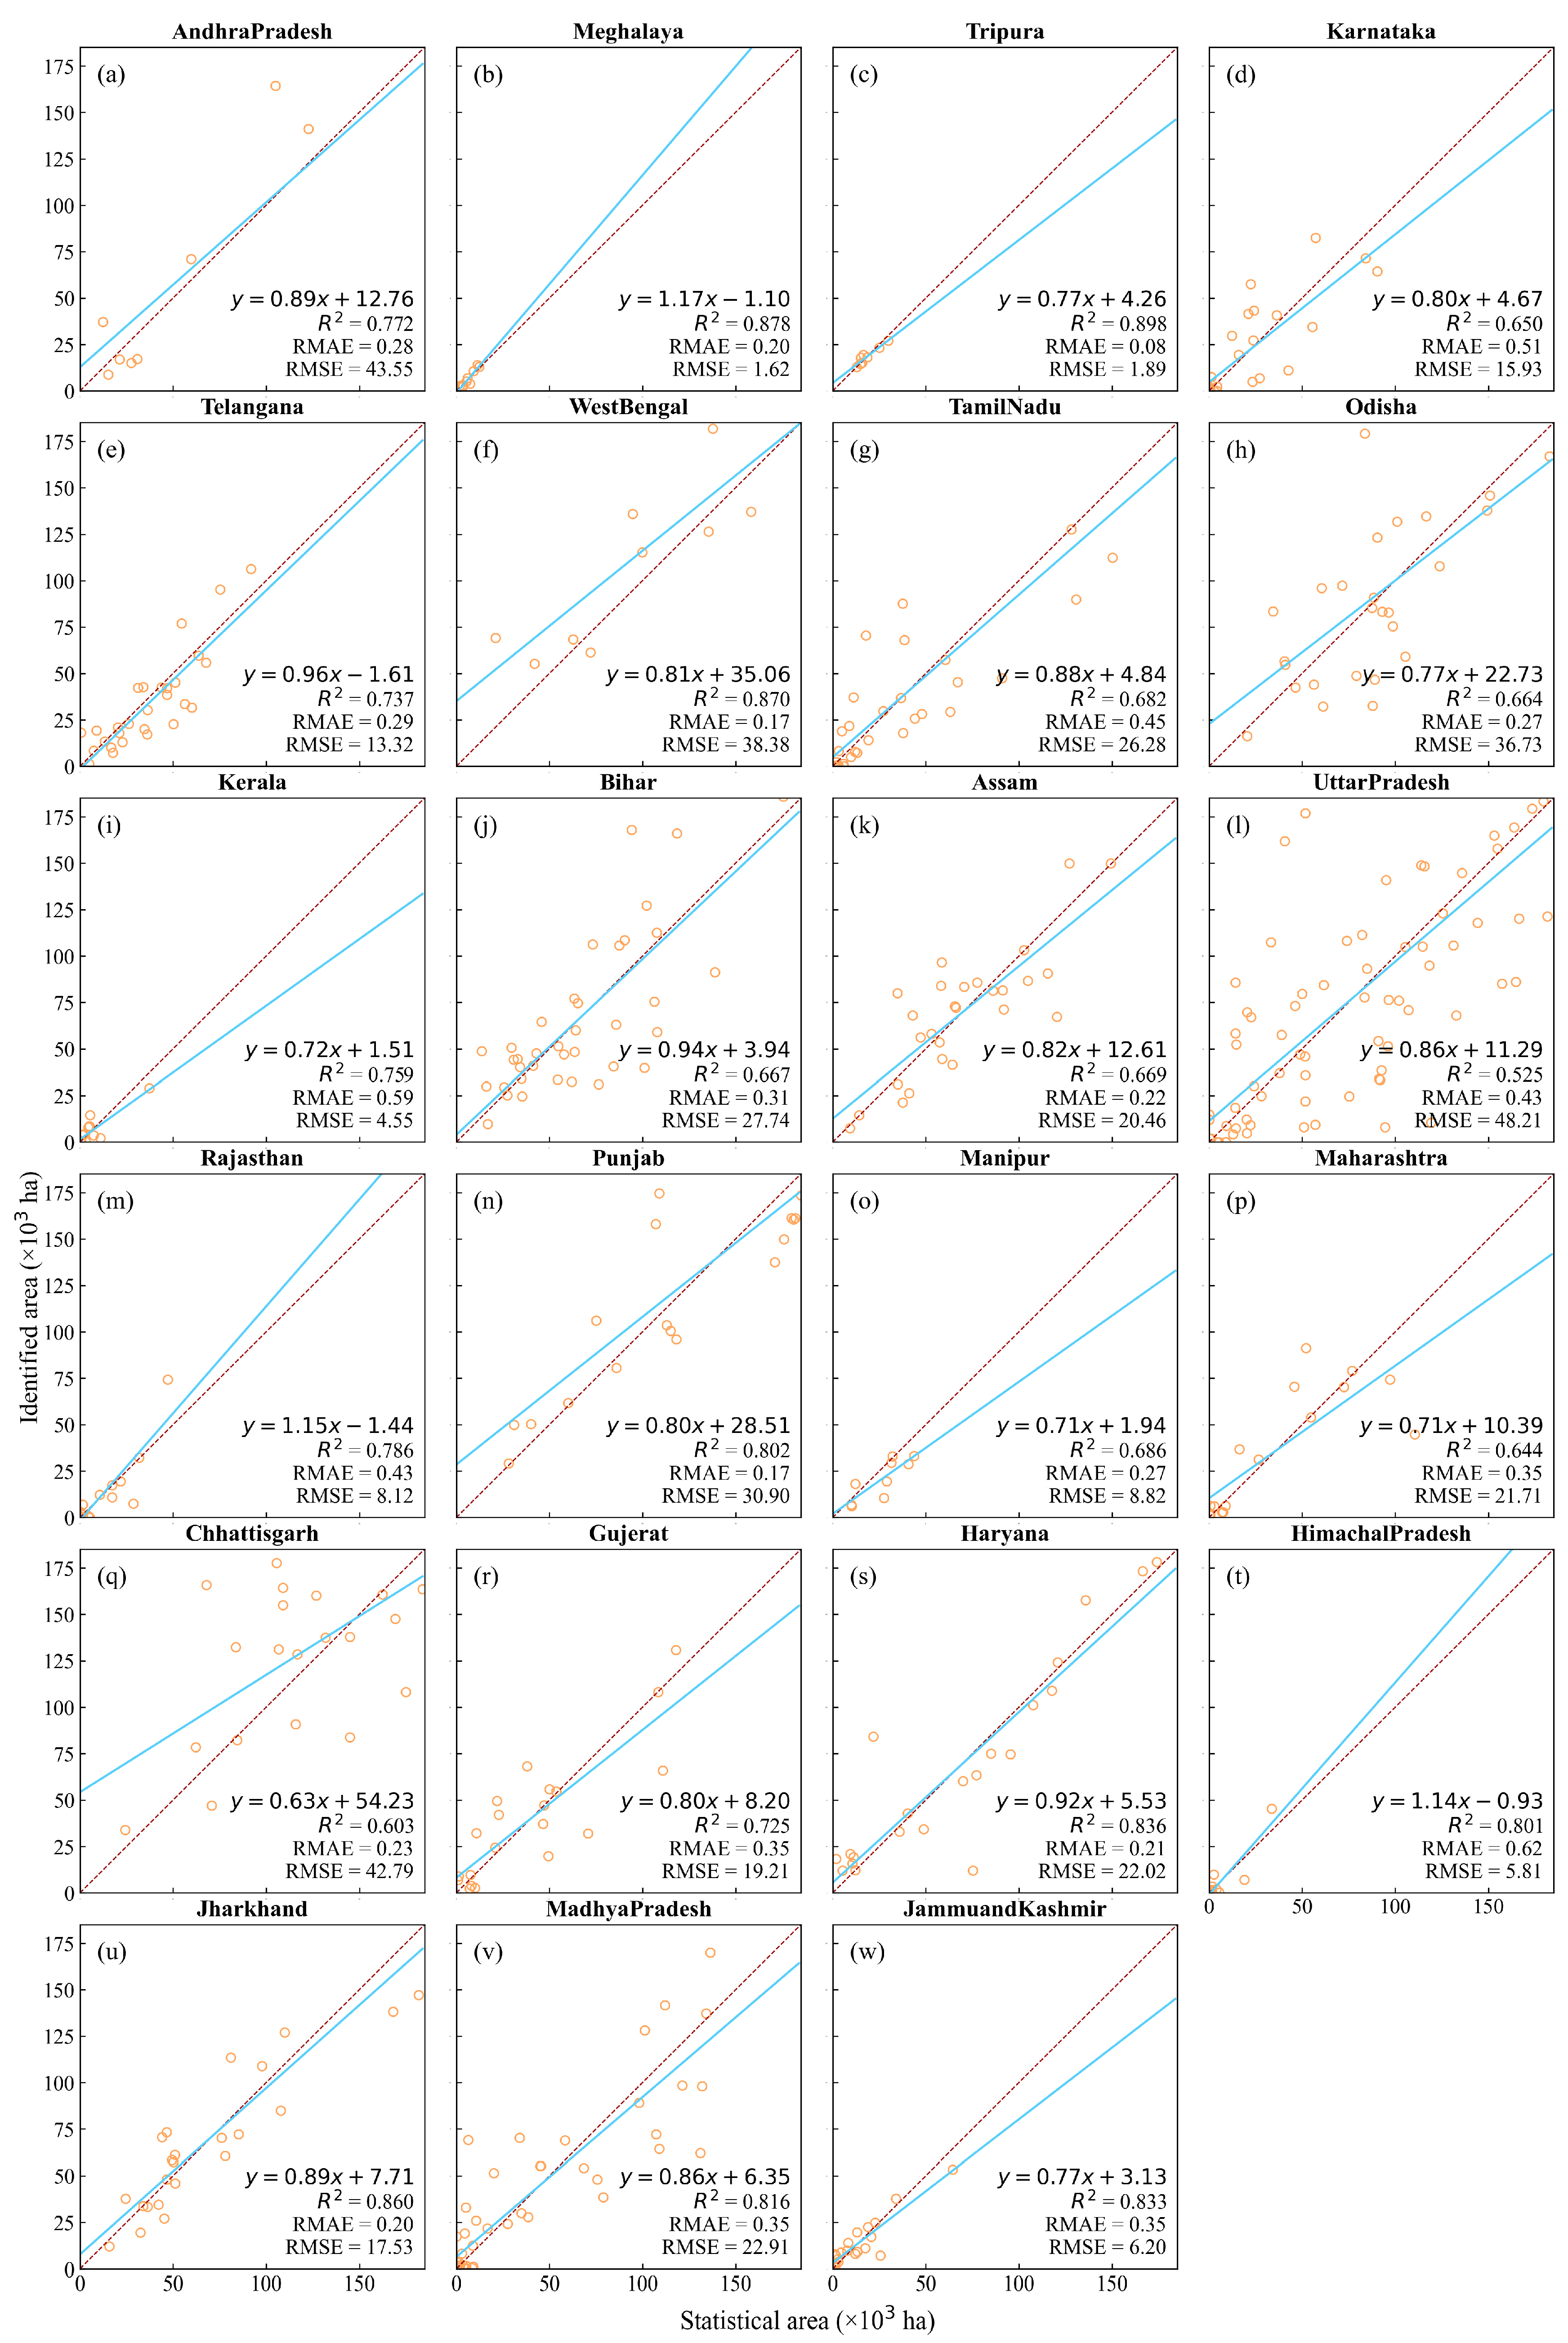
3.1. Identification Accuracy of Winter Rice

Kharif rice is widely distributed in India, especially in the eastern, central, and southern regions of the country (Figure 4, Figure A1, Figure A4). To assess the accuracy of our method, we conducted an evaluation in 11 major producing states with Kharif rice growing seasons (82% of India’s total Kharif rice area, Table 2) based on 5766 field samples (Table 2). The results indicate a high accuracy for Kharif rice crops in the 11 major producing regions. Specifically, the OA varied from 71.82% to 94.46%, with the UA ranging from 72.42% to 98.25% and PA ranging from 69.65% to 91.52% Kharif rice (Table 2). In Uttar Pradesh, a state with the largest planting area of Kharif rice, the classification dataset showed good accuracy, and UA, PA, and OA were 72.42%, 69.65%, and 71.82%, respectively. West Bengal and Chhattisgarh are also large Kharif rice planting areas in India, accounting for 10.44% and 10.40% of Kharif rice in India. The UA, PA, and OA of Kharif rice in West Bengal were 91.16%, 90.31%, and 91.40%, respectively, and that of Kharif rice in Chhattisgarh were 88.96%, 85.22%, and 87.83%, respectively.
Furthermore, we evaluated the identification accuracy against the district-level statistical areas. Our proposed method had good performance in identifying Kharif rice in areas with district-level data. Kharif rice is the most widely grown rice among the three seasons, and the correlation coefficient at the district level between the identified areas and agricultural statistical areas of Kharif rice ranged from 0.63 to 0.82; the RMSE ranged from 1.42 to 48.21. (103 ha), and the RMAE ranged from 0.20 to 0.55 (Figure 5). High accuracies were found in Punjab, Haryana, and Himachal Pradesh in the north of India and Madhya Pradesh and Jharkhand in the eastern region of India, with an R2 range of 0.80 to 0.86, an RMSE range of 5.81 to 30.90. (103 ha), and an RMAE range of 0.17 to 0.35, which may be due to the more intensive winter rice cultivation in these regions and the fact that rice is mostly grown under irrigation in these states. Whereas in states with relatively less cultivated area, such as Maharashtra and Manipur, the accuracy was lower, with an R2 range of 0.64 to 0.69, an RMSE range of 21.71(103 ha) to 8.82 (103 ha), and an RMAE range of 0.35 to 0.27, respectively.

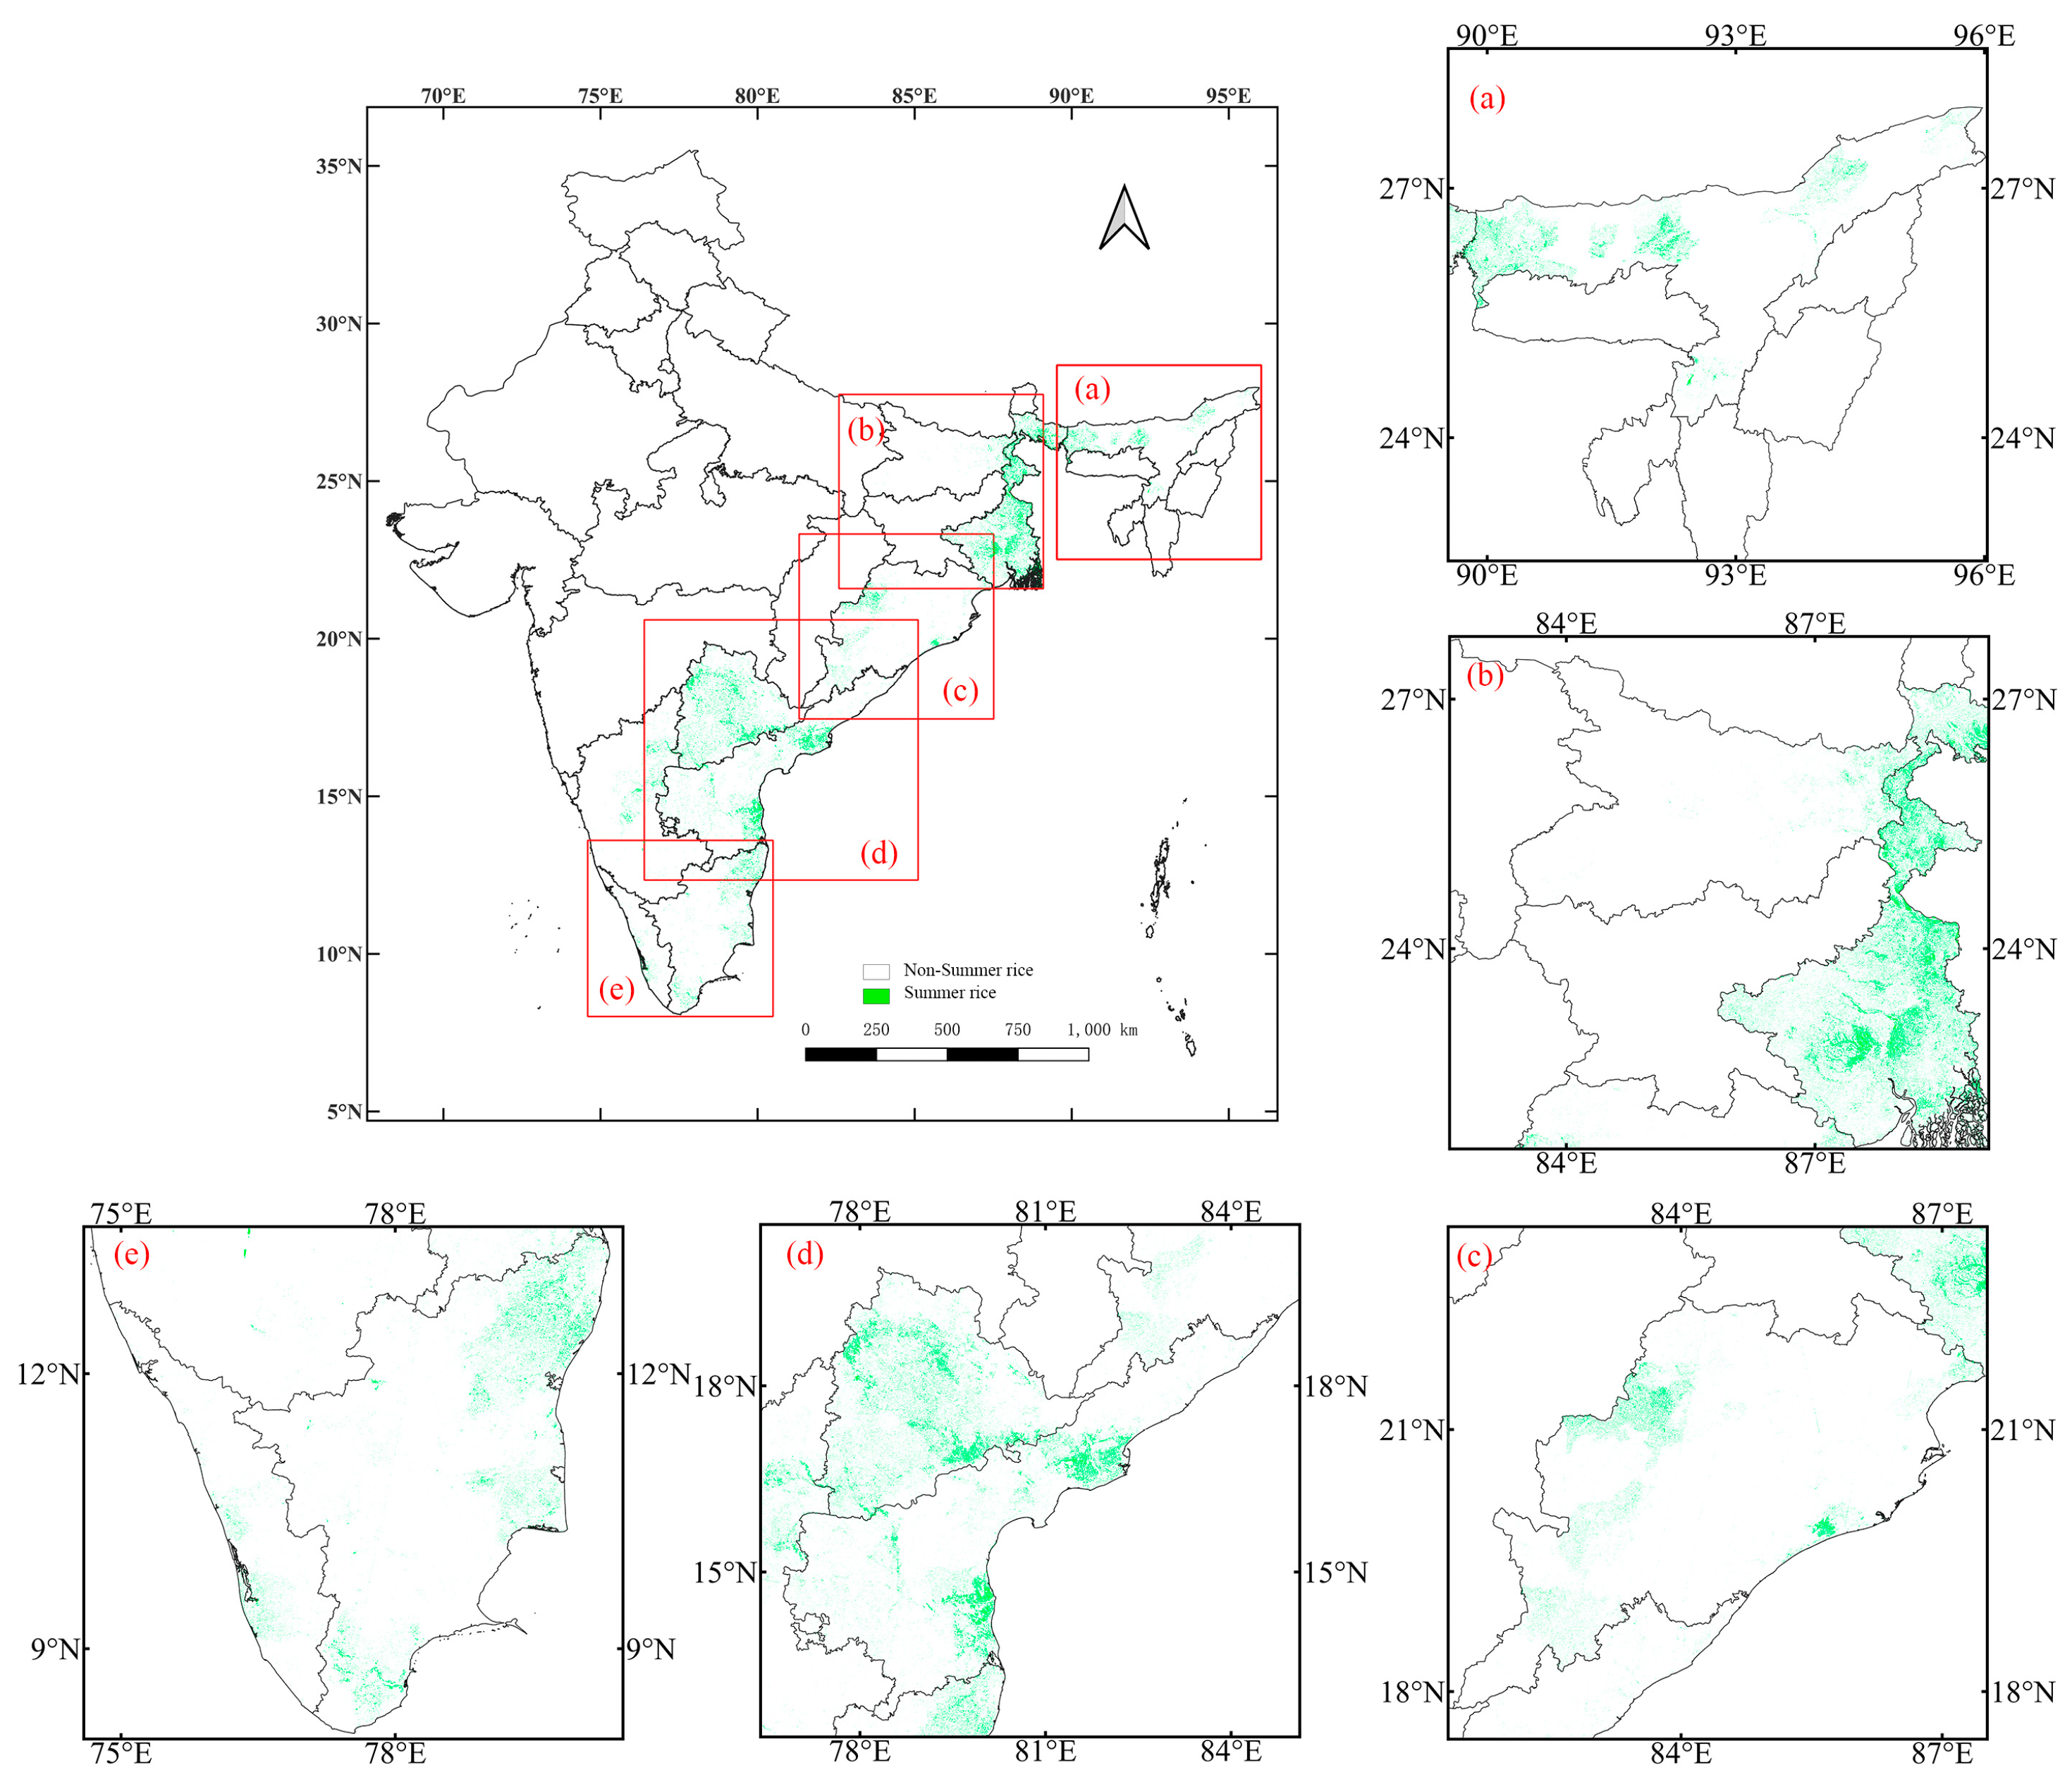
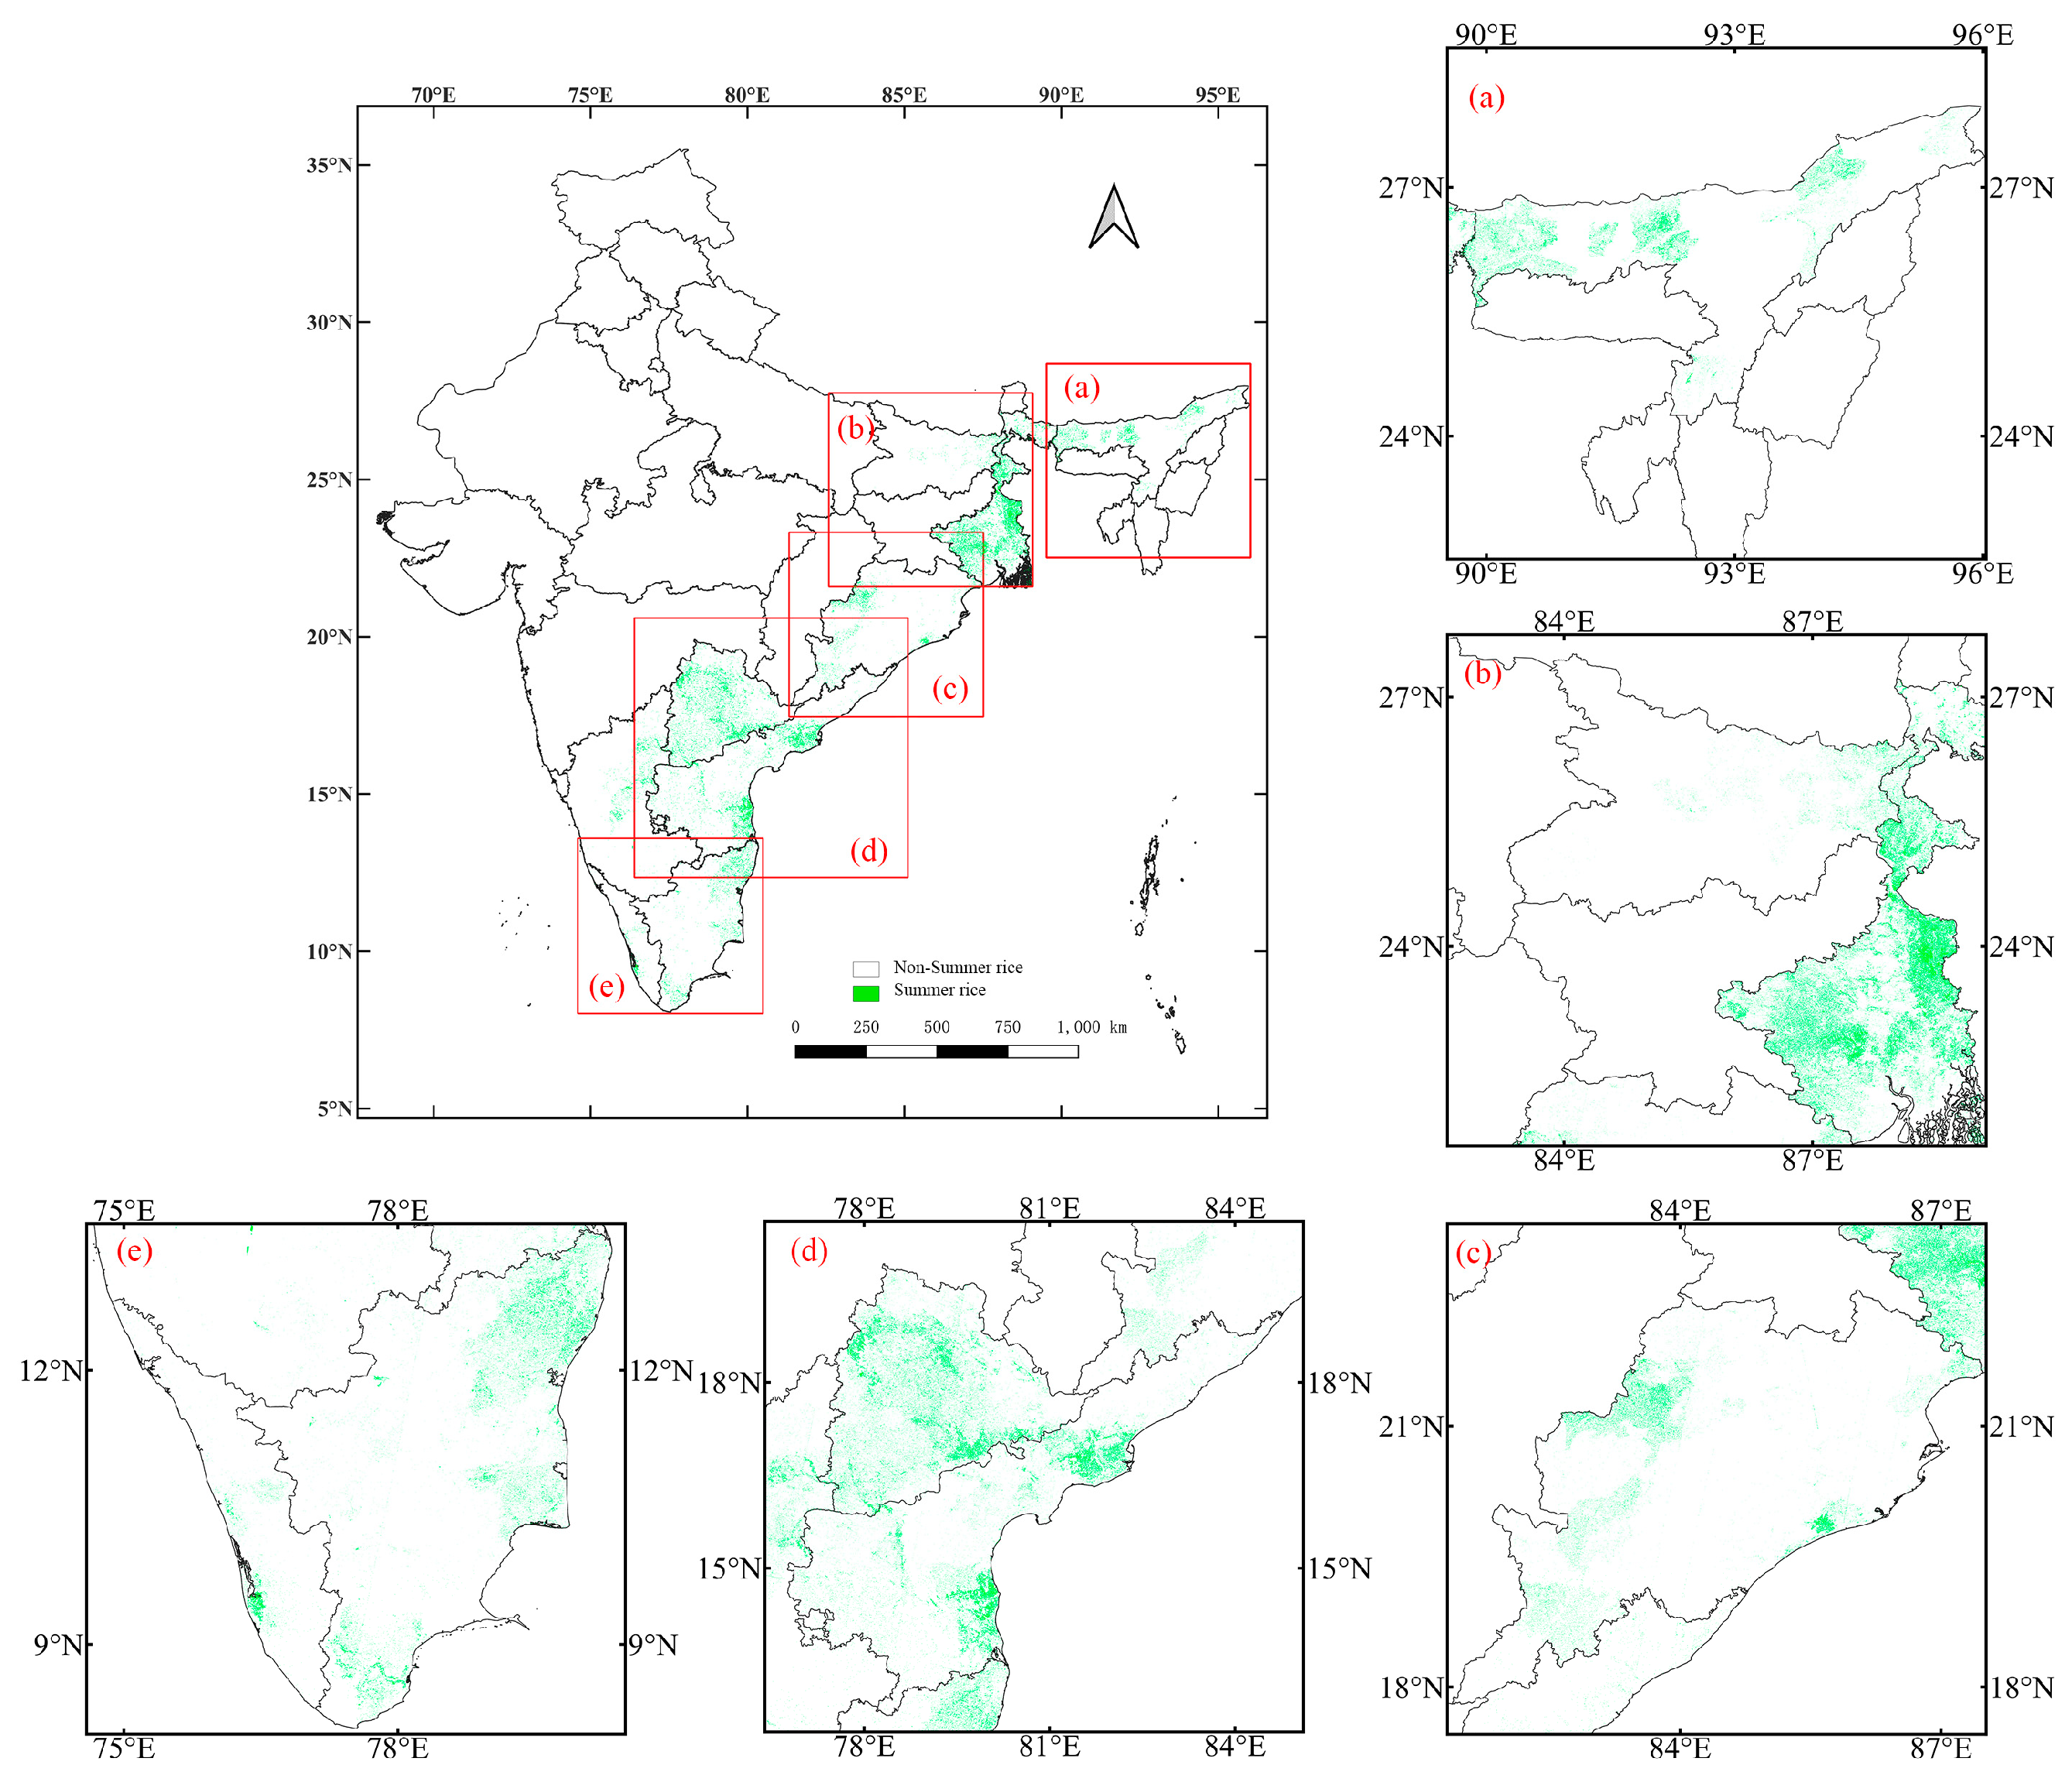
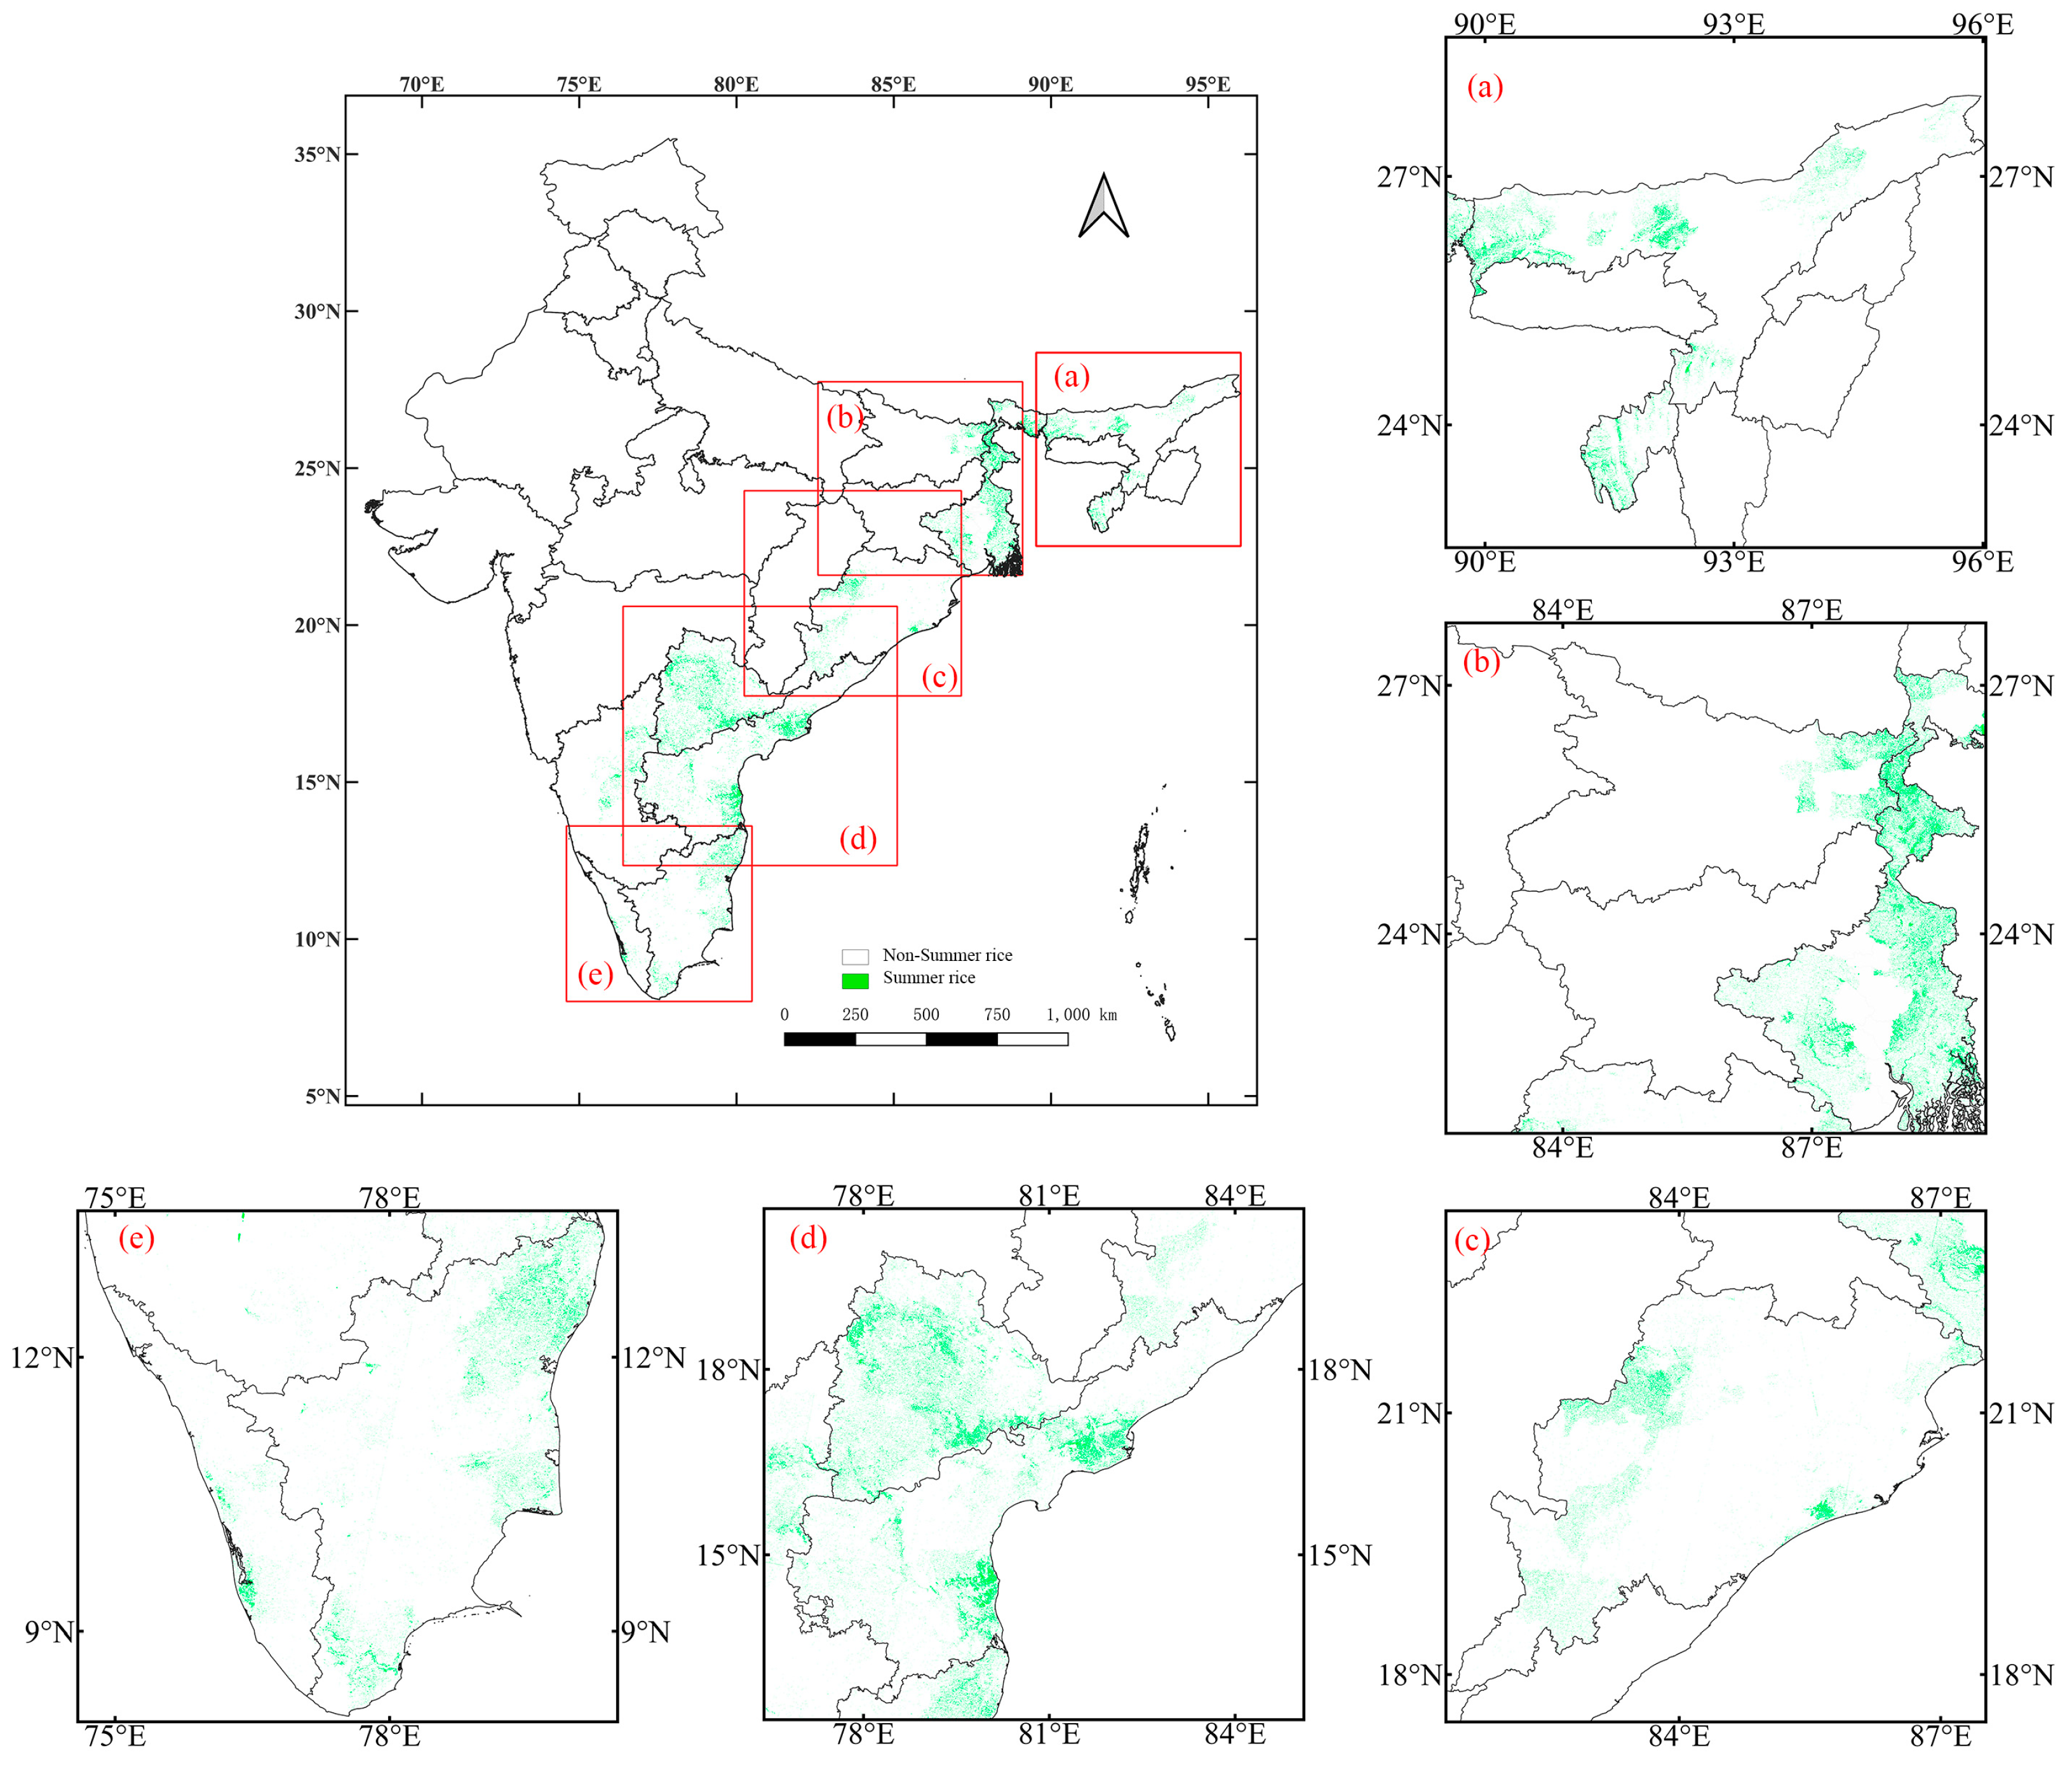
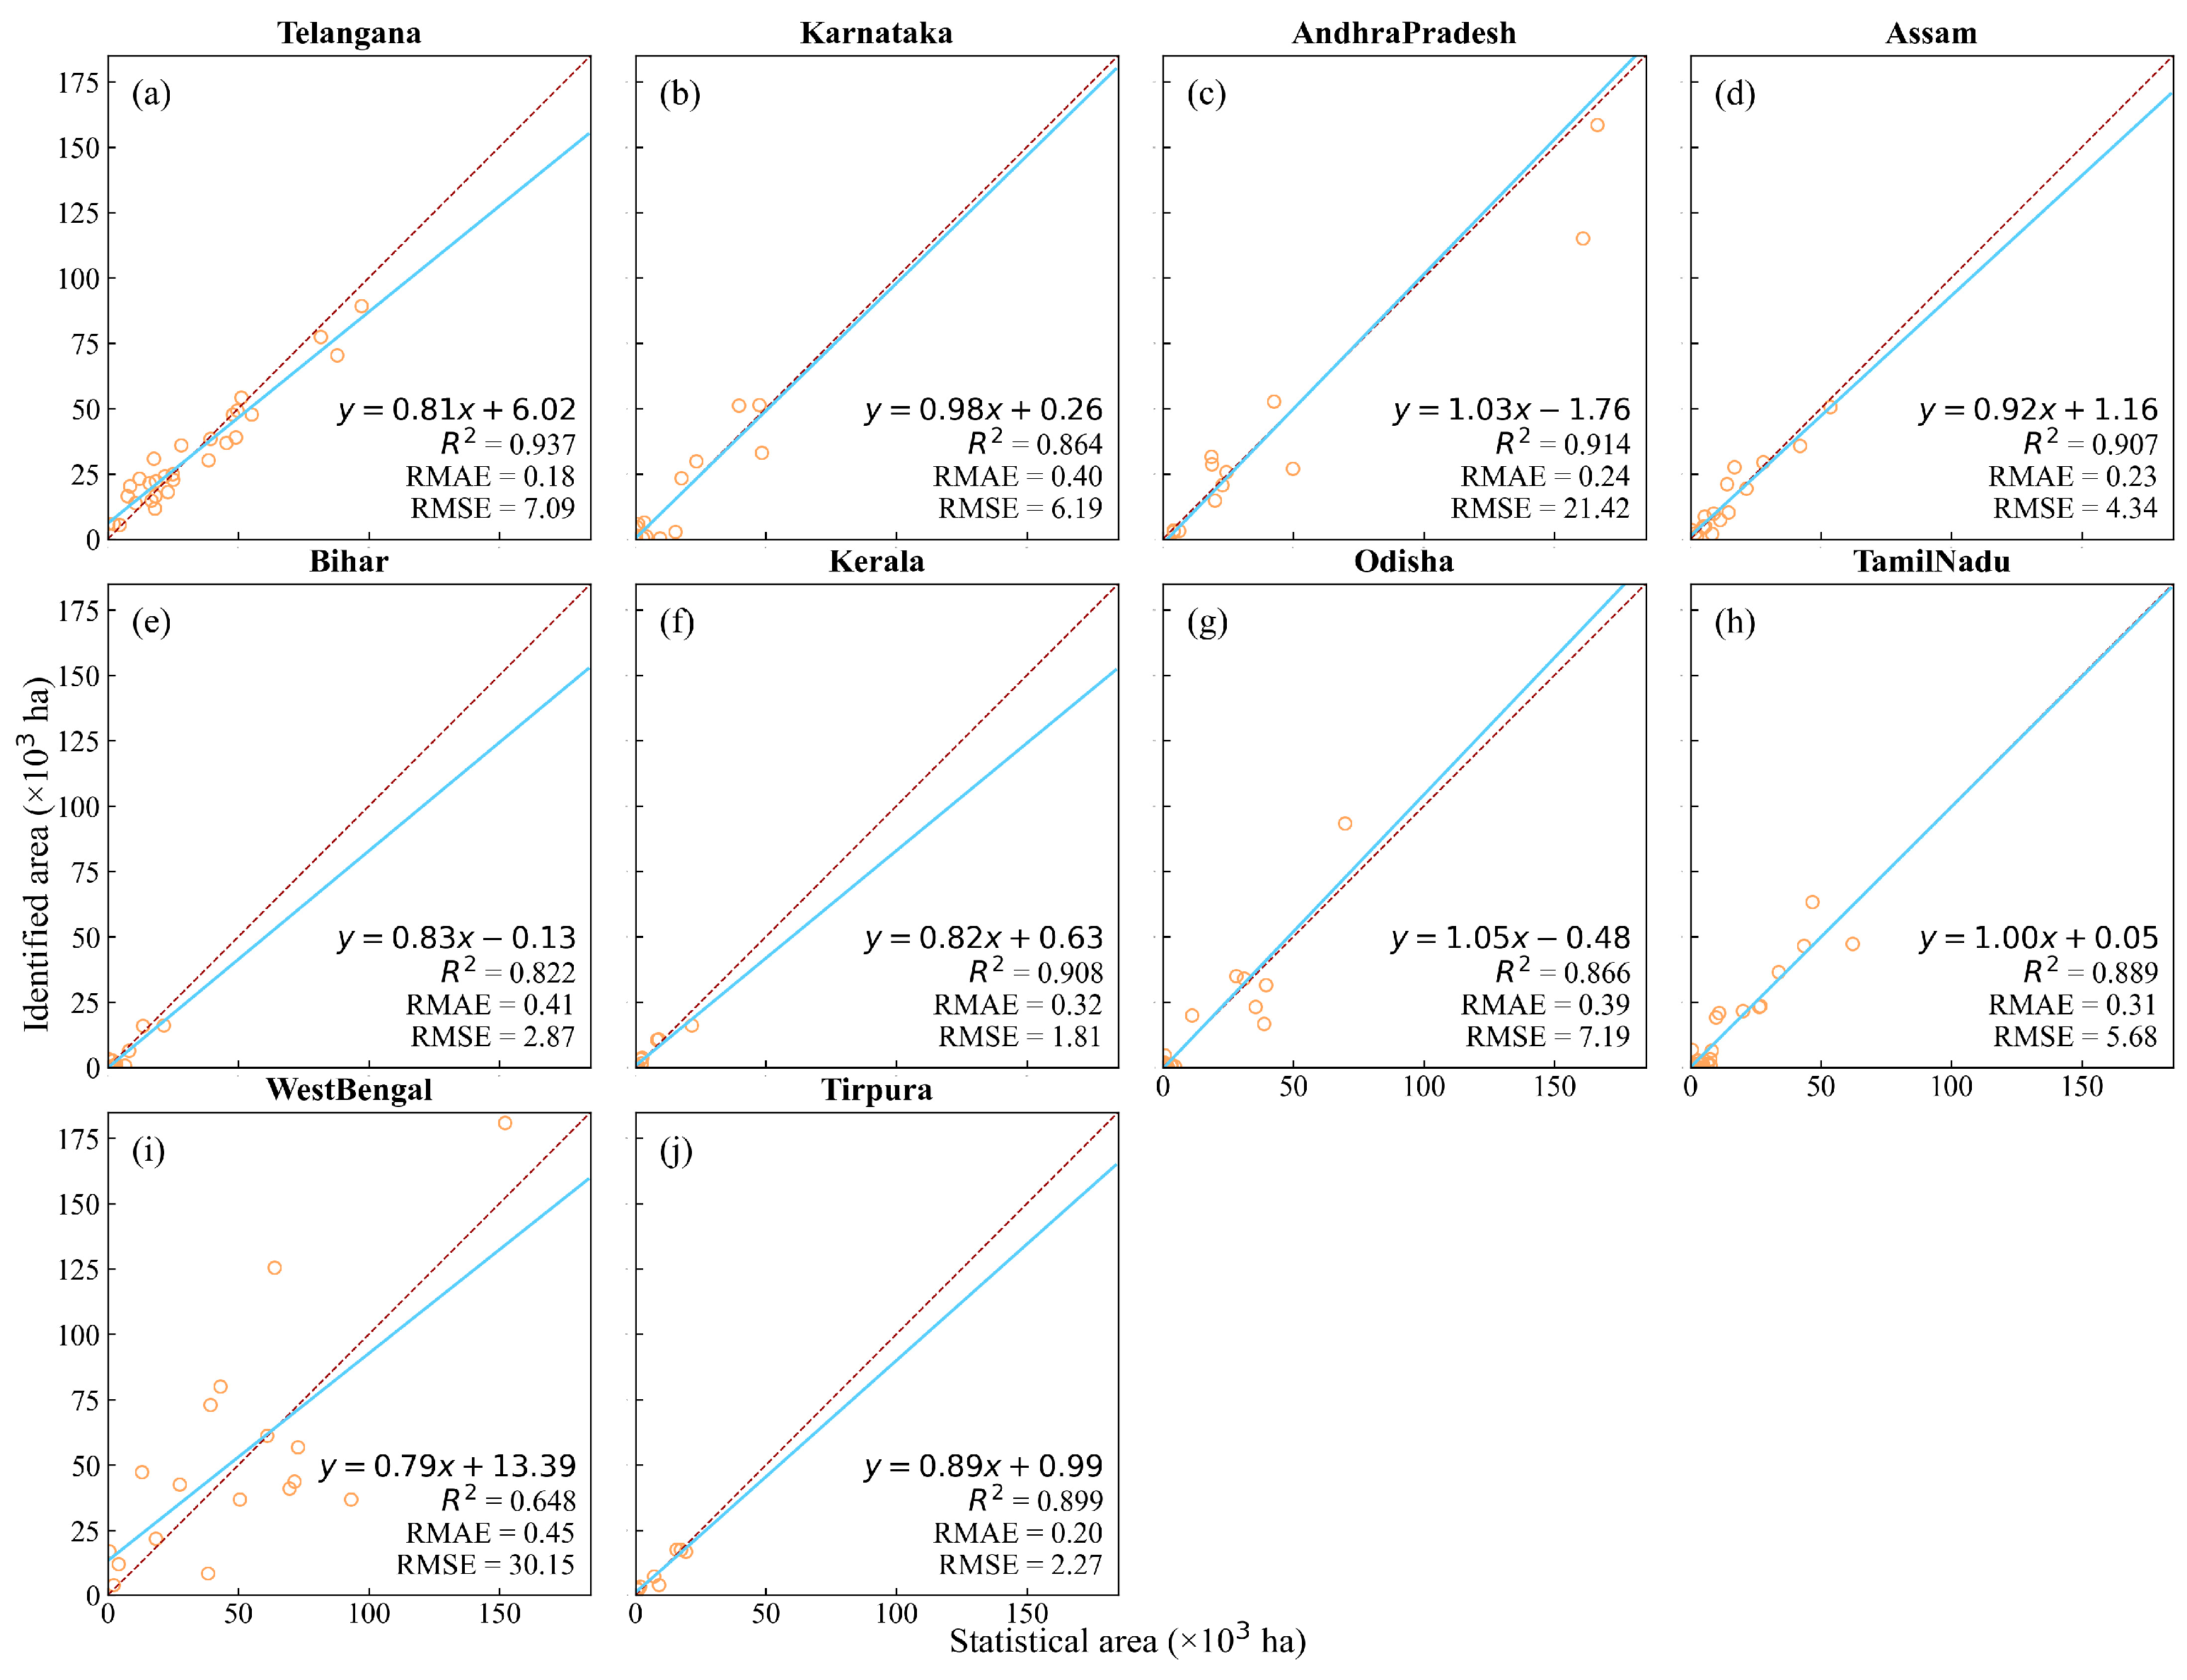
3.2. Identification Accuracy of Summer Rice

Summer rice is mainly cultivated in the eastern and southern parts of India, where the climatic conditions during the winter season are conducive to its growth. States like West Bengal, Odisha, Andhra Pradesh, and Tamil Nadu have significant summer rice cultivation (Figure 6, Figure A2, Figure A5). A total of 2214 field-level samples were collected across six major states known for extensive cultivation of summer rice, representing approximately 85% of the country’s summer rice area, as depicted in Table 2. The results showed that the OA ranged from 83.51% to 94.46%, with the UA ranging from 86.96% to 98.25% and PA ranging from 78.18% to 91.52% Rabi rice (Table 2). As the state with the largest area of Rabi rice cultivation in India, West Bengal (constituting over 30.37% of India’s total Rabi rice cultivation area) demonstrated excellent accuracy in the classification dataset. Specifically, the UA, PA, and OA achieved were 84.77%, 82.80%, and 86.16%, respectively. These indicated that our method in the summer rice region had a satisfactory performance.
We also assessed the identified area of summer rice at a district level based on statistical data. The identification and statistical areas showed a very strong correlation, with the regression lines for each state very close to the 1:1 line. The results showed R2 values ranging from 0.65 to 0.93, RMAE ranging from 0.18 to 0.45, and RMSE ranging from 1.81 to 30.15 (103 ha) (Figure 7). From the results, it can be seen that summer rice varieties performed better in terms of classification accuracy compared to winter rice varieties. For example, in Andhra Pradesh, where both winter and summer rice are cultivated simultaneously, the correlation coefficient, RMAE, and RMSE of winter rice were 0.77, 0.28, and 43.55, respectively (Figure 7), and those of summer rice were 0.91, 0.24, and 21.42, respectively (Figure 7). Meanwhile, the district-level validation performed poorly for areas with relatively small rice planting areas and dispersed planting regions, such as West Bengal, with a correlation coefficient and RMAE of 0.65 and 0.45, respectively.

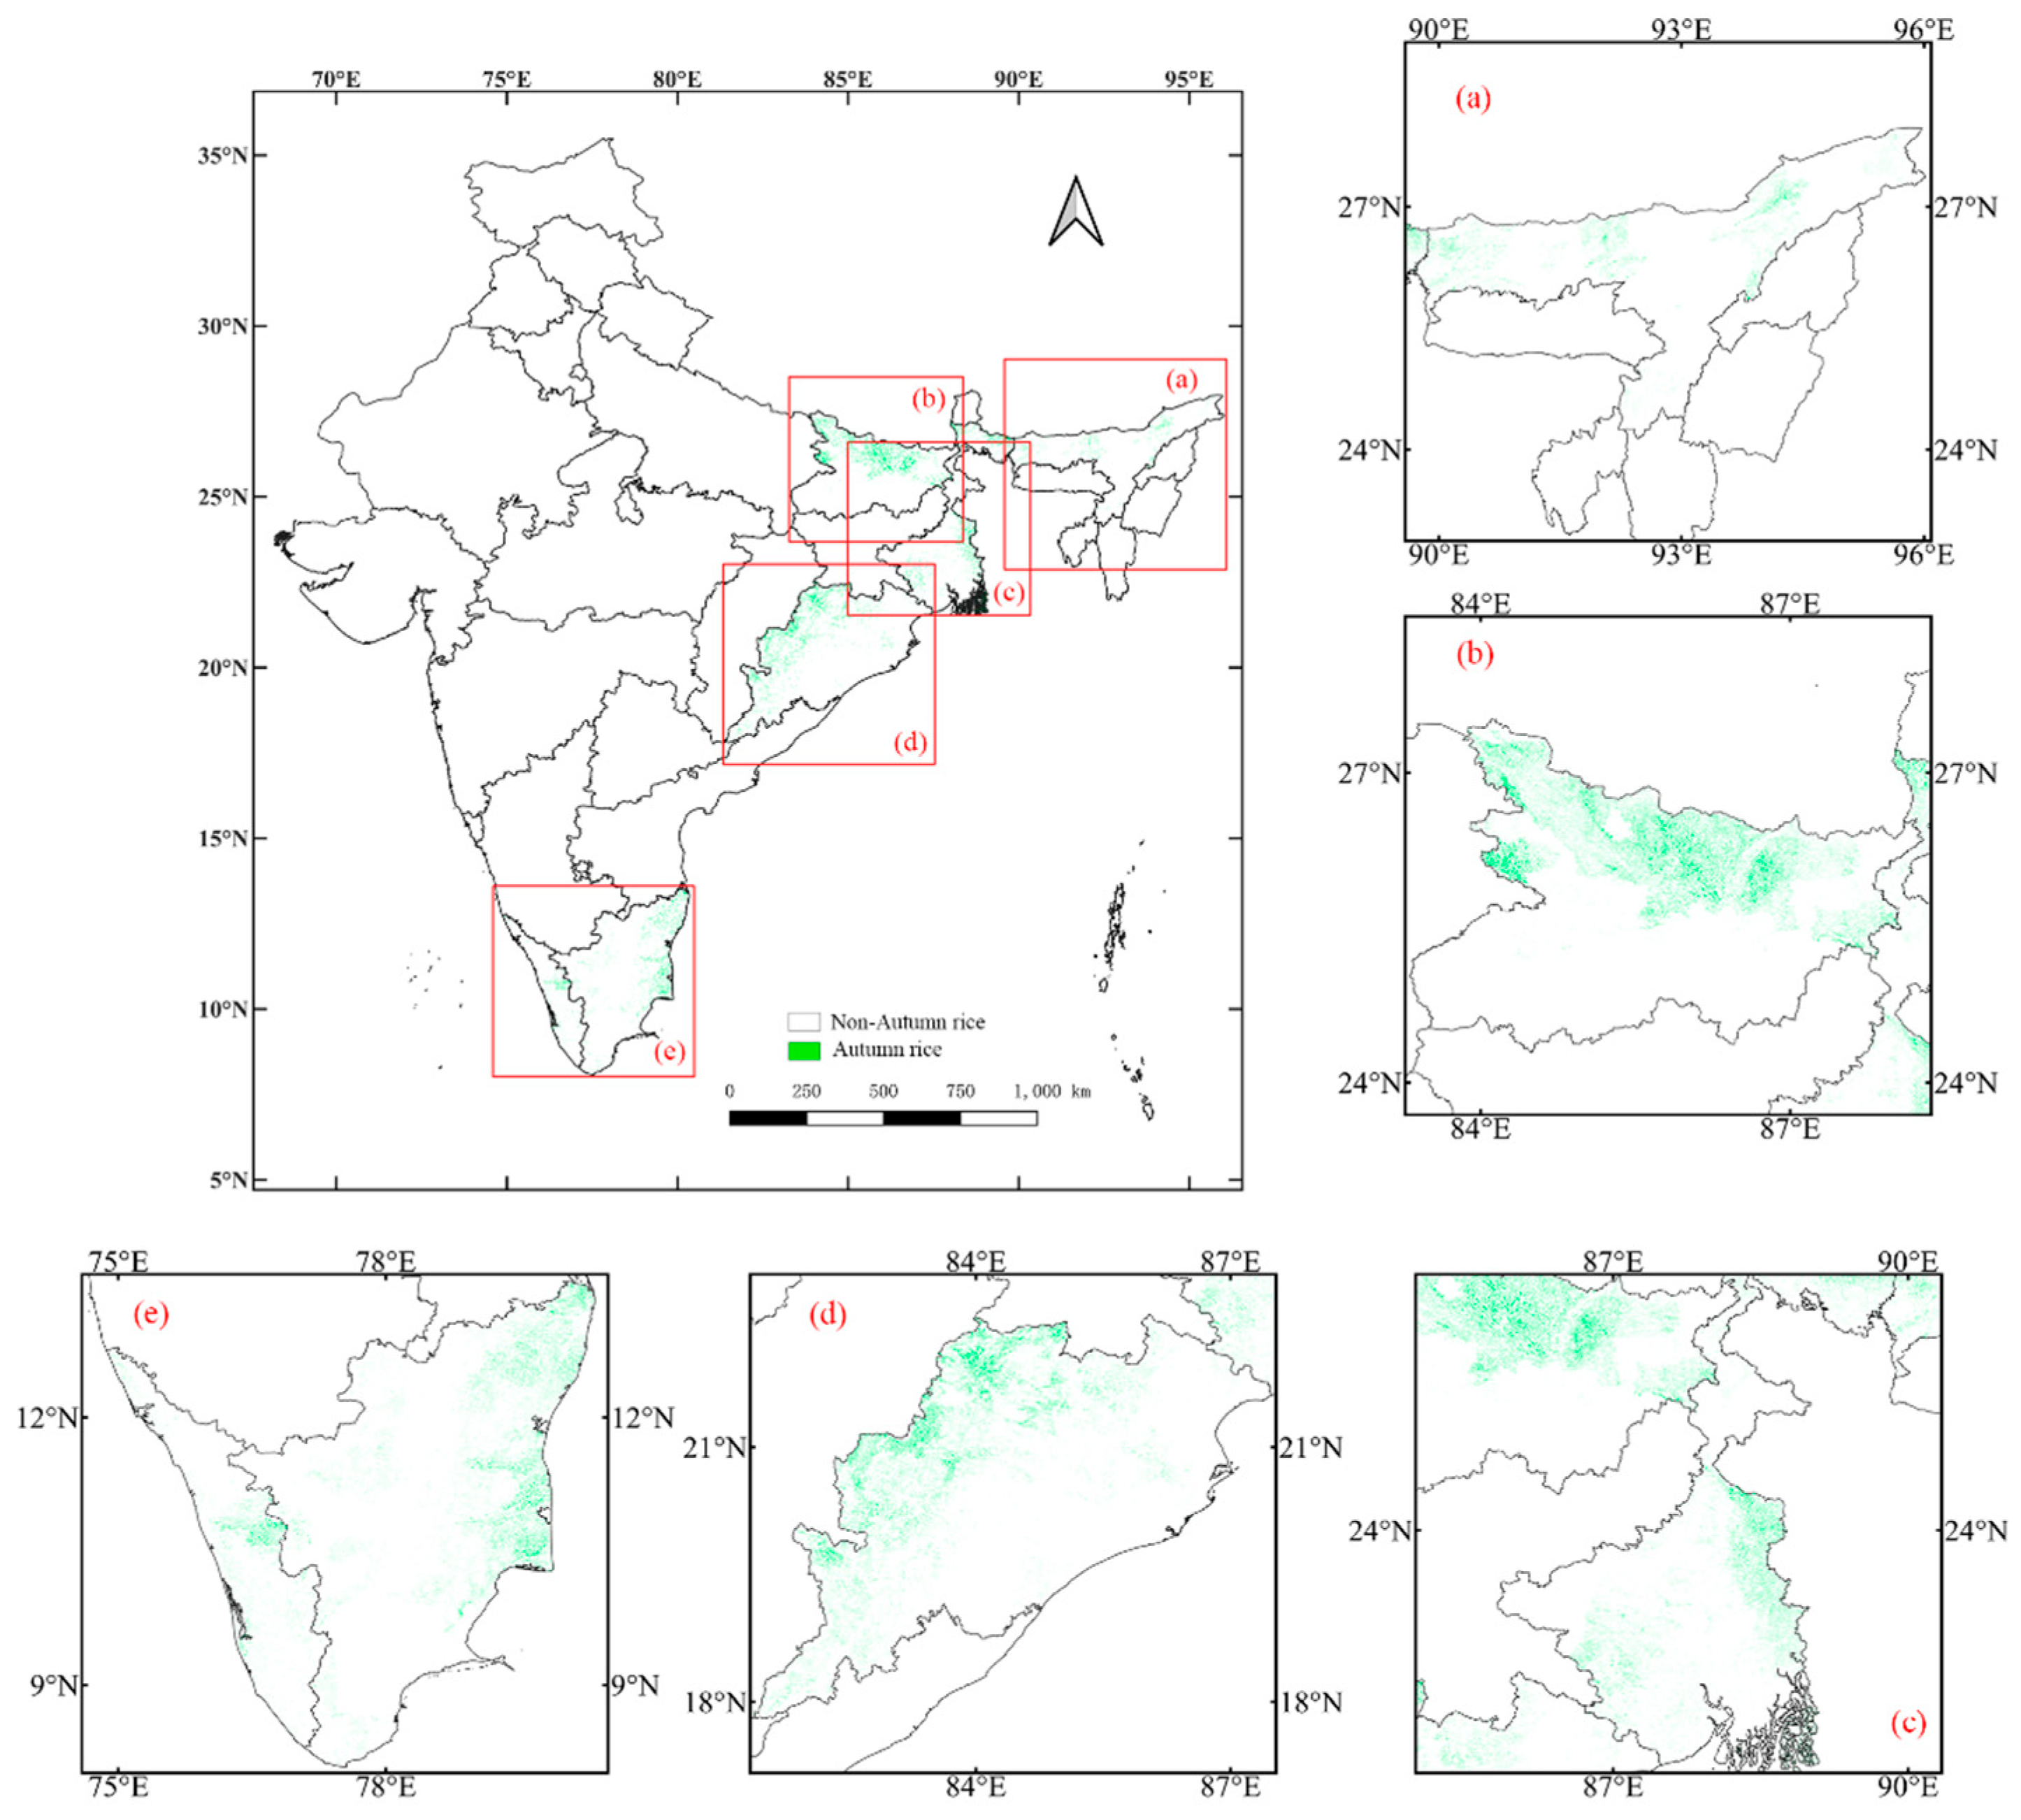
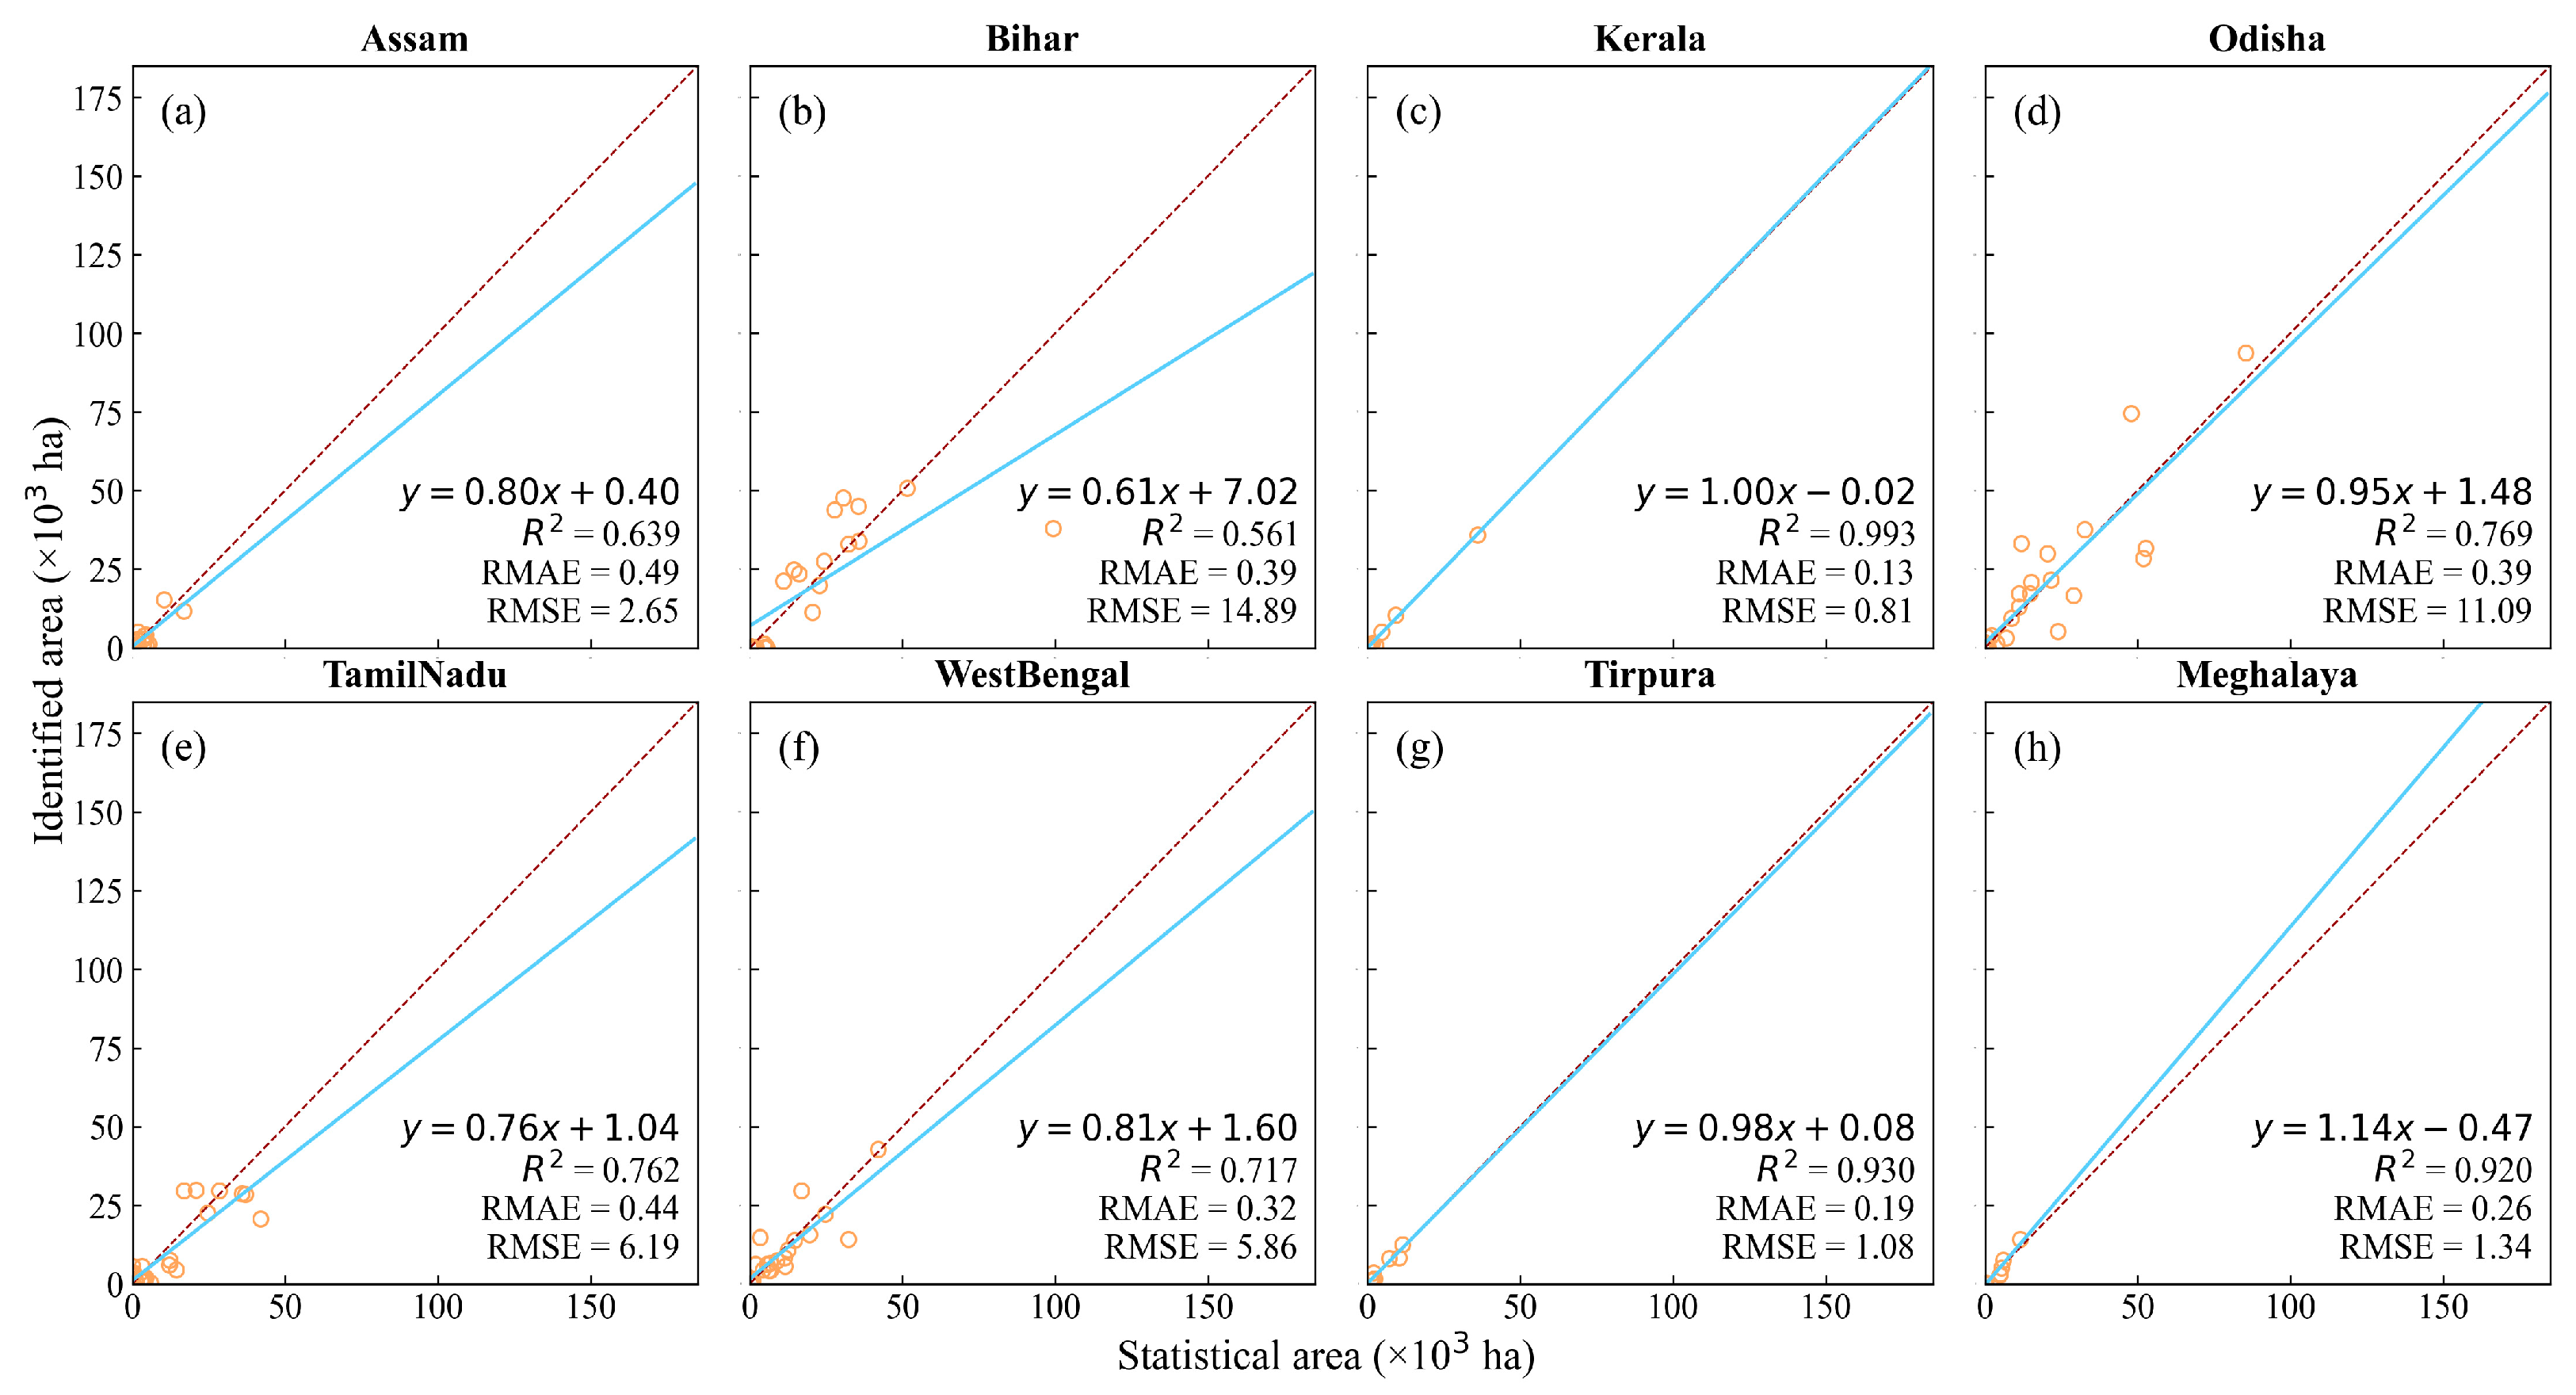
3.3. Identification Accuracy of Autumn Rice

Autumn rice is the least distributed type of rice in India, accounting for approximately 7% of the country’s rice production. In the eight states where autumn rice is grown (Figure 8, Figure A3, Figure A6), we utilized the 1650 samples extracted from Google Earth to assess the effectiveness of the proposed method. On average, the UA, PA, and OA were 73.08%, 82.81%, and 85.23% for the main autumn rice-producing regions, respectively (Table 2). The method showed the best performance in Bihar, where autumn rice cultivation is the most intensive, with UA, PA, and OA rates of 85.86%, 85.50%, and 85.66%, respectively (Table 2). In Odisha, the accuracy was the lowest compared to other states, with 71.30%, 71.77%, and 72.95% for UA, PA, and OA, respectively (Table 2).
For autumn rice in all states, the comparison of the identification results with district-level statistical data demonstrated good performance. The slopes ranged from 0.76 to 1.14, the R2 from 0.64 to 0.99, the RMSE from 0.81 to 14.89(103 ha), and the RMAE ranged from 0.13 to 0.49. (Figure 9). High accuracies were found in Tripura, Meghalaya, and Meghalaya in the northern region of India and Kerala in southern India, with the R2 ranging from 0.92 to 0.99, RMAE from 0.13 to 0.26, and RMSE from 0.81 to 1.34 (103 ha), which may be due to the more intensive autumn rice cultivation in these regions.

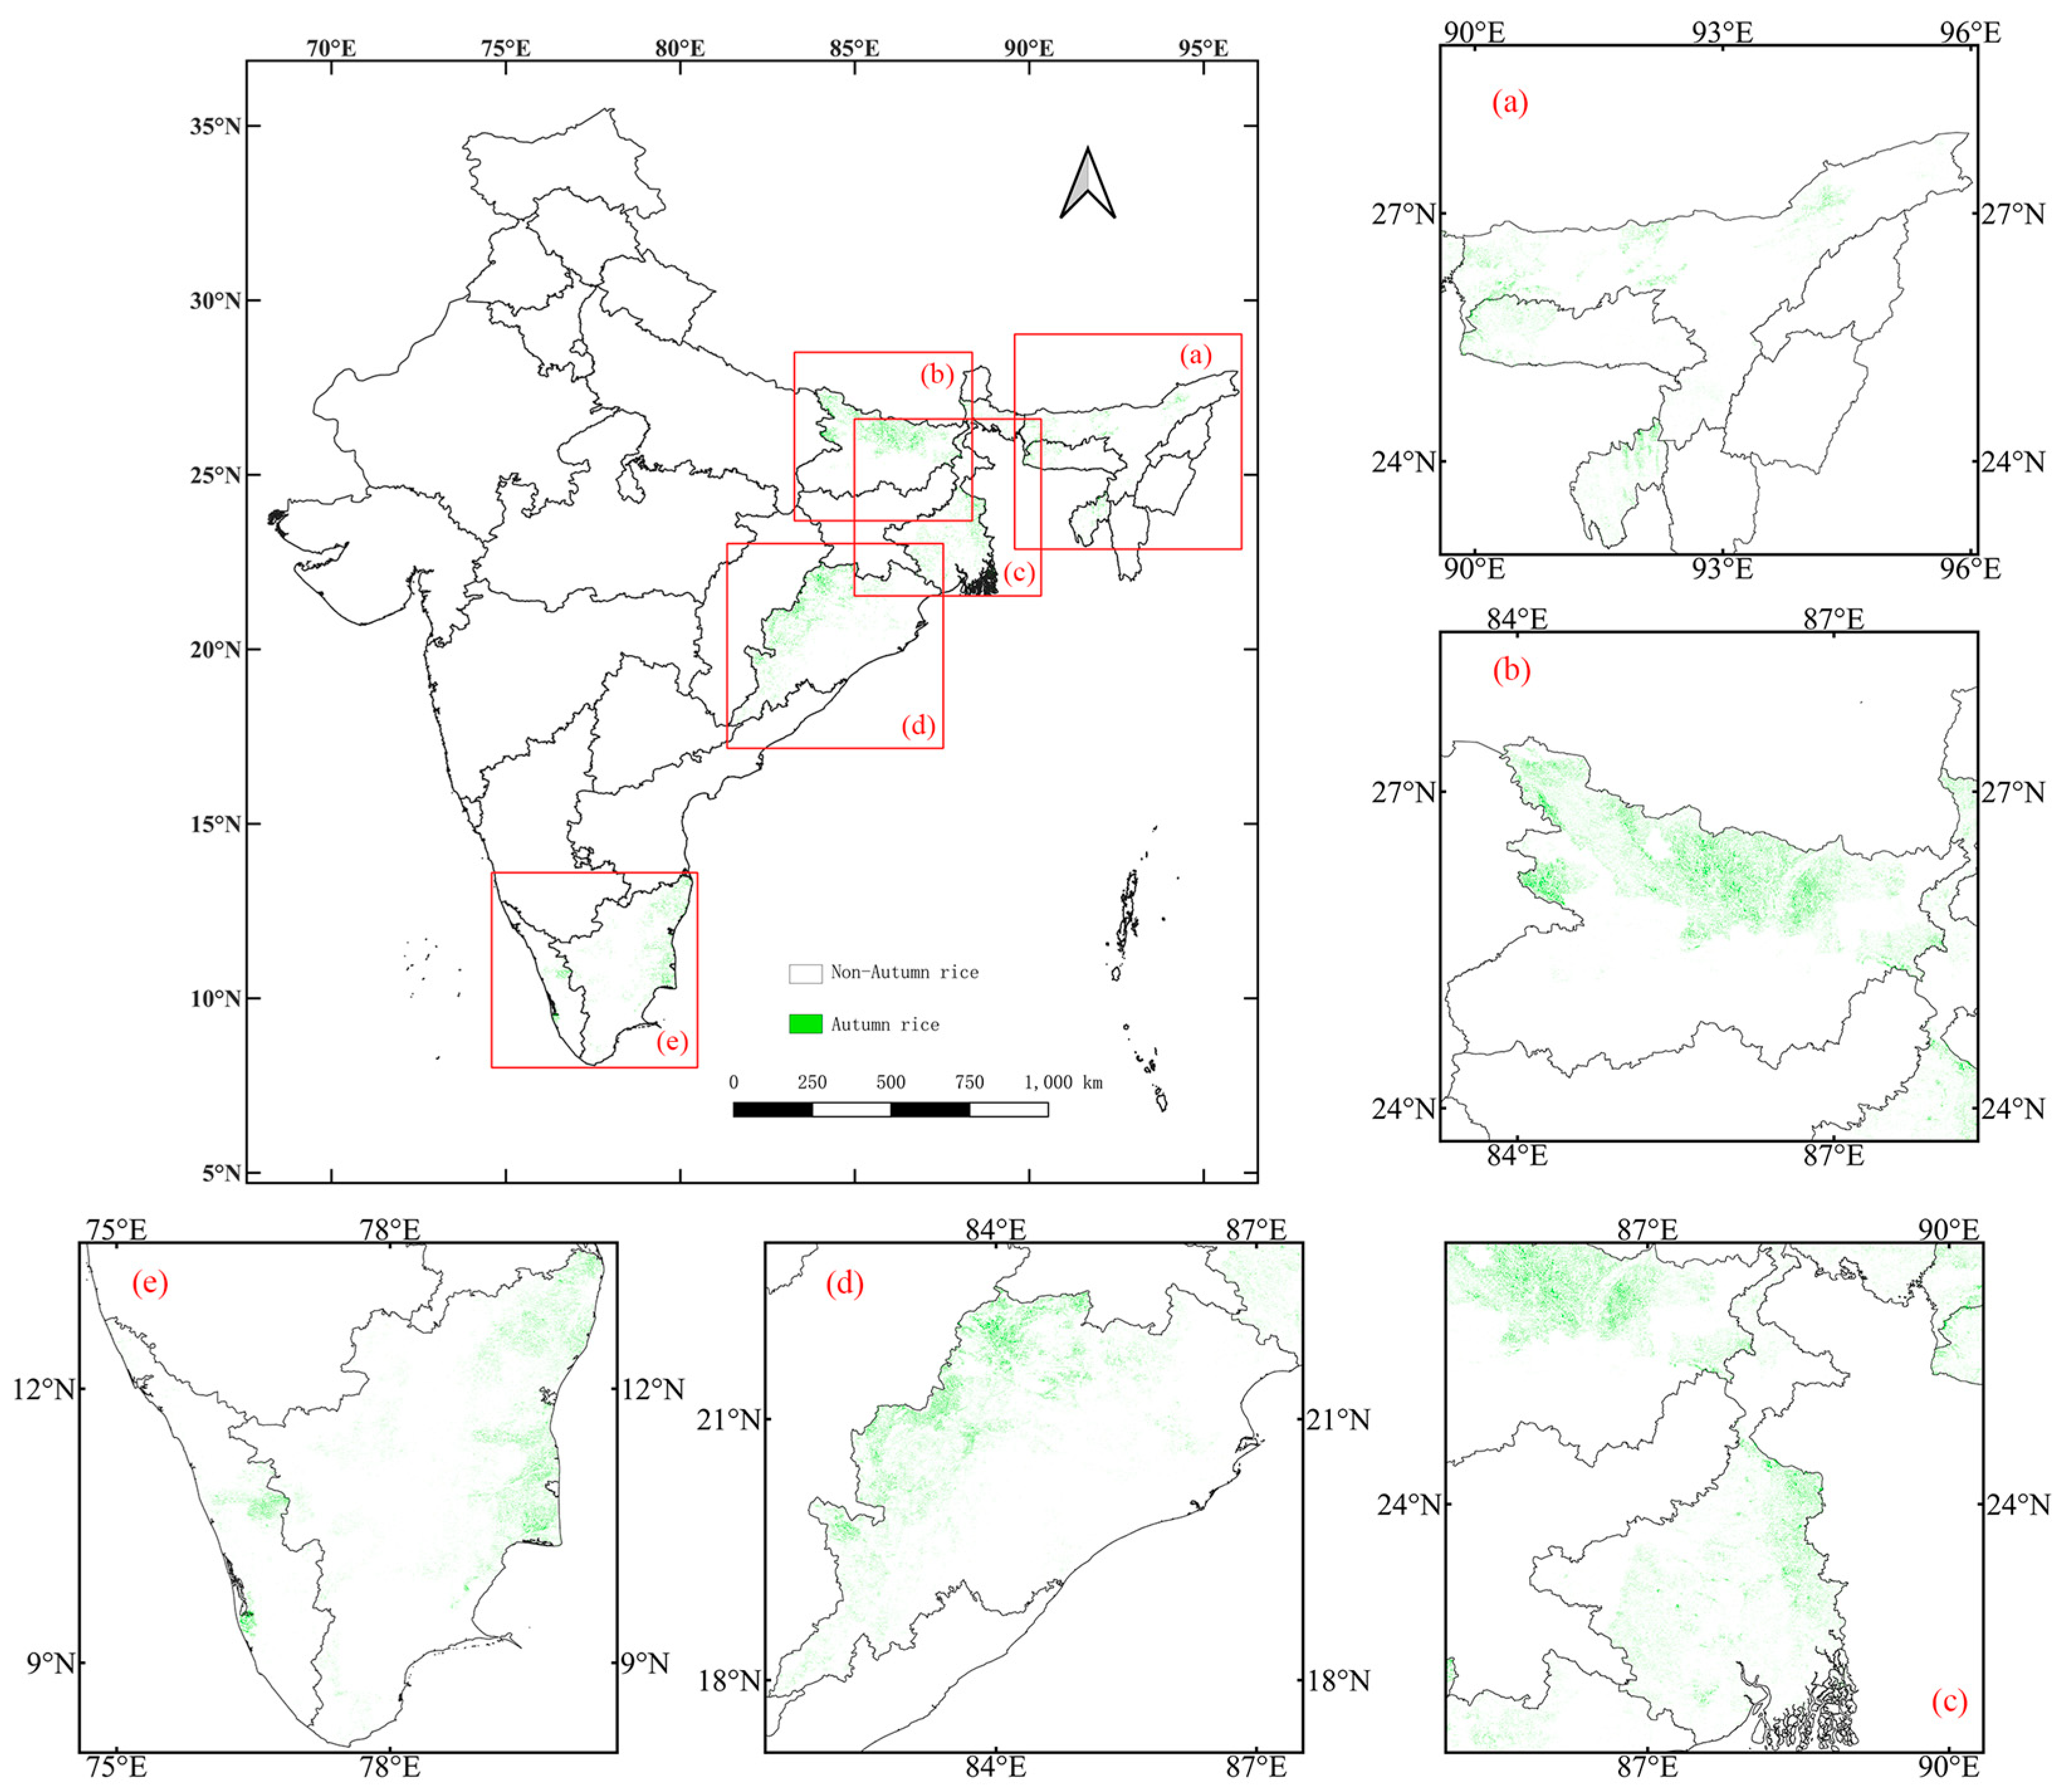
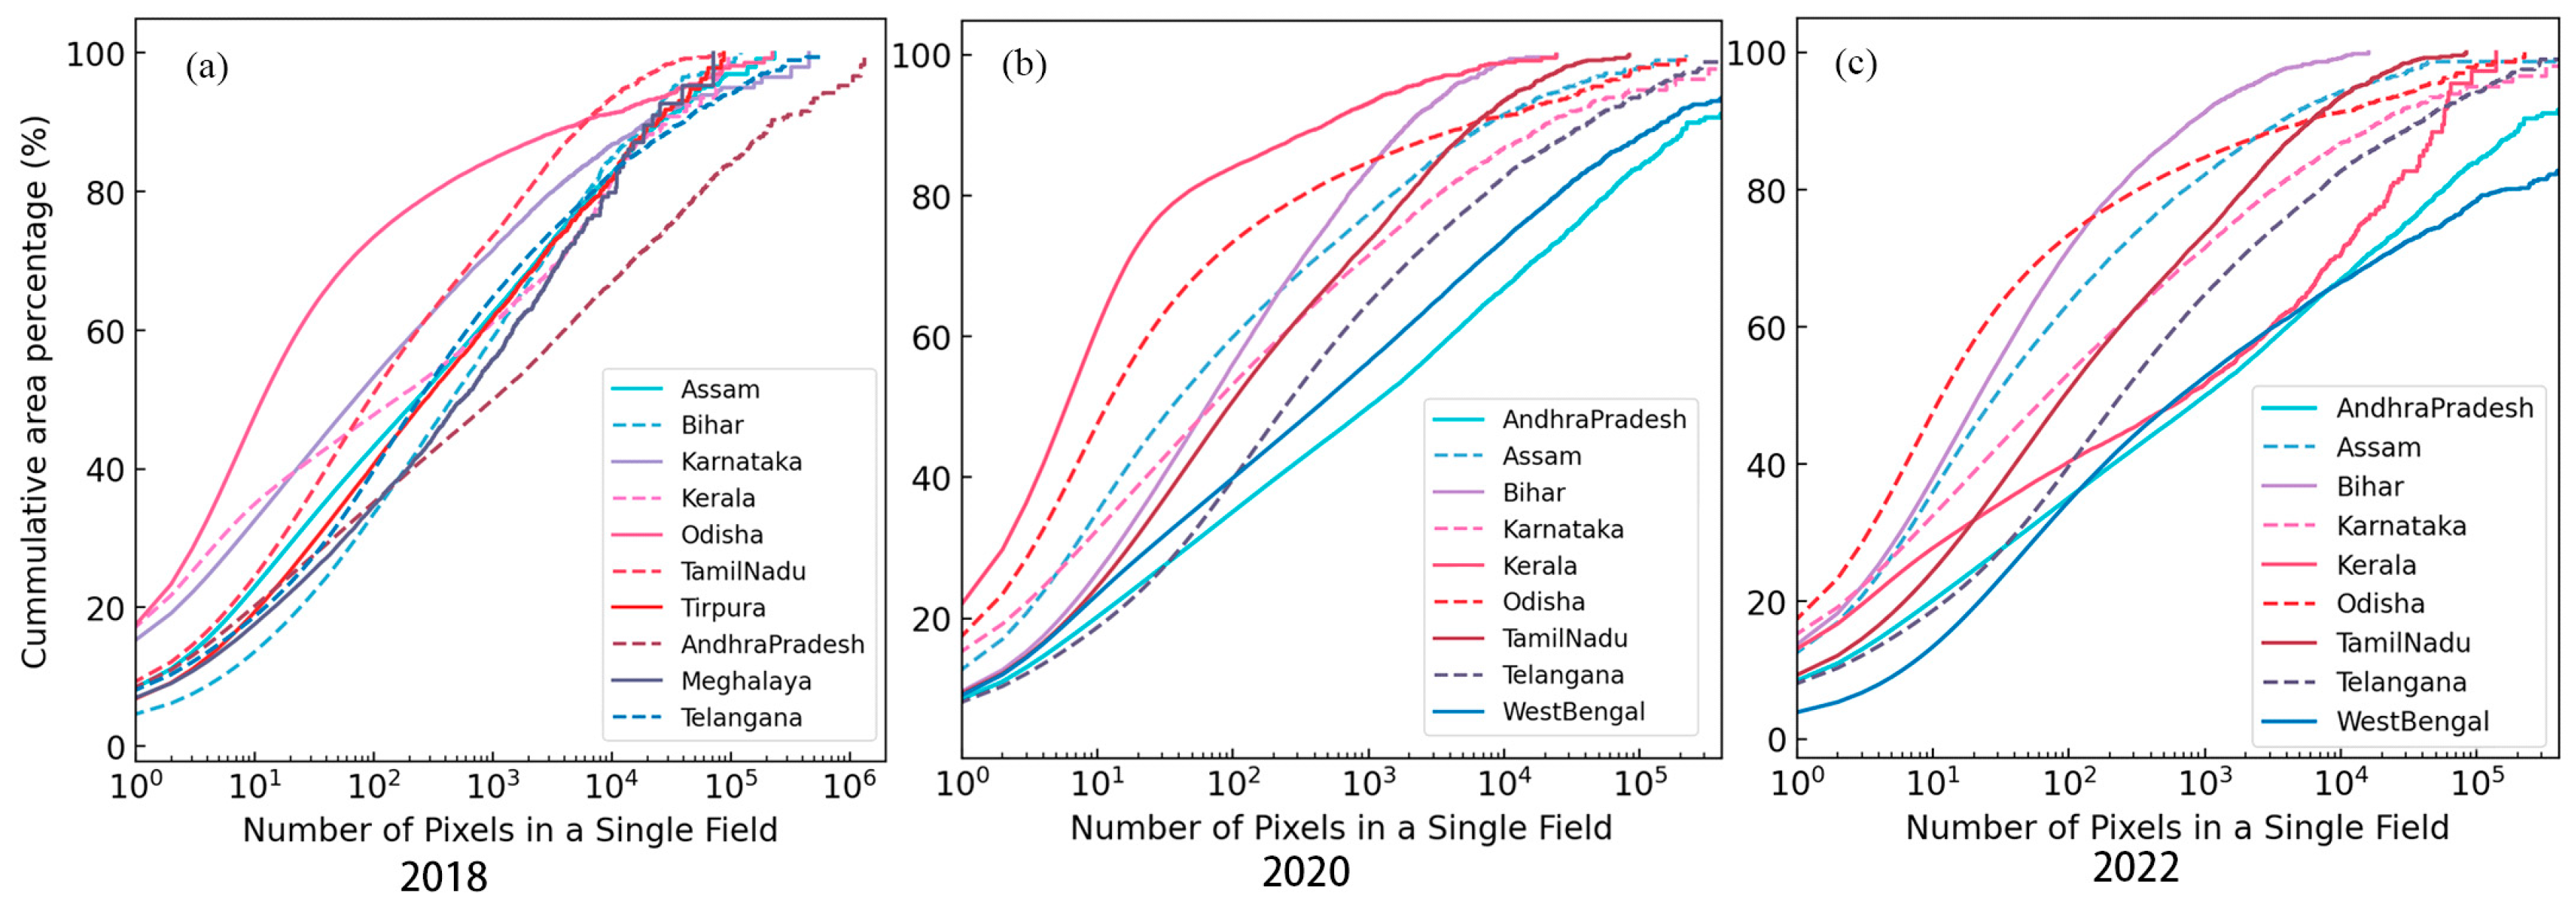
3.4. Spatial Patterns of Rice

The patch size distribution across states in India largely reflects the degree of fragmentation of rice fields. The analysis involved examining the spatial distribution of patch sizes using winter, autumn, and summer rice maps in 2018. For winter rice, in major producing states such as Punjab, West Bengal, Bihar, Uttar Pradesh, Odisha, Chhattisgarh, and Assam, large patches (defined as those exceeding 1000 pixels or approximately 90 hectares) constitute over 50% of the total area (Figure 10), and these states account for over 65% of the total rice cultivation area in the country. However, the unique smallholder farming practices in India have resulted in a relatively high degree of farmland fragmentation, resulting in a low proportion of large patches of summer and autumn rice, which are planted in a relatively small area (Figure 11 and Figure 12). Nevertheless, medium patches (defined as patches with pixels between 100 and 1000) and large patches also exceed 40% in most states cultivating summer and autumn rice.
For winter rice, the annual changes from 2018 to 2022 showed a decreasing trend in the proportion of small patches. For example, the share of large patches in the Jammu and Kashmir state increased from 50% in 2018 to 70% in 2022. Similarly, the share of large patches in the Punjab state also significantly increased between 2018 and 2022. This indicates that the proportion of small-sized farmland is gradually decreasing over time. This phenomenon indirectly reflects a reduction in farmland fragmentation in India, with land transitioning from previously small-scale, scattered plots to a more large-scale, consolidated, and intensive farming structures [48]. However, for summer and autumn rice, there has been no significant change in the proportion of small patches. This is because summer and autumn rice are not the primary rice varieties grown in India, and therefore, their planting patterns have remained relatively stable and unaffected by the aforementioned factors. These seasonal rice varieties are likely still cultivated using the traditional way, with farmers tending to use scattered small plots of land for these secondary crops [49].
We utilized the proportion of small patches (defined as patches containing no more than 10 pixels, roughly 0.9 ha) to categorize the winter rice map into three distinct classes (Figure 13). Category I included states with small patches of less than 20%, including Punjab, Uttar Pradesh, Bihar, West Bengal, Odisha, Chhattisgarh, Haryana, Assam, Madhya Pradesh, Manipur, Tamil Nadu, Himachal Pradesh, Jammu and Kashmir, Andhra Pradesh, and Jharkhand. Most of these states are major rice-producing states. Category II encompasses states where small patches ranged from 20% to 40% in proportion, including Gujarat, Telangana, Karnataka, Kerala, and Maharashtra. Most of these states are located on the Deccan Plateau, and much of the southern peninsula is a fertile rice-growing area. However, the Deccan Plateau is mountainous and rugged, resulting in a medium proportion of small patches. Category III small includes states with over 40% small patches, including Meghalaya, Tripura, and Rajasthan.
Among these states, Rajasthan stands out with the largest percentage of small patches, amounting to 44.10%. This is due to the staple crops in the state being Bajra and Green Gram, which account for 33.23% and 19.32% of the farmland area, respectively, while rice paddies constitute only about 0.16% of the total agricultural land area in that state. At the same time, most of the state is a desert area, and the relative scarcity of water resources is also a reason why rice cultivation cannot be concentrated on a large scale. Whereas most parts of Meghalaya and Tripura states are rugged and covered by mountains and hills, and rice cultivation is scattered.

4. Discussion

As the world’s largest producer of rice by planted area, India plays a crucial role in regulating the global rice supply. Therefore, accurate identification of the location of India’s rice fields is critical to the global agricultural economy and food supply [50]. However, currently, only a few studies have tried to map rice in India beyond the scale of a state. For example, Singha et al. [6] produced rice maps (10 m) for six states in northeast India bordering Bangladesh in 2017. This study, to our knowledge, is the first to generate a 10 m distribution map of paddy rice over all of India. This distribution map will be very helpful for estimating the production of paddy rice and methane emissions.
The cropping pattern in India is mixed farming with relatively small rice fields, and a smallholder economy intermingled with natural vegetation, seasonal water bodies, and settlements [35]. Such complex and diverse rice cropping systems and growth characteristics of rice across a vast geographical area increase the difficulty of producing highly accurate rice distribution maps in India with medium spatial resolution satellite data. Here, we used the SPRI method without sample dependency to identify the distribution of rice in 23 states of India in 2018, 2020, and 2022 at a 10 m spatial resolution. Our dataset showed a good accuracy between identified and statistical rice areas. Based on visual interpretation samples and statistical data from 2018, the results indicated that this method accurately identifies rice cultivation areas in 23 states across India. Our method performs well even without using training samples compared to machine learning and phenology methods, which is an important advantage for rice identification across India, given the lack of available survey samples. Our rice distribution map of India, which has high spatial resolution, facilitates access to more information on farmland, which is important for improving agricultural productivity, food security, and sustainable agricultural development.
Although the SPRI method was effective in accurately identifying rice harvesting areas across regional and national scales, some uncertainties persist. First, the precision of identification may be influenced by the SAR data quality. Rice mapping significantly relies on the distinctive spectral attributes observed during the flooding season. However, SAR data quality issues can amplify differences within classifications of rice fields while simultaneously diminishing the distinctions between rice fields and other crops [3]. Second, terrain effects have a significant impact on the backscattered signals of SAR. Due to the complexities of terrain and different land cover types, changes in radar signal incidence angles can cause fluctuations in backscatter values, thus affecting the accuracy of rice field identification. Despite the use of sophisticated radiometric terrain correction methods, it remains challenging to completely eliminate these effects. Furthermore, in states where rice is not a major production area, rice plots are small and have complex mixed cropping. Even with satellite data at a spatial resolution of 10 m, mixed pixels persisted, posing challenges in distinguishing rice from other land cover categories. These mixed pixels make rice identification difficult [51,52].
In addition, the SPRI method also has some uncertainties in threshold determination. The threshold for SPRI was determined empirically in the study by Xu et al. [3]. Within the five sites of their study, the differences in SPRI values between rice and non-rice pixels were large, with most of them concentrated at the ends of the value range. Therefore, the conclusion of their study was that the threshold value could be chosen arbitrarily between 0.5 and 0.7 with little effect on mapping accuracy. However, our study showed that SPRI values are not always concentrated at the ends of the value domain when the study area is large (all over India), and complex and fragmented land cover types are involved. Therefore, the use of a fixed empirical threshold does not meet the needs of rice mapping in India. Recent studies have also highlighted that empirically based threshold selection is insufficient for large-scale rice mapping [53]. To address the issue of threshold determination, we used the statistical area to determine the threshold. This approach, which has been used in several previous studies, solved the challenge of threshold determination and ensured that the total area of the product did not significantly deviate from the statistical area [22,41,42,43,44,45,46,47].
In the future, satellite data with higher spatial and temporal resolution may help to mitigate the problem of mixed pixels and increase the efficiency of capturing rice growth characteristics. At the same time, we hope to improve the methodology to finalize a continuous multi-year map of rice in India to provide a more reliable database for estimating rice production, paddy methane emissions, and other related activities.

5. Conclusions

India stands as one of the world’s largest rice-producing nations, with its rice cultivation area comprising almost 20% of the global total, encompassing approximately 45 million hectares. As we know, no large-scale rice distribution map with a 10 m spatial resolution has been published for India. We employed a sample-independent identification method based on Sentinel-1 satellite SAR data and mapped the distribution of rice in India for the years 2018, 2020, and 2022 using SPRI. The method performed well in all 23 states of India, with an overall accuracy of 84.44%. The area of the map was generally consistent with the area of agricultural statistics. More importantly, sampling points were not required for rice identification using the SPRI method. Simply adjusting the rice W-line and V-line for different regions allowed for broader-scale rice mapping. Overall, this study produced a 10 m spatial resolution map of rice in India, which is useful for future work such as methane emissions, predicting rice yields, and assessing food security.

Author Contributions

W.Y., X.C., X.Z., Q.P., and R.S. contributed to the conception and design of the study. R.S., X.C., Y.F., and B.P. performed the investigation. W.Y. provided theoretical guidance. X.C. conducted the statistical analysis and wrote the first draft of the manuscript. W.Y. reviewed and edited the manuscript. All authors have read and agreed to the published version of the manuscript.

Funding

This study was supported by the Open Research Program of the International Research Center of Big Data for Sustainable Development Goals (Grant No. CBAS2023ORP02).

Data Availability Statement

The data presented in this study are available in the article.

Acknowledgments

The authors would like to thank the reviewers and editors for their constructive comments.

Conflicts of Interest

The funders had no role in the design of the study; in the collection, analyses, or interpretation of data; in the writing of the manuscript, or in the decision to publish the results.

Appendix A

Figure A1. Winter rice identification map of India in 2020. Panels (af) on the right and bottom are enlarged maps of the winter rice states.
Remotesensing 16 03180 g0a1
Figure A2. Summer rice identification map of India in 2020. Panels (ae) on the right and bottom are enlarged maps of the summer rice states.
Remotesensing 16 03180 g0a2
Figure A3. Autumn rice identification map of India in 2020. Panels (ae) on the right and bottom are enlarged maps of the autumn rice states.
Remotesensing 16 03180 g0a3
Figure A4. Winter rice identification map of India in 2022. Panels (af) on the right and bottom are enlarged maps of the winter rice states.
Remotesensing 16 03180 g0a4
Figure A5. Summer rice identification map of India in 2022. Panels (ae) on the right and bottom are enlarged maps of the summer rice states.
Remotesensing 16 03180 g0a5
Figure A6. Autumn rice identification map of India in 2022. Panels (ae) on the right and bottom are enlarged maps of the autumn rice states.
Remotesensing 16 03180 g0a6

References

  1. FAO. World Food and Agriculture—Statistical Yearbook 2019; FAO: Rome, Italy, 2019; ISBN 978-92-5-131242-2. [Google Scholar]
  2. Rudiyanto; Minasny, B.; Shah, R.M.; Che Soh, N.; Arif, C.; Indra Setiawan, B. Automated Near-Real-Time Mapping and Monitoring of Rice Extent, Cropping Patterns, and Growth Stages in Southeast Asia Using Sentinel-1 Time Series on a Google Earth Engine Platform. Remote Sens. 2019, 11, 1666. [Google Scholar] [CrossRef]
  3. Xu, S.; Zhu, X.; Chen, J.; Zhu, X.; Duan, M.; Qiu, B.; Wan, L.; Tan, X.; Xu, Y.N.; Cao, R. A Robust Index to Extract Paddy Fields in Cloudy Regions from SAR Time Series. Remote Sens. Environ. 2023, 285, 113374. [Google Scholar] [CrossRef]
  4. Bandumula, N. Rice Production in Asia: Key to Global Food Security. Proc. Natl. Acad. Sci. India Sect. B Biol. Sci. 2018, 88, 1323–1328. [Google Scholar] [CrossRef]
  5. Bouman, B.A.M.; Humphreys, E.; Tuong, T.P.; Barker, R. Rice and Water. In Advances in Agronomy; Sparks, D.L., Ed.; Academic Press: Cambridge, MA, USA, 2007; Volume 92, pp. 187–237. [Google Scholar]
  6. Singha, M.; Dong, J.; Zhang, G.; Xiao, X. High Resolution Paddy Rice Maps in Cloud-Prone Bangladesh and Northeast India Using Sentinel-1 Data. Sci. Data 2019, 6, 26. [Google Scholar] [CrossRef]
  7. Chen, H.; Zhu, G.; Zhang, K.; Bi, J.; Jia, X.; Ding, B.; Zhang, Y.; Shang, S.; Zhao, N.; Qin, W. Evaluation of Evapotranspiration Models Using Different LAI and Meteorological Forcing Data from 1982 to 2017. Remote Sens. 2020, 12, 2473. [Google Scholar] [CrossRef]
  8. Yadav, R.; Subbarao, A. Atlas of Cropping Systems in India. In Atlas of Cropping Systems in India; Project Directorate for Cropping Systems Research: Meerut, India, 2001. [Google Scholar]
  9. Xiao, X.; Boles, S.; Frolking, S.; Li, C.; Babu, J.Y.; Salas, W.; Moore, B. Mapping Paddy Rice Agriculture in South and Southeast Asia Using Multi-Temporal MODIS Images. Remote Sens. Environ. 2006, 100, 95–113. [Google Scholar] [CrossRef]
  10. Gumma, M.; Nelson, A.; Thenkabail, P.; Singh, A. Mapping Rice Areas of South Asia Using MODIS Multitemporal Data. J. Appl. Remote Sens. 2011, 5, 053547. [Google Scholar] [CrossRef]
  11. Bridhikitti, A.; Overcamp, T.J. Estimation of Southeast Asian Rice Paddy Areas with Different Ecosystems from Moderate-Resolution Satellite Imagery. Agric. Ecosyst. Environ. 2012, 146, 113–120. [Google Scholar] [CrossRef]
  12. Gumma, M.K.; Thenkabail, P.S.; Panjala, P.; Teluguntla, P.; Yamano, T.; Mohammed, I. Multiple Agricultural Cropland Products of South Asia Developed Using Landsat-8 30 m and MODIS 250 m Data Using Machine Learning on the Google Earth Engine (GEE) Cloud and Spectral Matching Techniques (SMTs) in Support of Food and Water Security. GISci. Remote Sens. 2022, 59, 1048–1077. [Google Scholar] [CrossRef]
  13. Wang, J.; Huang, J.; Zhang, K.; Li, X.; She, B.; Wei, C.; Gao, J.; Song, X. Rice Fields Mapping in Fragmented Area Using Multi-Temporal HJ-1A/B CCD Images. Remote Sens. 2015, 7, 3467–3488. [Google Scholar] [CrossRef]
  14. Clauss, K.; Yan, H.; Kuenzer, C. Mapping Paddy Rice in China in 2002, 2005, 2010 and 2014 with MODIS Time Series. Remote Sens. 2016, 8, 434. [Google Scholar] [CrossRef]
  15. Dong, J.; Xiao, X.; Menarguez, M.A.; Zhang, G.; Qin, Y.; Thau, D.; Biradar, C.; Moore, B. Mapping Paddy Rice Planting Area in Northeastern Asia with Landsat 8 Images, Phenology-Based Algorithm and Google Earth Engine. Remote Sens. Environ. 2016, 185, 142–154. [Google Scholar] [CrossRef] [PubMed]
  16. Cao, D.; Feng, J.; Bai, L.; Xun, L.; Jing, H.; Sun, J.; Zhang, J. Delineating the Rice Crop Activities in Northeast China through Regional Parametric Synthesis Using Satellite Remote Sensing Time-Series Data from 2000 to 2015. J. Integr. Agric. 2021, 20, 424–437. [Google Scholar] [CrossRef]
  17. Dong, J.; Xiao, X. Evolution of Regional to Global Paddy Rice Mapping Methods: A Review. ISPRS J. Photogramm. Remote Sens. 2016, 119, 214–227. [Google Scholar] [CrossRef]
  18. Motohka, T.; Nasahara, K.N.; Miyata, A.; Mano, M.; Tsuchida, S. Evaluation of Optical Satellite Remote Sensing for Rice Paddy Phenology in Monsoon Asia Using a Continuous in Situ Dataset. Int. J. Remote Sens. 2009, 30, 4343–4357. [Google Scholar] [CrossRef]
  19. Kuenzer, C.; Knauer, K. Remote Sensing of Rice Crop Areas. Int. J. Remote Sens. 2013, 34, 2101–2139. [Google Scholar] [CrossRef]
  20. Chen, J.; Han, Y.; Zhang, J. Mapping Rice Crop Fields Using C Band Polarimetric SAR Data. In Proceedings of the 2014 the Third International Conference on Agro-Geoinformatics, Beijing, China, 11–14 August 2014; pp. 1–4. [Google Scholar]
  21. Clauss, K.; Ottinger, M.; Kuenzer, C. Mapping Rice Areas with Sentinel-1 Time Series and Superpixel Segmentation. Int. J. Remote Sens. 2018, 39, 1399–1420. [Google Scholar] [CrossRef]
  22. Pan, B.; Zheng, Y.; Shen, R.; Ye, T.; Zhao, W.; Dong, J.; Ma, H.; Yuan, W. High Resolution Distribution Dataset of Double-Season Paddy Rice in China. Remote Sens. 2021, 13, 4609. [Google Scholar] [CrossRef]
  23. Canisius, F.; Shang, J.; Liu, J.; Huang, X.; Ma, B.; Jiao, X.; Geng, X.; Kovacs, J.M.; Walters, D. Tracking Crop Phenological Development Using Multi-Temporal Polarimetric Radarsat-2 Data. Remote Sens. Environ. 2018, 210, 508–518. [Google Scholar] [CrossRef]
  24. Li, H.; Fu, D.; Huang, C.; Su, F.; Liu, Q.; Liu, G.; Wu, S. An Approach to High-Resolution Rice Paddy Mapping Using Time-Series Sentinel-1 SAR Data in the Mun River Basin, Thailand. Remote Sens. 2020, 12, 3959. [Google Scholar] [CrossRef]
  25. Ramadhani, F.; Pullanagari, R.; Kereszturi, G.; Procter, J. Automatic Mapping of Rice Growth Stages Using the Integration of SENTINEL-2, MOD13Q1, and SENTINEL-1. Remote Sens. 2020, 12, 3613. [Google Scholar] [CrossRef]
  26. Küçük, Ç.; Taşkın, G.; Erten, E. Paddy-Rice Phenology Classification Based on Machine-Learning Methods Using Multitemporal Co-Polar X-Band SAR Images. IEEE J. Sel. Top. Appl. Earth Obs. Remote Sens. 2016, 9, 2509–2519. [Google Scholar] [CrossRef]
  27. Bazzi, H.; Baghdadi, N.; El Hajj, M.; Zribi, M.; Minh, D.H.T.; Ndikumana, E.; Courault, D.; Belhouchette, H. Mapping Paddy Rice Using Sentinel-1 SAR Time Series in Camargue, France. Remote Sens. 2019, 11, 887. [Google Scholar] [CrossRef]
  28. Fu, Y.; Shen, R.; Song, C.; Dong, J.; Han, W.; Ye, T.; Yuan, W. Exploring the Effects of Training Samples on the Accuracy of Crop Mapping with Machine Learning Algorithm. Sci. Remote Sens. 2023, 7, 100081. [Google Scholar] [CrossRef]
  29. Zhao, S.; Liu, X.; Ding, C.; Liu, S.; Wu, C.; Wu, L. Mapping Rice Paddies in Complex Landscapes with Convolutional Neural Networks and Phenological Metrics. GISci. Remote Sens. 2020, 57, 37–48. [Google Scholar] [CrossRef]
  30. Skakun, S.; Franch, B.; Vermote, E.; Roger, J.-C.; Becker-Reshef, I.; Justice, C.; Kussul, N. Early Season Large-Area Winter Crop Mapping Using MODIS NDVI Data, Growing Degree Days Information and a Gaussian Mixture Model. Remote Sens. Environ. 2017, 195, 244–258. [Google Scholar] [CrossRef]
  31. Dong, J.; Fu, Y.; Wang, J.; Tian, H.; Fu, S.; Niu, Z.; Han, W.; Zheng, Y.; Huang, J.; Yuan, W. Early-Season Mapping of Winter Wheat in China Based on Landsat and Sentinel Images. Earth Syst. Sci. Data 2020, 12, 3081–3095. [Google Scholar] [CrossRef]
  32. Boryan, C.; Yang, Z.; Mueller, R.; Craig, M. Monitoring US Agriculture: The US Department of Agriculture, National Agricultural Statistics Service, Cropland Data Layer Program. Geocarto Int. 2011, 26, 341–358. [Google Scholar] [CrossRef]
  33. Xu, J.; Zhu, Y.; Zhong, R.; Lin, Z.; Xu, J.; Jiang, H.; Huang, J.; Li, H.; Lin, T. DeepCropMapping: A Multi-Temporal Deep Learning Approach with Improved Spatial Generalizability for Dynamic Corn and Soybean Mapping. Remote Sens. Environ. 2020, 247, 111946. [Google Scholar] [CrossRef]
  34. Liu, W.; Dong, J.; Xiang, K.; Wang, S.; Han, W.; Yuan, W. A Sub-Pixel Method for Estimating Planting Fraction of Paddy Rice in Northeast China. Remote Sens. Environ. 2018, 205, 305–314. [Google Scholar] [CrossRef]
  35. Frolking, S.; Yeluripati, J.B.; Douglas, E. New District-Level Maps of Rice Cropping in India: A Foundation for Scientific Input into Policy Assessment. Field Crops Res. 2006, 98, 164–177. [Google Scholar] [CrossRef]
  36. Zhang, G.; Xiao, X.; Biradar, C.M.; Dong, J.; Qin, Y.; Menarguez, M.A.; Zhou, Y.; Zhang, Y.; Jin, C.; Wang, J.; et al. Spatiotemporal Patterns of Paddy Rice Croplands in China and India from 2000 to 2015. Sci. Total Environ. 2017, 579, 82–92. [Google Scholar] [CrossRef] [PubMed]
  37. Waleed, M.; Mubeen, M.; Ahmad, A.; Habib-ur-Rahman, M.; Amin, A.; Farid, H.U.; Hussain, S.; Ali, M.; Qaisrani, S.A.; Nasim, W.; et al. Evaluating the Efficiency of Coarser to Finer Resolution Multispectral Satellites in Mapping Paddy Rice Fields Using GEE Implementation. Sci. Rep. 2022, 12, 13210. [Google Scholar] [CrossRef] [PubMed]
  38. High-Resolution Distribution Maps of Rice in India for 2018, 2020, and 2022. Available online: https://figshare.com/articles/figure/High-resolution_distribution_maps_of_rice_in_India_for_2018_2020_and_2022/24228619 (accessed on 3 October 2023). [CrossRef]
  39. Peng, W.; Kuang, T.; Tao, S. Quantifying Influences of Natural Factors on Vegetation NDVI Changes Based on Geographical Detector in Sichuan, Western China. J. Clean. Prod. 2019, 233, 353–367. [Google Scholar] [CrossRef]
  40. McFEETERS, S.K. The Use of the Normalized Difference Water Index (NDWI) in the Delineation of Open Water Features. Int. J. Remote Sens. 1996, 17, 1425–1432. [Google Scholar] [CrossRef]
  41. Zhang, X.; Shen, R.; Zhu, X.; Pan, B.; Fu, Y.; Zheng, Y.; Chen, X.; Peng, Q.; Yuan, W. Sample-Free Automated Mapping of Double-Season Rice in China Using Sentinel-1 SAR Imagery. Front. Environ. Sci. 2023, 11, 1207882. [Google Scholar] [CrossRef]
  42. Dong, J.; Lu, H.; Wang, Y.; Ye, T.; Yuan, W. Estimating Winter Wheat Yield Based on a Light Use Efficiency Model and Wheat Variety Data. ISPRS J. Photogramm. Remote Sens. 2020, 160, 18–32. [Google Scholar] [CrossRef]
  43. Shen, R.; Dong, J.; Yuan, W.; Han, W.; Ye, T.; Zhao, W. A 30 m Resolution Distribution Map of Maize for China Based on Landsat and Sentinel Images. J. Remote Sens. 2022, 2022, 9846712. [Google Scholar] [CrossRef]
  44. Shen, R.; Pan, B.; Peng, Q.; Dong, J.; Chen, X.; Zhang, X.; Ye, T.; Huang, J.; Yuan, W. High-Resolution Distribution Maps of Single-Season Rice in China from 2017 to 2022. Earth Syst. Sci. Data Discuss. 2023, 15, 3203–3222. [Google Scholar] [CrossRef]
  45. Peng, Q.; Shen, R.; Li, X.; Ye, T.; Dong, J.; Fu, Y.; Yuan, W. A Twenty-Year Dataset of High-Resolution Maize Distribution in China. Sci. Data 2023, 10, 658. [Google Scholar] [CrossRef]
  46. Huang, X.; Fu, Y.; Wang, J.; Dong, J.; Zheng, Y.; Pan, B.; Skakun, S.; Yuan, W. High-Resolution Mapping of Winter Cereals in Europe by Time Series Landsat and Sentinel Images for 2016–2020. Remote Sens. 2022, 14, 2120. [Google Scholar] [CrossRef]
  47. Dong, J.; Pang, Z.; Lin, S.; Zhang, X.; Xie, Z.; Ren, P.; Zhang, X.; Yuan, W. Cotton Lands Induced Cooling Effect on Land Surface Temperature in Xinjiang, China. Agric. For. Meteorol. 2024, 351, 110004. [Google Scholar] [CrossRef]
  48. Yadav, S.; Kumar, V.; Singh, S.; Kumar, R.M.; Sharma, S.; Tripathi, R.; Nayak, A.K.; Ladha, J.K. Chapter 8—Growing Rice in Eastern India: New Paradigms of Risk Reduction and Improving Productivity. In The Future Rice Strategy for India; Mohanty, S., Chengappa, P.G., Mruthyunjaya, Ladha, J.K., Baruah, S., Kannan, E., Manjunatha, A.V., Eds.; Academic Press: Cambridge, MA, USA, 2017; pp. 221–258. ISBN 978-0-12-805374-4. [Google Scholar]
  49. Salas, E.A.L.; Subburayalu, S.K.; Slater, B.; Zhao, K.; Bhattacharya, B.; Tripathy, R.; Das, A.; Nigam, R.; Dave, R.; Parekh, P. Mapping Crop Types in Fragmented Arable Landscapes Using AVIRIS-NG Imagery and Limited Field Data. Int. J. Image Data Fusion 2020, 11, 33–56. [Google Scholar] [CrossRef]
  50. FAO. World Food and Agriculture—Statistical Yearbook 2020; FAO: Rome, Italy, 2020; ISBN 978-92-5-132345-9. [Google Scholar]
  51. Steele-Dunne, S.C.; McNairn, H.; Monsivais-Huertero, A.; Judge, J.; Liu, P.-W.; Papathanassiou, K. Radar Remote Sensing of Agricultural Canopies: A Review. IEEE J. Sel. Top. Appl. Earth Obs. Remote Sens. 2017, 10, 2249–2273. [Google Scholar] [CrossRef]
  52. Le Toan, T.; Ribbes, F.; Wang, L.-F.; Floury, N.; Ding, K.-H.; Kong, J.A.; Fujita, M.; Kurosu, T. Rice Crop Mapping and Monitoring Using ERS-1 Data Based on Experiment and Modeling Results. IEEE Trans. Geosci. Remote Sens. 1997, 35, 41–56. [Google Scholar] [CrossRef]
  53. Yang, M.; Guo, B.; Wang, J. A Novel and Robust Method for Large-Scale Single-Season Rice Mapping Based on Phenology and Statistical Data. ISPRS J. Photogramm. Remote Sens. 2024, 213, 14–32. [Google Scholar] [CrossRef]
Figure 1. Study area, including the administrative regions of 23 states of India. Blue dots indicate rice survey sites obtained from Google Earth and red dots indicate non-rice survey sites obtained from Google Earth.
Remotesensing 16 03180 g001
Figure 2. Diagram of the three feature maps in the VH time series used to calculate the rice index, where p1 and p2 are the key points of the rice growing season signature.
Remotesensing 16 03180 g002
Figure 3. The conceptual flowchart of the study.
Remotesensing 16 03180 g003
Figure 4. Winter rice identification map of India in 2018. Panels (af) on the right and bottom are enlarged maps of the winter rice states.
Remotesensing 16 03180 g004
Figure 5. Scatter plot comparing the estimated planting area of winter rice and the agricultural statistical area at the district level for 2018. The dotted line represents the 1:1 line, and the blue solid lines indicate the regression lines. (aw) represent different states respectively.
Remotesensing 16 03180 g005
Figure 6. Summer rice identification map of India in 2018. Panels (ae) on the right and bottom are enlarged maps of the summer rice states.
Remotesensing 16 03180 g006
Figure 7. Scatter plot comparing the estimated planting area of summer rice and the agricultural statistical area at the district level for 2018. The dotted line denotes the 1:1 line, and the blue solid lines indicate the regression lines. (aj) represent different states respectively.
Remotesensing 16 03180 g007
Figure 8. Autumn rice identification map of India in 2018. Panels (ae) on the right and bottom are enlarged maps of the autumn rice states.
Remotesensing 16 03180 g008
Figure 9. Scatter plot comparing the estimated planting area of autumn rice and the agricultural statistical area at the district level for 2018. The dotted line denotes the 1:1 line, and the blue solid lines indicate the regression lines. (ah) represent different states respectively.
Remotesensing 16 03180 g009
Figure 10. Cumulative distribution of patches with varying pixel numbers in the 2018, 2020, and 2022 winter rice distribution maps. (a,d,g) Western region of India and southern region of India. (b,e,h) Northern region of India and central region of India. (c,f,i) Eastern region of India and northeastern region of India.
Remotesensing 16 03180 g010
Figure 11. Cumulative distribution of patches with varying pixel numbers in the (a) 2018, (b) 2020, and (c) 2022 summer rice distribution maps.
Remotesensing 16 03180 g011
Figure 12. Cumulative distribution of patches with varying pixel numbers in the (a) 2018, (b) 2020, and (c) 2022 autumn rice distribution maps.
Remotesensing 16 03180 g012
Figure 13. Spatial distribution of small rice patch proportions in winter, 2018. The first category includes states where small patches account for less than 20%, the second category includes states where small patch proportions range from 20% to 40%, and the third category includes states where small patches account for over 40%.4.3 Limitations and prospects.
Remotesensing 16 03180 g013
Table 1. Sowing and harvesting periods of autumn, winter, and summer rice, divided by state.
StateAutumnWinterSummer
SowingHarvestingSowingHarvestingSowingHarvesting
Andhra Pradesh--May–JuneNovember–DecemberDecember–JanuaryApril–May
AssamFebruary–AprilJune–JulyJune–AugustNovember–DecemberDecember–FebruaryMay–June
BiharMay–JulySeptember–OctoberJuly–SeptemberNovember–DecemberJanuary–FebruaryMay–June
Chhattisgarh--June–AugustOctober–December--
Gujrat--June–AugustOctober–December--
Haryana--May–JulySeptember–November
Himachal Pradesh--June–JulySeptember–November--
Jammu Kashmir--April–JulySeptember–December--
Jharkhand--June–AugustOctober–December--
Karnataka--May–AugustSeptember–DecemberDecember–FebruaryApril–July
KeralaApril–JuneAugust–OctoberSeptember–OctoberJanuary–FebruaryDecember–JanuaryMarch–April
Madhya Pradesh--June–AugustMid-September–MidDecember--
Maharashtra--June–JulyOctober–December--
Manipur--June–AugustOctober–December--
MeghalayaFebruary–AprilJune–JulyJune–AugustNovember–DecemberDecember–FebruaryMay–June
OdishaMay–JuneSeptember–OctoberJunee–AugustDecember–JanuaryDecember–JanuaryMay–June
Punjab--May–AugustSeptember–November--
Rajasthan--July–AugustOctober–December--
Tamil NaduApril–JuneAugust–OctoberSeptember–OctoberJanuary–FebruaryDecember–JanuaryMarch–April
TripuraFebruary–AprilJune–JulyJuly–AugustNovember–DecemberDecember–FebruaryMay–June
Uttar Pradesh May–JulySeptember–November
West BengalMay–JuneJuly–NovemberJuly–AugustNovember–DecemberOctober–FebruaryApril–May
Table 2. Confusion matrix of the rice identification map in the main producing states in 2018.
StatesRice/OtherRice 1OtherUA (%)PA (%)OA (%)
West Bengal
(Winter)
Rice 26783991.9994.5691.40
Other5936490.3286.05
Odisha
(Winter)
Rice2961881.9994.2782.71
Other6510184.8760.84
Bihar
(Winter)
Rice483687.8298.7788.94
Other6710494.5560.82
Assam
(Winter)
Rice246884.2596.8586.50
Other4610092.5968.49
West Bengal
(Summer)
Rice2941284.0096.0884.30
Other567185.5455.91
Odisha
(Summer)
Rice1772687.1987.1983.85
Other269378.1578.15
Bihar
(Summer)
Rice3021786.7894.6786.36
Other469785.0967.83
Assam
(Summer)
Rice1291689.5888.9783.85
Other153266.6768.09
West Bengal
(Autumn)
Rice1543181.9183.2482.48
Other3415283.0681.72
Odisha
(Autumn)
Rice2517779.4376.5272.95
Other6513263.1667.01
Bihar
(Autumn)
Rice1221384.7290.3785.66
Other228787.0079.82
Assam
(Autumn)
Rice2695796.0782.5286.67
Other1117375.2294.02
Telangana
(Winter)
Rice2033569.0585.2977.34
Other9122786.6471.38
Telangana
(Summer)
Rice147887.5094.8490.10
Other2111793.6084.78
Andhra Pradesh
(Winter)
Rice128783.1294.8181.13
Other2611794.3581.82
Andhra Pradesh
(Summer)
Rice1972484.9189.1488.48
Other3525691.4387.97
Chhattisgarh
(Winter)
Rice3581586.0695.9887.83
Other5816991.8574.45
Uttar Pradesh
(Winter)
Rice3596070.8185.6871.82
Other14817174.0353.61
Punjab
(Winter)
Rice274790.4397.5191.26
Other2910293.5877.86
1 The identified rice sample points. 2 Number of sample points.
Disclaimer/Publisher’s Note: The statements, opinions and data contained in all publications are solely those of the individual author(s) and contributor(s) and not of MDPI and/or the editor(s). MDPI and/or the editor(s) disclaim responsibility for any injury to people or property resulting from any ideas, methods, instructions or products referred to in the content.

