Article

Automatic Aircraft Identification with High Precision from SAR Images Considering Multiscale Problems and Channel Information Enhancement

1
Xi’an Key Laboratory of Network Convergence Communication, College of Communication and Information Engineering, Xi’an University of Science and Technology, Xi’an 710054, China
2
School of Electrical and Information Engineering, Changsha University of Science & Technology, Changsha 410114, China
*
Author to whom correspondence should be addressed.
Remote Sens. 2024, 16(17), 3177; https://doi.org/10.3390/rs16173177
Submission received: 15 July 2024 / Revised: 25 August 2024 / Accepted: 26 August 2024 / Published: 28 August 2024
(This article belongs to the Special Issue Intelligent Remote Sensing Data Interpretation)

Abstract

:
The SAR system possesses the ability to carry out all-day and all-weather imaging, which is highly valuable in the application of aircraft identification. However, aircraft identification from SAR images still faces great challenges due to speckle noise interference, multiscale problems, and complex background interference. To solve these problems, an efficient bidirectional path multiscale fusion and attention network (EBMA-Net) is proposed in this paper. It employs bidirectional connectivity to fuse the features of aircraft with different scales to perform the accurate detection of aircraft even when the background is highly complex. In the presented EBMA-Net, a module called efficient multiscale channel attention fusion (EMCA) and three parallel squeeze efficient channel attention (SECA) modules are proposed. In the EMCA module, the bidirectional paths are created by stacking upper and lower fusion modules, which effectively integrate shallow detailed features and deep semantic information. So, the detection performance of aircraft at different scales is improved. In the SECA module, the dependency relationship between feature channels is explicitly modeled, which can automatically learn the importance of different channels, prioritize key features, so as to improve the precision and robustness of aircraft identification. In the experiment, the public dataset of aircraft identification (i.e., SAR-AIRcraft-1.0, which is generated from the GF-3 satellite) from high-resolution SAR systems is used, and several other excellent target-detection networks are used for performance comparison, namely, YOLOv5s, YOLOv7, MGCAN, and EBPA2N. According to the results, the average aircraft detection accuracy of EBMA-Net is 91.31%, which is 4.5% higher than YOLOv7; and the false alarm rate is decreased by 5%. Its accuracy in the identification of aircraft can reach 95.6%, which is about 3.7% higher than YOLOv7. Therefore, the EBMA-Net obviously outperforms the other networks for aircraft detection and identification. The proposed EBMA-Net, which can capture the detailed information and better restrain the background interference, could also be used to perform the detection and identification of dense targets with different scales and background from SAR images.

1. Introductory

In recent years, remote sensing technology has seen increasingly widespread application in synthetic aperture radar (SAR) images in fields such as military reconnaissance and civilian surveillance [1]. The SAR system has all-day and all-weather data acquisition capabilities [2]. Therefore, the use of SAR images for aircraft detection has been widely studied. However, due to noise interference, deformation, and occlusion, the targets in SAR images are often affected. This brings great challenges to the detection and identification of aircraft in SAR images.
SAR target detection is a crucial part of SAR image interpretation [3], and many scholars have conducted extensive research on different object-detection methods [4,5,6,7,8]. Aircraft are the typical man-made targets in SAR images. Timely aircraft identification provides an important basis for flight scheduling, operational efficiency and on-site maintenance, thus becoming a key component of civil airport management. In the military field, high-precision aircraft detection can provide reliable military intelligence, which is conducive to battlefield awareness and reconnaissance [9]. SAR imagery with high-precision has an important application value in practical scenarios.
Traditional aircraft detection methods mainly include three types. The first is the single-feature constant false positive rate (CFAR) algorithm [10]. The CFAR algorithm is essentially a hypothetical experiment based on clutter statistics and brightness information. Since the structural information of the target is not taken into account [11] in the field of aircraft detection, there are a large number of false positives in the detection effect of the CFAR algorithm [12]. The second type is an algorithm based on multi-feature fusion. By fusing various features such as target geometry [13], electromagnetic scattering features [14], and texture features [15], the detection performance of the algorithm is improved, and the target is comprehensively detected. Tan et al. [16] proposed a hybrid method that combines gradient texture saliency mapping with CFAR algorithms for aircraft detection. This method aims to solve some of the limitations of the CFAR algorithm in specific scenarios. The third category is knowledge-based algorithms based on expert systems [17]. It relies on prior knowledge of the imaging scene, the clutter, and the targets, to decipher the SAR images. The performance of the algorithm has improved, but the complexity of the algorithm has also increased. Traditional object-detection methods can fully combine the information of the target itself into the SAR image with a priori understanding of the surrounding environment. However, it relies heavily on human intervention and hand-designed features. In some simple scenes with relatively complete aircraft imaging features, good detection results can be obtained. In the face of target interpretation of SAR images in complex and large scenes, the artificially designed feature characterization ability is weak, and there are many defects in detection accuracy and scene adaptability, which hinders further application.
At present, popular deep learning object-detection networks are broadly divided into two categories: single-stage algorithms and two-stage algorithms. Among them, the most representative two-stage algorithm is the RCNN series [18]. Li et al. [19] introduced an improved line segment detector to achieve the approximate localization of airports in large scenes, and then effectively combined with transfer learning and Fast R-CNN to detect aircraft in the candidate area of the airport. Zhang et al. [20] proposed a cascaded three-view network using Faster R-CNN, which achieved remarkable accuracy in aircraft detection. Yang et al. [21] proposed an M-FCN network, which, combined with FCN, can accurately locate the aircraft and improve the detection accuracy of the aircraft. On the other hand, the most representative single-level algorithms are SSD [22] and the YOLO series [23,24,25,26,27,28,29]. Among them, the MGCAN network proposed by Chen et al. [30] greatly improves the performance of small aircraft target detection. Luo et al. [31] introduced the EBPA2N network, which is good at capturing the multiscale scattering characteristics of the aircraft, thereby improving the accuracy of aircraft detection. Nie et al. [32] proposed the use of the LFC-SSD network to detect multiscale aircraft, and some progress has been made in aircraft detection. However, the generalization ability and real-time performance of the above-mentioned network are still insufficient, and the actual imaging has similar aircraft characteristics and strong scattering points for some specifications.
Deep learning models make it more difficult to extract features for small aircraft target detection on SAR images. In the real scenario, the aircraft may be obscured by other objects, which will make detection more difficult. The background is complex and poses strong interference in target detection (e.g., buildings and other metal scattering features in SAR images are similar to aircraft scattering features), which makes it difficult for deep learning models to accurately distinguish between aircraft targets and backgrounds. Therefore, the above issues remain as challenges that we need to address. The main contributions of this paper are as follows:
(1)
An efficient bidirectional-path multiscale fusion and attention network (EBMA-Net) is proposed. It realizes multiple cross-level feature-fusion operations, captures aircraft features more richly and comprehensively, and can effectively solve the problems of discrete aircraft, scale inhomogeneity and complex background interference.
(2)
The construction of an efficient multiscale channel attention fusion module (EMCA), which effectively learns multiscale spatial information and accurately captures small aircraft target features.
(3)
An efficient dual-channel attention module is proposed, namely, squeeze efficient channel attention (SECA), to reduce the interference of complex background and scattering noise, enhance the robustness of the model, and reduce the dependence on a specific scene, so as to reduce false alarms.
The subsequent sections of this paper are structured as follows. Section 2 provides a detailed description of the proposed methodology. Section 3 presents the experimental setup, conducts comparisons with other networks, and analyzes the results. Finally, Section 4 concludes the paper.

2. Methodology

The efficient bidirectional path multiscale fusion and attention network (EBMA-Net) consists of three parts: the YOLOv7 [33] backbone network, the head-level structure, and the classification regression, as shown in Figure 1. First, the YOLOv7 backbone network is employed as the feature extractor, responsible for capturing target features. The output feature maps from the last three stages of this backbone are then fed into the head layer, that is the EMCA module and three parallel dual channel attention SECA modules, outputting three layers of feature maps with different sizes. Finally, the fused features are classified into a regression part and output to obtain the result after detection and recognition.

2.1. The YOLOv7 Backbone Network

Looking at YOLOv7 [33] as a whole, the image size of 512 × 512 is input into the backbone network, and the feature maps are first generated through a two-layer CBS operation. The paper represents the 3D tensor as X R C × H × W , Here, C, H, and W represent the number of channels, height, and width of the feature map, respectively. Then, it is obtained by two-layer CBS and ELAN modules, after which the rich image features are extracted by three MP and ELAN modules respectively, and three feature maps are produced, namely, C 3 R 256 × 64 × 64 , C 4 R 512 × 32 × 32 , and C 5 R 1024 × 16 × 16 . Then, the head goes through the SPPCSPC module and the channel number is changed from 1024 to 512, to spatial pyramid pooling (SPP) [34], which learns the multiscale information of the aircraft by constructing high-level features on multiple sensory fields using multiple pooling algorithms of different scales. It is a module that uses pyramid pooling operations and CSP structures. The head layer network generates three layers of feature maps of varying sizes. These fused features are then input into the detection head, ultimately leading to the desired output result. In Figure 1, “Cat” means “ConCat”.

2.2. EBMA-Net

The EBMA-Net architecture presented in the paper, depicted in Figure 1, employs the YOLOv7 backbone network as its feature extraction core, balancing the demands of detection precision and identification accuracy. This choice of backbone ensures the extraction of optimal target features. The output feature maps C3, C4, and C5 of the last three stages of the backbone network are injected into the EBMA bidirectional path multiscale fusion attention module, to enrich the feature representation. The EBMA-Net consists of the EMCA module and three parallel dual-channel attention SECA modules. The EMCA module integrates three feature maps of varying resolutions generated by the backbone network. Following this, the module employs three parallel dual-channel attention mechanisms to enhance the multiscale features of the aircraft. Additionally, classification and regression prediction networks are leveraged to derive initial predictions. Ultimately, the non-maximum suppression (NMS) [35] technique is applied to eliminate redundant predictions, resulting in refined detection outcomes.

2.2.1. EMCA Module

The backbone network generates multi-level features, wherein shallow features offer detailed spatial information crucial for precise target localization. Meanwhile, high-level features contain rich semantic content, essential for distinguishing foreground from background. Consequently, the efficient integration of these features across various scales significantly contributes to enhancing target-detection accuracy. To achieve comprehensive fusion, the EMCA module is introduced, specifically designed to integrate the output feature maps C3, C4, and C5 from the backbone network. CBM is performed after outputting C3, C4, and features are weighted at the channel level and spatial level after C5, respectively, to achieve more comprehensive feature fusion, i.e., to perform efficient channel and bottleneck transformer (ECBT) dual-attention operation. As shown in Figure 1, in the EMCA module, the stacking of the upward path feature fusion module (UPF) and downward path feature fusion (DPF) forms a bidirectional path. The EMCA module efficiently integrates shallow, detailed features with deeper, semantic information, leveraging their complementary benefits. This integration facilitates an improvement in the detection rate of targets across various scales. Among them, both UPF and DPF modules have introduced the SE attention [36] module. The goal is to efficiently extract key aircraft attributes and enhance the detection network’s overall performance.

UPF Module

As shown in Figure 1, UPF splices the feature maps C3, C4 and C5 output from the backbone network with the feature maps in the bottom–up path, and then further fuses the features through a series of convolutional operations. A branch output from the SPPCSPC module is processed by the CBM module in UPF and then upsampled, and then concatenated with the features output from C4 in the backbone network. In order to enhance the feature representation, the output feature map after splicing is processed by the SE module and then the ELAN operation is performed. Of these, the SE module operation performs channel feature compression of the input feature map X using global average pooling to obtain X R C × 1 × 1 , followed by two fully connected layer operations, which are expressed as a function of F e ( · ) . Following that, the sigmoid function is applied to derive S, where these two fully connected layers serve to integrate the feature map information from each channel. Finally, it is weighted channel-by-channel to the previous features by multiplication [37]. The principle of the SE module is as follows:
X = F G A P = 1 H × W i , j W , H X i , j
S = δ ( W 2 F e W 1 X
X 1 = S × X
where X R C × H × W is the input feature map, F G A P is the global average pooling, and X R C × 1 × 1 has a channel vector with a global sense field. W1 and W2 are learnable parameters that scale the channel vector and learn the varying importance of each channel dimension. The sigmoid function δ is utilized for normalization purposes. Finally, the normalized channel attention weight vector δ W 2 F e W 1 X ϵ R C × 1 × 1 is multiplied with X R C × H × W input features to obtain X 1 R C × H × W , and feature recalibration is achieved.

DPF Module

To enable the feature map to contain richer semantic and location information, the detailed features of different scale targets are effectively fused. As in Figure 1, DPF is performed to further fuse the UPF output with the top–down path features. The UPF output information is spliced with another branch output by the SPPCSPC module after MP operation. The output features are again processed by the SE module and ELAN to obtain the final output information of the bidirectional path.

ECBT Module

In order to make the model more effective in extracting and representing the aircraft target, important aircraft features on the channel and space can be captured simultaneously, which help the model to learn the SAR image information effectively in the complex background and improve the performance of the model. Inspired by the ideas of the ECA [37] and BoT [38] attention mechanisms, the ECBT dual-attention mechanism is proposed (as shown in Figure 2), which weights features at the channel level and spatial level, respectively, to achieve a more comprehensive feature fusion.
First, channel feature compression is performed on the input X using global average pooling to obtain a 1 × 1 × C feature map, which can be obtained by Equation (1). Cross-channel feature learning is performed by 1D convolution to learn the differences between different channels. The sigmoid activation function is applied to derive the normalized channel weight vector A e c a . Finally, the channel weight vector A e c a R C × 1 × 1 is multiplied channel-by-channel with the input feature X R C × H × W to finally output the features of X R C × H × W . This feature map is then fed into the self-attentive BoT module for processing. The MHSA, as part of the BoT module, is a deep learning architecture that employs the self-attention mechanism to determine the weights of each input sequence element. This process involves assessing the relevance between a query, key, and value. Specifically, an input sequence is mapped to a vector space comprising query, key, and value representations. Subsequently, the relevance between the query and each key is determined through the calculation of their inner product. This relevance is then used to weight the corresponding value vectors, and the weighted values are aggregated to generate the final three self-attention feature maps θ X T R C 2 × H × W ,     ϕ X ϵ R C 2 × H × W   , and   g ( X ) R C 2 × H × W . The principle of its module is as follows:
K = ϕ C = log 2 ( C ) 2 + 1 2 o d d
A e c a = δ C o n v 1 d k F G A P X
X = A e c a × X  
X 2 = S o f t max θ ( X ) T ϕ X g X = 1 j e θ ( X ) T φ ( X ) θ ( X ) T φ X W · g ( X )
where W is the weight.

2.2.2. SECA High-Efficiency Dual-Channel Attention Module

The SECA module’s processed feature map captures intricate image details. Its ability to discern the scattering patterns of aircraft aids significantly in enhancing the overall aircraft detection accuracy. Inspired by the ideas of ECA [37] and SE [36], the SECA block is proposed to screen the features (as Figure 3 shown) to make the network more efficient to focus on the channel feature target information.
Effective local channels and global local channels are important branches for learning target features. In this paper, the input feature map is divided along the channel dimension into two independent components, which are then fed into different channel attention branches of the effective local channels and global channels, respectively. Afterward, these two branches are merged to derive attention-boosted sub-features. The attention-enhanced sub-features are aggregated to obtain the attention-enhanced fine features. Ultimately, skip connections are employed to effectively preserve the initial coarse-grained features, thus enhancing the robustness of the training process.
Efficient local cross-channel attention is achieved as follows: initially, channel feature compression is applied to the input X 1 using global average pooling, resulting in a 1 × 1 × C feature map (as shown in Equation (1)). Subsequently, cross-channel feature learning is performed through 1D convolution to assess the importance of the different channels. The sigmoid activation function is then employed to obtain a normalized channel weight vector A e c a (as shown in Equation (5)). Finally, this channel weight vector A e c a R C × 1 × 1 is multiplied channel-wise with the input feature X 1 R C × H × W , yielding a feature map with channel attention.
X 11 = A e c a × X 1
Given an input feature map X 1 R C × H × W , where C represents the number of channels in the input feature map, and H o d d signifies the odd number closest to H (as shown in Equation (4)), K designates the dimension of the 1D convolution kernel, used to capture local cross-channel interactions. C o n v 1 d k represents a 1D convolution operation, utilizing a kernel of size k × k (as shown in Equation (5)). F G A P X 1 denotes the global average pooling of image X 1 , and δ denotes the sigmoid activation function, which is used to generate the normalized weight coefficients for each channel. The channel weight vector A e c a R C × 1 × 1 is multiplied by the input feature   X 1 R C × H × W to obtain the feature graph X 11 R C × H × W with channel attention.
The principle of the global channel attention module is as follows:
E 2 = F G A P X 2
S 2 = δ ( W 3 F e W 2 E 2 )
X 21 = S 2 × X 2
where X 2 R C × H × W is the input feature map, and E 2 R C × H × W is the channel vector with global sense field. F e W 2 E 2 denotes the first fully connected layer. W 2 and W 3 are learnable parameters for scaling and transforming the channel tract vector and learning the different levels of importance of the channel dimensions, respectively. δ is the sigmoid function, which is used for normalization. S 2 R C × 1 × 1 denotes the output result after normalization. Finally, the normalized channel attention weight vector S 2 is multiplied with the input features X 2 R C × H × W to obtain the feature graph X 21 R C × H × W with channel attention.

2.3. Classifier

After extracting the aircraft features, the network outputs valid predictive feature maps at three scales, which are 16 × 16, 32 × 32, and 64 × 64. To refine the feature maps at various scales, the prediction frame network typically produces three anchor frames for each scale, differing in size and aspect ratio. This approach helps cover a wider range of potential object sizes and shapes. Classification regression by 1 × 1 convolution then directly predicts the location, confidence and class of each bounding box. After obtaining the bounding boxes, overlapping predictions are removed using NMS [35] to output the final detection results. During the training phase, the network’s performance is evaluated through the calculation of a loss function. This loss quantifies the discrepancy between the network’s predictions and the ground truth. To improve the network’s accuracy, the parameters are optimized iteratively to minimize this loss.

3. Experiments

3.1. Experimental Data

For our experiments, we leverage a specialized dataset, SAR-AIRcraft-1.0, which contains high-resolution SAR imagery for aircraft detection and identification. This dataset is derived from domestic Gaofen-3 satellite data [39]. The SAR-AIRcraft-1.0 dataset comprises 4368 images with a 1 m resolution. These images are categorized into four distinct sizes: 800 × 800, 1000 × 1000, 1200 × 1200, and 1500 × 1500, providing a diverse set of inputs for our experiments. There are 16,463 aircraft target instances including A220, A320/321, A330, ARJ21, Boeing 737, Boeing 787, and others in 7 categories. Furthermore, the dataset undergoes transformations such as horizontal rotation and a 90-degree clockwise rotation; flipping and mirroring for data enhancement [6] is used to expand these aircraft category data. Finally, 19,358 aircraft samples with a size of 512 × 512 pixels are produced. The division of the dataset adheres to a 7:3 ratio between training and validation samples, while an additional 74 samples are reserved for independent testing.

3.2. Environment and Parameters

The experiments are based on a single NVIDIA RTX 2080 Ti (12 G RAM) and Ubuntu 18.04 system. All networks were trained for 100 epochs based on the PyTorch framework with the same dataset, and the training time was recorded. The batch size was 8. The paper was compared with YOLOv5s [29], EBPA2N [31], MGCAN [30] and YOLOv7 [33], all with a learning rate of 0.0001. For a fair comparison, none of these networks were loaded with a pre-trained model; they were trained using multiscale training, and some additional augmented testing techniques were used to boost network performance. All other parameters were used by default.

3.3. Assessment of Indicators

To assess the performance of our model, we rely on key metrics such as detection precision (P), recall (R), missed detection rate (MDR), and false alarm rate (FAR). These metrics provide direct insights into the reliability of our model in our experiments. Their precision rate, recall rate, missed detection rate and false alarm rate are defined as follows:
P = T P T P + F P
R = T P T P + F N
M D R = 1     R = 1     T P T P + F N
F A R = 1     P = T P T P + F P
True positive (TP) refers to correctly predicting the positive class, where both the actual value and the prediction are positive. In other words, which class it belongs to, and if it is predicted to be in that category, it is called true positive. (e.g., true is 1 and prediction is also 1). Conversely, false negative (FN) occurs when the positive class is incorrectly predicted as the negative class, meaning the actual value is positive but the prediction is negative. It is that the prediction is not a class, but it is actually that class, (e.g., true is 1 and prediction is 0). False positive (FP): the actual value is negative, but the predicted value is positive. That is, you predict it to be a certain class, but it is not, so it is a false positive (for example, true is 0, predicted is 1).

3.4. Results

To assess the performance of the framework proposed in the paper, 74 samples with 1 m resolution of SAR-AIRcraft-1.0 images from Gaofen-3 system were randomly selected for independent testing. All the images are 1500 × 1500 pixels, and none of them were used in the training data. In this paper, one image of aircraft detection results was randomly selected to analyze the experimental results. In the identification experiment, the 74 randomly selected maps were automatically sliced by the program to obtain 541 test maps of 512 × 512 pixels. Of these, four randomly selected 512 × 512 pixels testing result maps for aircraft recognition testing were analyzed.

3.4.1. Analysis of Aircraft Detection Results

The aircraft detection results by the different networks, correct detections, false alarms, and missed detections are represented by green, red, and yellow boxes, respectively. The ground truth of the aircraft is shown in Figure 4a. The scattering characteristics of airplanes at airports are intricate and diverse, rendering the detection process more challenging. In Figure 4b, YOLOv5s obviously has two false alarms in the airport. There are obviously false alarms and missed detections as shown in Figure 4c–e. Notably, the EBMA detection results exhibit no false alarms, with only one aircraft with weak brightness information being missed. This indicates that EBMA-Net exhibits significantly better robustness. The EMCA and SECA modules in EBMA-Net are adept at effectively detecting aircraft and mitigating false alarms. Therefore, EBMA-Net’s detection performance surpasses that of the YOLOv7, MGCAN, and EBPA2N networks. It possesses strong feature-learning capabilities and can adeptly accommodate the multiscale and multi-directional characteristics of aircraft. The SECA module can learn the features of the aircraft in a more focused way, which improves the detection rate of the aircraft.

3.4.2. Aircraft Inspection Performance Assessment

Table 1 shows the performance evaluation metrics of different networks for aircraft detection on 74 independent test images. The accuracy metric of 84.2% for YOLOv5s was the lowest (as Figure 5a shown). This suggests that the robustness of this network is inadequate. For the YOLOv7, MGCAN and EBPA2N networks, the precision metrics were 86.78% (as Figure 5b shows), 86.12% (as Figure 5c shows) and 87.31% (as Figure 5d shows) respectively. All had a 2% improvement in accuracy relative to the YOLOv5s network accuracy. The test accuracy was slightly improved, but not significantly. For the EBMA-Net proposed in this paper, the test precision of 91.1% (as Figure 5e shows) improved by 4.5% relative to YOLOv7, and the recall rate was 93.88% (as Figure 6e shown), the MDR was 6.12%, and the FAR was 8.69%. The detection metrics were much better than YOLOv5s. The detection accuracy improved by 3–5% relative to both MGCAN and EBPA2N networks. Therefore EBMA-Net has a more reliable detection performance. At the same time, by comparing the five confusion matrix plots in Figure 7, it can be seen that Figure 7e has fewer false detection rates and missed detection rates when detecting various types of aircraft targets, reflecting the higher accuracy of EBMA-Net.

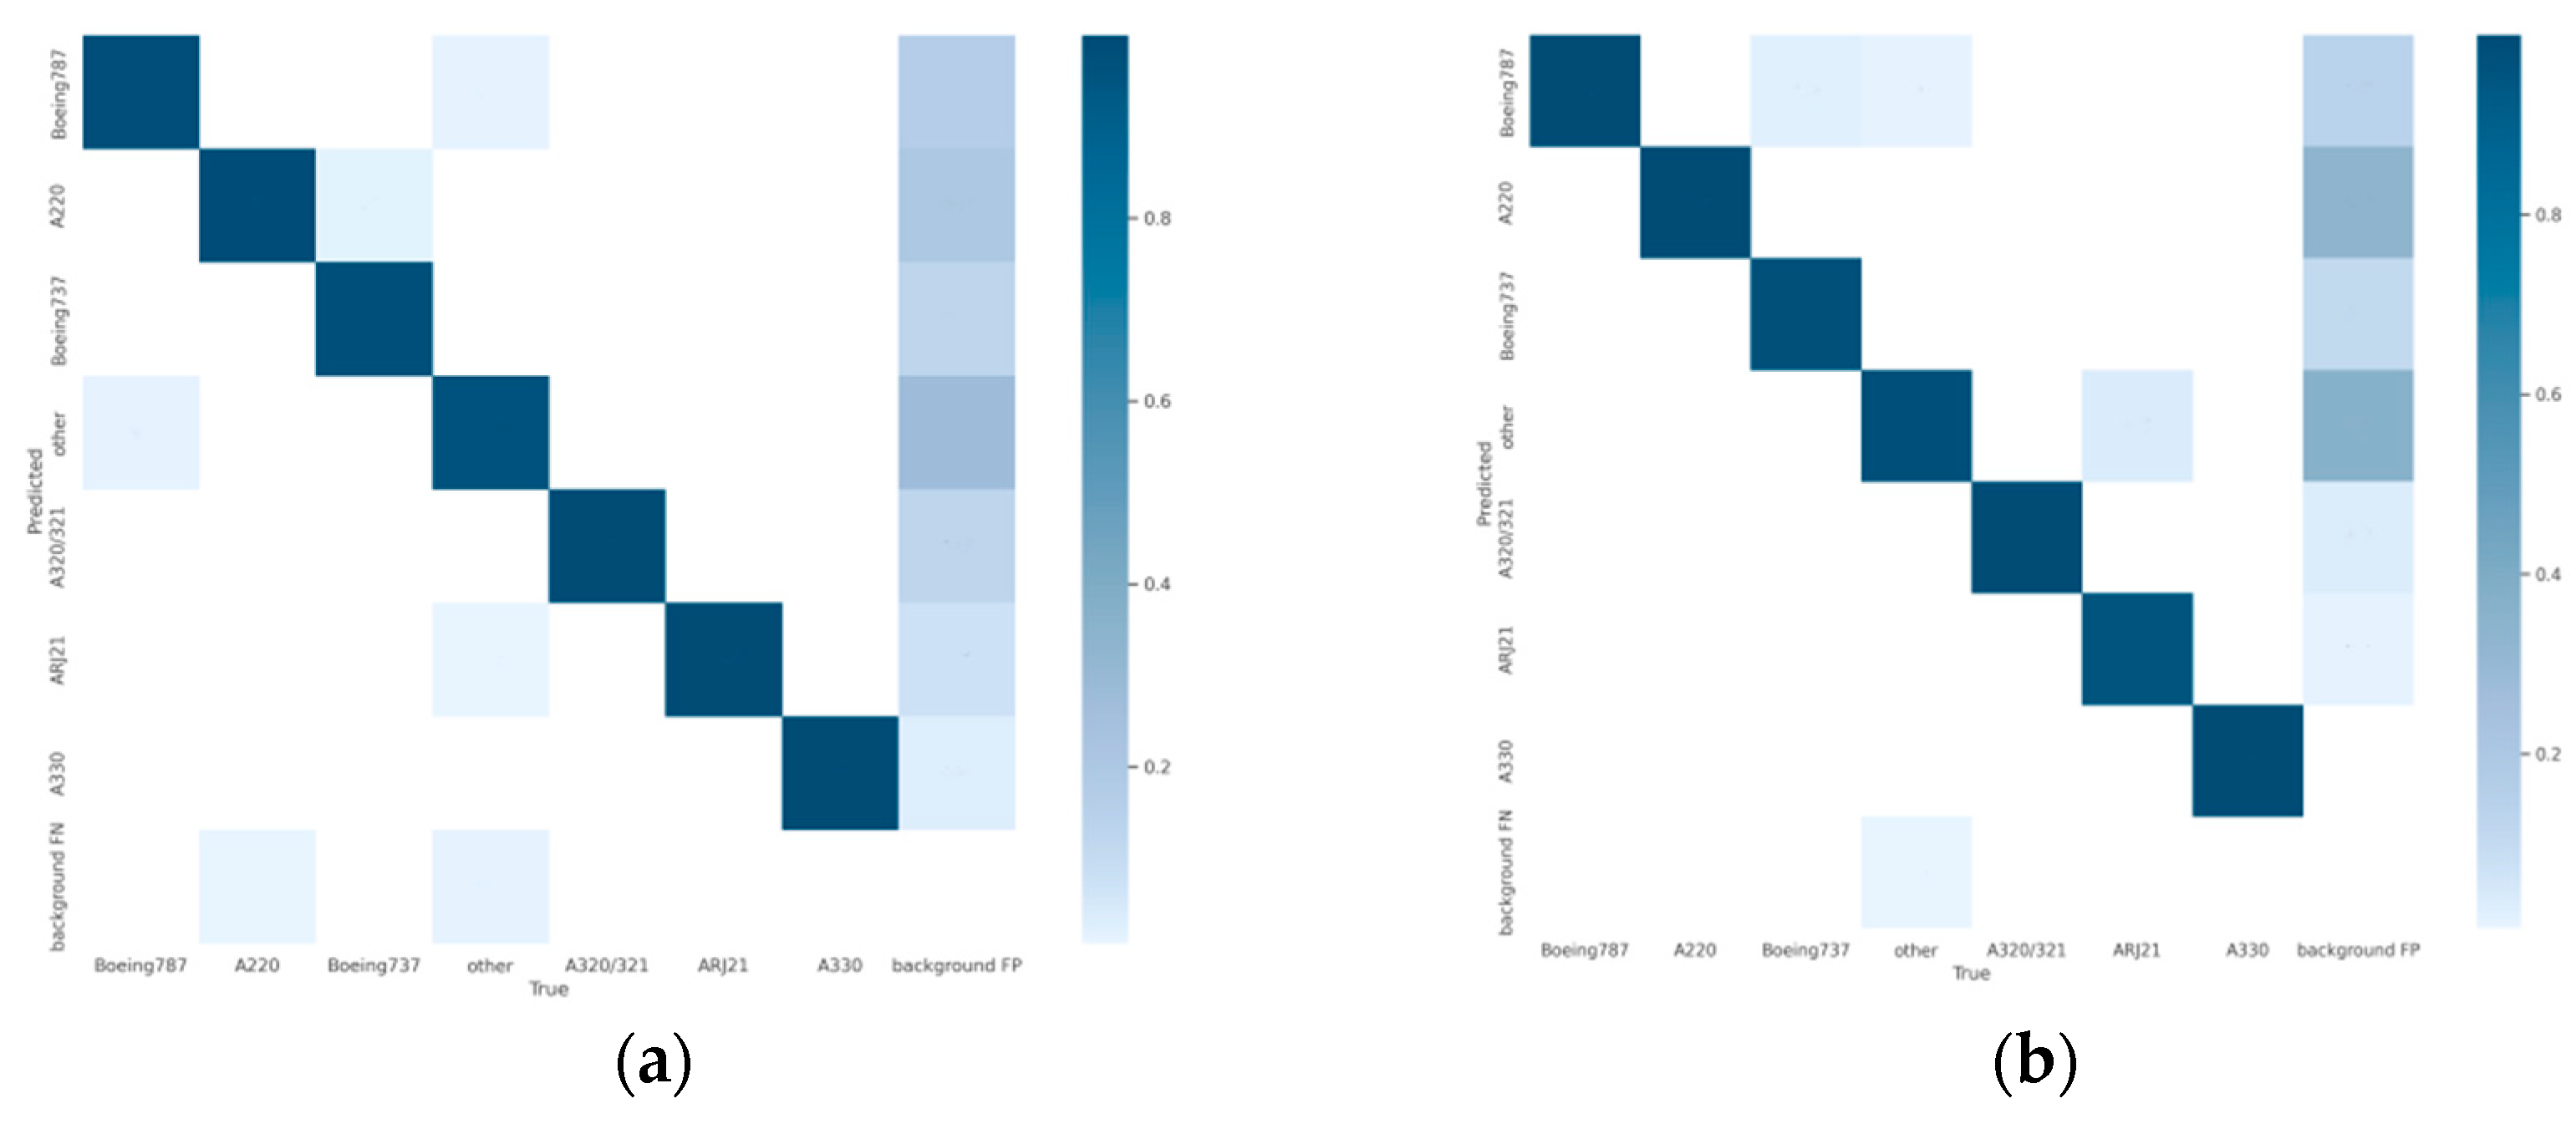
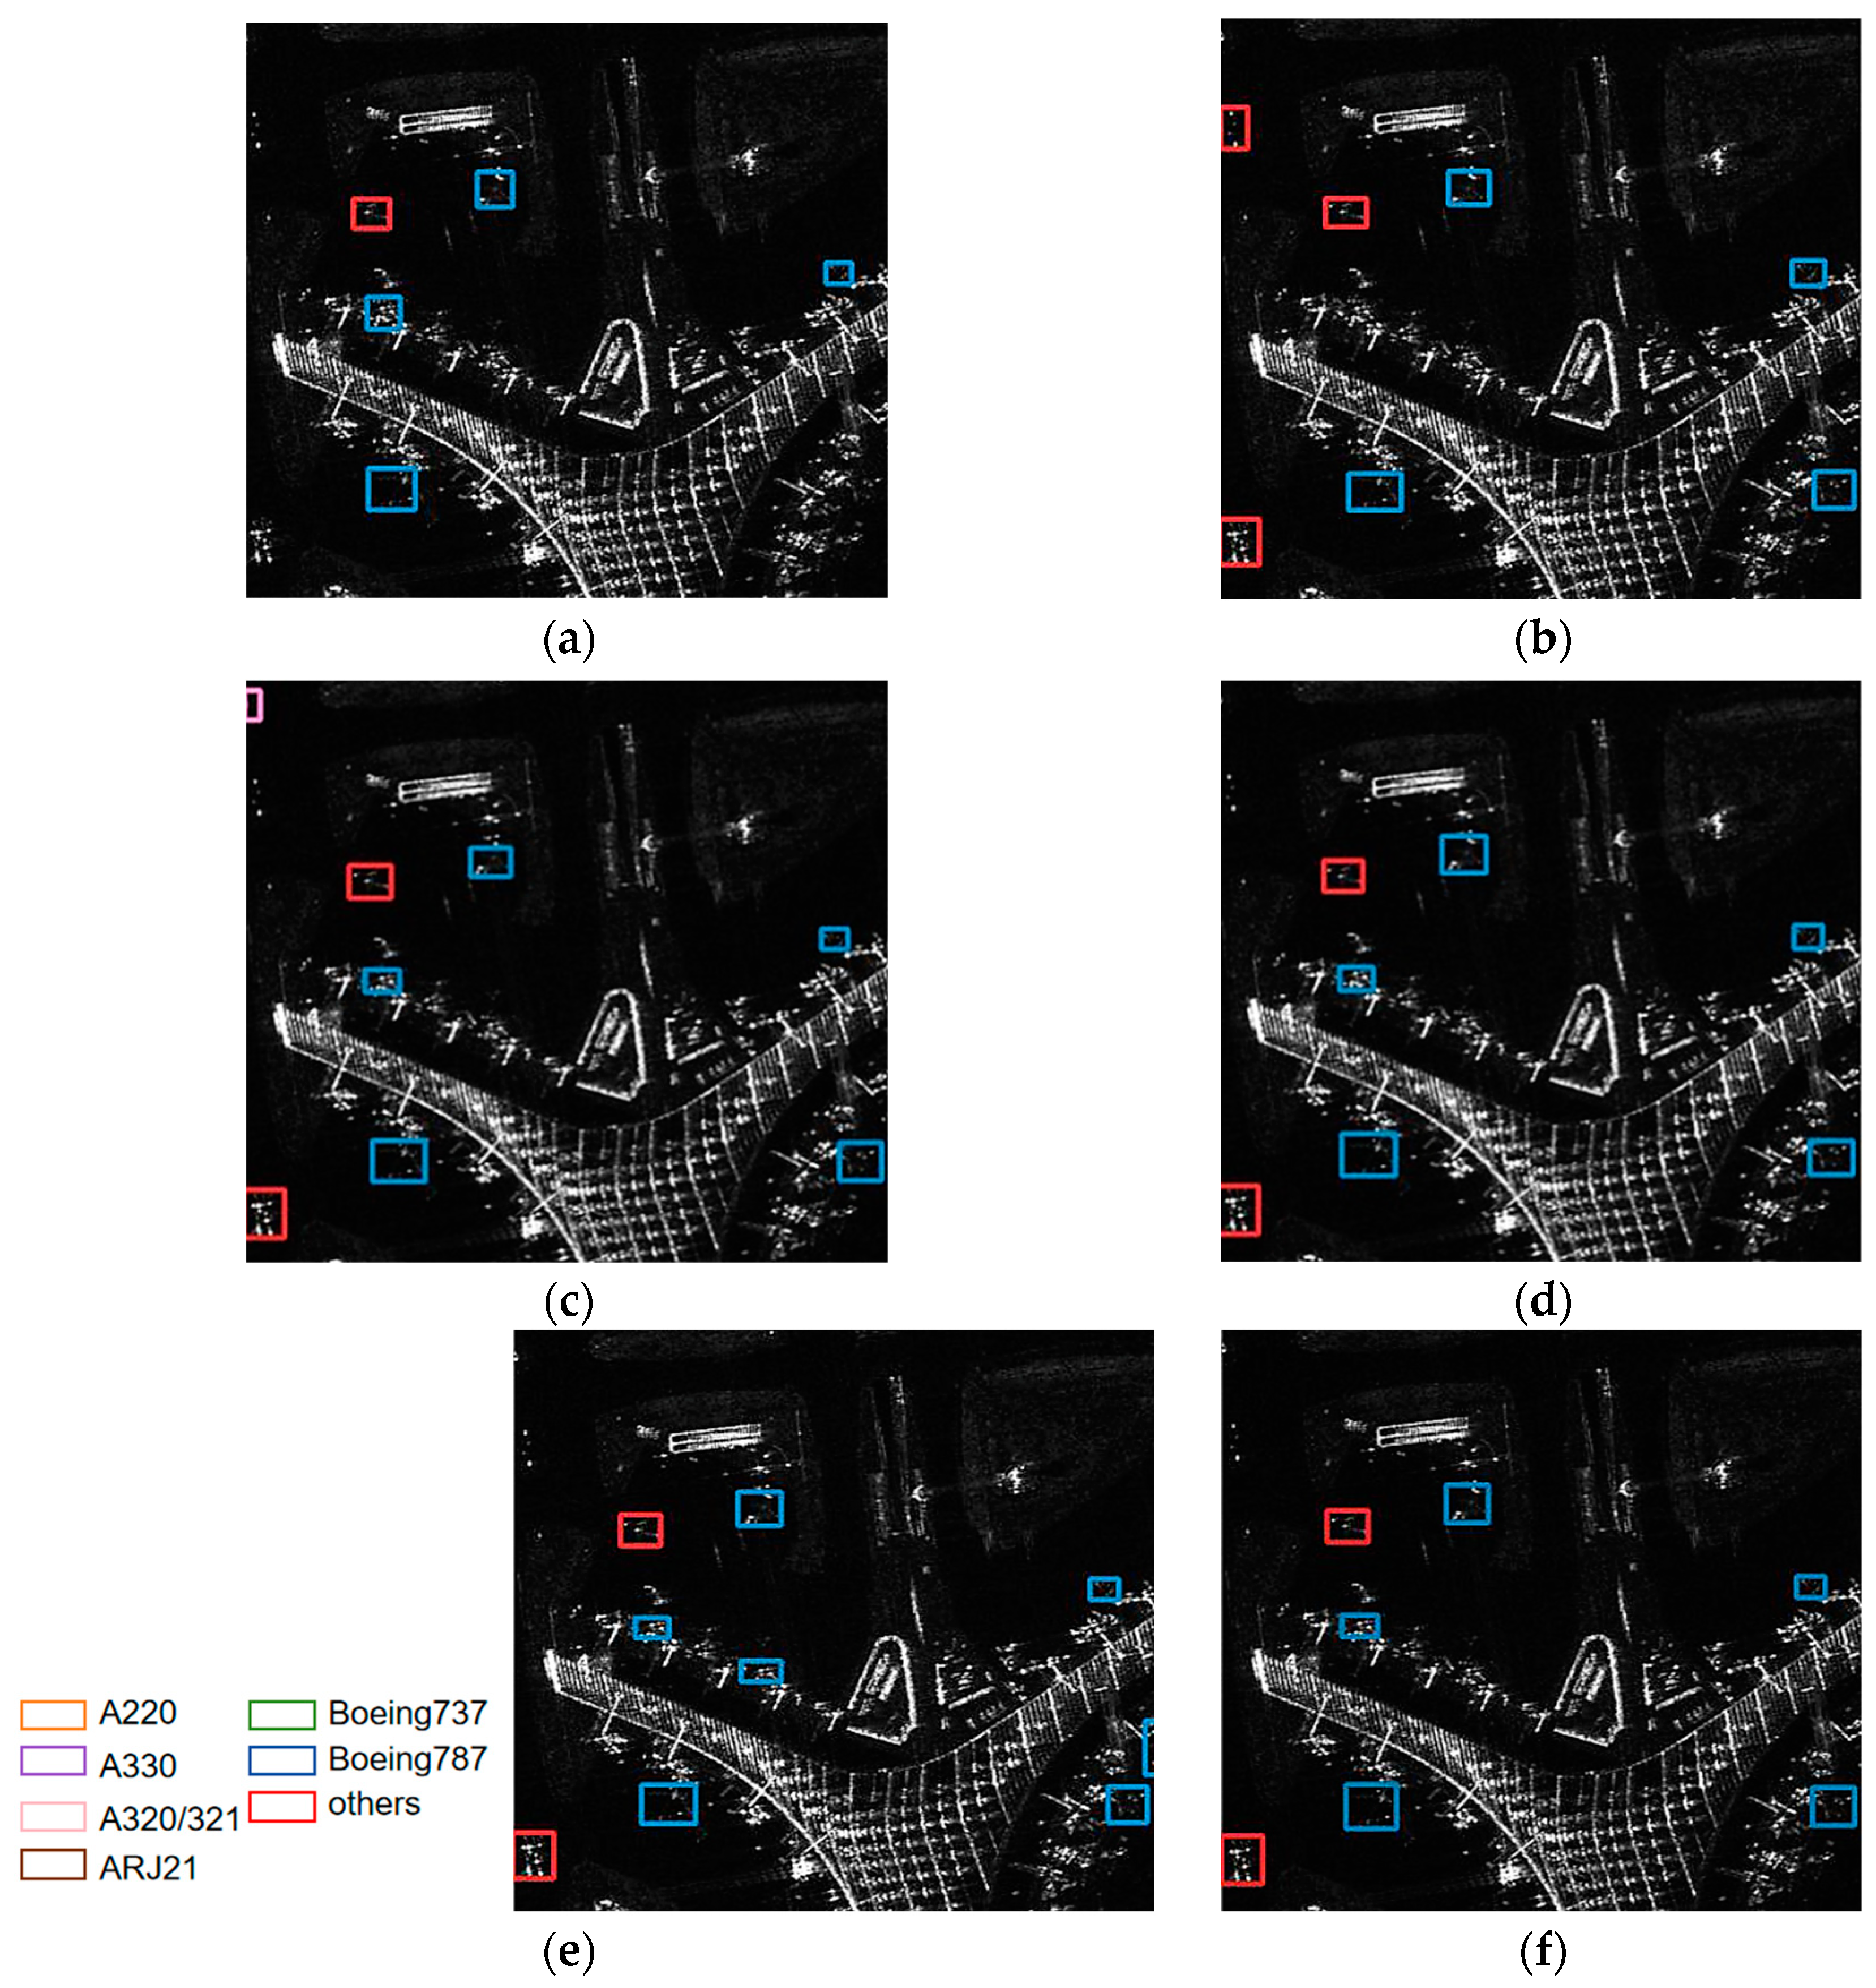
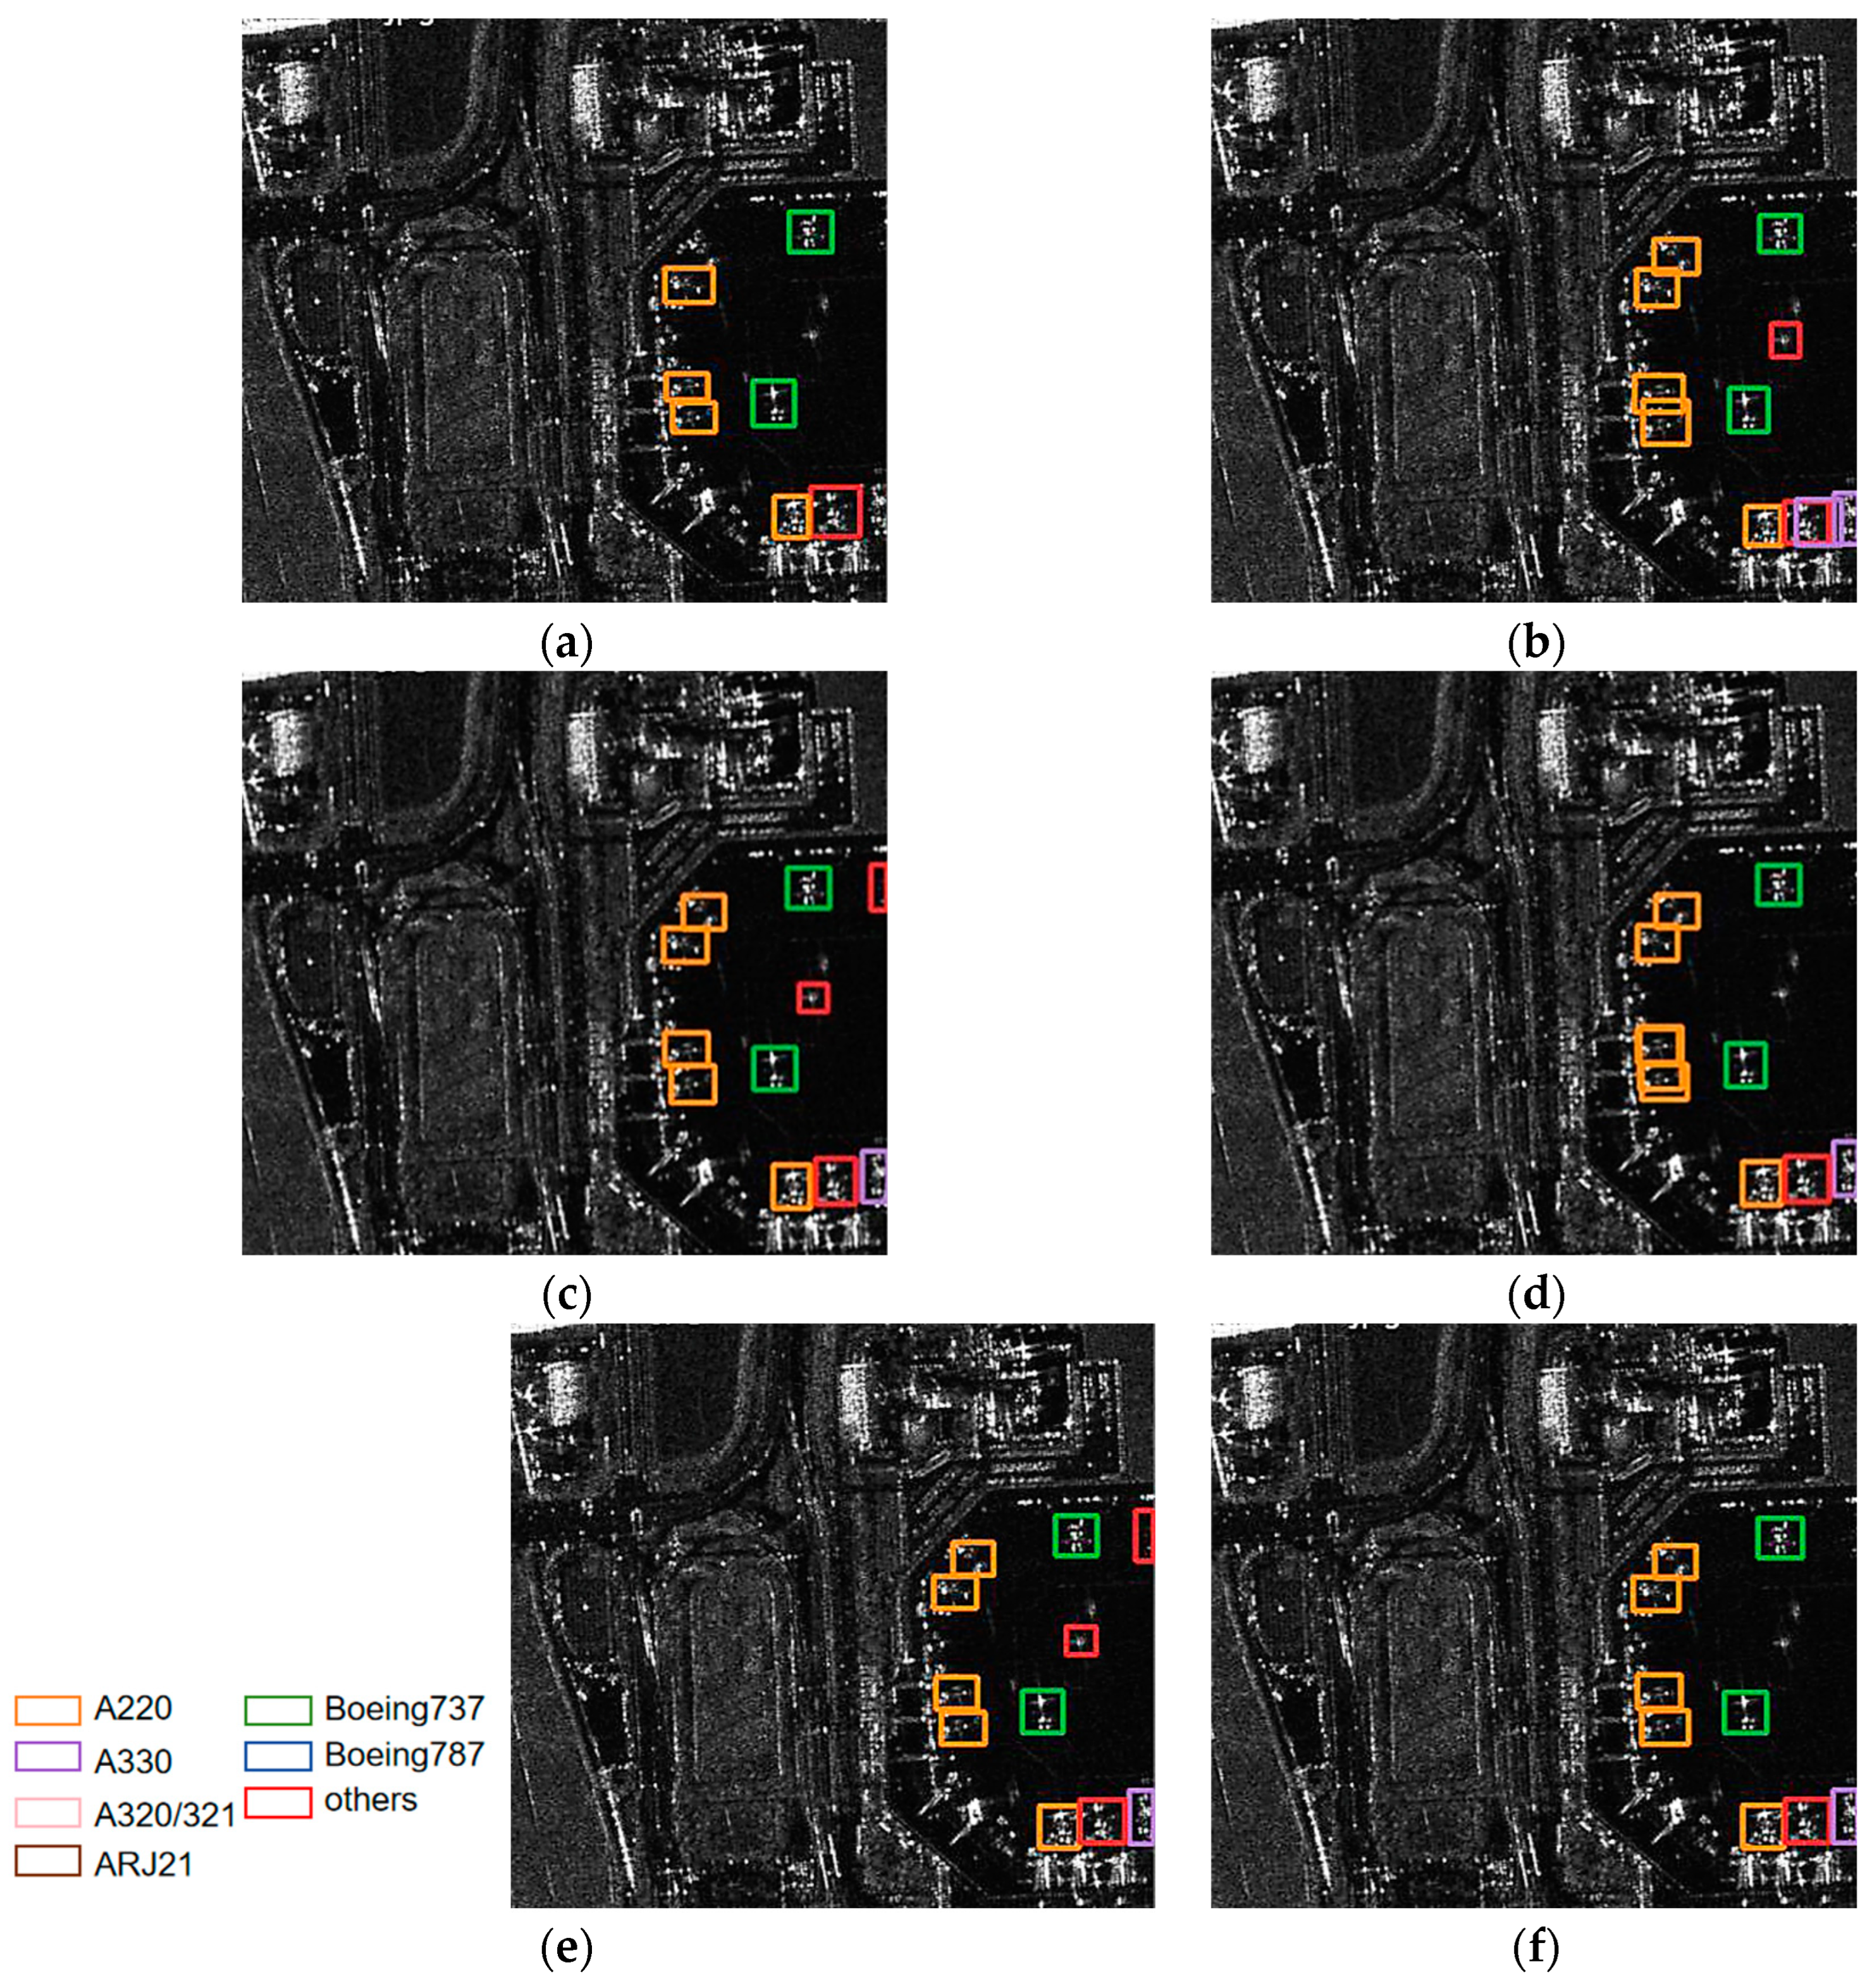
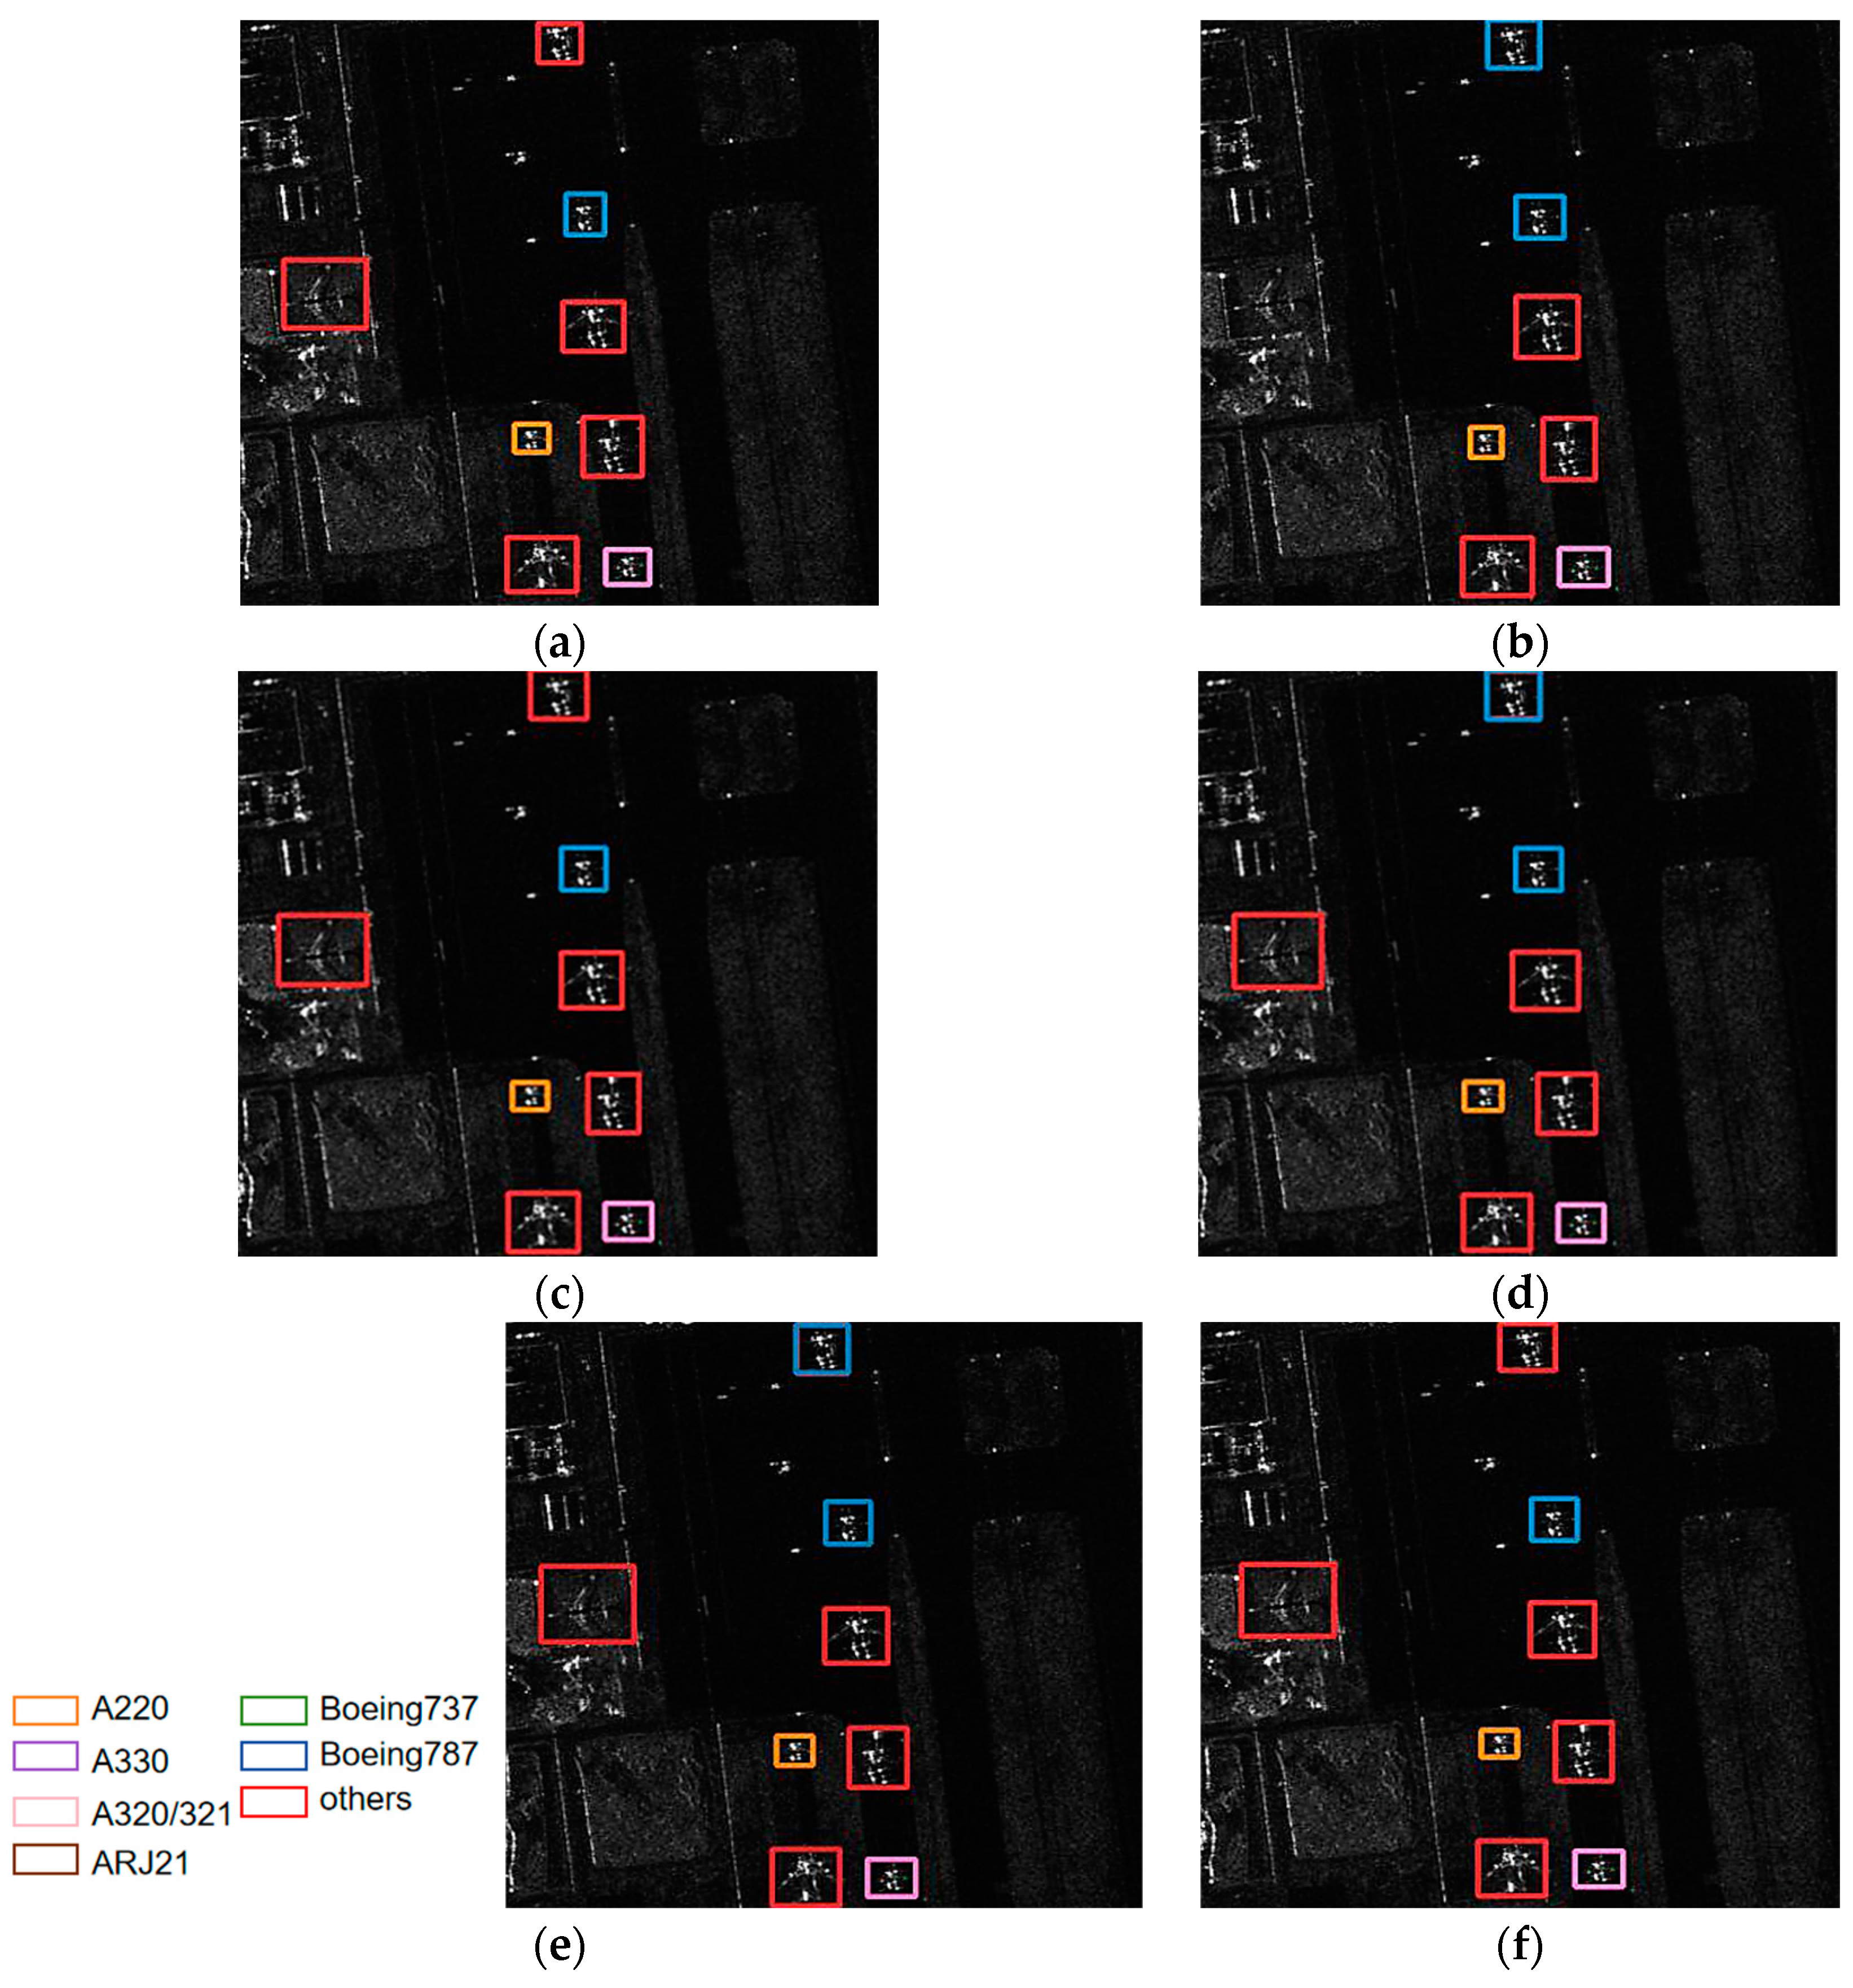
3.4.3. Analysis of Aircraft Identification Results

In this paper, the aircraft identification results for different networks are represented by orange, pink, purple, brown, green, blue and red boxes for A220, A320/321, A330, ARJ21, Boeing 737, Boeing 787, and others, respectively.
Figure 8a shows the scene containing four Boeing 787 aircraft and one aircraft from the others category. The scene is obviously complex, and there are a lot of strong scattering bright spots, which may cause great challenges to aircraft identification. As shown in Figure 8b, there are two false alarms for the category of others for YOLOv5s. Figure 8c shows three false alarms in the YOLOv7 results, one in the other aircraft category, one Boeing 737 and one A330. Figure 8e shows that there are four alarms in the EBPA2N results, of which there is only one in the others category and three Boeings 737. Figure 8d,f show the results of MGCAN and EBMA-Net, in which there are two false alarms, one in the others category and the other is a Boeing 737. Compared with other networks, EBMA-Net shows better generalization ability, and is more capable of identifying the effective features of the aircraft.
Figure 9a shows the ground truth of the aircraft, which contains examples of mainly A220, Boeing 737 and some from the others category. The aircraft are relatively densely distributed on the lower right side of the image. The airport scene is obviously complex, and the buildings and metals around the airplanes seem to have similar textures to the airplanes, which may easily produce false alarms. In Figure 9b, for the YOLOv5s network, there are three false alarms and two wrong identifications. According to Figure 9c,e, for the results of the MGCAN and YOLOv7, there are four false alarms, but no missed detection or false identifications. For EBPA2N (Figure 9d), there are three false alarms, while for EBMA-Net (Figure 9f), there are only two false alarms but no missed detections. It shows that the addition of the EMCA and SECA modules in EBMA-Net enhances the ability to capture the scattering characteristics for different categories of aircraft. Therefore, its identification performance surpasses that of YOLOv5s, MGCAN, and YOLOv7 networks significantly.
Figure 10a shows the ground truth of the aircraft, containing four categories of aircraft, Boeing 787, other, A220 and A330. As a whole, this scene is obviously clean, and the aircraft scattering characteristics are obvious, so it is easy to identify the aircraft. However, one aircraft of other category on the left of the image is undetected in the YOLOv5s network (Figure 10b), which shows the weak robustness of YOLOv5s network. In addition, it is clear that the scattering characteristics of the other category and Boeing 787 appear extremely similar. Therefore, as shown in Figure 10d,e for MGCAN and EBPA2N networks, one aircraft of the other category is identified as Boeing 787. According to the identification results, in Figure 10c,f, YOLOv7 and EBMA-Net both identify all the aircraft correctly. It shows that the EMCA and SECA modules incorporated into the EBMA-Net have good feature learning capability.
In the scene of Figure 11a, five types of aircraft are shown: Boeing 737, other, A220, A320/321 and ARJ21, and there are 11 aircraft. The distribution of the different categories of aircraft is relatively dense; the scene at the airport is complex. Additionally, the mechanical and metal equipment surrounding the aircraft appears to exhibit scattering points similar to those of the aircraft itself, which creates a great challenge for aircraft identification. The top of the image in Figure 11b misses the detection of ARJ21, and there are two false alarms of one A220 aircraft and one other category aircraft in the middle part of the image. In Figure 11c, the aircraft at the top of the image is incorrectly identified as ARJ21, and there are also two false alarms in the middle part of the image, which also appear in the results of EBPA2N (Figure 11e). However, for MGCAN and EBMA-Net, the identification of aircraft is much better, with only one false alarm (A220) produced. It shows that the EBMA-Net has good generalization ability.

3.4.4. Performance Evaluation of Aircraft Identification

To facilitate a more intuitive comparison of aircraft recognition performance, Table 2 shows the indexes of different networks in 541 images with size of 512 × 512 pixels, which include 1258 aircraft in total. Among them, the numbers of aircraft of different types are 228, 329, 178, 89, 73, 19 and 342 for Boeing 787, A220, Boeing 737, A320/321, ARJ21, A330 and others, respectively. The performance metrics are mainly the identification P, the R, the MD) and the FAR. According to Table 2, it can be intuitively found that the YOLOv5s network identifies all kinds of aircraft with an average precision of 94.9% (as Figure 12a shows), but its recall rate is only 96.6% (as Figure 13a shows), which is lower than the other three networks, except EBPA2N. Although the average precision of YOLOv7 is only 91.9% (as Figure 12b shows), its recall rate is 98.2% (as Figure 13b shows). Compared with YOLOv5s, it has more false alarms and fewer missed detections. For MGCAN, the P and R are 94.1% (as Figure 12c shows) and 97.4% (as Figure 13c shows), respectively, which represents a slightly higher missed detection rate but a better performance in false detections compared with YOLOv7. The P and R of EBPA2N are 95.5% (as Figure 12d shows) and 96.5% (as Figure 13d shows), with fewer false alarms compared with MGCAN, but more aircraft were not detected. On the whole, the performance of both MGCAN and EBPA2N networks is improved compared to the YOLOv5s and YOLOv7 networks. For the EBMA-Net proposed in this paper, the P and R achieved 95.6% (as Figure 12e shown) and 98.4% (as Figure 13e shown), which showed a clear outperformance compared to the other networks and a 3.7% improvement in precision compared to YOLOv7. In addition, its false alarm and missed detections are both the lowest compared with other networks, which verify the learning capability of the deep features of aircraft by the EBMA-Net. At the same time, by comparing the five confusion matrix plots in Figure 14, it can be seen that Figure 14e shows fewer false detection rates and missed detection rates when detecting various types of aircraft targets, reflecting the higher accuracy of EBMA-Net.
The primary focus of this paper in designing and developing detection and recognition neural networks is to balance detection and recognition accuracy, as deep neural networks that achieve high accuracy often require significant computational effort. The computational intensity of the YOLOv7 network is inherently more complex. The main reason why the paper combines YOLOv7 with SAR image analysis is to realize a deep neural network. The proposed EMCA module aims to effectively learn multiscale spatial information to accurately capture small aircraft target features. Additionally, it addresses the correlation between the discrete features of the aircraft in a larger and more complex scene. Subsequently, a dual-channel attention mechanism, referred to as the SECA module, is introduced to adaptively learn the significant features of an airplane. Experimental results based on Gaofen-3’s SAR aircraft data demonstrate that the proposed EBMA-Net exhibits superior detection and identification performance compared to YOLOv5s, YOLOv7, MGCAN, and EBPA2N.

4. Conclusions

To detect and identify aircraft with high-precision from SAR images quickly, robustly and automatically, EBMA-Net is proposed in this paper. It solves the problems of large differences in the scale and position of different types of aircraft, complex scattering noise interference and background, and similar scattering characteristics. In EBMA-Net, two innovative modules, namely the EMCA module and the SECA module, are proposed to capture the relationship between aircraft backscattering features, to effectively integrate the multiscale information of aircraft, learn similar scattering characteristics of different types of aircraft targets, and greatly improve the detection and recognition accuracy. Experiments based on the high-resolution SAR aircraft public dataset indicate that the proposed EBMA-Net has outstanding performance, compared with other excellent networks. It can extract the multiscale features of aircraft and better suppress the interference from a complex background with better robustness and generalization. Furthermore, the network can be applied to detect and identify other small targets in SAR images.

Author Contributions

Conceptualization, J.W. and G.L.; methodology, J.W.; software, G.L. and J.L.; validation, J.W., G.L. and W.D.; formal analysis, W.S. and W.D.; writing—original draft preparation, J.W. and G.L.; writing—review and editing, J.W., G.L. and J.L. All authors have read and agreed to the published version of the manuscript.

Funding

This work was supported by the Natural Science Foundation of China (61901358), the Outstanding Youth Science Fund of Xi’an University of Science and Technology (2020YQ3-09), the China Postdoctoral Science Foundation (2020M673347).

Data Availability Statement

The original contributions presented in the study are included in the article, further inquiries can be directed to the corresponding author.

Acknowledgments

The authors would like to thank the reviewers and the editor for their constructive comments.

Conflicts of Interest

The authors declare no conflicts of interest.

References

  1. Zhang, C. Principles, System Analysis and Application of Integrated Aperture Radar; Science Press: Beijing, China, 1989. [Google Scholar]
  2. Dong, G. Research on SAR Image Target Recognition Technology Based on Single Acting Signal. Ph.D. Thesis, National University of Defense Technology, Qinhuangdao, China, 2016. [Google Scholar]
  3. Yang, W.; Xu, X.; Sun, H. Discussion on the interpretation technology of synthetic aperture radar image. Space Electron. Technol. 2004, 1, 9. [Google Scholar]
  4. Chen, L.; Li, Z.; Song, C.; Xing, J.; Cai, X.; Fang, Z.; Luo, R.; Li, Z. Automatic detection of earthquake triggered landslides using Sentinel-1 SAR imagery based on deep learning. Int. J. Digit. Earth 2024, 17, 2393261. [Google Scholar] [CrossRef]
  5. Li, C. Deep Learning-Based Aircraft Target Detection and Recognition for SAR Images. Ph.D. Thesis, National University of Defense Technology, Qinhuangdao, China, 2019. [Google Scholar]
  6. Chen, L.; Cai, X.; Li, Z.; Xing, J.; Ai, J. Where is my attention? An explainable AI exploration in water detection from SAR imagery. Int. J. Appl. Earth Obs. Geoinf. 2024, 130, 103878. [Google Scholar] [CrossRef]
  7. Pan, B.; Tai, J.; Zheng, Q.; Zhao, S. Cascade convolutional neural network based on transfer-learning for aircraft detection on high-resolution remote sensing images. J. Sens. 2017, 2017, 1796728. [Google Scholar] [CrossRef]
  8. Chen, L.; Cai, X.; Xing, J.; Li, Z.; Zhu, W.; Yuan, Z.; Fang, Z. Towards transparent deep learning for surface water detection from SAR imagery. Int. J. Appl. Earth Obs. Geoinf. 2023, 118, 103287. [Google Scholar] [CrossRef]
  9. Fu, J. Research on Aircraft Target Recognition from Remote Sensing Images Based on Feature Fusion. Ph.D. Thesis, Nanchang Aviation University, Nanchang, China, 2014. [Google Scholar]
  10. Gagliardi, R.; Reed, I.S. Adaptive Multiple-Band CFAR (Constant-False-Alarm-Rate) Detection of an Optical Pattern with Unknown Spectral Distribution; Report; Department of Electrical Engineering, University of Southern California: Los Angeles, CA, USA, 1989. [Google Scholar]
  11. Pan, Z.; Liu, L.; Qiu, X.; Lei, B. Fast Vessel Detection in Gaofen-3 SAR Images with Ultrafine Strip-Map Mode. Sensors 2017, 17, 1578. [Google Scholar] [CrossRef]
  12. Guo, Q.; Wang, H.; Xu, F. Aircraft target detection from satellite-borne synthetic aperture radar images. Shanghai Aerosp. 2018, 35, 57–64. [Google Scholar]
  13. Olson, C.F.; Huttenlocher, D.P. Automatic target recognition by matching oriented edge pixels. IEEE Trans. Image Process 1997, 6, 103–113. [Google Scholar] [CrossRef] [PubMed]
  14. Pan, J.; Niu, Z.; Chen, Z. Aircraft Target Identification Method for SAR Images Based on Peak Matching. Mod. Electron. Technol. 2015, 38, 19–23. [Google Scholar] [CrossRef]
  15. Guo, Q.; Wang, H.; Xu, F. Advances in aircraft target detection and identification from SAR images. Radar J. 2020, 9, 497–513. [Google Scholar]
  16. Tan, Y.; Li, Q.; Li, Y.; Tian, J. Aircraft Detection in High-Resolution SAR Images Based on a Gradient Textural Saliency Map. Sensors 2015, 15, 23071–23094. [Google Scholar] [CrossRef] [PubMed]
  17. Liu, J.; Meng, W. Research review on single-stage target detection algorithm based on deep learning. Air Armament 2020, 27, 44–53. [Google Scholar]
  18. Girshick, R.; Donahue, J.; Darrell, T.; Malik, J. Rich feature hierarchies for accurate object detection and semantic segmentation. In Proceedings of the IEEE Conference on Computer Vision and Pattern Recognition, Columbus, OH, USA, 23–28 June 2014; pp. 580–587. [Google Scholar]
  19. Li, C.; Zhao, L.; Kuang, G. A Two-stage Airport Detection Model for Large Scale SAR Images Based on Faster R-CNN. In Proceedings of the Eleventh International Conference on Digital Image Processing (ICDIP 2019), Guangzhou, China, 10–13 May 2019; pp. 515–525. [Google Scholar]
  20. Zhang, L.; Li, C.; Zhao, L.; Xiong, B.; Quan, S.; Kuang, G. A cascaded three-look network for aircraft detection in SAR images. Remote Sens. Lett. 2020, 11, 57–65. [Google Scholar] [CrossRef]
  21. Yang, Y.; Zhuang, Y.; Bi, F.; Shi, H.; Xie, Y. M-FCN: Effective fully convolutional network-based airplane detection framework. IEEE Geosci. Remote Sens. Lett. 2017, 14, 1293–1297. [Google Scholar] [CrossRef]
  22. Liu, W.; Anguelov, D.; Erhan, D.; Szegedy, C.; Reed, S.; Fu, C.Y.; Berg, A.C. SSD: Single shot multibox detector. In European Conference on Computer Vision; Springer: Cham, Switzerland, 2016; pp. 21–37. [Google Scholar]
  23. Lin, T.; Goyal, P.; Girshick, R.; He, K.; Dollár, P. Focal Loss for Dense Object Detection. IEEE Trans. Pattern Anal. Mach. Intell. 2017, 2999–3007. [Google Scholar]
  24. Redmon, J.; Divvala, S.; Girshick, R.; Farhadi, A. You only look once: Unified, real-time object detection. In Proceedings of the IEEE Conference on Computer Vision and Pattern Recognition, Las Vegas, NV, USA, 27–30 June 2016; pp. 779–788. [Google Scholar]
  25. Redmon, J.; Farhadi, A. YOLO9000: Better, Faster, Stronger. In Proceedings of the 2017 IEEE Conference on Computer Vision and Pattern Recognition (CVPR), Honolulu, HI, USA, 21–26 July 2017; pp. 6517–6525. [Google Scholar]
  26. Redmon, J.; Farhadi, A. YOLOv3: An Incremental Improvement. arXiv 2018, arXiv:1804.02767. [Google Scholar]
  27. Bochkovskiy, A.; Wang, C.Y. YOLOv4: Optimal Speed and Accuracy of Object Detection. arXiv 2020, arXiv:2004.10934v1. [Google Scholar]
  28. Wang, C.; Bochkovskiy, A.; Liao, H. Scaled-YOLOv4: Scaling Cross Stage Partial Network. In Proceedings of the IEEE/CVF Conference on Computer Vision and Pattern Recognition, Nashville, TN, USA, 19–25 June 2021; pp. 13029–13038. [Google Scholar]
  29. Ultralytics. YOLOv5. Available online: https://github.com/ultralytics/yolov5 (accessed on 18 May 2024).
  30. Chen, L.; Luo, R.; Xing, J.; Li, Z.; Xing, X.; Yuan, Z.; Tan, S.; Cai, X. Geospatial transformer is what you need for aircraft detection in SAR Imagery. IEEE Trans. Geosci. Remote Sens. 2022, 60, 5225715. [Google Scholar] [CrossRef]
  31. Luo, R.; Chen, L.; Xing, J.; Yuan, Z.; Tan, S.; Cai, X.; Wang, J. A Fast Aircraft Detection Method for SAR Images Based on Efficient Bidirectional Path Aggregated Attention Network. Remote Sens. 2021, 13, 2940. [Google Scholar] [CrossRef]
  32. Nie, Y.; Bian, C.; Li, L.; Chen, H.; Chen, S. LFC-SSD: Multiscale aircraft detection based on local feature correlation. IEEE Geosci. Remote Sens. Lett. 2022, 19, 6510505. [Google Scholar] [CrossRef]
  33. Wang, C.; Bochkovskiy, A.; Liao, H. YOLOv7: Trainable bag-of-freebies sets new state-of-the-art for real-time object detectors. In Proceedings of the IEEE/CVF Conference on Computer Vision and Pattern Recognition, Vancouver, BC, Canada, 17–24 June 2023; pp. 7464–7475. [Google Scholar]
  34. He, K.; Zhang, X.; Ren, S.; Sun, J. Spatial pyramid pooling in deep convolutional networks for visual recognition. IEEE Trans. Pattern Anal. Mach. Intell. 2015, 37, 1904–1916. [Google Scholar] [CrossRef] [PubMed]
  35. Chen, L.; Weng, T.; Xing, J.; Li, Z.; Yuan, Z.; Pan, Z.; Tan, S.; Luo, R. Employing deep learning for automatic river bridge detection from SAR images based on adaptively effective feature fusion. Int. J. Appl. Earth Obs. Geoinf. 2021, 102, 102245. [Google Scholar] [CrossRef]
  36. Hu, J.; Shen, L.; Sun, G. Squeeze-and-Excitation Networks. In Proceedings of the 2018 IEEE/CVF Conference on Computer Vision and Pattern Recognition, Salt Lake City, UT, USA, 18–22 June 2018; pp. 7132–7141. [Google Scholar] [CrossRef]
  37. Wang, Q.; Wu, B.; Zhu, P.; Li, P.; Zuo, W.; Hu, Q. ECA-Net: Efficient Channel Attention for Deep Convolutional Neural Networks. In Proceedings of the 2020 IEEE/CVF Conference on Computer Vision and Pattern Recognition (CVPR), Seattle, WA, USA, 14–19 June 2020; pp. 11531–11539. [Google Scholar] [CrossRef]
  38. Srinivas, A.; Lin, T.Y.; Parmar, N.; Shlens, J.; Abbeel, P.; Vaswani, A. Bottleneck transformers for visual recognition. In Proceedings of the IEEE/CVF Conference on Computer Vision and Pattern Recognition, Virtual, 19–25 June 2021; pp. 16519–16529. [Google Scholar]
  39. Wang, Z.; Kang, Y.; Zeng, X.; Wang, Y.; Zhang, T.; Sun, X. SAR-AIRcraft-1.0: A high-resolution SAR aircraft detection and identification dataset. Radar J. 2023, 12, 906–922. [Google Scholar]
Figure 1. The overall framework of EBMA-Net.
Remotesensing 16 03177 g001aRemotesensing 16 03177 g001b
Figure 2. ECBT dual-attention mechanism.
Remotesensing 16 03177 g002
Figure 3. Squeeze efficient channel attention.
Remotesensing 16 03177 g003
Figure 4. Diagram of aircraft test results. (a) The ground truth of the aircraft, (bf) the detection results of YOLOv5s, YOLOv7, MGCAN, EBPA2N, and EBMA-Net on aircraft, respectively. The green boxes, yellow boxes and red boxes denote correct detection, missed detection and false alarms, respectively.
Remotesensing 16 03177 g004aRemotesensing 16 03177 g004b
Figure 5. The precision curves: (a) the precision curve of YOLOv5s; (b) the precision curve of YOLOv7; (c) the precision curve of MGCAN; (d) the precision curve of EBPA2N; (e) the precision curve of EBMA-Net.
Remotesensing 16 03177 g005aRemotesensing 16 03177 g005b
Figure 6. The recall curves: (a) the recall curve of YOLOv5s; (b) the recall curve of YOLOv7; (c) the recall curve of MGCAN; (d) the recall curve of EBPA2N; (e) the recall curve of EBMA-Net.
Remotesensing 16 03177 g006aRemotesensing 16 03177 g006b
Figure 7. Confusion matrix diagrams for validation: (a) confusion matrix diagram for validation, YOLOv5s; (b) confusion matrix diagram for validation, YOLOv7; (c) confusion matrix diagram for validation, MGCAN; (d) confusion matrix diagram for validation, EBPA2N; (e) confusion matrix diagram for validation, EBMA-Net.
Remotesensing 16 03177 g007aRemotesensing 16 03177 g007b
Figure 8. (a) The ground truth of the aircraft for Scene I, (bf) the identification results of the aircraft for Scene I by YOLOv5s, YOLOv7, MGCAN, EBPA2N and EBMA-Net, respectively.
Remotesensing 16 03177 g008
Figure 9. (a) The ground truth of the aircraft for Scene II, (bf) the identification results of the aircraft for Scene II by YOLOv5s, YOLOv7, MGCAN, EBPA2N and EBMA-Net, respectively.
Remotesensing 16 03177 g009
Figure 10. (a) The ground truth of the aircraft for Scene III, (bf) the identification results of the aircraft for Scene III by YOLOv5s, YOLOv7, MGCAN, EBPA2N and EBMA-Net, respectively.
Remotesensing 16 03177 g010
Figure 11. (a) The ground truth of the aircraft for Scene IV, (bf) the identification results of the aircraft for Scene IIV by YOLOv5s, YOLOv7, MGCAN, EBPA2N and EBMA-Net, respectively.
Remotesensing 16 03177 g011
Figure 12. The precision curves for aircraft identification: (a) the precision curve of YOLOv5s; (b) the precision curve of YOLOv7; (c) the precision curve of MGCAN; (d) the precision curve of EBPA2N; (e) the precision curve of EBMA-Net.
Remotesensing 16 03177 g012
Figure 13. The recall curves for aircraft identification: (a) the recall curve of YOLOv5s; (b) the recall curve of YOLOv7; (c) is the recall curve of MGCAN; (d) the recall curve of EBPA2N; (e) the recall curve of EBMA-Net.
Remotesensing 16 03177 g013aRemotesensing 16 03177 g013b
Figure 14. Confusion matrix diagram for validation of aircraft identification. (a) Confusion matrix diagram for validation, YOLOv5s; (b) confusion matrix diagram for validation, YOLOv7; (c) confusion matrix diagram for validation, MGCAN; (d) confusion matrix diagram for validation, EBPA2N; (e) confusion matrix diagram for validation, EBMA-Net.
Remotesensing 16 03177 g014aRemotesensing 16 03177 g014b
Table 1. Comparison of aircraft detection performance between different networks.
NetworksP (%)R (%)MDR (%)FAR (%)
YOLOv5s84.293.686.3215.8
YOLOv786.7893.786.2213.22
MGCAN86.1293.986.1213.88
EBPA2N87.3193.886.2212.69
EBMA-Net91.3193.886.128.69
Table 2. The performance of different networks for aircraft identification.
NetworksType of AircraftP (%)R (%)MDR (%)FAR (%)
YOLOv5sBoeing 78793.892.57.56.2
A22095.29644.8
Boeing 73791.298.31.78.8
Others94.393.96.15.7
A320/32191.6108.4
ARJ21195.94.10
A33098.4101.6
Mean94.996.63.45.1
YOLOv7Boeing 78793.496.93.16.6
A22091.197.92.18.9
Boeing 73785.91014.1
Others88.397.12.111.7
A320/32190.7109.3
ARJ2195.995.94.14.1
A33098.3101.7
Mean91.998.21.88.1
MGCANBoeing 78793.195.24.86.9
A22093.396.93.16.7
Boeing 73791.799.50.58.3
Others91.89558.2
A320/32190.5109.5
ARJ21195.54.50
A33098.7101.3
Mean94.197.42.65.9
EBPA2NBoeing 78793.893.66.76.2
A22094.895.34.75.2
Boeing 73795.497.22.34.6
Others93.893.96.16.2
A320/32191.799.50.58.3
ARJ2199.895.94.10.2
A33099.2100.8
Mean95.596.53.54.5
EBMA-NetBoeing 78793.897.42.66.2
A22094.897.92.15.2
Boeing 73795.299.80.24.8
Others93.497.43.66.6
A320/32193.3106.7
ARJ21196.53.50
A33099101
Mean95.698.41.64.4
Disclaimer/Publisher’s Note: The statements, opinions and data contained in all publications are solely those of the individual author(s) and contributor(s) and not of MDPI and/or the editor(s). MDPI and/or the editor(s) disclaim responsibility for any injury to people or property resulting from any ideas, methods, instructions or products referred to in the content.

