Article

Ship Lock Extraction from High-Resolution Remote Sensing Images Based on Fuzzy Theory and Prior Knowledge

1
School of Remote Sensing and Information Engineering, Wuhan University, Wuhan 430079, China
2
The National Key Laboratory of Water Disaster Prevention, Nanjing Hydraulic Research Institute, Nanjing 210029, China
*
Author to whom correspondence should be addressed.
These authors contributed equally to this work.
Remote Sens. 2024, 16(17), 3181; https://doi.org/10.3390/rs16173181
Submission received: 18 July 2024 / Revised: 15 August 2024 / Accepted: 27 August 2024 / Published: 28 August 2024

Abstract

:
As crucial water conservancy projects, ship locks play a key role in flood control, shipping, water resource allocation, and promoting regional economic development, making them an indispensable part of the modern water transportation system. Utilizing satellite remote sensing for lock extraction can significantly reduce manual workload and costs, assist in the daily dynamic maintenance of lock hubs, and provide more comprehensive data support for the construction and management of water transport infrastructure. In this context, this paper proposes a new method for ship lock object extraction. Leveraging fuzzy theory and prior knowledge of locks, the extraction of lock objects is achieved from Gaofen-1 (GF-1) high-resolution remote sensing images. The experimental results demonstrate that the proposed algorithm can effectively extract small lock objects in remote sensing images, achieving an average extraction accuracy of 80.9% in the study area.

1. Introduction

In recent years, water conservancy projects have emerged as a focal point of national infrastructure development, playing a pivotal role in flood control, mitigating water scarcity, generating clean energy, and fostering economic progress [1,2,3]. Ship locks, a crucial component of these projects, are routinely employed to navigate the variations in water levels across inland waterways, ensuring smooth passage [4,5]. They possess diverse functionalities, including water level and flow regulation, the enhancement of shipping and economic prosperity, water resource protection, and disaster prevention and mitigation, which hold significant value for waterborne transportation, water resource management, and economic development [6,7]. Leveraging remote sensing technologies for the automatic extraction of ship locks offers a robust scientific foundation for the administrative management of lock navigation services, the assessment of hydro-environmental conditions, and the strategic distribution of watershed resources.
Ship locks are usually composed of upstream and downstream approach channels, lock heads, lock chambers, and gates [8]. These are typical hydraulic structures, generally composed of concrete and metal materials [9,10]. Recently, numerous studies have focused on utilizing remote sensing image recognition to extract hydraulic structures. Chen [11] successfully achieved automated recognition of artificial objects over rivers by employing fuzzy theory and prior knowledge and leveraging the grayscale and geometric characteristics of high-resolution remote sensing images. Tian [12] conducted binarized edge detection of road skeleton lines in remote sensing images and effectively identified bridge edge lines using multiple information sources, including bridge characteristics. Chen et al. [13] proposed a method for extracting overwater bridges from high-resolution optical remote sensing images based on directional enhanced linear structural units and mathematical morphology. Lu et al. [14] developed a bridge recognition model that efficiently extracted bridges in complex scenes by analyzing the topological relationships of bridge regions in remote sensing images. Fu et al. [15] employed the fuzzy threshold method to segment water and land areas and determined bridge boundaries and location parameters based on a prior knowledge model. Xue et al. [16] utilized an improved YOLOv5 convolutional neural network to accurately identify large ground objects such as bridges, dams, and ports in complex environments.
The classification of remote sensing imagery often involves uncertainties, including factors like clouds, shadows, occlusions, and the ambiguity of object boundaries. In this context, the introduction of fuzzy set theory provides us with a mathematical framework to capture the uncertainties related to human cognitive processes, enabling us to obtain more accurate and reasonable classification results for remote sensing imagery. Over the past few decades, abundant different image segmentation algorithms have been proposed [17,18], among which the fuzzy c-means (FCM) algorithm has gained wide application due to its simplicity, easy convergence, unsupervised nature, and ability to preserve more image information [19]. However, FCM is highly sensitive to noise and does not take into account the neighboring pixels and spatial information of the image, leading to higher computational complexity. Therefore, based on FCM, Szilagyi et al. [20] proposed the enhanced fuzzy c-means (EnFCM) algorithm in 2003. By introducing weight factors to balance noise and outliers in the data, as well as optimizing the iterative computation process, EnFCM accelerates the clustering process of grayscale images, enhancing the stability, robustness, and flexibility of the clustering [21,22]. This enhancement makes it more suitable for data analysis and clustering tasks in practical applications.
Most existing studies have focused on relatively regular-shaped hydraulic structures such as bridges and roads, with relatively simple scenes. There is limited research on remote sensing extraction specifically for ship locks. Ship locks often appear as small “V”, “W”, or irregular rectangle shapes in the image, and the recognition process requires a high image resolution [23]. It is challenging to separate them from various other architectural backgrounds in complex scenes. Therefore, this study proposes an automatic extraction method for ship lock targets in high-resolution remote sensing images based on fuzzy theory and prior knowledge.

2. Materials

This study focuses on typical ship locks as experimental subjects and selects portions of the watersheds where these ship locks are located as the research area. In addition to the target ship locks, the study includes various other features. As a crucial component of water conservancy infrastructure, ship locks are responsible for functions such as water transportation and flood control. They play a significant role in ensuring the navigability of waterways across different river basins, supporting urban and rural water supply, and enhancing the ecological environment of these basins.
In this study, we selected GF-1 images as the data source with a resolution of 2 m, including 4 bands of blue, green, red, and near-infrared. The images shown in Figure 1 underwent preprocessing operations such as geometric correction, radiation correction, and pan-sharpening, to ensure the images are more accurate and consistent. The areas where the ship locks are located in the images of each study area are marked by a black rectangle, and enlarged images of these areas are displayed in the lower right corner.
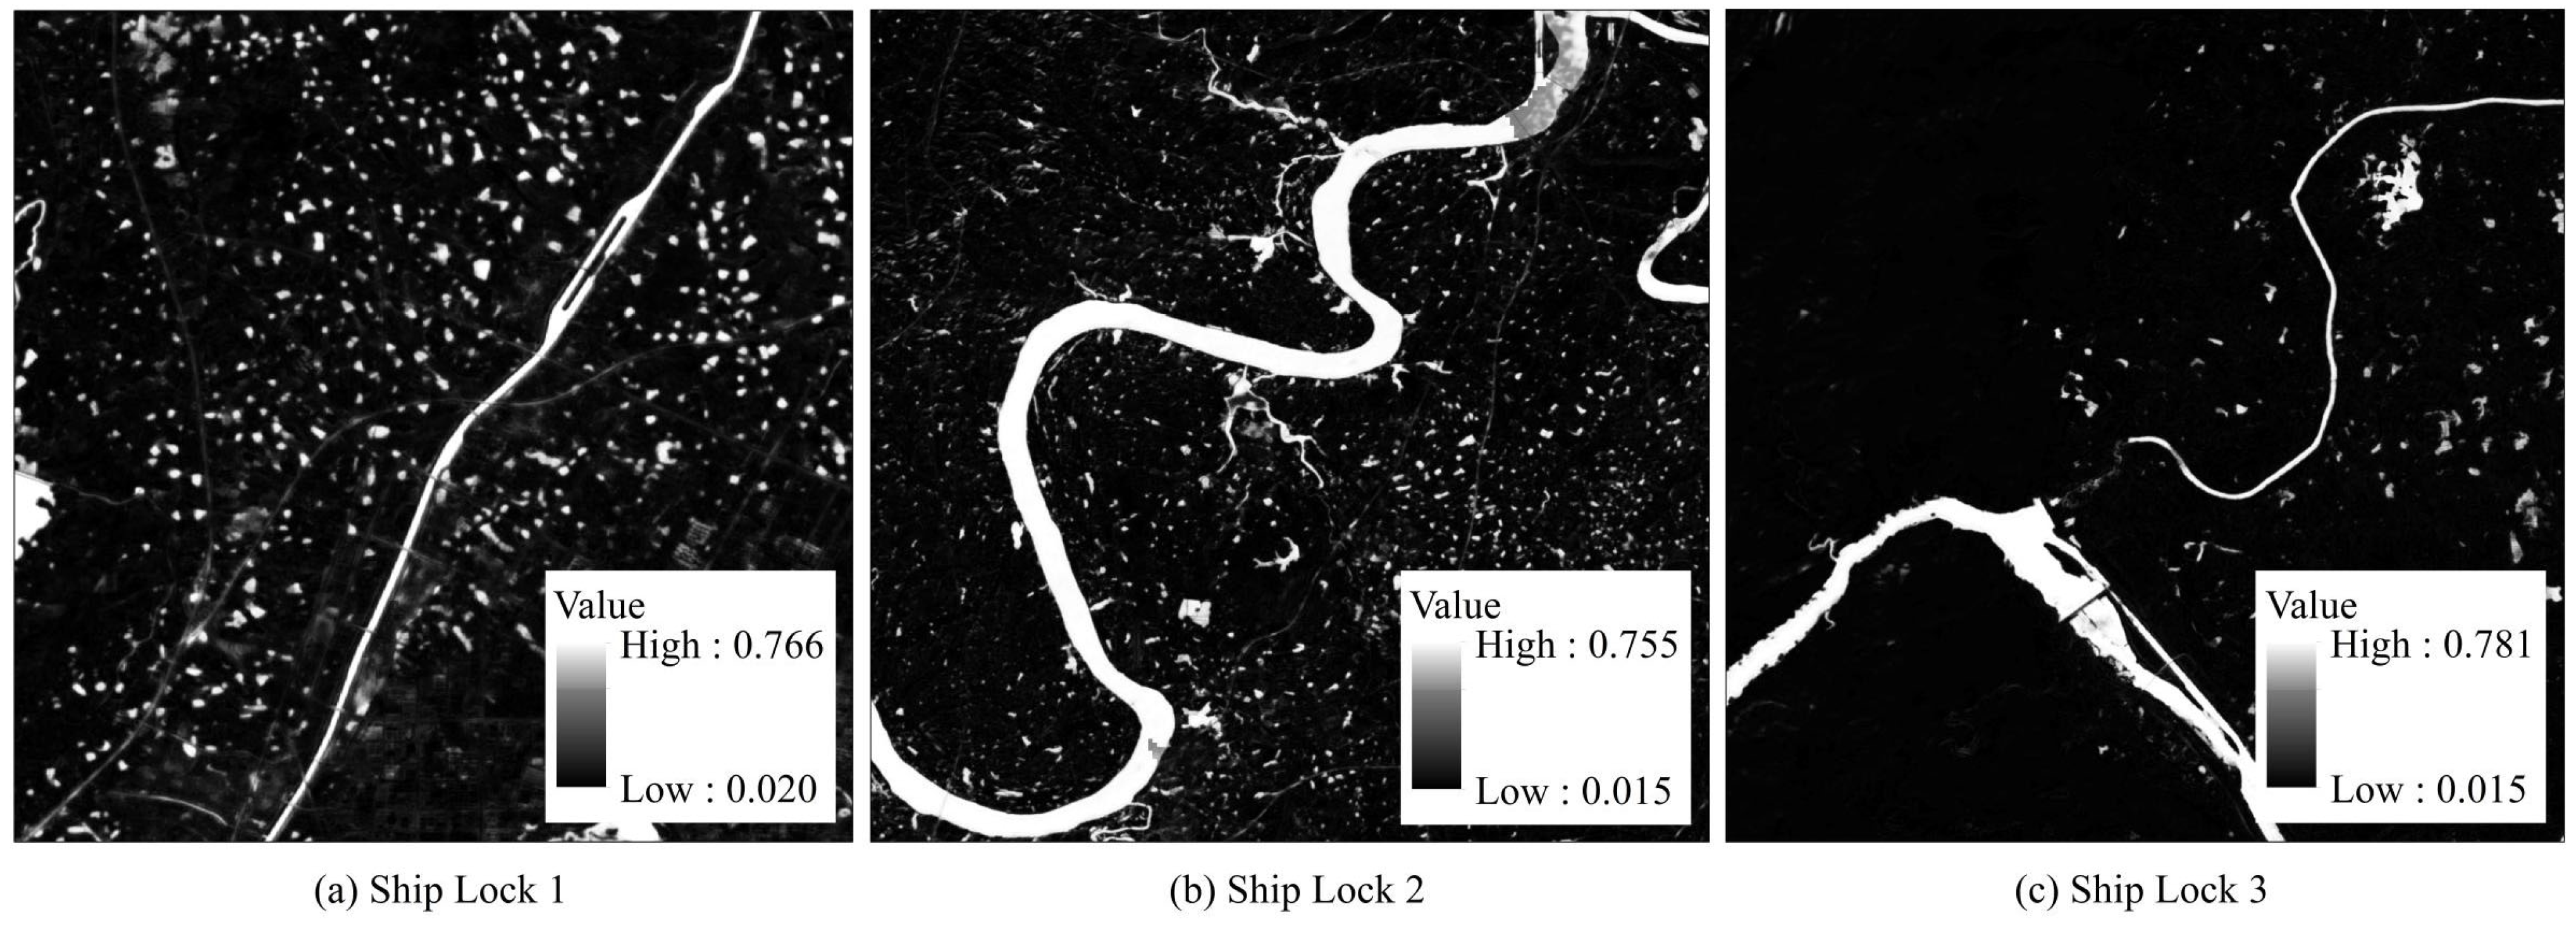
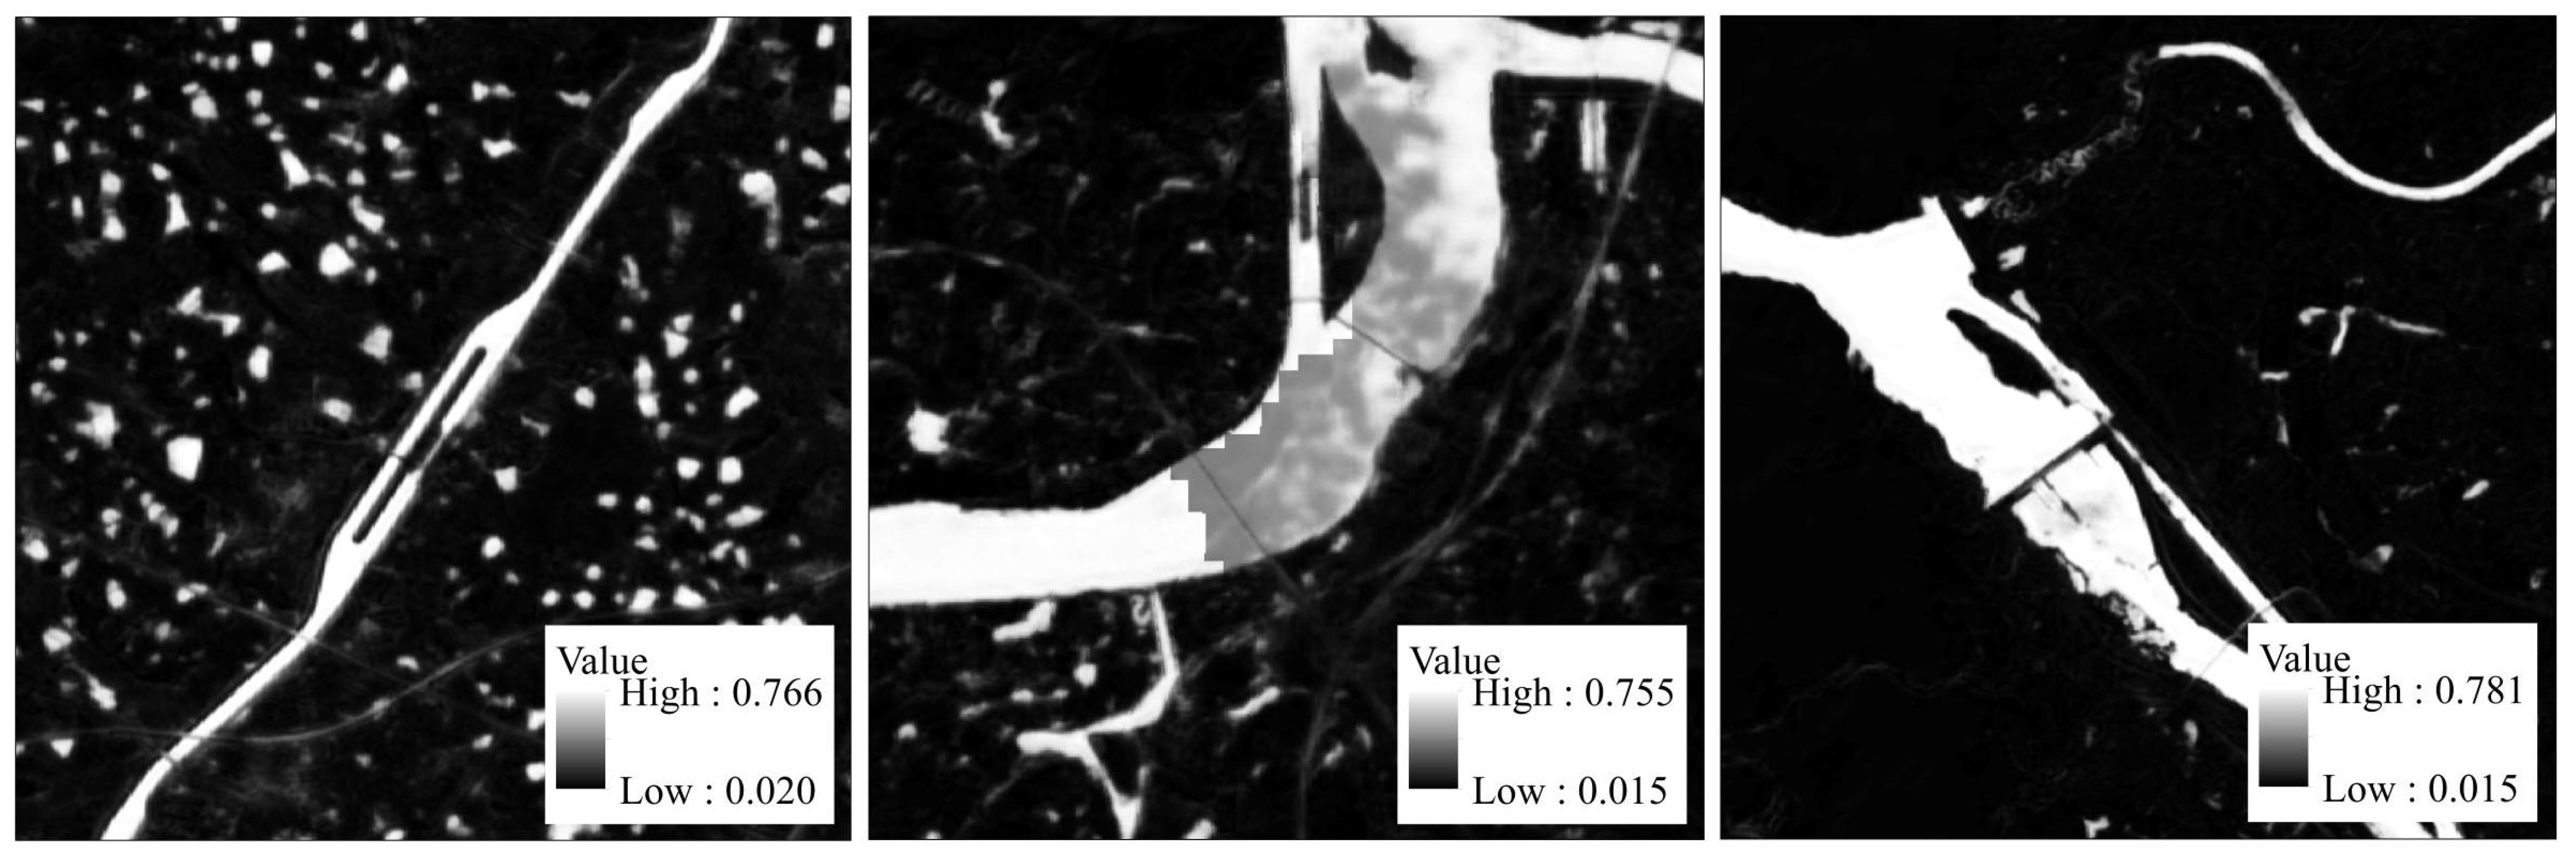
Dynamic World (DW) [24] is a globally consistent, 10 m resolution, near-real-time (NRT) land use and land cover (LULC) dataset generated using deep learning models based on Sentinel-2 images. In this study, water probability data in the DW dataset, shown in Figure 2, were utilized as reference data for the extraction of river channels and ship locks.

3. Methodology

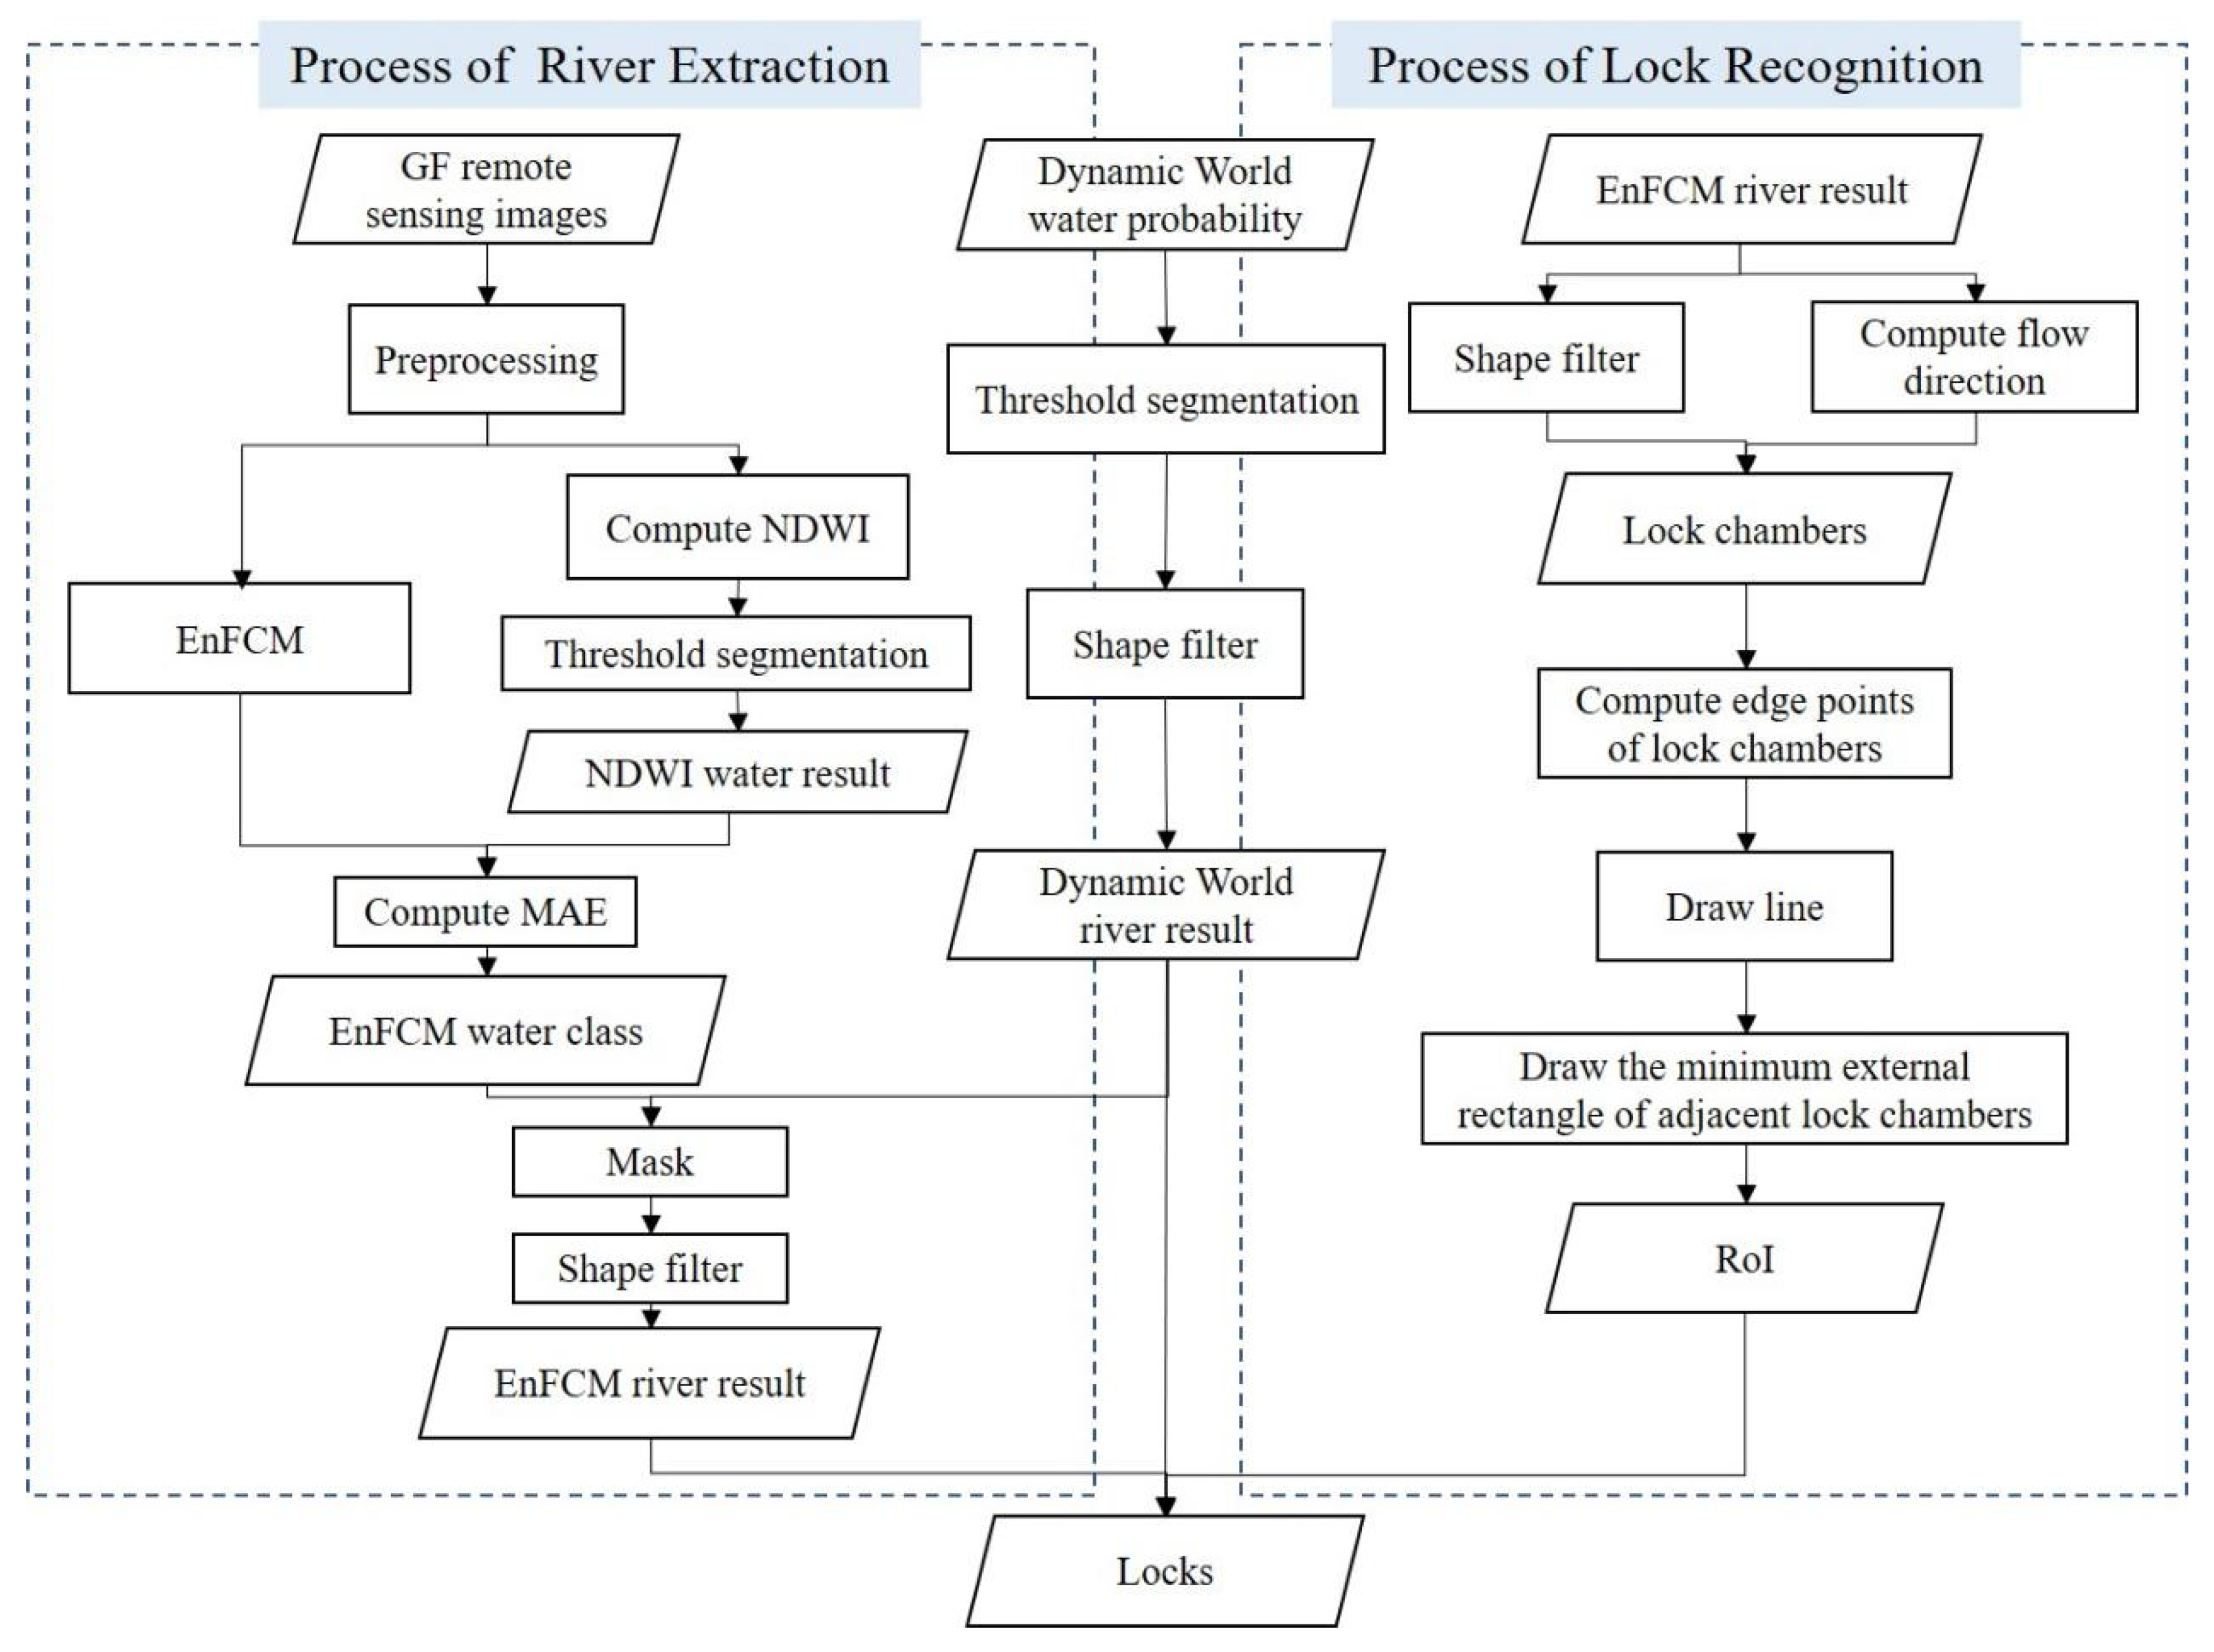
This study divides ship lock extraction into two parts: river region extraction based on fuzzy theory and water probability, and ship lock recognition based on prior knowledge and spectral characteristics. A specific technical flowchart is shown in Figure 3.
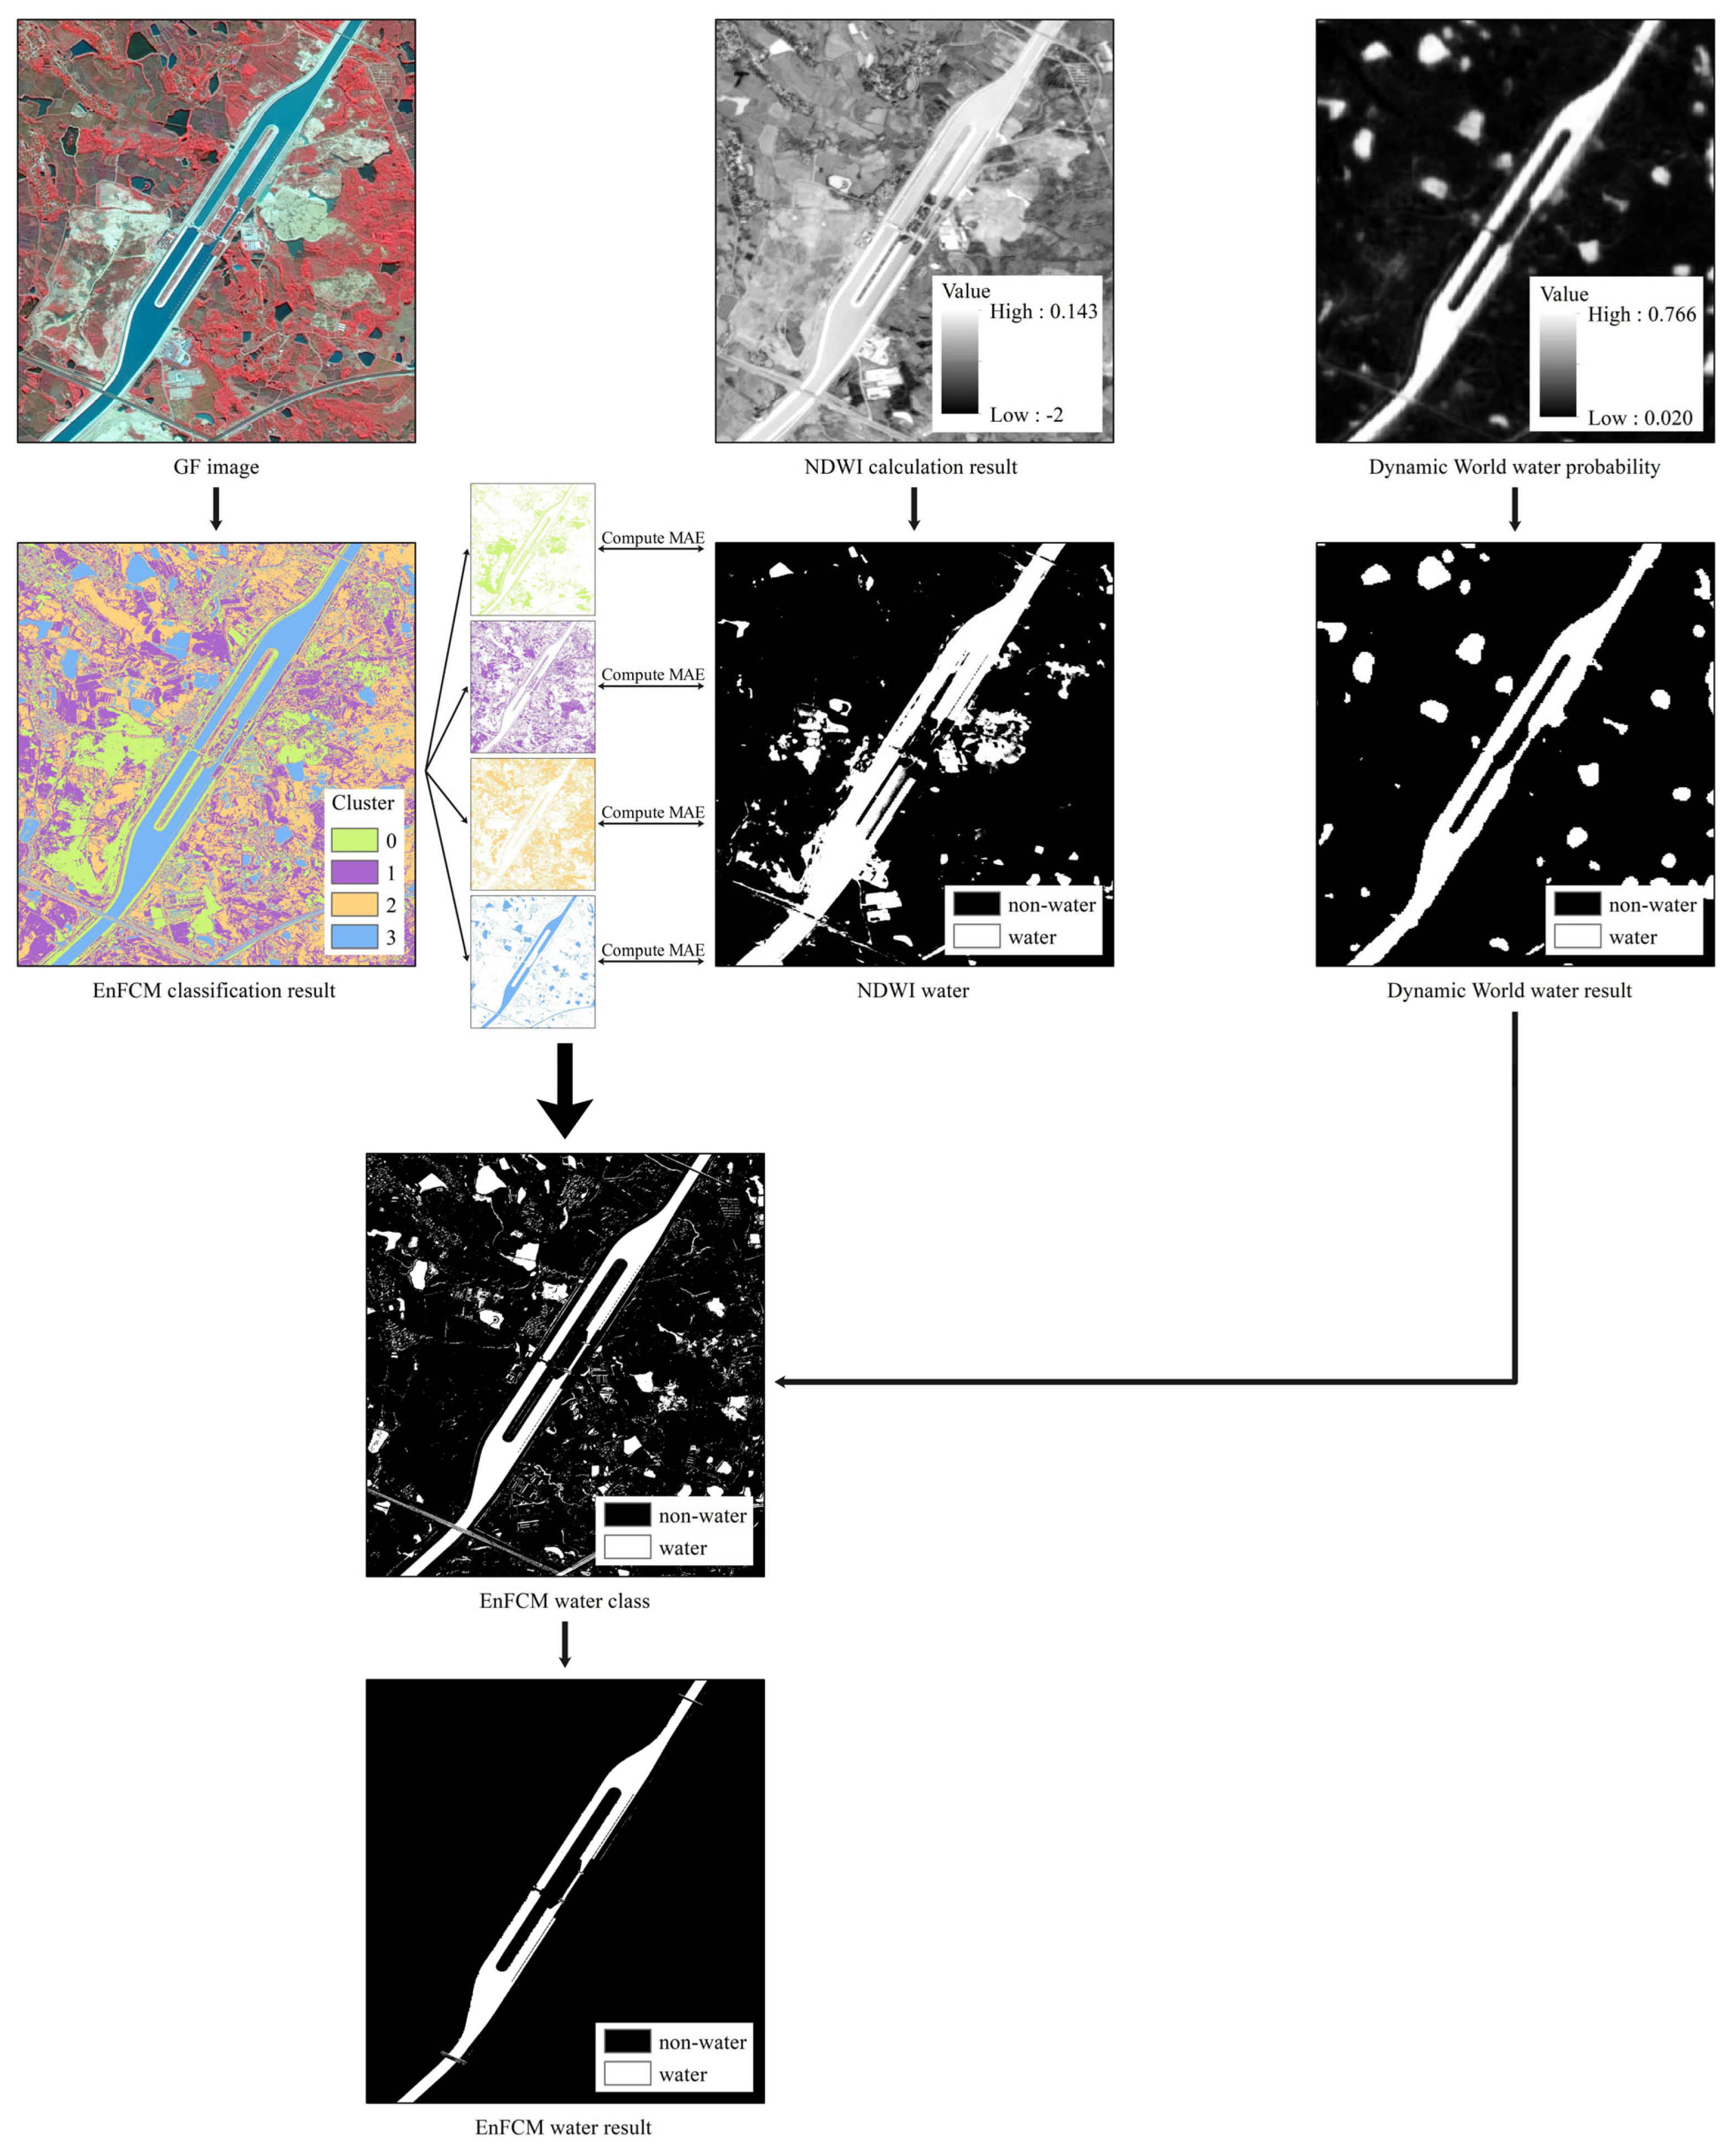
The first step of the experimental process focuses on the precise extraction of river areas. This step employs the enhanced fuzzy c-means algorithm (EnFCM) to perform fuzzy classification on high-resolution remote sensing images for each study area. Subsequently, the threshold range set by the normalized difference water index (NDWI) is used to evaluate the similarity between each pixel category and water body characteristics, thereby accurately identifying and extracting the water body category. Finally, the DW water body probability data are introduced to further refine the river range using masking technology, resulting in a more accurate river area image. As an example, for the Ship Lock 1 study area, an exemplary image of the specific steps for extracting the river region is shown in Figure 4.
The second step in the experimental process is the automatic identification of ship locks. Based on the accurately defined river areas, an area shape screening mechanism is first used to initially extract potential lock chamber areas. Next, the flow direction is calculated, and survey lines are drawn centered on the two end boundary points of each lock chamber area, approximately perpendicular to the main flow direction. The region of interest (RoI) is then obtained through the intersection of the survey line and other connected domains. To achieve precise positioning of ship lock targets, the finely defined river range results extracted by the EnFCM algorithm are combined with the DW river extraction results. This combination serves as a mask layer to eliminate non-ship lock parts, enabling the accurate identification and extraction of ship lock targets. As an example, for the Ship Lock 1 study area, an exemplary image of the specific steps for the automatic identification of part of the ship lock is shown in Figure 5.
The core innovation of this study focuses on developing a sluice extraction algorithm that integrates prior knowledge and spectral features. Unlike the commonly used algorithms for identifying water-based structures through morphological analysis, our algorithm leverages the structural characteristics of sluices to effectively differentiate them from other water-crossing structures like bridges and barrage gates, thus achieving high-precision recognition and extraction of sluice targets.
Specifically, in the river extraction phase, we introduced the Mean Absolute Error (MAE) as a crucial evaluation metric for measuring the similarity of waterbody recognition results. Subsequently, to further refine river boundaries, the DW water probability data were incorporated as a masking layer. For sluice recognition, we designed an algorithm based on prior knowledge tailored to extract sluice targets. The core innovation of this algorithm lies in its multiple threshold screenings of water-crossing structures using existing computer graphics algorithms, focusing on the unique geometric structures of sluices. This approach overcomes the difficulty of distinguishing sluices from other water-crossing structures present in existing algorithms.

3.1. River Extraction Based on Fuzzy Theory and Water Probability

The extraction of river areas, based on fuzzy theory and water body probability, utilizes high-resolution remote sensing images of the study area. This process employs the EnFCM algorithm and DW water body probability data, along with the calculation of the normalized difference water index (NDWI) threshold, to achieve accurate extraction of river areas.

3.1.1. EnFCM Fuzzy Classification

The study first obtained high-resolution remote sensing images of each study area and used the EnFCM algorithm to fuzzy-classify the images. The EnFCM algorithm preprocesses the original image by performing a linear weighted sum of the pixel points and their neighboring pixels. This process generates an average image of the local neighborhood pixels from the original image [25].
ξ k = 1 1 + α x k + α N R J N k x j
where ξ k represents the grayscale value of the k-th pixel in the image ξ , x j represents the neighboring pixels of x k , N k represents the set of pixels within the window centered at x k , α N R J N k x j represents the average grayscale value of the surrounding neighborhood x k , and α is a parameter used to control the influence of the neighborhood component.
Then, a fast segmentation method is applied to the grayscale histogram of the generated image ξ . The objective function is defined as follows:
J s = i = 1 c l = 1 q γ l u i l ξ l v l 2
where v i represents the i-th cluster center, u i represents the fuzzy membership degree with respect to the grayscale value ‘l’ relative to cluster ‘i’, ‘c’ represents the number of clusters, ‘q’ represents the number of grayscale levels in the given image, and γ l represents the number of pixels with a grayscale value equal to ‘l’, where l = 1, …, q [26].
For any given l, under the constraint of i = 1 c u i l = 1 , we aim to find the minimum value of J s . This involves taking the first derivatives of u i l and v i with respect to J s and setting them equal to zero. Ultimately, we obtain two necessary but not sufficient conditions for J s to be a local extremum point, as shown below:
u i l = ξ l v i 2 / m 1 j = 1 c ξ l v j 2 / m 1
v i = l = 1 q γ l u i l m ξ l l = 1 q γ l u i l m
where u i l represents the membership values of the various clusters, v i represents the cluster centers, and ξ l represents the grayscale value of the l-th pixel in the image. m is a hyperparameter that controls the fuzziness of the clustering.

3.1.2. Determining the Water Category Based on the EnFCM Classification

Since the EnFCM algorithm can only classify images and cannot provide clear identification of the resulting categories. We employ the calculation of the normalized difference water index (NDWI) in GF images to achieve automatic water discrimination. NDWI, proposed by McFeeters [27] in 1996, is a classic method for extracting water indices, and can describe the characteristics of open water, enhance water features in remote sensing images, and simultaneously reduce information on vegetation and other land features. Its calculation formula is shown in Equation (5).
N D W I = G R E E N N I R G R E E N + N I R
where GREEN represents the green band of the image, and NIR represents the near-infrared band of the image.
The study areas can be roughly divided into water and non-water by performing threshold and binary segmentation of the NDWI results. Each classification of EnFCM was binarized to obtain a separate binarized water distribution map for each category, and the similarity was calculated with the binary segmentation results of NDWI, so as to accurately determine the water category in EnFCM. In this study, the mean absolute error (MAE) [28] was selected as an index for evaluating the similarity of the water results. MAE provides a method to measure the average absolute deviation between model predictions and actual observations. Its formula is shown in Equation (6). MAE can reflect the possibility of each category in EnFCM being classified as water, thus determining the most likely representation of the water category.
M A E = 1 m i = 1 m x i x i ^
where m represents the number of samples, x i represents the true observed value of the i-th sample, and x i ^ represents the predicted value of the i-th sample.
In this study, the results of NDWI water are taken as the “true value”, while the results of the EnFCM categories are taken as the predicted value. MAE is calculated between each category and the NDWI results, where a lower MAE indicates a higher similarity between the category and the NDWI results. Ultimately, the category with the lowest MAE value is selected as the water category in EnFCM.

3.1.3. Identifying the Extent of Rivers

Due to the presence of various non-river water bodies with diverse shapes in the EnFCM water category, it is difficult to set an appropriate threshold and achieve satisfactory results by solely relying on shape-based filtering methods for river extraction. Therefore, in this study, taking advantage of the low-resolution DW data and the fact that water infrastructure such as locks and bridges has minimal impact on the connectivity of rivers, the DW water probability dataset is used to perform shape-based filtering on the preliminary water body results obtained from EnFCM. This approach retains only well-connected rivers, while removing other water bodies with smaller areas or no association with rivers, thus improving data quality and analysis accuracy, facilitating subsequent lock extraction tasks.
In the specific processing steps, this study focuses on large rivers where the location of lock chambers is typically found. These rivers tend to occupy a significant area in remote sensing images. Therefore, this study first sets an appropriate threshold for DW water probability data to distinguish between water and non-water areas. Then, a river area threshold is applied to extract potential rivers, aiming to exclude interference from other water features.
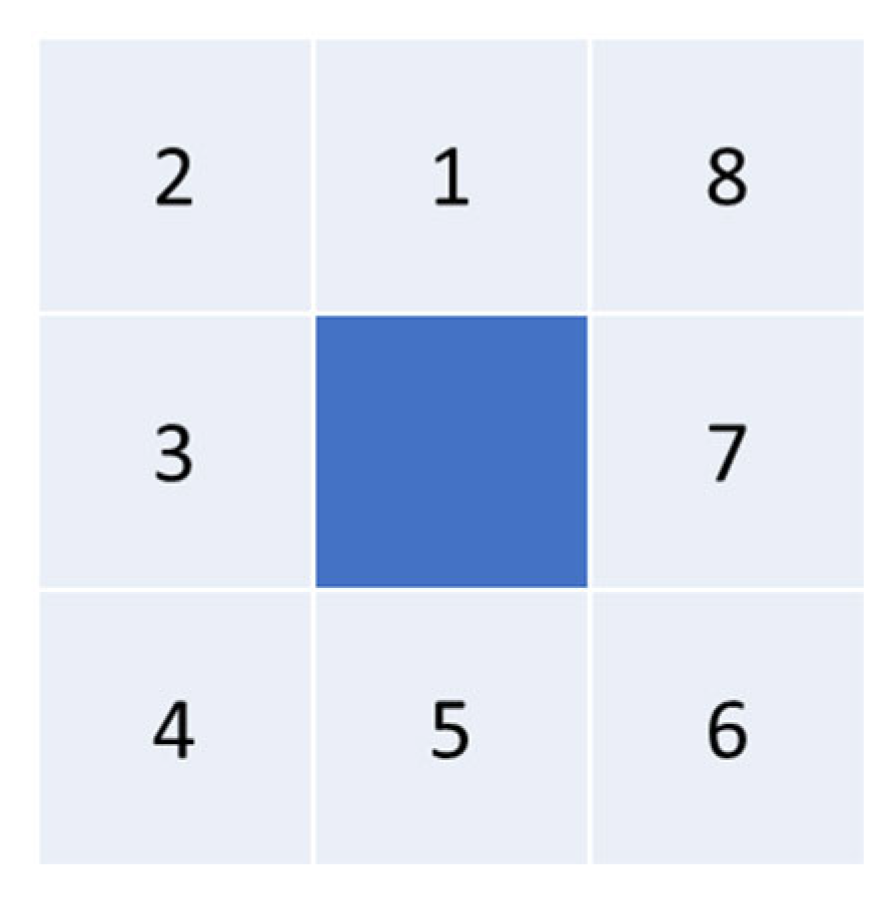
Since the river reaches are scattered in the image, it is necessary to perform 8-neighborhood connected component extraction on the binary DW river results. Figure 6 shows the basic idea of connected domain extraction. It takes the current pixel as the center, takes the eight pixels above, below, and to the left, right, upper left, upper right, lower left, and lower right as the eight neighborhoods of the current pixel, and divides the neighbors. Pixels with the same pixel value within the domain are marked to extract each connected region in the image.
After obtaining the information of connected components in the image, we calculate the area of each connected component. Connected components with an area greater than a specified threshold are marked as potential river targets, representing the DW river region. These components are then used as a mask to extract the river portions from the EnFCM water category, allowing us to obtain a more accurate river extent [29].

3.2. Ship Lock Recognition Based on Prior Knowledge and Spectral Characteristics

3.2.1. Prior Knowledge

The construction of a ship lock typically has a scientific basis and follows certain standards. Therefore, in high-resolution remote sensing images, ship locks exhibit the following common characteristics:
  • As navigational structures, ship locks are usually built in large but narrower rivers, and they are typically constructed in pairs or groups [30,31].
  • Ship locks, as artificial structures, are typically constructed using materials such as concrete and metal. Their spectral characteristics differ significantly from water [32].
  • Ship locks regulate the water level on both sides of the river by adjusting the gates, which is manifested in remote sensing images as dividing the river into several segments [33].
  • The chamber of a ship lock has an approximately regular rectangular shape, and its area is significantly smaller than the area between the bridges across the river segment.

3.2.2. Determining the Region of Interest (RoI) Range

Based on prior knowledge, the lock chamber of a ship lock is typically regular, stable, and approximately rectangular in shape. Compared to the expansive stretches of natural rivers or large water conservancy facilities, the lock chamber area is usually much smaller than the sections of rivers between other cross-water structures. Therefore, this study sets an empirical threshold to perform shape filtering on finely defined river ranges and selects smaller river sections as potential lock chamber areas.
The screening process involves two stages of applying shape area thresholds. The primary purpose of the first screening is to exclude small water bodies and irregularly shaped areas that are unrelated to ship locks, thereby retaining the main river sections. Following this, the second screening focuses on the lock chamber areas. This step aims to exclude large water body areas and accurately identify and extract the sections suspected to be lock chambers.
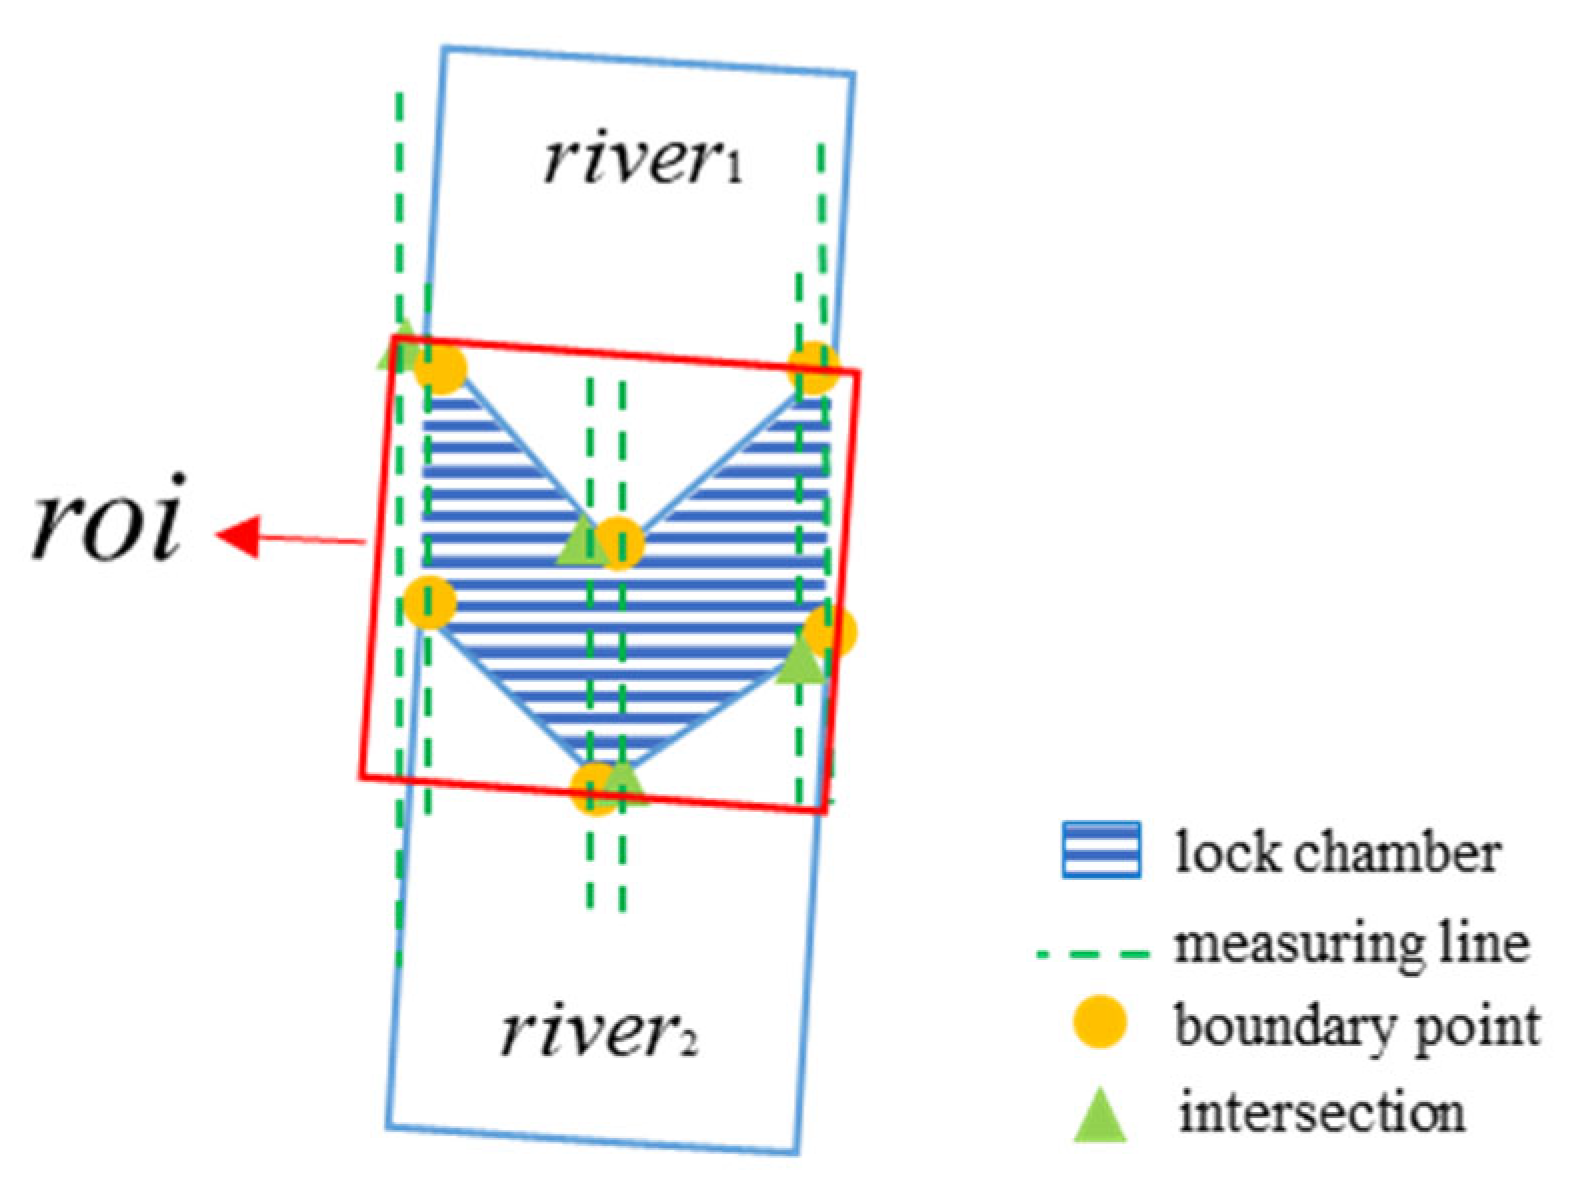
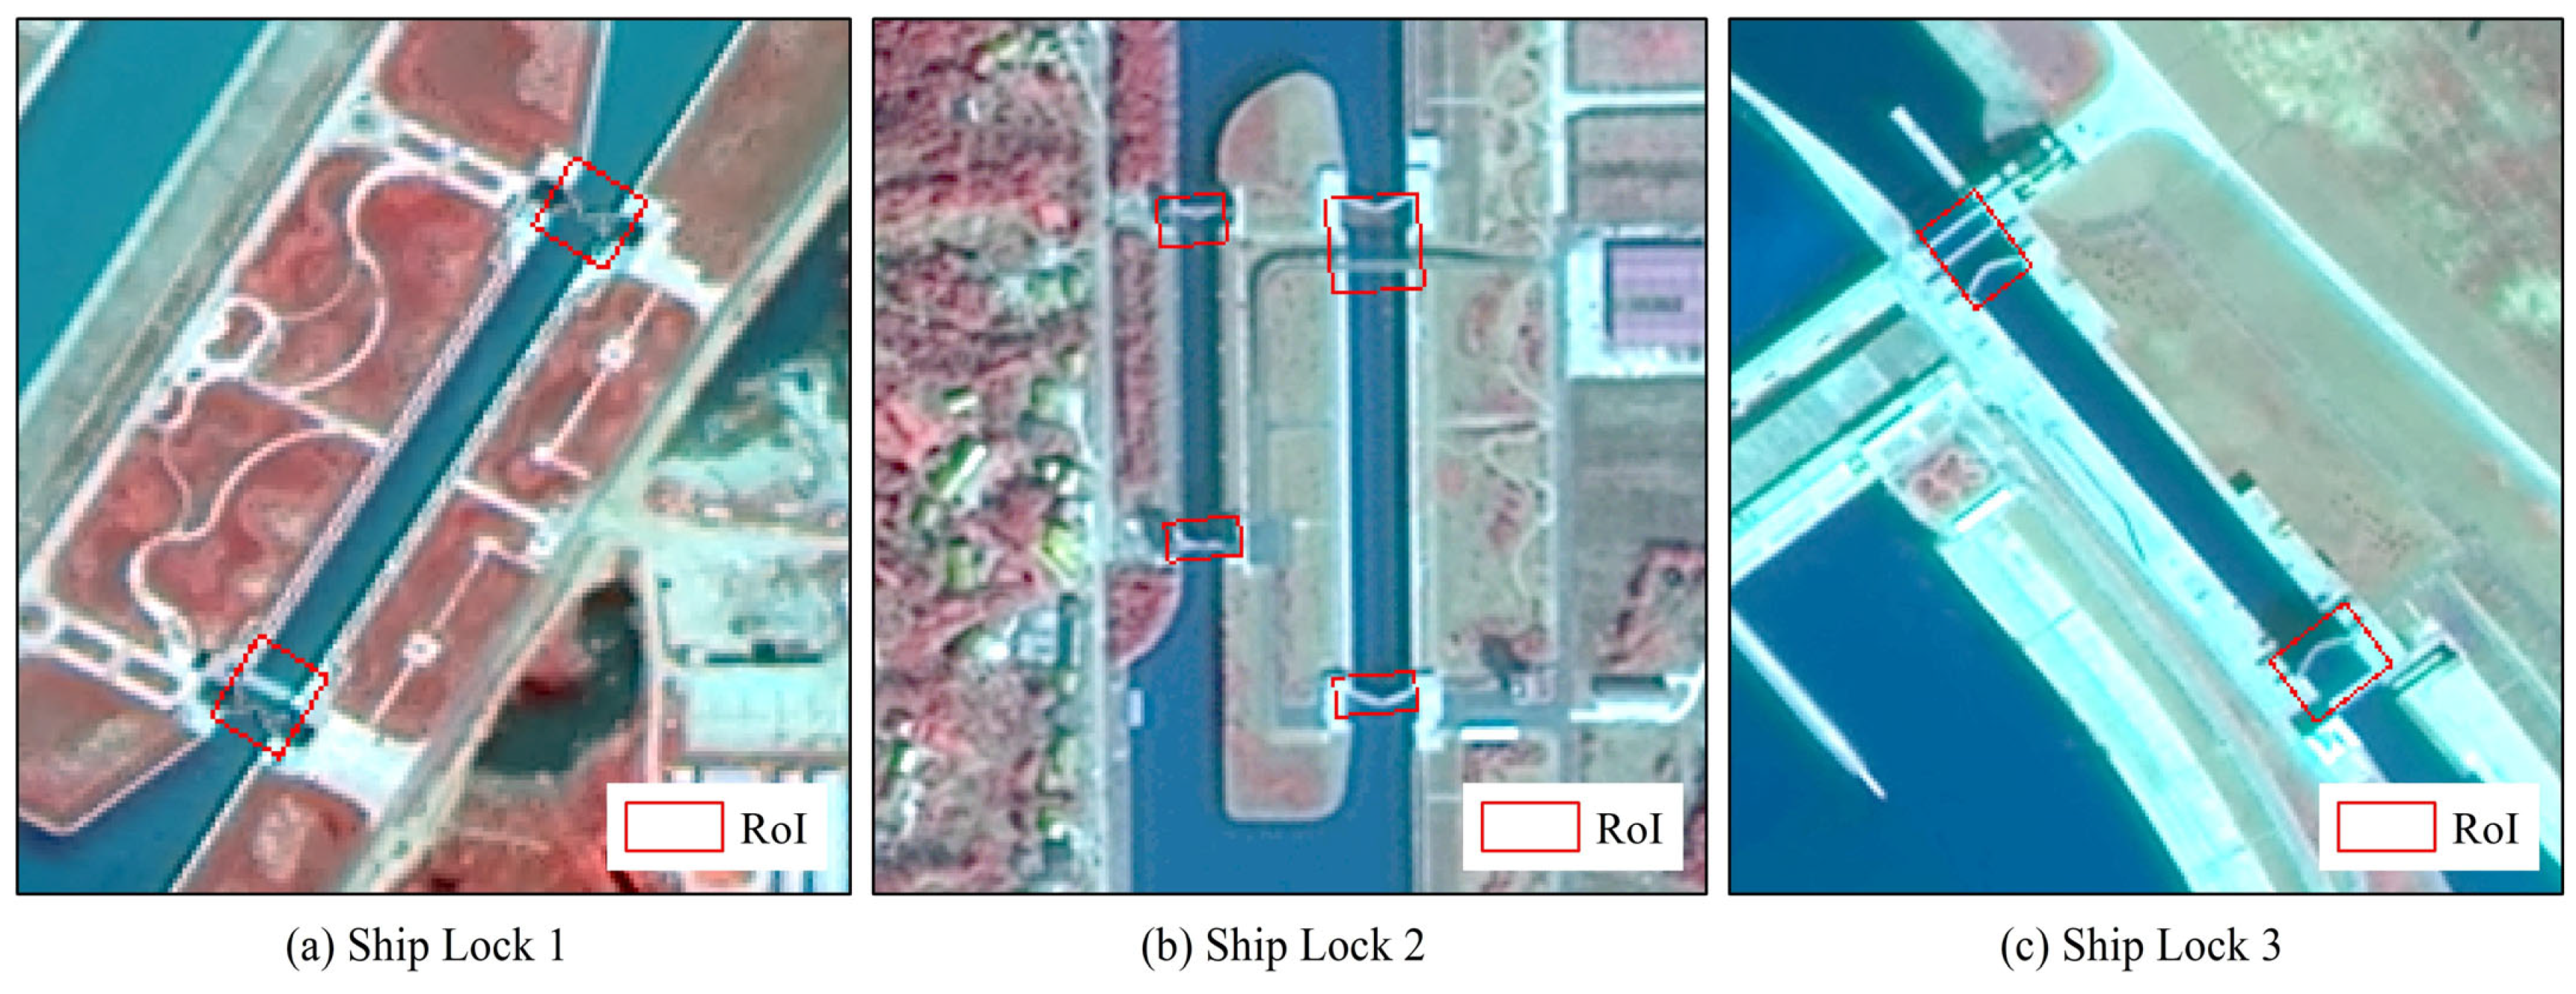
Based on the extracted results for suspected lock chambers, basic image processing and spatial analysis techniques are employed to calculate the river flow direction. This analysis identifies the boundary points at both ends of each lock chamber, which are approximately perpendicular to the river direction. From each boundary point, a survey line is drawn along the river direction to determine the intersection points between the lock chamber and the adjacent river sections. By combining these intersection points with the original boundary points, a minimum enclosing rectangle is created, resulting in the region of interest (RoI) for the suspected ship lock. A schematic diagram is illustrated in Figure 7.

3.2.3. Ship Lock Extraction

After determining the Region of Interest (RoI), the refined river boundary results obtained from EnFCM, along with the river extraction results from DW, are used as masks to filter out water bodies within the RoI and interference factors outside the river boundaries, such as land areas between rivers. This process ultimately yields the final extraction results for the ship locks.

3.3. Accuracy Verification

Many evaluation criteria have been proposed and subsequently used to evaluate the accuracy of various object recognition semantic segmentation techniques [34]. Among them, as concise and representative metrics, average pixel accuracy (mPA) and average intersection over union (mIoU) are the main evaluation indicators of our experiment. mPA calculates the average accuracy of all categories of pixels, that is, the proportion of correctly classified pixels in each category, and then calculates the average of all categories [35]. The calculation formula is as shown in Equation (7).
m P A = 1 k + 1 i = 0 k p i i j = 0 k p i j
mIoU is a standard metric for semantic segmentation and calculates the ratio of the intersection and union of two sets. In the problem of semantic segmentation, these two sets are the real value and the predicted value. That is, the ratio of the intersection and union of the predicted results of each category, and the true value is calculated, summed, and then averaged [36]. The calculation formula is as shown in Equation (8).
m I o U = 1 k + 1 i = 0 k p i i j = 0 k p i j + j = 0 k p j i p i i
where p i i represents the number of true positives, while p i j and p j i are usually interpreted as false positives and false negatives, respectively, and k + 1 represents the total number of categories.
In order to verify the accuracy of the ship lock extraction algorithm, firstly, the true value of the ship lock target was obtained by manual visual interpretation based on the high-resolution remote sensing images of each study area. Based on this, the mPA and mIoU extracted by the ship lock in the corresponding study area are calculated, thereby completing the evaluation of algorithm accuracy.

4. Results

4.1. EnFCM River Results

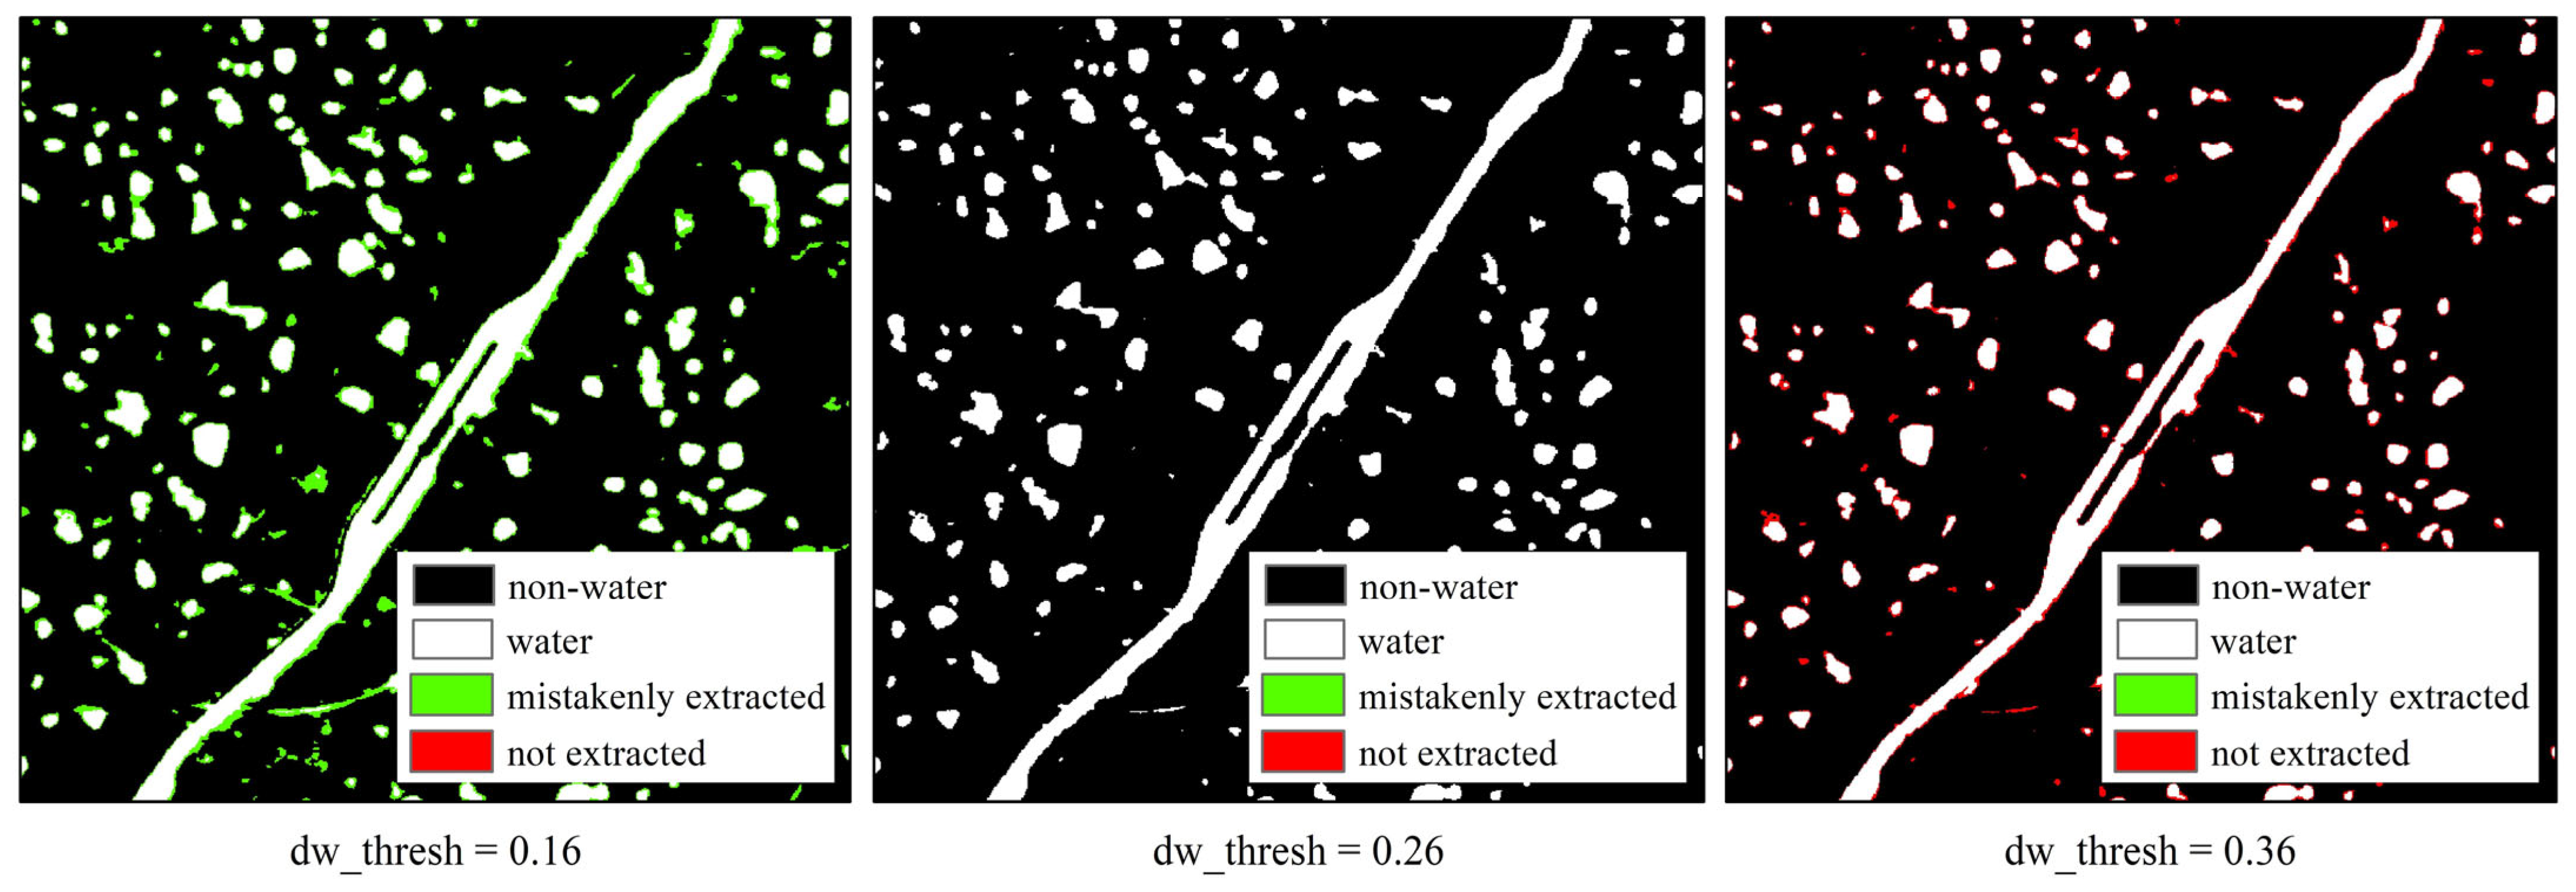
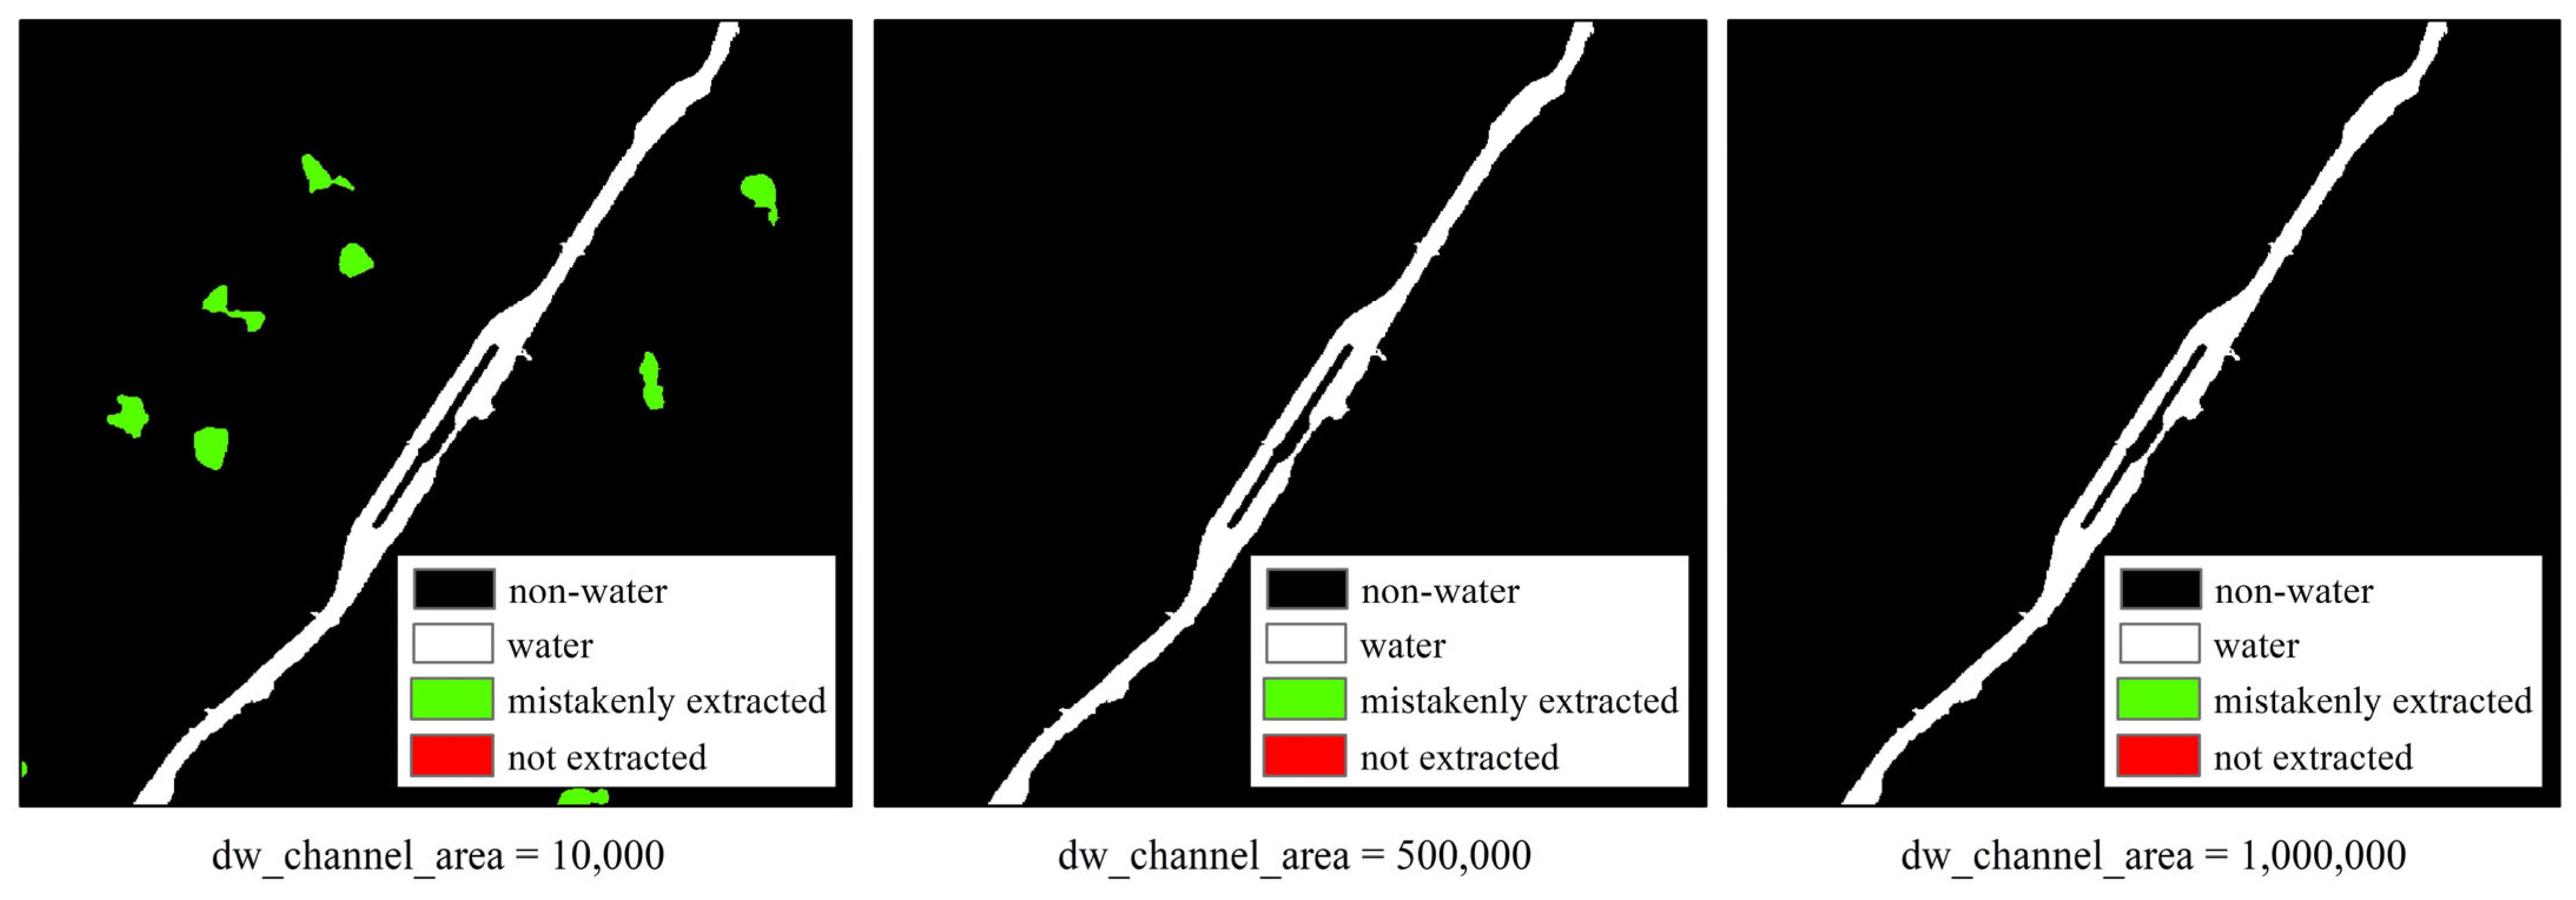
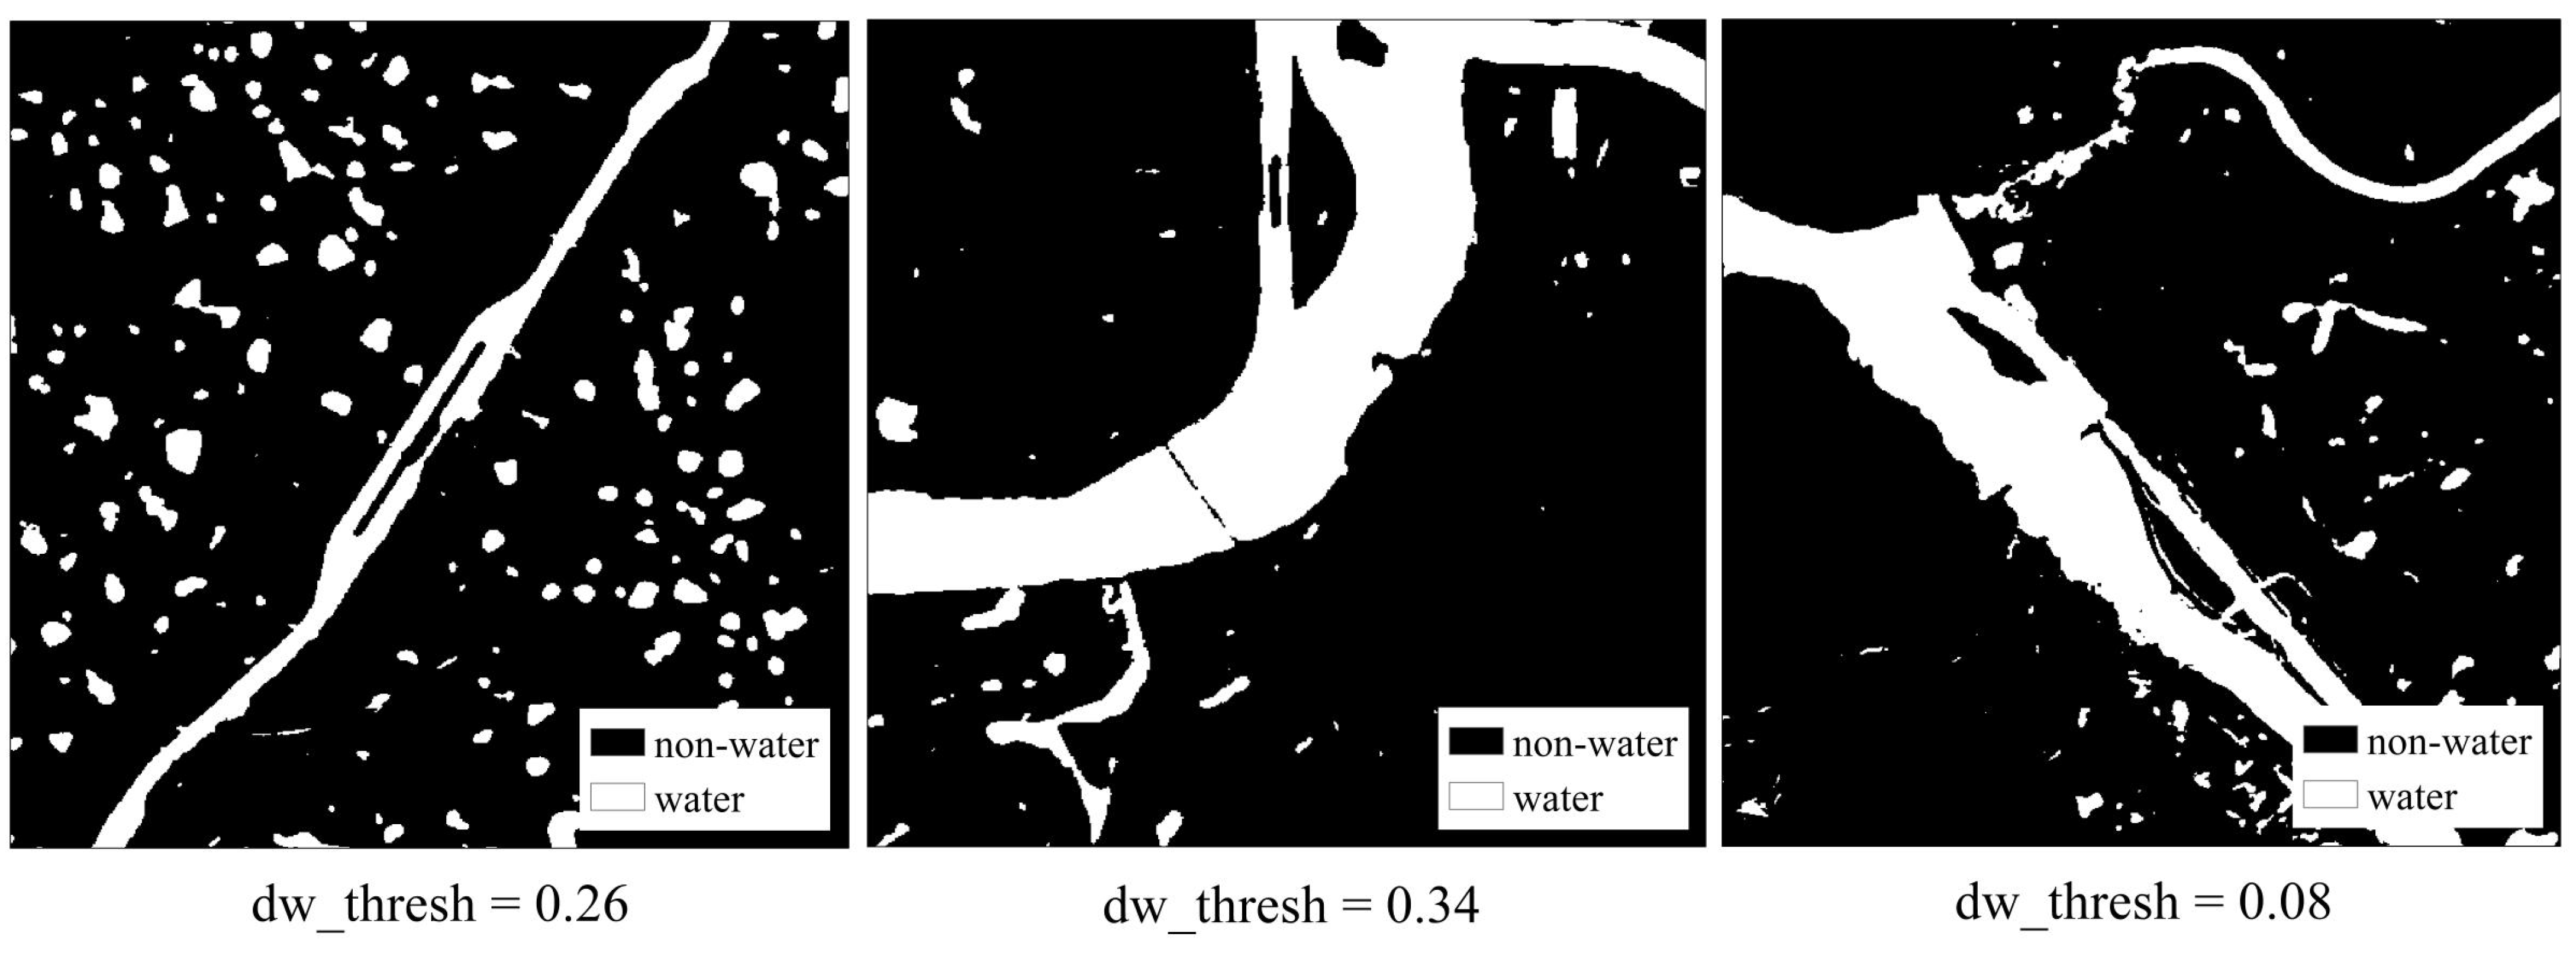
In this study, we obtained DW water body products by setting a threshold for DW water bodies and performed binarization to segment the water body parts from the image. Subsequently, we applied DW shape filtering and set an area threshold to extract the river regions. This experiment involved calibrating the water body probability threshold (dw_thresh) and the area threshold (dw_channel_area) independently, ultimately selecting the most appropriate thresholds based on the actual conditions and segmentation results. Taking the research area for Ship Lock 1 as an example, Figure 8 and Figure 9 illustrate the water body segmentation results for various values of dw_thresh (0.16, 0.26, and 0.36) and dw_channel_area (10,000, 500,000, and 1,000,000).
In the treatment of DW water bodies, the careful selection of thresholds is particularly critical. As shown in Figure 8 and Figure 9, the green part is the mistakenly extracted part, and the red part is the unextracted part. If the dw_thresh is set too low during the binarization stage, non-water elements, such as metal structures and roads on the embankment, may be erroneously identified as water bodies due to excessive sensitivity. This can lead to segmentation results that include non-target objects. Conversely, if the threshold is set too high, sensitivity is diminished, resulting in failure to effectively segment some actual water body areas, such as narrower river sections, and leading to a loss of important information.
Similarly, during the shape area screening stage, if the dw_channel_area threshold is set too low, it may inadvertently include small water bodies or atypical forms (such as wetlands and small puddles) within the analysis scope, thereby introducing noise. Conversely, if the threshold is set too high, overly stringent screening criteria may eliminate all water bodies, including important main river areas, which contradicts the original intent of the study. Therefore, to ensure accurate identification and retention of the main river areas, the dw_channel_area threshold should be set at a relatively high level, while carefully avoiding over-filtering to maintain the integrity and representativeness of the data.
It is important to note that while the adjustment and selection of thresholds should adhere to certain principles, the process is not strictly fixed. In practice, threshold parameters should be adjusted flexibly. By comparing the processing results under various thresholds, researchers can consider the study’s objectives and the characteristics of the data to identify the threshold combination that best meets the desired goals while maintaining controllable errors.
After the experiments, the dw_thresh and dw_channel_area thresholds we selected for the three study areas were 0.26, 0.34, 0.08, and 500,000, 300,000, and 300,000, respectively. An overview of the specific DW water body thresholds is shown in Table 1, and the segmentation results are shown in Figure 10, Figure 11 and Figure 12.
By applying the dw_thresh threshold, we could effectively segment the main water body areas in each experimental region. Subsequently, the dw_channel_area threshold was utilized to accurately extract the primary river sections while eliminating most small-scale and discontinuous water bodies. It is important to note that, due to significant differences in environmental conditions across various study areas, the applicability of the same set of threshold parameters may vary. Therefore, when selecting a threshold, it is essential to consider the specific conditions of the study area to ensure that the chosen threshold best meets the research requirements and achieves the desired segmentation results.
In the EnFCM fuzzy classification, the choice of the number of clusters, denoted as c, has a certain impact on the classification results. A higher value of c results in a greater number of categories, leading to the more detailed segmentation of features. In this experiment, an automated method was used to calculate the minimum MAE values and runtime for the EnFCM classes and NDWI classes in each study area when the value of c ranges from 2 to 9. The results are shown in Table 2.
Based on the results in the above table and Figure 13, as the number of clusters c increases, the accuracy of water body segmentation gradually improves. However, when c ≥ 5, the slope of the MAE value change curve approaches zero, and there is minimal change in the river regions of primary interest, with only a few small water bodies being incrementally segmented. Furthermore, as c increases, the algorithm’s running time exhibits some variability but generally shows an increasing trend, reflecting the impact of the number of clusters on algorithm efficiency. Therefore, considering the balance between segmentation accuracy and algorithm efficiency, we ultimately selected c = 5 as the optimal number of clusters. Combined with the DW river results, we applied a mask to the EnFCM water results to obtain the final extracted river area for each study area, as shown in Figure 14.

4.2. Lock Extraction Results

In the EnFCM channel processing section, we conducted two rounds of shape filtering. The first round of filtering focused on the entire river, setting a threshold for the connected components to exclude small water bodies and irregular-shaped areas that are not related to the lock chambers, so as to determine the river results. On the basis of the first round of filtering, a second round of filtering was performed specifically for the lock chambers. By setting a threshold for the connected components, larger water body areas were excluded, resulting in accurate extraction of the lock chamber portion.
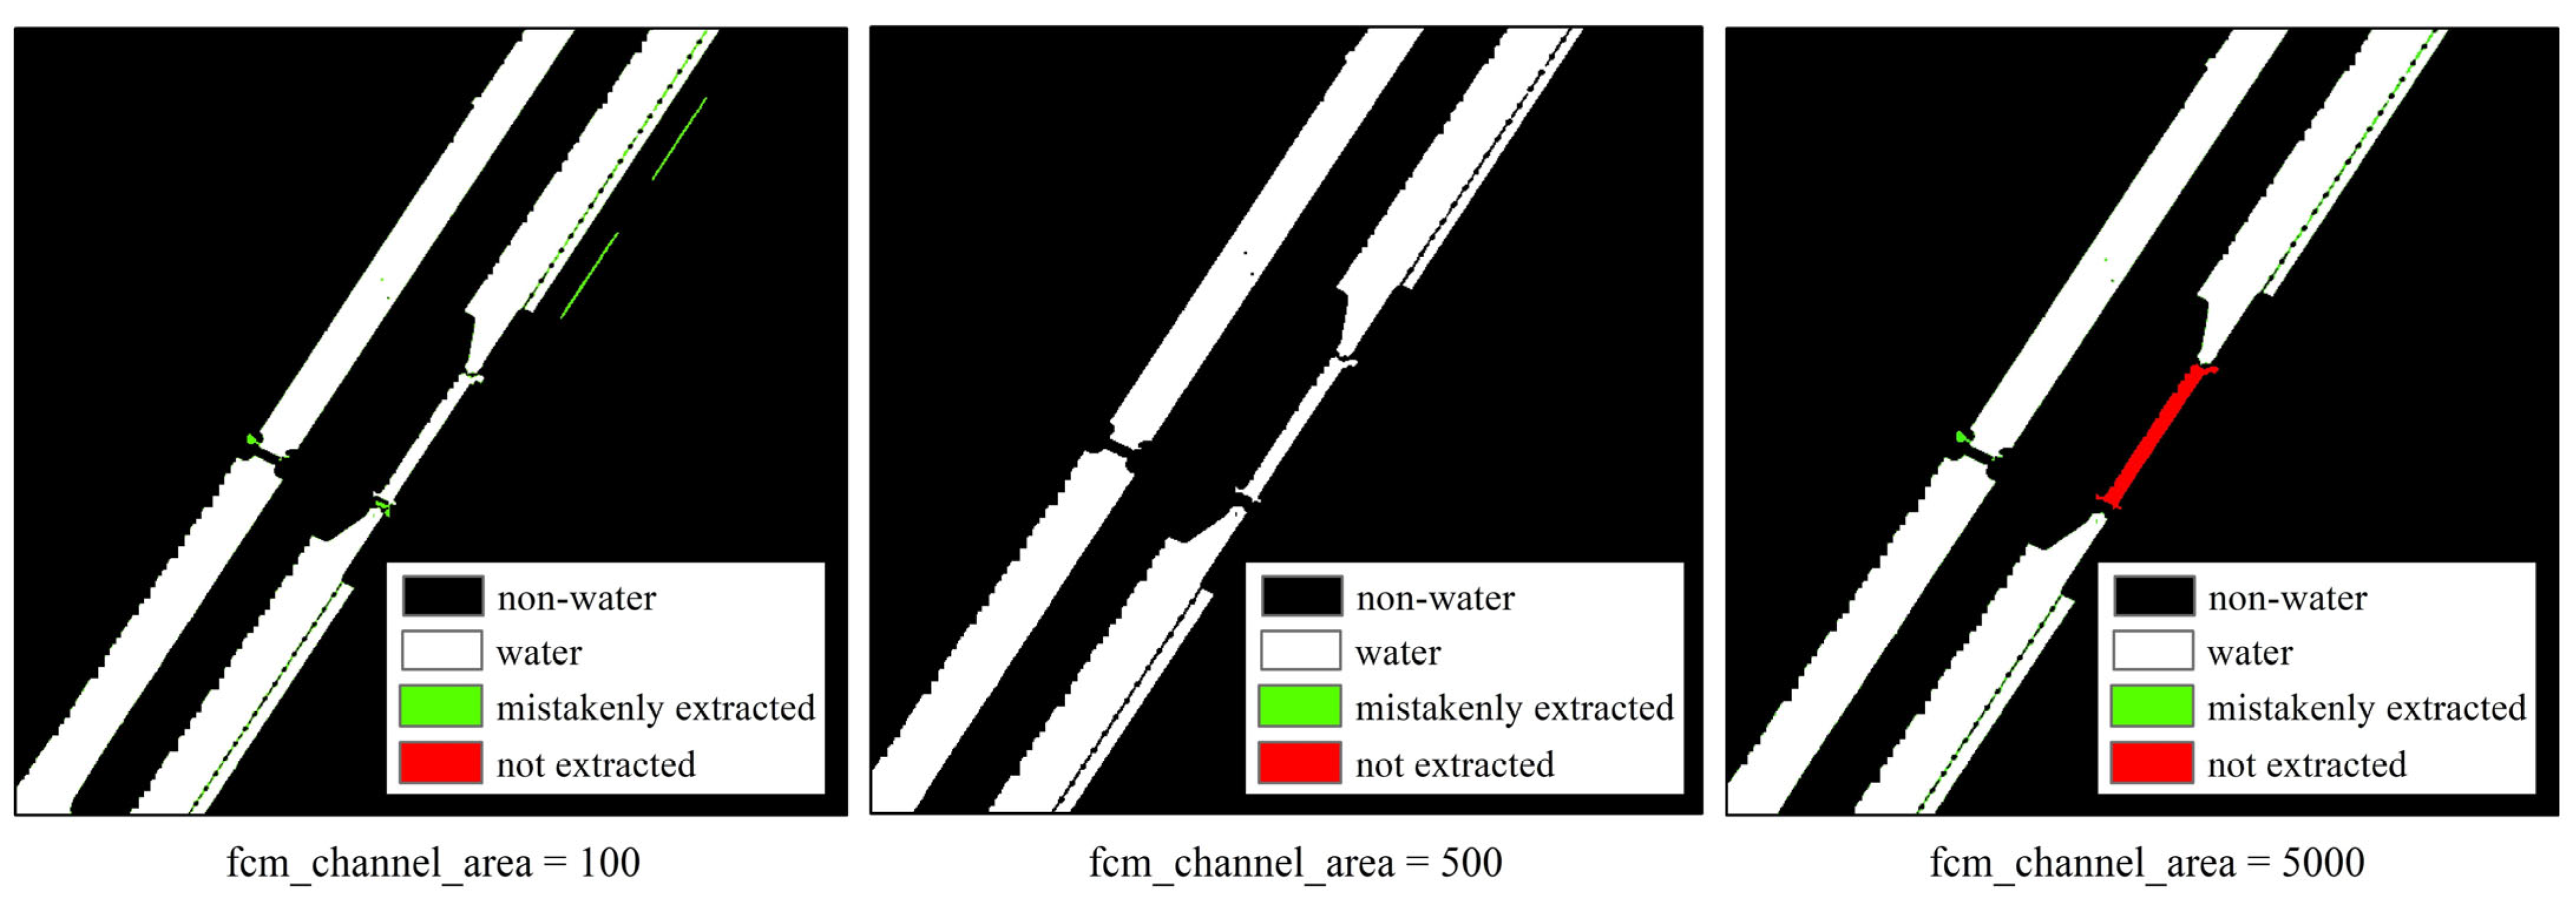
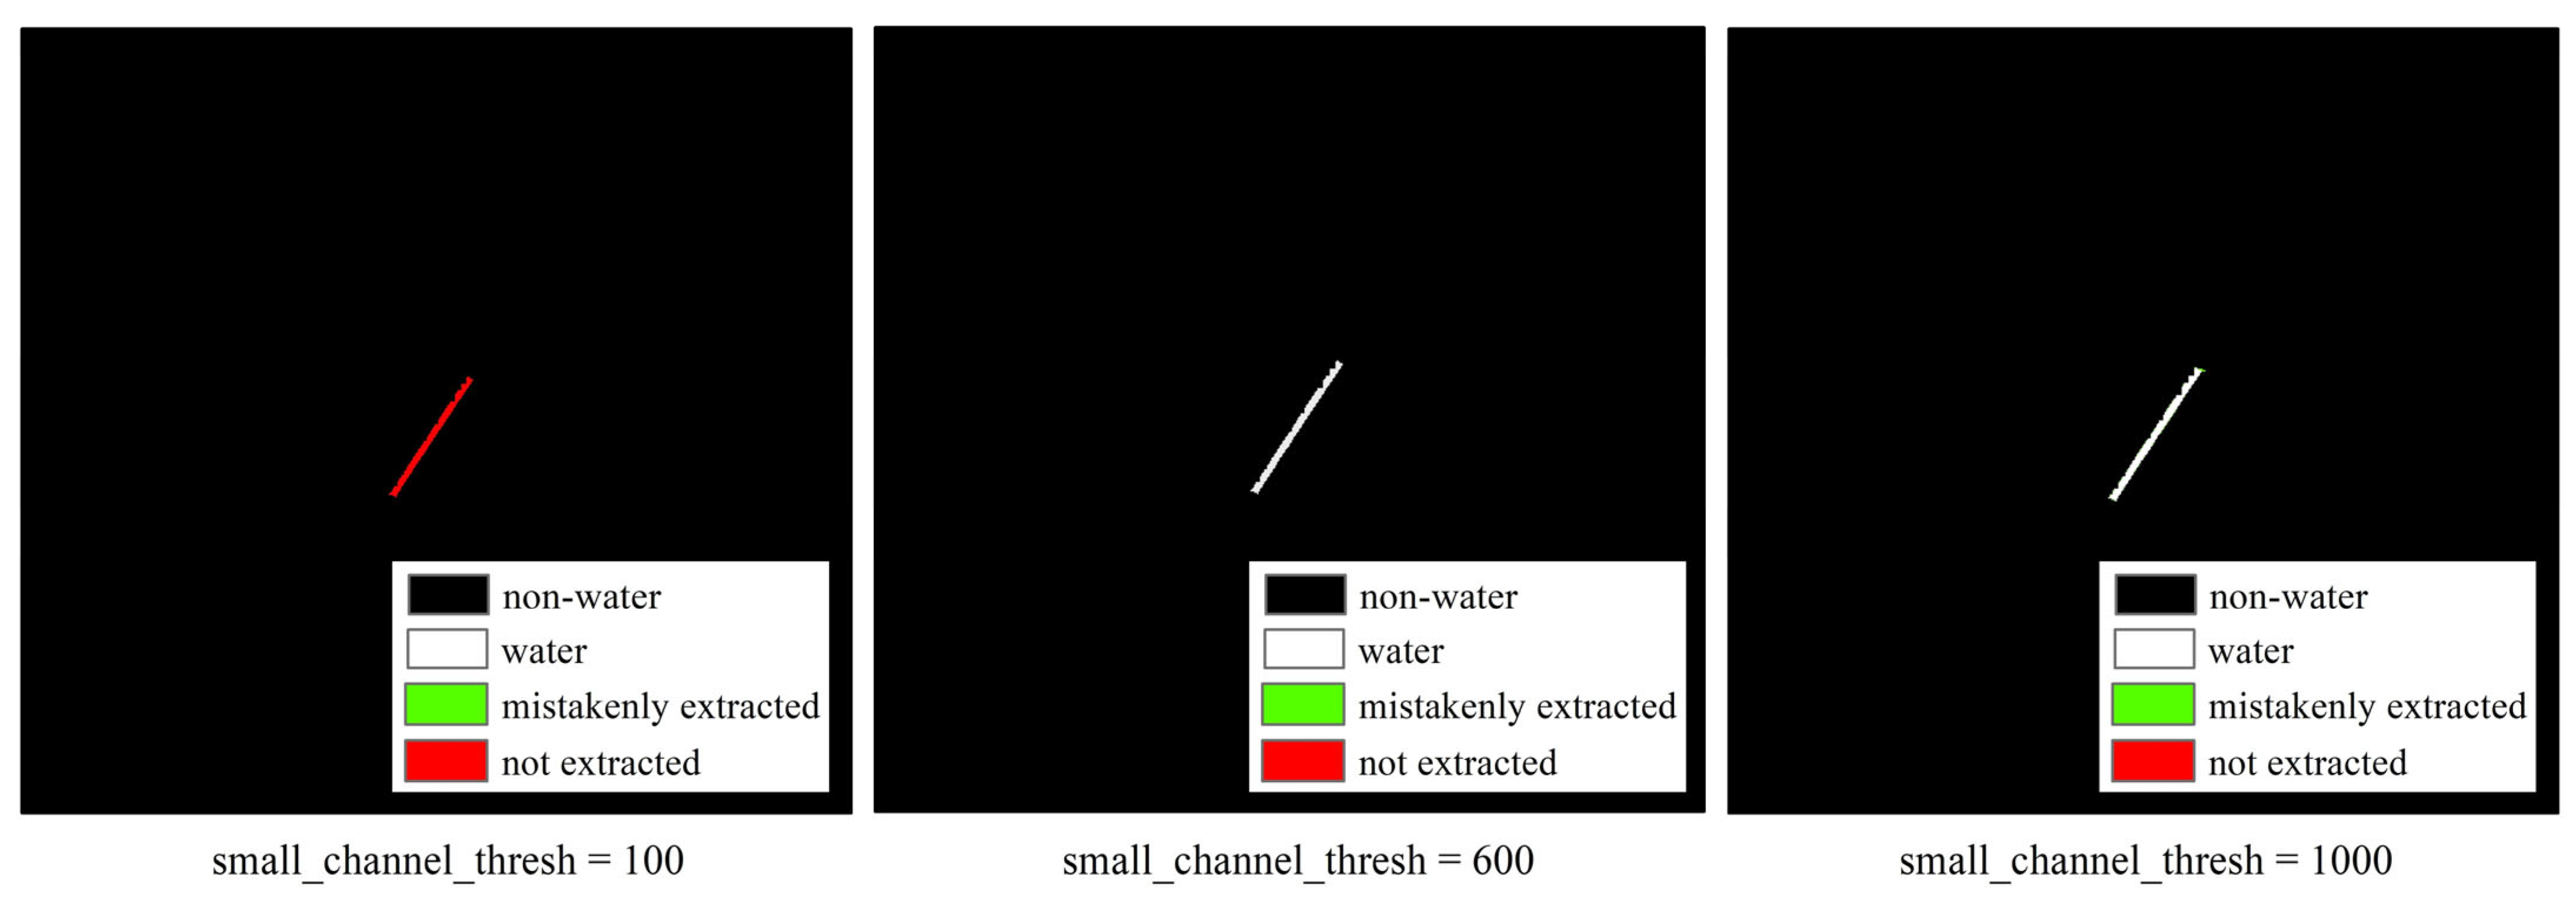
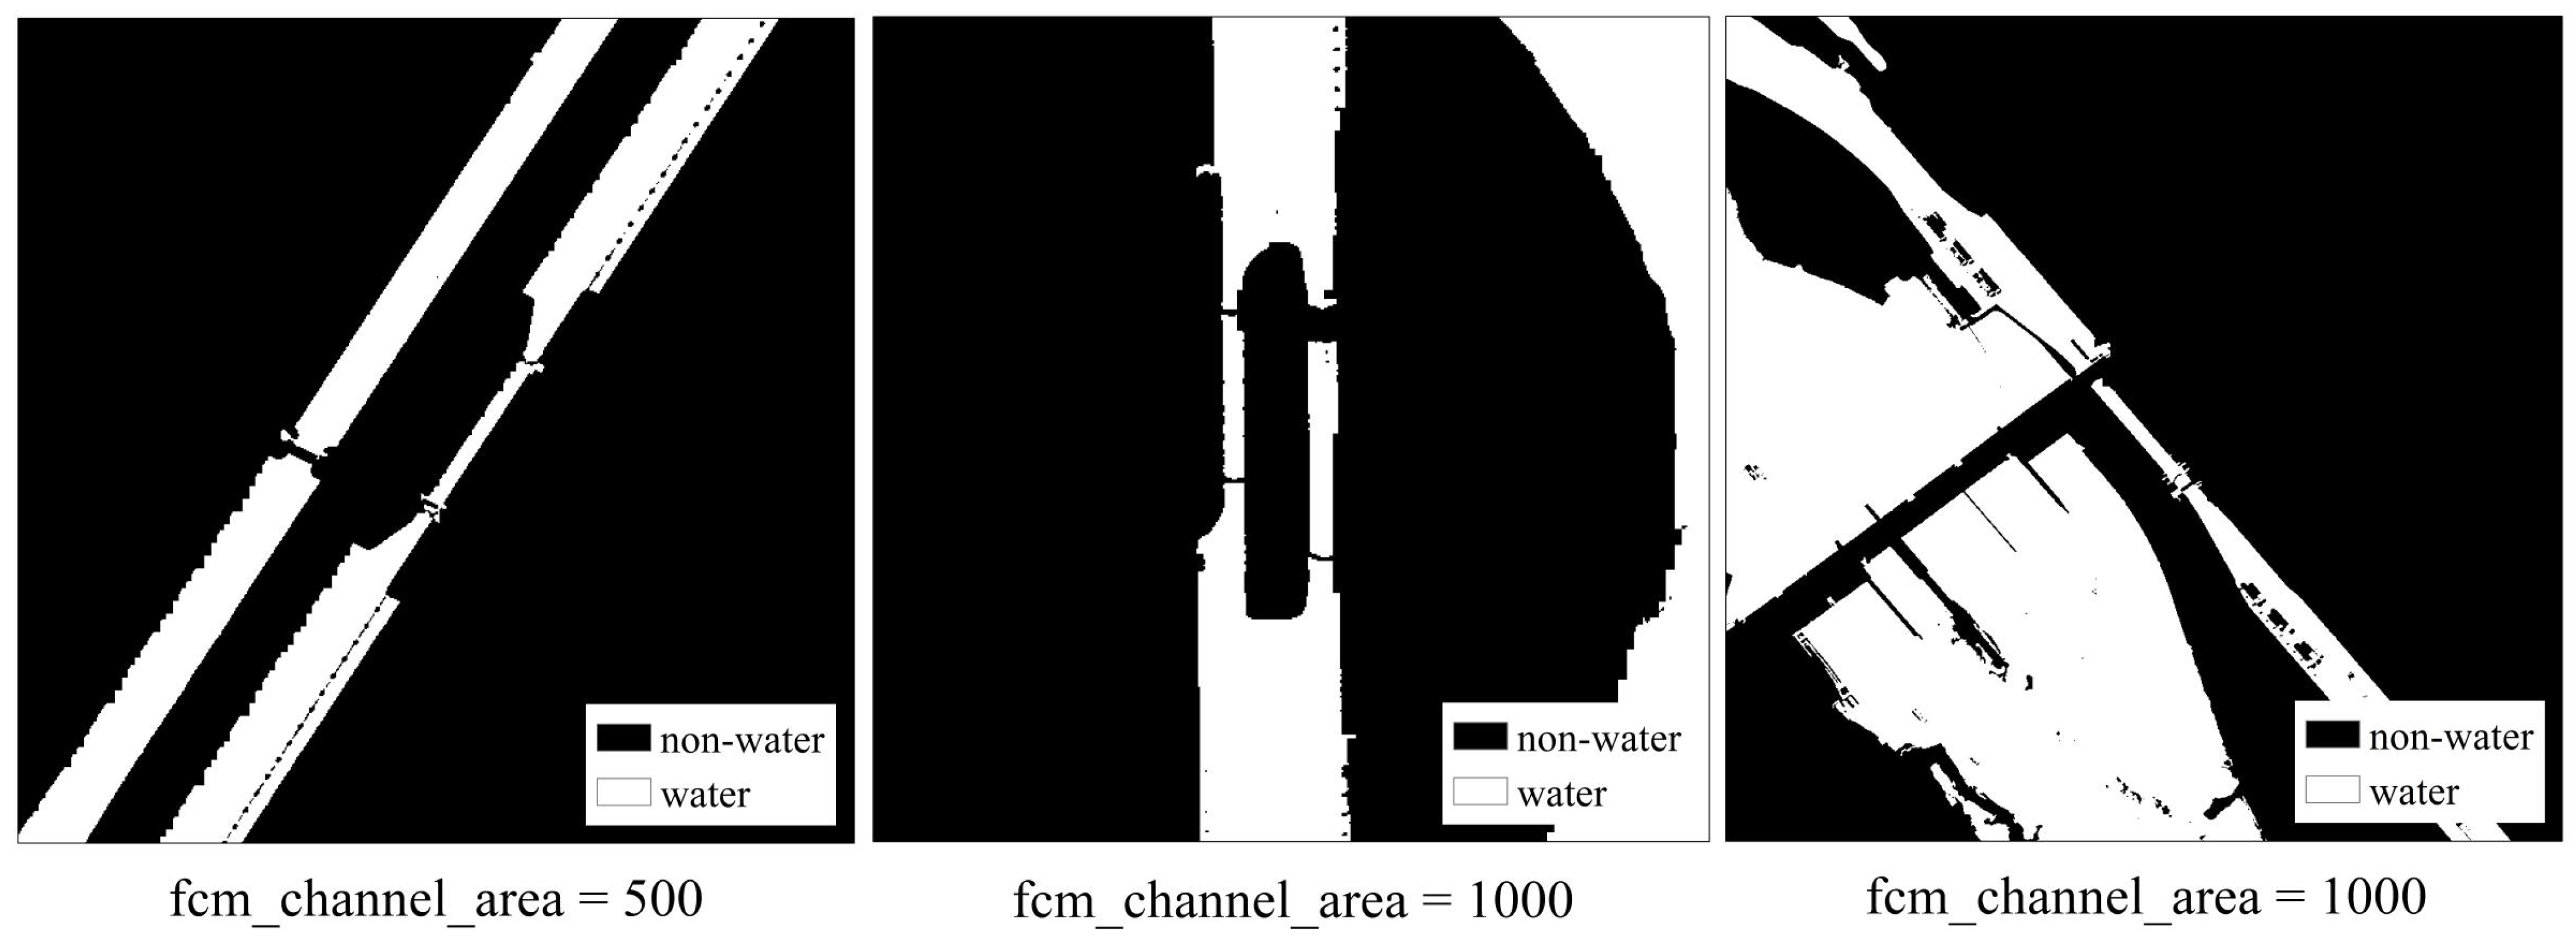
This experiment involved calibrating the first area threshold (fcm_channel_area) and the second area threshold (small_channel_thresh), ultimately selecting the most appropriate thresholds based on actual conditions and screening results. Taking the research area for Ship Lock 1 as an example, Figure 15 and Figure 16 illustrate the area threshold screening results for various values of fcm_channel_area (100, 500, and 5000) and small_channel_thresh (100, 600, and 1000).
It can be observed that during the two-stage filtering of the river’s shape area, if the value of fcm_channel_area is set too low, some small water areas on the embankment may be retained. Conversely, if the value is too high, portions of the lock chamber may be excluded, hindering subsequent extraction efforts. Similarly, if the small_channel_thresh value is too low, the lock chamber will be eliminated entirely, while a value that is too high may retain some small river sections, thereby affecting the determination of the region of interest (RoI). Generally, the second area filtering threshold, small_channel_thresh, should be slightly larger than the first area filtering threshold, fcm_channel_area, to ensure effective segmentation.
Throughout the continuous shape area screening process for rivers, it became evident that the setting of the fcm_channel_area threshold is critical. If this threshold is set too low, small water areas near the embankment may be inadvertently retained, increasing the complexity and uncertainty of subsequent lock chamber extraction. Conversely, if the threshold is set too high, key components, such as the lock chamber, may be mistakenly eliminated, severely compromising the integrity of the dataset and the effectiveness of the analysis.
Similarly, the small_channel_thresh serves as the threshold for the second area screening, and its value must be carefully considered. A threshold that is too small may exclude important areas, such as lock chambers, while a threshold that is too large may retain excessive small-area river sections. These non-target areas can interfere with the accurate definition of regions of interest (RoIs) in subsequent analyses.
In general, to maintain the coherence and rationale of the screening process, the value of small_channel_thresh can be based on the results of the previous screening (i.e., fcm_channel_area) and adjusted appropriately. This approach aims to maximize the retention of key water body components, such as lock chambers, while eliminating redundant small water areas, thereby establishing a solid foundation for subsequent analyses.
In this experimental study, the values of fcm_channel_area and small_channel_thresh thresholds for three groups of research areas were 500, 1000, 1000 and 600, 2000, 2000, respectively. An overview of each threshold is shown in Table 3 below.
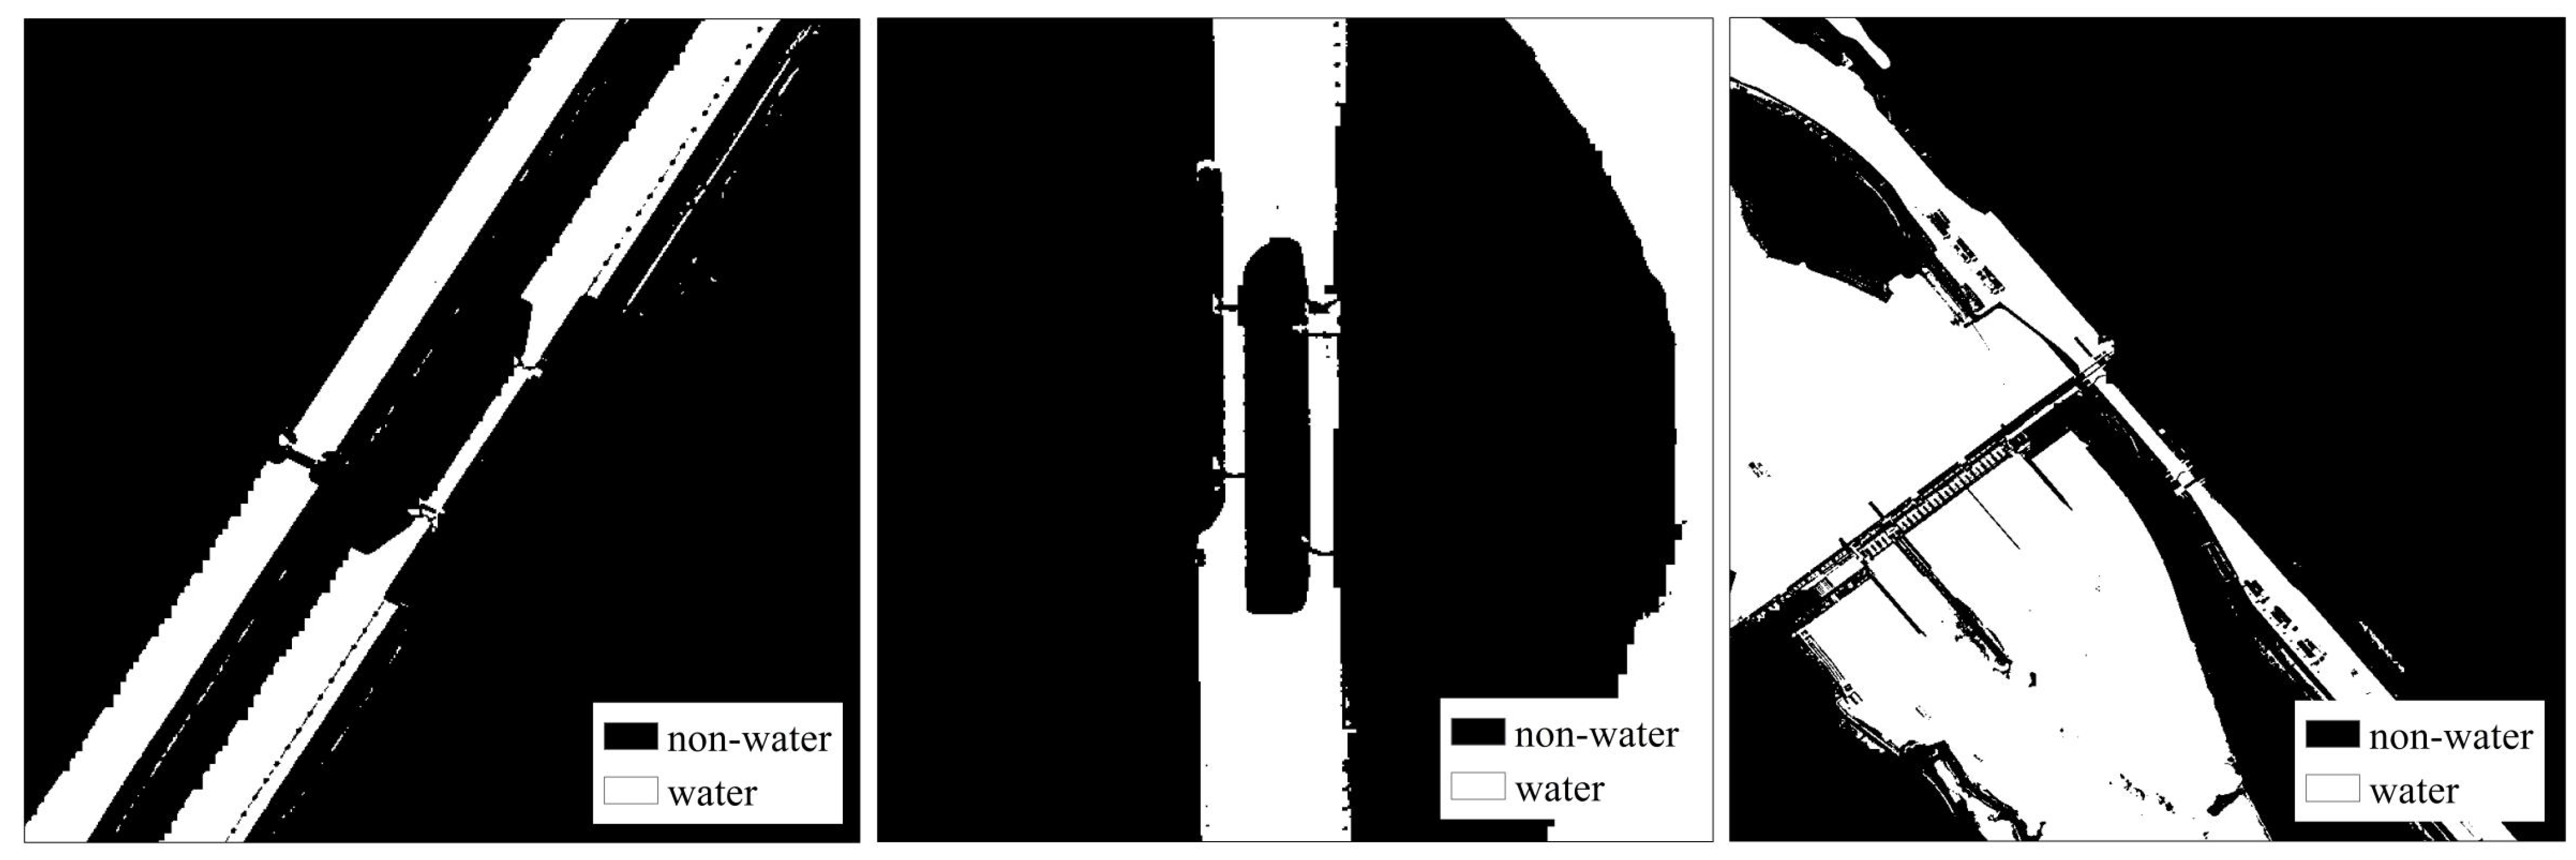
The results of threshold filtering and extraction of lock chambers using EnFCM river ranges (Figure 17) are as follows. Figure 18 shows the results of the first shape screening process, and Figure 19 shows the results of the second shape screening process.
After the initial shape and area screening, we effectively removed the fine, non-target water areas surrounding the river trunk that resulted from corrosion treatment. Subsequently, through the second shape and area screening, we further refined the results and successfully extracted the relatively small area of the lock chamber. This extraction provided essential data support for the accurate determination of the region of interest (RoI) in subsequent analyses.
According to the EnFCM river treatment results, the RoIs of each study area were determined based on our prior knowledge of ship locks, as shown in Figure 20.
Combining the RoI range, the DW river range in each study area, and the EnFCM river results, the final lock extraction results were obtained after filtering, as shown in Figure 21.
From Figure 21, it can be observed that the lock extraction results in each study area are satisfactory. Locks with small and distinct shapes, appearing as “V” or “W” patterns, were successfully extracted from the images.

4.3. Accuracy Verification Results

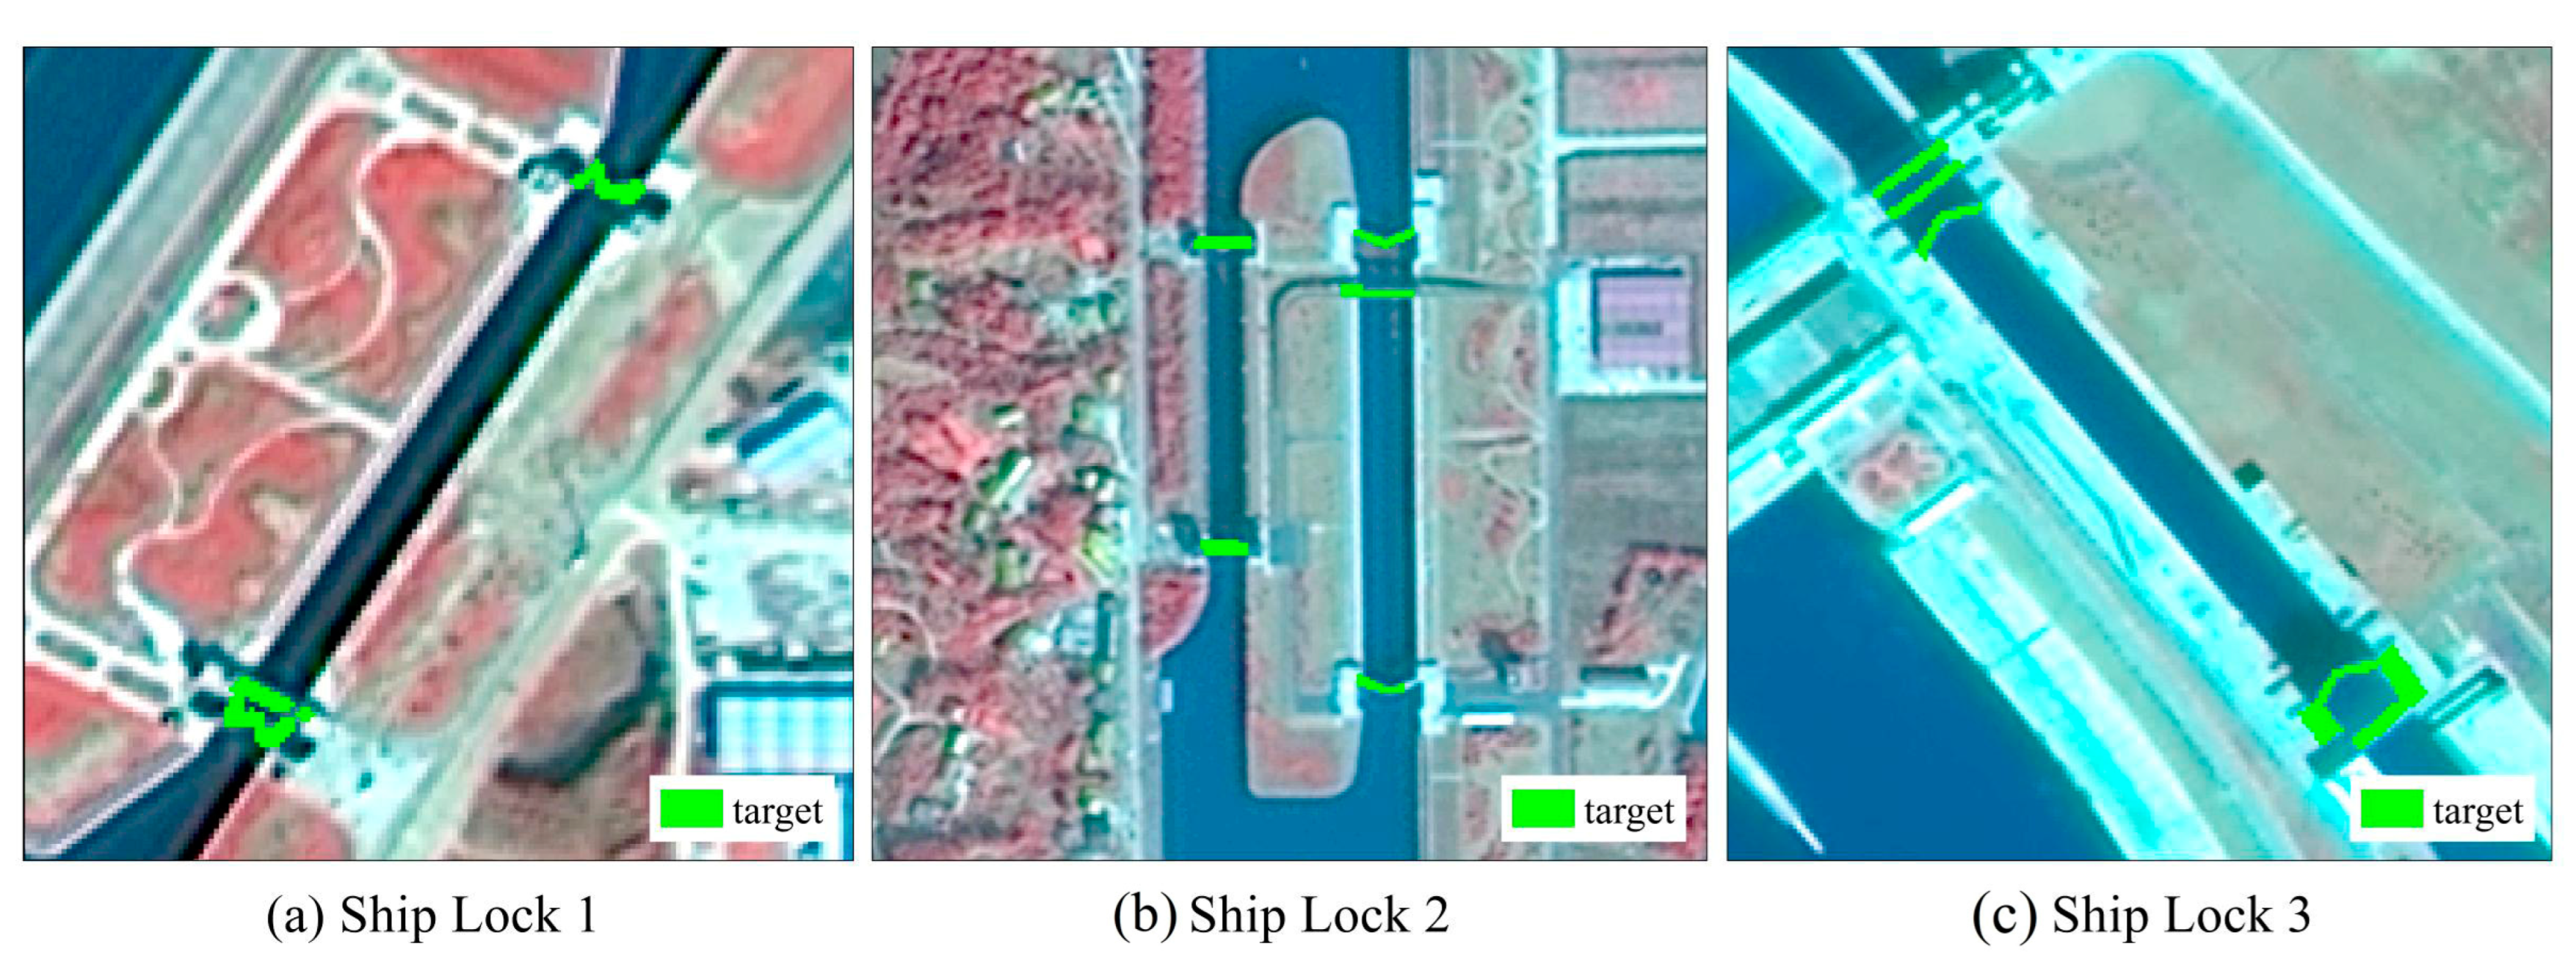
According to the calculation methods of mPA and mIoU, we visually interpreted and plotted the true values of the ship locks in each study area. The results are shown in Figure 22.
Based on the true values of the ship lock target in each study area, combined with the predicted value of the ship lock extracted by the algorithm, the accuracy of mPA and mIoU of the ship lock extraction in each study area was calculated. The results are shown in Table 4.
As shown in the above table, the average pixel accuracy (mPA) for the three ship lock areas is high, with values of 0.784, 0.833, and 0.810, respectively. The overall average mPA reaches 0.803, indicating a good classification effect and demonstrating that the ship lock recognition and extraction model performs well in each area.
Additionally, the mean intersection over union (mIoU) values for the three ship lock areas are 0.740, 0.713, and 0.782, resulting in an average mIoU of 0.745, which also indicates a high level of overlap between the extraction results and the actual ground truth. However, the overall mIoU results are lower than those of the mPA. This discrepancy may be attributed to noise or complex backgrounds affecting the degree of spatial overlap, leading to some non-ship lock areas being mistakenly classified as ship locks.
Based on the above analysis, the accuracy of the ship lock extraction results is relatively high, which also proves the effectiveness and feasibility of this research method.

5. Discussion

In the discussion section, we will delve into the advantages and disadvantages of using fuzzy theory and prior knowledge for extracting locks from high-resolution remote sensing imagery.
Firstly, the fuzzy theory performs remarkably well in handling uncertainty issues in remote sensing imagery, particularly for the precise segmentation of land cover categories in complex scenes. In high-resolution remote sensing imagery, water bodies often exhibit intricate boundaries with their surrounding environment. However, fuzzy theory precisely captures the fuzziness of these boundaries, allowing for the accurate recognition of water regions [37,38]. More importantly, this method effectively utilizes the unique spectral characteristics of man-made structures, distinguishing them from the background of water bodies and even recognizing and extracting small locks [39]. This fine-grained clustering and segmentation capability holds significant importance for image processing, ground object recognition and other fields.
Furthermore, by fully utilizing the distinctive functional features, geometric characteristics, and spectral attributes of locks, as well as prior knowledge, it is possible to differentiate locks from other man-made structures such as bridges that span over water. This is achieved through shape filtering of the channels and applying area thresholding to identify regions suspected to be lock chambers. Consequently, the position of the lock can be determined, effectively excluding other man-made structures that are not locks.
Despite the numerous advantages of this method, there are also limitations in its practical application. Firstly, in terms of objective conditions, when there are a large number of large vessels near the lock in the image, these vessels may affect the extraction of water bodies, leading to errors in identifying lock chambers [40]. This is because large vessels can cause occlusion in the water bodies, especially in narrow rivers with dense vessel traffic, thereby compromising the integrity of the water bodies and making it difficult to accurately extract the river. In addition, narrow bridges and regulating gates within lock chambers, as well as other similar man-made structures, can also introduce interference in the extraction of locks [41,42]. These structures share functional, morphological, and spectral similarities with locks, making them prone to confusion during the recognition process. Secondly, in terms of methods, the experimental process involves the selection and adjustment of multiple thresholds, which requires a certain amount of manual work and requires a certain amount of experience. Therefore, the method of threshold selection and adjustment needs to be improved.
To overcome these limitations, improvements and optimizations can be made in several areas. First, by incorporating richer feature information and integrating other data sources, the accuracy of lock gate identification can be enhanced [43]. For example, integrating high-precision 3D terrain information from LiDAR data can complement the 2D information from remote sensing images, helping to avoid errors in river area extraction caused by shadows. Second, combining machine learning or deep learning algorithms, such as Convolutional Neural Networks (CNNs) and Transformers, can enable us to effectively process and analyze high-resolution remote sensing images. Training models to automatically learn and recognize lock gate features will improve the accuracy and efficiency of identifying numerous small and medium-sized lock gates [44]. Finally, for similar man-made water crossing structures, introducing additional prior knowledge or rules can help distinguish them from lock gates or involve appropriate post-processing to reduce interference and the likelihood of misclassification.

6. Conclusions

As a crucial component of water conservancy projects, ship locks are vital for water transportation, water resource management, and economic development. The identification and extraction of ship locks are essential for the construction and maintenance of these projects, and there is an urgent need to optimize ship lock extraction methods. In this study, remote sensing technology, an advanced observation method, played a key role. Utilizing high-resolution images and fuzzy classification algorithms, this study automatically identifies and extracts ship locks, offering a scientific and efficient method to support ship lock water transportation service management, hydrological environment assessment, and basin water resource management.
This study employs fuzzy theory to cluster and segment images in the study area, accurately identifying water body categories by calculating the similarity between each category and the normalized difference water index (NDWI) threshold water body range. The application of the EnFCM algorithm significantly improves the accuracy of water body extraction and optimizes classification efficiency. Even under complex surface coverage conditions, river areas can be extracted more accurately. Additionally, considering the unique functional, geometric, and spectral characteristics of ship locks compared to other cross-water structures, this paper leverages prior knowledge that the ship lock chamber is approximately rectangular and relatively small in area. By using shape filtering and area threshold screening, we successfully identify suspected lock chamber areas. This method is both logically clear and highly practical, offering a new and effective approach for the automatic identification and extraction of artificial structures across water, particularly ship locks. It can be effectively applied in real-world scenarios involving multiple rivers.
This research utilizes high-resolution remote sensing images to achieve efficient and accurate extraction of ship locks, providing critical data support for water monitoring, shipping management, and other related fields. It addresses the challenges in identifying and extracting special cross-water artificial structures like ship locks. More importantly, remote sensing technology, with its long-term, large-scale, and high-frequency data acquisition capabilities, can monitor the progress of water conservancy projects such as ship locks over extended periods.
Furthermore, the application of remote sensing in ship lock identification and extraction offers robust technical support for independent third-party monitoring. As a crucial component in ensuring transparency and fairness in engineering projects, third-party monitoring can provide objective and accurate assessments based on remote sensing data, effectively mitigating issues related to conflicts of interest and information asymmetry. By regularly publishing remote sensing monitoring reports, third-party organizations can deliver authoritative information on the operational status of ship locks to the public, government agencies, and stakeholders, fostering positive interaction between the sustainable development of water conservancy projects and social oversight.

Author Contributions

Conceptualization, L.M. and L.L.; methodology, Y.S.; validation, Y.S., Y.B. and B.C.; formal analysis, B.C.; resources, Z.L.; writing—original draft preparation, Y.B.; writing—review and editing, B.C.; project administration, Z.W., X.W. and R.M.; funding acquisition, W.Z. All authors have read and agreed to the published version of the manuscript.

Funding

This research was funded by the National Key R&D Program of China under Grant No. 2021YFB3900603.

Data Availability Statement

The data presented in this study are available on request from the corresponding author due to restrictions imposed by involvement in the National Key R&D Program of China.

Acknowledgments

The numerical calculations in this article were performed on the supercomputing system at the Supercomputing Center of Wuhan University.

Conflicts of Interest

The authors declare no conflicts of interest.

References

  1. Liu, J.; Zang, C.; Tian, S.; Liu, J.; Yang, H.; Jia, S.; You, L.; Liu, B.; Zhang, M. Water conservancy projects in China: Achievements, challenges and way forward. Glob. Environ. Chang. 2013, 23, 633–643. [Google Scholar] [CrossRef]
  2. Mei, J. Flood Control Planning and Construction in China. China Water Resour. 2010, 20, 17–19+25. [Google Scholar]
  3. Lu, S.; Wu, B.; Wang, H.; Ouyang, N.; Guo, S. Hydro-ecological impact of water conservancy projects in the Haihe River Basin. Acta Oecologica 2012, 44, 67–74. [Google Scholar] [CrossRef]
  4. Bačkalić, T.; Bugarski, V.; Kulić, F.; Kanović, Ž. Adaptable Fuzzy Expert System for Ship Lock Control Support. J. Navig. 2016, 69, 1341–1356. [Google Scholar] [CrossRef]
  5. Liu, C.; Qi, J.; Chu, X.; Zheng, M.; He, W. Cooperative ship formation system and control methods in the ship lock waterway. Ocean. Eng. 2021, 226, 108826. [Google Scholar] [CrossRef]
  6. Deng, Y.; Sheng, D.; Liu, B. Managing ship lock congestion in an inland waterway: A bottleneck model with a service time window. Transp. Policy 2021, 112, 142–161. [Google Scholar] [CrossRef]
  7. Bugarski, V.; Bačkalić, T.; Kuzmanov, U. Fuzzy decision support system for ship lock control. Expert Syst. Appl. 2013, 40, 3953–3960. [Google Scholar] [CrossRef]
  8. Zhang, P.; Wang, W.; Zhou, J.; Jiang, Y.; Chen, X. Research on the Condition Monitoring of the Reverse Tainter Valve in Ship Locks. In Proceedings of the 2020 Prognostics and Health Management Conference (PHM-Besançon), Besancon, France, 4–7 May 2020; pp. 287–290. [Google Scholar]
  9. Su, C.; Bai, J. Structural optimization of ship lock heads during construction period considering concrete creep. Math. Probl. Eng. 2020, 2020, 5495202. [Google Scholar] [CrossRef]
  10. Buldgen, L.; Le Sourne, H.; Rigo, P. Simplified analytical method for estimating the resistance of lock gates to ship impacts. J. Appl. Math. 2012, 2012, 763849. [Google Scholar] [CrossRef]
  11. Aijun, C. Research on Automatic Recognition Algorithm of Typical Man-Made Targets; Harbin Institute of Technology: Harbin, China, 2008. [Google Scholar]
  12. Changfei, T. Research on road bridge extraction method based on satellite data. Sci. Technol. Inf. 2018, 16, 65–66. [Google Scholar]
  13. Chen, C.; Qin, Q.; Zhang, N.; Li, J.; Chen, L.; Wang, J.; Qin, X.; Yang, X. Extraction of bridges over water from high-resolution optical remote-sensing images based on mathematical morphology. Int. J. Remote Sens. 2014, 35, 3664–3682. [Google Scholar] [CrossRef]
  14. Lu, H.; Deng, Y.; Huang, Z.; Zhang, J. Extraction of bridges from high resolution remote sensing image based on topology modeling. In Proceedings of the 2014 IEEE International Conference on Cloud Engineering, Boston, MA, USA, 11–14 March 2014; pp. 494–499. [Google Scholar]
  15. Fu, Y.; Xing, K.; Huang, Y.; Xiao, Y. Recognition of bridge over water in high-resolution remote sensing images. In Proceedings of the 2009 WRI World Congress on Computer Science and Information Engineering, Los Angeles, CA, USA, 31 March–2 April 2009; Volume 2, pp. 621–625. [Google Scholar]
  16. Xue, J.; Zheng, Y.; Dong-Ye, C.; Wang, P.; Yasir, M. Improved YOLOv5 network method for remote sensing image-based ground objects recognition. Soft Comput. 2022, 26, 10879–10889. [Google Scholar] [CrossRef]
  17. Yang, M.S.; Hu, Y.J.; Lin, K.C.R.; Lin, C.C.L. Segmentation techniques for tissue differentiation in MRI of Ophthalmology using fuzzy clustering algorithms. Magn. Reson. Imaging 2002, 20, 173–179. [Google Scholar] [CrossRef]
  18. Chuang, K.S.; Tzeng, H.L.; Chen, S.; Wu, J.; Chen, T.J. Fuzzy c-means clustering with spatial information for image segmentation. Comput. Med. Imaging Graph. 2006, 30, 9–15. [Google Scholar] [CrossRef]
  19. Liu, J.; Xu, M. Kernelized fuzzy attribute C-means clustering algorithm. Fuzzy Set Syst. 2008, 159, 2428–2445. [Google Scholar] [CrossRef]
  20. Szilagyi, L.; Benyo, Z.; Szilagyii, S.M.; Adam, H.S. MR brain image segmentation using an enhanced fuzzy cmeans algorithm. In Proceedings of the 25th Annual International Conference of IEEE EMBS, Cancun, Mexico, 17–21 September 2003; pp. 17–21. [Google Scholar]
  21. Singh, T.; Gosain, A. Comparison of Different Fuzzy Clustering Algorithms: A Replicated Case Study. In Information and Decision Sciences; Satapathy, S., Tavares, J., Bhateja, V., Mohanty, J., Eds.; Advances in Intelligent Systems and Computing; Springer: Singapore, 2018; Volume 701, pp. 267–275. [Google Scholar] [CrossRef]
  22. Torra, V. On Fuzzy c-Means and Membership Based Clustering. In Advances in Computational Intelligence; Rojas, I., Joya, G., Catala, A., Eds.; IWANN 2015; Lecture Notes in Computer Science; Springer: Cham, Switzerland, 2015; Volume 9094. [Google Scholar] [CrossRef]
  23. Chen, X.; Zhu, J.; Zhang, Z. Researching on the Single Lock Chamber Automatic Layout Algorithm. Appl. Mech. Mater. 2014, 678, 39–42. [Google Scholar] [CrossRef]
  24. Brown, C.F.; Brumby, S.P.; Guzder-Williams, B.; Birch, T.; Hyde, S.B.; Mazzariello, J.; Czerwinski, W.; Pasquarella, V.J.; Haertel, R.; Ilyushchenko, S.; et al. Dynamic World, Near real-time global 10 m land use land cover mapping. Sci. Data 2022, 9, 251. [Google Scholar] [CrossRef]
  25. Zhang, W.; Li, C.; Zhang, Y.-Z. A new hybrid algorithm for image segmentation based on rough sets and enhanced fuzzy c-means clustering. In Proceedings of the 2009 IEEE International Conference on Automation and Logistics, Shenyang, China, 5–7 August 2009; pp. 1212–1216. [Google Scholar]
  26. Daskalakis, A.; Cavouras, D.; Bougioukos, P.; Kostopoulos, S.; Georgiadis, P.; Kalatzis, I.; Kagadis, G.; Nikiforidis, G. Genes expression level quantification using a spot-based algorithmic pipeline. In Proceedings of the 2007 29th Annual International Conference of the IEEE Engineering in Medicine and Biology Society, Lyon, France, 22–26 August 2007; pp. 1148–1151. [Google Scholar]
  27. McFeeters, S.K. The use of the Normalized Difference Water Index (NDWI) in the delineation of open water features. Int. J. Remote Sens. 1996, 17, 1425–1432. [Google Scholar] [CrossRef]
  28. Willmott, C.J.; Matsuura, K. Advantages of the mean absolute error (MAE) over the root mean square error (RMSE) in assessing average model performance. Clim. Res. 2005, 30, 79–82. [Google Scholar] [CrossRef]
  29. Guo, H.; He, G.; Jiang, W.; Yin, R.; Yan, L.; Leng, W. A Multi-Scale Water Extraction Convolutional Neural Network (MWEN) Method for GaoFen-1 Remote Sensing Images. ISPRS Int. J. Geo-Inf. 2020, 9, 189. [Google Scholar] [CrossRef]
  30. Wang, T.; Li, T. Ship lock management and dynamic congestion toll for ships. Ocean. Coast. Manag. 2022, 230, 106369. [Google Scholar] [CrossRef]
  31. Zhang, H.; Ke, J. An Intelligent Scheduling System and Hybrid Optimization Algorithm for Ship Locks of the Three Gorges Hub on the Yangtze River. Mech. Syst. Signal Process. 2024, 208, 110974. [Google Scholar] [CrossRef]
  32. Fan, Q.; Zhu, H.; Geng, J. Monitoring result analyses of high slope of five-step ship lock in the Three Gorges Project. J. Rock Mech. Geotech. Eng. 2015, 7, 199–206. [Google Scholar] [CrossRef]
  33. Chen, C.; Qin, Q.M.; Chen, L.; Wang, J.L.; Liu, M.C.; Wen, Q. Extraction of water bridges from high-resolution remote sensing images based on spectral feature analysis of ground objects. Spectrosc. Spectr. Anal. 2013, 33, 718–722. [Google Scholar]
  34. Zhang, J.; Zhao, X.; Chen, Z.; Lu, Z. A Review of Deep Learning-Based Semantic Segmentation for Point Cloud. IEEE Access 2019, 7, 179118–179133. [Google Scholar] [CrossRef]
  35. Zhao, D.; Yuan, B.; Gao, Y.; Qi, X.; Shi, Z. UGCNet: An Unsupervised Semantic Segmentation Network Embedded With Geometry Consistency for Remote-Sensing Images. IEEE Geosci. Remote Sens. Lett. 2022, 19, 5510005. [Google Scholar] [CrossRef]
  36. Tian, L.; Zhong, X.; Chen, M. Semantic Segmentation of Remote Sensing Image Based on GAN and FCN Network Model. Sci. Program. 2021, 2021, 9491376. [Google Scholar] [CrossRef]
  37. Vagnoli, M.; Remenyte-Prescott, R. An automatic bridge damage diagnostics method using empirical mode decomposition based health indicators and neuro-fuzzy classification. Struct. Control. Health Monit. 2022, 29, e3027. [Google Scholar] [CrossRef]
  38. Zhou, Y.; Chu, X.; Jiang, Z.; Yu, Z. Research on Navigation Risk Identification of Three Gorges Ship Lock Based on Improved Analytic Hierarchy Process. In Proceedings of the 2019 5th International Conference on Transportation Information and Safety (ICTIS), Liverpool, UK; 2019; pp. 276–280. [Google Scholar]
  39. Liu, C.; Wang, S.; Yang, J. Context Feature Based Bridge Detection for Polarimetric SAR Images. In Proceedings of the IGARSS 2023—2023 IEEE International Geoscience and Remote Sensing Symposium, Pasadena, CA, USA, 16–21 July 2023; pp. 7777–7780. [Google Scholar]
  40. Liu, R.; Jiang, Z.; Wang, C.; Tao, X. A Population-Based Ant Algorithm for the Lock Chamber Arrangement Problem. In Proceedings of the 2020 IEEE 6th International Conference on Control Science and Systems Engineering (ICCSSE), Beijing, China, 17–19 July 2020; pp. 82–85. [Google Scholar]
  41. Chen, A. Novel Approach for Recognizing Bridges over Water in Large Remote Sensing Images. In Proceedings of the 2008 International Symposium on Computational Intelligence and Design, Wuhan, China, 17–18 October 2008; pp. 47–51. [Google Scholar]
  42. Kalidindi, M.K.; Khosa, R.; Bairwa, A.K. Extraction of flow features around a bridge pier with an evolving scour hole using Lagrangian coherent structures. Phys. Fluids 2024, 36, 055133. [Google Scholar] [CrossRef]
  43. Shi, S.; Zhang, D.; Su, Y.; Wan, C.; Zhang, M.; Liu, C. A Fuzzy-Based Decision-Making Model for Improving the Carrying Capacity of Ship Locks: A Three Gorges Dam Case. J. Mar. Sci. Eng. 2019, 7, 244. [Google Scholar] [CrossRef]
  44. Tang, R.; Dong, G. Bridge-over-water detection via modulated deformable convolution and attention mechanisms. EURASIP J. Adv. Signal Process. 2022, 2022, 56. [Google Scholar] [CrossRef]
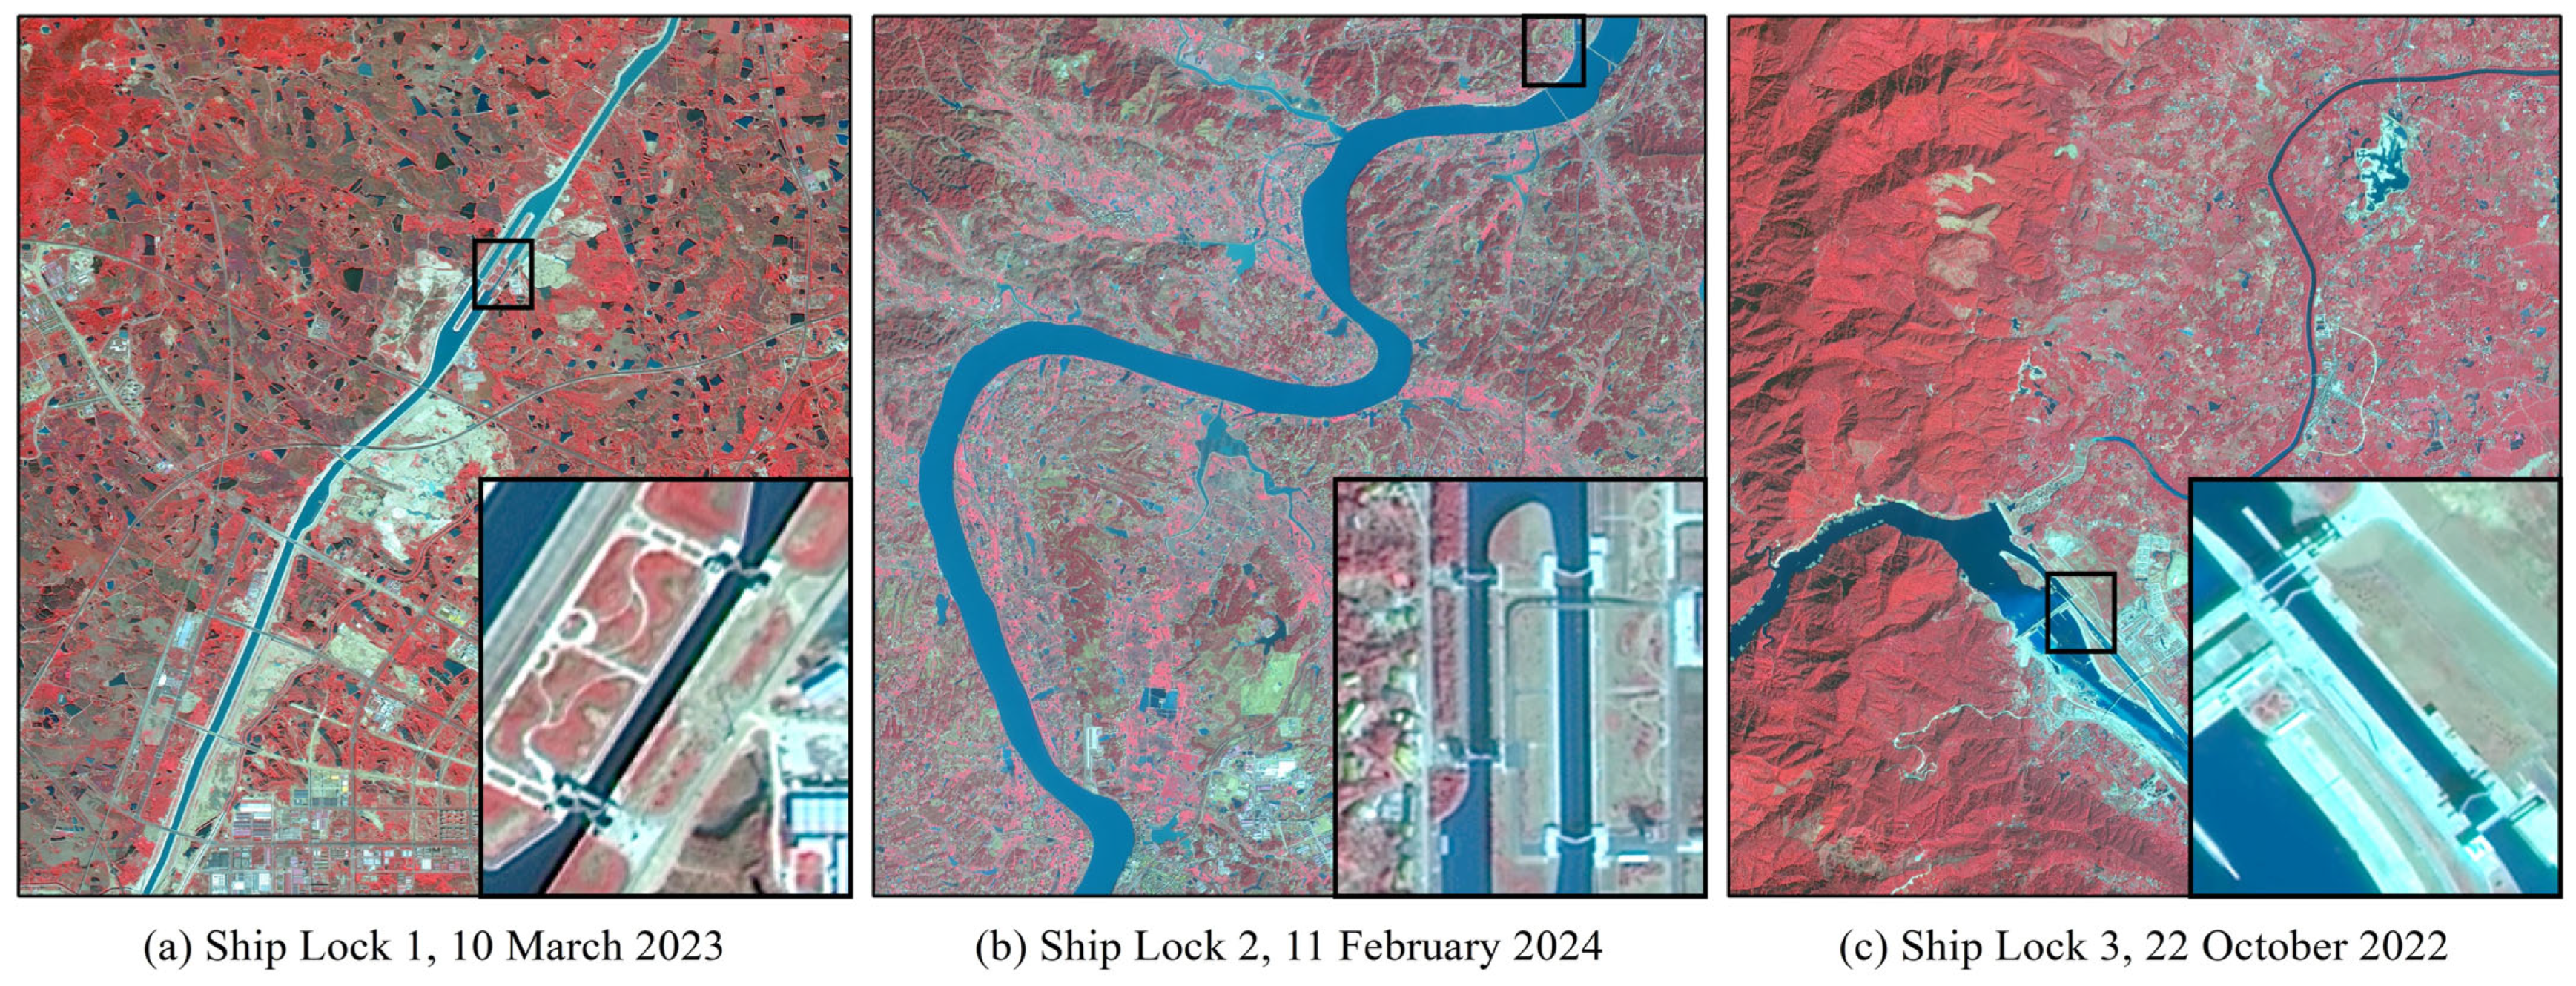
Figure 1. High-resolution remote sensing images of ship locks in each study area: (a) Ship Lock 1, taken on 10 March 2023; (b) Ship Lock 2, taken on 11 February 2024; (c) Ship Lock 3, taken on 22 October 2022.
Remotesensing 16 03181 g001
Figure 2. DW water body probability data in each study area: (a) Ship Lock 1 study area; (b) Ship Lock 2 study area; (c) Ship Lock 3 study area.
Remotesensing 16 03181 g002
Figure 3. Technical flow chart.
Remotesensing 16 03181 g003
Figure 4. Schematic diagram of river area extraction steps.
Remotesensing 16 03181 g004
Figure 5. Schematic diagram of ship lock recognition steps.
Remotesensing 16 03181 g005
Figure 6. Eight-neighbor connected domain processing schematic diagram.
Remotesensing 16 03181 g006
Figure 7. Ship lock RoI diagram.
Remotesensing 16 03181 g007
Figure 8. Comparison of different values of dw_thresh.
Remotesensing 16 03181 g008
Figure 9. Comparison of different values of dw_channel_area.
Remotesensing 16 03181 g009
Figure 10. DW water body probability data at each lock.
Remotesensing 16 03181 g010
Figure 11. DW threshold binarization processing.
Remotesensing 16 03181 g011
Figure 12. Area threshold shape filter.
Remotesensing 16 03181 g012
Figure 13. Line chart of the relationship between the MEA values, run time, and number of clusters c for each research area lock gate.
Remotesensing 16 03181 g013
Figure 14. EnFCM river results in each study area (the left image is a large-scale result map of the study area, the right image is a detailed display map of the lock area, and the base images are all false color GF images): (a) Ship Lock 1 study area; (b) Ship Lock 2 study area; (c) Ship Lock 3 study area.
Remotesensing 16 03181 g014
Figure 15. Comparison of different values of fcm_channel_area.
Remotesensing 16 03181 g015
Figure 16. Comparison of different values of small_channel_thresh.
Remotesensing 16 03181 g016
Figure 17. EnFCM water body results at channels in each study area.
Remotesensing 16 03181 g017
Figure 18. First area threshold shape filter.
Remotesensing 16 03181 g018
Figure 19. Second area threshold shape filter.
Remotesensing 16 03181 g019
Figure 20. RoI results for each study area: (a) Ship Lock 1 study area; (b) Ship Lock 2 study area; (c) Ship Lock 3 study area.
Remotesensing 16 03181 g020
Figure 21. Extraction results of ship locks in each study area: (a) Ship Lock 1 study area; (b) Ship Lock 2 study area; (c) Ship Lock 3 study area.
Remotesensing 16 03181 g021
Figure 22. The true values of ship locks in each study area: (a) Ship Lock 1 study area; (b) Ship Lock 2 study area; (c) Ship Lock 3 study area.
Remotesensing 16 03181 g022
Table 1. Overview of DW water body thresholds.
Threshold NameDescriptionValue
dw_threshWater body probability threshold, used to binarize DW water bodies.Ship Lock 10.26
Ship Lock 20.34
Ship Lock 30.08
dw_channel_areaArea threshold, used for shape area filtering to extract river areas.Ship Lock 1500,000
Ship Lock 2300,000
Ship Lock 3300,000
Table 2. MAE values corresponding to different classification cluster numbers c.
Study Areac ValueMAERun Time (s)
Ship Lock 120.49191.052
30.24681.329
40.15991.555
50.130113.037
60.108122.446
70.099112.803
80.091115.523
90.091120.173
Ship Lock 220.48881.828
30.19987.604
40.10682.235
50.08496.079
60.06683.930
70.05083.337
80.05095.168
90.03786.178
Ship Lock 320.32998.623
30.18387.674
40.10477.027
50.06281.076
60.04787.227
70.03885758
80.030100.219
90.024103.490
Table 3. Overview of area thresholds.
Threshold NameDescriptionValue
fcm_channel_areaThe first area threshold, used to filter the first shape area filter.Ship Lock 1500
Ship Lock 21000
Ship Lock 31000
small_channel_threshThe second area threshold, used for the second shape area screening and extraction gate chamber.Ship Lock 1600
Ship Lock 22000
Ship Lock 32000
Table 4. Accuracy verification results for each study area.
Study AreamAPmIoU
Ship Lock 10.7840.740
Ship Lock 20.8330.713
Ship Lock 30.8100.782
Average0.8090.745
Disclaimer/Publisher’s Note: The statements, opinions and data contained in all publications are solely those of the individual author(s) and contributor(s) and not of MDPI and/or the editor(s). MDPI and/or the editor(s) disclaim responsibility for any injury to people or property resulting from any ideas, methods, instructions or products referred to in the content.