Early-Stage Mapping of Winter Canola by Combining Sentinel-1 and Sentinel-2 Data in Jianghan Plain China
Abstract
:1. Introduction
2. Materials and Methods
2.1. Study Area
2.2. Datasets and Processing
2.2.1. Sentinel-1 Data
2.2.2. Sentinel-2 Data
2.2.3. Sample Data
2.2.4. Field Survey Data
2.3. Feature Extraction
2.4. Feature Selection
2.5. Classification Models
2.6. Accuracy Assessment
3. Results
3.1. Feature Analysis
3.1.1. Backscattering Features of Winter Canola at Different Phenological Stages
3.1.2. Textural Features of Winter Canola at Different Phenological Stages
3.1.3. Spectral Indices of Winter Canola at Different Phenological Stages
3.2. Earliest Mapping Timing Based on Sentinel-1
3.3. Earliest Mapping Timing Based on Sentinel-1 and Sentinel-2
3.4. Mapping Multiyear and Early-Stage Winter Canola
4. Discussion
4.1. Important Features for Winter Canola Early-Season Mapping
4.2. Advantages of Combination of Sentinle-1 and Sentinel-2 Data for Winter Canola Mapping
4.3. Future Studies
5. Conclusions
- At the overwintering stage, the differences in the red-edge and near-infrared bands were the largest, followed by VV, DVI, and GOSAVI, which also showed greater differences than the other features
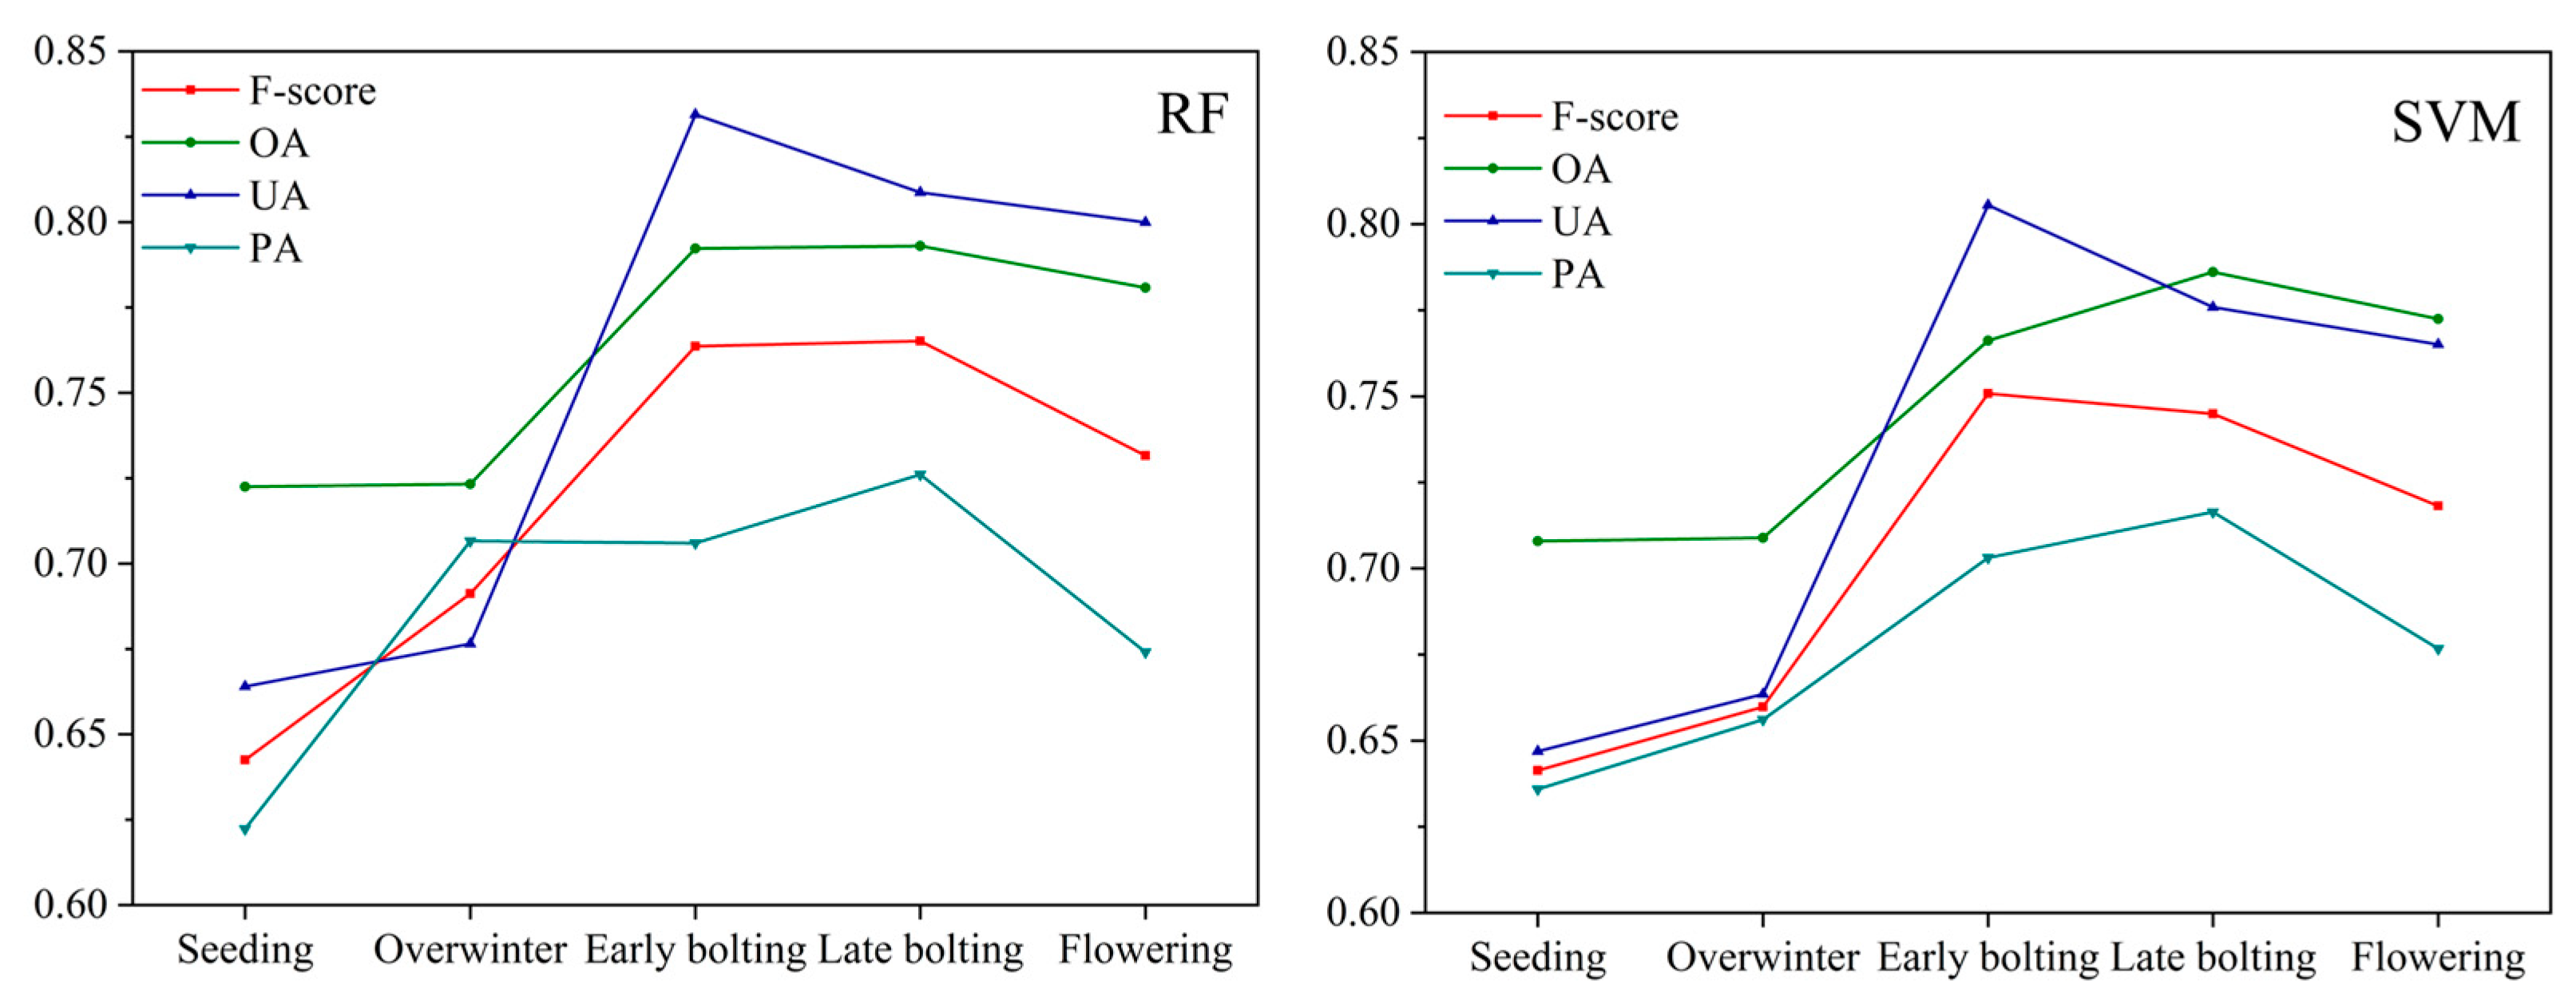
- When using only Sentinel-1 data, the winter canola could be earliest identified at the bolting stage (late January, 3.5 months prior to harvest), that is, 50 days earlier than the traditional flowering period (mid-March). The F-score of winter canola under the RF and SVM models could reach more than 0.75, and the OA could reach more than 80%; the accuracy of the RF model was slightly higher.
- Combining Sentinel-1 and Sentinel-2 data, the winter canola could be mapped earliest during the early overwinter stage (late December, 4.5 months prior to harvest), with the F-score of winter canola over 0.85 and the OA over 81% under the RF and SVM models. Adding Sentinel-1 could improve the overall accuracy by about 2–4% and the F-score by about 1–2% in winter canola mapping.
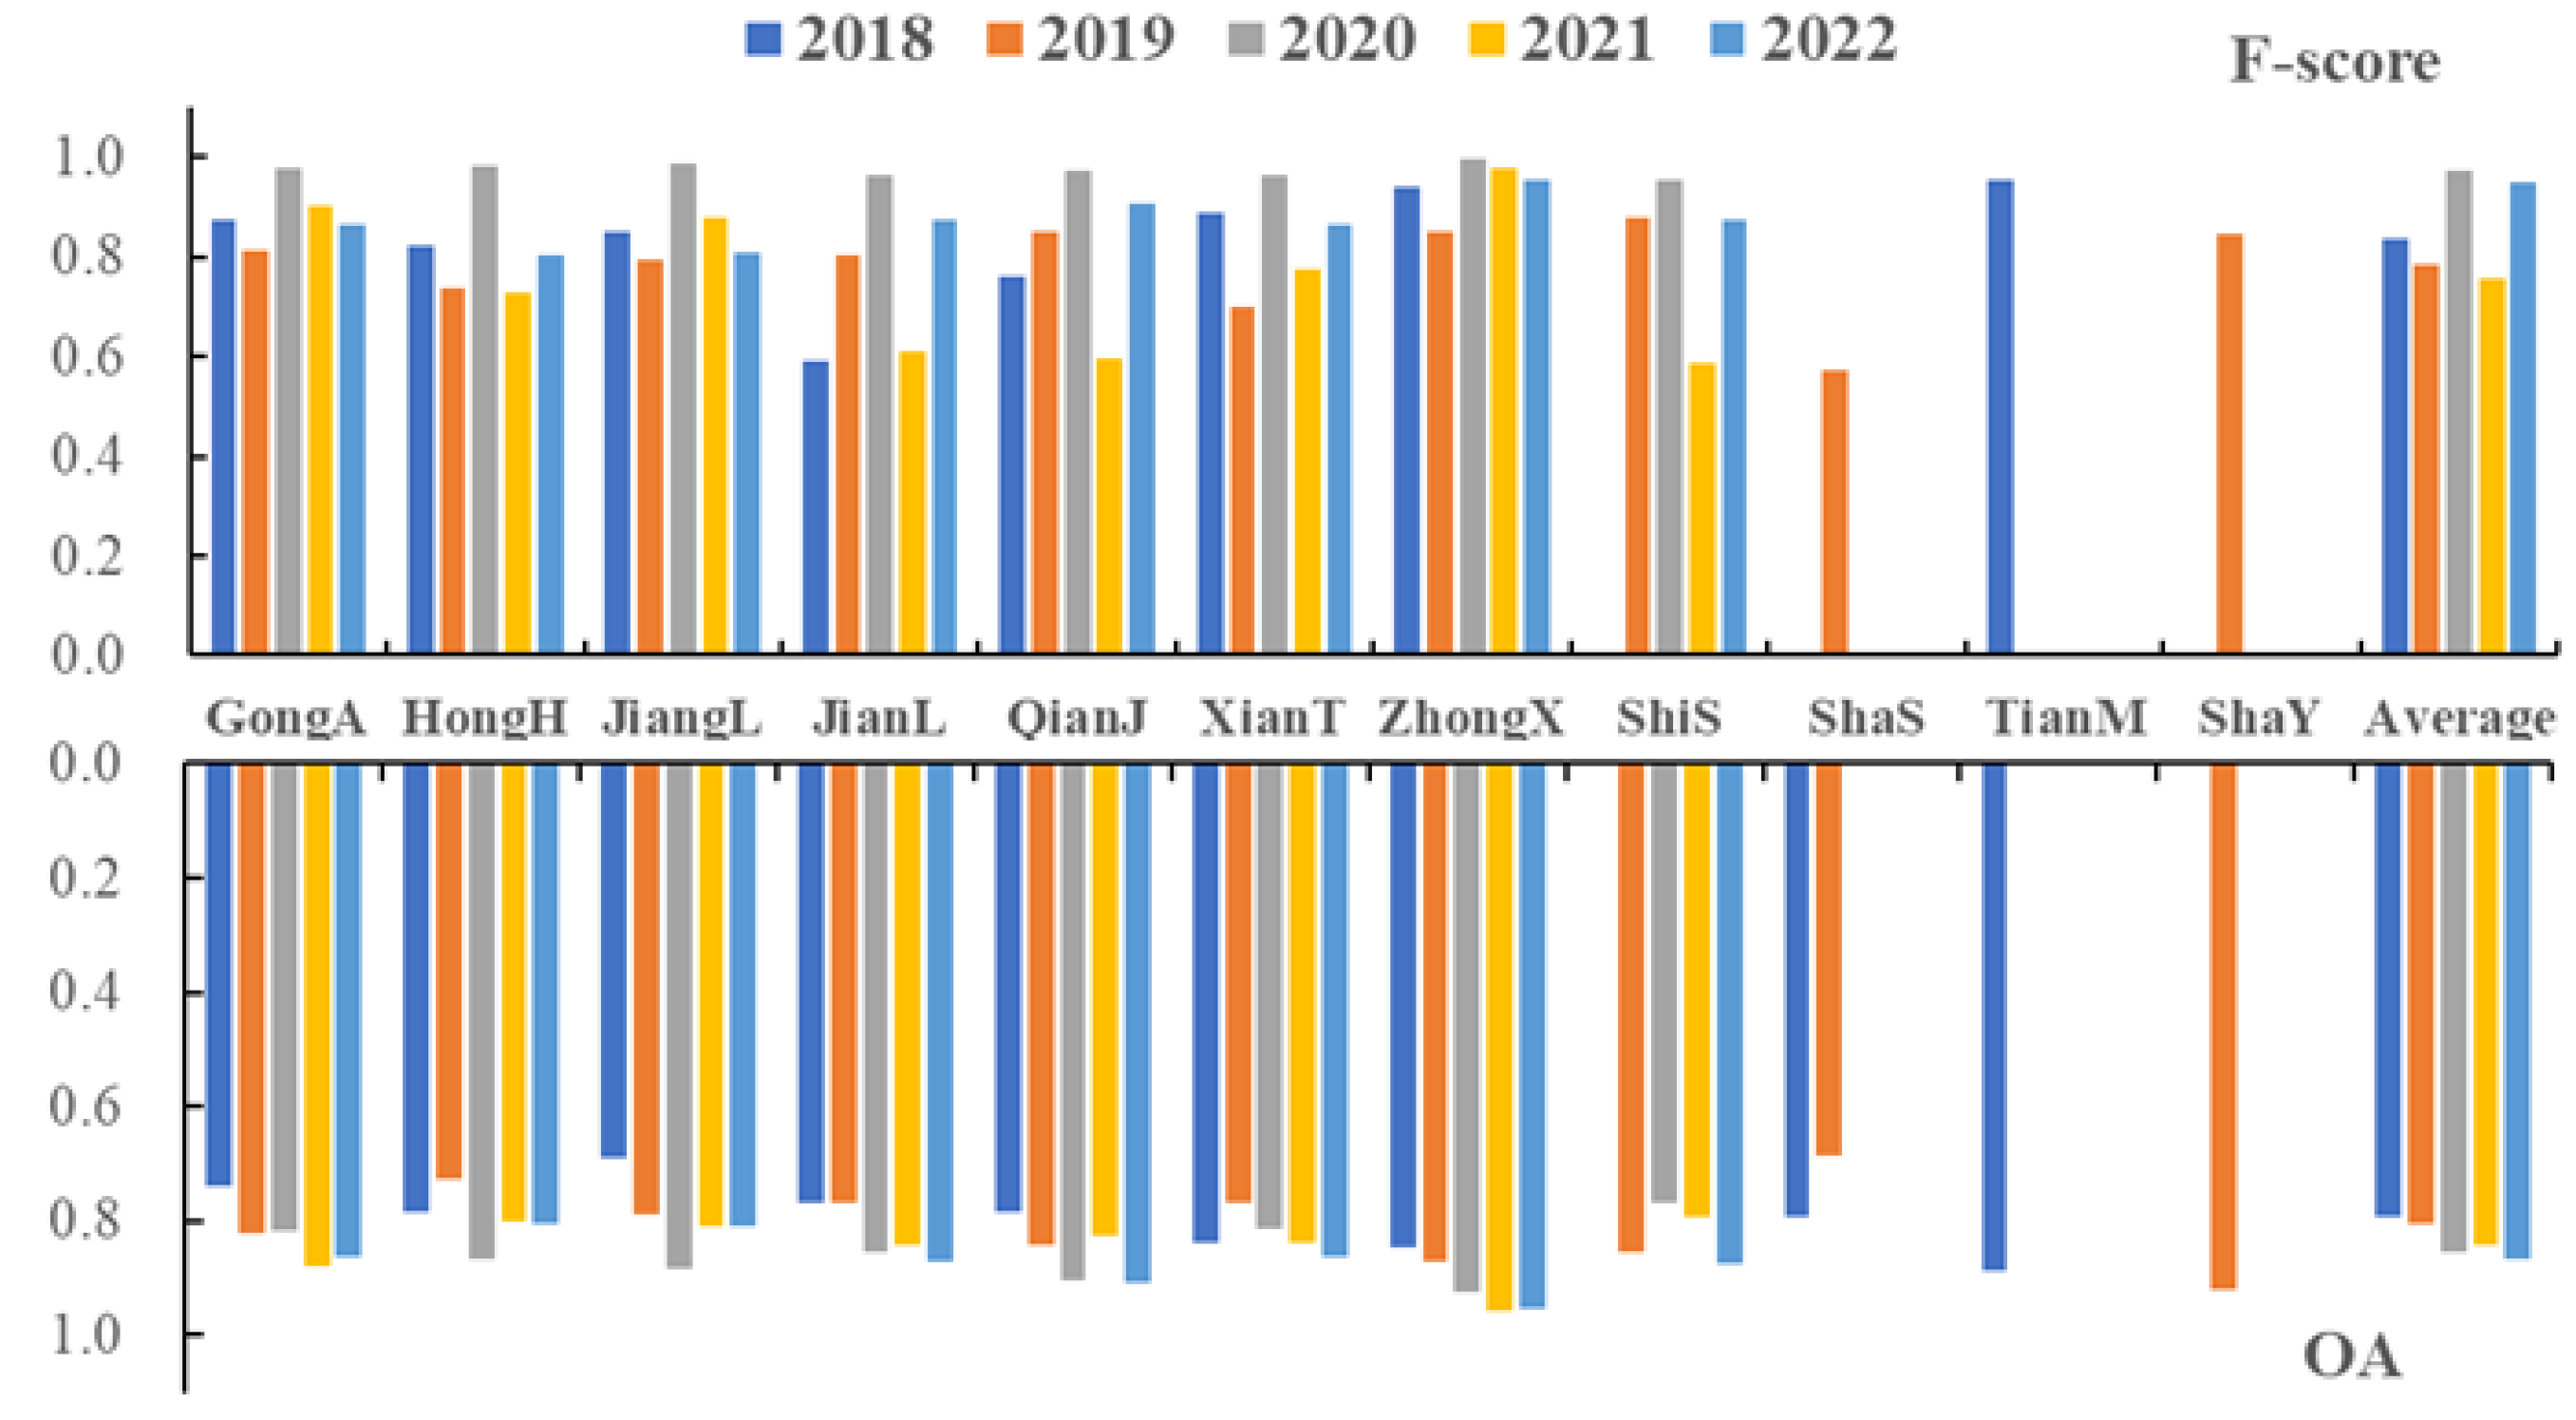
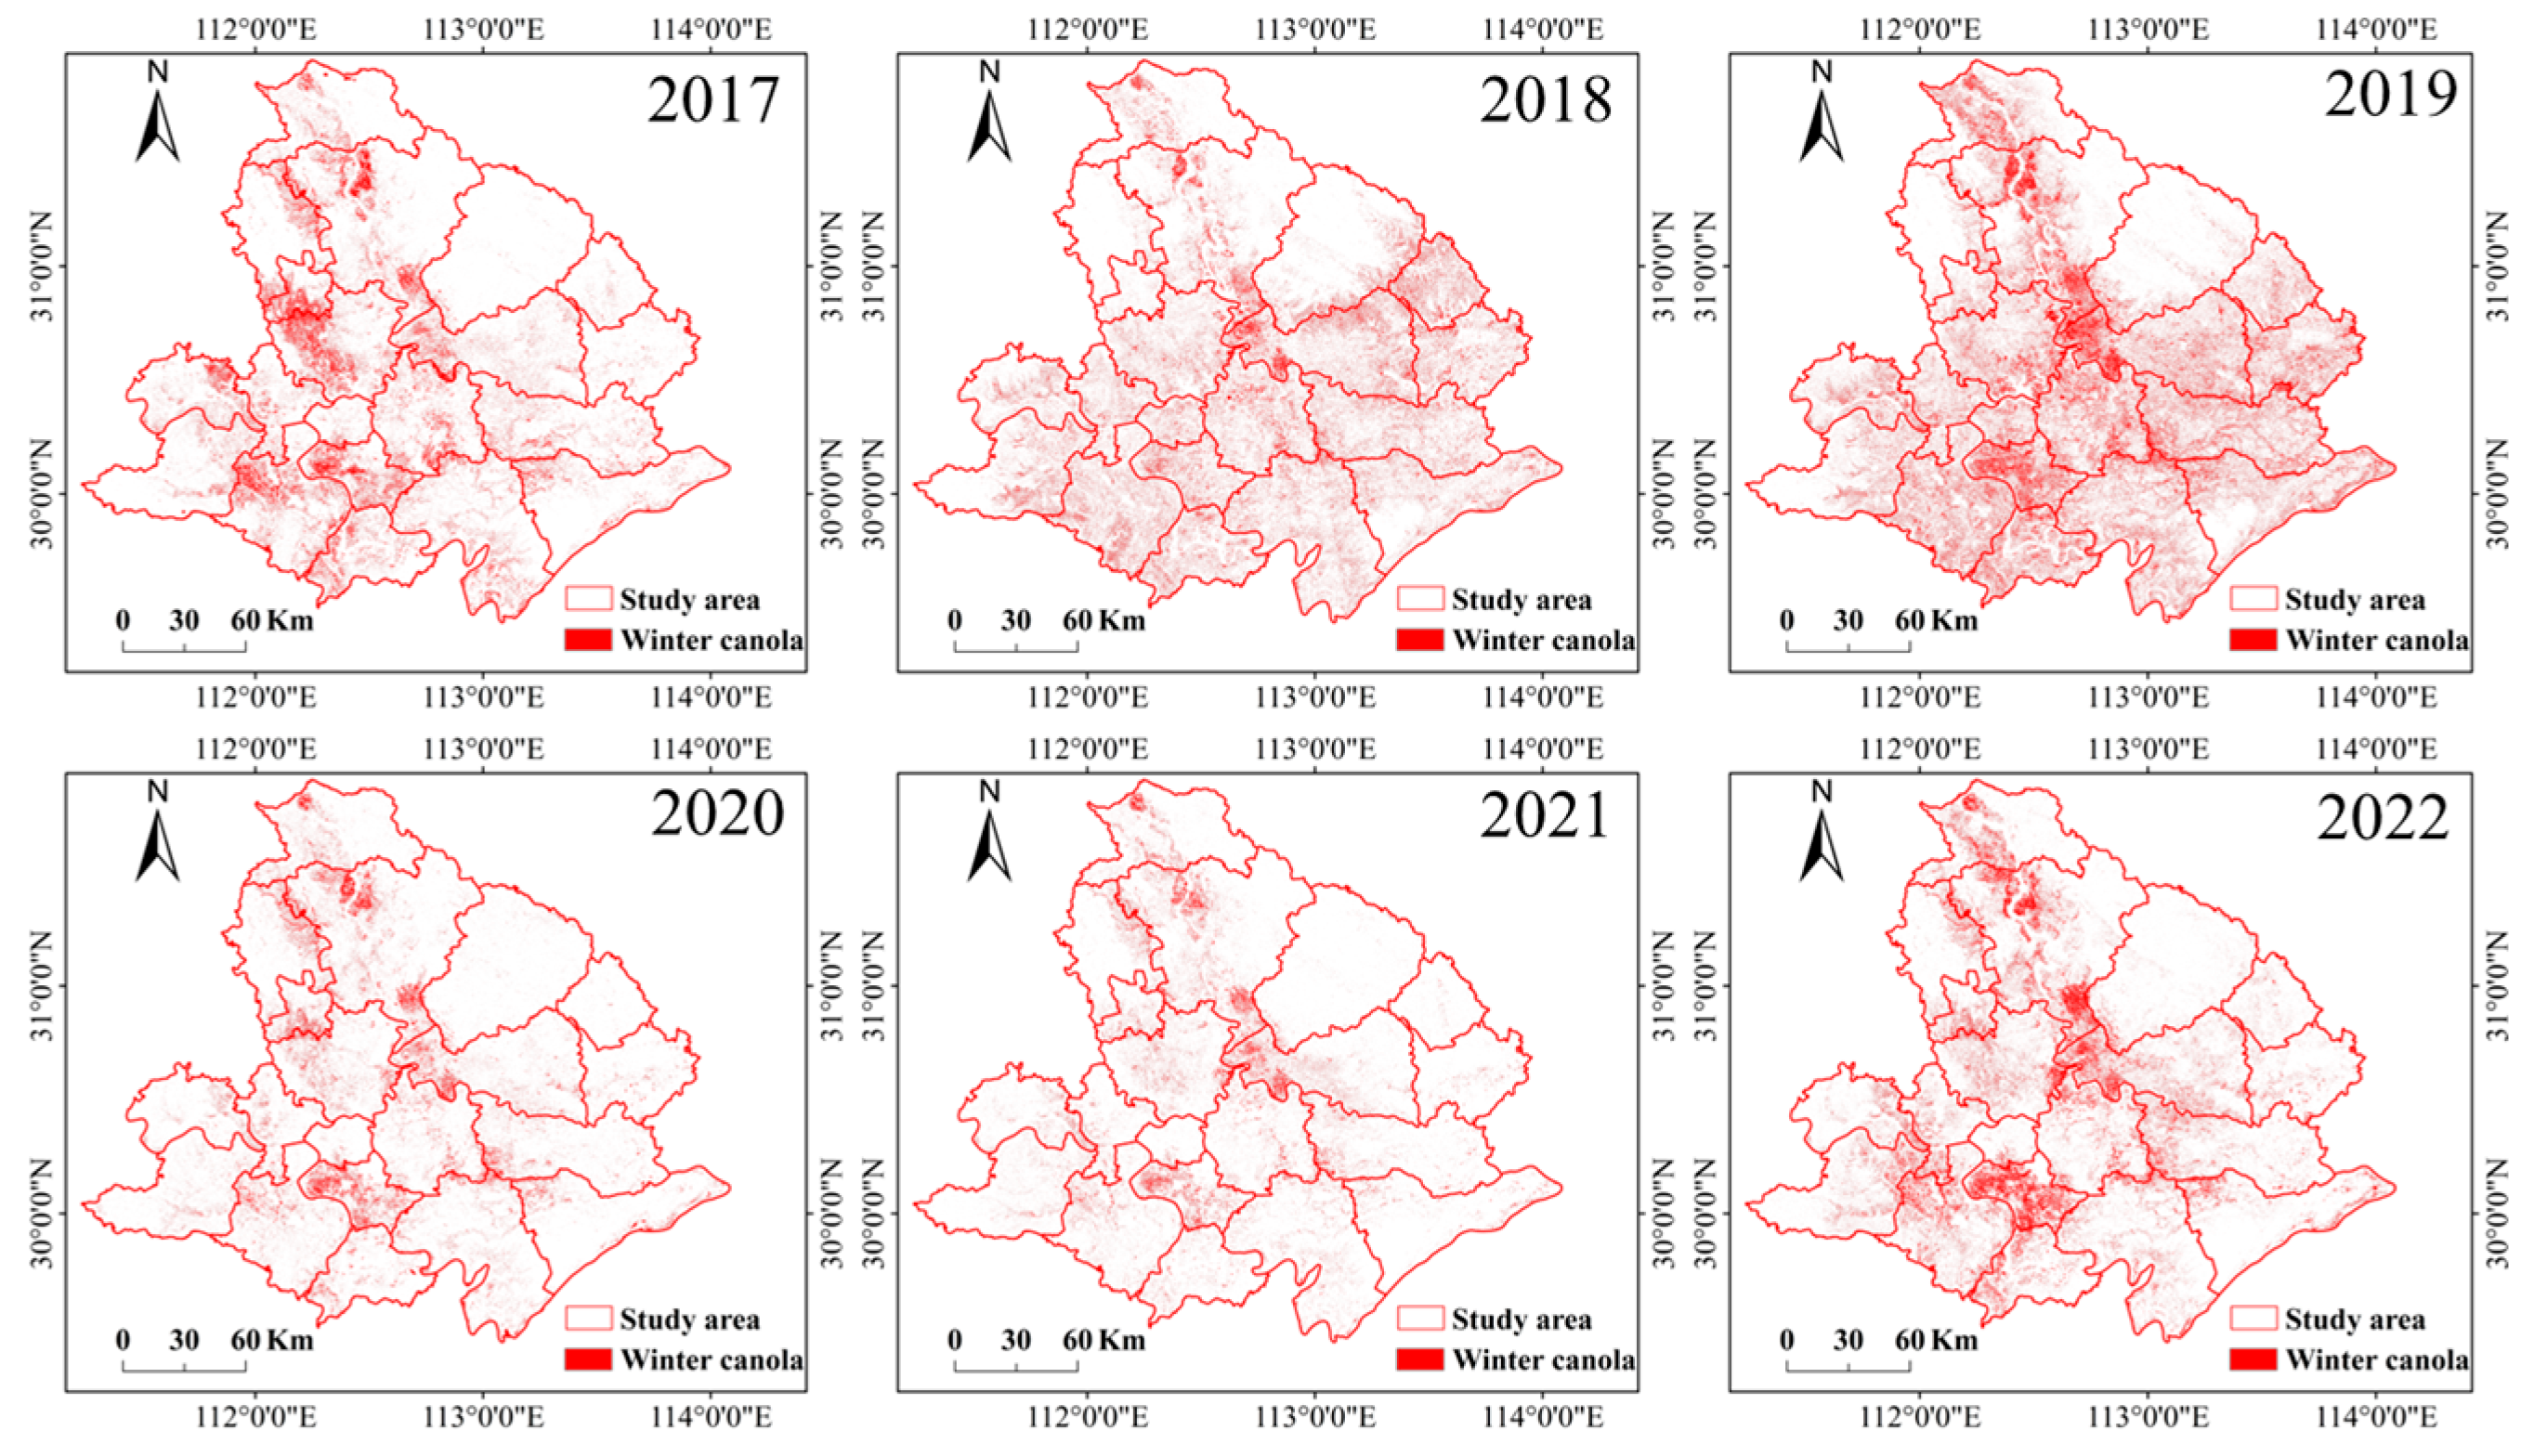
- The F-score of winter canola mapping based on the classifier transfer approach in 2018–2022 varied between 0.75 and 0.97, and the OA ranged from 79% to 86%.
Supplementary Materials
Author Contributions
Funding
Data Availability Statement
Acknowledgments
Conflicts of Interest
References
- Sulik, J.J.; Long, D.S. Spectral indices for yellow canola flowers. Int. J. Remote Sens. 2015, 36, 2751–2765. [Google Scholar] [CrossRef]
- Kontgis, C.; Schneider, A.; Ozdogan, M. Mapping rice paddy extent and intensification in the Vietnamese Mekong River Delta with dense time stacks of Landsat data. Remote Sens. Environ. 2015, 169, 255–269. [Google Scholar] [CrossRef]
- Zhang, M.; Lin, H. Object-based rice mapping using time-series and phenological data. Adv. Space Res. 2019, 63, 190–202. [Google Scholar] [CrossRef]
- Chipanshi, A.; Zhang, Y.; Kouadio, L.; Newlands, N.; Davidson, A.; Hill, H.; Warren, R.; Qian, B.; Daneshfar, B.; Bedard, F. Evaluation of the Integrated Canadian Crop Yield Forecaster (ICCYF) model for in-season prediction of crop yield across the Canadian agricultural landscape. Agric. For. Meteorol. 2015, 206, 137–150. [Google Scholar] [CrossRef]
- Song, Q.; Hu, Q.; Zhou, Q.; Hovis, C.; Xiang, M.; Tang, H.; Wu, W. In-season crop mapping with GF-1/WFV data by combining object-based image analysis and random forest. Remote Sens. 2017, 9, 1184. [Google Scholar] [CrossRef]
- Mosleh, M.; Hassan, Q.; Chowdhury, E. Application of Remote Sensors in Mapping Rice Area and Forecasting Its Production: A Review. Comput. Fluids 2015, 117, 114–124. [Google Scholar] [CrossRef]
- Jing, Y.; Li, G.; Chen, J.; Shi, Y. Determination of Paddy Rice Growth Indicators with MODIS Data and Ground-Based Measurements of LAI; Atlantis Press: Dordrecht, The Netherlands, 2013. [Google Scholar]
- Jin, Z.; Azzari, G.; You, C.; Di Tommaso, S.; Aston, S.; Burke, M.; Lobell, D.B. Smallholder maize area and yield mapping at national scales with Google Earth Engine. Remote Sens. Environ. 2019, 228, 115–128. [Google Scholar] [CrossRef]
- Belgiu, M.; Csillik, O. Sentinel-2 cropland mapping using pixel-based and object-based time-weighted dynamic time warping analysis. Remote Sens. Environ. 2018, 204, 509–523. [Google Scholar] [CrossRef]
- Griffiths, P.; Nendel, C.; Hostert, P. Intra-annual reflectance composites from Sentinel-2 and Landsat for national-scale crop and land cover mapping. Remote Sens. Environ. 2019, 220, 135–151. [Google Scholar] [CrossRef]
- Wang, M.; Zheng, Y.; Huang, C.; Meng, R.; Pang, Y.; Jia, W.; Zhou, J.; Huang, Z.; Fang, L.; Zhao, F. Assessing Landsat-8 and Sentinel-2 spectral-temporal features for mapping tree species of northern plantation forests in Heilongjiang Province, China. For. Ecosyst. 2022, 9, 100032. [Google Scholar] [CrossRef]
- Huang, Z.; Zhong, L.; Zhao, F.; Wu, J.; Tang, H.; Lv, Z.; Xu, B.; Zhou, L.; Sun, R.; Meng, R. A spectral-temporal constrained deep learning method for tree species mapping of plantation forests using time series Sentinel-2 imagery. ISPRS J. Photogramm. Remote Sens. 2023, 204, 397–420. [Google Scholar] [CrossRef]
- Mercier, A.; Betbeder, J.; Baudry, J.; Le Roux, V.; Spicher, F.; Lacoux, J.; Roger, D.; Hubert-Moy, L. Evaluation of Sentinel-1 & 2 time series for predicting wheat and rapeseed phenological stages. ISPRS J. Photogramm. Remote Sens. 2020, 163, 231–256. [Google Scholar]
- Liu, S.S.; Chen, Y.R.; Ma, Y.T.; Kong, X.X.; Zhang, X.Y.; Zhang, D.Y. Mapping Ratoon Rice Planting Area in Central China Using Sentinel-2 Time Stacks and the Phenology-Based Algorithm. Remote Sens. 2020, 12, 3400. [Google Scholar] [CrossRef]
- Sulik, J.J.; Long, D.S. Spectral considerations for modeling yield of canola. Remote Sens. Environ. 2016, 184, 161–174. [Google Scholar] [CrossRef]
- Ashourloo, D.; Shahrabi, H.S.; Azadbakht, M.; Aghighi, H.; Nematollahi, H.; Alimohammadi, A.; Matkan, A.A. Automatic canola mapping using time series of sentinel 2 images. ISPRS J. Photogramm. Remote Sens. 2019, 156, 63–76. [Google Scholar] [CrossRef]
- Han, J.; Zhang, Z.; Cao, J.; Luo, Y. Mapping rapeseed planting areas using an automatic phenology-and pixel-based algorithm (APPA) in Google Earth Engine. Crop. J. 2022, 10, 1483–1495. [Google Scholar] [CrossRef]
- Tao, J.-B.; Liu, W.-B.; Tan, W.-X.; Kong, X.-B.; Meng, X.U. Fusing multi-source data to map spatio-temporal dynamics of winter rape on the Jianghan Plain and Dongting Lake Plain, China. J. Integr. Agric. 2019, 18, 2393–2407. [Google Scholar] [CrossRef]
- De Vroey, M.; de Vendictis, L.; Zavagli, M.; Bontemps, S.; Heymans, D.; Radoux, J.; Koetz, B.; Defourny, P. Mowing detection using Sentinel-1 and Sentinel-2 time series for large scale grassland monitoring. Remote Sens. Environ. 2022, 280, 113145. [Google Scholar] [CrossRef]
- Sun, R.; Zhao, F.; Huang, C.; Huang, H.; Lu, Z.; Zhao, P.; Ni, X.; Meng, R. Integration of deep learning algorithms with a Bayesian method for improved characterization of tropical deforestation frontiers using Sentinel-1 SAR imagery. Remote Sens. Environ. 2023, 298, 113821. [Google Scholar] [CrossRef]
- Park, S.; Im, J.; Park, S.; Yoo, C.; Han, H.; Rhee, J. Classification and mapping of paddy rice by combining Landsat and SAR time series data. Remote Sens. 2018, 10, 447. [Google Scholar] [CrossRef]
- Liao, C.H.; Wang, J.F.; Xie, Q.H.; Baz, A.A.; Huang, X.D.; Shang, J.L.; He, Y.J. Synergistic Use of multi-temporal RADARSAT-2 and VENµS data for crop classification based on 1D convolutional neural network. Remote Sens. 2020, 12, 832. [Google Scholar] [CrossRef]
- Luo, C.; Qi, B.; Liu, H.; Guo, D.; Lu, L.; Fu, Q.; Shao, Y. Using Time Series Sentinel-1 Images for Object-Oriented Crop Classification in Google Earth Engine. Remote Sens. 2021, 13, 561. [Google Scholar] [CrossRef]
- Hu, L.; Xu, N.; Liang, J.; Li, Z.; Chen, L.; Zhao, F. Advancing the Mapping of Mangrove Forests at National-Scale Using Sentinel-1 and Sentinel-2 Time-Series Data with Google Earth Engine: A Case Study in China. Remote Sens. 2020, 12, 3120. [Google Scholar] [CrossRef]
- Gašparović, M.; Dobrinić, D. Comparative assessment of machine learning methods for urban vegetation mapping using multitemporal sentinel-1 imagery. Remote Sens. 2020, 12, 1952. [Google Scholar] [CrossRef]
- Sun, Z.; Luo, J.H.; Yang, J.Z.C.; Yu, Q.Y.; Zhang, L.; Xue, K.; Lu, L.R. Nation-Scale Mapping of Coastal Aquaculture Ponds with Sentinel-1 SAR Data Using Google Earth Engine. Remote Sens. 2020, 12, 3086. [Google Scholar] [CrossRef]
- Wang, P.; Zhang, H.; Patel, V.M. SAR Image Despeckling Using a Convolutional Neural Network. IEEE Signal Process. Lett. 2017, 24, 1763–1767. [Google Scholar] [CrossRef]
- Zhang, K.; Zuo, W.; Chen, Y.; Meng, D.; Zhang, L. Beyond a Gaussian Denoiser: Residual Learning of Deep CNN for Image Denoising. IEEE Trans. Image Process. 2017, 26, 3142–3155. [Google Scholar] [CrossRef] [PubMed]
- Wang, Y.; Feng, L.; Zhang, Z.; Tian, F. An unsupervised domain adaptation deep learning method for spatial and temporal transferable crop type mapping using Sentinel-2 imagery. ISPRS J. Photogramm. Remote Sens. 2023, 199, 102–117. [Google Scholar] [CrossRef]
- Yin, F.; Lewis, P.E.; Gomez-Dans, J. Bayesian atmospheric correction over land: Sentinel-2/MSI and Landsat 8/OLI. Geosci. Model Dev. 2022, 15, 7933–7976. [Google Scholar] [CrossRef]
- Porwal, S.; Katiyar, S.K. Performance evaluation of various resampling techniques on IRS imagery. In Proceedings of the International Conference on Contemporary Computing, Noida, India, 7–9 August 2014. [Google Scholar]
- Periasamy, S. Significance of dual polarimetric synthetic aperture radar in biomass retrieval: An attempt on Sentinel-1. Remote Sens. Environ. 2018, 217, 537–549. [Google Scholar] [CrossRef]
- Haralick, R.M.; Shanmugam, K.; Dinstein, I.H. Textural features for image classification. IEEE Trans. Syst. Man Cybern. 1973, SMC-3, 610–621. [Google Scholar] [CrossRef]
- Conners, R.W.; Trivedi, M.M.; Harlow, C.A. Segmentation of a high-resolution urban scene using texture operators. Comput. Vis. Graph Image Process 1984, 25, 273–310. [Google Scholar] [CrossRef]
- Hastie, T.; Tibshirani, R.; Friedman, J.; Franklin, J. The Elements of Statistical Learning: Data Mining, Inference, and Prediction. Math. Intell. 2004, 27, 83–85. [Google Scholar] [CrossRef]
- Breiman, L.J.M.L. Random Forests. Mach. Learn. 2001, 45, 5–32. [Google Scholar] [CrossRef]
- Genuer, R.; Poggi, J.M.; Tuleau-Malot, C. VSURF: Variable Selection Using Random Forests. Pattern Recognit. Lett. 2016, 31, 2225–2236. [Google Scholar] [CrossRef]
- Chen, N.; Yu, L.; Zhang, X.; Shen, Y.; Zeng, L.; Hu, Q.; Niyogi, D. Mapping Paddy Rice Fields by Combining Multi-Temporal Vegetation Index and Synthetic Aperture Radar Remote Sensing Data Using Google Earth Engine Machine Learning Platform. Remote Sens. 2020, 12, 2992. [Google Scholar] [CrossRef]
- Wei, C.; Huang, J.; Mansaray, L.; Li, Z.; Liu, W.; Han, J. Estimation and Mapping of Winter Oilseed Rape LAI from High Spatial Resolution Satellite Data Based on a Hybrid Method. Remote Sens. 2017, 9, 488. [Google Scholar] [CrossRef]
- Cortes, C.; Vapnik, V. Support-vector networks. Mach. Learn. 1995, 20, 273–297. [Google Scholar] [CrossRef]
- Whelen, T.; Siqueira, P. Use of time-series L-band UAVSAR data for the classification of agricultural fields in the San Joaquin Valley. Remote Sens. Environ. 2017, 193, 216–224. [Google Scholar] [CrossRef]
- Liao, C.; Wang, J.; Shang, J.; Huang, X.; Liu, J.; Huffman, T. Sensitivity study of Radarsat-2 polarimetric SAR to crop height and fractional vegetation cover of corn and wheat. Int. J. Remote Sens. 2018, 39, 1475–1490. [Google Scholar] [CrossRef]
- Mcnairn, H.; Shang, J.; Jiao, X.; Champagne, C. The Contribution of ALOS PALSAR Multipolarization and Polarimetric Data to Crop Classification. IEEE Trans. Geosci. Remote Sens. 2009, 47, 3981–3992. [Google Scholar] [CrossRef]
- Mandal, D.; Kumar, V.; Ratha, D.; Dey, S.; Bhattacharya, A.; Lopez-Sanchez, J.M.; McNairn, H.; Rao, Y.S. Dual polarimetric radar vegetation index for crop growth monitoring using sentinel-1 SAR data. Remote Sens. Environ. 2020, 247, 111954. [Google Scholar] [CrossRef]
- Zhang, H.; Liu, W.; Zhang, L. Seamless and automated rapeseed mapping for large cloudy regions using time-series optical satellite imagery. ISPRS J. Photogramm. Remote Sens. 2022, 184, 45–62. [Google Scholar] [CrossRef]
- Betbeder, J.; Fieuzal, R.; Philippets, Y.; Ferro-Famil, L.; Baup, F. Contribution of multitemporal polarimetric synthetic aperture radar data for monitoring winter wheat and rapeseed crops. J. Appl. Remote Sens. 2016, 10, 026020. [Google Scholar] [CrossRef]
- Cookmartin, G.; Saich, P.; Quegan, S.; Cordey, R.; Burgess-Allen, P.; Sowter, A. Modeling microwave interactions with crops and comparison with ERS-2 SAR observations. IEEE Trans. Geosci. Remote Sens. 2002, 38, 658–670. [Google Scholar] [CrossRef]
- Fieuzal, R.; Baup, F.; Maraissicre, C. Monitoring Wheat and Rapeseed by Using Synchronous Optical and Radar Satellite Data—From Temporal Signatures to Crop Parameters Estimation. Adv. Remote Sens. 2013, 2, 162–180. [Google Scholar] [CrossRef]
- Sulik, J.J.; Long, D.S. Automated detection of phenological transitions for yellow flowering plants such as Brassicaoilseeds. Agrosystems Geosci. Environ. 2020, 3, e20125. [Google Scholar] [CrossRef]
- Zang, Y.; Chen, X.; Chen, J.; Tian, Y.; Cui, X. Remote Sensing Index for Mapping Canola Flowers Using MODIS Data. Remote Sens. 2020, 12, 3912. [Google Scholar] [CrossRef]
- Huang, X.; Huang, J.; Li, X.; Shen, Q.; Chen, Z. Early mapping of winter wheat in Henan province of China using time series of Sentinel-2 data. GIsci Remote Sens. 2022, 59, 1534–1549. [Google Scholar] [CrossRef]
- D’Andrimont, R.; Taymans, M.; Lemoine, G.; Ceglar, A.; Velde, M.V.D. Detecting flowering phenology in oil seed rape parcels with Sentinel-1 and -2 time series. Remote Sens. Environ. 2020, 239, 111660. [Google Scholar] [CrossRef]
- Dong, W.; Shenghui, F.; Zhenzhong, Y.; Lin, W.; Wenchao, T.; Yucui, L.; Chunyan, T. A Regional Mapping Method for Oilseed Rape Based on HSV Transformation and Spectral Features. Int. J. Geo-Inf. 2018, 7, 224. [Google Scholar]
- Tao, J.-B.; Zhang, X.-Y.; Wu, Q.-F.; Wang, Y. Mapping winter rapeseed in South China using Sentinel-2 data based on a novel separability index. J. Integr. Agric. 2023, 22, 1645–1657. [Google Scholar] [CrossRef]
- Adrian, J.; Sagan, V.; Maimaitijiang, M. Sentinel SAR-optical fusion for crop type mapping using deep learning and Google Earth Engine. ISPRS J. Photogramm. Remote Sens. 2021, 175, 215–235. [Google Scholar] [CrossRef]
- Orynbaikyzy, A.; Gessner, U.; Conrad, C. Crop type classification using a combination of optical and radar remote sensing data: A review. Int. J. Remote Sens. 2019, 40, 6553–6595. [Google Scholar] [CrossRef]
- Arias, M.; Campo-Bescós, M.Á.; Álvarez-Mozos, J. Crop Classification Based on Temporal Signatures of Sentinel-1 Observations over Navarre Province, Spain. Remote Sens. 2020, 12, 278. [Google Scholar] [CrossRef]
- Zhong, L.; Hu, L.; Zhou, H.; Tao, X. Deep learning based winter wheat mapping using statistical data as ground references in Kansas and northern Texas, US. Remote Sens. Environ. 2019, 233, 111411. [Google Scholar] [CrossRef]
- Zhao, F.; Sun, R.; Zhong, L.; Meng, R.; Huang, C.; Zeng, X.; Wang, M.; Li, Y.; Wang, Z. Monthly mapping of forest harvesting using dense time series Sentinel-1 SAR imagery and deep learning. Remote Sens. Environ. 2022, 269, 112822. [Google Scholar] [CrossRef]


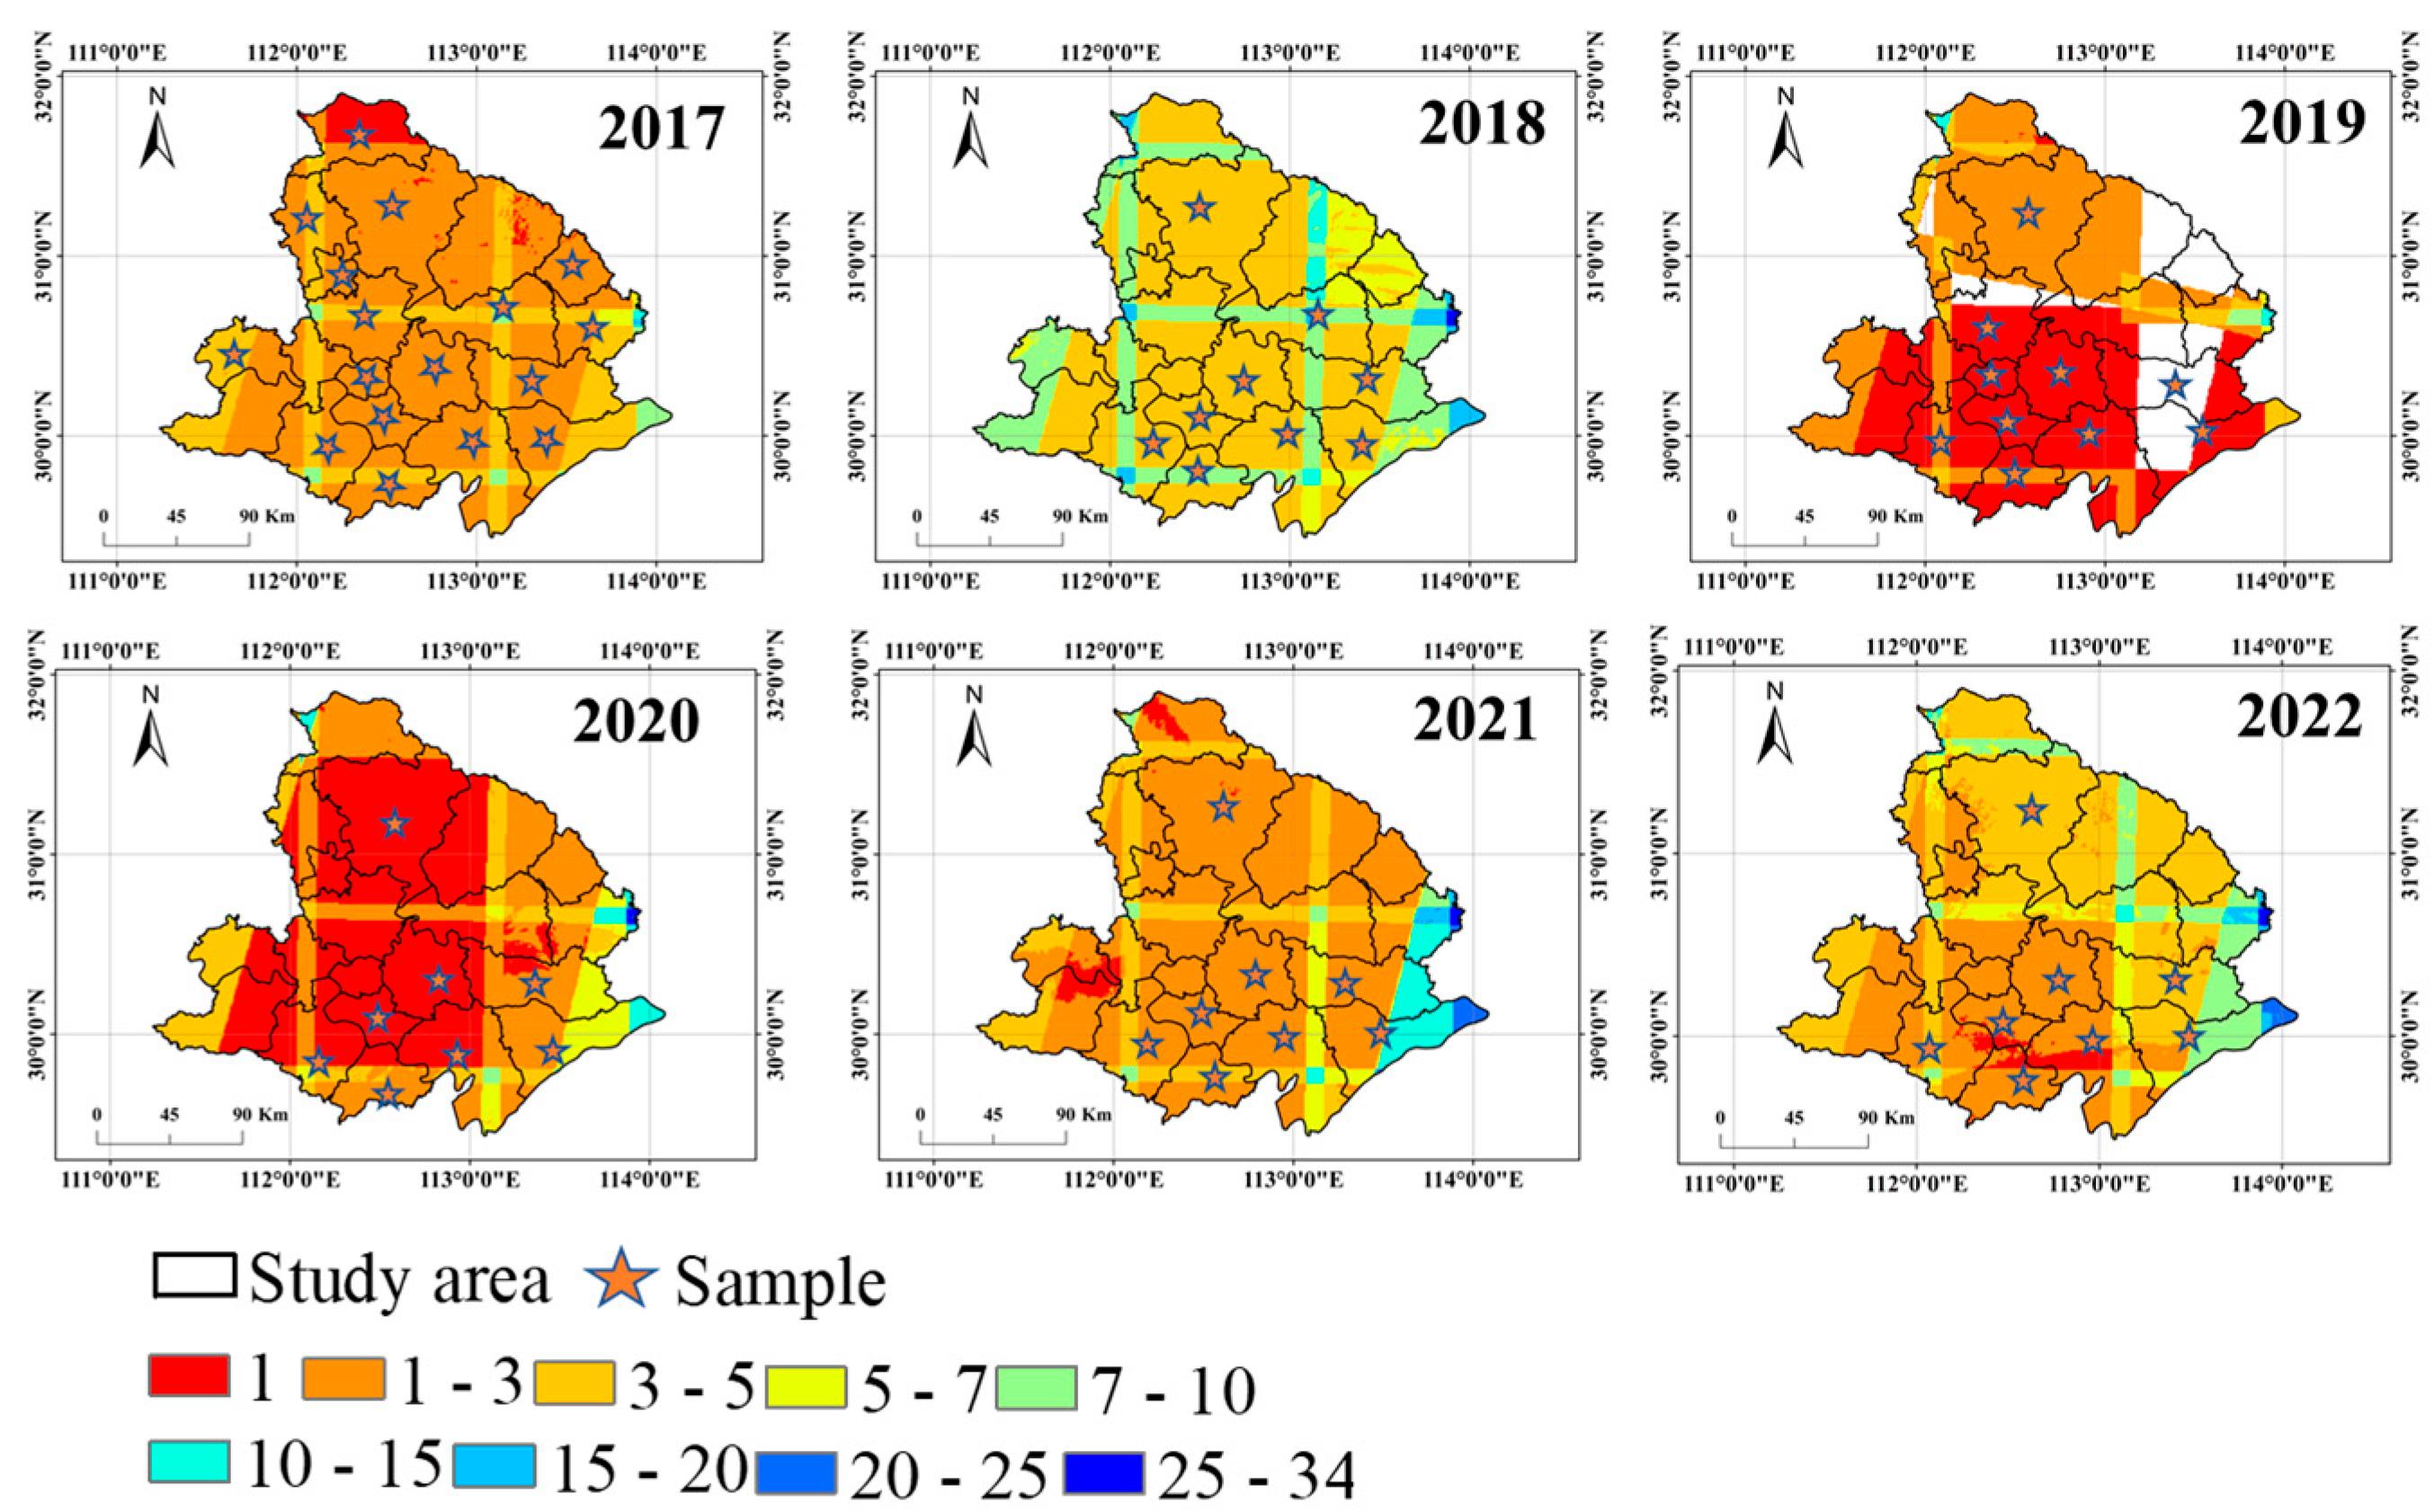

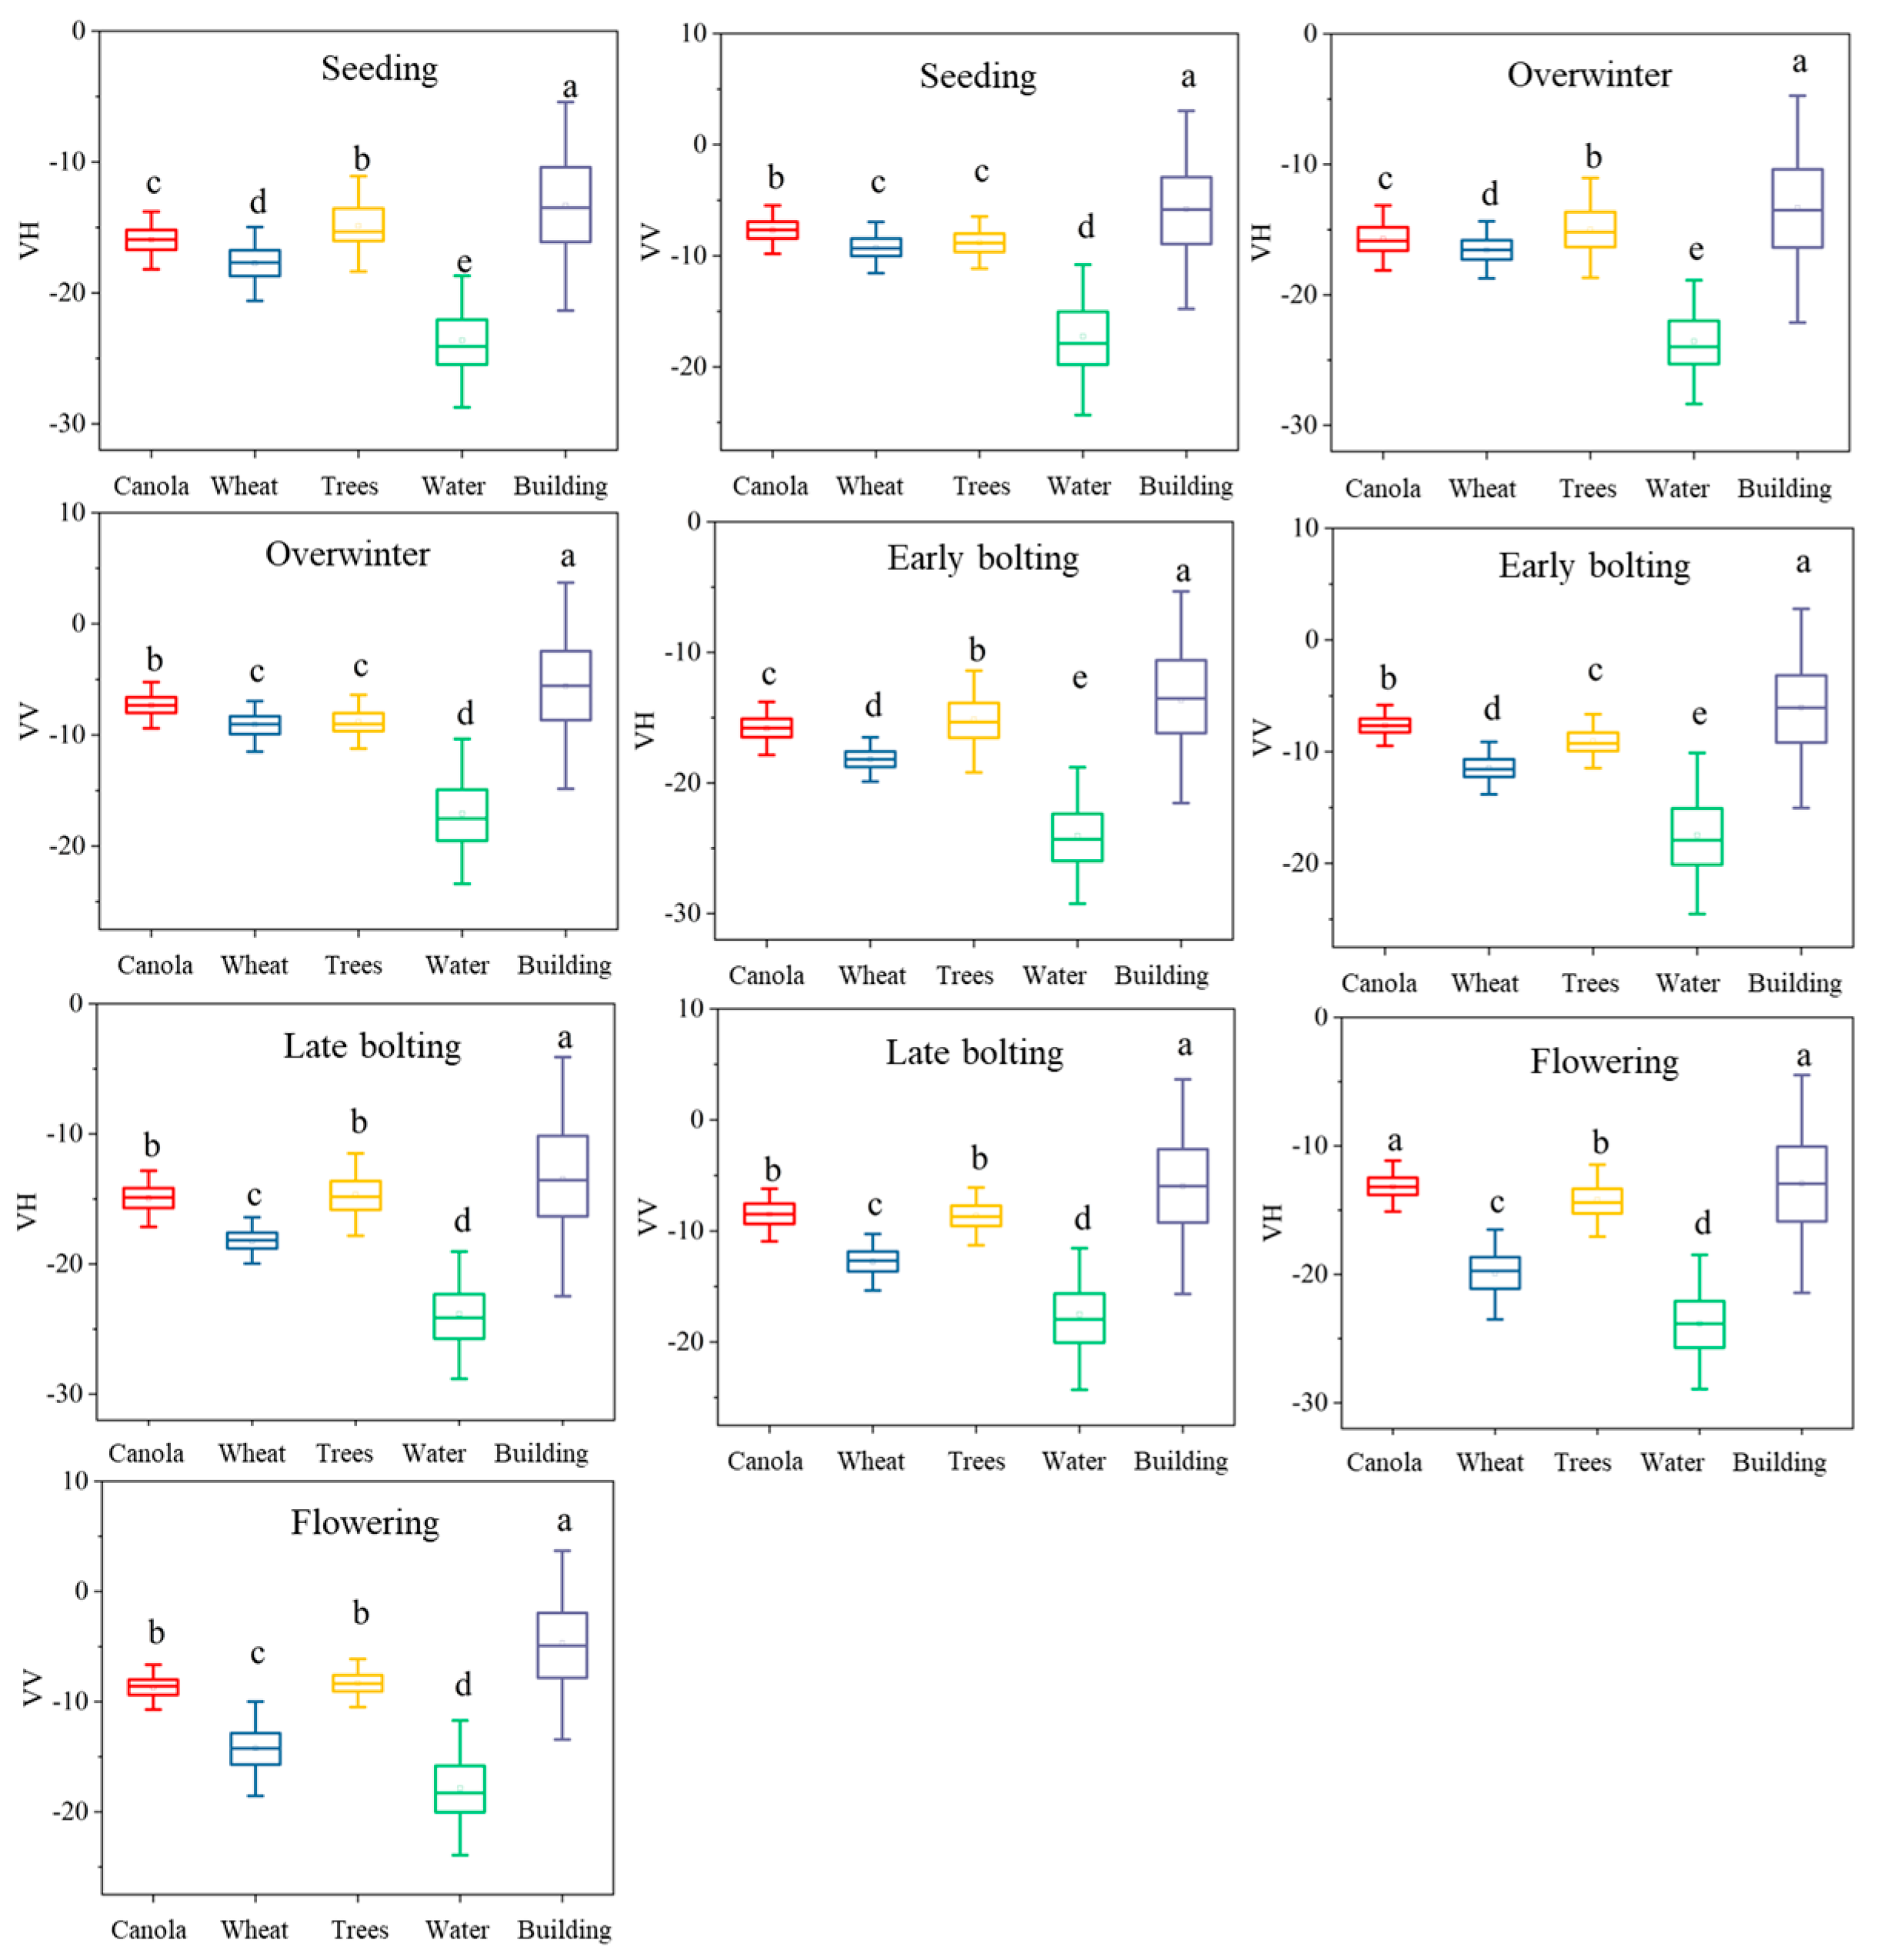
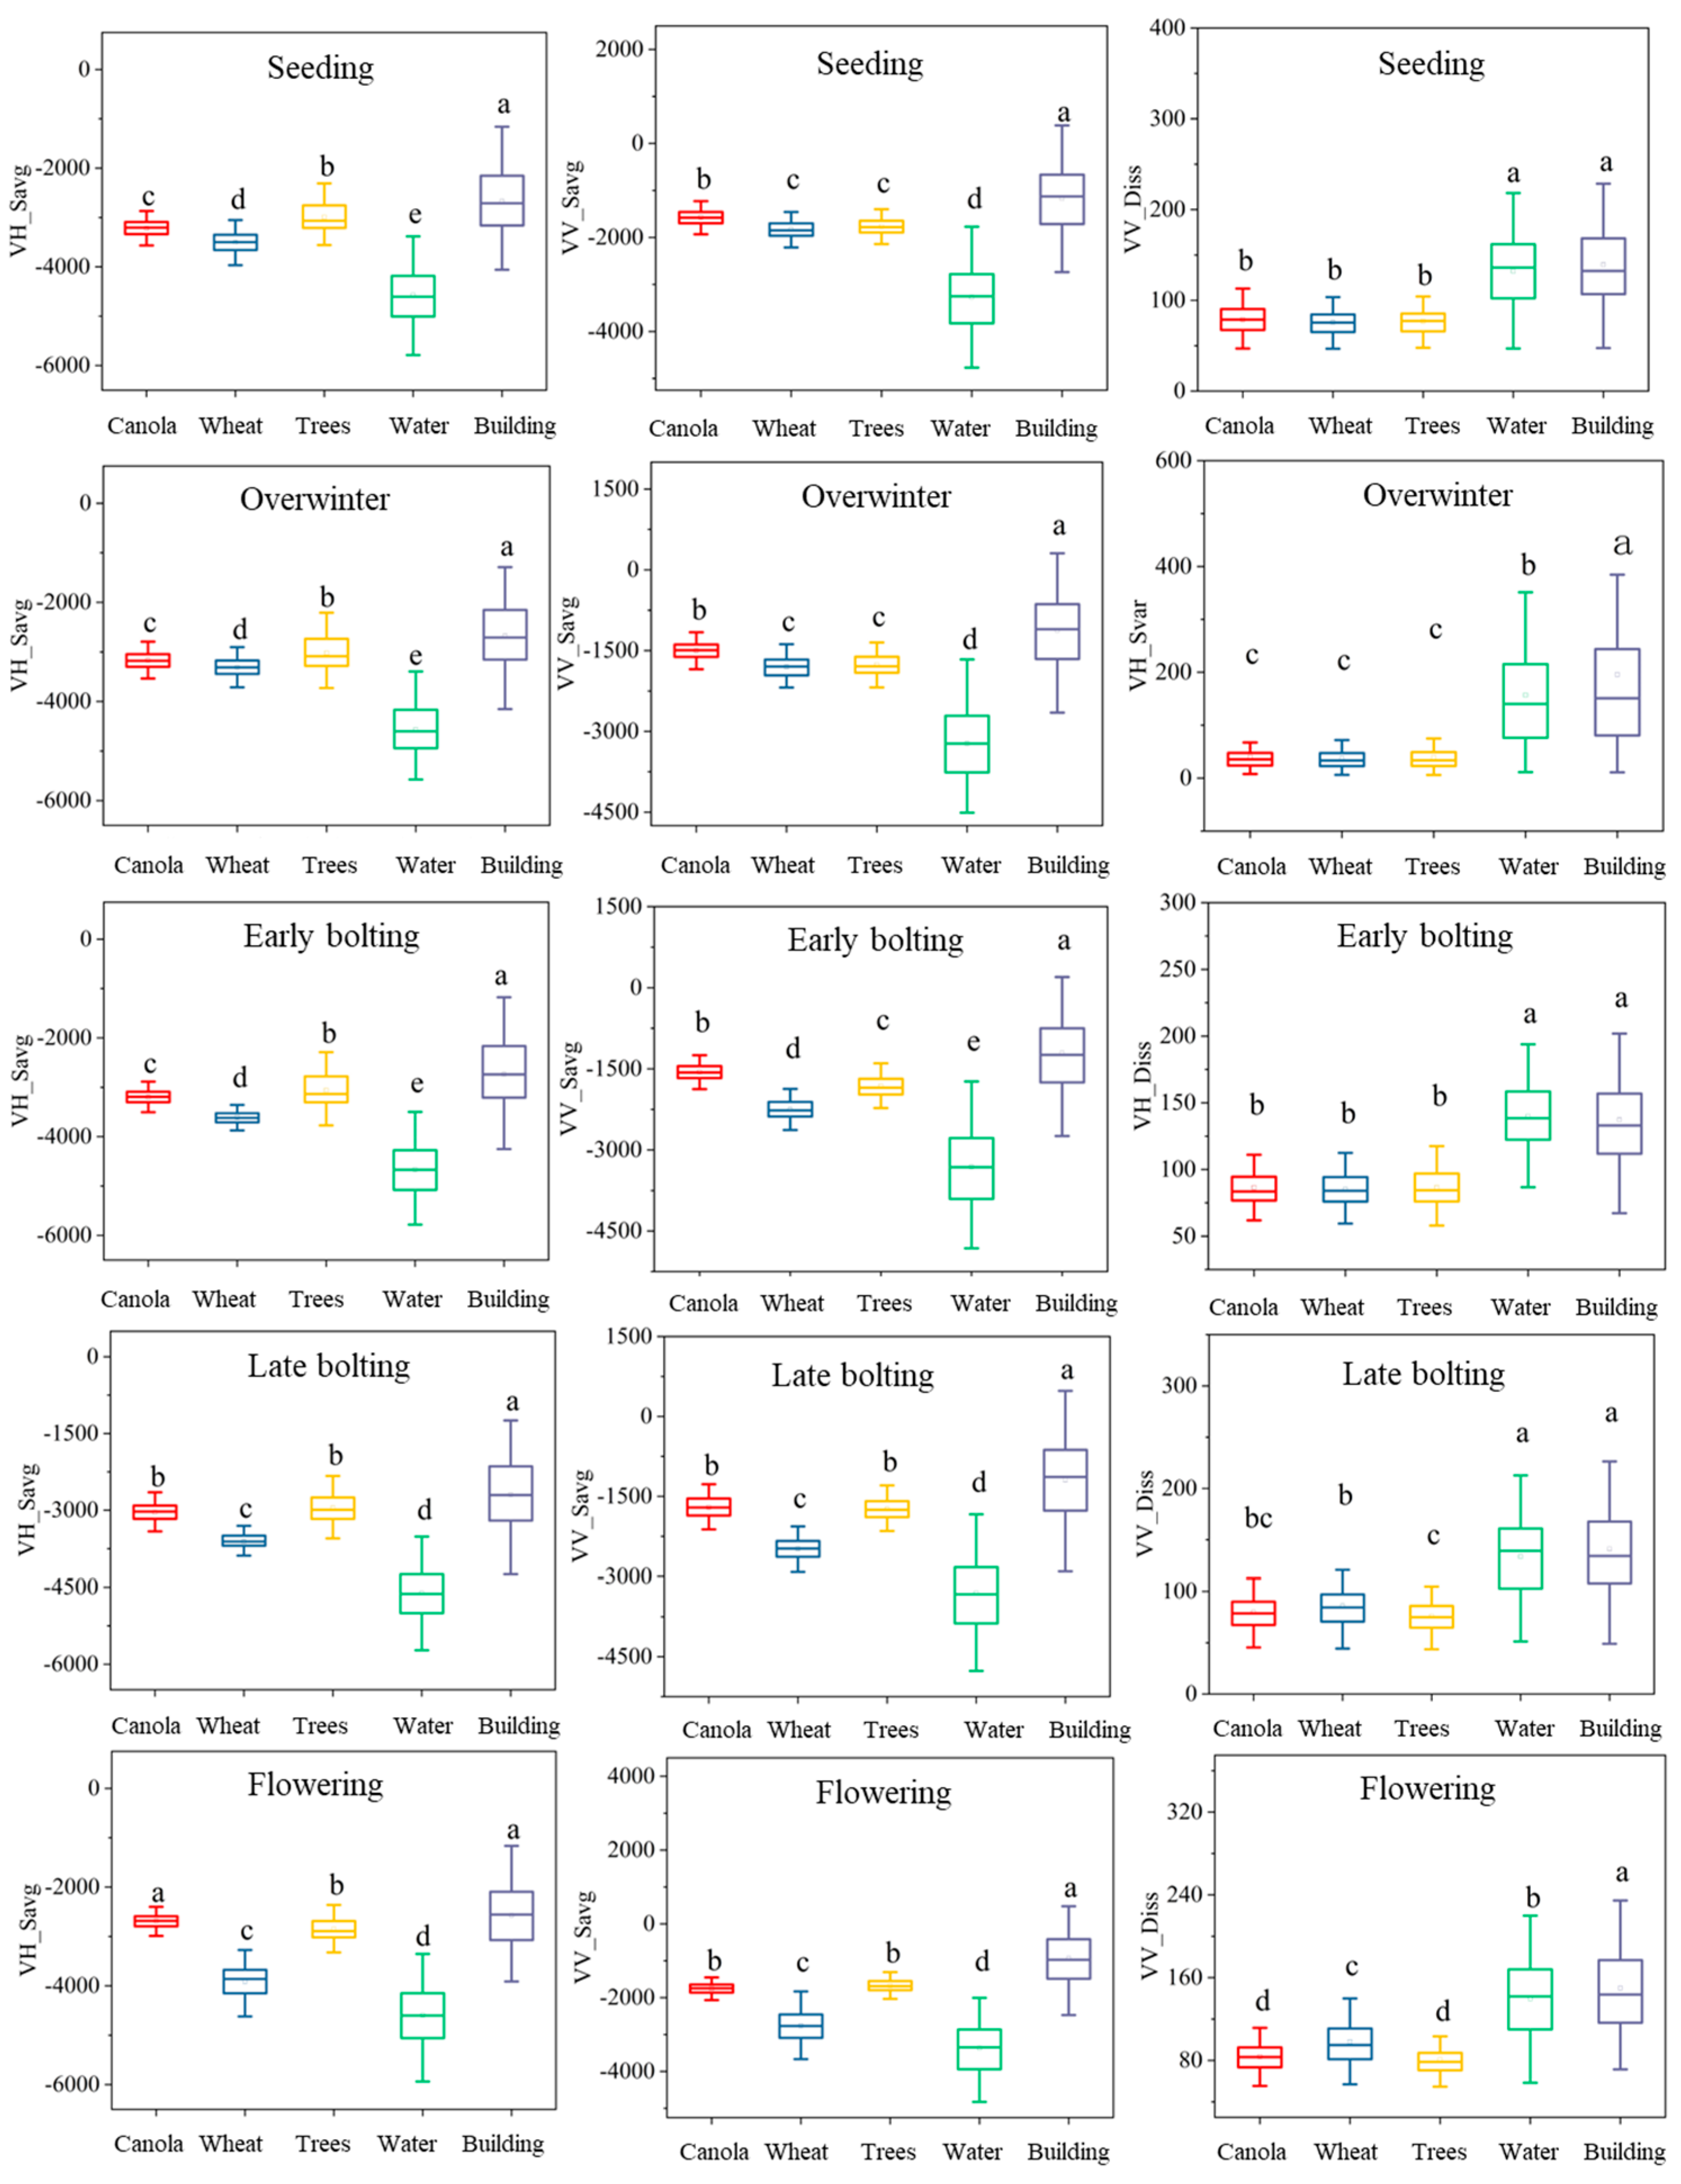
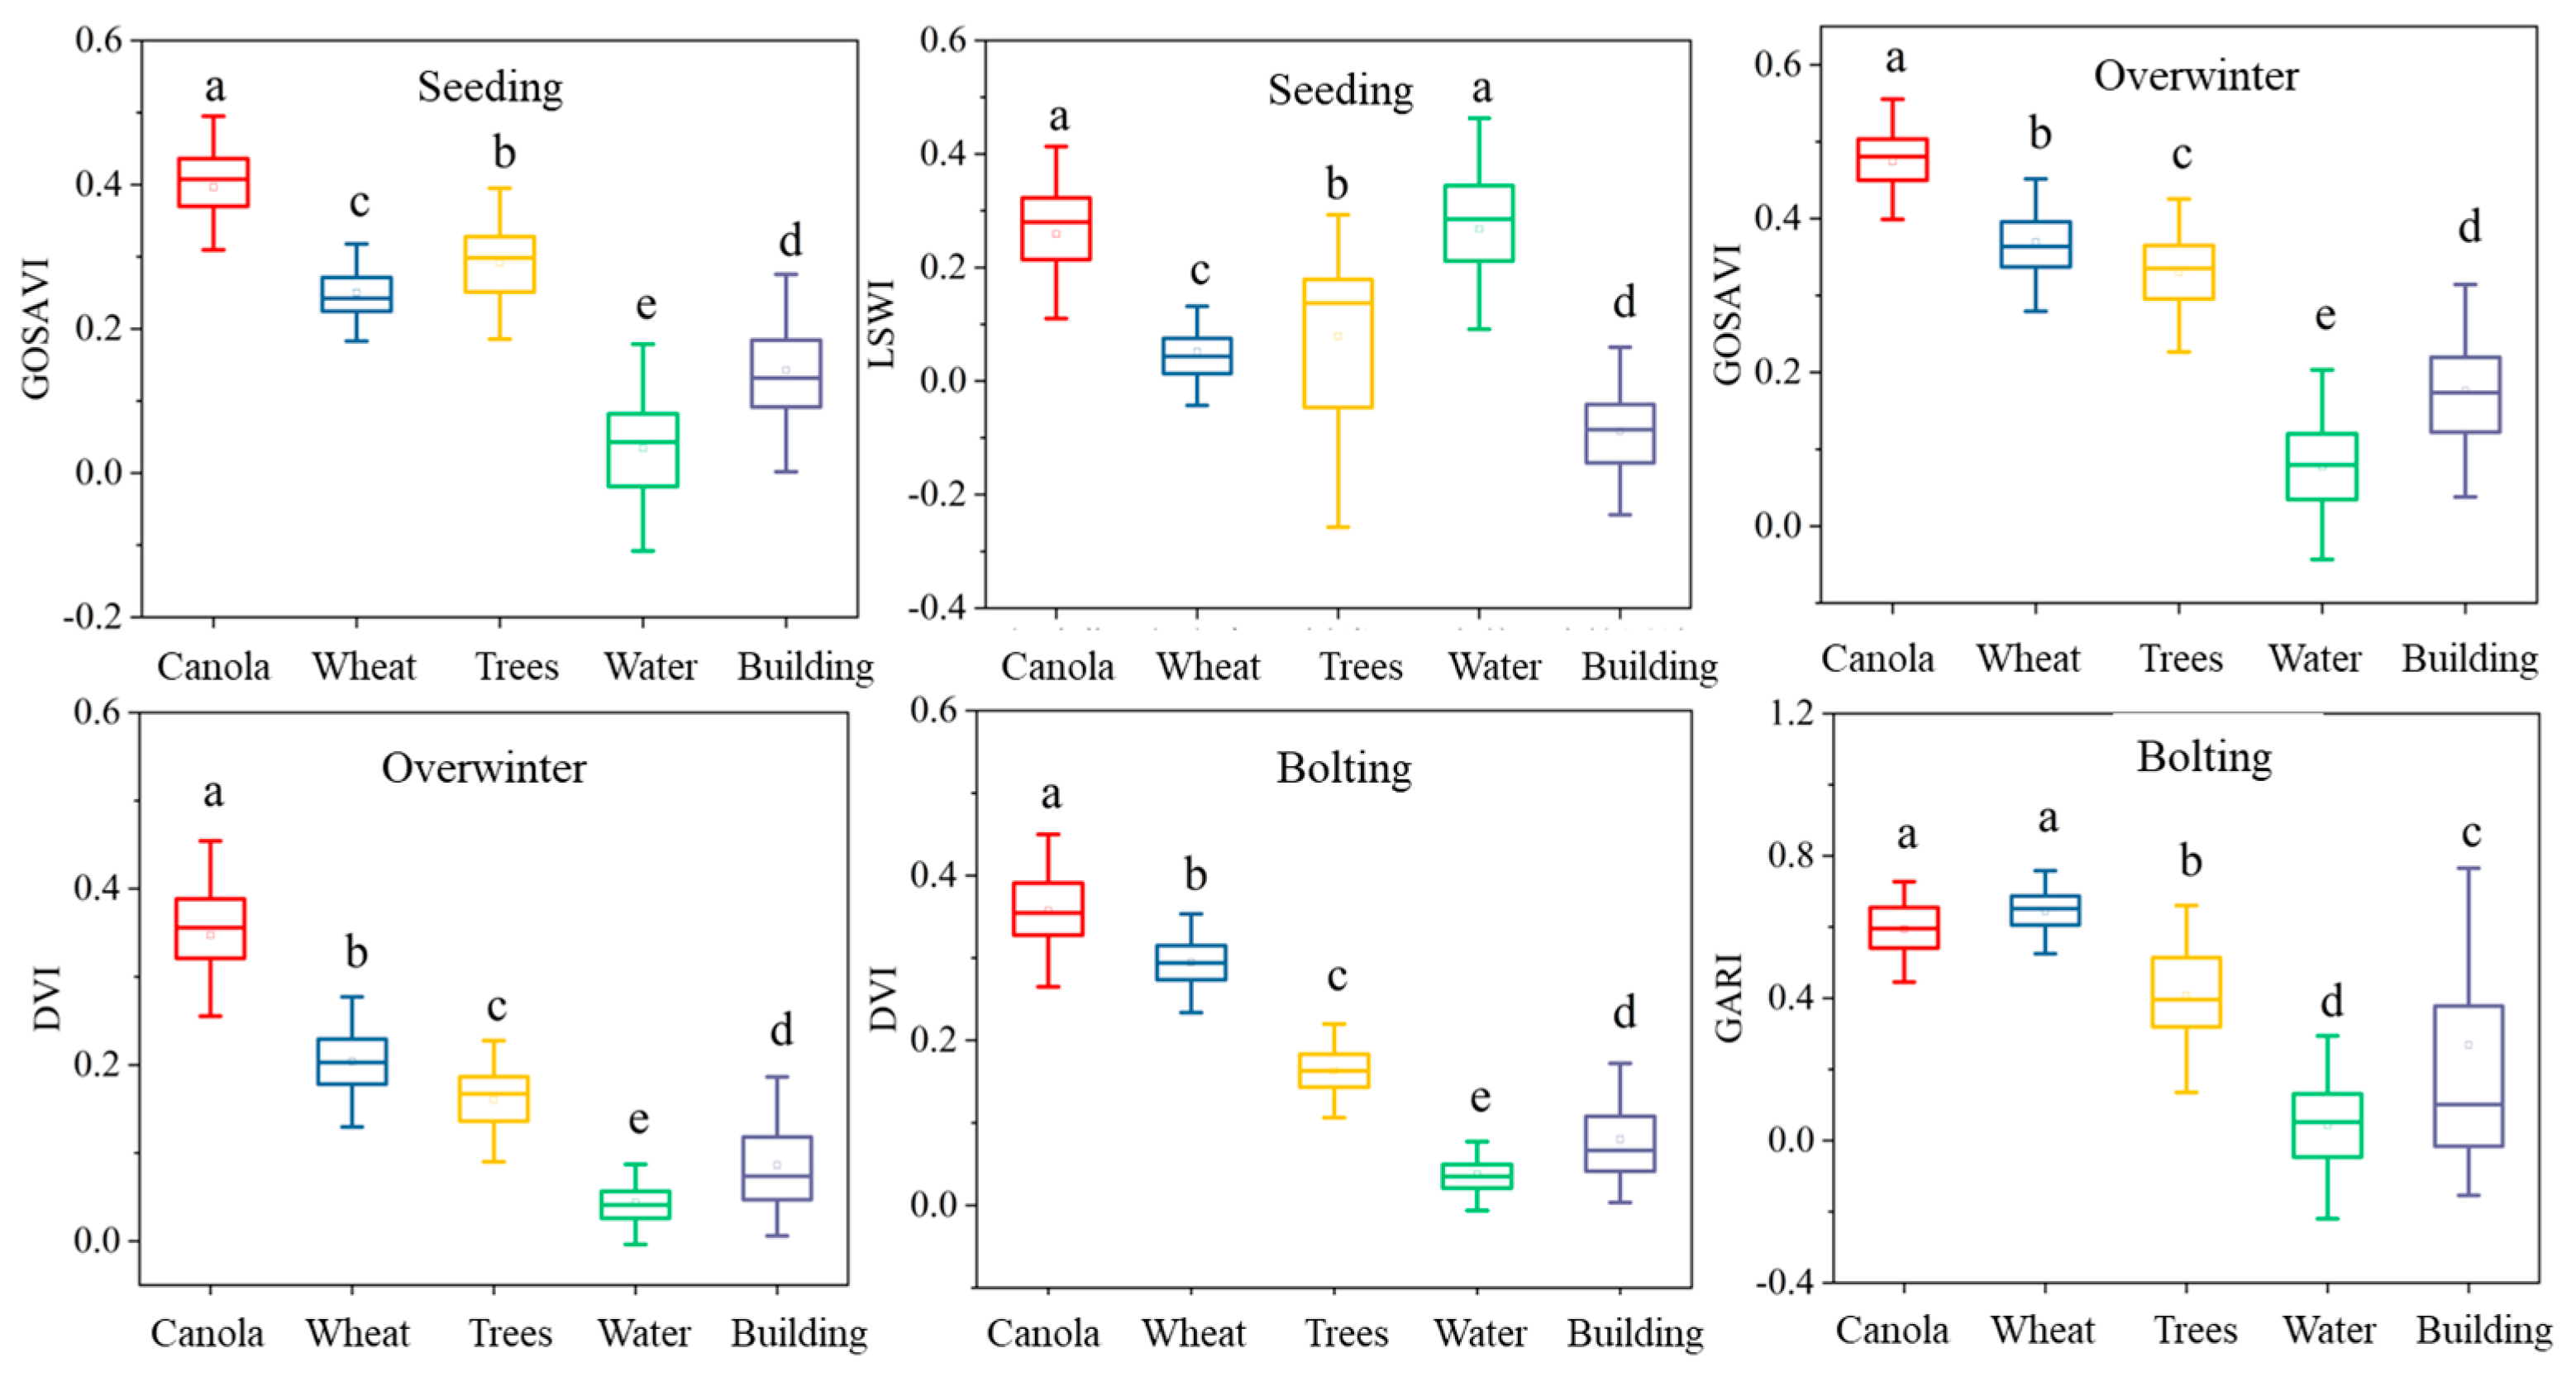
 |
| Class | 2017 | 2018 | 2019 | 2020 | 2021 | 2022 |
|---|---|---|---|---|---|---|
| Winter canola | 1302 | 521 | 549 | 321 | 320 | 339 |
| Winter wheat | 1216 | 527 | 561 | 340 | 340 | 325 |
| Trees | 1225 | 508 | 559 | 447 | 447 | 447 |
| Water | 1242 | 520 | 591 | 470 | 470 | 470 |
| Building | 1242 | 517 | 585 | 465 | 465 | 465 |
| Total | 6227 | 2593 | 2845 | 2043 | 2042 | 2046 |
| Polarization Indexes | Formular | Citation |
|---|---|---|
| SRI | VH/VV | This paper |
| SDI | VH-VV | This paper |
| SNDI | (VH − VV)/(VH + VV) | This paper |
| SDRI | 2 × VV/(VH + VV) | This paper |
| SRD | VH/VV − VV/VH | This paper |
| SNDVHvv/VVvh | (VH/VVVV/VH)/(VH/VV + VV/VH) | This paper |
| SMI | (VH + VV)/2 | [32] |
| Textural Features | Citation |
|---|---|
| ASM, Contrast, CORR, VAR, IDM, SAVG, SVAR, SENT, ENT, DVAR, DENT, IMCORR1, IMCORR2, MaxCORR | [33] |
| DISS, PROM | [34] |
| Phenological Stages | Selected Variables |
|---|---|
| Seeding stage (Early December) | VH_Savg, VV_Savg, SMI, SRI, Elevation, SDRI, VV_Diss |
| Overwinter stage (Late December) | VV_Savg, SRI, VV, SND, VH_Savg, Elevation, VH_Svar, VH_Prom |
| Early bolting stage (Late January) | VV_Savg, VH_Savg, VV, SRI, Elevation, VV_Dvar, VH_Diss |
| Late bolting stage (Mid-February) | SMI, VH_Savg, VH, VV, Elevation, VV_Savg, VV_Diss |
| Flowering stage (Late March) | VH_Savg, VH, SMI, VV_Savg, Elevation, SDI, VV_Diss |
| Phenological Stages | Selected Variables |
|---|---|
| Seeding stage (Early December) | B6, B5, B8, RPVI, GOSAVI, LSWI, VV |
| Overwinter stage (Late December) | B6, B7, B8, DVI, GOSAVI, VV, B5 |
| Late bolting stage (Mid-February) | B6, B8, B7, VV, DVI, VH, GARI |
| Model | Data Source | Seeding | Overwinter | Bolting | |||
|---|---|---|---|---|---|---|---|
| F-Score | OA | F-Score | OA | F-Score | OA | ||
| RF | S2 | 0.7928 | 80.06% | 0.8445 | 77.53% | 0.9791 | 91.65% |
| S1 + S2 | 0.8010 | 81.48% | 0.8615 | 81.63% | 0.9831 | 94.35% | |
| SVM | S2 | 0.7658 | 80.93% | 0.8478 | 79.94% | 0.9780 | 92.11% |
| S1 + S2 | 0.7894 | 82.58% | 0.8583 | 82.34% | 0.9800 | 94.48% | |
Disclaimer/Publisher’s Note: The statements, opinions and data contained in all publications are solely those of the individual author(s) and contributor(s) and not of MDPI and/or the editor(s). MDPI and/or the editor(s) disclaim responsibility for any injury to people or property resulting from any ideas, methods, instructions or products referred to in the content. |
© 2024 by the authors. Licensee MDPI, Basel, Switzerland. This article is an open access article distributed under the terms and conditions of the Creative Commons Attribution (CC BY) license (https://creativecommons.org/licenses/by/4.0/).
Share and Cite
Liu, T.; Li, P.; Zhao, F.; Liu, J.; Meng, R. Early-Stage Mapping of Winter Canola by Combining Sentinel-1 and Sentinel-2 Data in Jianghan Plain China. Remote Sens. 2024, 16, 3197. https://doi.org/10.3390/rs16173197
Liu T, Li P, Zhao F, Liu J, Meng R. Early-Stage Mapping of Winter Canola by Combining Sentinel-1 and Sentinel-2 Data in Jianghan Plain China. Remote Sensing. 2024; 16(17):3197. https://doi.org/10.3390/rs16173197
Chicago/Turabian StyleLiu, Tingting, Peipei Li, Feng Zhao, Jie Liu, and Ran Meng. 2024. "Early-Stage Mapping of Winter Canola by Combining Sentinel-1 and Sentinel-2 Data in Jianghan Plain China" Remote Sensing 16, no. 17: 3197. https://doi.org/10.3390/rs16173197
APA StyleLiu, T., Li, P., Zhao, F., Liu, J., & Meng, R. (2024). Early-Stage Mapping of Winter Canola by Combining Sentinel-1 and Sentinel-2 Data in Jianghan Plain China. Remote Sensing, 16(17), 3197. https://doi.org/10.3390/rs16173197


