Abstract
Atmospheric gravity waves are one of the important dynamic processes in near space and are widely present in the atmosphere. They play a crucial role in the transfer of energy and momentum between different regions of the atmosphere. The Sun, as the ultimate source of gravity wave energy, significantly influences the intensity of gravity wave disturbances through its activity variations. This paper utilizes data from the Global Navigation Satellite System Occultation Sounder (GNOS) onboard the Fengyun-3C (FY-3C) satellite to invert global stratospheric gravity wave disturbances. It provides the global stratospheric gravity wave distribution from 2015 to 2023, nearly covering one solar activity cycle, and focuses on analyzing the response of gravity waves at different latitudes, altitudes, and wavelengths to the solar activity cycle. We found that short-wavelength gravity waves respond more noticeably to solar activity compared to long-wavelength gravity waves. Through analyzing the intensity of stratospheric gravity wave disturbances across different latitude bands, we found that in high-latitude regions, stratospheric gravity wave disturbances are most sensitive and respond most quickly to variations in solar activity. Furthermore, the Southern Hemisphere exhibits a stronger response to the current year’s solar activity changes compared to the Northern Hemisphere. In the mid-latitude and equatorial regions, the response to changes in solar activity intensity is delayed. The correlation gradually strengthens with this lag, reaching a very strong level after a 2-year lag. Additionally, the correlation between the Southern Hemisphere and solar activity is generally higher than that of the Northern Hemisphere.
1. Introduction
Gravity waves (GWs) are one of the main atmospheric fluctuations in the Earth’s upper atmosphere and lower plasmasphere. They play a crucial role in processes involving changes in atmospheric temperature, density, and chemical composition, as well as in the coupling of energy and momentum transfer between different regions in the middle and upper atmosphere [1,2,3,4]. Gravity waves are usually generated in the troposphere, filtered by wind fields in the stratosphere and mesosphere, and partially dissipated in the upper mesosphere and thermosphere [5].
The primary sources of gravity waves include topography [6], convective events [7], frontal systems, and jet streams [8]. However, the energy source is the solar radiation received by Earth, the cyclical variations in solar activity continuously impact the generation and propagation of gravity waves. By analyzing ground-based station and satellite observation data, a clear correlation between gravity waves and solar activity has been identified [4,9,10,11,12,13]. Gavrilov et al. (1995) analyzed data from a medium-frequency radar (52°N, 107°W) between 1979 and 1993, finding a negative correlation between gravity waves and the 11-year solar activity cycle [9]. After analyzing data from three stations at different longitudes and latitudes, Gavrilov et al. (2002) further indicated that the correlation between gravity waves and solar activity is influenced by longitude [10]. However, Jacobi et al.(2006) found a positive correlation between gravity waves and solar activity after analyzing data from the Colm station [11]. Li et al. (2010) used temperature data from LiDAR observations and found that during solar maximum periods, temperature changes in upper stratospheric gravity waves are enhanced [12]. Additionally, the enhancement of lower atmospheric gravity waves can lead to the strengthening of middle atmospheric gravity waves [14]. Satellite observation data can provide global distributions of gravity waves. By analyzing temperature profile data from SABER, Ern et al. (2011) and Zhang et al. (2012) found that gravity waves exhibit an 11-year periodic variation, which aligns with the solar activity cycle [15,16]. Ern et al. (2011) analyzed five years of temperature data from SABER and concluded that the amplitude and momentum flux of gravity waves are negatively correlated with the solar activity cycle [15]. Liu et al. (2017) further indicated that the potential energy of gravity waves in low- and mid-latitude regions is negatively correlated with solar activity [13]. Additionally, Wang et al.(2023) noted that, after 2017, as solar activity weakened, there was a trend of decreasing gravity waves in high-latitude regions year by year [4].
Variations in solar radiation flux do not directly impact the dynamics of gravity waves but rather influence them through atmospheric background parameters such as background wind, temperature, and dissipation parameters [17,18]. Any change in solar radiation flux will alter the incoming EUV and X-ray fluxes, subsequently affecting atmospheric neutral density and temperature parameters, which in turn modify dissipation factors and others [19]. The influence of solar activity on the stratospheric atmosphere, including changes in Earth’s surface temperature, stratospheric temperature, wind fields, and cloud cover [20,21,22], is a long-term process. These impacts manifest in atmospheric phenomena with a certain lag. Indices representing solar activity levels, such as sunspot numbers and solar radio flux, are correlated with the Arctic Oscillation Index and the East Asian Monsoon Index, with a notable lag correlation [23,24]. For one of the main sources of gravity wave generation, convective activity, its outgoing longwave radiation index, tropical western Pacific vertical velocity, and tropical zonal wind fields all have the highest correlation with the F107 index with a lag of one to two years [24]. Therefore, the response of gravity wave activity to variations in solar activity intensity may also exhibit a lag.
Previous studies analyzing the response of GWs to solar activity have only considered immediate responses, without accounting for the potential delayed response of gravity waves due to atmospheric background parameters, which is a key focus of this paper. Additionally, many studies in the past obtained gravity waves using a high pass filter with a cut-off vertical wavelength of 10 km [25]. Consequently, their results completely suppressed the gravity waves with vertical wavelengths >10 km, which are dominant over the middle and high latitude regions [26]. So, to capture as much gravity wave information as possible, we investigated gravity waves in two separate vertical wavelength ranges, one is 2–10 km (short-wavelength GWs), and the other is 12–20 km (long-wavelength GWs). GWs at different latitudes are influenced by excitation sources, background winds, etc., and their correlation with solar activity may differ, which lacks comparative analysis in previous studies.
This paper uses temperature detection data from the Global Navigation Satellite System Occultation Sounder (GNOS) onboard the FY-3C satellite from 2015 to 2023 to analyze the response of global gravity wave disturbances to medium- and long-term solar activity changes. The primary focus is on analyzing the correlation between gravity wave intensities at different altitudes, latitudes, and wavelengths, and the sunspot number index, which characterizes the solar activity cycle. Additionally, we will focus on the delayed response of gravity waves to solar activity across different latitudinal bands and altitude layers. Section 2 provides a detailed introduction to the data and methods used in this paper. Section 3 analyzes the processing results. Section 4 presents the conclusions and discussion.
2. Data Selection and Methods
2.1. Atmospheric Temperature Profile and the Sunspot Number
The FY-3C satellite is a meteorological satellite that operates in a sun-synchronous orbit, with an average orbital altitude of 836 km and an orbital period of approximately 101.5 min. GNOS is the Global Navigation Satellite System Occultation Sounder onboard the FY-3C satellite, composed of three antennas, three RF units, and one electronic unit. It employs high-dynamic, highly sensitive signal acquisition and tracking technology, enabling it to receive GPS and BDS satellite navigation signals to retrieve atmospheric profiles of temperature, humidity, and other parameters [27]. Through processes such as precise orbit determination, atmospheric parameter retrieval, and quality control, GNOS achieves mean refractivity deviations from the ground to 46 km of –0.09% (GNOS-GPS) and –0.04% (GNOS-BDS), with average standard deviations of 1.81% and 1.26%, respectively [28]. Its atmospheric parameter profiles (e.g., temperature profiles) are long-term stable and suitable for climate research [4,29]. GNOS generates approximately 430 temperature profiles distributed globally each day. This paper selects nine years (2015–2023) of FY-3C-GNOS atmospheric temperature profile data (http://satellite.nsmc.org.cn, accessed on 1 July 2024) to calculate and analyze the global gravity wave distribution. The data span nearly the entire solar activity cycle.
Sunspots have long been considered an excellent indicator and quantifier of solar activity, particularly as an important parameter for the 11-year solar activity cycle trend [30]. In this work, the solar activity cycle is represented by the sunspot number (SN). The SN data are from WDC-SILSO, supported by the Royal Observatory of Belgium, Brussels, at http://www.sidc.be/silso/home (accessed on 1 July 2024).
2.2. The Method of Gravity Wave Extraction
Considering the data volume and distribution of FY-3C occultation data, the statistical analysis region in this paper covers latitudes from 90°S to 90°N; longitude range from 0° to 360°; altitude range from 20 to 50 km, transforming the resolution to 1 km using cubic spline interpolation. The gravity wave disturbance distribution is divided into five latitude bands (two at high latitudes and two at mid-latitudes, 60–90 degrees and 30–60 degrees, respectively, in both the hemispheres and one equatorial band between 30 degrees north and south) and three altitude layers (20–30 km, 30–40 km, and 40–50 km). The seasons are defined based on the northern hemisphere: January, February, and December as winter; March to May as spring; June to August as summer; and September to November as autumn. Before extracting atmospheric gravity wave disturbances, quality control was performed on the atmospheric temperature data detected by the FY-3C satellite. In the aforementioned grid, all data were statistically analyzed by month regardless of year, and temperature data with deviations beyond three times the standard deviation were excluded.
The method for extracting atmospheric gravity waves uses the commonly employed small perturbation approximation, which assumes that the measured temperature profile T(z) is composed of the background temperature (z) and the perturbation value T′(z). The background temperature is obtained by averaging all temperature profiles from a grid within a specific season. The perturbation value is obtained by subtracting the average from each profile. The obtained perturbation profiles are band-pass filtered (Equation (1)) with a passband range of 2–20 km, thereby obtaining atmospheric disturbances caused by gravity waves with vertical wavelengths in the 2–20 km range. The absolute value of the obtained temperature perturbations is then calculated for each grid on a quarterly basis. Further, filters with ranges of 2–10 km and 12–20 km are selected to analyze the global distribution characteristics of gravity waves with shorter vertical wavelengths of 2–10 km (short waves) and longer vertical wavelengths of 12–20 km (long waves), respectively. Then, by performing zonal averaging based on the five defined latitudes, the average disturbance of gravity waves in different latitude bands is derived. Finally, the extracted gravity wave intensities of different wavelengths were averaged according to latitude bands and seasons. Before 2018, due to the small amount of data, the standard deviations for the curves are larger than 20% but are smaller than 15% beyond 2018. Analyzing the variation patterns of gravity waves with different vertical wavelengths can reveal the differences in contributions to the coupling of the upper and lower atmosphere by waves of different vertical wavelengths. We developed a Python script that utilizes the library of fundamental algorithms for scientific computing in Python(SciPy; https://scipy.org/; accessed on 1 July 2024) to conduct interpolation and bandpass filtering analysis.
2.3. Statistical Method
This work applies two statistical methods: Pearson correlation analysis and significance test. We performed the Pearson correlation analysis to determine whether our target variables, such as gravity wave intensity at different wavelengths and different latitudes, are linearly associated with the solar cycle. The correlation coefficient r between two random variables reflects their linear dependence.
where mx is the mean of the vector x and my. is the mean of the vector y. Based on the obtained Pearson correlation coefficients, we consider a correlation coefficient greater than 0.8 to be strongly correlated, a coefficient between 0.5 and 0.8 to be moderately correlated, and a coefficient less than 0.5 to be weakly correlated.
Second, we perform the significance test. We used the p-value to represent the significance level of the correlation coefficient. The smaller the p-value, the more significant the correlation coefficient obtained from the analysis between sunspot number and GW intensity. We consider the correlation analysis results with a p-value greater than 0.1 to be non-significant. Results with a p-value less than 0.1 but greater than 0.05 are considered weakly significant. Results with a p-value less than 0.05 are considered significant, and those with a p-value less than 0.01 are considered highly significant.
3. Result
We analyzed gravity wave disturbances of different wavelengths and discussed the correlation between gravity wave disturbance intensity and solar activity (based on the sunspot number) using Pearson correlation analysis. Considering that the impact of solar activity intensity changes on gravity waves might be delayed due to the Earth’s atmospheric system, we analyzed the effects of solar activity intensity changes with a 2-year lag (impact of 2013–2021 solar activity intensity), a 1-year lag (impact of 2014–2022 solar activity intensity), and the same period effect (impact of 2015–2023 solar activity intensity).
3.1. Response of Short Wavelength (2–10 km) Gravity Waves
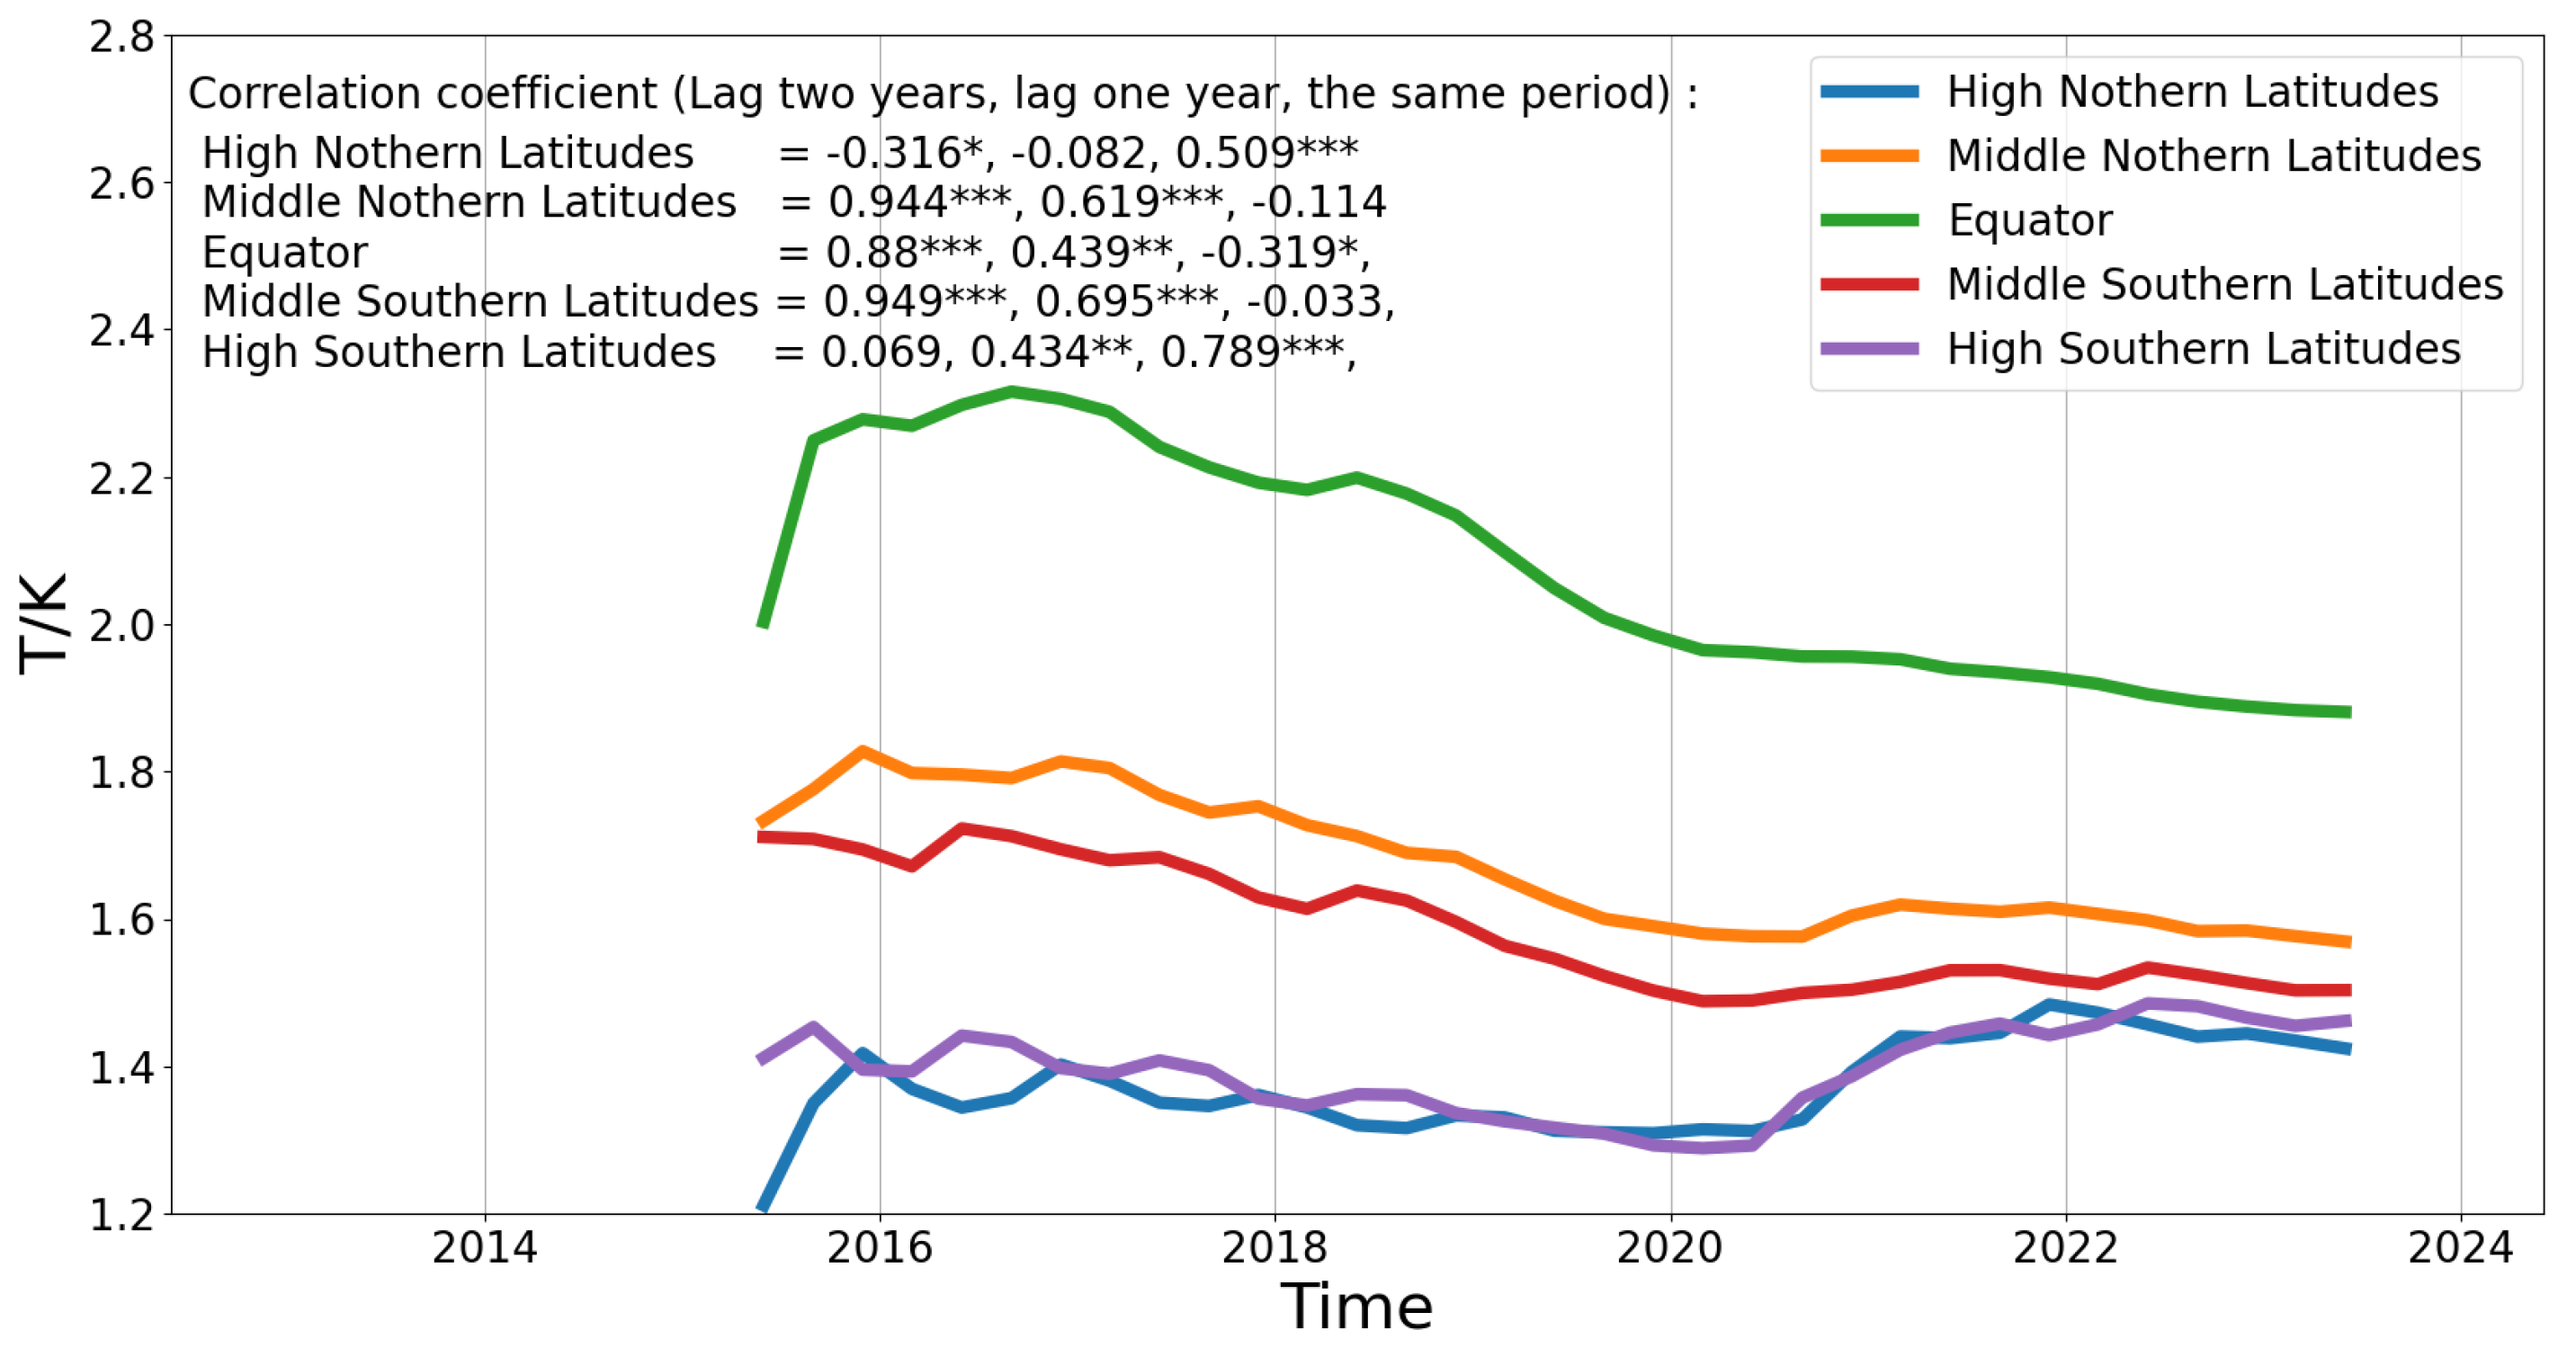
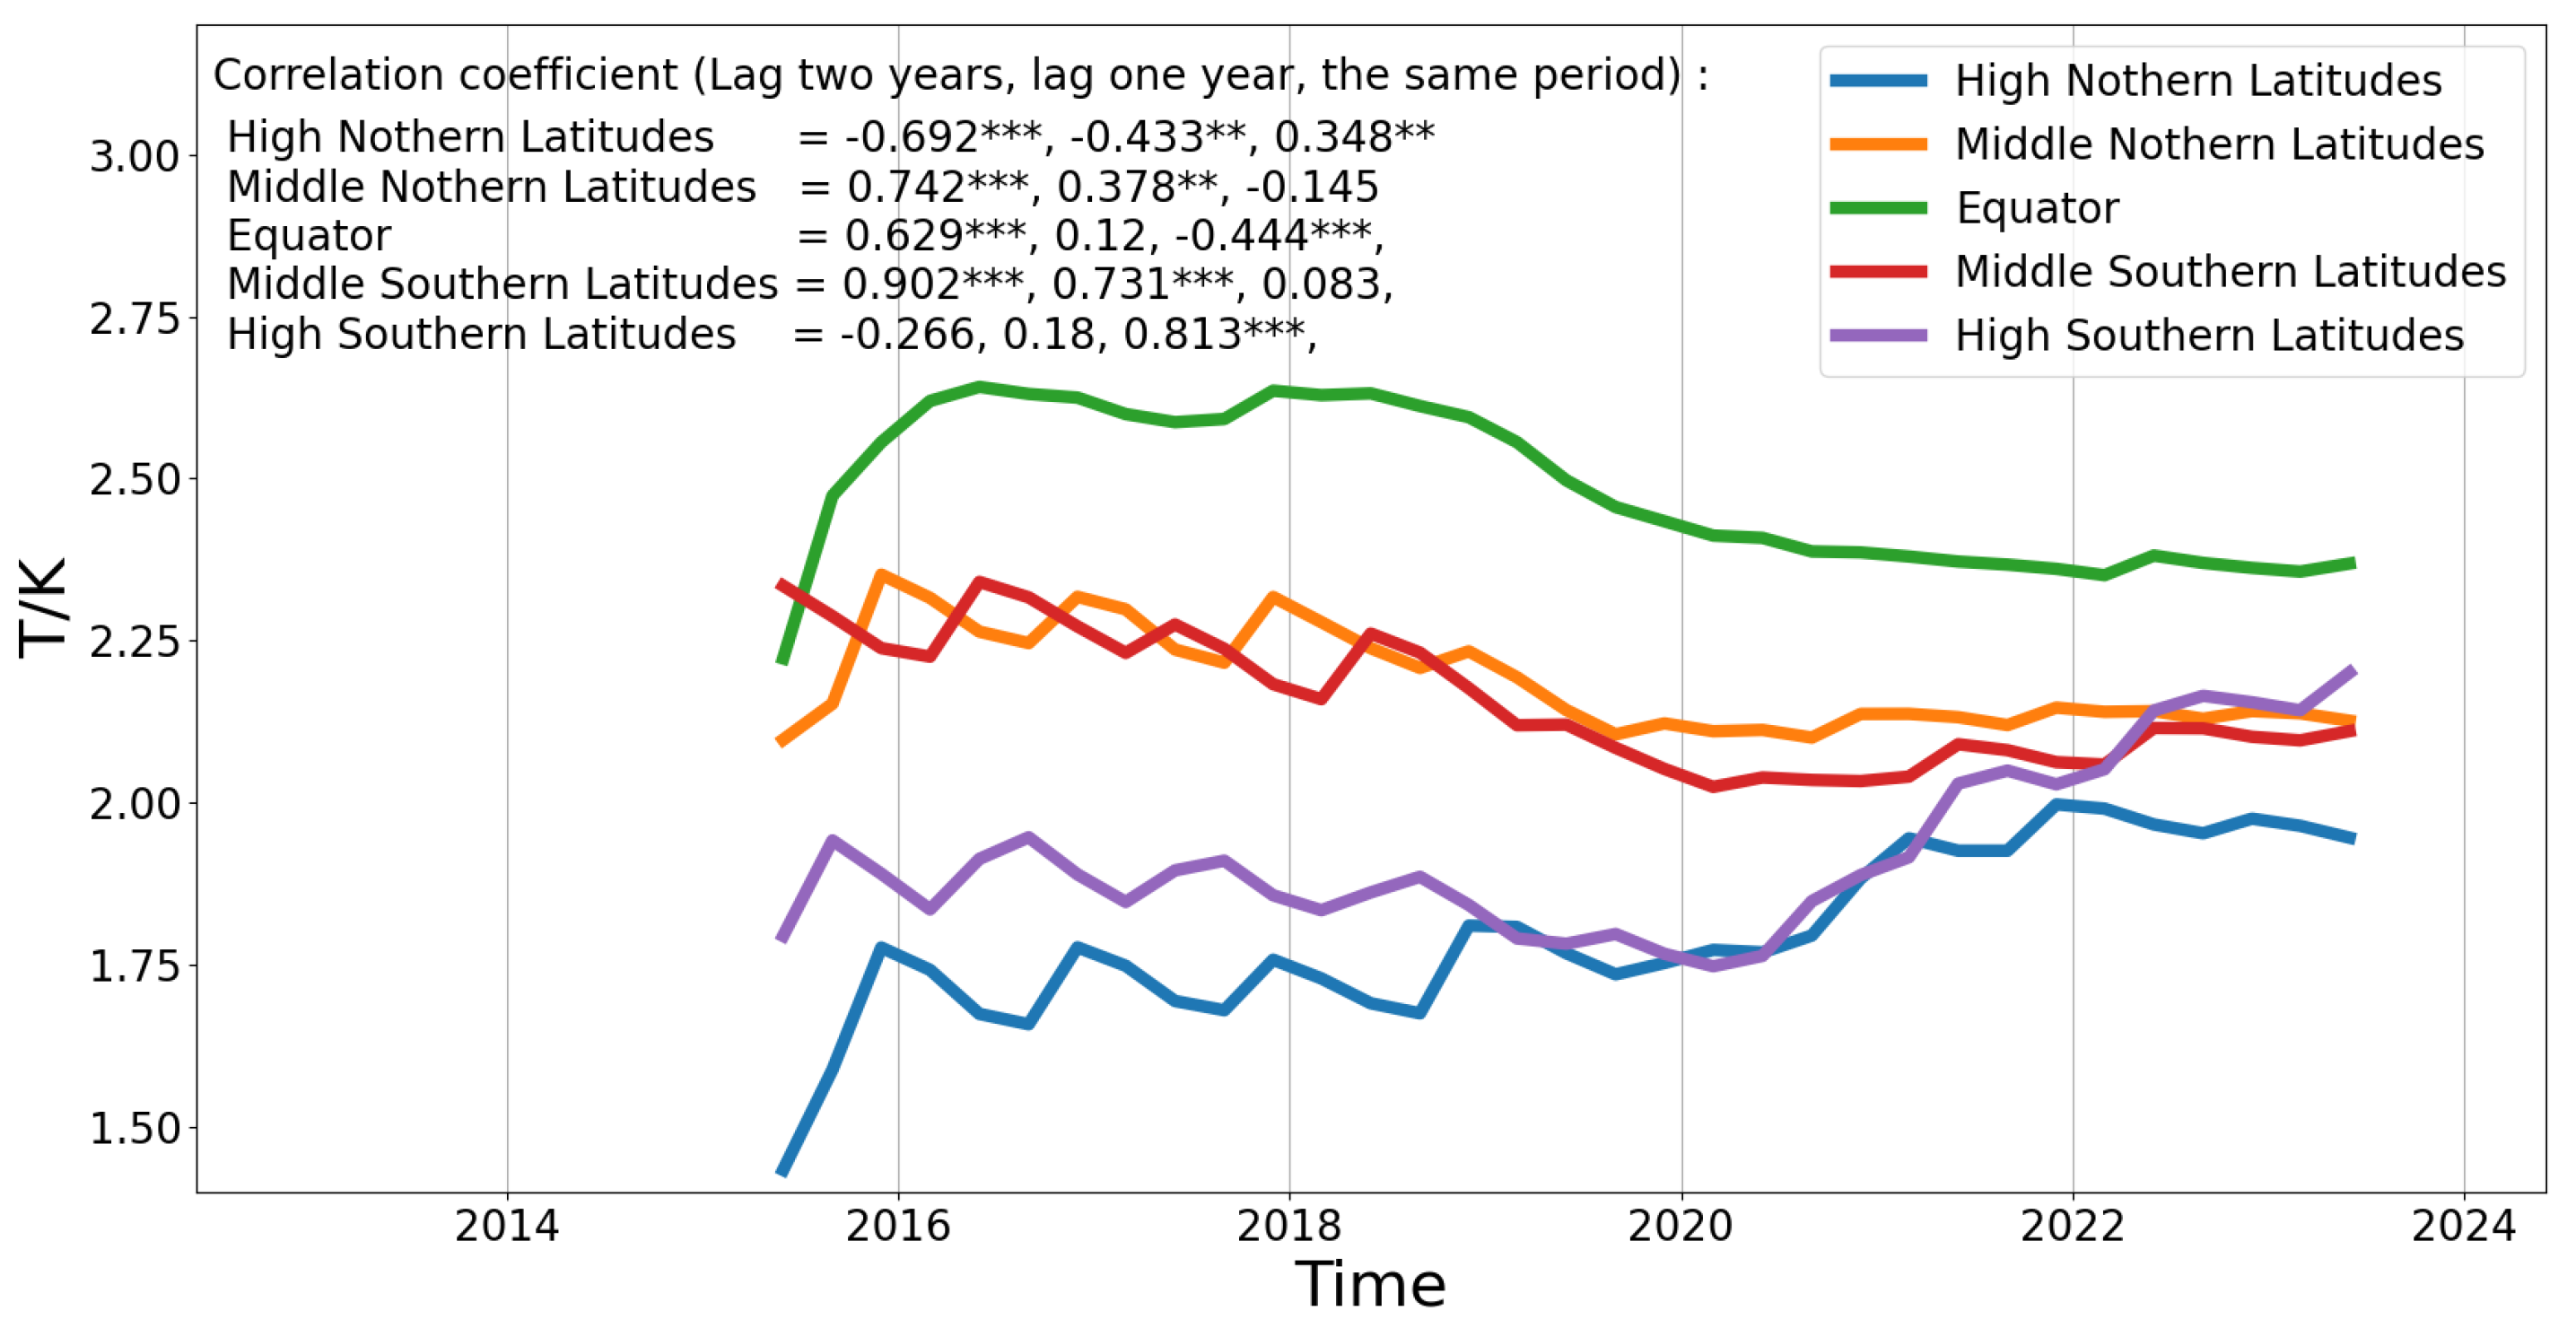
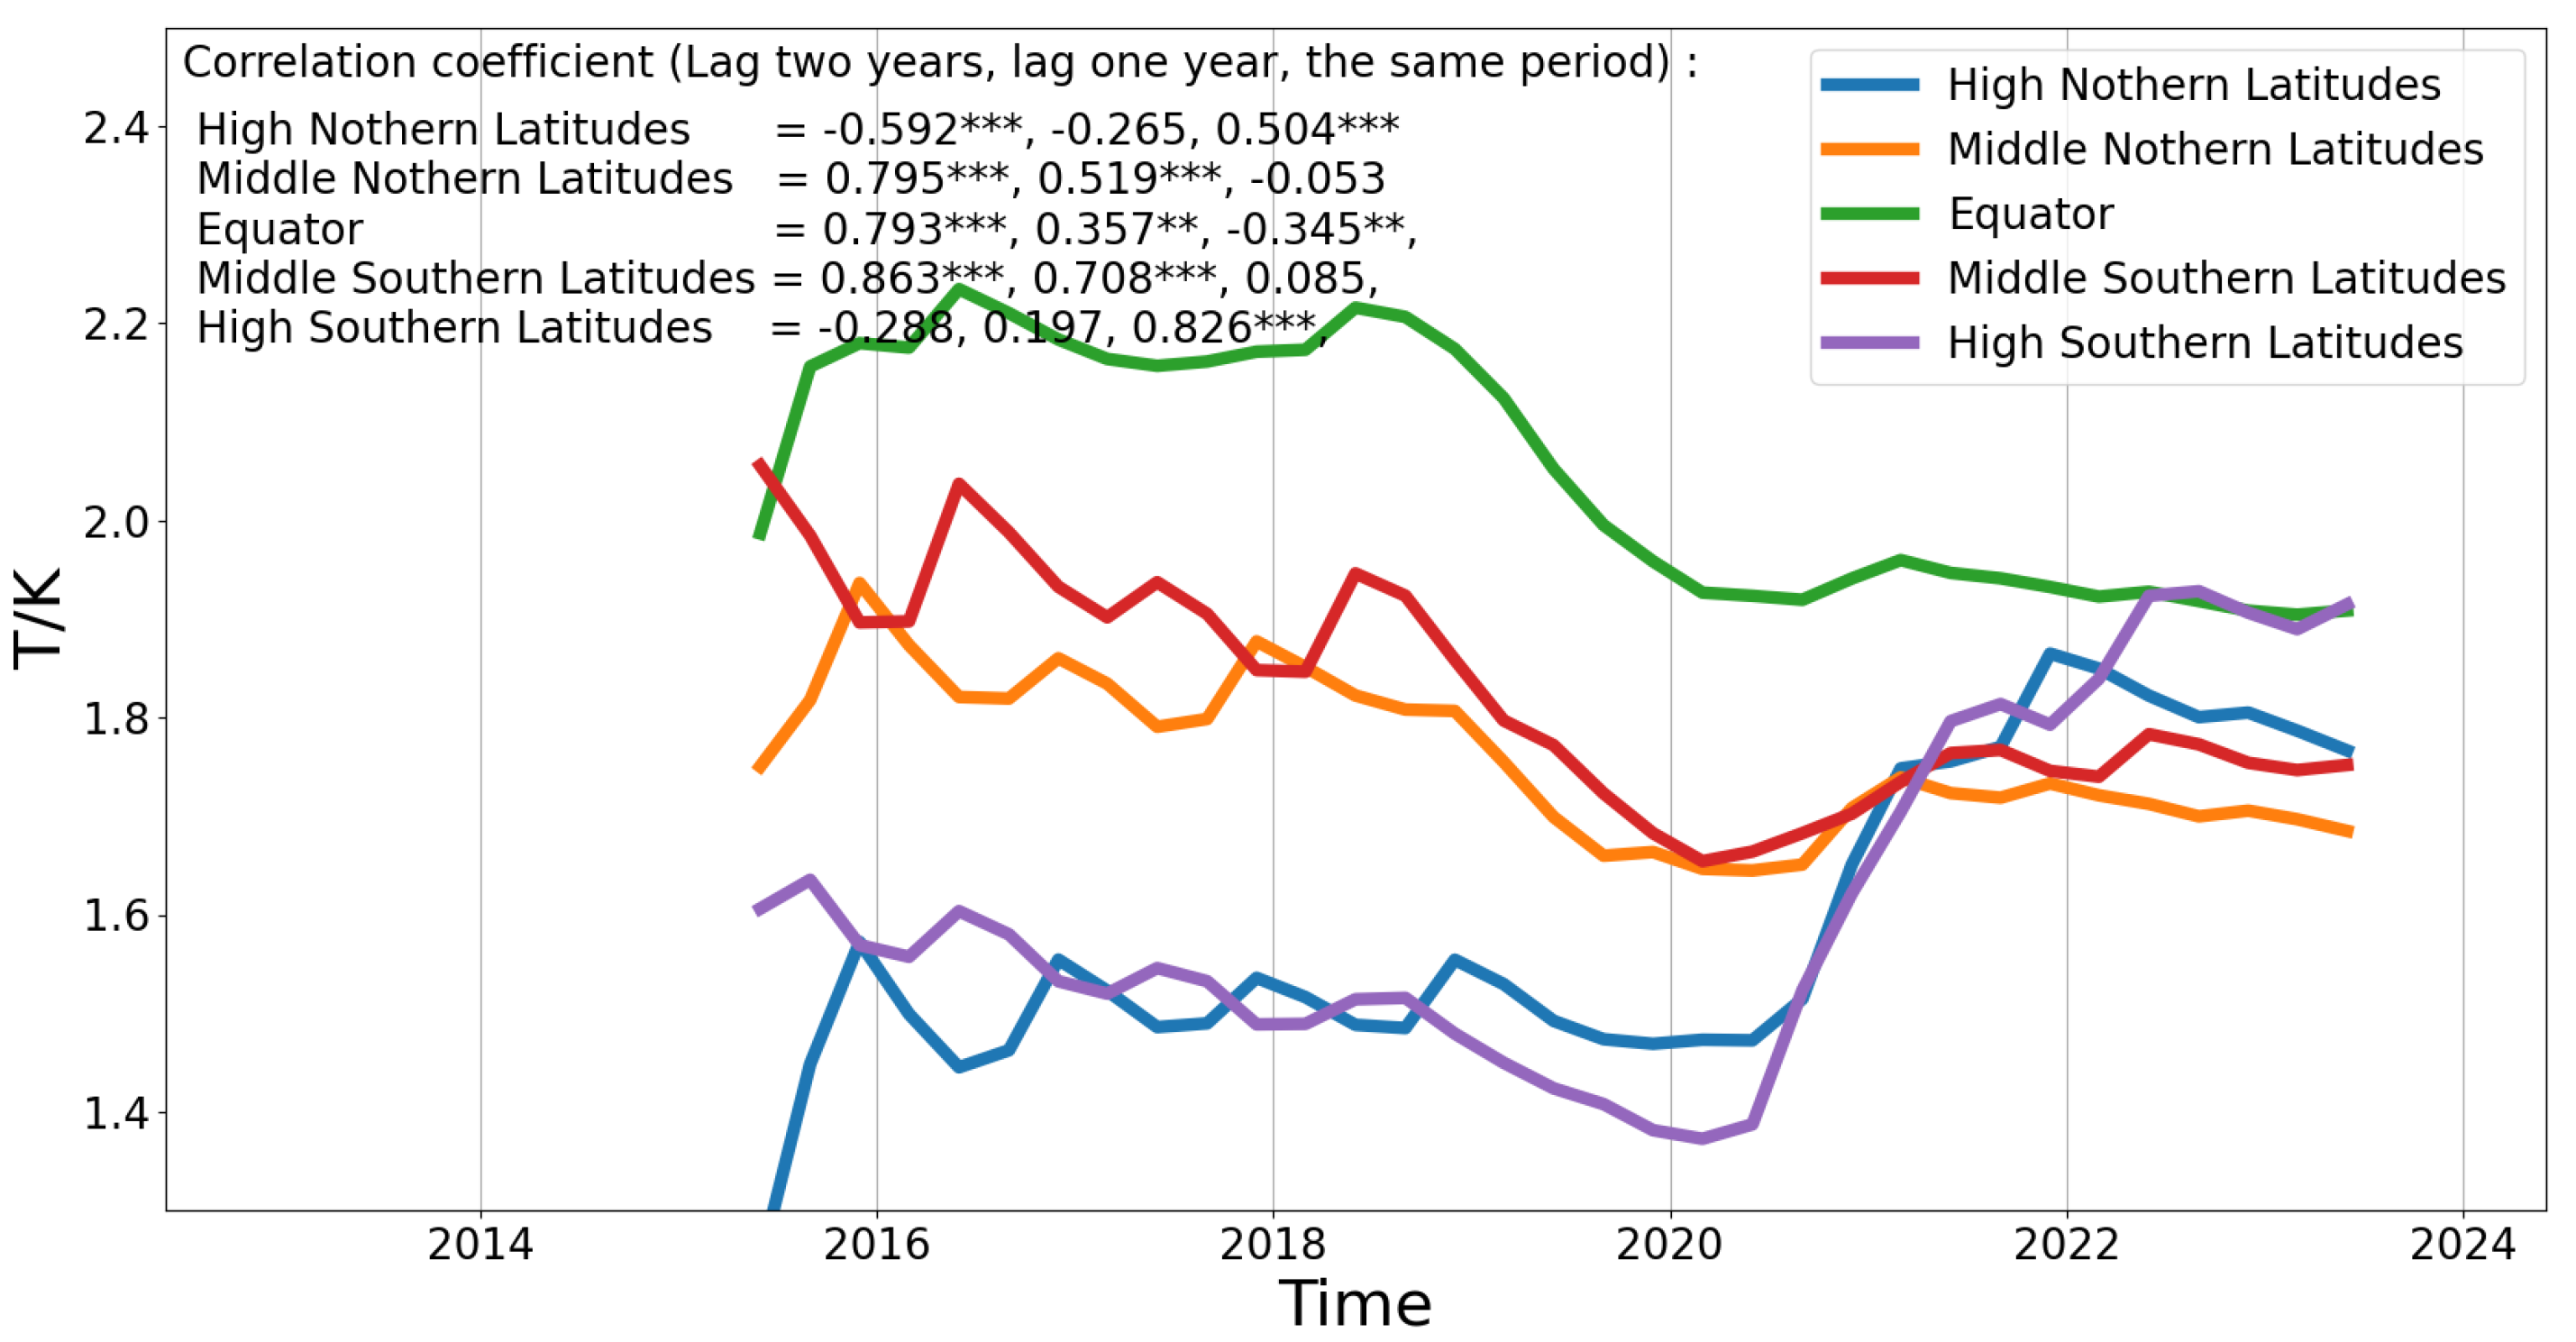
For gravity waves at different altitude layers, both the disturbance intensity and the interannual variation trends differ. Figure 1 shows the variations in short-wavelength gravity wave disturbance intensity at the 25 km altitude layer from 2015 to 2023, as well as the response to changes in solar activity intensity. The Pearson correlation coefficients between the sunspot number and gravity wave disturbance intensity, along with their significance, p-values, are indicated in the top graph of Figure 1. From Figure 1, it can be seen that the impact of solar activity intensity on short-wavelength gravity waves at the 25 km altitude layer has a higher reliability with a 2-year lag, while the impact in the same period can be ignored. From the 2-year lag analysis, it can be seen that the Southern Hemisphere is more affected by solar activity intensity than the Northern Hemisphere. This might be due to the larger land area in the Northern Hemisphere, leading to more orographic gravity waves and influences from land-sea boundaries [31].
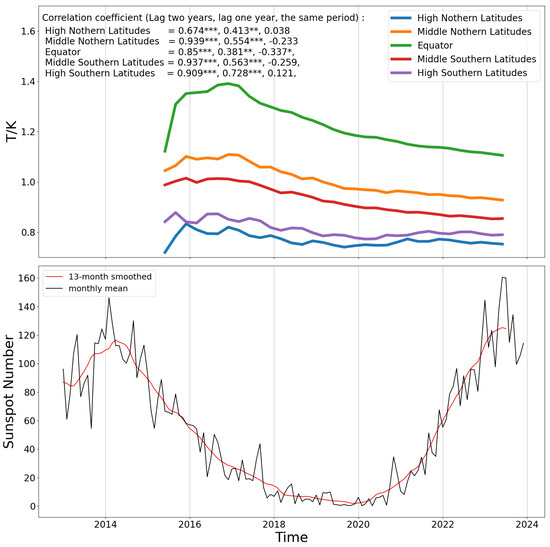
Figure 1.
Response of short-wavelength gravity waves to solar activity at an altitude of 25 km. The top graph shows the variation in gravity wave disturbance intensity over time in different latitude intervals. Significance levels are indicated as follows: p-value > 0.1 is not marked, p-value < 0.1 is marked with *, p-value < 0.05 is marked with **, and p-value < 0.01 is marked with ***. In the bottom graph, the black line represents the monthly mean sunspot number, and the red line represents the 13-month mean sunspot number.
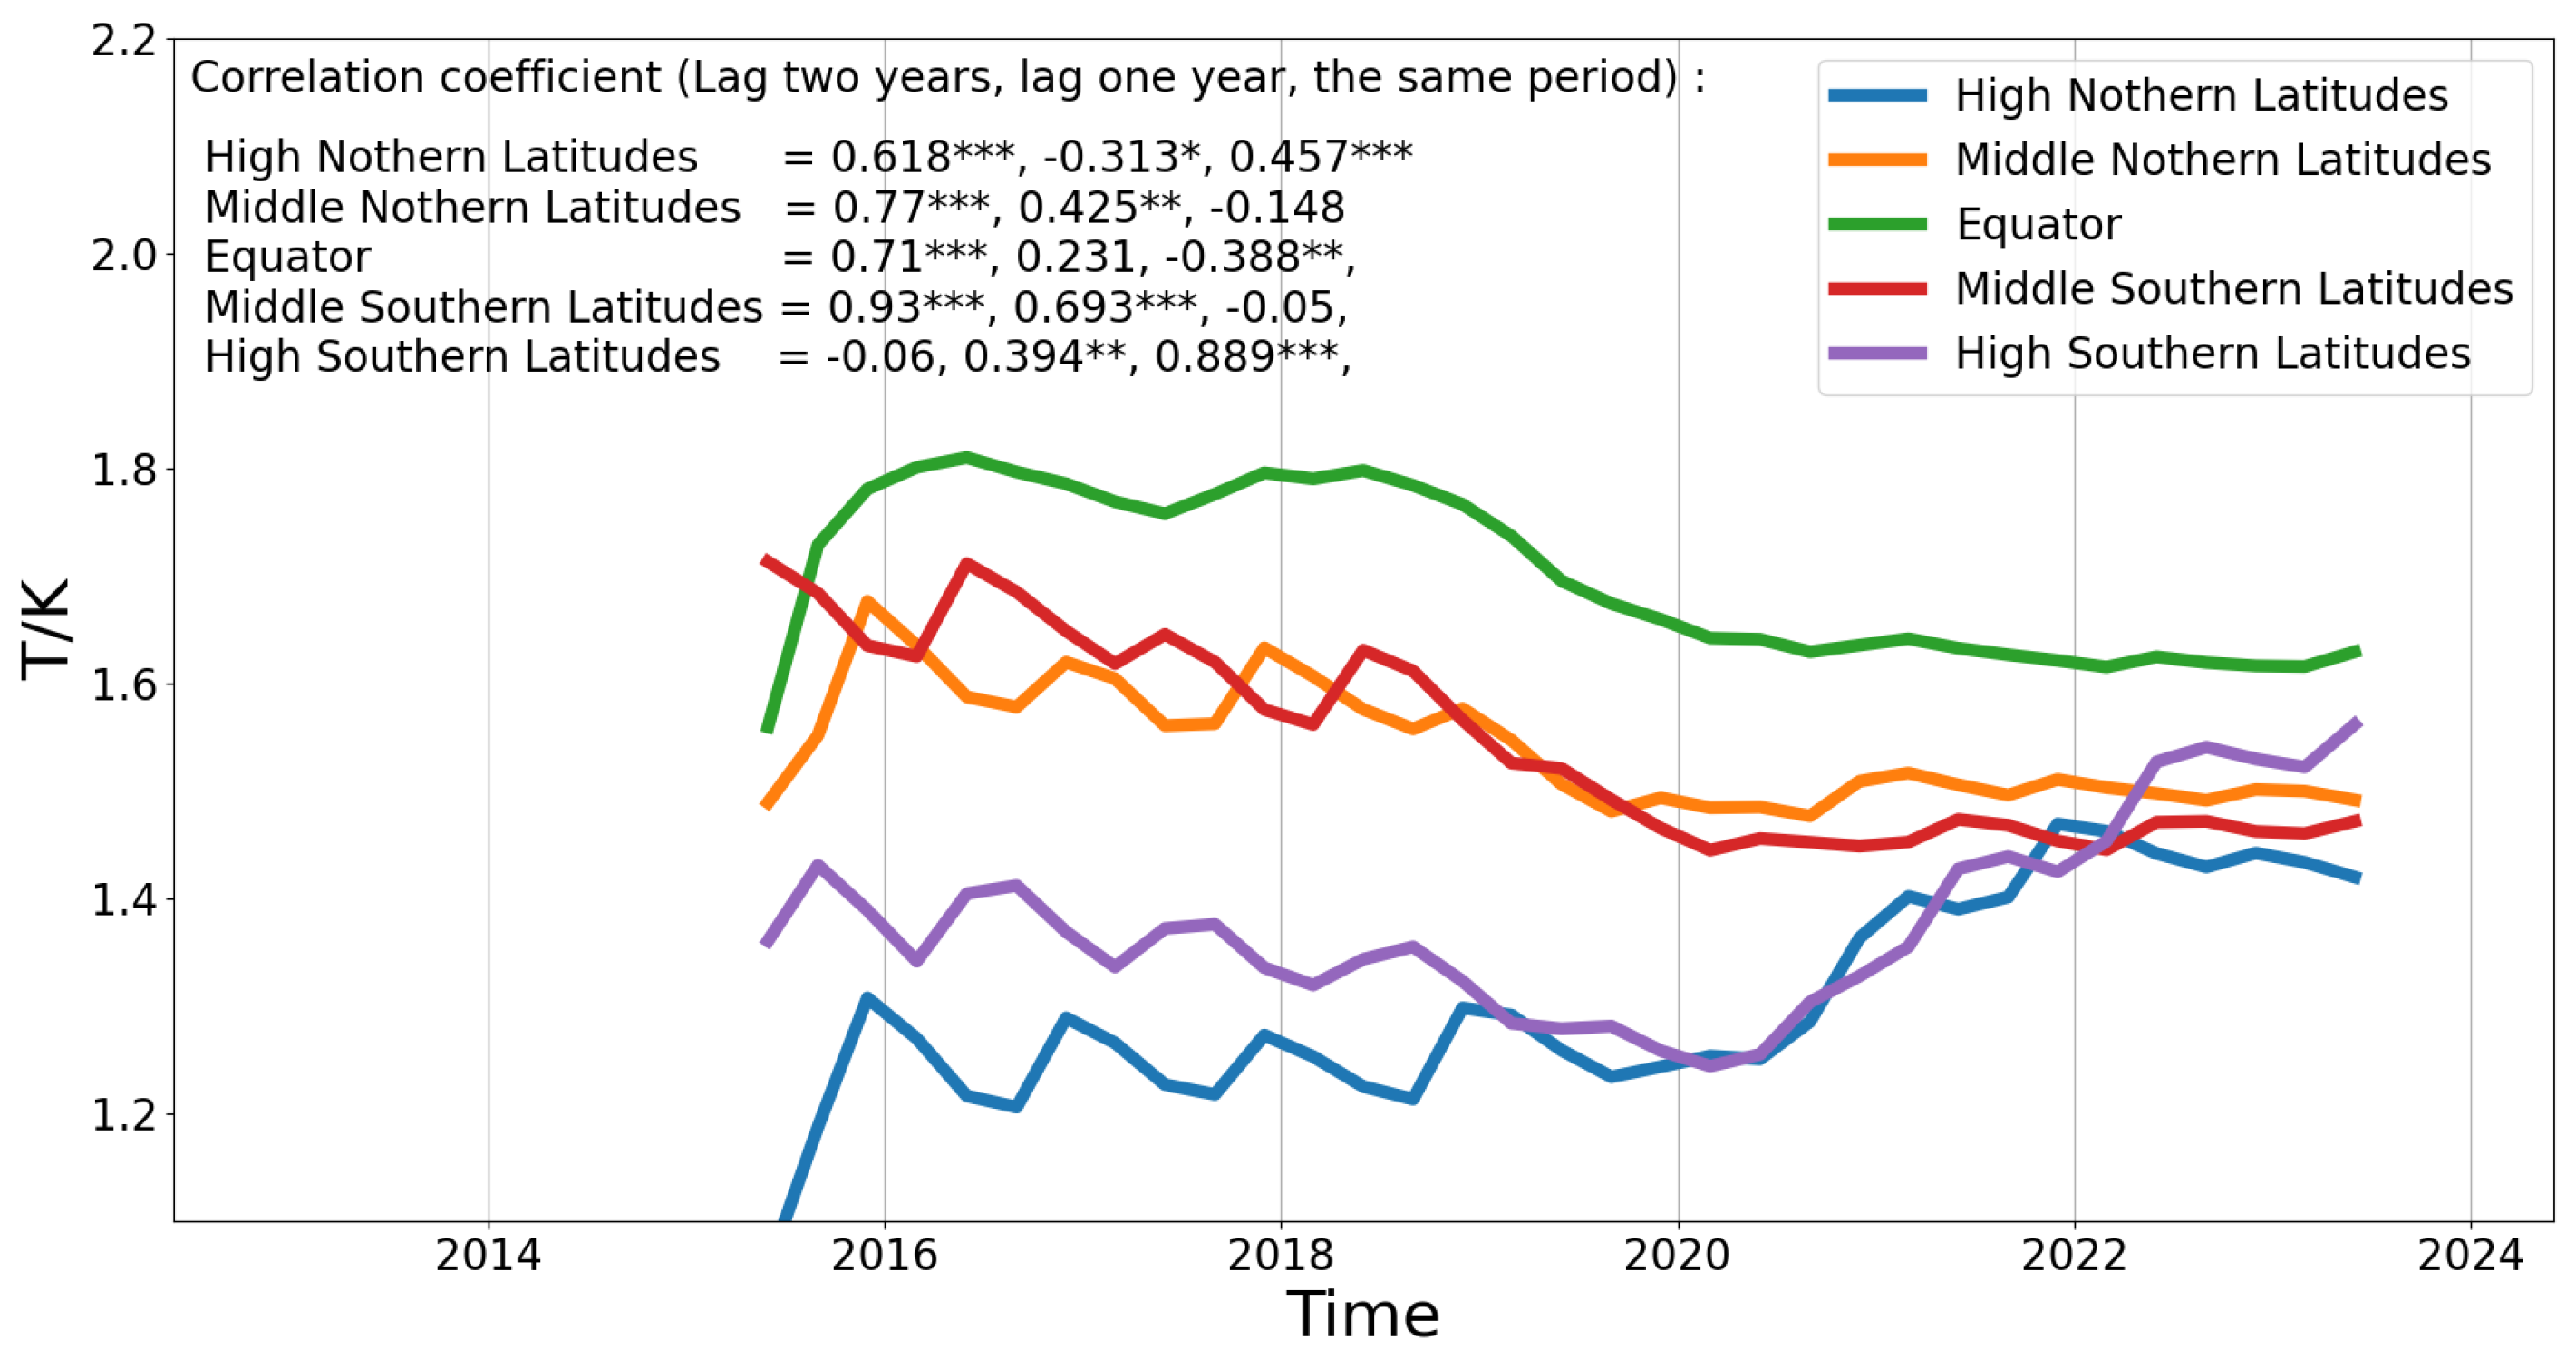
Figure 2 shows the response of short-wavelength gravity waves to solar activity at an altitude range of 35 km. Based on the correlation coefficients and significance p-values indicated in the top graph of Figure 1, it is evident that gravity waves in the polar regions of both hemispheres are the most sensitive to changes in solar activity intensity, with the highest confidence in the impact during the same period. For the Southern Hemisphere, Northern Hemisphere, and equatorial regions, the highest confidence is observed with a 2-year lag, showing a trend where the correlation is higher in mid-latitude regions compared to the equatorial regions. Similar to the response at 35 km altitude, the high-latitude regions of both hemispheres at 45 km altitude are the most sensitive, with the correlation coefficients being quite similar. In the mid-latitude and equatorial regions at the 45 km altitude layer, the response of gravity wave disturbances to solar activity intensity has the highest confidence with a 2-year lag, with correlation coefficients exceeding 0.8.
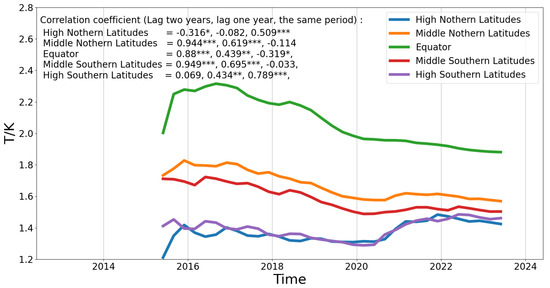
Figure 2.
Response of short-wavelength gravity waves to solar activity at an altitude of 35 km. The legend is the same as in Figure 1.
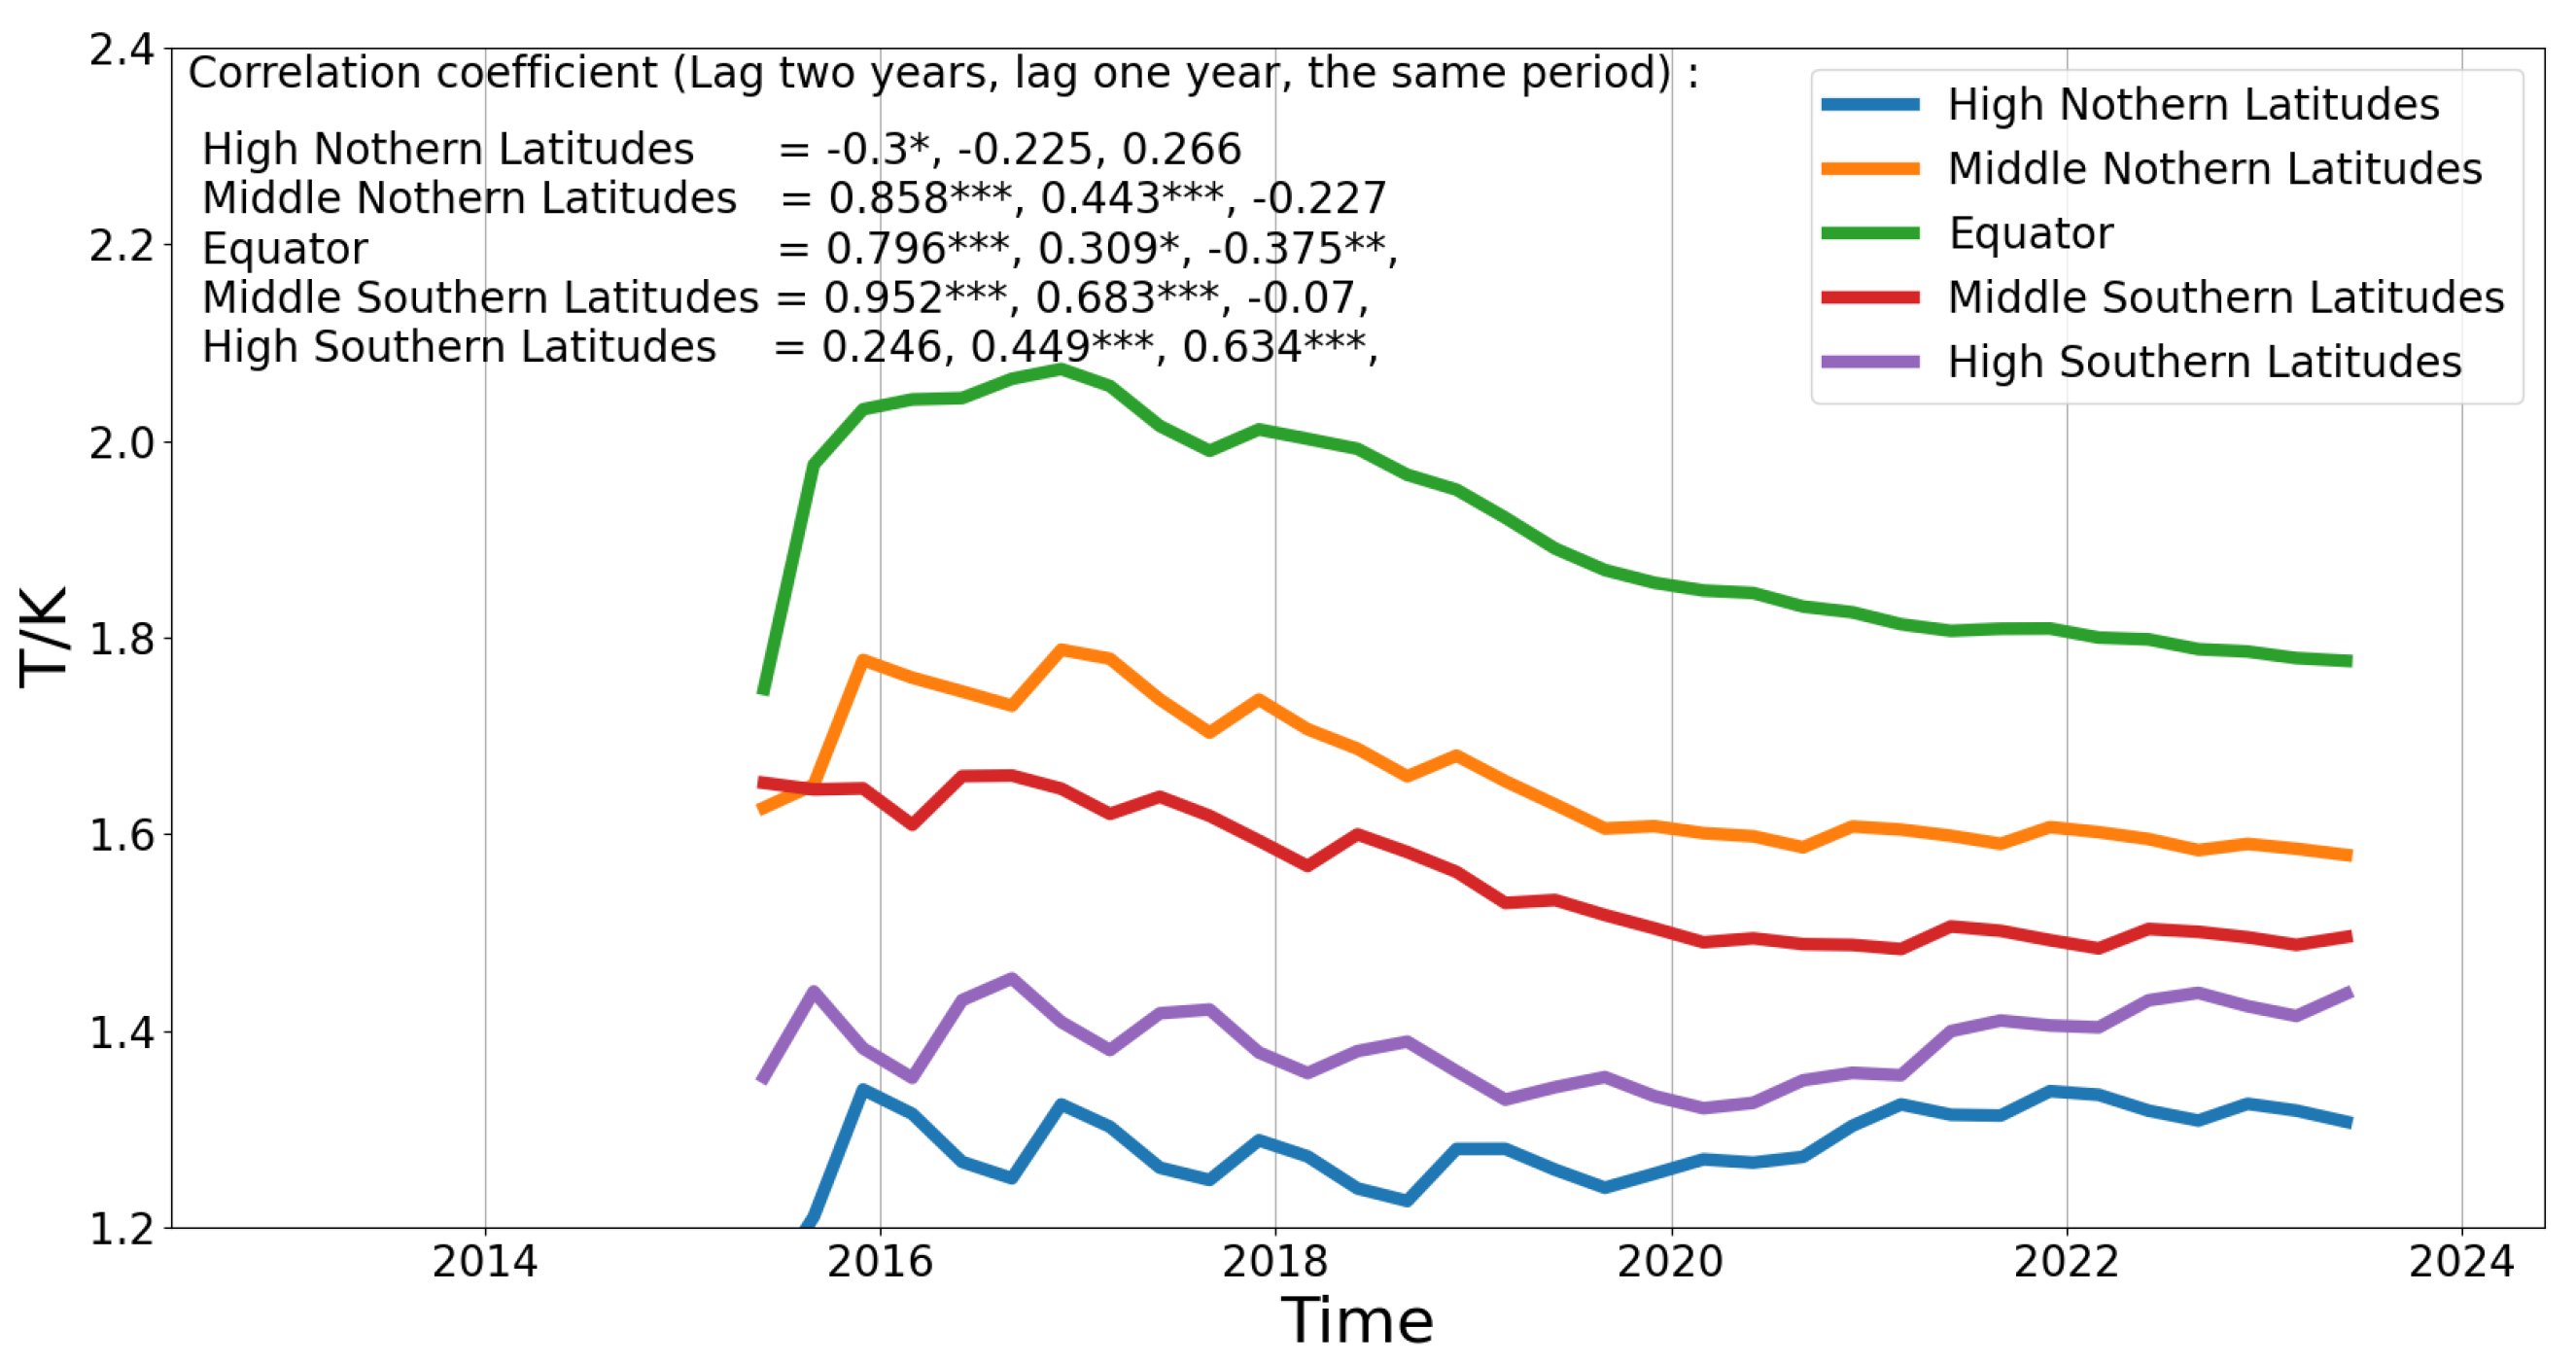
From Figure 1, Figure 2 and Figure 3, it can be seen that for short-wavelength gravity waves, the disturbance intensity is strongest in the equatorial region, followed by the mid-latitude regions, and weakest in the high-latitude regions. This is consistent with the analysis results of Alexander et al. (2008) and Wu and Eckermann (2008) [32,33]. Additionally, at the 35 km and 45 km altitude layers, gravity wave disturbances in the mid-latitude regions exhibit seasonal variations, and the disturbance intensity in the Northern Hemisphere is higher than that in the Southern Hemisphere across all latitude bands. This phenomenon is mainly due to the different zonal wind directions in the Northern Hemisphere during winter and summer, which produce different filtering effects on orographic gravity waves, leading to seasonal variations in gravity wave intensity [31]. In terms of intensity, the gravity wave disturbance intensity at the 35 km altitude layer is higher than at the 25 km and 45 km altitude layers, which is similar to the observations of Wang et al. (2023) [4]. From the correlation analysis, it can be seen that the correlation coefficients for a 2-year lag in the mid-latitude and equatorial regions are significantly higher than those for a 1-year lag. This indicates that the impact of solar activity intensity changes on stratospheric gravity waves in mid- and low-latitude regions is delayed, reaching its peak after a 2-year lag. The cause of this phenomenon is likely due to the delayed response of fundamental atmospheric parameters and activities to solar activity [34,35] In the 1-year lag analysis, the correlation between gravity waves and sunspot numbers in the mid-latitude and equatorial regions is positively related to altitude; the higher the altitude, the higher the correlation. For example, in the mid-latitude region of the Southern Hemisphere, the correlation coefficients at 25 km, 35 km, and 45 km altitudes are 0.554, 0.695, and 0.776, respectively. However, this phenomenon is not observed in the 2-year lag analysis. This might be because the correlation coefficients in the 2-year lag analysis have already reached a strong correlation, resulting in smaller distinctions across different altitude layers. However, this phenomenon is not observed in the 2-year lag analysis.

Figure 3.
Response of short-wavelength gravity waves to solar activity at an altitude of 45 km. The legend is the same as in Figure 1.
3.2. Response of Long-Wavelength (12–20 km) Gravity Waves
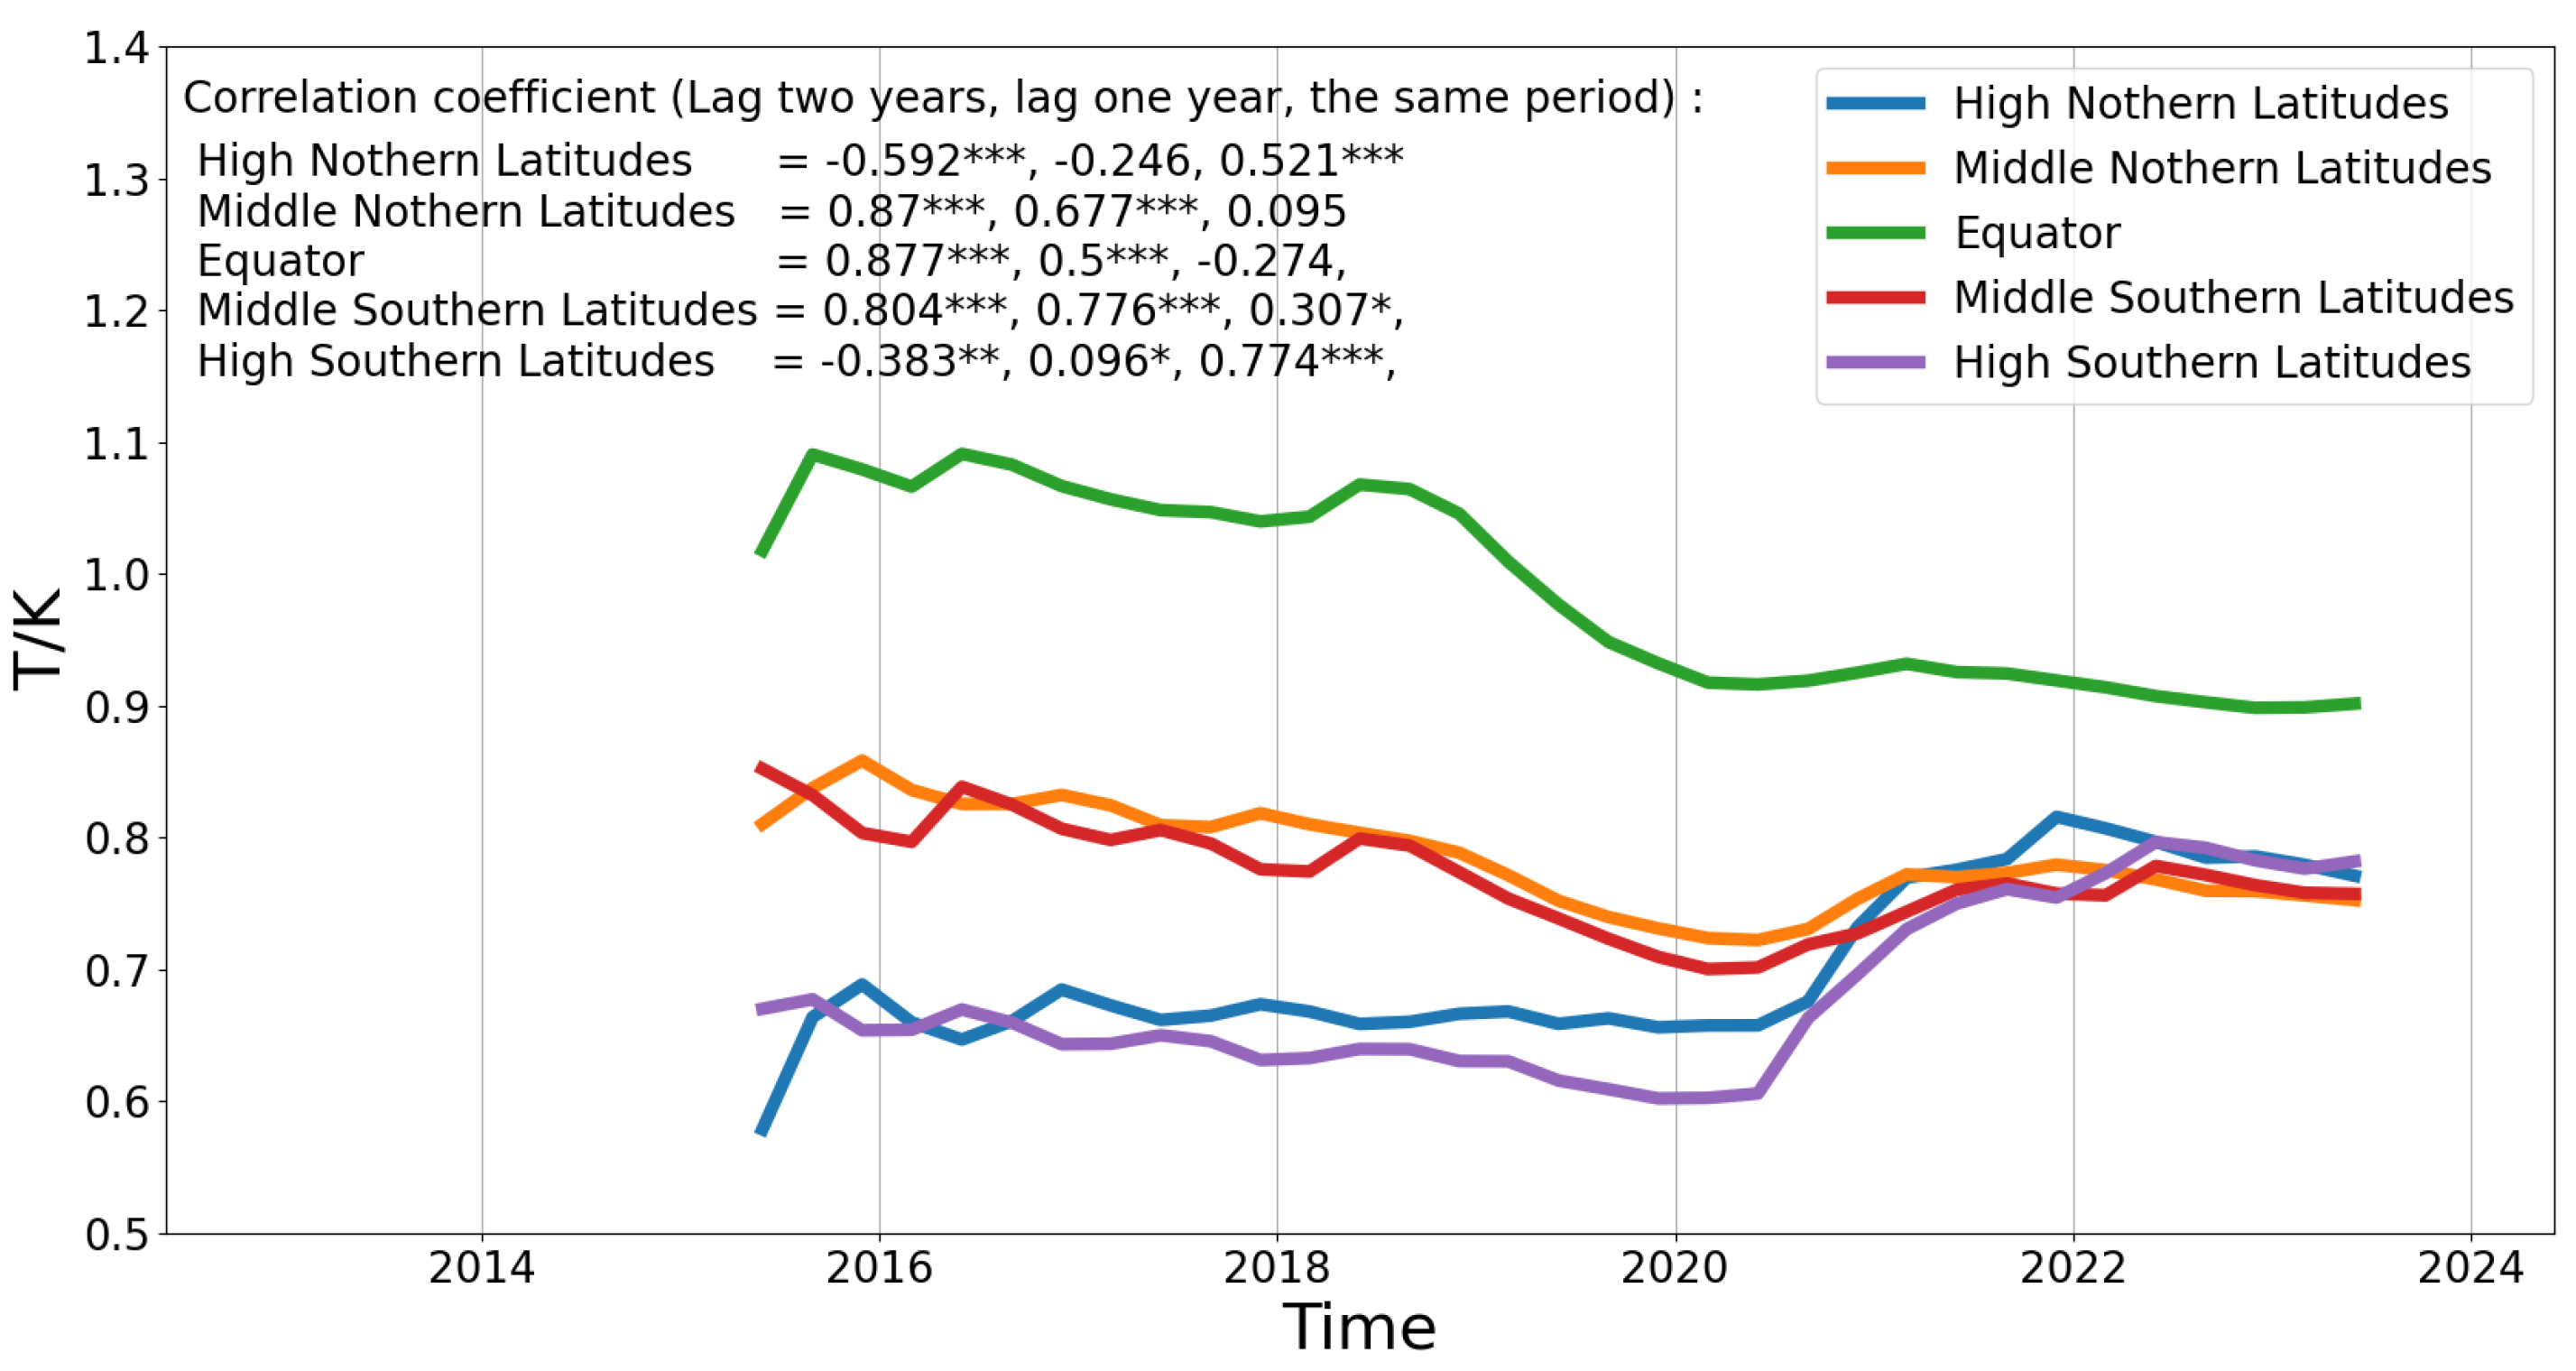
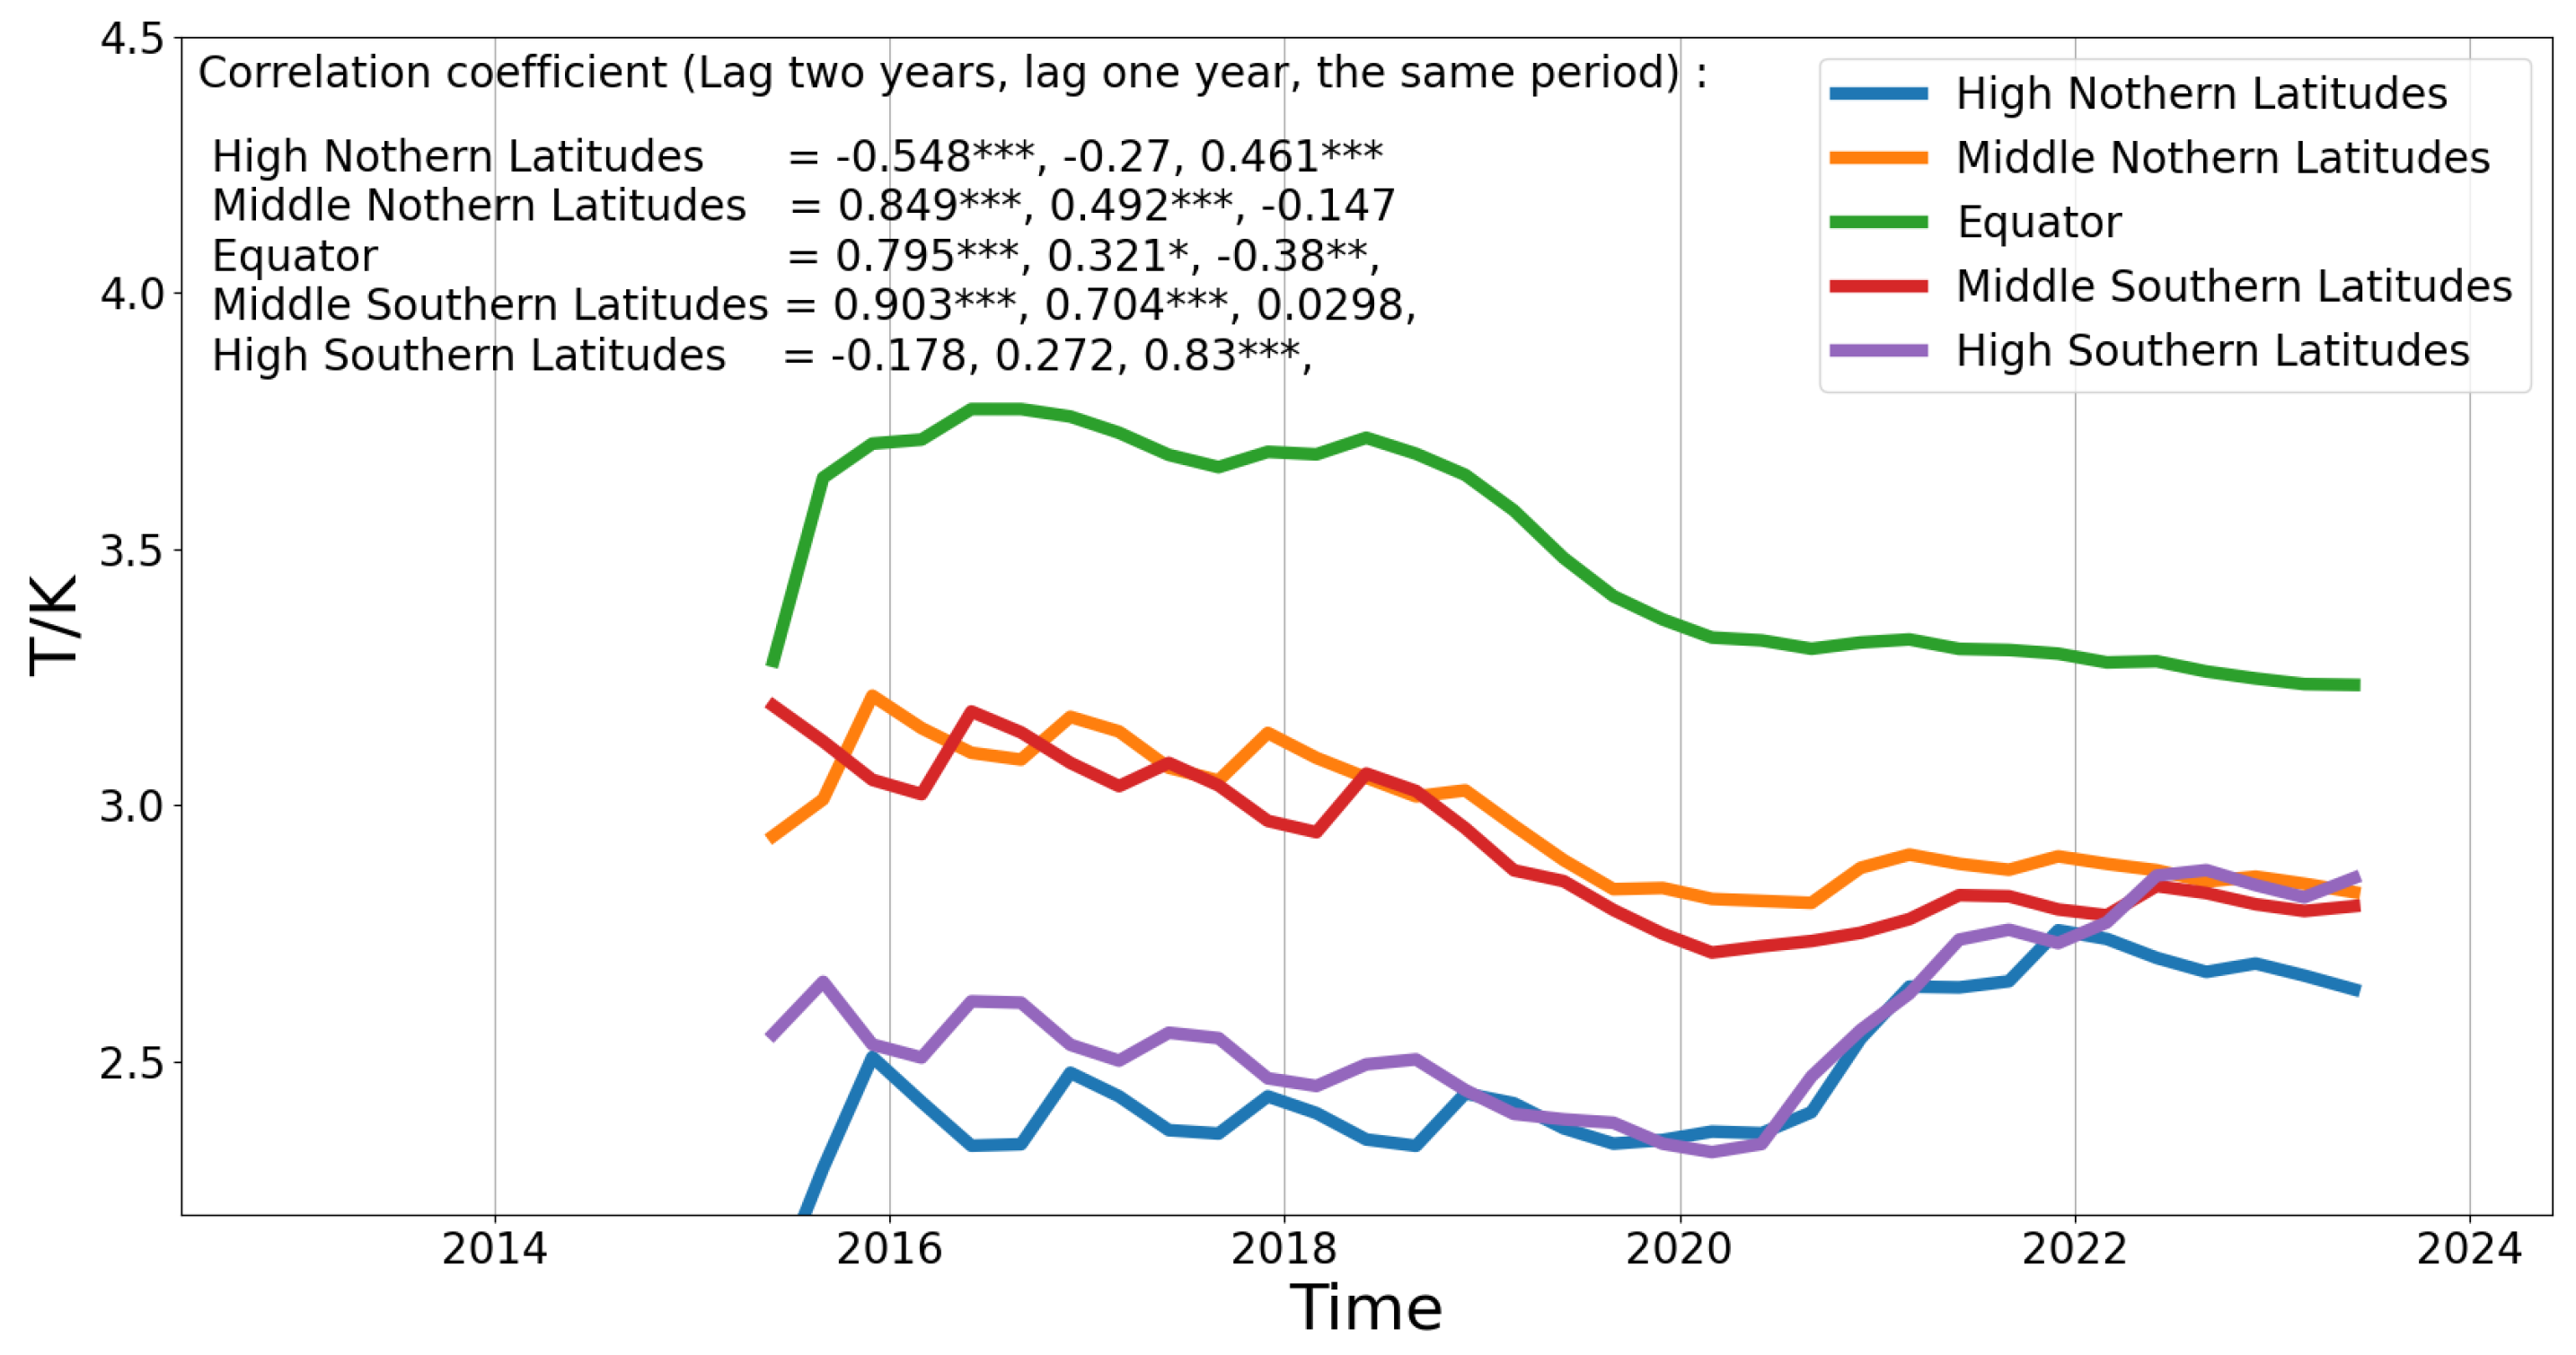
Using band-pass filtering, we extracted gravity waves with wavelengths in the range of 12–20 km for analysis. The results are shown in Figure 4, Figure 5 and Figure 6. Figure 4 shows the response of gravity waves at the 25 km altitude layer to solar activity. As shown in the figure, except for the high-latitude region of the Southern Hemisphere, the response of gravity wave disturbance intensity to solar activity intensity in other latitude bands is delayed by two years. The response of gravity wave disturbances in the high-latitude region of the Southern Hemisphere to changes in solar activity intensity is relatively rapid, showing a response within the same period. It is worth noting that the correlation between sunspot numbers and gravity waves in the high-latitude region of the Northern Hemisphere with a two-year lag is negative. Figure 5 and Figure 6 show the response of gravity waves at the 35 km and 45 km altitude layers to solar activity, respectively. Similar to the 25 km altitude layer, except for the same-period response in the high-latitude region of the Southern Hemisphere, the response of gravity wave disturbance intensity to solar activity intensity in other latitude bands is delayed by two years. Additionally, the correlation between sunspot numbers and gravity waves in the high-latitude region of the Northern Hemisphere with a two-year lag is also negative. It is noteworthy that in the mid-latitude and equatorial regions, the correlation coefficients with a two-year lag are positively related to altitude; the higher the altitude, the greater the correlation. This phenomenon is not observed in the one-year lag analysis. This is in stark contrast to the analysis of short-wavelength gravity waves, indicating that there are differences in the responses of short-wavelength and long-wavelength gravity waves to solar activity.
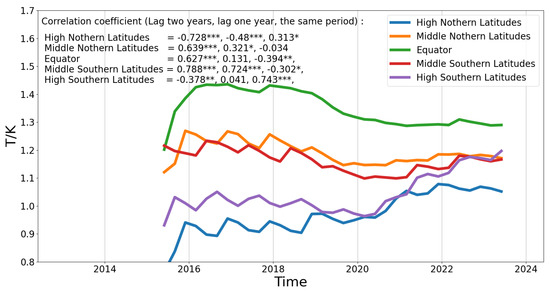
Figure 4.
Response of long-wavelength gravity waves at an altitude of 25 km to solar activity. The legend is the same as in Figure 1.
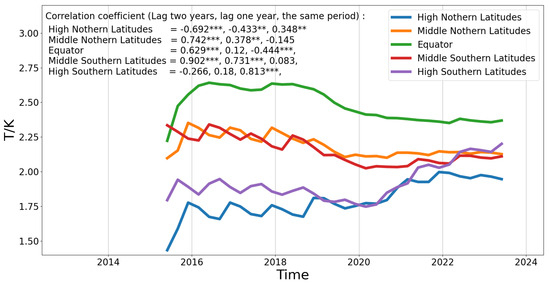
Figure 5.
Response of long-wavelength gravity waves at an altitude of 35 km to solar activity. Significance levels are indicated as follows: p-value > 0.1 is not marked, p-value < 0.05 is marked with **, and p-value < 0.01 is marked with ***.

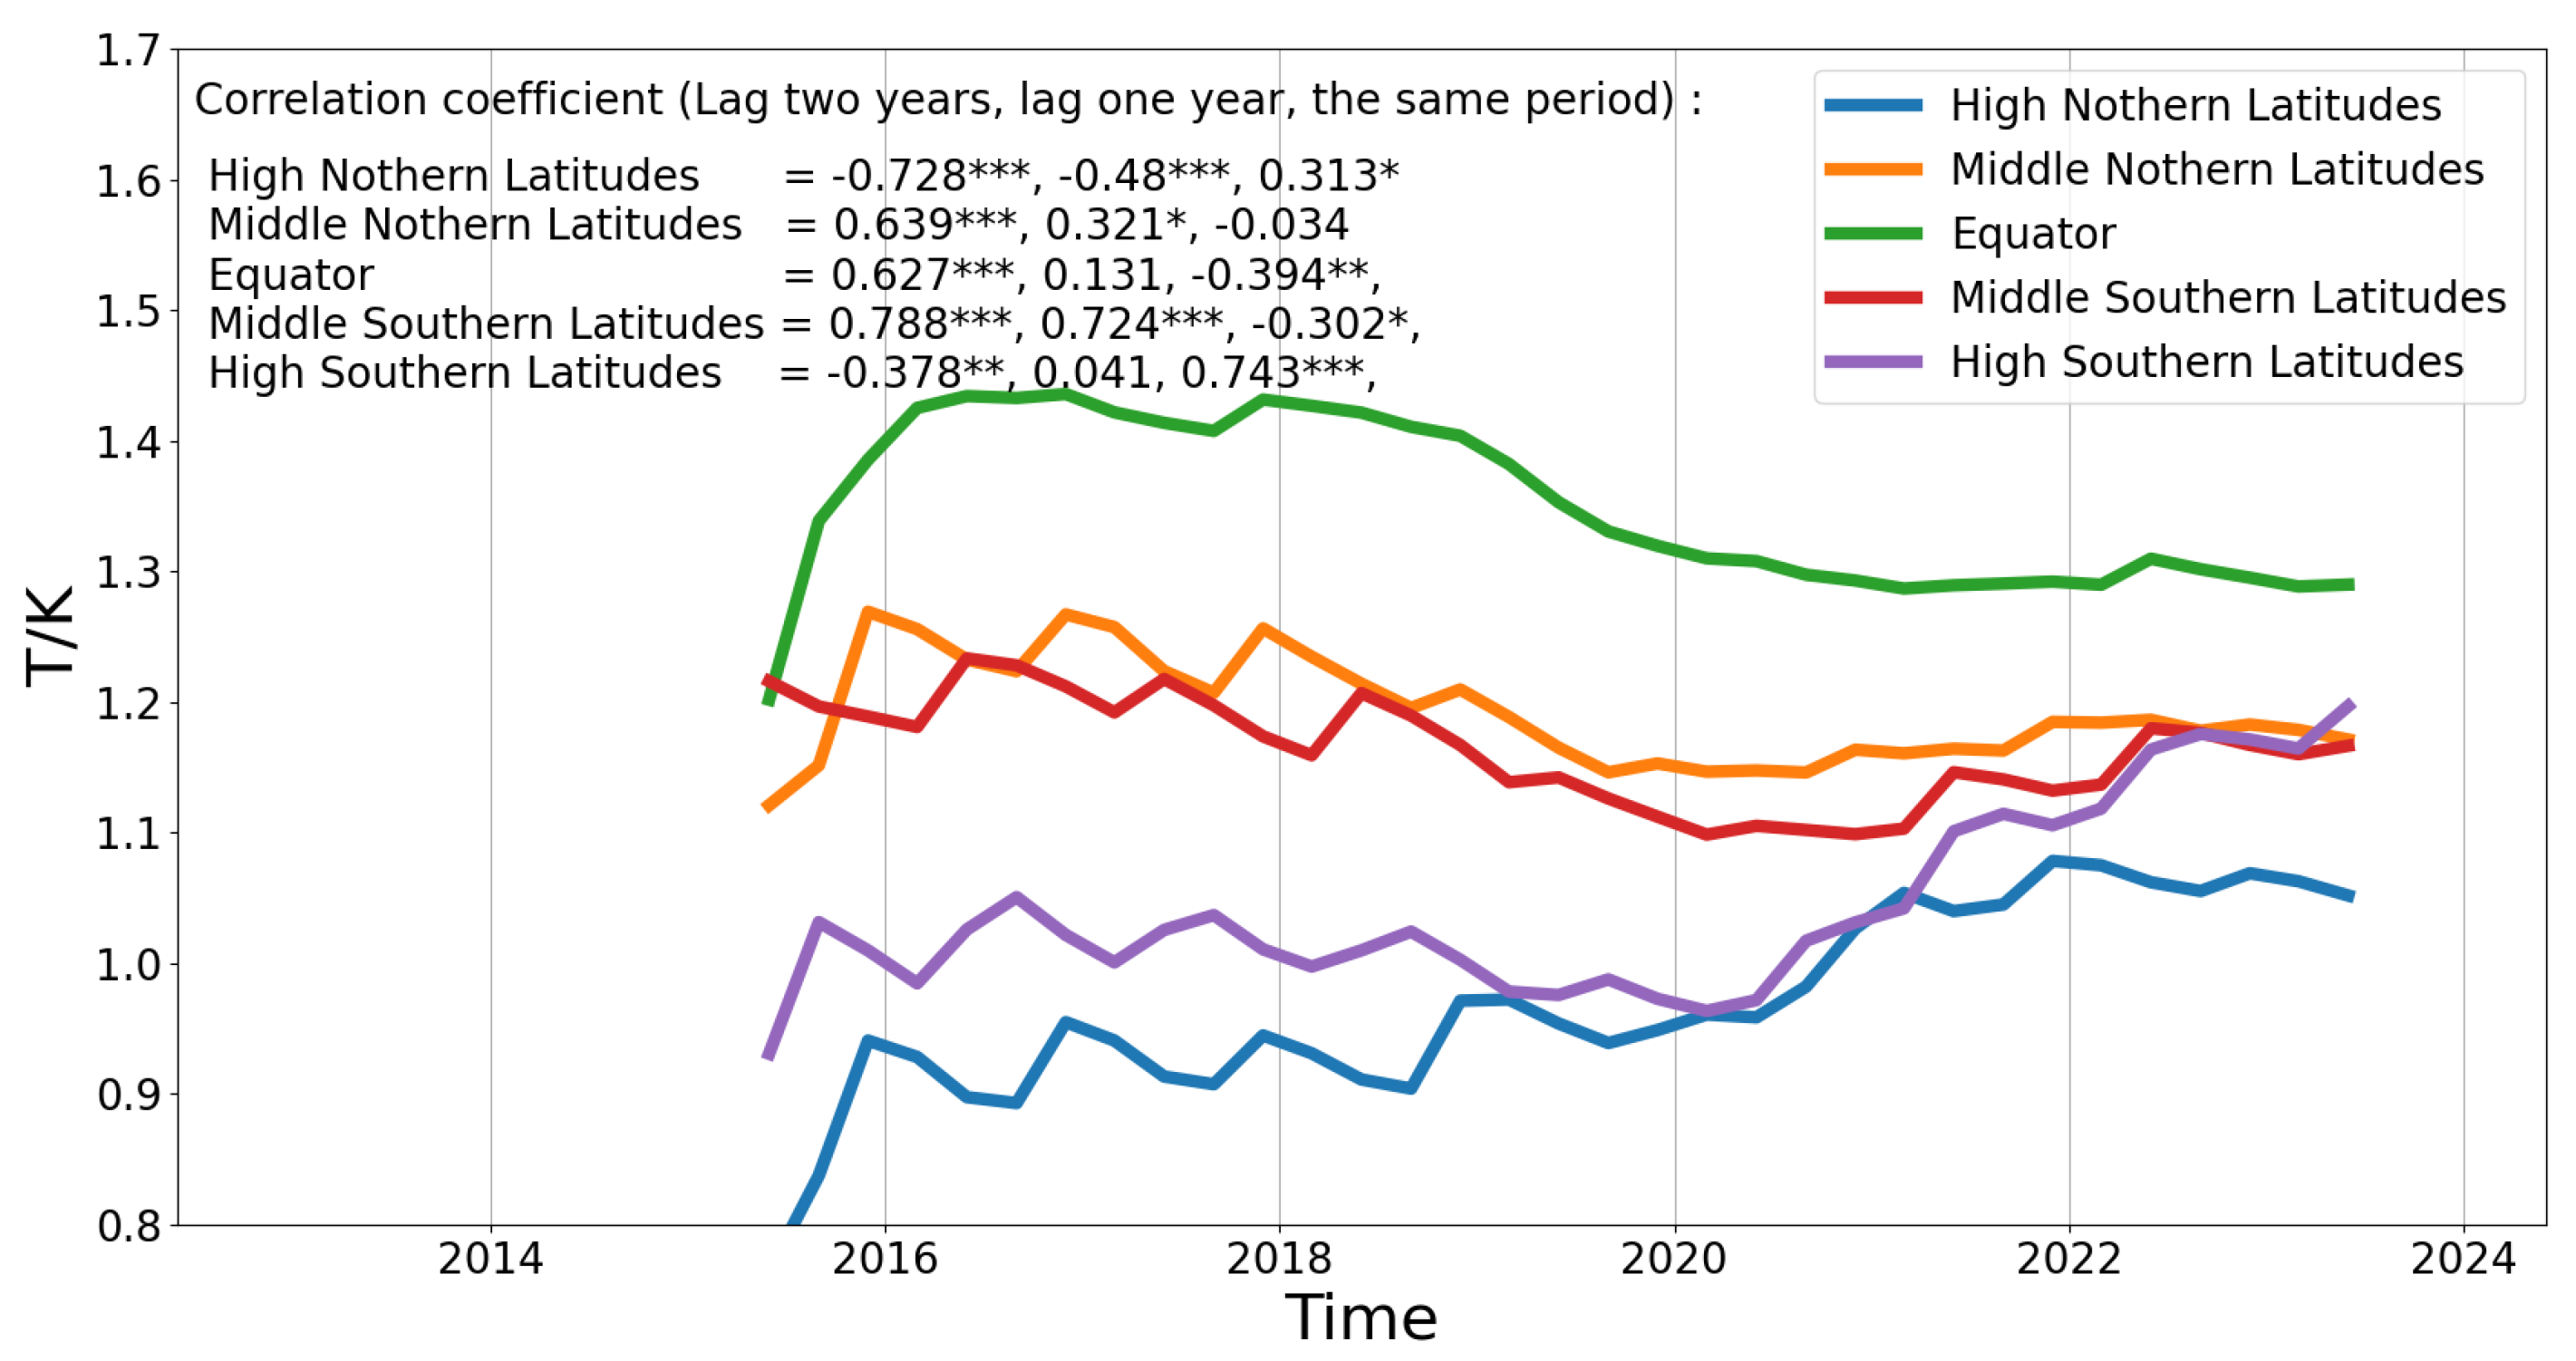
Figure 6.
Response of long-wavelength gravity waves at an altitude of 45 km to solar activity. The legend is the same as in Figure 1.
From a comprehensive view of Figure 4, Figure 5 and Figure 6, similar to short-wavelength gravity waves, the disturbance intensity is strongest in the equatorial region, followed by the mid-latitude regions, and weakest in the high-latitude regions. However, unlike short-wavelength gravity waves, the gravity wave intensity in the mid-latitude region of the Southern Hemisphere gradually increases with altitude and surpasses the disturbance intensity in the mid-latitude region of the Northern Hemisphere. For short-wavelength gravity waves, the disturbance intensity in the Southern Hemisphere is consistently lower than that in the Northern Hemisphere. In terms of correlation, the response of gravity waves in the mid-to-high-latitude regions of the Northern Hemisphere to changes in solar activity is delayed by two years. In the mid-latitude region of the Southern Hemisphere, the response is delayed by one year, while in the high-latitude region of the Southern Hemisphere, the response occurs within the same period. Consistent with previous studies, the simultaneous response of mid- and low-latitude regions to solar activity shows a negative correlation [9,15]. However, since their results did not undergo significance analysis, the conclusions, although similar, are questionable. Similar to short-wavelength gravity waves, the correlation coefficients between gravity waves and sunspot numbers in the equatorial region are lower than those in the mid-latitude region at different altitude levels. Additionally, in the two-year lag analysis, the correlation between gravity waves in the mid-latitude region and sunspot numbers is positively related to altitude; the higher the altitude, the greater the correlation. For example, in the mid-latitude region of the Northern Hemisphere, the correlation coefficients at 25 km, 35 km, and 45 km altitudes are 0.639, 0.742, and 0.77, respectively. This trend is consistent with the equatorial region and the mid-latitude region of the Southern Hemisphere. This phenomenon is not observed in the one-year lag analysis.
3.3. Response of Full Wavelength (2–20 km) Gravity Waves
Combining the analysis of short-wavelength gravity waves and long-wavelength gravity waves, Figure 7, Figure 8 and Figure 9 depict the response of gravity waves across different altitude levels to solar activity. Figure 7 illustrates the response of gravity waves across all wavelengths at an altitude of 25 km to solar activity. It can be observed that the response of mid-latitude regions to solar activity gradually strengthens with increasing lag time. Gravity waves in the high-latitude regions of the Southern Hemisphere respond to solar activity changes during the same period. The response of gravity waves at a 35 km altitude level differs from that at a 25 km altitude level (as shown in Figure 8). High-latitude regions of the Northern Hemisphere respond to solar activity during the same period, but gravity waves lagging two years behind solar activity show a negative correlation. Overall, the response of gravity waves across all wavelengths to solar activity shows that mid-latitude regions and equatorial regions exhibit a lagged response to solar activity of two years at all altitude levels. Additionally, there is a phenomenon where the higher the altitude, the lower the correlation coefficient. At the same time, the differences between the high-latitude regions of the Northern and Southern Hemispheres are quite evident. In the Southern Hemisphere high-latitude regions, there is no lagged response to solar activity across all altitude levels. However, the situation in the Northern Hemisphere is more complex. Only the analysis at 35 km and 45 km altitude levels passed significance testing, and in the analysis with a lag of two years, a negative correlation is observed.

Figure 7.
Response of gravity waves across all wavelengths at an altitude of 25 km to solar activity. The legend is the same as in Figure 1.

Figure 8.
Response of gravity waves across all wavelengths at an altitude of 35 km to solar activity. The legend is the same as in Figure 1.
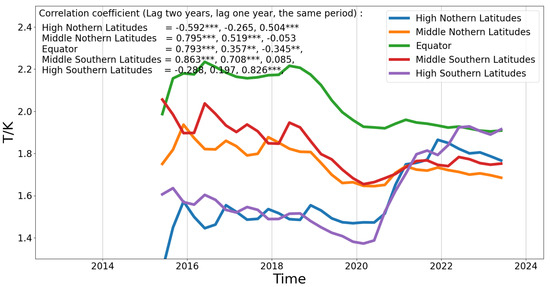
Figure 9.
Response of gravity waves across all wavelengths at an altitude of 45 km to solar activity. Significance levels are indicated as follows: p-value > 0.1 is not marked, p-value < 0.05 is marked with **, and p-value < 0.01 is marked with ***.
4. Summary and Discussion
This study utilizes the stratospheric temperature profile data observed by the GNOS payload on the FY-3C satellite to analyze the response of gravity wave disturbances in the 20–50 km altitude range to long-term variations in solar activity. Sunspot numbers are used to represent the strength of solar activity, and Pearson correlation analysis and significance analysis are employed to discuss the response of gravity wave disturbances at different spectral bands and altitude layers to medium and long-term variations in solar activity. We used methods such as zonal averaging and seasonal averaging to mitigate the variations in gravity wave intensity caused by short-term solar eruptive activities (e.g., flares, coronal mass ejections) leading to geomagnetic storms, and short-term intense atmospheric activities such as typhoons and severe convective weather. This allows the results to better reflect the trend of gravity wave responses to the 11-year solar activity cycle. Although only nine years of observation data were used, not covering the entire solar activity cycle, it still provides a reasonable reflection of the response of gravity wave disturbance intensity to the 11-year solar activity cycle. The Pearson correlation coefficients and significance levels (p-values) obtained from the analysis of Figure 1, Figure 2, Figure 3, Figure 4, Figure 5, Figure 6, Figure 7, Figure 8 and Figure 9 are organized into three lists below, with correlation coefficients having significance levels below 0.01 highlighted in red.
Previous studies based on observations from individual stations or satellites have shown that GW activity and long-term solar activity changes are sometimes positively correlated and sometimes negatively correlated; these long-term changes have also been attributed to changes in local meteorological conditions [9,10,11,13,15]. This study finds that the positive or negative correlation between GW activity and long-term solar activity changes is related to the latitude of individual stations (or latitude bands in satellite observations) and the lag time. Ern et al. (2011) analyzed GW amplitude and momentum flux at 30 km between 30°N and 30°S and the 10.7 cm solar flux, indicating a negative correlation between the 11-year solar cycle and GW activity [15]. Gavrilov et al. (1995) used data from a medium-frequency radar in the mid-latitude region (52°N, 107°W) and also found a negative correlation between gravity waves and the 11-year solar activity cycle [9]. Liu et al. (2017) further used satellite data to point out that the potential energy of gravity waves in low and mid-latitude regions is negatively correlated with solar activity [13]. This does not contradict the positive correlation between gravity waves and solar activity mentioned in this paper. As shown by the correlation coefficients in Table 1, Table 2 and Table 3 for the equatorial and mid-latitude regions, the majority of the non-lagged correlation coefficients of the zonally averaged gravity wave values are negative, which is consistent with previous studies. Additionally, the zonally averaged gravity wave values, compared to single-station gravity wave disturbance values, better reflect the overall conditions of the latitude band. When there is a lag of one or two years, the correlation coefficients become positive, and the confidence levels increase significantly. Furthermore, the significance analysis shows that the p-value for a 2-year lag is significantly lower than the p-value for no lag, indicating that the credibility of the gravity waves’ response to solar activity in the equatorial and mid-latitude regions is higher when considering a 2-year lag.

Table 1.
Correlation between short-wavelength (2–12 km) gravity wave intensity and solar activity.
Table 2.
Correlation between long-wavelength (12–20 km) gravity wave intensity and solar activity.
Table 3.
Correlation between full-wavelength (2–20 km) gravity wave intensity and solar activity.
The correlation between GW and solar activity may depend on GW sources (e.g., topography, convection) and gravity wave propagation conditions at different latitudes [10,13]. Parameters affecting gravity wave propagation, such as zonal wind speed and atmospheric temperature, respond differently to the solar activity cycle depending on latitude [36]. Additionally, Liu et al. (2017) pointed out that the response of gravity wave potential energy to solar activity depends on latitude and height, and exhibits hemispherical asymmetry. The delayed response of gravity waves to the 11-year solar cycle in equatorial and mid-latitude regions is believed to be due to the delayed effects of solar activity on some fundamental atmospheric parameters and activities, such as convective activity and ocean temperatures. Deep convection, such as thunderstorms, mesoscale convective complexes, and mesoscale convective systems, are considered major sources of gravity waves [37]. Xiao et al. (2016) pointed out that there is a significant lagged correlation (1–2 years) between outgoing longwave radiation (OLR), which characterizes convective activity over the tropical western Pacific, and the F10.7 index [34]. White et al. (1997) also pointed out that the highest correlation between solar activity levels and ocean temperatures lags solar activity by 1–2 years, which is the timescale for the upper ocean to reach radiative equilibrium after being disturbed by solar total irradiance [35]. Huo et al. (2023) similarly noted that the decadal oscillation of the tropical Pacific climate system has the highest correlation with the 11-year solar cycle, lagging solar activity by 1–2 years [38]. It is precisely these delayed responses of atmospheric activities and parameters to solar activity that result in the delayed response of gravity waves to solar activity. However, this paper only analyzes the overall response of gravity waves without analyzing gravity waves from different excitation sources, which will be further investigated in future work.
Through a comprehensive analysis of Figure 1, Figure 2, Figure 3, Figure 4, Figure 5, Figure 6, Figure 7, Figure 8 and Figure 9 and Table 1, Table 2 and Table 3, the following conclusions can be drawn:
- In terms of gravity wave intensity, the disturbance intensity of gravity waves is strongest in the equatorial region, followed by the mid-latitude region, and weakest in the high-latitude region; there are significant interannual variations in gravity wave disturbances in high-latitude and mid-latitude regions, while the interannual variations in the equatorial region are not significant;
- Compared to long-wave gravity waves, short-wave gravity waves exhibit a more pronounced response to solar activity, and the correlation increases with increasing lag time, which may be due to the characteristics of short-wave gravity waves or the predominance of short waves in the gravity waves detected by GNOSE;
- For high-latitude regions, gravity wave disturbances are more sensitive to changes in solar activity than in other regions, and the response is more rapid; the response of gravity wave disturbance intensity in the high-latitude region of the Southern Hemisphere to changes in solar activity in the current year is higher than that in the high-latitude region of the Northern Hemisphere; the correlation between gravity wave intensity and changes in solar activity in high-latitude regions also varies with altitude, with higher altitudes exhibiting a stronger correlation;
- For mid-latitude and equatorial regions, there is a delay in response to changes in solar activity, with the correlation gradually increasing with the lagging years, reaching a very strong level after a lag of 2 years; the correlation between gravity wave disturbance intensity and solar activity is generally higher in the mid-latitude region of the Southern Hemisphere than in the Northern Hemisphere, which may be due to the stronger influence of terrain and convection on gravity waves in the Northern Hemisphere; the response of short-wave gravity wave intensity to changes in solar activity at lag times of 1 and 2 years is higher than that of long-wave gravity waves in mid-latitude and equatorial regions; the correlation between full-wavelength (2–20 km) gravity wave intensity and solar activity with a lag of 2 years is negatively correlated with altitude, with higher altitudes exhibiting weaker correlation, while the correlation with a lag of 1 year is the opposite.
Author Contributions
Conceptualization, C.W., X.Z. and J.Y.; methodology, C.W. and W.G.; software, C.W. and Q.M.; validation, F.H.; formal analysis, F.H.; investigation, C.W. and J.Y.; resources, X.Z. and J.Y.; data curation, Q.M.; writing—original draft preparation, C.W.; writing—review and editing, C.W. and X.Z.; visualization, C.W.; supervision, X.Z. and J.Y.; project administration, X.Z. and J.Y.; funding acquisition, X.Z. All authors have read and agreed to the published version of the manuscript.
Funding
This research was funded by the National Key R&D Program of China (2021YFA0718600) and the National Natural Science Foundation of China (41931073, 42222408, 12241101, 42174192). We acknowledge the support from the China Meteorological Administration’s ‘Ionospheric Weather Forecast and Early Warning’ Youth Innovation Team (CMA2024QN09).
Data Availability Statement
The data used in this research can be found at http://satellite.nsmc.org.cn and http://www.sidc.be/silso/home (accessed on 1 July 2024).
Conflicts of Interest
The authors declare no conflicts of interest.
References
- Allen, S.J.; Vincent, R.A. Gravity wave activity in the lower atmosphere: Seasonal and latitudinal variations. J. Geophys. Res. Atmos. 1995, 100, 1327–1350. [Google Scholar] [CrossRef]
- Daren, L.; Chen, Z.; Guo, X.; Tian, W. Recent progress in near space atmospheric environment study. Adv. Mech. 2009, 39, 674–682. [Google Scholar]
- Fritts, D.C.; Alexander, M.J. Gravity wave dynamics and effects in the middle atmosphere. Rev. Geophys. 2003, 41, 1003. [Google Scholar] [CrossRef]
- Wang, C.; Yang, J.; Cheng, X.; Guo, W.; Li, J.; Yang, G.; Zhang, X.; Yang, Z.; Hu, X.; Gu, S.; et al. Investigation of the Global Gravity Wave Activity Characteristics from the FY-3C Satellite Observation Data. Chin. J. Space Sci. 2023, 43, 260. [Google Scholar] [CrossRef]
- Singer, W.; Hoffmann, P.; Kishore Kumar, G.; Mitchell, N.J.; Matthias, V. Atmospheric coupling by gravity waves: Climatology of gravity wave activity, mesospheric turbulence and their relations to solar activity. In Climate and Weather of the Sun-Earth System (CAWSES); Springer: Dordrecht, The Netherlands, 2013; pp. 409–427. [Google Scholar]
- Nastrom, G.D.; Fritts, D.C. Sources of mesoscale variability of gravity waves. Part I: Topographic excitation. J. Atmos. Sci. 1992, 49, 101–110. [Google Scholar] [CrossRef]
- Vincent, R.A.; Joan, A.M. Gravity waves in the tropical lower stratosphere: An observational study of seasonal and interannual variability. J. Geophys. Res. Atmos. 2000, 105, 17971–17982. [Google Scholar] [CrossRef]
- Fritts, D.C.; Nastrom, G.D. Sources of mesoscale variability of gravity waves. Part II: Frontal, convective, and jet stream excitation. J. Atmos. Sci. 1992, 49, 111–127. [Google Scholar] [CrossRef]
- Gavrilov, N.M.; Manson, A.H.; Meek, C.E. Climatological monthly characteristics of middle atmosphere gravity waves (10 min–10 h) during 1979–1993 at Saskatoon. Ann. Geophys. 1995, 13, 285. [Google Scholar]
- Gavrilov, N.M.; Fukao, S.; Nakamura, T.; Jacobi, C.; Kürschner, D.; Manson, A.H.; Meek, C.E. Comparative study of interannual changes of the mean winds and gravity wave activity in the middle atmosphere over Japan, Central Europe and Canada. J. Atmos. Sol.-Terr. Phys. 2002, 64, 1003–1010. [Google Scholar] [CrossRef]
- Jacobi, C.; Gavrilov, N.M.; Kürschner, D.; Fröhlich, K. Gravity wave climatology and trends in the mesosphere/lower thermosphere region deduced from low-frequency drift measurements 1984–2003 (52.1 N, 13.2 E). J. Atmos. Sol.-Terr. Phys. 2006, 68, 1913–1923. [Google Scholar] [CrossRef]
- Li, T.; Leblanc, T.; McDermid, I.S.; Wu, D.L.; Dou, X.; Wang, S. Seasonal and interannual variability of gravity wave activity revealed by long-term lidar observations over Mauna Loa Observatory, Hawaii. J. Geophys. Res. Atmos. 2010, 115, D13103. [Google Scholar] [CrossRef]
- Liu, X.; Yue, J.; Xu, J.; Garcia, R.R.; Russell, J.M.; Mlynczak, M.; Wu, D.L.; Nakamura, T. Variations of global gravity waves derived from 14 years of SABER temperature observations. J. Geophys. Res. Atmos. 2017, 122, 6231–6249. [Google Scholar] [CrossRef]
- Gavrilov, N.M.; Riggin, D.M.; Fritts, D.C. Interannual variations of the mean wind and gravity wave variances in the middle atmosphere over Hawaii. J. Atmos. Sol.-Terr. Phys. 2004, 66, 637–645. [Google Scholar] [CrossRef]
- Ern, M.; Preusse, P.; Gille, J.C.; Hepplewhite, C.L.; Mlynczak, M.G.; Russell, J.M., III; Riese, M. Implications for atmospheric dynamics derived from global observations of gravity wave momentum flux in stratosphere and mesosphere. J. Geophys. Res. Atmos. 2011, 116, D19107. [Google Scholar] [CrossRef]
- Zhang, Y.; Xiong, J.; Liu, L.; Wan, W. A global morphology of gravity wave activity in the stratosphere revealed by the 8-year SABER/TIMED data. J. Geophys. Res. Atmos. 2012, 117, D21101. [Google Scholar] [CrossRef]
- Vadas, S.L.; Fritts, D.C. Influence of solar variability on gravity wave structure and dissipation in the thermosphere from tropospheric convection. J. Geophys. Res. Space Phys. 2006, 111, A10S12. [Google Scholar] [CrossRef]
- Yiğit, E.; Medvedev, A.S. Internal gravity waves in the thermosphere during low and high solar activity: Simulation study. J. Geophys. Res. Space Phys. 2010, 115, A00G02. [Google Scholar] [CrossRef]
- Mandal, S.; Pallamraju, D.; Suryawanshi, P. Changes in the daytime thermospheric gravity wave propagation characteristics over low-latitudes in response to the variation in solar flux. J. Atmos. Sol.-Terr. Phys. 2020, 209, 105414. [Google Scholar] [CrossRef]
- Haigh, J.D. The impact of solar variability on climate. Science 1996, 272, 981–984. [Google Scholar] [CrossRef]
- Tinsley, B.A. Correlations of atmospheric dynamics with solar wind-induced changes of air-Earth current density into cloud tops. J. Geophys. Res. Atmos. 1996, 101, 29701–29714. [Google Scholar] [CrossRef]
- Zhao, X.H.; Feng, X.S. Periodicities of solar activity and the surface temperature variation of the Earth and their correlations. Chin. Sci. Bull. 2014, 59, 1284–1292. [Google Scholar]
- Huth, R.; Bochníček, J.; Hejda, P. The 11-year solar cycle affects the intensity and annularity of the Arctic Oscillation. J. Atmos. Sol.-Terr. Phys. 2007, 69, 1095–1109. [Google Scholar] [CrossRef]
- Xiao, Z.; Yin, Z.; Liu, S.; Song, Y. Impacting of Solar Activity and Earth Movement Factors on Climate, 1st ed.; China Science Publishing & Media Ltd.: Beijing, China, 2023. [Google Scholar]
- Alexander, S.P.; Tsuda, T.; Kawatani, Y. COSMIC GPS observations of Northern Hemisphere winter stratospheric gravity waves and comparisons with an atmospheric general circulation model. Geophys. Res. Lett. 2008, 35, L10808. [Google Scholar] [CrossRef]
- John, S.R.; Kumar, K.K. A discussion on the methods of extracting gravity wave perturbations from space-based measurements. Geophys. Res. Lett. 2013, 40, 2406–2410. [Google Scholar] [CrossRef]
- Sun, Y.; Bai, W.; Liu, C.; Liu, Y.; Du, Q.; Wang, X.; Yang, G.; Liao, M.; Yang, Z.; Zhang, X.; et al. The FengYun-3C radio occultation sounder GNOS: A review of the mission and its early results and science applications. Atmos. Meas. Tech. 2018, 11, 5797–5811. [Google Scholar] [CrossRef]
- Liao, M.; Zhang, P.; Yang, G.-L.; Bi, Y.-M.; Liu, Y.; Bai, W.; Meng, X.; Du, Q.-F.; Sun, Y.-Q. Preliminary validation of the refractivity from the new radio occultation sounder GNOS/FY-3C. Atmos. Meas. Tech. 2016, 9, 781–792. [Google Scholar] [CrossRef]
- Liu, Z.Y.; Sun, Y.Q.; Bai, W.H.; Xia, J.M.; Tan, G.Y.; Cheng, C.; Du, Q.F.; Wang, X.Y.; Zhao, D.Y.; Tian, Y.S.; et al. Validation of Preliminary Results of Thermal Tropopause Derived from FY-3C GNOS Data. Remote. Sens. 2019, 11, 1139. [Google Scholar] [CrossRef]
- Balogh, A.; Hudson, H.S.; Petrovay, K.; von Steiger, R. Introduction to the Solar Activity Cycle: Overview of Causes and Consequences. Space Sci. Rev. 2014, 186, 1–15. [Google Scholar] [CrossRef]
- Lindzen, R.S. Turbulence and stress owing to gravity wave and tidal breakdown. J. Geophys. Res. Ocean. 1981, 86, 9707–9714. [Google Scholar] [CrossRef]
- Alexander, M.J.; Gille, J.; Cavanaugh, C.; Coffey, M.; Craig, C.; Eden, T.; Francis, G.; Halvorson, C.; Hannigan, J.; Khosravi, R.; et al. Global estimates of gravity wave momentum flux from High Resolution Dynamics Limb Sounder observations. J. Geophys. Res. Atmos. 2008, 113, D15S18. [Google Scholar] [CrossRef]
- Wu, D.L.; Eckermann, S.D. Global Gravity Wave Variances from Aura MLS: Characteristics and Interpretation. J. Atmos. Sci. 2008, 65, 3695–3718. [Google Scholar] [CrossRef]
- Xiao, Z.; Liao, Y.; Li, C. Possible impact of solar activity on the convection dipole over the tropical pacific ocean. J. Atmos. Sol.-Terr. Phys. 2016, 140, 94–107. [Google Scholar] [CrossRef]
- White, W.B.; Lean, J.; Cayan, D.R.; Dettinger, M.D. Response of global upper ocean temperature to changing solar irradiance. J. Geophys. Res. Oceans 1997, 102, 3255–3266. [Google Scholar] [CrossRef]
- Krivolutsky, A.A.; Cherepanova, L.A.; Dement’eva, A.V. Solar cycle influence on troposphere and middle atmosphere via ozone layer in the presence of planetary waves: Simulation with ARM. J. Geophys. Res. Space Phys. 2015, 120, 8298–8306. [Google Scholar] [CrossRef]
- Shi, G.; Hu, X.; Yao, Z.; Guo, W.; Sun, M.; Gong, X. Case study on stratospheric and mesospheric concentric gravity waves generated by deep convection. Earth Planet. Phys. 2021, 5, 79–89. [Google Scholar] [CrossRef]
- Huo, W.; Xiao, Z.; Zhao, L. Phase-locked impact of the 11-year solar cycle on tropical pacific decadal variability. J. Clim. 2023, 36, 421–439. [Google Scholar] [CrossRef]

Disclaimer/Publisher’s Note: The statements, opinions and data contained in all publications are solely those of the individual author(s) and contributor(s) and not of MDPI and/or the editor(s). MDPI and/or the editor(s) disclaim responsibility for any injury to people or property resulting from any ideas, methods, instructions or products referred to in the content. |
© 2024 by the authors. Licensee MDPI, Basel, Switzerland. This article is an open access article distributed under the terms and conditions of the Creative Commons Attribution (CC BY) license (https://creativecommons.org/licenses/by/4.0/).