Article

GLFuse: A Global and Local Four-Branch Feature Extraction Network for Infrared and Visible Image Fusion

1
School of Computer Science and Technology, Guangdong University of Technology, Guangzhou 510006, China
2
School of Integrated Circuits, Guangdong University of Technology, Guangzhou 510006, China
3
School of Automation, Guangdong University of Technology, Guangzhou 510006, China
*
Author to whom correspondence should be addressed.
Remote Sens. 2024, 16(17), 3246; https://doi.org/10.3390/rs16173246
Submission received: 16 July 2024 / Revised: 17 August 2024 / Accepted: 30 August 2024 / Published: 1 September 2024

Abstract

:
Infrared and visible image fusion integrates complementary information from different modalities into a single image, providing sufficient imaging information for scene interpretation and downstream target recognition tasks. However, existing fusion methods often focus only on highlighting salient targets or preserving scene details, failing to effectively combine entire features from different modalities during the fusion process, resulting in underutilized features and poor overall fusion effects. To address these challenges, a global and local four-branch feature extraction image fusion network (GLFuse) is proposed. On one hand, the Super Token Transformer (STT) block, which is capable of rapidly sampling and predicting super tokens, is utilized to capture global features in the scene. On the other hand, a Detail Extraction Block (DEB) is developed to extract local features in the scene. Additionally, two feature fusion modules, namely the Attention-based Feature Selection Fusion Module (ASFM) and the Dual Attention Fusion Module (DAFM), are designed to facilitate selective fusion of features from different modalities. Of more importance, the various perceptual information of feature maps learned from different modality images at the different layers of a network is investigated to design a perceptual loss function to better restore scene detail information and highlight salient targets by treating the perceptual information separately. Extensive experiments confirm that GLFuse exhibits excellent performance in both subjective and objective evaluations. It deserves note that GLFuse effectively improves downstream target detection performance on a unified benchmark.

1. Introduction

In multi-modal imaging, achievement of multi-modality image fusion which aims to effectively combine complementary information from different types of sensors remains a significant challenge [1]. Specifically, the integration of infrared and visible image information faces difficulties in simultaneously preserving thermal radiation details and rich textural information due to the inherent differences between these modalities [2]. Infrared images captured by sensors reflect the thermal radiation intensity of objects, providing benefits for monitoring under low-light and unfavorable weather conditions. Despite this, infrared images lack scene detail information. On the other hand, visible images generally provide higher resolution and more intricate textural details [
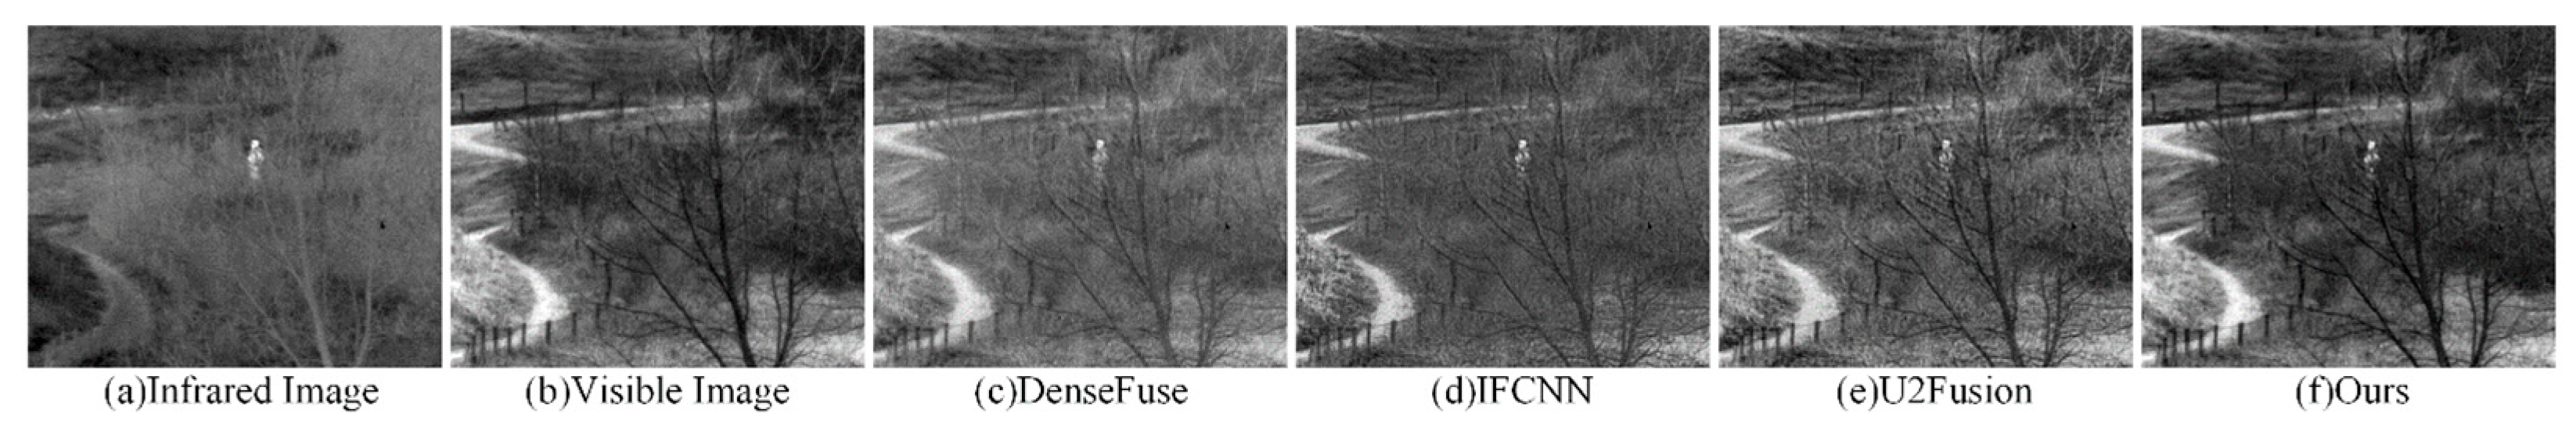
3]. As shown in Figure 1, the fusion process combines the distinct and overlapping information from both types of images to create fused images with enhanced textures and salient targets. This fusion result has various uses in subsequent tasks like multi-modal saliency detection [4], target detection [5], and semantic segmentation [6].
Techniques for fusing infrared and visible images generally fall into two board categories: traditional approaches and deep-learning-based approaches. Traditional approaches often entail measuring activity levels in either the spatial or transform domains, followed by manual fusion using predefined fusion rules [7]. Representative traditional approaches include Multi-scale Transform (MST) [8,9,10], Sparse Representation (SR) [11,12,13], and subspace-based fusion methods [14,15]. While these approaches have been effective in certain situations, their effectiveness may be hindered when dealing with more complex scenes due to their reliance on manually designed rules and limitations in shallow feature learning.
In recent years, deep learning has proven its robust capability in extracting image features and has gained widespread adoption in image fusion. Among these techniques, Convolutional Neural Networks (CNNs) [16,17,18,19] are particularly popular. These approaches efficiently preserve the intricate details of the original images through feature extraction carried out by the convolutional layers. However, CNNs can only extract local information within a relatively small receptive field and struggle to retain the overall semantic information of the scene [20]. To address this, Transformers [21], adept at extracting global features and capturing long-range dependencies between features, have been introduced into the image fusion domain [22,23,24], delivering more pronounced fusion effects. However, fusion methods based on Transformers are not as effective as CNNs in preserving the textural details of the scene. Therefore, fusion frameworks that combine CNNs and Transformers [25,26,27] have been further proposed. These methods not only preserve the detailed features of the scene but also highlight salient targets. Despite the good performance of the aforementioned methods, they still lack effective control over the importance of different features during the fusion process. In fact, there will be feature redundancy in this process, which would limit the further improvement for fusion performance. Moreover, the unique complementary semantic information learning from different modalities would appear at different feature learning stages using same network structure. However, this is rarely discussed in available studies [28]. In addition, the aforementioned methods all overlook the importance of informative input features besides raw image forms in mining local information and their impact on the fusion results [29,30]. To address these challenges, it is essential to develop a fusion framework that not only integrates global and local features from different modalities but also effectively controls the importance of these features during the fusion process.
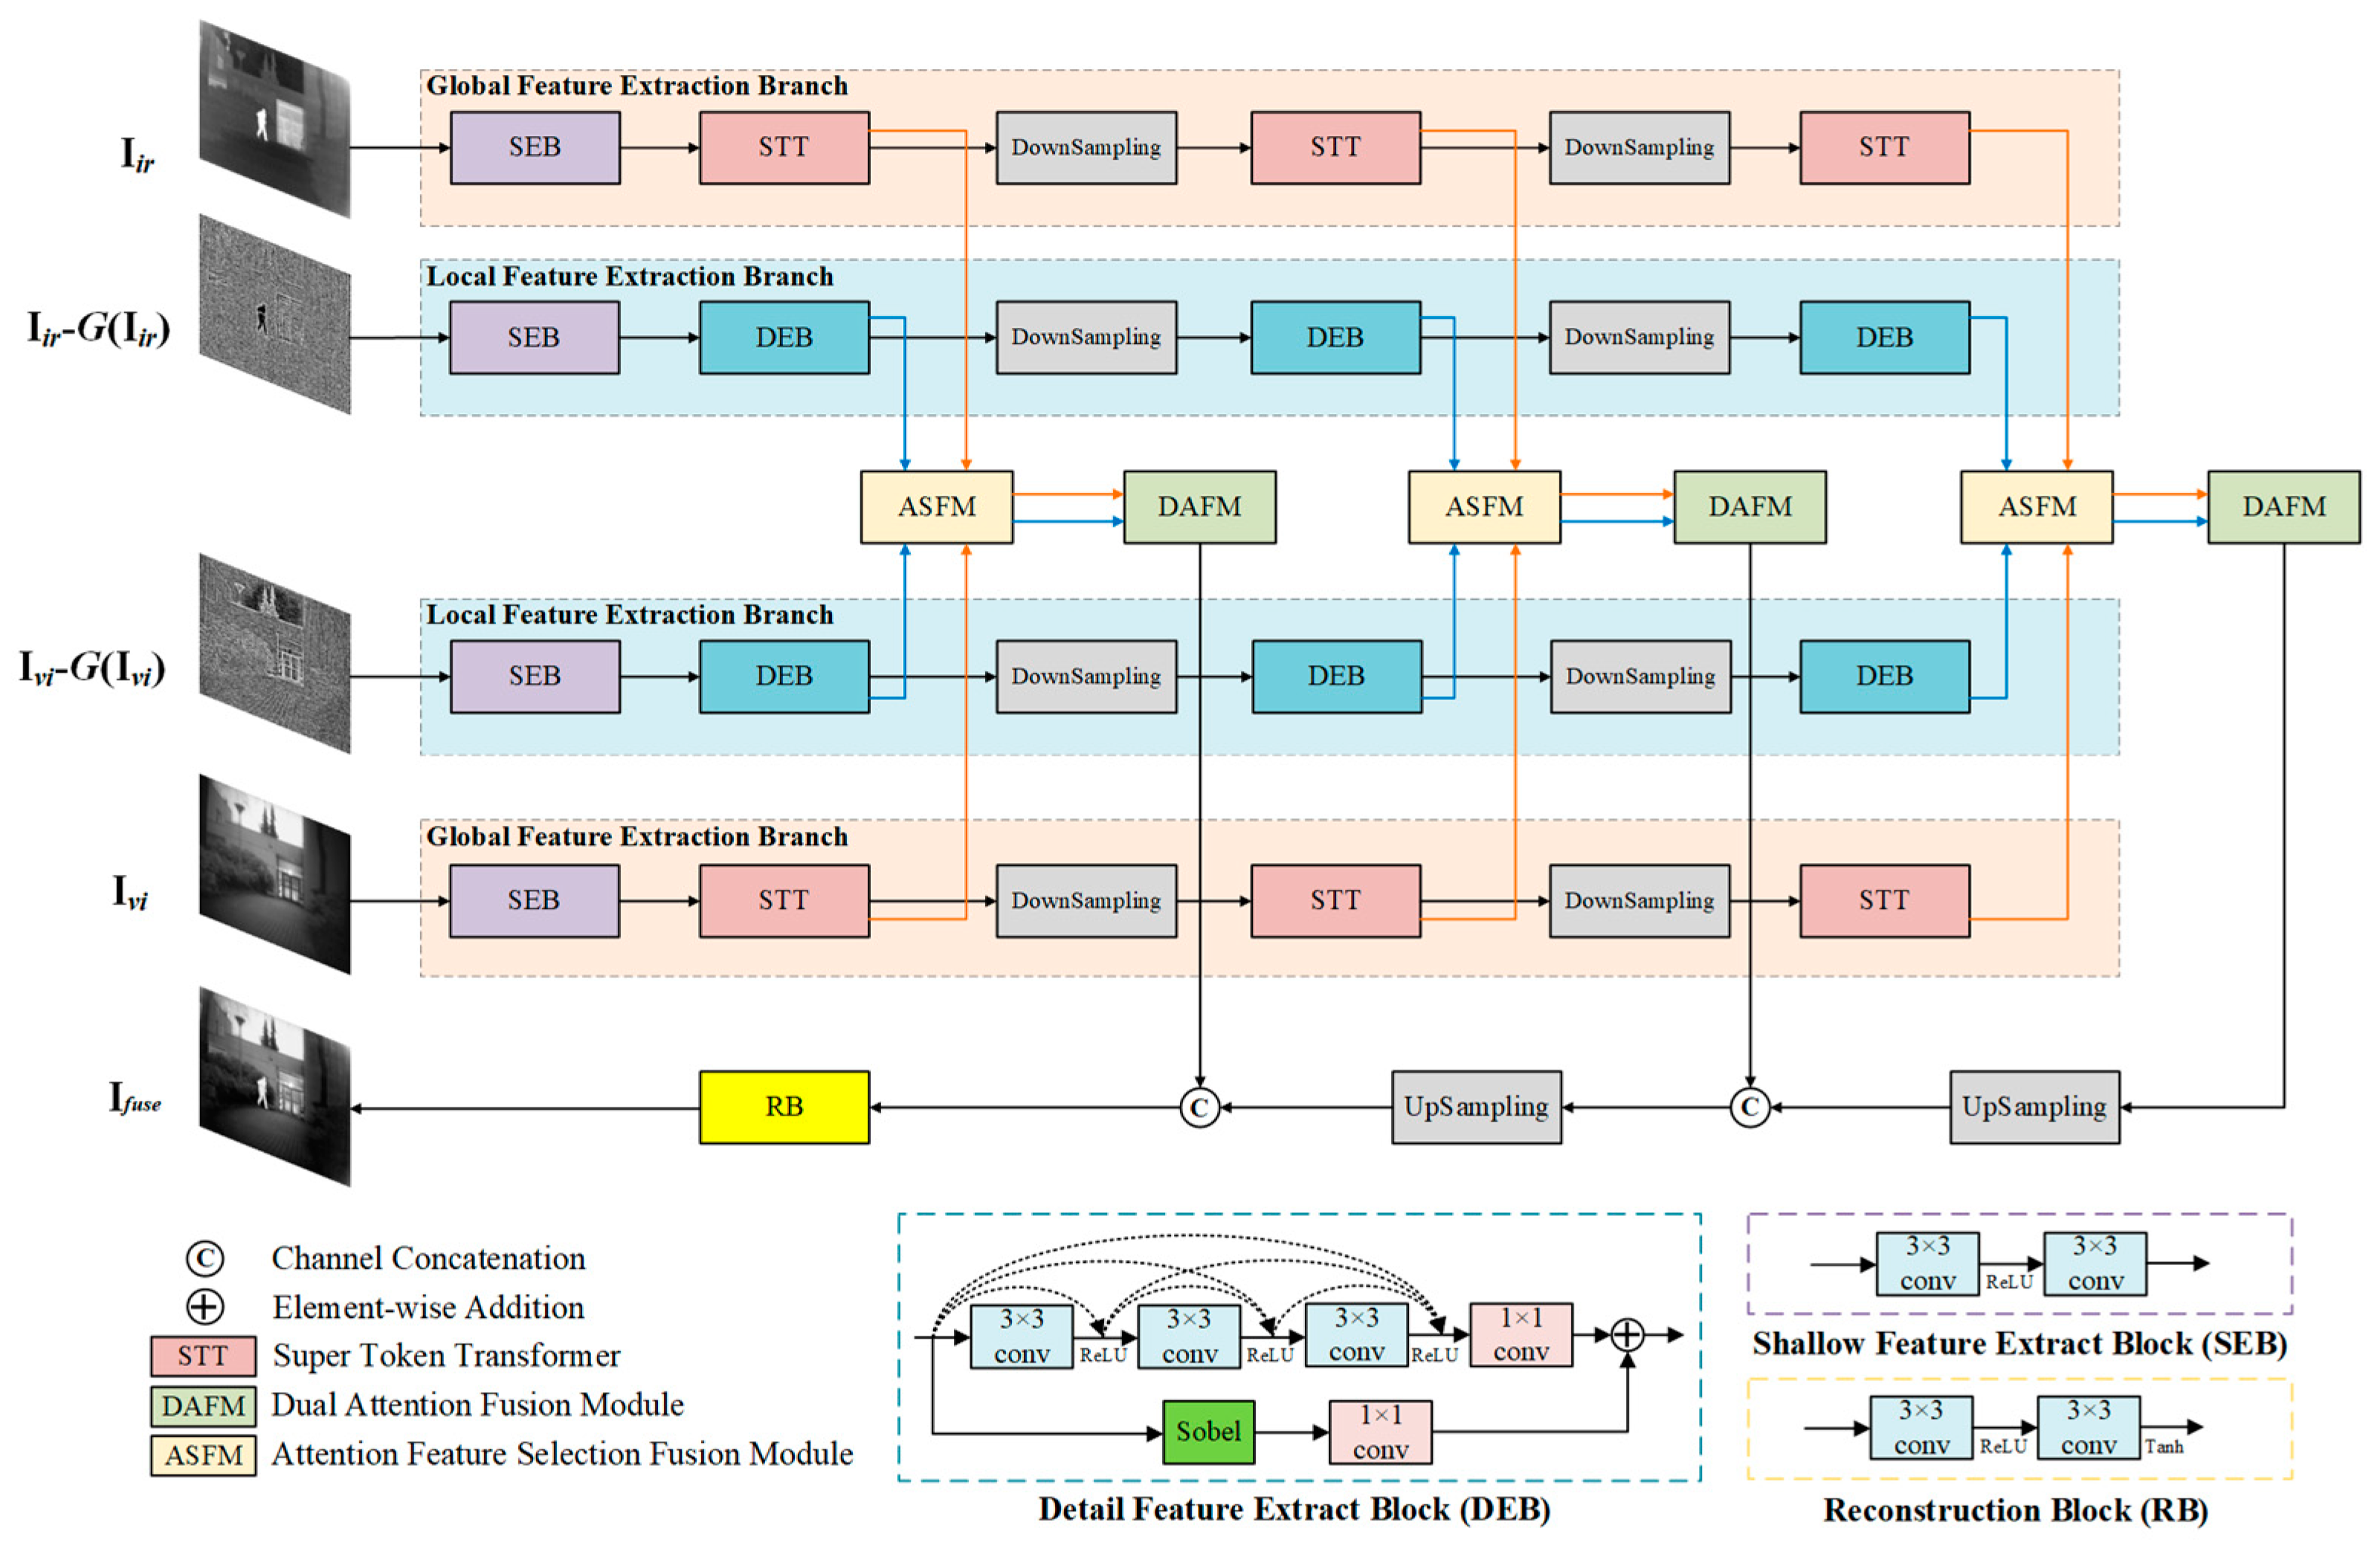
In concern of the aforementioned problems, a novel network architecture for infrared and visible image fusion is designed in this study to improve fusion quality. By incorporating the Transformer-based global feature extraction branches alongside the CNN-based local detail extraction branches, this architecture effectively captures both global and local feature information. Moreover, the Attention-based Feature Selection and Fusion Module (ASFM) and Dual Attention Fusion Module (DAFM) are specifically designed to tackle the issues of feature redundancy and selective feature fusion. These innovations contribute to the creation of more informative and visually coherent fusion images. To summarize, the key contributions of this study are as follows:
  • A four-branch Transformer-CNN network architecture is constructed for infrared and visible image fusion by utilizing multiple types of image inputs. The network is able to achieve end-to-end training and testing. Its architecture takes both original infrared and visible images and their preprocessed feature maps as input to go through global and local feature extraction and fusion to enhance the fusion quality of infrared and visible images.
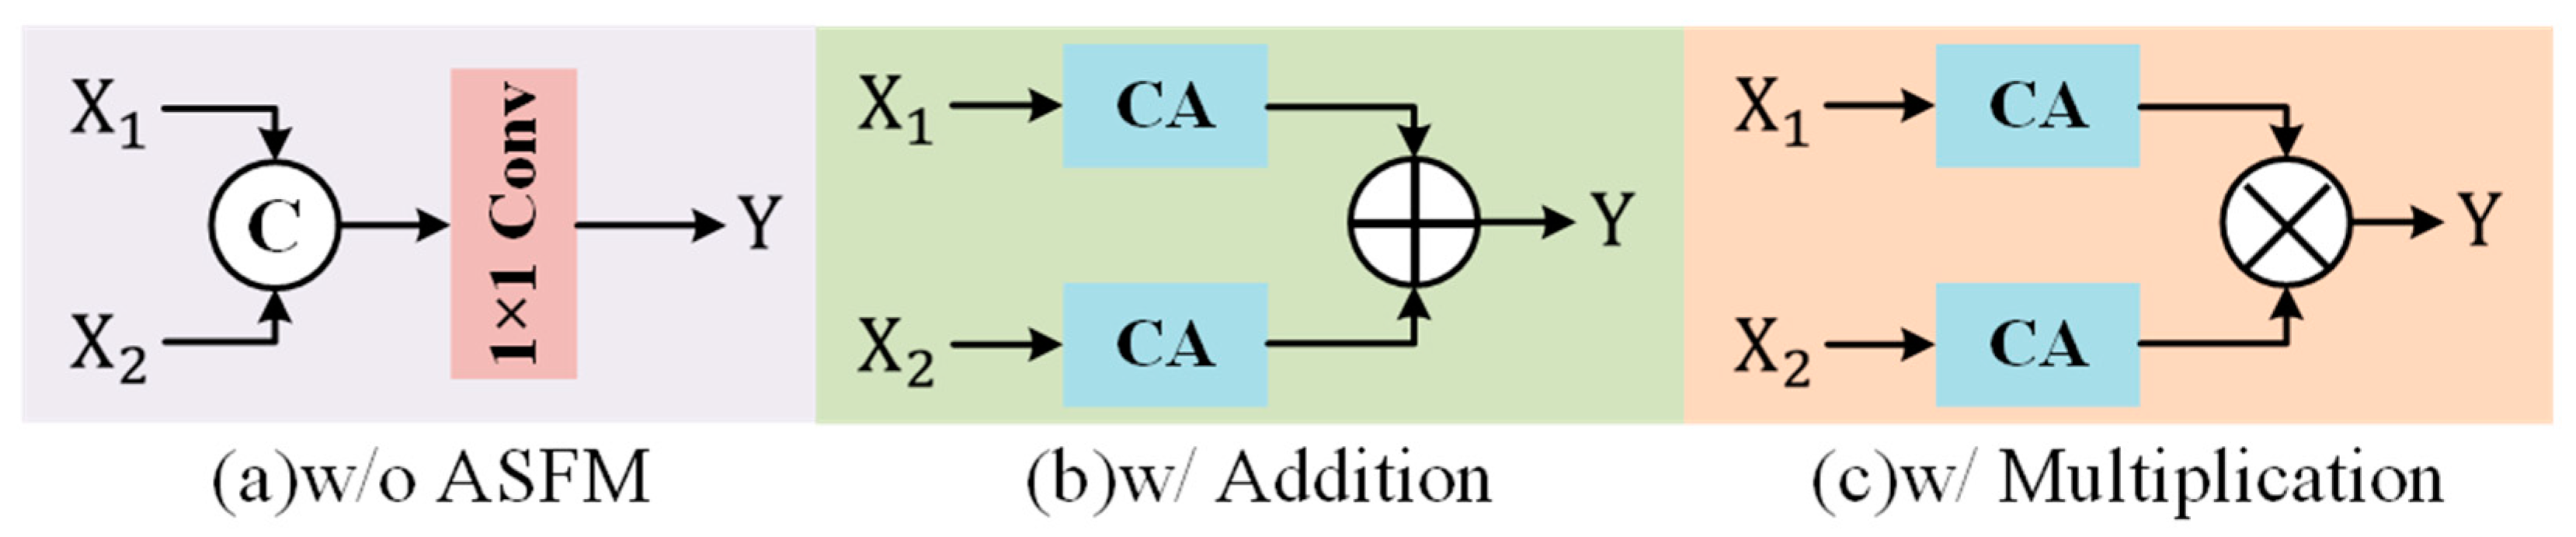
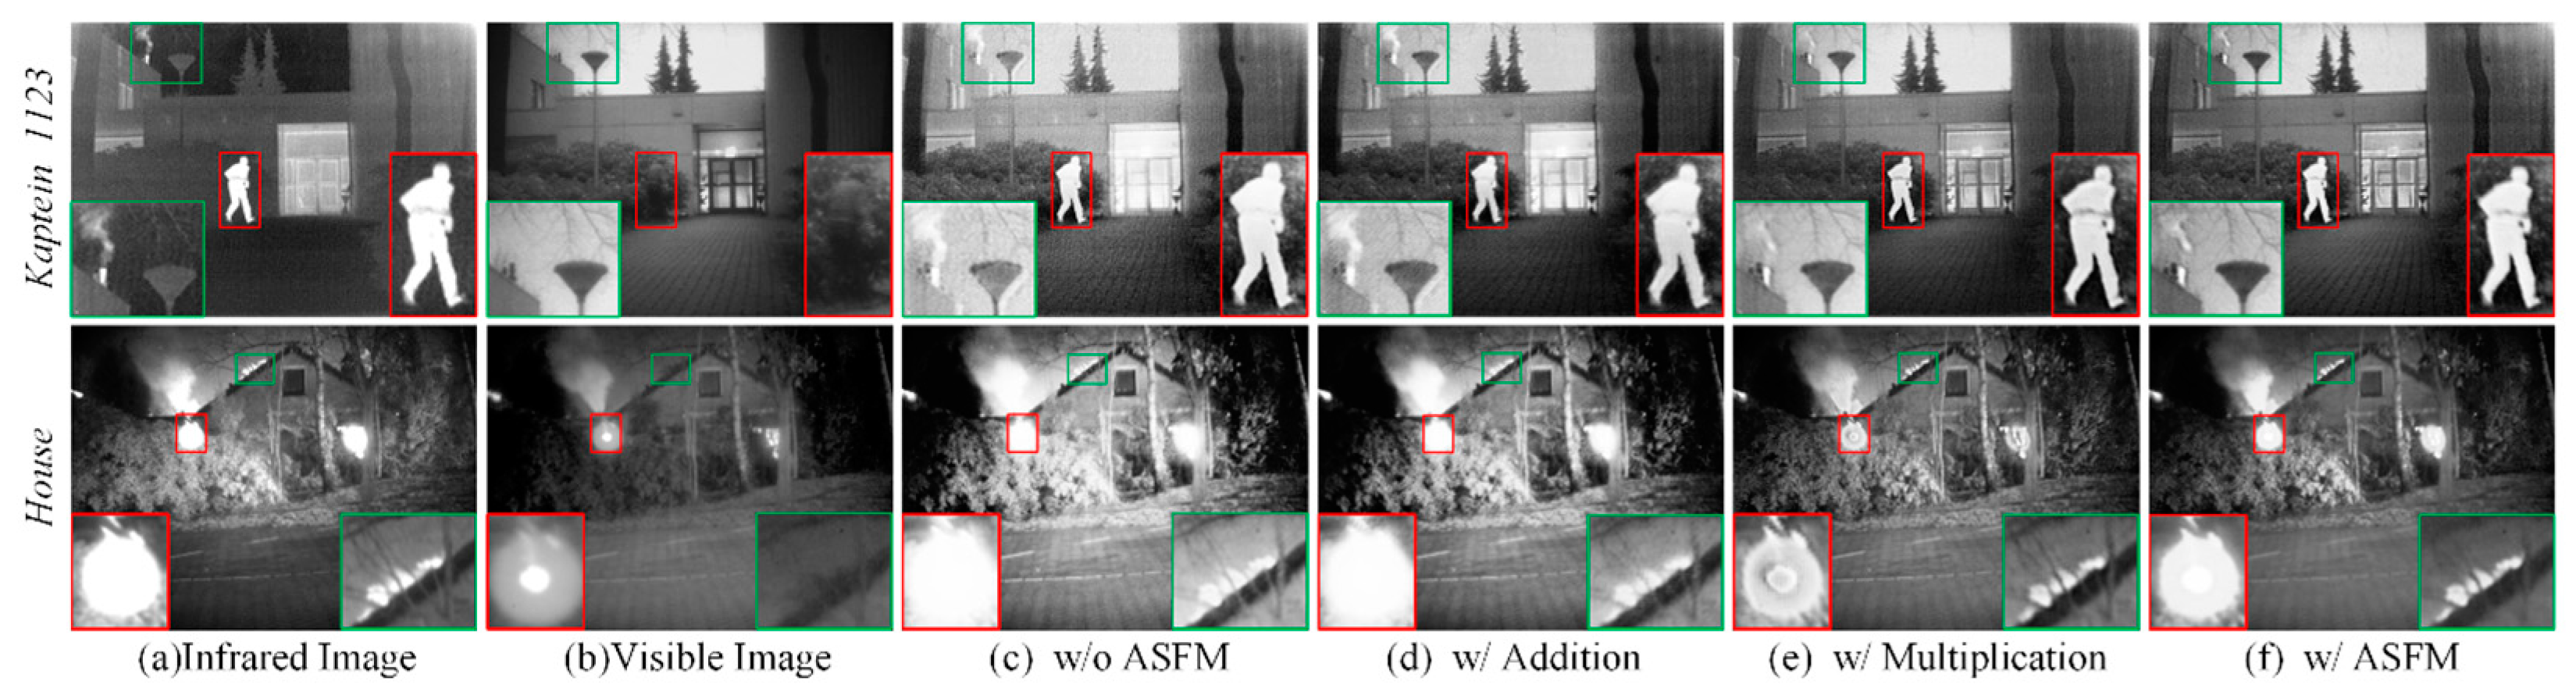
  • An Attention-based Feature Selection and Fusion Module (ASFM) is developed so that both unique and common features from different modalities can be integrated through an addition–multiplication strategy. This approach increases the richness of information in the fused image.
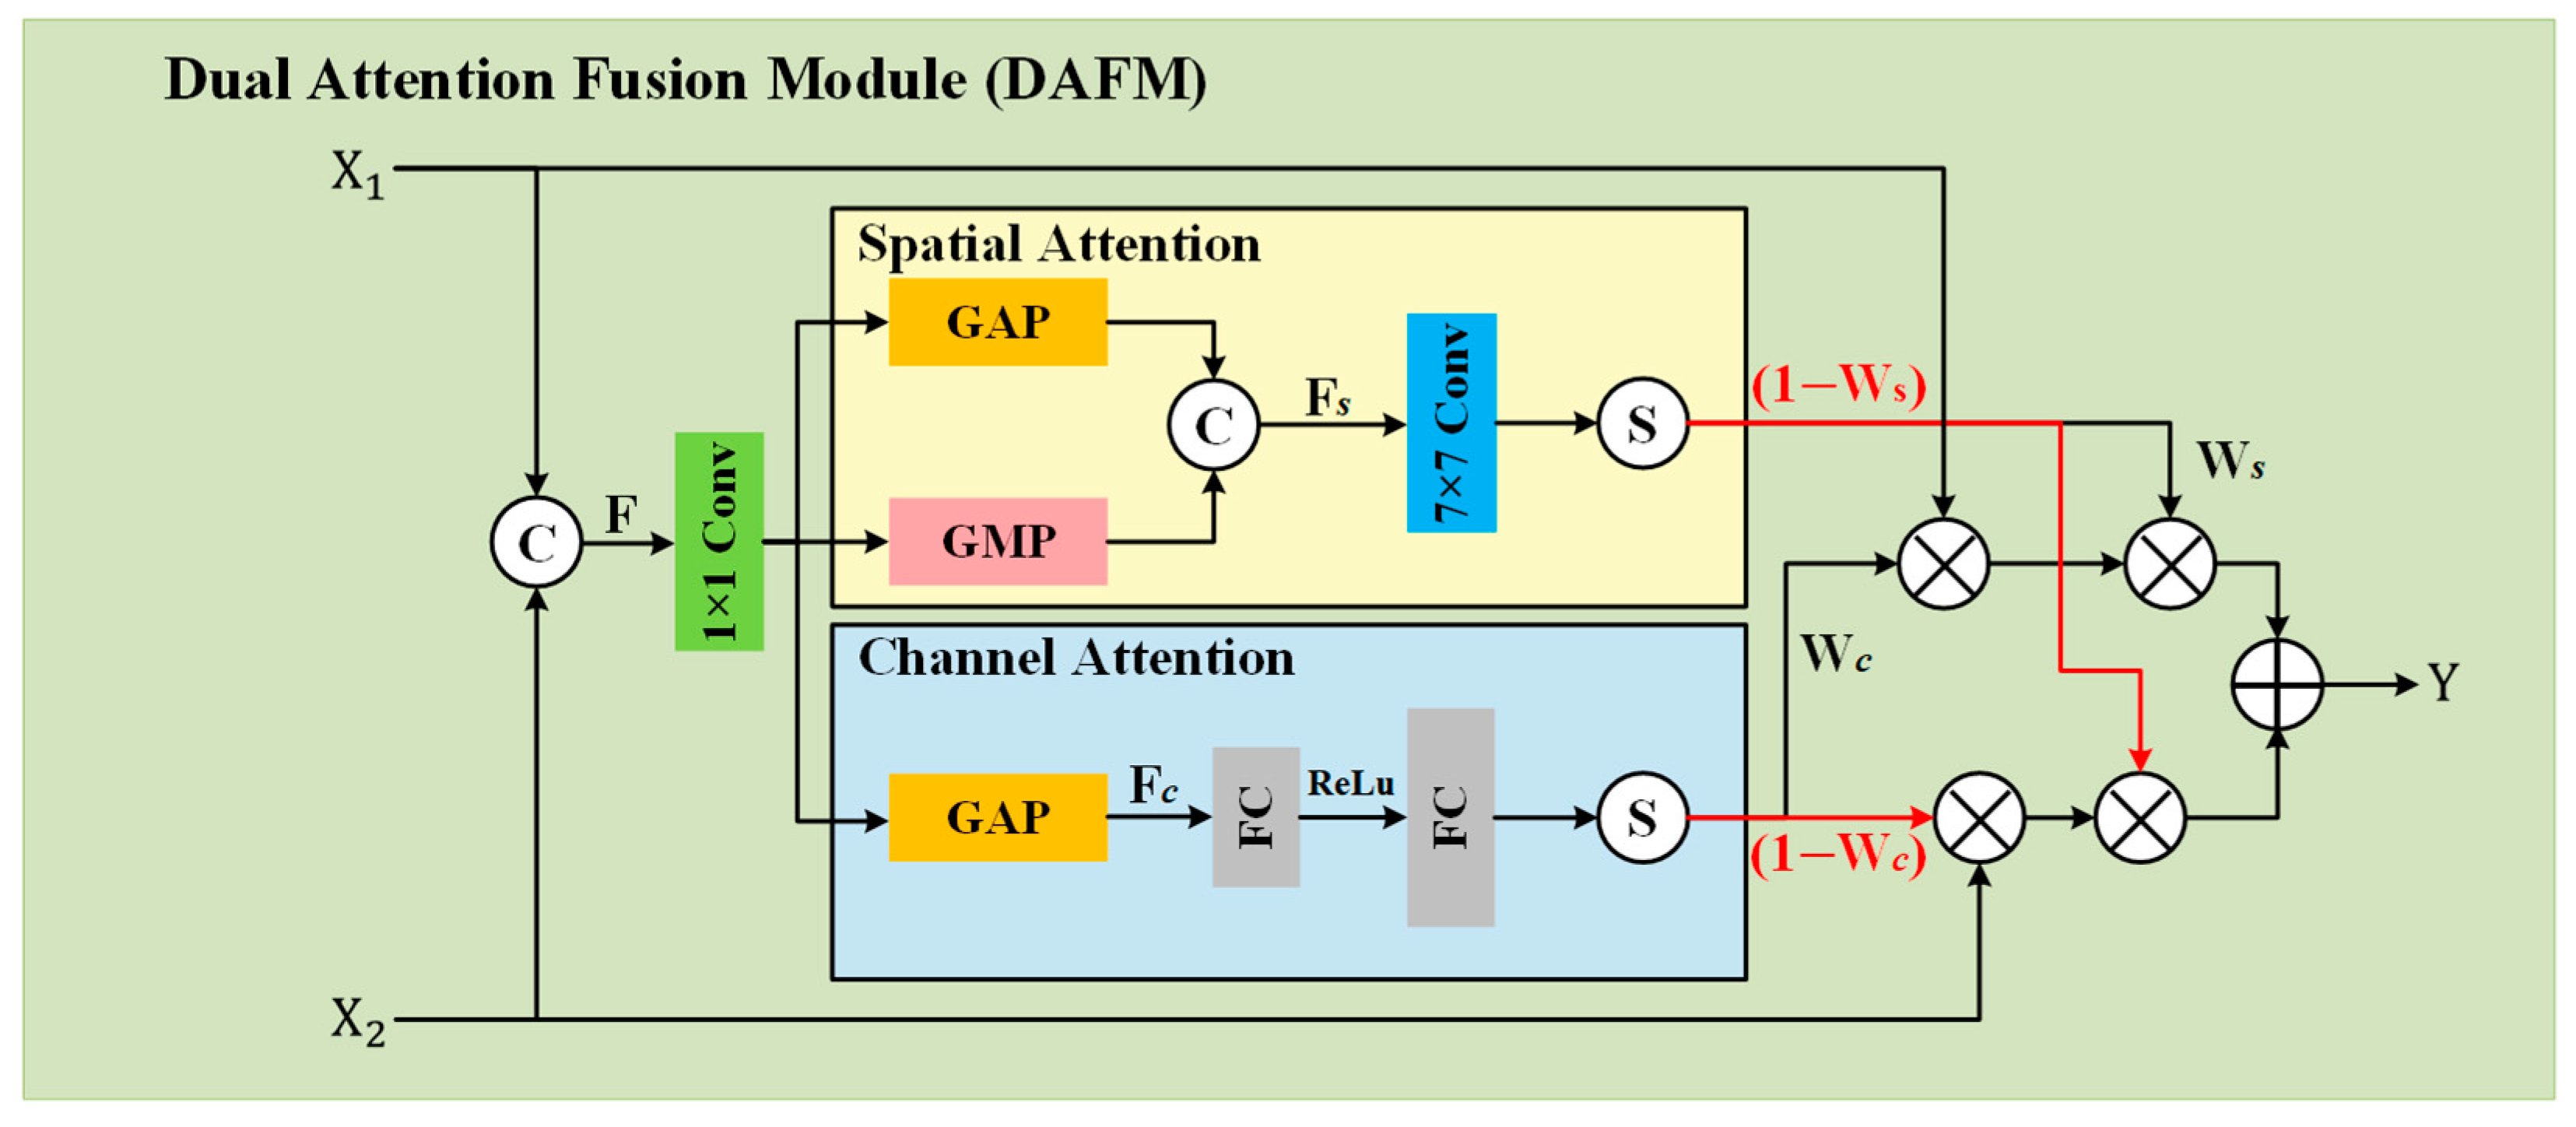
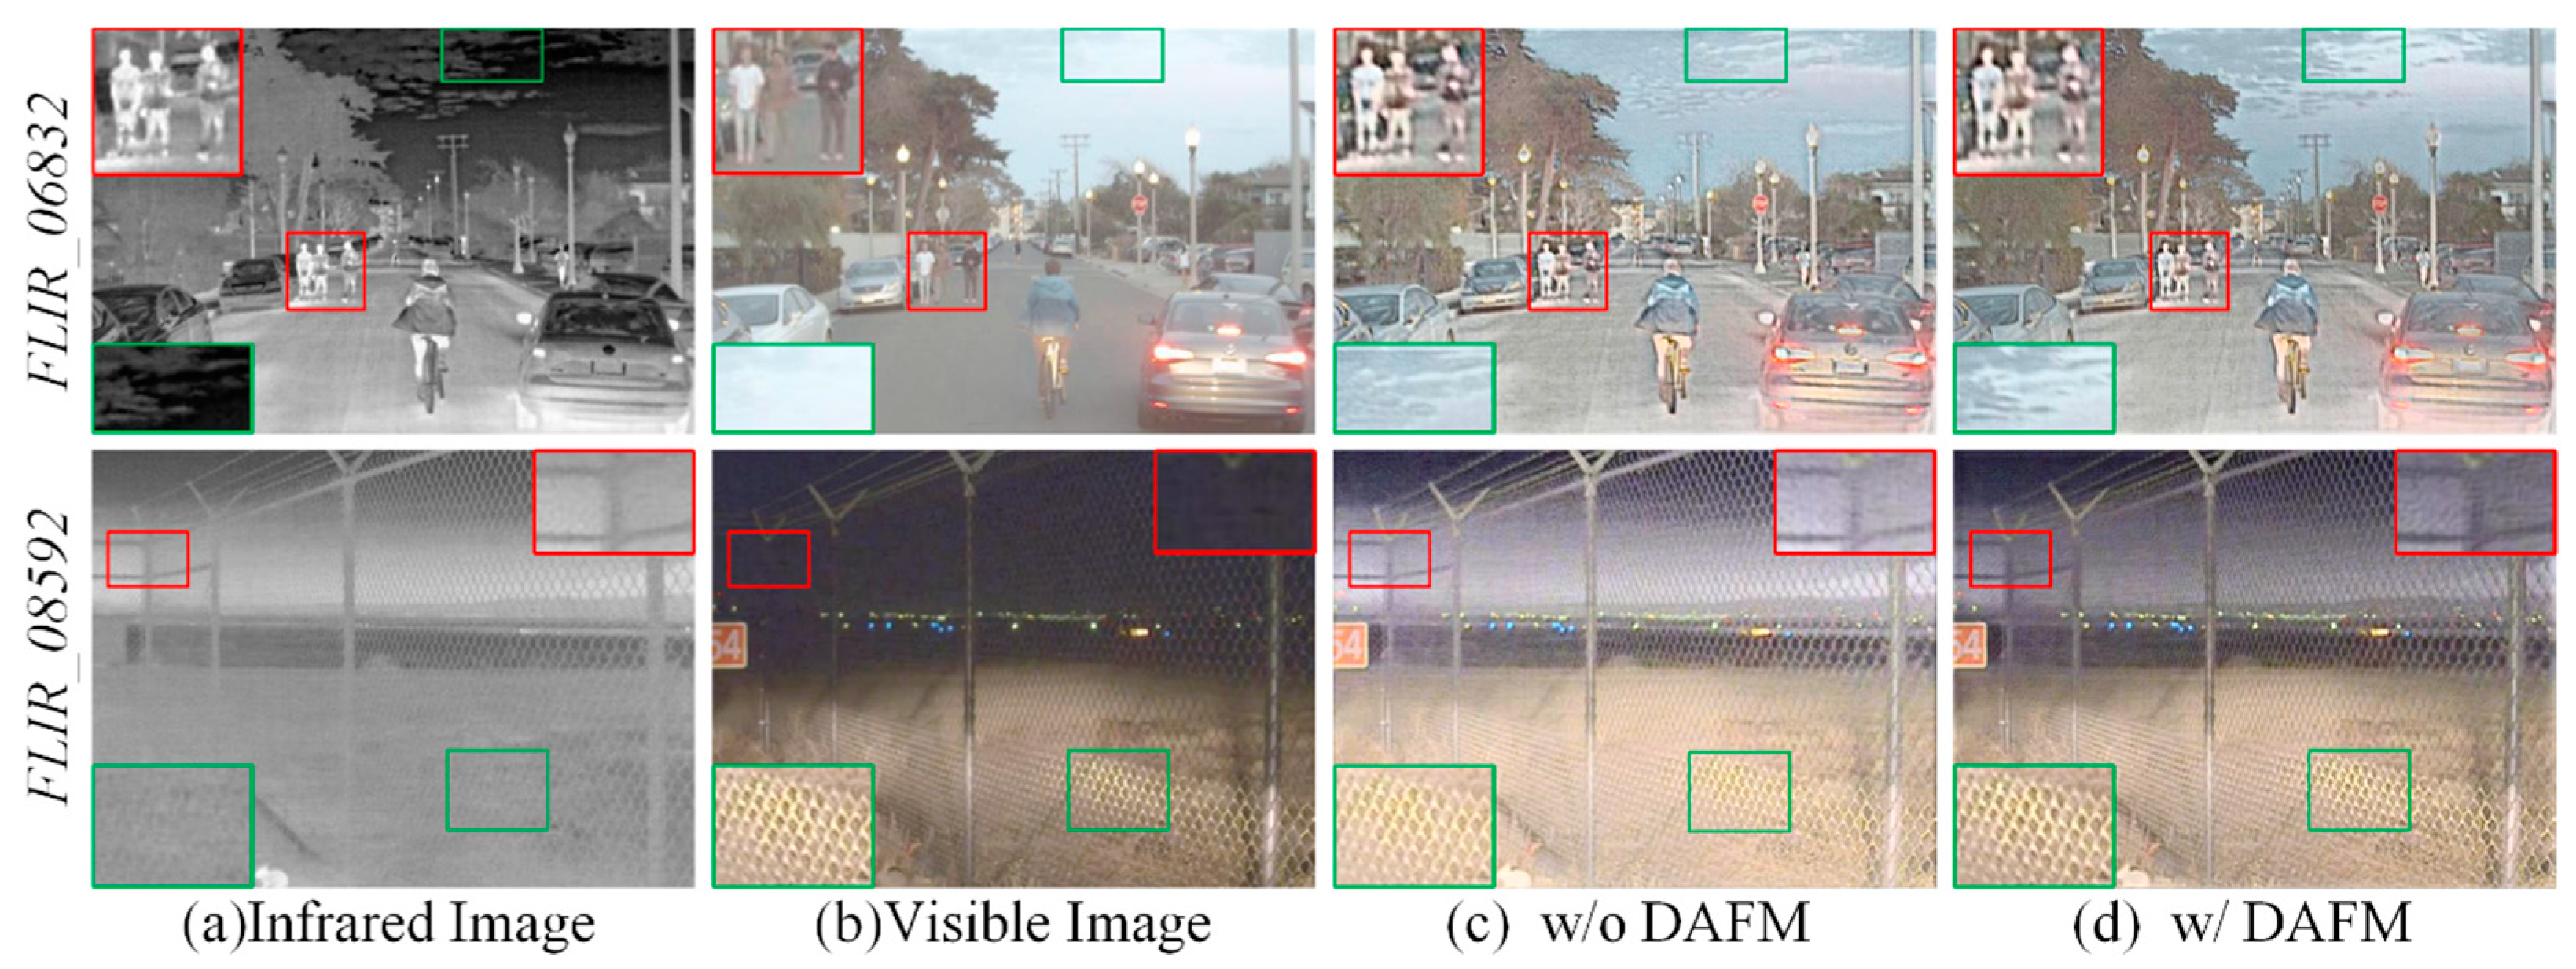
  • A Dual Attention Fusion Module (DAFM) is proposed that employs a combination of channel and spatial attention mechanisms. It enables selectively filtering and fusing global and local features to reduce feature redundancy in the fused image.
A perception loss function is specifically designed for image fusion based on semantic information at different levels from different modalities. This loss function adds constraints based on feature differences in input images from different modalities, leading to fused images that align more closely with human visual perception.
The following structure is evident throughout this paper: Section 2 introduces various methods and applications that are related. Section 3 outlines the architecture and loss function of the method proposed by us. Section 4 provides a detailed analysis and presentation of extensive experimental results. Ultimately, Section 5 concludes the paper.

2. Related Work

In unsupervised scenarios, Generative Adversarial Networks (GANs) have emerged as an ideal choice for image fusion. Ma et al. [31] pioneered the application of GANs in this field with their proposal of FusionGAN. In this approach, the generator is tasked with creating fused images that incorporate detailed information from visible images. Then, through adversarial training, the fused images are given more significant information from infrared images. To enhance fusion performance, Ma et al. [32] introduced the Dual Discriminator Conditional GAN (DDcGAN) fusion framework. The framework introduced a novel target-emphasized loss function and implemented a dual discriminator structure, thereby further advancing the capabilities of FusionGAN. In addition, Li et al. [33] introduced AttentionFGAN to respond to the need for perceiving prominent information in source images. This model integrates a multi-scale attention mechanism into GANs, enabling the generator to focus on infrared salient targets and visible background intricacies while ensuring the discriminator concentrates on regions of interest. Although GAN-based fusion models circumvent the limitations associated with manually crafting fusion rules, the absence of explicit ground truth in image fusion tasks poses a challenge. This difficulty hinders the discriminator’s ability to effectively distinguish and learn features from various sources, consequently obstructing the development of GAN-based image fusion models.
Convolutional Neural Networks (CNNs), which are widely utilized in merging infrared and visible images due to their robust feature extraction and adaptability, have been demonstrated to have remarkable performance. Li et al. [16] introduced the DenseFuse framework, utilizing dense blocks in the encoding process to combine features from both shallow and deep layers, thus extracting richer source image features. Inspired by DenseFuse, Li et al. [34] later introduced NestFuse, advancing the fusion strategy by incorporating spatial and channel attention mechanisms. These mechanisms underscore the relevance of each spatial position and channel, leveraging deep-learned features. A different approach was proposed by Zhao et al. [18] with DIDFuse, which aims to separate images into two distinct components including two principal components: one capturing the low-frequency aspects in a background feature map, and the other encapsulating the high-frequency elements in a detail feature map. To facilitate the fusion of images with prominent targets and clear textures, they also introduced a specialized loss function. These prominent fusion techniques are all part of the Autoencoder (AE) connected network family. However, due to the manual fusion strategies required for the extracted multi-modal features in these studies, the fusion performance is constrained.
To alleviate excessive reliance on prior knowledge, researchers have explored alternative fusion network frameworks that implicitly integrate feature extraction, merging, and image synthesis into end-to-end CNN-associated networks with carefully designed loss functions. For instance, Zhang et al. [35] introduced IFCNN, which first introduced perceptual loss during the training phase of image fusion models, to enable fused images with richer texture information. Zhang et al. [36] conceptualized the image fusion challenge as one of preserving the texture and intensity ratios inherent in the source images. Thus, they formulated a unified loss function that incorporates both types of information, making it adaptable across various fusion tasks. Xu et al. [17] introduced the U2Fusion technique, which utilizes an unsupervised unified network for image fusion. They also presented a unique loss function that focuses on preserving adaptive information and incorporates pretrained CNNs for extracting features. In a similar vein, Tang et al. [37] introduced SeAFusion, a real-time, semantic-aware image fusion network. This network leverages dense blocks with gradient residuals for feature extraction and integrates loss functions inspired by semantic segmentation to guide the fusion network’s training process. It is evident from the aforementioned studies that developing suitable loss functions to enhance semantic information perception has the potential to boost the performance of CNN-related networks for fused infrared and visible images. Additionally, CNN-related fusion methods may have limitations in terms of their ability to learn local features.
The Vision Transformer (ViT) [38] has been demonstrated to have strong effectiveness in handling long-range dependencies and has had widespread application in various machine vision domains in recent years, including visual recognition [39,40], object detection [41,42], tracking [43,44], and segmentation [45,46,47]. Initially introduced by Zhao et al. [27], the Transformer was integrated into infrared and visible image fusion, using a sequential DenseNet to extract detailed features and a Dual-Transformer (DT) to enhance global information before fusion. Chen et al. [48] further advanced this by integrating the Transformer into a CNN-based fusion network to capture both global and local features, employing a dual-branch CNN module for shallow feature extraction and a Transformer module for leveraging global channel and spatial relationships. A different fusion strategy was proposed by Yi et al. [49] with their TCPMFNet, leveraging an autoencoder structure and parallel hybrid fusion strategy using Transformer and a CNN. Tang et al. [
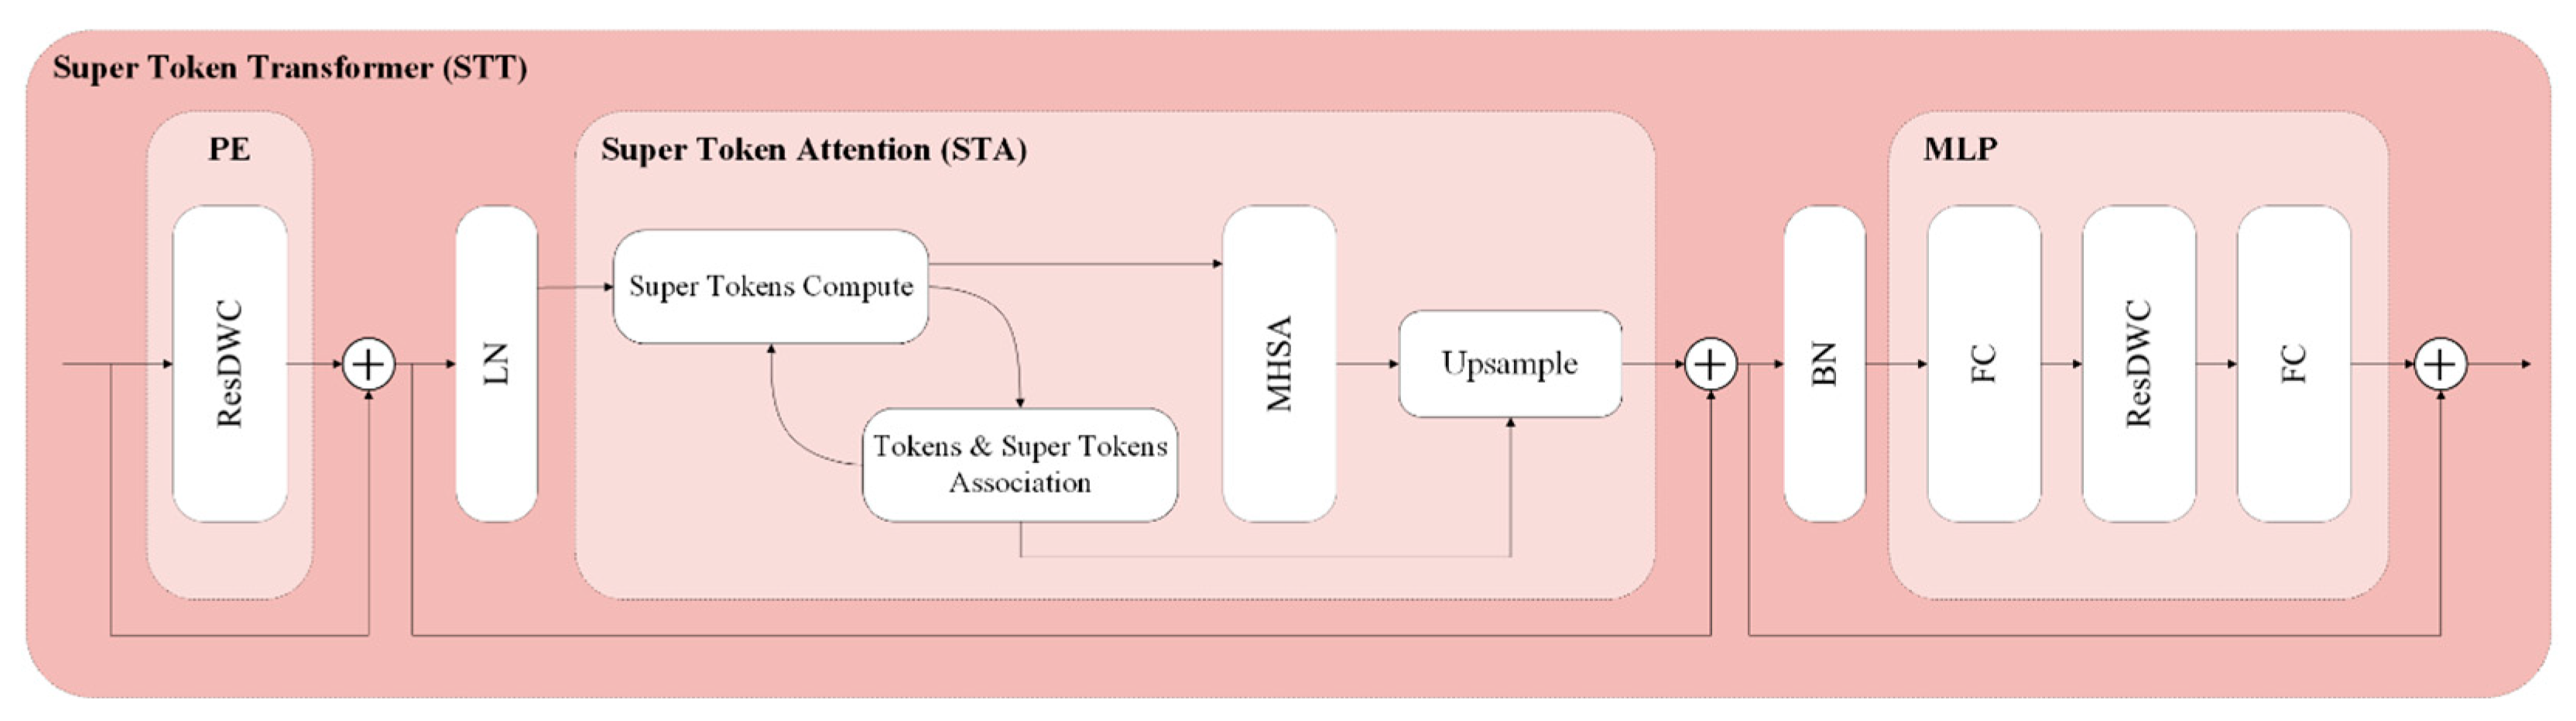
50] developed a network featuring a local feature extraction branch to retain complementary information and a global feature extraction branch with three Transformer blocks to capture long-distance relationships. To address computational costs, Huang et al. [51] introduced the Super Token Transformer (STT) as a more efficient alternative. The Super Token Attention (STA) module within the STT significantly reduces the number of tokens involved in computations by leveraging clustering and sparse association learning concepts, while maintaining model performance. As such, the STA module presents a promising option for feature learning in Transformer-based image fusion.
Along with feature learning regarding the range of perceived information, attention-mechanism-based feature fusion strategies are also an important aspect to empower the model’s capability to enhance informative feature learning through adaptively handling different data characteristics. Yang et al. [52] proposed a fusion module that combines channel attention and spatial attention mechanisms. They used the channel attention mechanism to analyze the feature responses of different channels, while utilizing the spatial attention mechanism to adaptively focus on key regions in the image. To address potential artifacts and non-consistency issues in fused images, Li et al. [53] introduced an attention-based fusion strategy that analyzes the differences between input features. Specifically, it highlights thermal targets in infrared images while preserving details in visible light images, which effectively prevents artifacts in fusion image. Furthermore, in concern of the significant correlation and complementarity between features of different modalities, Li et al. [54] proposed an innovative Cross-Attention Mechanism (CAM). It significantly improves the network’s ability to extract and utilize complementary features through balancing the emphasis on salient targets and detail preservation. In this process, it reduces redundant information from different modalities. In summary, these attention-mechanism-based fusion methods are able to adaptively analyze and integrate the key information. Thus, they enable the deep learning models to achieve more powerful and flexible feature representation capabilities in various visual tasks.

3. Proposed Method

This portion presents a comprehensive overview of the fusion method that is being proposed. To begin with, there will be a general overview of the network. Following that, the global feature extraction and local feature extraction, as well as the components for merging features, will be outlined. Lastly, the design of the loss function will be discussed, with a focus on perceptual loss.

3.1. Overall Framework

The overall framework of the proposed method is shown in Figure 2. It is an end-to-end network model comprising four branches which mainly can be grouped into two different types, namely the branches primarily based on Super Token Transformer (STT) [51] for global feature extraction, and the branches primarily based on the convolution-associated Detail Extraction Block (DEB) for local feature learning. There are also two types of input images, one is the source IR-RGB images, the other one is the corresponding high-frequency filtering images from the two source images. All input images pass through the Shallow Feature Extraction Block (SEB) in each branch for shallow feature extraction before undergoing feature learning by the main network. Specifically, the global branch takes the original image as input to capture the scene’s global features through STT blocks. The local branch takes preprocessed images containing high-frequency information from the source images as input to extract texture and detail features through DEBs. After local and global feature learning, an Attention-based Feature Selection Fusion Module (ASFM) follows which is developed by adopting an addition–multiplication strategy that utilizes the attention mechanism to filter and select features from the input feature maps. This module works to obtain common and unique features of different modalities and merge them. Then, a Dual Attention Fusion Module (DAFM) is proposed by employing channel and spatial attention mechanisms to dynamically allocate fusion weights to input features by enhancing significant features and weakening irrelevant ones. Furthermore, a multi-scale feature extraction is performed using down-sampling layers, where features from adjacent scales will be kept consistent in size through up-sampling layers to construct new saliency maps in the channel dimension. The up-sampling layers are designed by blending nearest-neighbor interpolation with convolutional layers, a strategy employed to alleviate the checkerboard artifacts typically caused by deconvolution. Finally, the integration of feature maps is completed using a reconstruction block. The reconstruction block consists of two layers of 3 × 3 convolutions, with the activation function of the final convolutional layer set as the hyperbolic tangent function (Tanh) to output the fused image.

3.2. Four-Branch Feature Extraction

3.2.1. Global Feature Extraction Branches

There are two branches used for global feature learning from two original modality images. The two branches adopt the same network structure and each branch consists of a Shallow Feature Extraction Block (SEB) and three-stage Super Token Transformer (STT) blocks with down-sampling layers as the connection between each two. It has been reported that convolution operations can extract local representations more efficiently compared to vanilla non-overlapping tokenization [21]. Therefore, a convolutional SEB module is developed with a 3 × 3 kernel size and a Rectified Linear Unit (ReLU) as its activation function to extract shallow features. This branch accepts the source image Iw (w = ir, vi) as input to process it through SEB to generate shallow multi-channel feature maps following Equation (1):
F w 0 = f S E B ( I w ) ,
where f S E B ( ) represents the feature extraction operation performed by the SEB and F w 0 denotes the shallow infrared or visible features of the global branch.
Shallow features extracted by the SEB are then fed into the STT block whose structure is shown in Figure 3. The STT block primarily consists of Position Embedding (PE), Super Token Attention (STA), and a Multi-layer Perceptron (MLP). Specifically, the PE layer incorporates positional information into the input tokens, aiding the model in understanding their sequence positions. The Residual Depth-wise Convolution (ResDWC) within the PE layer enhances local feature representation at a lower computational cost. The STA layer utilizes a fast sampling algorithm based on soft k-means to compute Super Tokens. Specifically, by learning the association between tokens and Super Tokens, the positions of Super Tokens and the clusters to which tokens belong are dynamically updated. This process assigns tokens to different Super Tokens and calculates the association map between tokens and Super Tokens. Subsequently, Multi-head Self-attention (MHSA) calculations are performed in the Super Token space to capture long-range dependencies between Super Tokens. Finally, the learned association mappings are then used to remap the Super Tokens back to the original token space, where they are fused with the original tokens. Through this process, not only are local details of the original tokens preserved but the global representations extracted by the Super Tokens are also incorporated, which leads to a richer and more comprehensive feature representation. Finally, the MLP layer refines the token features though linear transformation of the Fully Connected Layer (FC) and Depth-wise Convolutions (ResDWC). After these operations, it enhances representation capability and introduces non-linear representations. Additionally, the impel Layer Normalization (LN) and Batch Normalization (BN) applied during this process help improve the convergence, as they stabilize and accelerate the training process. Three successive STT blocks are established for global context feature extraction and every two neighboring STT blocks are interconnected using down-sampling layers. In this structure, 3×3 convolutions with a stride of 2 and padding of 1 are used to decrease the quantity of tokens and reduce computational demands. The number of output channels from the down-sampling layers is configured to be twice that of the input channels, enhancing the ability for feature representation and retaining more abundant information. As the feature maps traverse each down-sampling layer, their dimensions are reduced by half so that multi-scale features are obtained. For the first STT block, given that the input features are denoted as F w 0 , the output can be represented as Equation (2):
F w 1 = f S T T 1 ( F w 0 ) ,
where f S T T 1 ( ) represents the feature extraction operation performed by the first-stage STT. F w 1 represents the global infrared or visible features processed by the first-stage STT. Correspondingly, for the ith (i ≥ 2) stage of the STT layer, the input is F w i 1 and the output feature representation after processing by f S T T i ( ) is denoted as F w i . By applying a rapid sampling algorithm to predict Super Tokens, STT can efficiently and effectively capture a global representation in the preliminary phases of the neural network.

3.2.2. Local Feature Extraction Branches

In comparison to Transformers, CNNs are more adept in capturing and articulating the structural and textural aspects of low-level visual features in images. Therefore, two CNN-based local feature extraction branches are designed to complement the shortcomings of the STT learning in capturing local details. Different from the global feature learning branches, each of these two CNN-associated branches take the preprocessed image from the corresponding raw image as input to harness the CNN’s ability to extract local features more efficiently. Specifically, a Gaussian smoothing filter is applied to the source image Iw, followed by the subtraction of this filtered image from the original to separate out the texture and fine details of the source image. This process is formulated in Equation (3):
D w = I w G ( I w ) ,
where G ( ) represents the Gaussian smoothing filtering operation and Dw represents the preprocessed infrared or visible image. Since the texture and edges of objects typically have higher gradient peaks, they represent high-frequency information in the image. Therefore, this way of preprocessing the source image facilitates a more potent extraction of detailed information.
To work in concert with the global feature learning branch, the local feature extraction branch is also constructed with a Shallow Feature Extraction Block (SEB) first, then three successive Detail Extraction Blocks (DEBs) follow and are connected by the in-between down-sampling layers. Here, the SEB works to extract shallow features F ^ w 0 corresponding to the infrared or visible information.
F ^ w 0 = f SEB ( D w ) .
After shallow feature learning, the feature maps would be continued to enter into the Detail Extraction Block (DEB) which is designed for fine-grained feature extraction. Due to the advantages of the residual dense block, the backbone of the module consists of three 3 × 3 convolutional layers, which fully gather local features generated by each convolutional layer through dense connections and adjust the channel dimension adaptively through concatenation and 1 × 1 convolutions. To better preserve object edges, a predefined weighted Sobel operator is added in the residual branch to calculate the magnitude of gradients from the input features. Then 1 × 1 convolutional layers are utilized to eliminate the dimensional difference between the main and residual branches. Finally, the deep and fine-grained features are integrated through element-wise addition. For the first DEB, with the input feature F ^ w 0 , the output feature maps F ^ w 1 are represented in Equation (5):
F ^ w 1 = f DEB 1 ( F ^ w 0 ) ,
where f D E B 1 ( ) represents the feature extraction operation performed by the first-stage DEB. With down-sampling layers between DEBs similar to the global branch, there are still another two DEB structures that follow for local feature extraction. For the ith (i ≥ 2) structure of the DEB, its input is F ^ w i 1 , and the output feature representation after processing by f D E B i ( ) is denoted as F ^ w i .

3.3. Feature Fusion Module

3.3.1. Attention-Based Feature Selection Fusion Module (ASFM)

Through feature learning of the global and local branches, the semantic features and other detailed features of the scene are captured. Due to their differing imaging principles, infrared and visible sensors have the capacity to capture distinct information from the same scene. So, it is essential to distinguish their image features into unique features and common features. As illustrated in Figure 1, the salient targets in the infrared image and the background details in the visible image constitute their unique features. In addition, it can be noticed that both infrared and visible cameras can simultaneously perceive the main trunks of trees and the edges of paths in the scene. Hence, these features can be categorized as their common features. The unique features typically represent complementary information of different modalities, while common features generally reflect the edge and semantic information of the scene. We believe that in the fusion result, the unique features and common features of the same scene in different modalities play equally important roles. To fully leverage the unique and common features of cross-modality images, an Attention-based Feature Selection and Fusion Module (ASFM) is proposed and its structure is shown in Figure 4a.
Specifically, the ASFM takes the global/local features of different modalities as input to fuse the complementary global/local information. On one hand, it collects the unique features of different modality feature maps through element-wise addition. On the other hand, it obtains the common features of different modality feature maps through element-wise multiplication. The unique features and common features are merged along the channel dimension, followed by adjustment utilizing a 1 × 1 convolutional layer to match the output dimensions. This approach ensures the retention of critical information and integrates the features captured by each sensor. Furthermore, to enhance the feature information across different modalities for more accurate localization and identification of objects of interest, we apply a Coordinate Attention (CA) module [55] to process the input features. The processing of the ASFM can be represented as Equation (6):
Y = f c ( C a t ( A ( X 1 ) × A ( X 2 ) , A ( X 1 ) + A ( X 2 ) ) ) ,
where f c ( ) denotes the 1 × 1 convolutional layer. C a t ( ) stands for concatenation along the channel dimension. A ( ) represents the coordinate attention (CA) block. X 1 and X 2 represent the different modality features output by the global/local branch at the same scale. Y denotes the fused global/local features.

3.3.2. Dual Attention Fusion Module (DAFM)

Through the fusion of multi-modality features via the ASFM, the fused global and local features are available. Then the crucial key to achieving high-quality fusion of these features is accurately determining their relative importance. Most reported fusion algorithms implement the fusion process with fixed weights, characterized by simple operation and high computational efficiency. However, this strategy is prone to feature redundancy, making it difficult to distinguish between important and irrelevant features, and thus limit the final fusion quality and application performance. Channel attention mechanisms enable identifying key features within each channel and enhance important features while suppressing irrelevant ones by assigning appropriate weights. Similarly, spatial attention mechanisms determine the importance of features at different spatial locations, allowing the system to focus on areas of interest and utilize more informative spatial information. Similarly, spatial attention mechanisms determine the importance of features across various spatial positions, allowing the system to concentrate on regions of interest and utilize more informative spatial information. Therefore, to further efficiently fuse global and local features learned from different inputs, we combine the channel attention mechanism with the spatial attention mechanism to propose a Dual Attention Fusion Module (DAFM) to dynamically assign fusion weights to its input features.
As illustrated in Figure 5, the inputs of the Dual Attention Fusion Module (DAFM) include global features X 1 and local features X 2 at the same scale. The features are merged along the channel dimension, creating a unified feature map F, which is subsequently compressed through a 1 × 1 convolution to decrease its channel count. Subsequently, F is passed to both the spatial and channel attention modules. The spatial attention module includes a global max pooling layer, a global average pooling layer, and a convolutional layer without bias. To reduce computational cost, this module applies global max and average pooling operations independently across the channel dimension to be concatenated to generate a feature map F s H × W × 2 . With F s , spatial attention weights W s H × W × 1 are obtained via a sigmoid activation operation. The channel attention module employs a soft selection strategy to enhance feature representation through a global average pooling layer and two 1 × 1 point-wise convolutional layers. This provides the generation of channel attention weights W c 1 × 1 × C . The global features X 1 are then rescaled using the weights W c and W s , while the local features X 2 are rescaled using the weights ( 1 W c ) and ( 1 W s ) , respectively. Finally, the reweighted global and local features are added together to produce the fused feature Y .
Figure 6 illustrates the process of fusing global and local features within the DAFM module. Specifically, the global features and local features are generated by the first-stage ASFM, while the fused features are produced by the first-stage DAFM. The top 7 channels from each type of feature map are extracted to compose this figure. It is obvious that global features provide clear target contour information, while local features are rich in texture details, indicating that type-specific features are well extracted. The fused features exhibit the characteristics of both global and local features, demonstrating that the DAFM effectively combines these elements. The visualization aligns with our analysis.

3.4. Loss Function

The primary component of the GLFuse loss function is a content loss that encourages the restoration of salient infrared targets and the fine edge textures, along with a perceptual loss that maintains features from the source images to the fused image. Equation (7) defines the overall loss, with λ representing the balance between these loss types.
L t o t a l = L c o n + λ L p e r .

3.4.1. Content Loss

To guide the fused image to maintain as much as similarity as the source images in low-level features, we designed a content loss containing both an intensity loss L i n t and a gradient loss L g r a d following Equation (8):
L c o n = μ 1 L i n t + μ 2 L g r a d ,
where μ 1 and μ 2 serve as the weighting factors that regulate the contribution of these two distinct losses. The goal is to achieve a fused image that maintains the natural scene style, highlights salient targets, and includes rich texture details. The coarse-grained constraints provided by intensity loss L i n t help guide the fused image to retain significant features that are conveyed through pixel intensities. In contrast, the gradient loss enforces fine-grained constraints to safeguard the texture details of the original image scene, as specified in Equation (9):
L g r a d = 1 H W | I f | max ( | I i r | , | I v i | ) 1 ,
where represents the Sobel gradient operator measuring the textural information present within the image. | | represents the absolute value operation. It is important to note that the optimal texture is selected using a maximum selection strategy from the source images.
In this research, the intensity loss (marked as L i n t ) is divided into two components. The initial component is influenced by the prominent features in the infrared image which have higher pixel intensities and can be preserved more effectively in the fused image through a max selection strategy. The loss is represented as L p i x e l in Equation (10) within this manuscript.
L p i x e l = 1 H W I f max ( I i r , I v i ) 1 ,
where 1 represents the l1-norm, max ( ) denotes element-wise maximum selection. H and W denote the vertical (height) and horizontal (width) dimensions of the feature map, respectively. However, it is found in our study that when the scene illumination is high, L p i x e l tends to lead the model to focus on high-brightness areas, such as the sky and water surfaces, while reducing the focus on salient targets. However, despite their high brightness, these areas actually contain very little information. To address this phenomenon, we apply information entropy from the realm of information theory to quantify the information content present in each source image to construct the other part of intensity loss. Correspondingly, a loss function L e n related to the information entropy is defined. This loss guides the model to focus more on regions with relatively higher information content. Then the intensity loss L i n t is constructed as Equation (11):
L i n t = α L p i x e l + ( 1 α ) L e n ,
where α represents the weight factor that is utilized to regulate the contribution between L p i x e l and L e n . The information entropy EN is calculated as Equation (12):
E N = l = 0 L 1 p l log 2 p l ,
where L represents the number of gray levels, which is typically designated as 256. p l corresponds to the probability of occurrence for each particular gray level. The information entropy for the infrared image E i r and the visible image E v i is calculated, and weights are then assigned according to the information entropy. To enhance the difference between the weights, E i r and E v i are exponentially stretched. A positive scalar c is applied to scale these values, which are subsequently normalized. The formula for calculating the weights is elucidated in Equation (13).
ω i r exp ( E i r c ) exp ( E i r c ) + exp ( E v i c ) , w v i = exp ( E v i c ) exp ( E i r c ) + exp ( E v i c ) .
Once the weights ω i r for the infrared image and ω v i for the visible image are achieved to represent the amount of information contained in each, the loss function L e n is consequently defined as Equation (14):
L e n = 1 H W ( ω i r I f I i r 1 + ω v i I f I v i 1 ) .

3.4.2. Perceptual Loss

With the constraint of content loss, the network model ensures that the fused image aligns closely with the source images at the pixel level, but it cannot capture the subtle perceptual differences between the fused image and the original inputs [56]. Consider a scenario where the goal is to enhance target detection in low-light environments. In this case, it is more important to preserve the thermal signatures captured by the infrared image and the high-frequency details present in the visible image. This means the fused image should accurately reconstruct the thermal information for target detection while also retaining the structural integrity of the details from the visible image to avoid introduction of noise or loss of crucial details. For such high-standard fusion tasks, relying solely on content loss is insufficient.
In available image fusion studies, a common practice is to use the VGG network as a feature extractor to calculate the perceptual loss [57]. This method takes the source images and the fused image as inputs to the VGG network, calculating the perceptual loss by measuring the Euclidean distance between feature maps at the same depth of the fused image and the source images. Namely, the perceptual loss part derived from one source image is in general formulated as Equation (15):
L p e r ( x , y ) = j 1 H j W j C j ϕ j ( x ) ϕ j ( y ) 2 2 ,
where ϕ j ( x ) represents the feature map extracted by the convolutional layer before the jth max pooling layer, with a size of H j × W j × C j . After that, two perceptual loss parts are linearly combined with corresponding weights to emphasize certain aspects of the input images. In some studies, metrics such as brightness, contrast, and information entropy have been used to obtain the corresponding weight maps [58,59]. Nevertheless, while handling intricate scenes, these metrics can be significantly influenced by noise, variations in lighting, and additional factors, which leads to reduced performance. Therefore, in this study, all the perceptual losses are treated equally to avoid these possible effects. Of more importance, it is argued in this study that there would be feature differences between input images of different modalities at the same depth in the VGG network. However, this is overlooked when taking Equation (15) to calculate the relevant perceptual loss by using feature maps of every layer of VGG achieved for each modality image. In this paper, a pretrained VGG16 network is used to extract feature maps of the fused image and input images. By observing the differences between images of different modalities at the same depth in the VGG16 network, fusion rules are designed to calculate perceptual loss.
The salient pedestrian targets are primarily highlighted in the infrared image, as demonstrated in Figure 7, while the texture details or gradient information of the scene is reflected in the visible image. ϕ 1 ( I ) , ⋯, ϕ 5 ( I ) denote the feature maps generated at various levels of depth within the VGG16 network when processing both the infrared and visible images of an identical scene. In Figure 7, ϕ 1 ( I ) and ϕ 2 ( I ) present the shallow-level features such as texture and contours. In these layers, the feature maps of the visible images contain more abundant information than those of the infrared images. In contrast, the deeper-level feature maps, namely ϕ 3 ( I ) , ⋯, ϕ 5 ( I ) , primarily represent deep-level features where objects and spatial structures can be perceived. In these layers, the semantic content from the infrared image is effectively retained, while the detailed content from the visible image is largely lost. We aim to generate a fused image that emphasizes the prominent features from the infrared image while preserving the scene’s texture details. Consequently, this study carefully calculates the perceptual loss, and features ϕ 1 ( I ) and ϕ 2 ( I ) in the first two layers of the VGG16 network are utilized to compute the textural perceptual loss between the visible image and the fused image. The deeper features, namely, ϕ 3 ( I ) ,⋯, ϕ 5 ( I ) , are used to calculate the salient object perceptual loss between the infrared image and the fused image. Then the complete perceptual loss is proposed to be Equation (16):
L p e r = 1 N ( n = 1 2 L p e r ( I f , I v i ) + n = 3 N L p e r ( I f , I i r ) ) ,
where I f , I i r , and I v i denote the fused image, infrared image, and visible image, respectively. N = 5.

4. Experiments

4.1. Experimental Settings

4.1.1. Training and Test Datasets

In the experiments, the proposed network is trained on the MSRS dataset [60]. The original MSRS training set includes 1083 pairs of registered infrared and visible images. To obtain a sufficient number of training images, data augmentation is also conducted through random cropping during the training phase, ultimately acquiring 16,245 pairs of images, each with dimensions of 128 × 128 pixels. Additionally, to thoroughly assess the model generalization capabilities besides test evaluation using a small set of MSRS data, generalization experiments are also carried out on the TNO dataset [61] and the RoadScene dataset [17]. A summary of the foundational details pertaining to these benchmark datasets is presented in Table 1.

4.1.2. Implement Details

Our model was developed utilizing the PyTorch framework and underwent training on a powerful GeForce RTX 2080Ti 11GB GPU. The software setup includes UBUNTU20.2, Python 3.8, and PyTorch 1.12.1. Throughout the training process, we employed the Adam optimizer, setting the learning rate to 2 × 10 4 . We alo specified a training batch size of 32 and completed the training over 10 epochs. The total loss weight coefficient λ is assigned a value of 1 × 10 4 , while the content loss weight coefficients μ 1 and μ 2 are designated as 5 and 30, respectively. Additionally, α is set to 0.5.
As no reference images are included in public datasets for tasks that involve fusing infrared and visible images, assessing the quality of the resulting fused images directly against ground truth is not possible. Therefore, both subjective and objective evaluations are necessary. Subjective evaluation involves assessing human visual perception, which includes comparing the brightness, clarity, contrast, and overall visual effects of the fused images. It also involves examining how well the significant features in the infrared images are preserved. In contrast, objective evaluation employs quantitative metrics to measure the quality of the fused images. In the experiments, commonly utilized metrics are employed for evaluation purposes. To affirm the efficacy of the proposed method, a comparative analysis is conducted both subjectively and objectively against recent State-of-the-Art (SOTA) methods including DenseFuse [16], FusionGAN [31], IFCNN [35], U2Fusion [17], SDNet [19], RFN-Nest [62], FLFuse [63], SeAFusion [37], DATFuse [64], MetaFusion [65], Coconet [66], DDFM [67], and TarDAL [68]. All compared algorithms are tested with a public code repository, with experiment-related parameters kept constant.

4.2. Results Analysis

4.2.1. Subjective Evaluation

In this section, an evaluation of the proposed approach’s subjective nature is evident in Figure 8. Here, image fusion outcomes for select images sourced from the TNO, RoadScene, and MSRS datasets are displayed. The images feature red and green boxes denoting noteworthy targets and texture intricacies. Upon visual inspection, a comparison between GLFuse and SOTAs reveals that all techniques effectively fulfill the image fusion objective, integrating additional insights from the original images. However, the background of fusion images in Figure 8g,i,k appears blurry and lacks scene detail information. Although methods in Figure 8c,e,n retain background information from visible images, the image contrast is low and show suboptimal visual effects. FusionGAN in Figure 8d performs well in restoring pixel intensity from source images but introduces severe distortion in the image. Influenced by visible images, methods in Figure 8f,h exhibit a certain degree of brightness reduction in infrared targets during the fusion process. Although significant targets are clear in Figure 8j, the preservation of the background details from the visible image is not good. Figure 8o retains the pixel intensity of the target, but the target contours are incomplete. All methods in Figure 8l,m,p seem to successfully fuse the thermal radiation information obtained from infrared images with the rich textural features extracted from visible images. But more careful observation shows that our method in Figure 8p additionally preserves the color intensity of the visible images, which provides favorable conditions for subsequent image processing tasks. The superiority of the proposed method can also be observed from the fusion results achieved on the RoadScene and MSRS datasets displayed in Figure 9 and Figure 10, respectively.

4.2.2. Objective Evaluation

The above subjective evaluation involves human factors, which may lead to different assessment results due to individual differences. Therefore, we select 42 pairs, 50 pairs, and 361 pairs of images, respectively, from the TNO, RoadScene, and MSRS datasets to conduct quantitative evaluation for the above methods. Eight evaluation metrics, including Entropy (EN) [69], Spatial Frequency (SF) [70], Mutual Information (MI) [71], Standard Deviation (SD) [72], Visual Information Fidelity (VIF) [73], Sum of Correlation Differences (SCD) [74], Peak Signal-to-Noise Ratio (PSNR) [75], and Quality of Images (Qabf) [76], are utilized. All the aforementioned criteria function as affirmative benchmarks, with higher values signifying enhanced fusion results. In Table 2, we compare the performance of all methods on eight evaluation metrics. Our method performs excellently across all three datasets. On each dataset, all rank first for at least four out of eight metrics. Among them, the metrics of EN, VIF, and SD consistently show excellent performance, which indicate the informativeness possessed in the fusion image. In contrast, it is also noted that our method has the worst PSNR values on all three datasets. In fact, this is related to the distortions caused during the fusion process. As observable in Figure 8, Figure 9 and Figure 10, the proposed method obtains the most highlighted pedestrian thermal targets in the fusion images, as appeared in the infrared image. Even though these are acceptable results, they represent the fusion distortions at the pixel level which are reflected by PSNR. Therefore, the worst PSNR values are achieved by our method. For most of the rest of the metrics, even though the proposed method is not the best, it ranks second, being the closest to the best one. This means our method is also able to achieve acceptable effects with respect to relevant qualities. So, its comprehensive performance is superior against all the rest of the SOTA methods.

4.3. Ablation Studies

As there are multiple contributions in our network design, ablation experiments are conducted for each module and component of the network individually.

4.3.1. ASFM

To assess the effectiveness of the ASFM, this section compares different structures, a network using a cascade with a 1 × 1 convolution combination to replace the ASFM (w/o ASFM), a network using only the addition strategy of the ASFM (w/Addition), a network using only the multiplication strategy of the ASFM (w/Multiplication), and a network using the ASFM (w/ASFM). The structures of the three variants are shown in Figure 11.
Table 3 quantitatively compares the performance of above three structure variants on the TNO dataset. Numerically, networks using the ASFM (w/Addition, w/Multiplication, and w/ASFM) outperform networks without the ASFM (w/o ASFM) across all metrics. Specifically, the structure variant w/Addition exhibits higher values than the variant w/Multiplication with respect to metrics of EN, MI, and SCD. This indicates that the addition strategy helps increase the fused image’s informative content by aggregating unique information from the source images. Instead, the variant w/Multiplication helps increase values in terms of SF, PSNR, and Qabf compared to the variant w/Addition. It reflects that the multiplication strategy is more beneficial for preserving image gradient intensity and edge details. After combination of both addition and multiplication operation, most metrics, including EN, SF, MI, VIF, and PSNR, improve but not SD, SCD, and Qabf. This indicates that in certain cases, using a single addition or multiplication strategy may produce better fusion results. Overall, the proposed structure w/ASFM with a combined addition–multiplication strategy has the most potential in enhancing the network’s information extraction and edge detail preservation capabilities.
Figure 12 furthermore intuitively illustrates the effect of the three variants of the ASFM on the fusion results. Similarly, the red and green boxes in the images represent significant targets and texture details, respectively. For the image pair of Kaptein_1123, the fusion image in Figure 12d contains more smoke detail information compared to that in Figure 12e. Whereas for the fusion image of House, the network variant in Figure 12e provides better fusion image where the edge contours of the light bulb are well preserved compared to that in Figure 12d. Agreeing with the above quantitative comparison results, the network using complete the ASFM in Figure 12f is seen to maintain strong object edge gradients while incorporating rich detail information.

4.3.2. DAFM

To validate the efficacy of the DAFM introduced in this approach, we compare the complete network (w/DAFM) with a network using pixel-wise addition (w/o DAFM) instead. Those experiments are conducted on the RoadScene dataset, and the fusion results are illustrated in Figure 13. Regarding the fusion results of the FLIR_06832 image pair, pixel-wise addition (w/o DAFM) facilitates the preservation of the pixel intensity in the infrared target but with overexposure is observed. This leads to the contours of the background clouds becoming blurred. On the contrary, the complete network (w/DAFM) enhances image contrast while preserving the pixel intensity of the infrared target and better restoring the background details of the source image. As for image pair of FLIR_08592, the fusion result using the network structure w/DAFM in Figure 13d better preserves salient features within the red rectangle and restores details more effectively in the green rectangle. The corresponding quantitative results from the experiments are compiled in Table 4, where adding the DAFM is demonstrated to have better outcomes except for SCD.

4.3.3. Perceptual Loss

To illustrate the efficacy of proposed loss L p e r , the following perceptual loss function L p e r outlined in Equation (17) is employed for comparative analysis in ablation studies conducted on the MSRS dataset.
L p e r = 1 N n = 1 N ( L p e r ( I f , I v i ) + L p e r ( I f , I i r ) ) ,
where N = 5, I f , I i r , and I v i represent the fusion image, infrared image, and visible image, respectively. In contrast to L p e r , L p e r calculates the perceptual loss corresponding to the output feature maps of infrared and visible images at each depth of the VGG16 network. Additionally, a network that does not use the perceptual loss function (w/o L p e r ) is also implemented for comparison. To ensure the rigor of the experiments, all other parameters of each group remain consistent apart from the loss function.
The fusion results are shown in Figure 14. For the 00196D scene, constrained by the content loss, the fusion results in Figure 14c–e all excellently preserve the pixel intensity of significant targets and background texture details. However, the lack of perceptual loss constraint in Figure 14c encounters interference from redundant information of the infrared image on the green leaves inside the green rectangle. In contrast, Figure 14e, with constraint of L p e r , shows a cleaner image and less noise in the green rectangle. In the fusion comparison of the nighttime scene (00906N), the observation is in accordance with the fusion results of the first scene. Figure 14c–e all manage to restore the detail information within the green rectangle, but the outline of the street lamp in Figure 14c is blurry with significant noise. Once the perceptual loss is considered both fusion results are proved with improved visual effect in Figure 14d,e. For example, outlines of the street lamp in both images are clearer. But when the perceptual loss is defined as L p e r where the perceptual information conveyed in different depths of layers is treated differently, the network has a stronger constraint capability to generate images more consistent with human visual perception.

4.3.4. Gaussian Smoothing Preprocessing

In this section, an ablation study for the Gaussian-smoothed preprocessed input is also conducted. Namely, the local feature extraction branch that only uses the source image as input (w/o Dw) is implemented to retrain the network for comparison. The quantitative results of the experiment on the MSRS dataset are shown in Table 5. It is shown in this table that input with both source images and Gaussian-smoothed preprocessed images (w/Dw) enables the network to achieve much better fusion performance. This indicates that the preprocessed features aids in better feature learning to obtain richer edge detail and texture information during the multi-modality image fusion.

4.4. Object Detection Performance

Identifying objects is a prevalent task in advanced computer vision, with the goal of recognizing the semantic content in visual content. Based on the aforementioned analysis, object detection is subsequently performed on the fused image to substantiate the efficiency of the proposed fusion strategy. YOLOv5 [77] is a widely recognized detection algorithm that can effectively evaluate the preservation capability of various image fusion methods for semantic information. It is used for object detection in this part. The MSRS dataset contains 80 sets of infrared and visible images for object detection, with labels including two categories of pedestrians and cars. The object detection performance is reported in Table 6. This approach computed mAP values at thresholds of 0.5, 0.7, and 0.9 and calculated the average mAP across IoU thresholds ranging from 0.5 to 0.95 with a step size of 0.05, denoted as mAP@[0.5:0.95].
It can be observed from Table 6 that infrared images enable achieving the best pedestrian mAP values at all IoU thresholds. This is because the imaging characteristics of infrared sensors work to primarily capture thermal radiation emitted by objects within the scene. However, infrared images cannot reflect the overall semantic information of cars. Instead, visible images contain richer color and detail information, enabling accurate capture of semantic features such as the shape and appearance of cars. Therefore, fusing infrared images with visible images is theoretically assumed to harness the full potential of both image types, potentially boosting the performance and precision of object detection tasks. Among all the fusion approaches, the experimental results demonstrate that the method introduced in this research enables achieving the most excellent detection accuracy at various IoU thresholds, especially when the IoU thresholds are more stringently set as 0.7 and 0.9. The visual detection results presented in Figure 15 and Figure 16 illustrate that the images generated by the proposed fusion method not only align with human visual perception but also enable achieving the highest detection confidence. This implies that our method is capable of supplying a more abundant set of semantic information to the detection algorithms.

5. Conclusions

In this paper, we propose a GLFuse network for infrared and visible image fusion. The feature learning process in our network is conducted to learn both global and local features, in particular from two different input image types. The proposed network structure includes global branches with STT as the backbone for global feature extraction and local branches with the DEB as the backbone for local feature extraction. Subsequently, two level of fusion modules are correspondingly developed. On one hand, the ASFM is crafted to integrate both global/local features extracted from various modalities. On the other hand, the final global and local features learned from two kinds of input are fused through the DAFM. Of more importance, in this study, it is argued that there would be feature differences between input images of different modalities at the same depth in the VGG network. Therefore, the differences in feature maps across different modal images at different layers of the VGG16 network are addressed in this study by proposing a corresponding perceptual loss function to more accurately preserve different levels of semantic information. Extensive results from both subjective and objective experiments confirm that our GLFuse network has significant advantages in visual effects and quantitative metrics compared to state-of-the-art methods. Through a series of in-depth ablation experiments, it is confirmed that all these designs positively contribute to improving the quality of the fused images, enriching the information content and achieving better visual effects. Additionally, GLFuse is also validated to be more effective to enhance the efficacy of downstream target detection tasks with multi-modality images. All this evidence fully demonstrates the effectiveness and practicality of GLFuse within the domain of infrared and visible image fusion.

Author Contributions

Conceptualization, G.Z. and Z.H.; Funding acquisition, G.Z., S.F., Z.W. and H.W.; Methodology, G.Z. and Z.H.; Validation, G.Z. and Z.H.; Visualization, G.Z. and Z.H.; Writing—original draft, G.Z. and Z.H.; Writing—review and editing, G.Z., S.F., Z.W. and H.W. All authors have read and agreed to the published version of the manuscript.

Funding

This work was supported by the GuangDong Basic and Applied Basic Research Foundation (Grant No. 2024A1515010036), National Natural Science Foundation of China (Grant No. 32102078) to Silu Feng, and Guangzhou Municipal Science and Technology (Project No. 2023A04J0351) to Silu Feng.

Data Availability Statement

The data presented in this study are available in the public domain: [TNO: https://doi.org/10.6084/m9.figshare.1008029.v2, RoadScene: https://github.com/hanna-xu/RoadScene, MSRS: https://github.com/Linfeng-Tang/MSRS], last accessed: 15 July 2024.

Conflicts of Interest

The authors declare no conflicts of interest.

References

  1. Chen, J.; Li, X.; Luo, L.; Ma, J. Multi-focus image fusion based on multi-scale gradients and image matting. IEEE Trans. Multimed. 2021, 24, 655–667. [Google Scholar] [CrossRef]
  2. Saad, R.S.M.; Moussa, M.M.; Abdel-Kader, N.S.; Farouk, H.; Mashaly, S. Deep video-based person re-identification (Deep Vid-ReID): Comprehensive survey. EURASIP J. Adv. Signal Process. 2024, 1, 63. [Google Scholar] [CrossRef]
  3. Hu, Z.; Yaguang, J.; Guoqing, W. Decision-level fusion detection method of visible and infrared images under low light conditions. EURASIP J. Adv. Signal Process. 2023, 1, 38. [Google Scholar] [CrossRef]
  4. Qin, X.; Zhang, Z.; Huang, C.; Gao, C.; Dehghan, M.; Jagersand, M. Basnet: Boundary-Aware Salient Object Detection. In Proceedings of the IEEE/CVF Conference on Computer Vision and Pattern Recognition, Long Beach, CA, USA, 15–20 June 2019; pp. 7479–7489. [Google Scholar]
  5. Dai, X.; Yuan, X.; Wei, X. TIRNet: Object detection in thermal infrared images for autonomous driving. Appl. Intell. 2021, 51, 1244–1261. [Google Scholar] [CrossRef]
  6. Ha, Q.; Watanabe, K.; Karasawa, T.; Ushiku, Y.; Harada, T. MFNet: Towards Real-Time Semantic Segmentation for Autonomous Vehicles with Multi-Spectral Scenes. In Proceedings of the 2017 IEEE/RSJ International Conference on Intelligent Robots and Systems (IROS), Vancouver, BC, Canada, 24–28 September 2017; IEEE: Piscataway, NJ, USA, 2017; pp. 5108–5115. [Google Scholar]
  7. Ma, J.; Ma, Y.; Li, C. Infrared and visible image fusion methods and applications: A survey. Inf. Fusion 2019, 45, 153–178. [Google Scholar] [CrossRef]
  8. Liu, X.; Mei, W.; Du, H. Structure tensor and nonsubsampled shearlet transform based algorithm for CT and MRI image fusion. Neurocomputing 2017, 235, 131–139. [Google Scholar] [CrossRef]
  9. Li, S.; Yang, B.; Hu, J. Performance comparison of different multi-resolution transforms for image fusion. Inf. Fusion 2011, 12, 74–84. [Google Scholar] [CrossRef]
  10. Pajares, G.; De La Cruz, J.M. A wavelet-based image fusion tutorial. Pattern Recognit. 2004, 37, 1855–1872. [Google Scholar] [CrossRef]
  11. Wang, J.; Peng, J.; Feng, X.; He, G.; Fan, J. Fusion method for infrared and visible images by using non-negative sparse representation. Infrared Phys. Technol. 2014, 67, 477–489. [Google Scholar] [CrossRef]
  12. Zhang, Q.; Liu, Y.; Blum, R.S.; Han, J.; Tao, D. Sparse representation based multi-sensor image fusion for multi-focus and multi-modality images: A review. Inf. Fusion 2018, 40, 57–75. [Google Scholar] [CrossRef]
  13. Liu, Y.; Chen, X.; Ward, R.K.; Wang, Z.J. Image fusion with convolutional sparse representation. IEEE Signal Process. Lett. 2016, 23, 1882–1886. [Google Scholar] [CrossRef]
  14. Lewis, J.J.; O’callaghan, R.J.; Nikolov, S.G.; Bull, D.R.; Canagarajah, C.N. Region-Based Image Fusion Using Complex Wavelets. In Proceedings of the 7th International Conference on Information Fusion, Stockholm, Sweden, 28 June–1 July 2004; pp. 555–562. [Google Scholar]
  15. Meher, B.; Agrawal, S.; Panda, R.; Abraham, A. A survey on region based image fusion methods. Inf. Fusion 2019, 48, 119–132. [Google Scholar] [CrossRef]
  16. Li, H.; Wu, X.J. DenseFuse: A fusion approach to infrared and visible images. IEEE Trans. Image Process. 2018, 28, 2614–2623. [Google Scholar] [CrossRef] [PubMed]
  17. Xu, H.; Ma, J.; Jiang, J.; Guo, X.; Ling, H. U2Fusion: A unified unsupervised image fusion network. IEEE Trans. Pattern Anal. Mach. Intell. 2020, 44, 502–518. [Google Scholar] [CrossRef]
  18. Zhao, Z.; Xu, S.; Zhang, C.; Liu, J.; Li, P.; Zhang, J. DIDFuse: Deep Image Decomposition for Infrared and Visible Image Fusion. arXiv 2020, arXiv:2003.09210. [Google Scholar]
  19. Zhang, H.; Ma, J. SDNet: A versatile squeeze-and-decomposition network for real-time image fusion. Int. J. Comput. Vision. 2021, 129, 2761–2785. [Google Scholar] [CrossRef]
  20. Liang, J.; Cao, J.; Sun, G.; Zhang, K.; Van Gool, L.; Timofte, R. Swinir: Image Restoration Using Swin Transformer. In Proceedings of the IEEE/CVF International Conference on Computer Vision, Montreal, BC, Canada, 11–17 October 2021; pp. 1833–1844. [Google Scholar]
  21. Vaswani, A.; Shazeer, N.; Parmar, N.; Uszkoreit, J.; Jones, L.; Gomez, A.N.; Kaiser, Ł.; Polosukhin, I. Attention is all you need. Adv. Neural Inf. Process. Syst. 2017, 30, 5998–6008. [Google Scholar]
  22. Ma, J.; Tang, L.; Fan, F.; Huang, J.; Mei, X.; Ma, Y. SwinFusion: Cross-domain long-range learning for general image fusion via swin transformer. IEEE/CAA J. Autom. Sin. 2022, 9, 1200–1217. [Google Scholar] [CrossRef]
  23. Rao, D.; Xu, T.; Wu, X.J. Tgfuse: An infrared and visible image fusion approach based on transformer and generative adversarial network. arXiv 2023, arXiv:2201.10147. [Google Scholar] [CrossRef]
  24. Fu, Y.; Xu, T.Y.; Wu, X.J.; Fu, Y.; Xu, T.; Wu, X.; Kittler, J. Ppt Fusion: Pyramid Patch Transformerfor a Case Study in Image Fusion. arXiv 2021, arXiv:2107.13967. [Google Scholar]
  25. Qu, L.; Liu, S.; Wang, M.; Song, Z. Transmef: A Transformer-Based Multi-Exposure Image Fusion Framework Using Self-Supervised Multi-Task Learning. arXiv 2021, arXiv:2112.01030. [Google Scholar] [CrossRef]
  26. Li, J.; Zhu, J.; Li, C.; Chen, X.; Yang, B. CGTF: Convolution-guided transformer for infrared and visible image fusion. IEEE Trans. Instrum. Meas. 2022, 71, 5012314. [Google Scholar] [CrossRef]
  27. Zhao, H.; Nie, R. DNDT: Infrared and Visible Image Fusion via Densenet and Dual-Transformer. In Proceedings of the 2021 International Conference on Information Technology and Biomedical Engineering (ICITBE), Nanchang, China, 24–26 December 2021; IEEE: Piscataway, NJ, USA, 2021; pp. 71–75. [Google Scholar]
  28. Huang, J.; Li, X.; Tan, T.; Li, X.; Ye, T. MMA-UNet: A Multi-Modal Asymmetric UNet Architecture for Infrared and Visible Image Fusion. arXiv 2024, arXiv:2404.17747. [Google Scholar]
  29. Feng, S.; Wu, C.; Lin, C.; Huang, M. RADFNet: An infrared and visible image fusion framework based on distributed network. Front. Plant Sci. 2023, 13, 1056711. [Google Scholar] [CrossRef] [PubMed]
  30. Liu, J.; Yafei, Z.; Fan, L. Infrared and visible image fusion with edge detail implantation. Front. Phys. 2023, 11, 1180100. [Google Scholar] [CrossRef]
  31. Ma, J.; Yu, W.; Liang, P.; Li, C.; Jiang, J. FusionGAN: A generative adversarial network for infrared and visible image fusion. Inf. Fusion 2019, 48, 11–26. [Google Scholar] [CrossRef]
  32. Ma, J.; Xu, H.; Jiang, J.; Mei, X.; Zhang, X.P. DDcGAN: A dual-discriminator conditional generative adversarial network for multi-resolution image fusion. IEEE Trans. Image Process. 2020, 29, 4980–4995. [Google Scholar] [CrossRef] [PubMed]
  33. Li, J.; Huo, H.; Li, C.; Wang, R.; Feng, Q. AttentionFGAN: Infrared and visible image fusion using attention-based generative adversarial networks. IEEE Trans. Multimed. 2020, 23, 1383–1396. [Google Scholar] [CrossRef]
  34. Li, H.; Wu, X.J.; Durrani, T. NestFuse: An infrared and visible image fusion architecture based on nest connection and spatial/channel attention models. IEEE Trans. Instrum. Meas. 2020, 69, 9645–9656. [Google Scholar] [CrossRef]
  35. Zhang, Y.; Liu, Y.; Sun, P.; Yan, H.; Zhao, X.; Zhang, L. IFCNN: A general image fusion framework based on convolutional neural network. Inf. Fusion 2020, 54, 99–118. [Google Scholar] [CrossRef]
  36. Zhang, H.; Xu, H.; Xiao, Y.; Guo, X.; Ma, J. Rethinking the Image Fusion: A Fast Unified Image Fusion Network Based on Proportional Maintenance of Gradient and Intensity. Proc. AAAI Conf. Artif. Intell. 2020, 34, 12797–12804. [Google Scholar] [CrossRef]
  37. Tang, L.; Yuan, J.; Ma, J. Image fusion in the loop of high-level vision tasks: A semantic-aware real-time infrared and visible image fusion network. Inf. Fusion 2022, 82, 28–42. [Google Scholar] [CrossRef]
  38. Dosovitskiy, A.; Beyer, L.; Kolesnikov, A.; Weissenborn, D.; Zhai, X.; Unterthiner, T.; Dehghani, M.; Minderer, M.; Heigold, G.; Gelly, S.; et al. An Image is Worth 16 × 16 Words: Transformers for Image Recognition at Scale. arXiv 2020, arXiv:2010.11929. [Google Scholar]
  39. Srinivas, A.; Lin, T.Y.; Parmar, N.; Shlens, J.; Abbeel, P.; Vaswani, A. Bottleneck Transformers for Visual Recognition. arXiv 2021, arXiv:2101.11605. [Google Scholar]
  40. Chen, M.; Peng, H.; Fu, J.; Ling, H. Autoformer: Searching Transformers for Visual Recognition. In Proceedings of the IEEE/CVF International Conference on Computer Vision, Montreal, QC, Canada, 10–17 October 2021; pp. 12270–12280. [Google Scholar]
  41. Carion, N.; Massa, F.; Synnaeve, G.; Usunier, N.; Kirillov, A.; Zagoruyko, S. End-to-End Object Detection with Transformers. In Proceedings of the European Conference on Computer Vision, Glasgow, UK, 23–28 August 2020; Springer International Publishing: Cham, Switzerland; pp. 213–229. [Google Scholar]
  42. Zhu, X.; Su, W.; Lu, L.; Li, B.; Wang, X.; Dai, J. Deformable Detr: Deformable Transformers for End-to-End Object Detection. arXiv 2020, arXiv:2010.04159. [Google Scholar]
  43. Meinhardt, T.; Kirillov, A.; Leal-Taixe, L.; Feichtenhofer, C. Trackformer: Multi-object Tracking with Transformers. arXiv 2021, arXiv:2101.02702. [Google Scholar]
  44. Lin, L.; Fan, H.; Zhang, Z.; Xu, Y.; Ling, H. Swintrack: A simple and strong baseline for transformer tracking. Adv. Neural Inf. Process. Syst. 2022, 35, 16743–16754. [Google Scholar]
  45. Chen, J.; Lu, Y.; Yu, Q.; Luo, X.; Adeli, E.; Wang, Y.; Lu, L.; Yuille, A.L.; Zhou, Y. Transunet: Transformers Make Strong Encoders for Medical Image Segmentation. arXiv 2021, arXiv:2102.04306. [Google Scholar]
  46. Xie, E.; Wang, W.; Yu, Z.; Xie, E.; Wang, W.; Yu, Z.; Anandkumar, A.; Alvarez, J.M.; Luo, P. SegFormer: Simple and efficient design for semantic segmentation with transformers. Adv. Neural Inf. Process. Syst. 2021, 34, 12077–12090. [Google Scholar]
  47. Zhang, Y.; Liu, H.; Hu, Q. Transfuse: Fusing Transformers and Cnns for Medical Image Segmentation. In Medical Image Computing and Computer Assisted Intervention–MICCAI 2021, Proceeding of the 24th International Conference, Strasbourg, France, 27 September–1 October 2021; Part I 24; Springer: Berlin/Heidelberg, Germany, 2021; pp. 14–24. [Google Scholar]
  48. Chen, J.; Ding, J.; Yu, Y.; Chen, J.; Ding, J.; Yu, Y.; Gong, W. THFuse: An infrared and visible image fusion network using transformer and hybrid feature extractor. Neurocomputing 2023, 527, 71–82. [Google Scholar] [CrossRef]
  49. Yi, S.; Jiang, G.; Liu, X.; Yi, S.; Jiang, G.; Liu, X.; Li, J.; Chen, L. TCPMFNet: An infrared and visible image fusion network with composite auto encoder and transformer–convolutional parallel mixed fusion strategy. Infrared Phys. Technol. 2022, 127, 104405. [Google Scholar] [CrossRef]
  50. Tang, W.; He, F.; Liu, Y. TCCFusion: An infrared and visible image fusion method based on transformer and cross correlation. Pattern Recognit. 2023, 137, 109295. [Google Scholar] [CrossRef]
  51. Huang, H.; Zhou, X.; Cao, J.; Huang, H.; Zhou, X.; Cao, J.; He, R.; Tan, T. Vision Transformer with Super Token Sampling. arXiv 2022, arXiv:2211.11167. [Google Scholar]
  52. Yang, G.; Li, J.; Lei, H.; Gao, X. A multi-scale information integration framework for infrared and visible image fusion. Neurocomputing 2024, 600, 128116. [Google Scholar] [CrossRef]
  53. Li, X.; Chen, H.; Li, Y.; Peng, Y. MAFusion: Multiscale attention network for infrared and visible image fusion. IEEE Trans. Instrum. Meas. 2022, 71, 1–16. [Google Scholar] [CrossRef]
  54. Li, H.; Xiao-Jun, W. CrossFuse: A novel cross attention mechanism based infrared and visible image fusion approach. Inf. Fusion 2024, 103, 102147. [Google Scholar] [CrossRef]
  55. Hou, Q.; Zhou, D.; Feng, J. Coordinate Attention for Efficient Mobile Network Design. In Proceedings of the IEEE/CVF Conference on Computer Vision and Pattern Recognition, Nashville, TN, USA, 20–25 June 2021; pp. 13713–13722. [Google Scholar]
  56. Johnson, J.; Alahi, A.; Fei-Fei, L. Perceptual Losses for Real-Time Style Transfer and Super-Resolution. In Computer Vision–ECCV 2016, Proceedings of the 14th European Conference, Amsterdam, The Netherlands, 11–14 October 2016; Part II; Springer: Berlin/Heidelberg, Germany, 2016; pp. 694–711. [Google Scholar]
  57. Simonyan, K.; Zisserman, A. Very Deep Convolutional Networks for Large-Scale Image Recognition. arXiv 2014, arXiv:1409.1556. [Google Scholar]
  58. Xu, D.; Zhang, N.; Zhang, Y.; Li, Z.; Zhao, Z.; Wang, Y. Multi-scale unsupervised network for infrared and visible image fusion based on joint attention mechanism. Infrared Phys. Technol. 2022, 125, 104242. [Google Scholar] [CrossRef]
  59. Xu, H.; Ma, J.; Le, Z.; Jiang, J.; Guo, X. Fusiondn: A Unified Densely Connected Network for Image Fusion. Proc. AAAI Conf. Artif. Intell. 2020, 34, 12484–12491. [Google Scholar] [CrossRef]
  60. Tang, L.; Yuan, J.; Zhang, H.; Jiang, X.; Ma, J. PIAFusion: A progressive infrared and visible image fusion network based on illumination aware. Inf. Fusion 2022, 83, 79–92. [Google Scholar] [CrossRef]
  61. Toet, A. TNO Image Fusion Dataset. Figshare 2014. [Google Scholar] [CrossRef]
  62. Li, H.; Wu, X.J.; Kittler, J. RFN-Nest: An end-to-end residual fusion network for infrared and visible images. Inf. Fusion 2021, 73, 72–86. [Google Scholar] [CrossRef]
  63. Xue, W.; Wang, A.; Zhao, L. FLFuse-Net: A fast and lightweight infrared and visible image fusion network via feature flow and edge compensation for salient information. Infrared Phys. Technol. 2022, 127, 104383. [Google Scholar] [CrossRef]
  64. Tang, W.; He, F.; Liu, Y.; Duan, Y.; Si, T. DATFuse: Infrared and visible image fusion via dual attention transformer. IEEE Trans. Circuits Syst. Video Technol. 2023, 33, 3159–3172. [Google Scholar] [CrossRef]
  65. Zhao, W.; Xie, S.; Zhao, F.; He, Y.; Lu, H. Metafusion: Infrared and Visible Image Fusion via Meta-Feature Embedding from Object Detection. In Proceedings of the IEEE/CVF Conference on Computer Vision and Pattern Recognition, Vancouver, BC, Canada, 17–24 June 2023. [Google Scholar]
  66. Liu, J.; Lin, R.; Wu, G.; Liu, R.; Luo, Z.; Fan, X. Coconet: Coupled contrastive learning network with multi-level feature ensemble for multi-modality image fusion. Int. J. Comput. Vis. 2024, 132, 1748–1775. [Google Scholar] [CrossRef]
  67. Zhao, Z.; Bai, H.; Zhu, Y.; Zhang, J.; Xu, S.; Zhang, Y.; Zhang, K.; Meng, D.; Timofte, R.; Van Gool, L. DDFM: Denoising Diffusion Model for Multi-Modality Image Fusion. In Proceedings of the IEEE/CVF International Conference on Computer Vision, Paris, France, 1–6 October 2023. [Google Scholar]
  68. Liu, J.; Fan, X.; Huang, Z.; Wu, G.; Liu, R.; Zhong, W.; Luo, Z. Target-Aware Dual Adversarial Learning and a Multi-Scenario Multi-Modality Benchmark to Fuse Infrared and Visible for Object Detection. In Proceedings of the IEEE/CVF Conference on Computer Vision and Pattern Recognition, New Orleans, LA, USA, 18–24 June 2022. [Google Scholar]
  69. Roberts, J.W.; Van Aardt, J.A.; Ahmed, F.B. Assessment of image fusion procedures using entropy, image quality, and multispectral classification. J. Appl. Remote Sens. 2008, 2, 023522. [Google Scholar]
  70. Eskicioglu, A.M.; Fisher, P.S. Image quality measures and their performance. IEEE Trans. Commun. 1995, 43, 2959–2965. [Google Scholar] [CrossRef]
  71. Qu, G.; Zhang, D.; Yan, P. Information measure for performance of image fusion. Electron. Lett. 2002, 38, 1. [Google Scholar] [CrossRef]
  72. Rao, Y.J. In-fibre Bragg grating sensors. Meas. Sci. Technol. 1997, 8, 355. [Google Scholar] [CrossRef]
  73. Han, Y.; Cai, Y.; Cao, Y.; Xu, X. A new image fusion performance metric based on visual information fidelity. Inf. Fusion 2013, 14, 127–135. [Google Scholar] [CrossRef]
  74. Aslantas, V.; Bendes, E. A new image quality metric for image fusion: The sum of the correlations of differences. Aeu-Int. J. Electron. Commun. 2015, 69, 1890–1896. [Google Scholar] [CrossRef]
  75. Jagalingam, P.; Hegde, A.V. A review of quality metrics for fused image. Aquat. Procedia 2015, 4, 133–142. [Google Scholar] [CrossRef]
  76. Xydeas, C.S.; Petrovic, V. Objective image fusion performance measure. Electron. Lett. 2000, 36, 308–309. [Google Scholar] [CrossRef]
  77. Redmon, J.; Divvala, S.; Girshick, R.; Farhadi, A. You only look once: Unified, real-time object detection. In Proceedings of the IEEE Conference on Computer Vision and Pattern Recognition, Las Vegas, NV, USA, 27–30 June 2016; pp. 779–788. [Google Scholar]
Figure 1. Instances of merging infrared and visible images. Our approach generates fused outcomes containing abundant texture intricacies and enhanced contrast.
Remotesensing 16 03246 g001
Figure 2. The proposed GLFuse framework for fusion of infrared and visible images is depicted. The network incorporates various input images, such as source IR-RGB images and corresponding high-frequency filtering images IirG(Iir) compared to IviG(Ivi) extracted from the two source images. The source images are directed towards Transformer branches, which utilize STT as the primary feature learning mechanism for obtaining global information. Conversely, the high-frequency filtering images are channeled into CNN branches, where the main DEB module is employed for local feature extraction. The ASFM model is utilized to fuse different scales of global and local features, filtering out relevant information. Subsequently, the DAFM dynamically integrates the fused global and local features, enhancing significant features while suppressing less important ones. The multi-scale fused features undergo up-sampling to generate the final fusion image.
Remotesensing 16 03246 g002
Figure 3. The architecture of Super Token Transformer (STT).
Remotesensing 16 03246 g003
Figure 4. (a) The architecture of the Attention-Based Feature Selection Fusion Module (ASFM). X1 and X2 denote the input feature maps and Y represents the output of ASFM, where the structure of Coordinate Attention (CA) Block is presented in (b). The units of HAP and WAP refer to global average pooling along the height and width directions, respectively.
Remotesensing 16 03246 g004
Figure 5. The architecture of the Dual Attention Fusion Module (DAFM). The input feature maps are denoted as X1 and X2, with Y representing the DAFM output. The fully connected layers are represented by FC. The multiplication of the feature map by the attention weight W and (1 − W) is indicated by the black and red arrows, respectively. Global average pooling and global max pooling are denoted as GAP and GMP, respectively.
Remotesensing 16 03246 g005
Figure 6. Visualization of global and local feature fusion by DAFM.
Remotesensing 16 03246 g006
Figure 7. Illustration of feature maps extracted by VGG16 for infrared and visible images. Note, for each modality image, four out of five scale feature maps demoted as F i r i / F v i i from the VGG16 network are randomly picked and displayed here.
Remotesensing 16 03246 g007
Figure 8. Visualization of fusion results achieved by different methods on sandpath_18 image of the TNO dataset.
Remotesensing 16 03246 g008
Figure 9. Visualization of fusion results achieved by different methods on FLIR_06430 image of the RoadScene dataset.
Remotesensing 16 03246 g009
Figure 10. Visualization of fusion results achieved by different methods on 00537D image of the MSRS test dataset.
Remotesensing 16 03246 g010
Figure 11. The architecture of three structure variants of ASFM.
Remotesensing 16 03246 g011
Figure 12. The fusion results of GLFuse with different variants of ASFM on image pairs of scenes Kaptein_1123 and House.
Remotesensing 16 03246 g012
Figure 13. The fusion results of GLFuse with and without DAFM on image pairs of scenes FLIR_06832 and FLIR_08592.
Remotesensing 16 03246 g013
Figure 14. The fused results of GLFuse with different loss functions on image pairs of scenes 00196D and 00906N.
Remotesensing 16 03246 g014
Figure 15. Object detection results for infrared, visible, and fused images on the image pairs from scene 01460D in the MSRS dataset.
Remotesensing 16 03246 g015
Figure 16. Object detection results for infrared, visible, and fused images on the image pairs from scene 00689N in the MSRS dataset.
Remotesensing 16 03246 g016
Table 1. Details of the benchmark dataset.
DatasetsTrainTest
MSRSMSRSTNORoadScene
Number of pairs of images16,2453614250
Table 2. Quantitative fusion accuracies of representative methods on three different datasets. The top values are highlighted, with the second-best value being underlined.
DatasetsMethodsENSFMISDVIFSCDPSNRQabf
TNODenseFuse6.81938.98542.301934.82500.65841.783862.57740.4463
FusionGAN6.55806.27532.335230.66320.42201.379360.97940.2344
IFCNN6.853912.22662.057237.08080.62861.777763.46610.4813
U2Fusion6.996711.86382.010243.53160.61721.783962.80820.4267
SDNet6.694811.64282.260633.66930.57791.559062.15010.4298
RFN-Nest6.96325.87482.118436.89700.55931.784362.19300.3346
FLFuse6.36176.63192.186325.72250.60581.581763.83880.3961
SeAFusion7.133512.25252.838244.24360.70421.723261.39180.4879
DATFuse6.45319.60562.732227.57440.68301.495761.77340.4997
MetaFusion6.909212.81262.303141.23810.58781.622460.48420.4558
CoCoNet6.962615.30512.115043.27360.65271.715459.96340.2988
MMIF-DDFM6.255610.87852.692136.57760.66251.623361.23470.3774
TarDAL6.84057.95912.609345.21150.53881.548562.30430.3017
Ours7.158614.00762.760546.62040.73971.808162.77590.5293
RoadSceneDenseFuse6.85289.71772.679933.25570.52561.613762.40430.4033
FusionGAN6.98408.71652.784340.68270.38521.302459.45070.2670
IFCNN7.197814.86023.081633.01180.64451.677462.58120.5476
U2Fusion6.63717.16902.825028.50520.55171.413664.52450.3714
SDNet7.305815.34343.265546.08640.62691.659062.14230.5002
RFN-Nest7.22158.20242.728446.94210.54041.663360.46270.3294
FLFuse7.005111.83553.088337.54250.67221.624863.00370.5522
SeAFusion7.350915.34953.236850.18240.67081.682161.66430.5262
DATFuse6.724011.31663.074732.26870.62491.287662.39040.5191
MetaFusion7.079313.56652.791846.21350.65891.643560.55860.3253
CoCoNet7.279214.54242.661551.94320.55941.683259.76900.3363
MMIF-DDFM6.978513.95682.899847.28800.61181.634060.95580.4788
TarDAL7.14439.76893.162647.44450.53241.553462.88290.3745
Ours7.376715.49763.281949.21600.69231.709262.12960.5387
MSRSDenseFuse5.87625.55662.757323.91380.67691.384465.45230.3531
FusionGAN5.54254.47912.048321.95770.39081.155465.35210.1469
IFCNN6.307111.64102.651537.16840.76971.762366.17580.5641
U2Fusion5.38124.73672.666321.03560.51781.184466.74350.2126
SDNet5.15848.09301.822819.65550.50321.019261.49730.3292
RFN-Nest5.10955.11062.227527.25860.50021.488364.94070.2472
FLFuse5.59746.58042.243422.37730.65171.437166.17220.3722
SeAFusion6.386610.04653.223941.89890.95171.834764.57110.6486
DATFuse6.501810.08673.461136.90580.91151.670163.45260.6097
MetaFusion6.32518.37652.466938.24450.58331.677060.57660.3112
CoCoNet6.60099.30322.511746.53090.60011.501757.87270.3109
MMIF-DDFM6.20589.46012.565234.35460.68231.563162.12450.5433
TarDAL5.78896.62582.158933.84570.39010.682762.87080.1737
Ours6.61519.97023.783943.55090.98261.859964.31300.6341
Table 3. Quantitative comparison of three variants of ASFM on the TNO dataset. The top values are highlighted, with the second-best value being underlined.
ENSFMISDVIFSCDPSNRQabf
w/o ASFM7.003212.30352.106843.41660.66351.750958.35380.4408
w/Addition7.143712.16702.693448.50320.69731.820861.39920.4751
w/Multiplication7.066413.03662.418945.59050.71611.764262.55190.5382
w/ASFM7.158614.00762.760546.62040.73971.808162.77590.5293
Table 4. Quantitative comparison of GLFuse with or without DAFM on the RoadScene dataset. The top values are highlighted, with the second-best value being underlined.
ENSFMISDVIFSCDPSNRQabf
w/o DAFM7.303215.22353.006846.37730.67211.710961.86740.5108
w/DAFM7.376715.49763.281949.21600.69231.709262.12960.5387
Table 5. Quantitative fusion accuracy of GLFuse with or without Gaussian smoothing preprocessing input achieved on the MSRS dataset. The top values are highlighted, with the second-best value being underlined.
ENSFMISDVIFSCDPSNRQabf
w/o Dw6.509810.91423.671642.27230.96961.837465.88690.6282
w/Dw6.61519.97023.783943.55090.98261.859964.31300.6341
Table 6. The performance of object detection (mAP) on visible, infrared, and merged images from the MSRS dataset. The top values are highlighted, with the second-best value being underlined.
Methods[email protected][email protected][email protected]mAP@[0.5:0.95]
PersonCarAllPersonCarAllPersonCarAllPersonCarAll
Infrared0.9490.6830.8160.8650.5890.7270.2120.1570.1840.6710.470.571
Visible0.6810.9330.8070.4250.8420.6340.01360.3890.2010.350.7170.533
DenseFuse0.9270.9480.9370.7990.9110.8550.08030.4880.2840.5970.7420.669
FusionGAN0.8790.9160.8980.7550.8360.7960.1430.4640.3040.5940.7220.658
IFCNN0.9280.9170.9220.8330.9150.8740.1180.490.3040.620.7460.683
U2Fusion0.9430.9390.9410.8040.8920.8480.08090.4350.2580.6030.7320.667
SDNet0.9610.9270.9440.830.8860.8580.1240.5260.3250.6390.7530.696
RFN-Nest0.8010.8680.8350.6660.770.7180.04660.4360.2410.4870.6570.572
FLFuse0.8690.8780.8730.7980.7670.7820.140.5290.3340.5990.6860.642
SeAFusion0.9150.9050.910.8330.830.8310.1010.4560.2780.6010.7090.655
DATFuse0.9220.9070.9150.8150.8560.8360.09720.4560.2760.6040.7150.659
MetaFusion0.8880.910.8990.6860.8320.7590.0990.420.2590.5490.7010.625
CoCoNet0.8130.7020.7570.6680.6490.6590.1070.2360.1720.5120.520.516
MMIF-DDFM0.9160.9460.9310.7970.8610.8290.0720.4140.2430.5940.7120.653
TarDAL0.8720.9130.8930.7170.8170.7670.1180.3570.2370.5520.6740.613
Ours0.9450.9260.9360.8620.8890.8760.1680.5020.3350.6570.7380.698
Disclaimer/Publisher’s Note: The statements, opinions and data contained in all publications are solely those of the individual author(s) and contributor(s) and not of MDPI and/or the editor(s). MDPI and/or the editor(s) disclaim responsibility for any injury to people or property resulting from any ideas, methods, instructions or products referred to in the content.

