Article

Construction and Application of Dynamic Threshold Model for Agricultural Drought Grades Based on Near-Infrared and Short-Wave Infrared Bands for Spring Maize

1
Heilongjiang Ecology Meteorological Center, Northeast Satellite Meteorological Data Center, Harbin 150030, China
2
State Key Laboratory of Severe Weather, Chinese Academy of Meteorological Sciences, Beijing 100081, China
3
Heilongjiang Meteorological Observatory, Harbin 150030, China
*
Author to whom correspondence should be addressed.
Remote Sens. 2024, 16(17), 3260; https://doi.org/10.3390/rs16173260
Submission received: 17 July 2024 / Revised: 9 August 2024 / Accepted: 30 August 2024 / Published: 3 September 2024
(This article belongs to the Special Issue Proximal and Remote Sensing for Precision Crop Management II)

Abstract

:
Maize (Zea mays L.) is one of the most important grain crops in the world. Drought caused by climate change in recent years may greatly threaten water supply and crop production, even if the drought only lasts for a few days or weeks. Therefore, effective daily drought monitoring for maize is crucial for ensuring food security. A pivotal challenge in current related research may be the selection of data collection and the methodologies in the construction of these indices. Therefore, orthorectified reflectance in the short-wave infrared (SWIR) band, which is highly sensitive to variations in vegetation water content, was daily obtained from the MODIS MCD43A4 product. Normalized Difference Water Index (NDWI) calculated using the NIR and SWIR bands and days after planting (DAP) were normalized to obtain the Vegetation Water Index (VWI) and normalized days after planting (NDAP), respectively. The daily dynamic threshold model for different agricultural drought grades was constructed based on the VWI and NDAP with double-logistic fitting functions during the maize growing season, and its specific threshold was determined with historical drought records. Verification results indicated that the VWI had a good effect on the daily agricultural drought monitoring of spring maize in the “Golden Maize Belt” in northeast China. Drought grades produced by the VWI were completely consistent with historical records for 84.6% of the validation records, and 96.2% of the validation records differed by only one grade level or less. The VWI can not only daily identify the occurrence and development process of drought, but also well reflect the impact of drought on the yield of maize. Moreover, the VWI could be used to monitor the spatial evolution of drought processes at both regional and precise pixel scales. These results contribute to providing theoretical guidance for the daily dynamic monitoring and evaluation of spring maize drought in the “Golden Maize Belt” of China.

1. Introduction

China is a major grain-producing country, ranking first in the world for grain production for over 30 years. China’s population accounts for about one-fifth of the world’s total population, but the amount of arable land in China is limited. Therefore, ensuring stable food production in China is crucial for both China and the world. According to the National Bureau of Statistics of China, the planting area and yield of maize in China account for 36.4% and 40.4%, respectively, of the total planting area and yield of grain crops in 2022 (http://www.stats.gov.cn/) (accessed on 10 August 2023).
The area around 45°N in China is one of the best maize production areas due to its abundant solar radiation, suitable temperature, available water resources, and fertile soil. This area is world-renowned as the “Golden Maize Belt” (GMB) in northeast China (NEC) [1]. However, extreme weather events occur frequently under the influence of climate change. Maize cultivation in the GMB is influenced by periods of low precipitation, high solar radiation, and high temperature [1,2]. Moreover, the occurrence of high-intensity drought during the reproductive growth stage may seriously threaten the formation of maize yield [1,3]. For example, spring maize growth and yield in the GMB was significantly affected by drought in 2000 and 2007, resulting in a significant reduction in production [4]. Under future climate change scenarios, crop growth in the GMB is predicted to be affected by drought conditions, and the frequency of drought disasters will continue to increase [5]. This trend may cause significant fluctuations in maize production and seriously threaten food security in China and even in the world. Therefore, it is an urgent necessity to monitor maize drought in time for agricultural disaster prevention and reduction, and to protect food security.
Drought can generally be divided into meteorological drought, hydrological drought, and agricultural drought. The occurrence of agricultural drought is initially manifested as a decrease in soil moisture caused by reduced precipitation, accompanied by continuous water loss through crop transpiration. Eventually, when the water content in the crops cannot meet normal physiological activities, it is manifested as limiting crop growth, leading to reduced or no harvest of crops. Drought process identification is an important foundational work for drought monitoring, and mainly uses the threshold method [6,7,8,9]. This method distinguishes the beginning, duration, or end of drought based on the relationship between a drought index value and a threshold value for that index. Currently, drought indices are broadly divided into two categories: those based on ground climate data [10,11,12,13,14], and those based on satellite remote sensing information [15,16,17,18,19,20,21]. Drought indices that utilize ground-based climate data are generally straightforward to calculate and offer a convenient means of assessment. These indices can provide a reflection of the occurrence, development, and evolution of drought to a certain extent. However, even though interpolation methods can extend point results to spatial results, errors are usually significant due to factors such as terrain [22]. These indicators mostly serve as indicators of meteorological drought, yet they are difficult to accurately capture the impact of agricultural drought on crops. Another type of drought index based on satellite remote sensing information mainly uses remote sensing data from multiple angles, phases, and spectra to evaluate soil moisture either qualitatively or semi-quantitatively. The benefits of using remote sensing data are high spatial resolution and extensive coverage. It can not only observe surface temperature and precipitation, but also comprehensively reflect the moisture conditions of the surface. With the increasing number of remote sensing satellites, the quality of remote sensing data continues to improve, providing an increasingly rich dataset for drought monitoring [23,24,25].
Previous studies have found that reflectance spectra in the range of 1400–2500 nm, especially the short-wave infrared (SWIR) band, are very suitable for estimating crop water conditions [26,27,28,29,30]. In the SWIR spectrum, the incident energy received by plants is basically absorbed or reflected, with almost no transmission. The spectral characteristics of plants are controlled by the total water content of the leaves, and the reflectance of the leaves is negatively correlated with the total water content inside the leaves. Therefore, NDWI calculated using near-infrared (NIR) and SWIR showed high sensitivity to changes in vegetation water content, with data sourced from band 2 (NIR, 858 nm) and band 7 (SWIR, 2130 nm) of the MODIS reflectance product [27]. NDWI can reflect the spatiotemporal changes in drought conditions in a timely manner for short-term drought detection due to the sensitivity of NDWI to vegetation canopy water content [31].
At present, most existing studies have only focused on the static monitoring of a certain stage of drought [31,32], or have only focused on the ultimate impact of drought on crop yields [33,34]. Because drought is a relatively slow-forming natural disaster, the slow and cumulative impact of drought on crops has often been ignored. Monitoring drought as a static natural disaster may not adequately assess the impact of drought on crops and is thereby not conducive to the prevention and evaluation of drought disasters. Moreover, flash droughts resulting from climate change have occurred frequently in recent years. Although some of these droughts last for only a few days or weeks, they may greatly threaten water supply and crop production [35,36]. Accordingly, constructing a daily dynamic threshold model for monitoring drought is of great significance [6,37]. In addition, the response of crops to drought is dynamic and continuously changing with crop growth and development. The sensitivity of the same crop to drought may be different at various developmental stages [7,8,9]. Therefore, a threshold index value indicating drought may significantly change with crop growth and development. Consequently, drought indicators commonly use fixed thresholds during the entire growing season [28,38], or use a set of different thresholds for various developmental stages [8,9]. In this case, the drought thresholds of crops on two adjacent days at different developmental stages may be completely different, but in reality, there may be no significant difference in the response to drought on these two days. Previous research has established a daily dynamic drought threshold for summer maize by use of a double-logistic fitting function in the Huang-Huai-Hai region in China, resulting in high validation accuracy [6]. However, studies on daily dynamic drought thresholds for spring maize in the GMB in NEC have not been reported to date.
The purpose of this study was to: (1) construct the dynamic threshold model for agricultural drought grades based on NIR and SWIR bands; (2) determine and validate the daily dynamic thresholds for different drought grades (including mild drought, moderate drought, and severe drought) by using drought disaster records and phenophase observations of spring maize in the GMB through a double-logistic fitting function; (3) analyze the spatiotemporal distribution characteristics of several typical drought processes at regional and pixel scales; (4) study the impact of drought on spring maize yield; and (5) clarify the distribution characteristics of spring maize at different drought grades in the GMB in recent years. It is expected that this index will provide theoretical guidance for the daily quantitative monitoring of spring maize drought in the GMB in NEC, and will provide a new method for agricultural drought analysis.

2. Materials and Methods
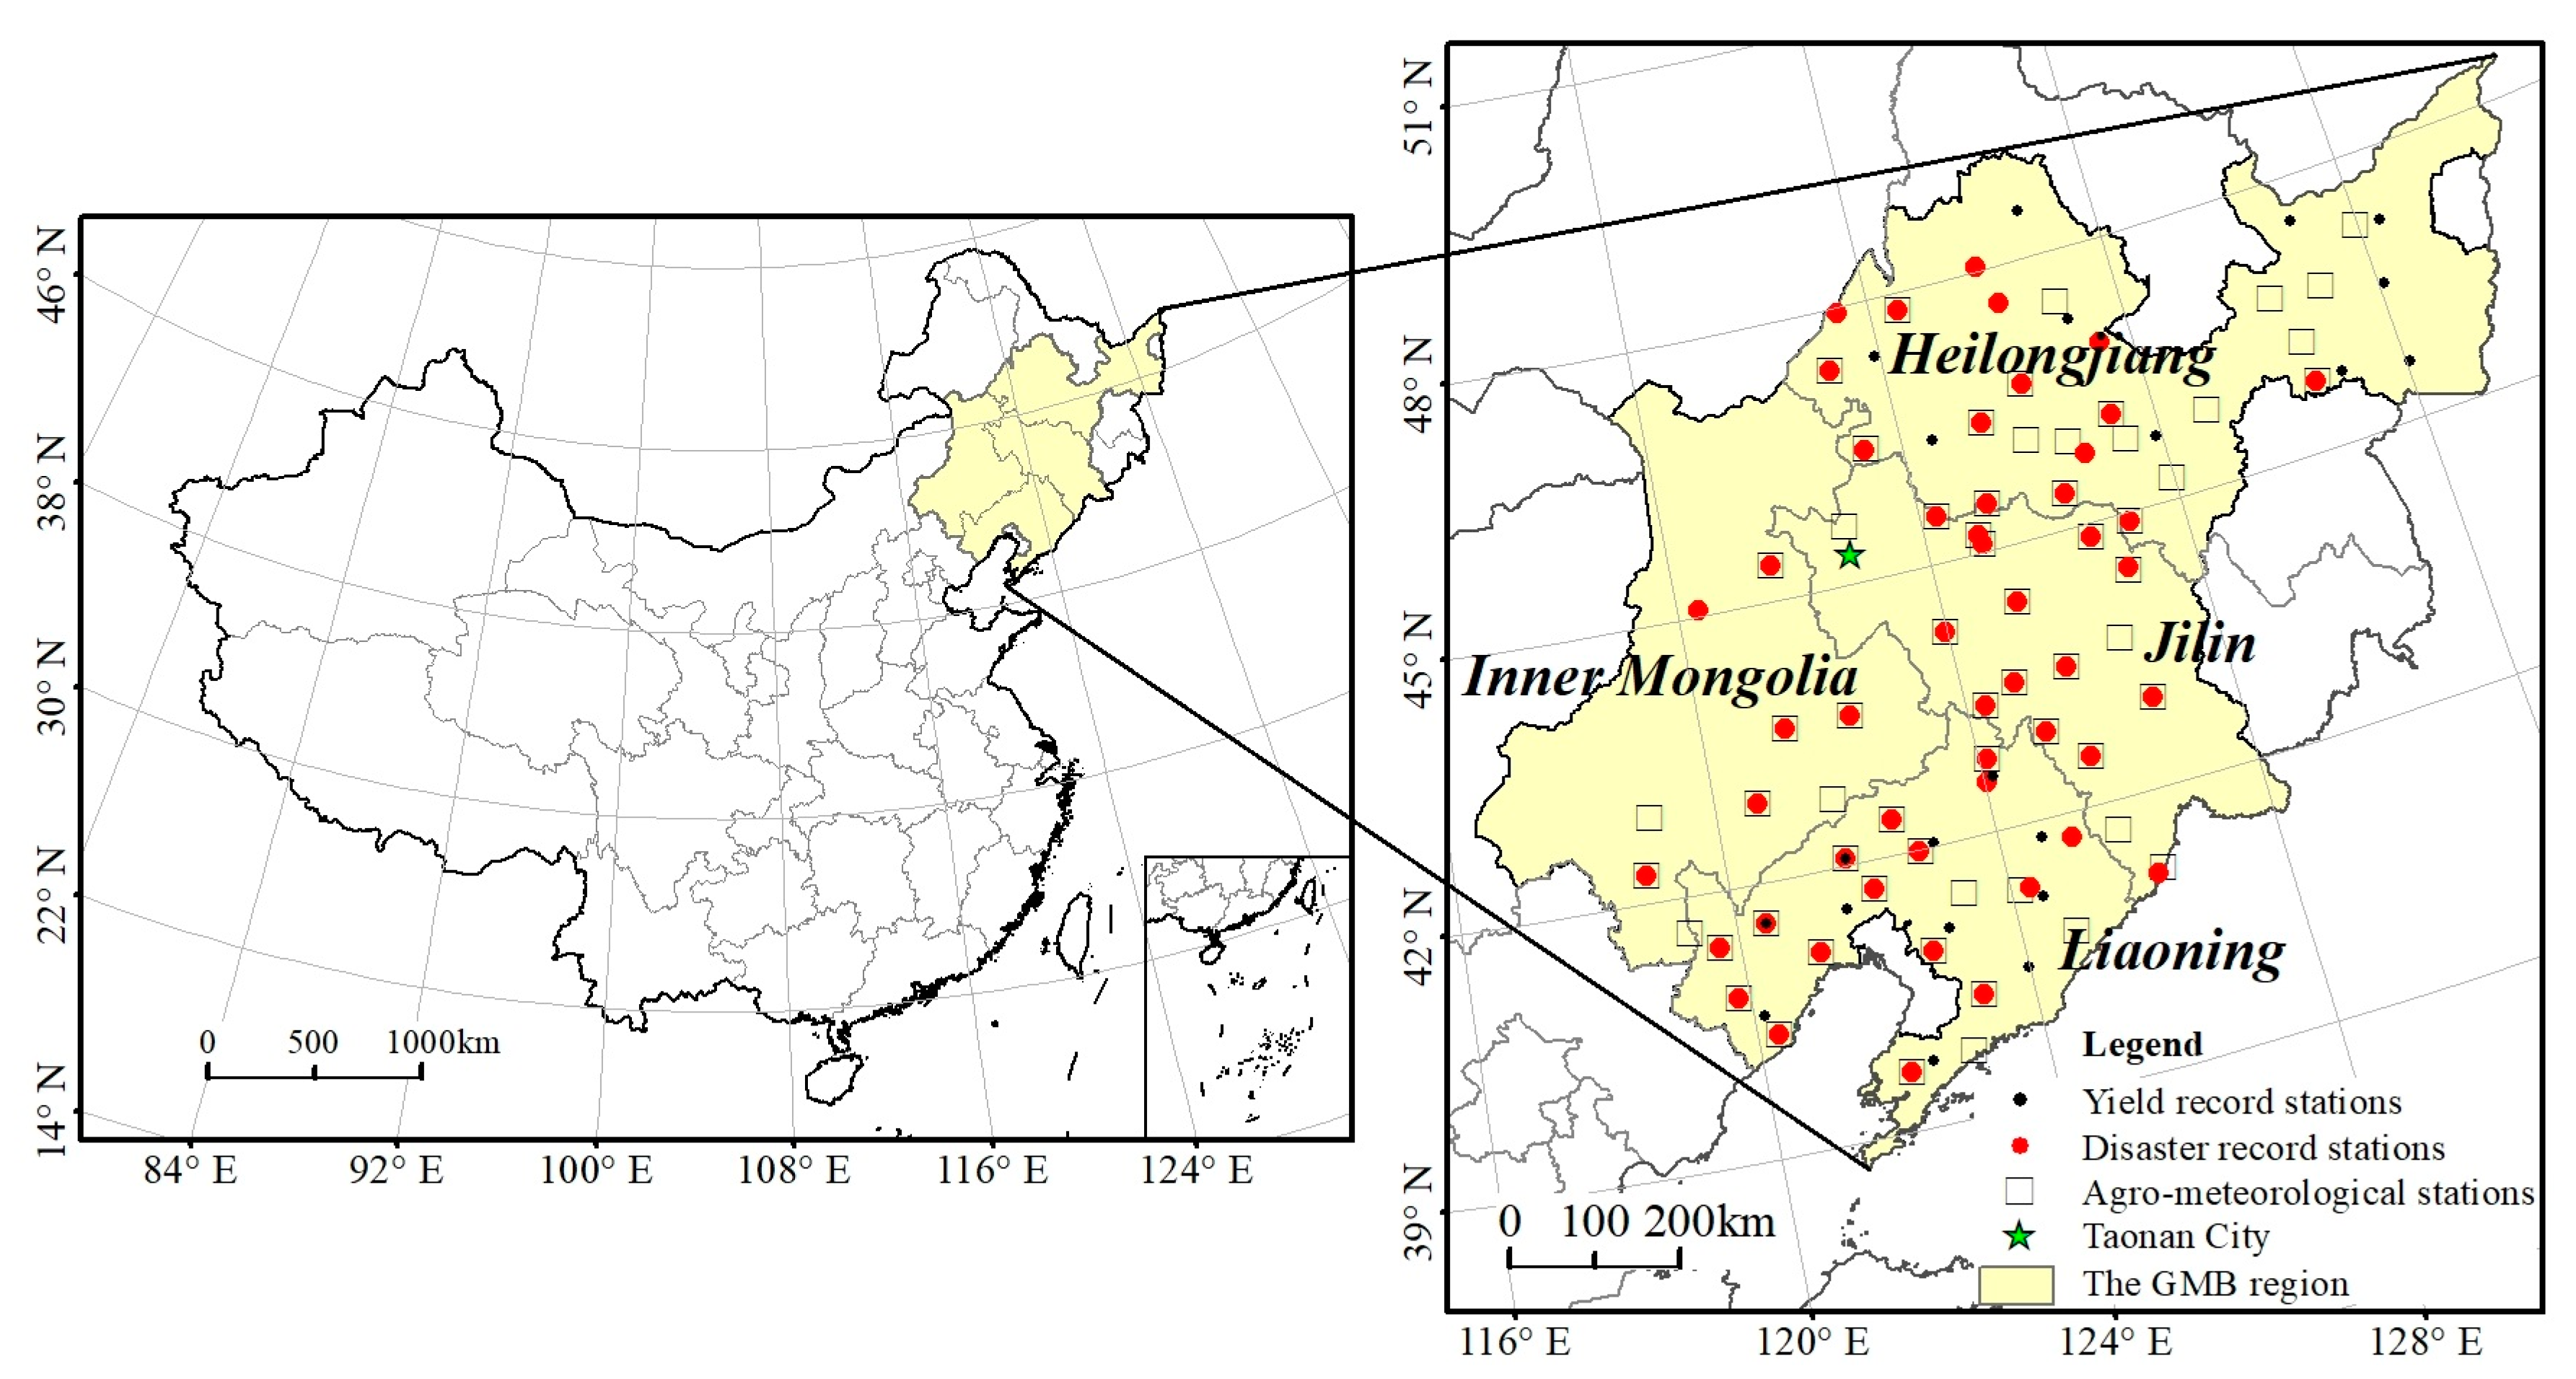
2.1. Study Area

The GMB in NEC is located at mid-to-high latitudes (38°43′–49°12′N, 116°25′–135°06′E; Figure 1). It includes all or parts of the 33 prefecture-level cities in Heilongjiang Province, Jilin Province, Liaoning Province, and eastern Inner Mongolia Autonomous Region, with an area of approximately 7.3 × 10⁵ km2 [1]. The terrain in this area is flat and the land is fertile. The soil layer is deep and rich in organic matter. Black soil, known for its high fertility, is predominantly distributed in the western part of the Sanjiang Plain, the eastern and northern parts of the Songnen Plain. Chernozem soil, another highly productive type, is found in the central and western parts of the Songnen Plain. These areas are vital as they serve as a significant commodity grain base in northern China and are the primary production area for spring maize. The climate is characterized as temperate humid and semi-humid monsoon, with winters being cold and dry, while summers are warm and rainy. The annual precipitation is mainly concentrated in summer. Precipitation and thermal resources are synchronized with the growth and development of maize, making it a typical rainfed agricultural area. However, low precipitation, high wind speed, and high evaporation in spring, and high solar radiation accompanied by high temperatures in summer, may present some risks to maize production. Changes in maize production can have significant impacts on China’s food security, economic development, and social stability.

2.2. Data

2.2.1. Remotely Sensed Data

The remote sensing data from 2000 to 2020 used in this study were Nadir Bidirectional Reflectance Distribution Function (BRDF)-Adjusted Reflection (NBAR) products (MCD43A4 products). MCD43A4 product provides at-ground nadir reflectance with a spatial resolution of 500 m and has a higher revisit cycle than the 8-day surface reflection product (MOD09Q1), which can be daily obtained from the NASA WIST website (https://ladsweb.modaps.eosdis.nasa.gov/, (accessed on 10 July 2024)). The data used in MCD43A4 were adjusted using a BRDF algorithm to simulate values as if they were taken from the nadir [39]. The corrections of this product significantly reduced noise generated by anisotropic scattering effects on surfaces under different lighting and observation conditions [40]. Four tiles of MCD43A4 data (h26v03, h26v04, h27v04, and h27v05) were selected to fully cover the GMB, and data from 22 April to 7 October of each year were used to cover the growing season of spring maize. After preprocessing methods such as data format conversion, concatenation, projection conversion, cropping, and filling missing values, the MODIS products in Hierarchical Data Format (HDF) were processed into Lambert Conformal Conic projection TIFF files for the NIR band (band 2 of MCD43A4) and the SWIR band (band 7 of MCD43A4) used in the GMB.

2.2.2. Distribution Datasets for Spring Maize

The annual distribution datasets of spring maize planting from 2000 to 2019 came from the National Ecosystem Science Data Center’s “Dataset of 1-km planting distribution of three major grain crops in China from 2000 to 2019” [41]. These datasets were GeoTIFF format raster data projected from Asia North Alberts Equal Area Conic at 1 km spatial resolution. In addition, the analysis results for 2020 used the maize planting distribution dataset from 2019.

2.2.3. Actual Disaster Records

Actual disaster records at 51 conventional disaster recording stations in the GMB from 2000 to 2013 were obtained from the China Meteorological Data Sharing Service System to construct the dynamic threshold model for agricultural drought grades (Figure 1). Disaster records were regularly observed by meteorologists at agricultural meteorological stations based on the methods recorded in the Specifications for Agro-Meteorological Observations [42]. Each disaster record included the onset date, location, duration, disaster type, disaster grade, and damaged crop for a given drought event. In addition, some drought information in 2000–2020 was also acquired from the Meteorological Disaster Management System and the Yearbook of Meteorological Disasters in China (from 2004 to 2021). For example, the Yearbook of Meteorological Disasters in China (2016) [43] recorded the following: from 20 June to 20 July 2015, the central and southern parts of Liaoning Province and western Jilin Province experienced severe drought, resulting in poor differentiation of young maize ears. Plants in heavily arid areas showed obvious stunting, with dry leaves and no yield.

2.2.4. Phenophase Observations

The phenophase observations of spring maize (included the dates of planting (V0), third leaf (V3), stem elongation (V6), tassel (VT), milk (R3), and physiological maturity (R6) [44]) at 62 agro-meteorological stations in the GMB from 2000 to 2013 were collected from the China Meteorological Administration (Figure 1). Under certain climate conditions, maize yield is increased due to a prolonged growing season, especially the reproductive growth period. Maize is often harvested late in the farming activities in NEC [45], usually 7–10 days later. The 7–10-day harvest delay can facilitate further dehydration of plants and storage of grains. Therefore, the end of the spring maize growing season was considered to be 10 days after physiological maturity in this study.
The phenophase observations were incomplete at a few stations in some years; therefore, multi-year averages of developmental dates for each station were used during the model construction process. Using the Inverse Distance Weighting algorithm, the multi-year average of spring maize phenophase dates at 62 agricultural meteorological stations were spatially interpolated over the GMB with a spatial resolution of 0.05°. Phenophase dates of the stations without observation records were extracted as the center-point locations.

2.2.5. Yield Data

Due to limitations in data acquisition capabilities, only per unit yield data of cities in Heilongjiang Province (10 cities) and Liaoning Province (12 cities) within the GMB from 2011 to 2020 were collected from the official websites of the Heilongjiang Bureau of Statistics (http://tjj.hlj.gov.cn/, (accessed on 10 July 2024)) and the Liaoning Provincial Bureau of Statistics (https://tjj.ln.gov.cn/, (accessed on 10 July 2024)), respectively.

2.3. Methods

2.3.1. Construction of Drought Samples

Based on the duration, degree, and location of historically observed disaster records for spring maize, a total of 282 drought records from 2000 to 2013 were obtained (including 204 records from 51 conventional disaster recording stations for determining the drought thresholds and 78 records from the Meteorological Disaster Management System for validation). The historical drought record on each day was considered as a drought disaster sample to construct the dynamic threshold model. Correspondingly, each day without a drought record (84493 days in total) during the spring maize growing season from 2000 to 2013 was defined as a drought-free sample.
Among the 204 drought records used to determine the drought thresholds, there were 71 records graded as mild drought, 89 records graded as moderate drought, and 44 records graded as severe drought. Overall, total drought frequency for spring maize from 2000 to 2013 was higher in the central and southern parts of the GMB, and lower in the eastern and northern parts. Most droughts occurred during the third leaf-to-stem elongation (V3–V6) and tassel-to-milk (VT–R3) stages. Maize in the VT–R3 stage requires a large amount of water, and water deficits during this period will hinder the growth and development of maize, directly reducing yield [46].

2.3.2. Drought Threshold Curves

The GMB region has a large coverage area, with longitude and latitude spanning over 18 degrees and 10 degrees, respectively. There are significant differences in the day of year (DOY) of each phenophase observation date for spring maize in different regions of the GMB. When drought occurs on a certain day, spring maize in different regions of the GMB may be in different developmental stages, resulting in different actual impacts of drought. To eliminate the effects of this difference, the number of days after planting (DAP) was normalized to obtain normalized days after planting (NDAP), calculated as:
N D A P = D O Y D O Y 0 D O Y 1 D O Y 0 × 100 ,
where DOY0 is the day of year of planting for spring maize; DOY1 is the day of year 10 days after physiological maturity for spring maize; DOY is the day of year of the observation (which is between DOY0 and DOY1).
The calculation formula for NDWI [16] is:
N D W I = b 2 b 7 b 2 + b 7 ,
where b2 represents the NIR (band 2, 858 nm) band of the MCD43A4 product; b7 represents the SWIR (band 7, 2130 nm) band of the MCD43A4 product. When calculating the results for a county, NDWI is the mean of all spring maize pixels within the entire county.
Because the GMB covers such a large area, there will be differences in climate conditions, planting systems, planting structures, and management practices across the region, resulting in various NDWI ranges of spring maize grown in different regions and years [47]. Similar to the normalization of DAP, NDWI was normalized to obtain the Vegetation Water Index (VWI) in this study in order to eliminate the effects of various differences. The VWI was calculated as [6]:
V W I i , j = N D W I i , j N D W I m i n N D W I m a x N D W I m i n ,
where VWIi,j is the VWI value for a spring maize pixel on day i of year j in a certain region, NDWIi,j is the NDWI value for a spring maize pixel on day i of year j, NDWImin represents the multi-year minimum NDWI from 2000 to 2020, and NDWImax represents the multi-year maximum NDWI from 2000 to 2020. When calculating the results for a county, the VWI is the mean of all spring maize pixels within the entire county.
Finally, four datasets with no drought (drought free), mild drought, moderate drought, and severe drought, determined by NDAP and the VWI, were obtained based on the disaster records and the growing season of spring maize.
Double-logistic function fitting is a time series analysis method [48]. This fitting method has been applied in the remote sensing monitoring of vegetation phenology, and can effectively estimate various parameters related to vegetation phenological events. It has demonstrated wide applicability in estimating biophysical parameters and monitoring vegetation phenology [6,48,49,50]. According to the variation trend of NDWI values with the growth and development of crops, the double-logistic fitting function was used with the four record sequences in this study. The basic function equation is given as:
f t = 1 1 + exp a t b 1 1 + exp c t d ,
where t is NDAP; a , b, c, and d are fitting coefficients, where a and c determine the position of the left and the right inflection points, respectively, and b and d determine the rate of change in the left and the right inflection points, respectively.

2.3.3. Daily Dynamic Thresholds and Its Validation

Drought threshold curves were determined by the mean of adjacent fitting curves (Table 1), and then three threshold curves of mild drought, moderate drought, and severe drought were obtained, as shown in Figure 2.
The VWI thresholds were validated with the validation drought records by evaluating the consistency between the identified results and the historical records of drought disasters. The validation drought records were sourced from the Meteorological Disaster Management System from 2014 to 2020, including disaster location, onset time, end time, description of disaster impact, overview of weather processes, warning release status, affected crops, etc. Daily VWI values for spring maize during the disaster period in a certain area were calculated and drought grades were determined based on Table 1 by comparing VWI values with the drought threshold curves. Considering the long duration of drought processes, the drought grade of each sample was represented by the heaviest drought grade identified by the VWI during the process. If the drought grade monitored by the VWI was the same as actual drought grade, the drought assessment level of spring maize was classified as “Complete correspondence”. If the drought grade monitored by the VWI only differed by one grade, the drought assessment level was classified as “Within one grade”. Otherwise, the drought grade monitored by the VWI was classified as “Inconsistent”. For example, the drought process represented by the dashed line in Figure 2 occurred at an NDAP value of 20–40. Historical records confirmed that severe drought occurred during this period. At point A, with an NDAP value of 32, the VWI measured 0.19. This value fell between the moderate and severe drought threshold curves, leading to a classification of moderate drought for that day. Similarly, at point B, an NDAP value of 36 corresponded to a VWI of 0.22, which was below the threshold for severe drought; thus, the day was identified as experiencing severe drought. Throughout the entire drought process, the VWI’s heaviest identification result was severe drought; therefore, the overall identification result for the entire drought process was severe drought. The verification result of this sample was “Complete correspondence”. Ultimately, the effectiveness of the VWI in identifying drought grades was evaluated by the percentage of “Complete correspondence” and “Within one grade”.

2.3.4. Maize Yield Analysis

Research has shown that agricultural cultivation techniques, field management measures and a variety of maturity types in a certain area in adjacent years generally have little change, and the change in per unit yield is mainly caused by the difference in meteorological conditions [51]. In general, the yield comparison value is used to evaluate the increase (decrease) in yield. The formula is:
Δ Y i = Y i Y N Y N × 100 % ,
where ΔYi is the percentage (%) increase (decrease) in per unit yield of spring maize at a certain site in year i; Yi is the per unit yield of spring maize (kg·ha−2) at a certain site in year i; YN is the average per unit yield of spring maize (kg·ha−2) for a specific time period at a certain site. Due to the fact that the yield in this article only covers from 2011 to 2020, the calculation method for YN is:
Y N = Y i 2 + Y i 1 + Y i + Y i + 1 + Y i + 2 n ,
when i is 2011, Y i 2 and Y i 1 are both 0, and n is 3; when i is 2012, Y i 2 is 0, and n is 4; when i is 2013~2018, n is 5; when i is 2019, Y i + 2 is 0, and n is 4; when i is 2020, Y i + 1 and Y i + 2 are both 0, and n is 3.
When ΔYi < 0, it can be considered that the per unit yield of spring maize of year i was affected by drought. Otherwise, before determining whether the per unit yield of spring maize of year i was affected by drought, it is necessary to comprehensively compare the relationship between per unit yield of year i and that of other years.

3. Results

3.1. Dynamic Threshold Model for Agricultural Drought Grades

3.1.1. Determination of Daily Dynamic Thresholds for Different Drought Grades

The double-logistic function was used to fit VWI values and to determine the daily dynamic thresholds of mild, moderate, and severe drought grades for spring maize in the GMB. The coefficient of determination (R2) values and parameters for VWI values fitted with the double-logistic function for spring maize in the GMB from 2000 to 2013 for drought free, mild drought, moderate drought, and severe drought are shown in Table 2. The R2 values indicated that VWI values were well fitted by all four fitting functions. As drought stress increased, a and c presented increasing and decreasing trends, respectively, following the order of adrought free < amild drought < amoderate drought < asevere drought and cdrought free > cmild drought > cmoderate drought > csevere drought. This pattern indicated that the intensification of drought degree over time might delay the onset of a maximum VWI and lead to an earlier end to the spring maize growing season [6].

3.1.2. Validation of Drought Grades

Based on the drought conditions recorded in the Meteorological Disaster Management System, a total of 78 spring maize drought records from 2014 to 2020 (including 16 records of mild drought, 38 records of moderate drought, and 24 records of severe drought) were extracted to verify the critical thresholds of the VWI for different drought grades (Table 3). Overall, the drought conditions identified through the VWI were basically consistent with the historical records of spring maize drought disasters. Among them, 84.6% of the drought records had the same drought grade as the historical records, and 96.2% of the drought records were within one drought grade, as noted in the historical records. The validation accuracy of moderate drought identified through the VWI was the lowest (76.3%), while the accuracy when considering a difference of one grade level was 94.7%. Due to the fact that the drought conditions were identified by the VWI on a daily basis and reflected the occurrence and development process of drought, there were certain fluctuations in drought level. However, historical records generally reflected the overall drought situation of a large area (city or county) over a longer period of time. Therefore, there might be discrepancies between the drought grades identified by the VWI and the drought grades recorded in some historical drought records. Overall, identification of drought grades for spring maize in the GMB through the VWI exhibited high accuracy.

3.2. Analysis of Historical Drought Events Based on Dynamic Drought Thresholds of VWI

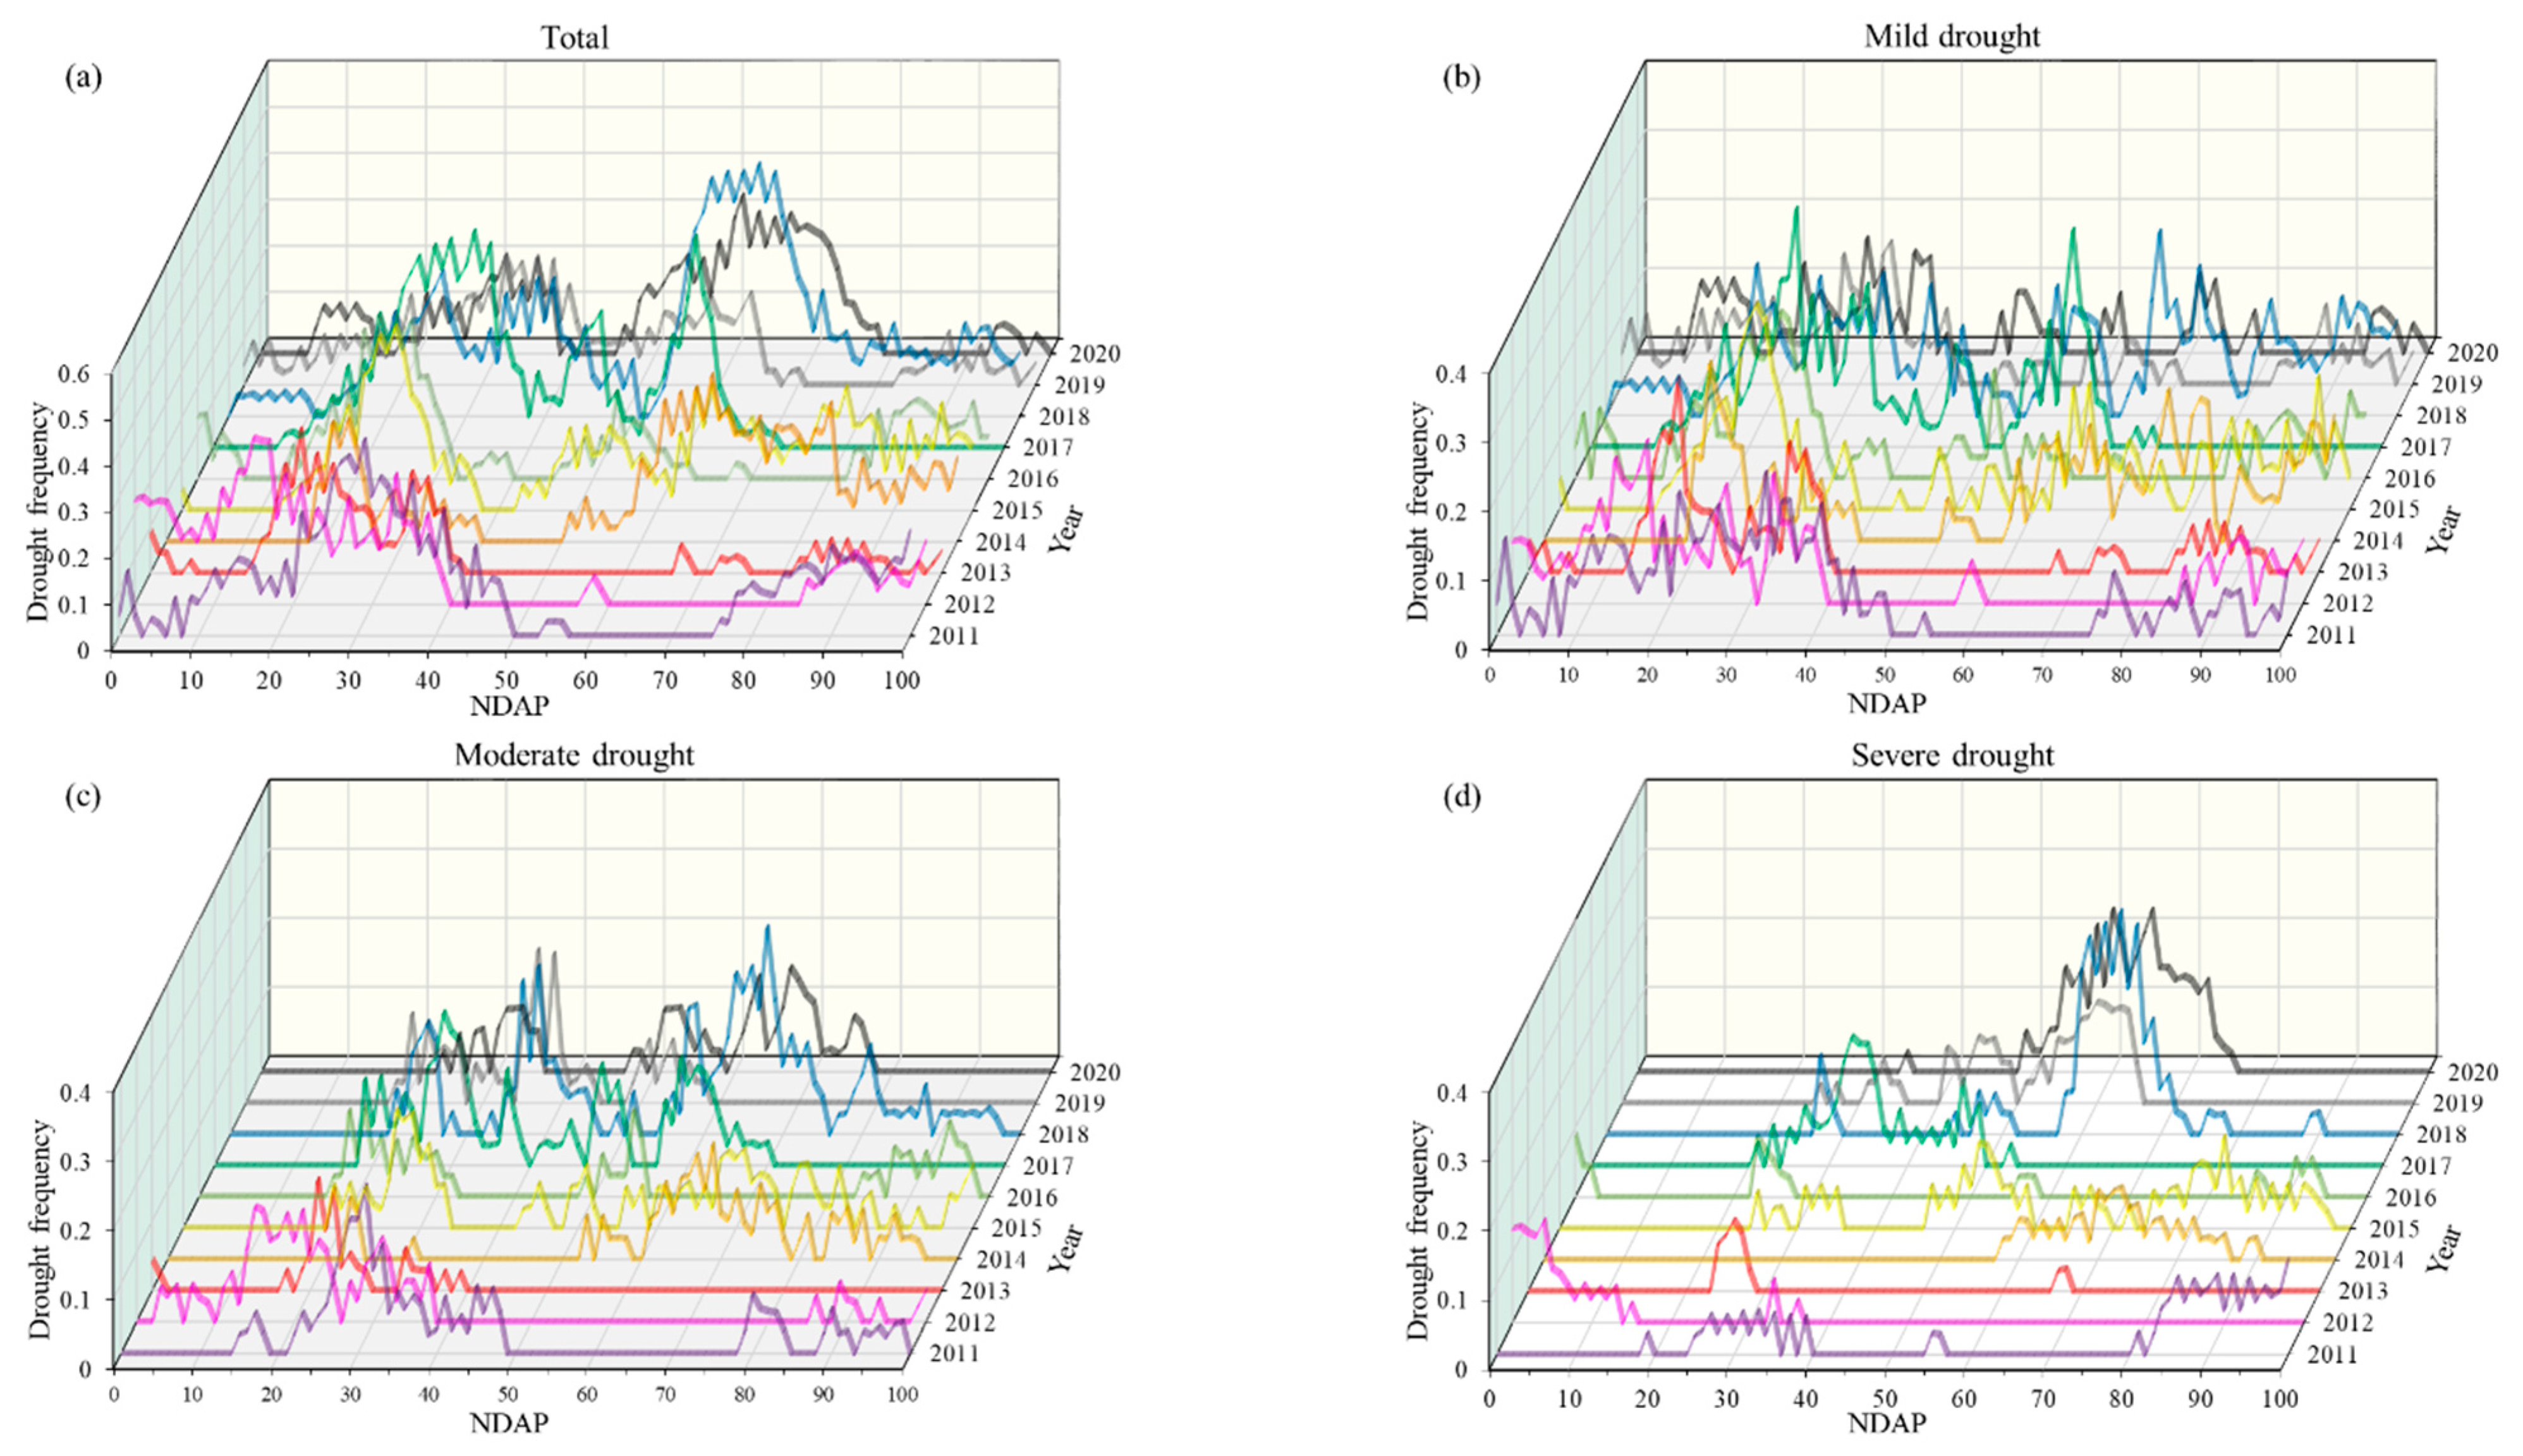
3.2.1. Drought Dynamics at a Typical Station

Taonan City in Jilin Province is located in the central part of the GMB. The drought that occurred in Taonan City in 2017 was well-documented in both the Meteorological Disaster Management System and the Yearbook of Meteorological Disasters in China (2018) [52], offering a relatively complete record of the disaster’s progression. Therefore, the drought process in Taonan City in 2017 was selected to validate the applicability of the VWI for daily identification of drought grades. According to records in the Meteorological Disaster Management System, precipitation in Taonan City beginning in the spring of 2017 had been significantly lower than in previous years. There had been continuous high temperatures and little precipitation since June, resulting in a sharp decrease in soil moisture and a serious impact on crop growth. Some areas even experienced varying degrees of seedling death. The drought was very severe and had a continuous development trend. The drought situation in Taonan City in 2017, identified through the VWI, is shown in Figure 3. In the early spring maize growing season in Taonan City, VWI values were above the mild drought threshold. Therefore, the recognition result of the VWI also indicated that it was a period without drought. Later, the VWI values decreased to the range of mild drought levels. VWI values showed that the occurrence time of drought in Taonan City was even earlier than noted in the historical records. A severe drought occurred in Taonan City from 1 June to 30 June 2017 (NDAP 18–38), as clearly recorded in the Yearbook of Meteorological Disasters in China (2018). The identification results of the VWI during this period showed severe drought, as VWI values usually remained below the threshold curve for severe drought. An 83 mm precipitation event occurred in Taonan City on 20 June (NDAP 31), but it did not immediately alleviate the severe drought effects on maize. Even though the subsequent precipitation alleviated the drought to the moderate drought grade (NDAP 35), the later high temperatures and low precipitation exacerbated the drought to severe drought again. The concentrated precipitation in early August gradually alleviated the drought situation. Finally, the VWI values returned to a drought-free level on 6 August (NDAP 63). The daily dynamic analysis of the drought process in Taonan City by use of the VWI was consistent with the actual observations of drought effects on maize that reflected the characteristics of agricultural drought occurrence and development, as well as the mitigating effect of precipitation on drought.

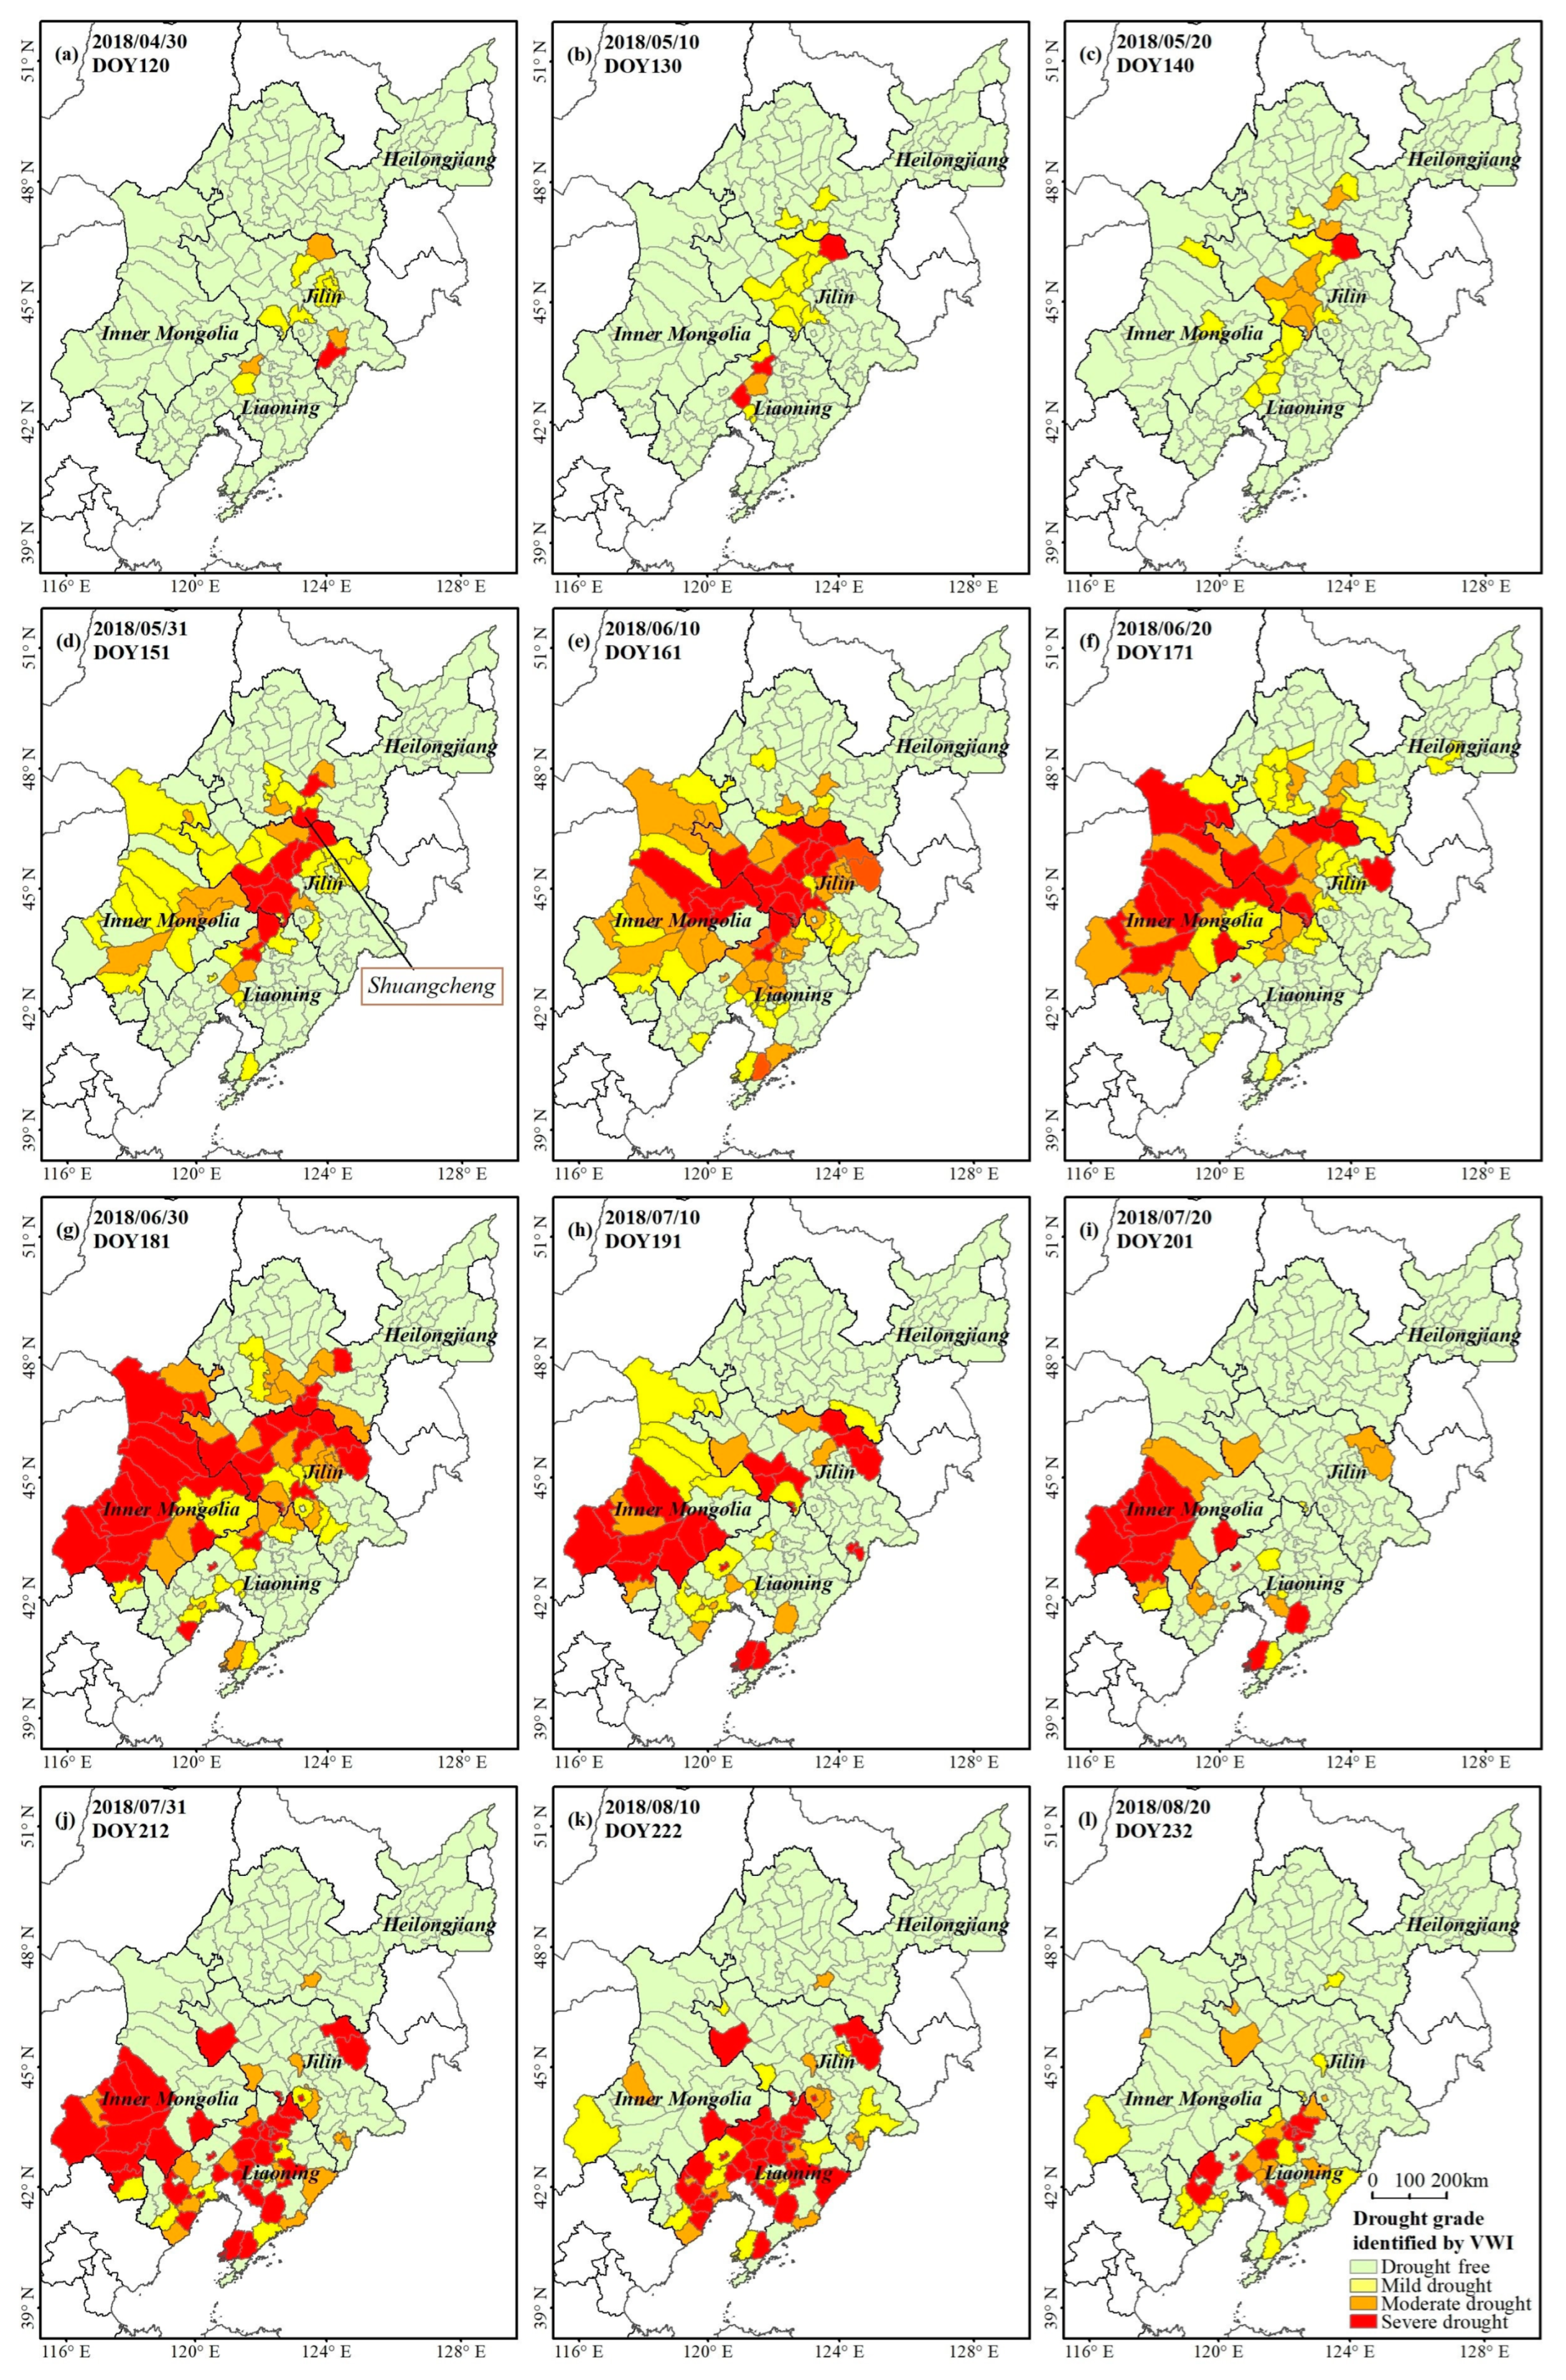
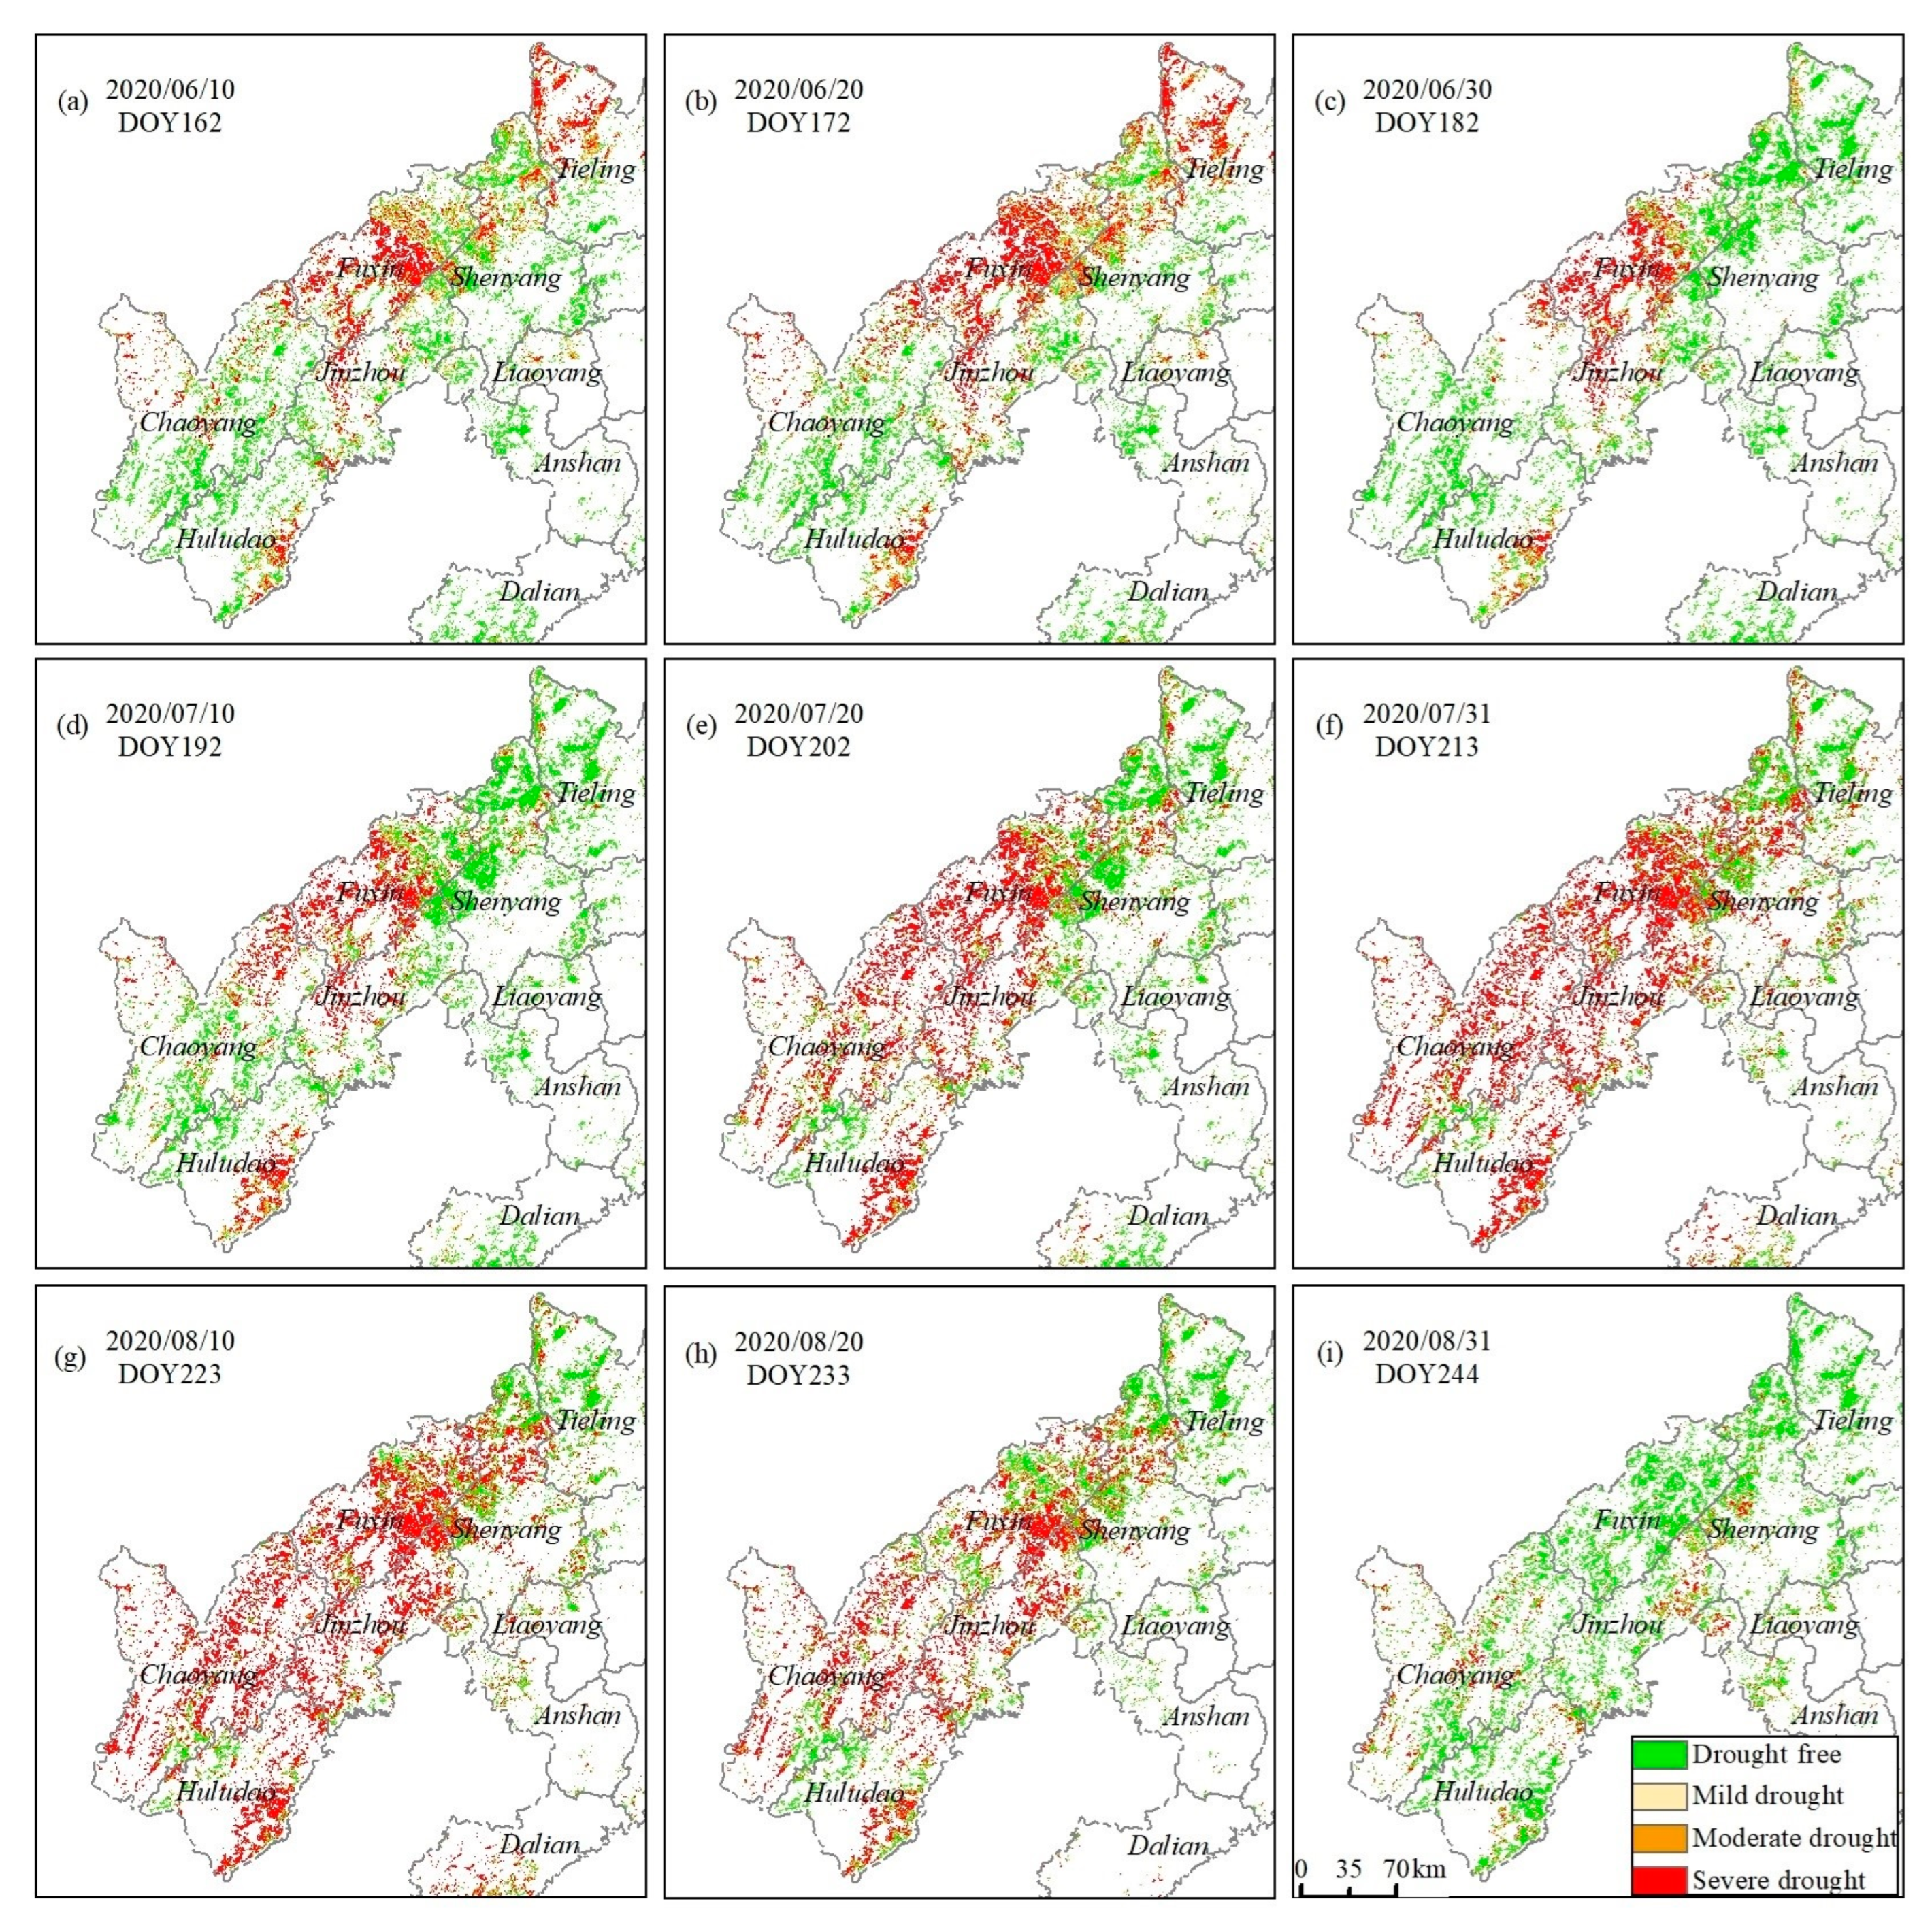
3.2.2. Spatial Evolution of Drought in Typical Drought Years

Daily dynamic thresholds of VWI for identifying different drought grades were determined using disaster records from 2000 to 2013. According to actual disaster records in recent years, the growing season of spring maize in the GMB had been consistently affected by drought every year. In order to ensure the independence and effectiveness of the verification results, the years 2018 and 2020, which were closer to the current time and had detailed disaster records, were selected as typical years to analyze the effectiveness of the VWI in identifying drought grades at regional and pixel scales.
(1) In drought year 2018
Multiple drought processes occurred in the GMB from April to September in 2018 according to regional observations and the Yearbook of Meteorological Disasters in China (2019) [53]. The VWI can dynamically identify the drought grade of spring maize on a daily basis, but due to limited space for this article, Figure 4 only shows the spatial evolution of drought at 10-day intervals. According to historical records, various grades of drought had occurred throughout the spring maize growing season in the Inner Mongolia Autonomous Region. Additionally, Liaoning Province had been experiencing drought since late April (Figure 4a–c), with severe drought in some areas. Although the two precipitation events in late May alleviated the meteorological drought, it can be seen that drought for spring maize had not eased, and the intensity of drought had even increased (Figure 4d). In early July to early August, almost the entire Liaoning Province experienced severe drought (Figure 4g–k). In addition, there was a drought in the southwest part of Heilongjiang Province in May (Figure 4b–d), and some areas in the central and southern regions experienced severe drought at the end of May (Figure 4d). According to historical records, Shuangcheng even experienced a drought disaster on 1 June, which can also be seen in Figure 4d. There was a spring drought in the central region of Jilin Province. In late April to late July, there was moderate-to-severe drought in the western region of Jilin Province (Figure 4a–g). Some areas in the central and southern parts of Jilin Province experienced varying grades of drought in July to early August (Figure 4h–k). Overall, the drought grades identified by the VWI were basically consistent with the actual observation records, including drought in central Jilin Province, and severe drought in most areas of Liaoning Province and southern Heilongjiang Province. Due to the lack of specific descriptions of the impact of drought on crops in the historical disaster records, the drought condition and grade in some areas could not be evaluated. However, the drought identification results of the VWI in these areas were completely consistent with the recorded drought areas, which strongly proved the applicability of the VWI in identifying large-scale drought.
(2) In drought year 2020
According to actual disaster records, a typical drought process occurred in Liaoning Province in 2020 (China Meteorological Administration, 2021) [54], marking the fourth consecutive year of summer drought. Historical records related that this drought event mainly occurred from 1 June to 20 August 2020. Low precipitation in Shenyang, Jinzhou, Fuxin, Chaoyang, and Huludao had resulted in severe drought in the western and north-central regions of Liaoning Province. This drought had had a great impact on maize production in some areas. Moreover, the drought process developed from late June and continued into midsummer, lasting for a long time. Figure 5 shows the spatial evolution process of drought in spring maize planting areas in 2020, identified pixel by pixel using the VWI. The mild, moderate, and severe drought frequencies of spring maize in the GMB for each DOY in 2020 growing season were identified by the VWI, and the results at 10-day intervals are shown in Figure 6. The drought frequency was the number of pixels with different grades of drought occurring at each DOY divided by the total number of maize pixels in western and north-central regions of Liaoning Province. In the first 20 days of June (Figure 5a,b), the western and northern regions of Liaoning Province experienced severe drought, especially in most areas of Fuxin, Tieling, and Shenyang. The precipitation in Tieling and northern Shenyang in late June eased the drought somewhat (Figure 5c). There was little precipitation in the western and north-central regions of Liaoning Province from July to early August, leading to the continuous expansion of drought range and the intensification of drought severity (Figure 5d–g). The precipitation in mid-August eased the drought situation to some extent, but the recovery of crops would take additional time (Figure 5h) [55]. It was not until the end of August that the drought in most areas was alleviated (Figure 5i). These results indicate that the drought events identified by the VWI were basically consistent with the historical records of drought. The VWI could accurately represent the process of drought occurrence, development, and relief. Moreover, the spatial details of the drought identified by the VWI were rich and accurate.

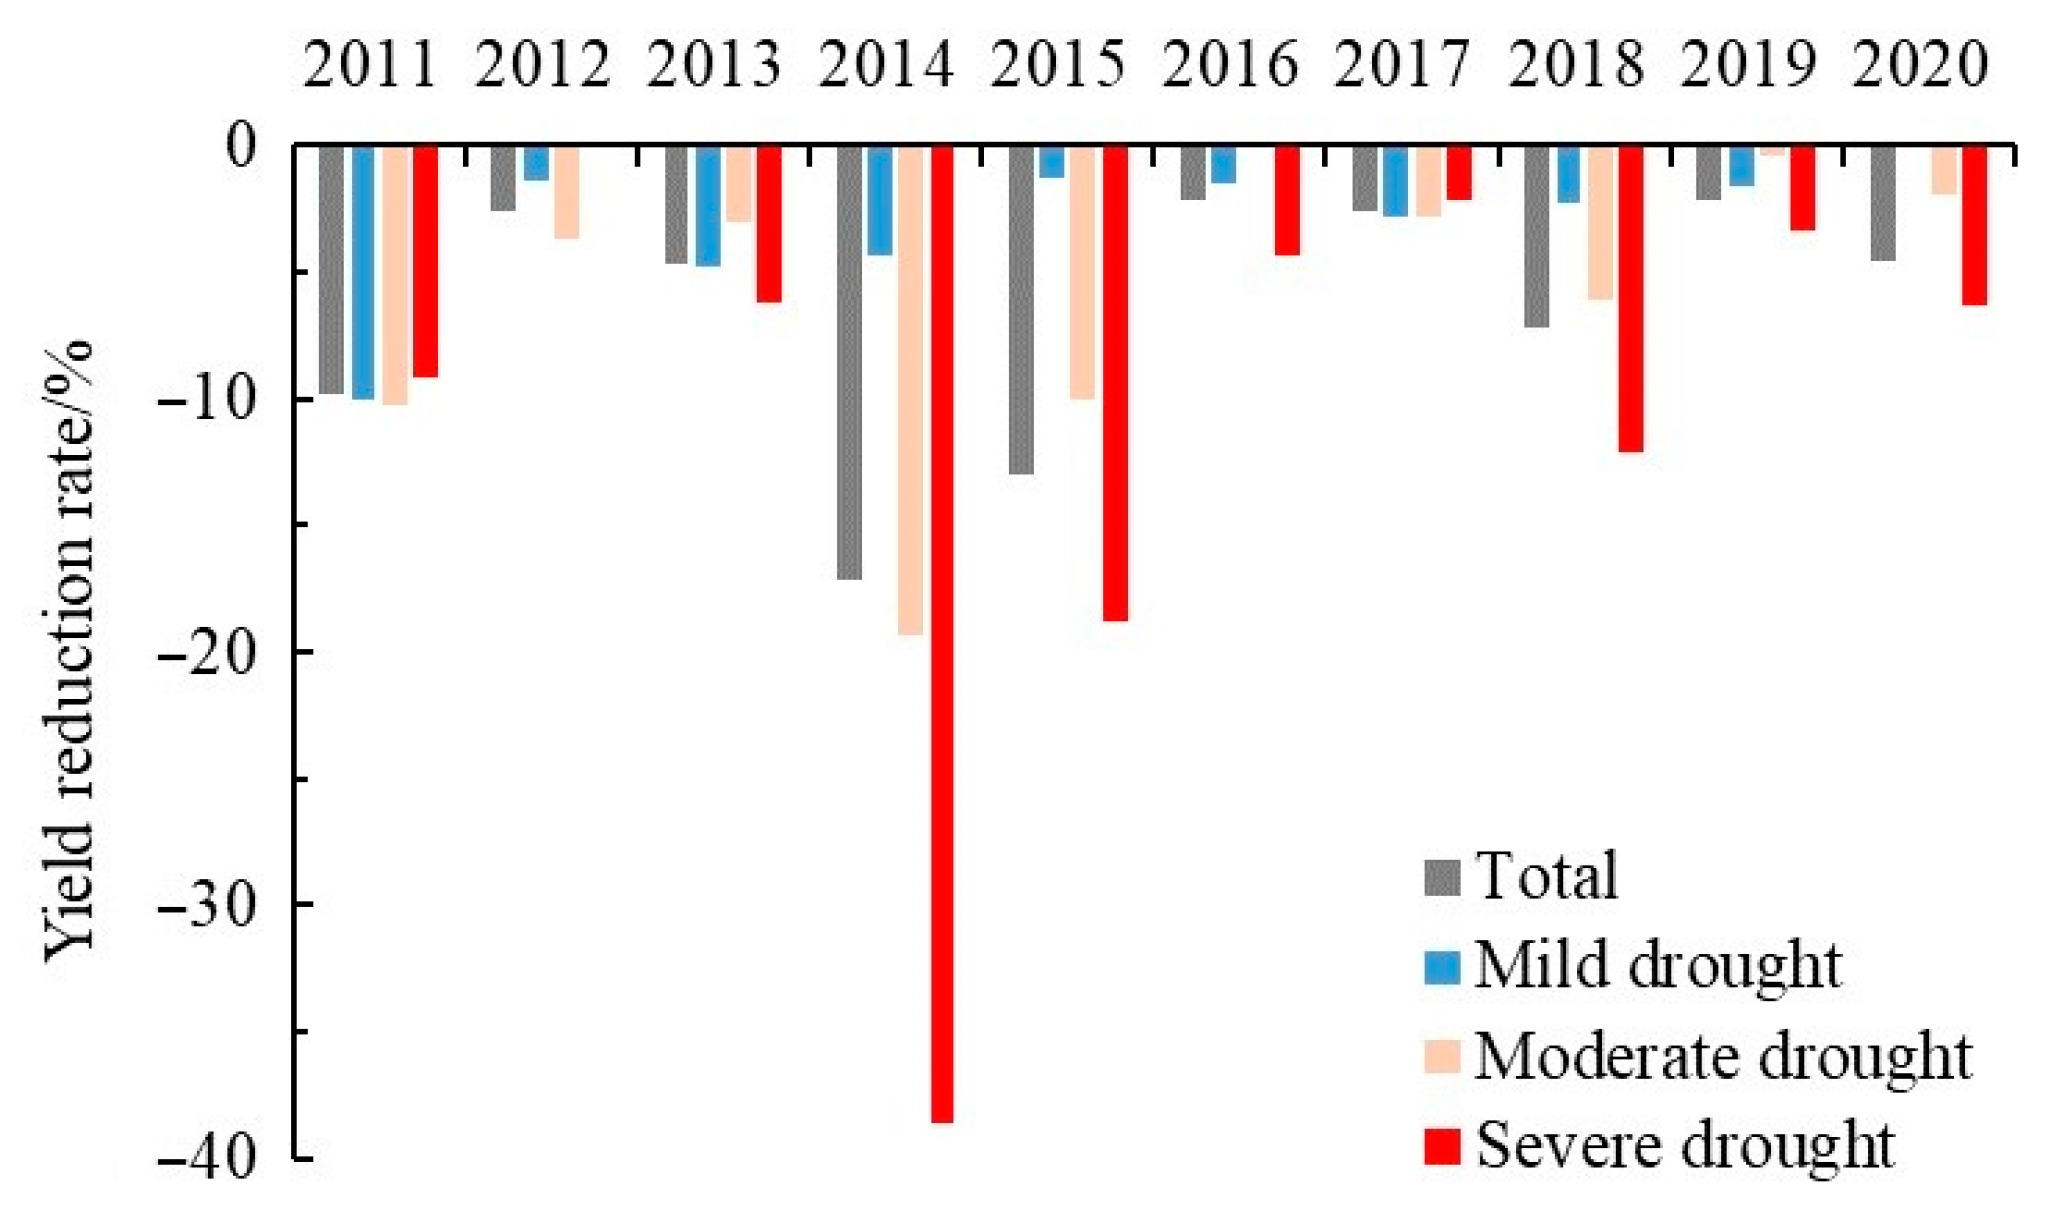
3.2.3. Impact of Drought on Spring Maize Yield

The frequencies of total (all drought grades), mild drought, moderate drought, and severe drought of 22 cities in Heilongjiang Province and Liaoning Province within the GMB for each NDAP in the spring maize growing season from 2011 to 2020, identified by the VWI, are shown in Figure 7. Results showed that the maximum total drought frequency was 55%, which occurred on NDAP 67 in 2018 (Figure 7a). The high-value areas of total drought frequency in the past three years (2018–2020) mainly occurred near NDAP 30 and 65 (near the stem elongation stage (V6) and milk stage (R3), respectively). As drought stress increased, drought frequency generally presented a decreasing trend, following the order of fmild drought > fmoderate drought > fsevere drought, except for the order of fmild drought > fsevere drought > fmoderate drought in 2020 (Figure 7b–d). Drought can inhibit the growth of maize, often leading to delayed development and stunted plants, which in turn have a certain impact on yield [56]. Based on production data, a total of 220 samples were obtained for the per unit yield of the 22 cities from 2011 to 2020 (100 samples in Heilongjiang Province and 120 samples in Liaoning Province). The recognition results of the VWI showed that 110 samples had experienced drought. Comparing the per unit yield of a city in a certain year with the average per unit yield of the specific time period, results showed that 65 of the 110 (59.1%) drought samples showed a decrease in yield due to the impact of drought. Among them, 45 and 65 samples from Heilongjiang Province and Liaoning Province experienced drought, respectively. Moreover, there were 26 (57.8%) and 39 (60.0%) samples in Heilongjiang Province and Liaoning Province, respectively, whose yields had been affected by drought.
The average rates of maize yield reduction were calculated for 22 cities with mild, moderate, and severe droughts in each year (Figure 8). The highest average yield reduction rates for all drought grades, mild drought, moderate drought, and severe drought were −17% in 2014, −10% in 2011, −19% in 2014, and −39% in 2014, respectively. The yield reduction rate caused by severe drought was generally high. Among them, the recognition results of the VWI showed that Huludao City in Liaoning Province experienced severe drought in 2014, with a per unit yield 58% lower than the average of nearly five years (2012–2016).

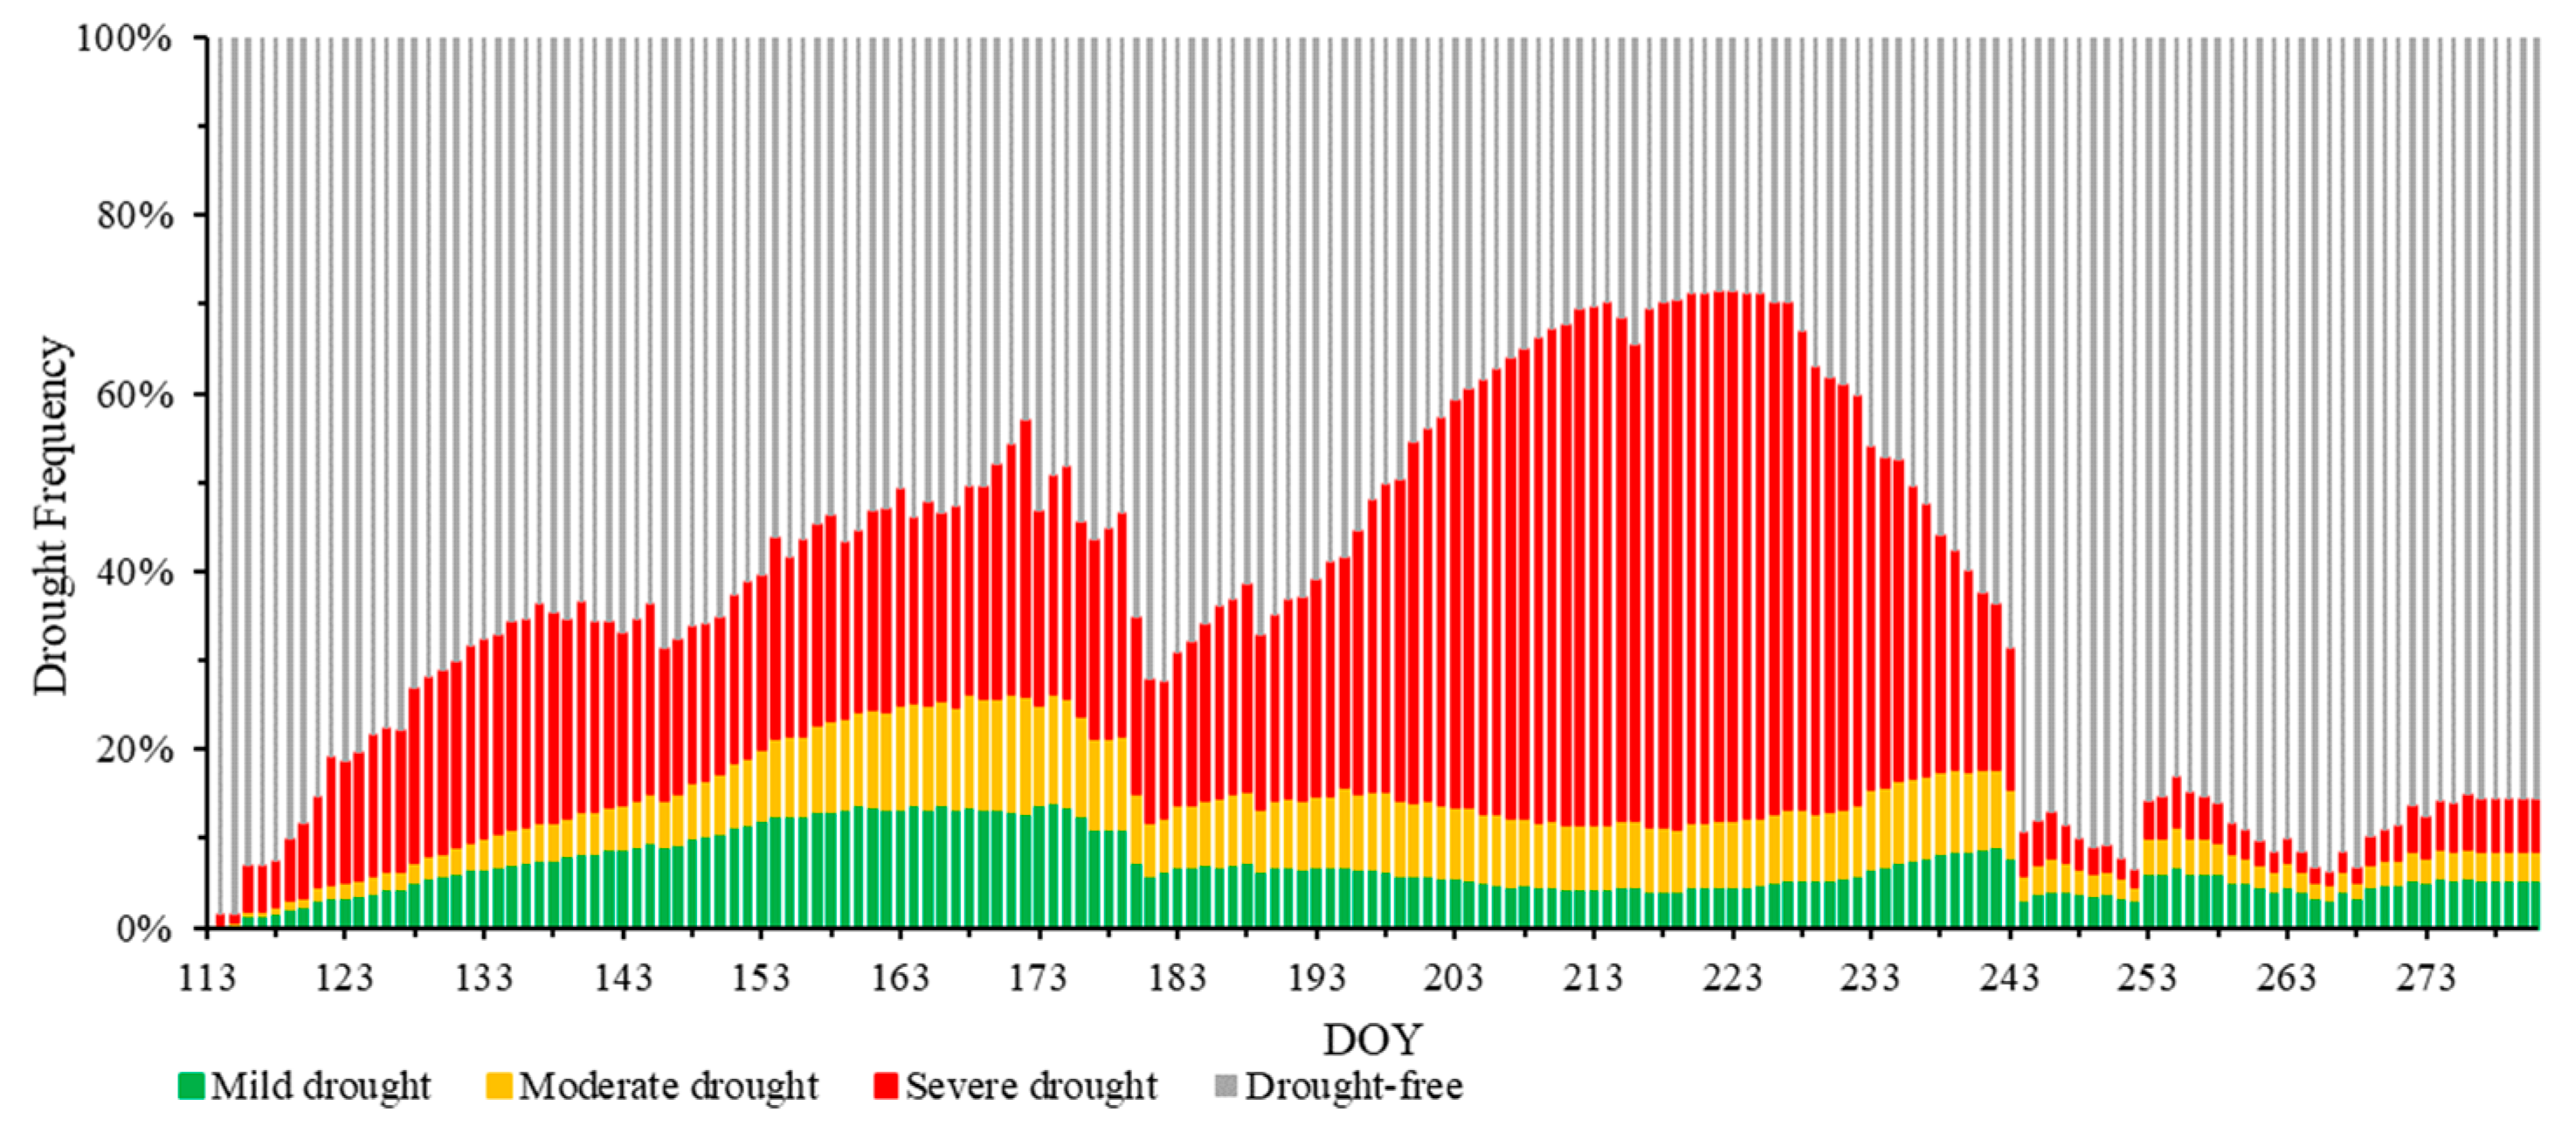
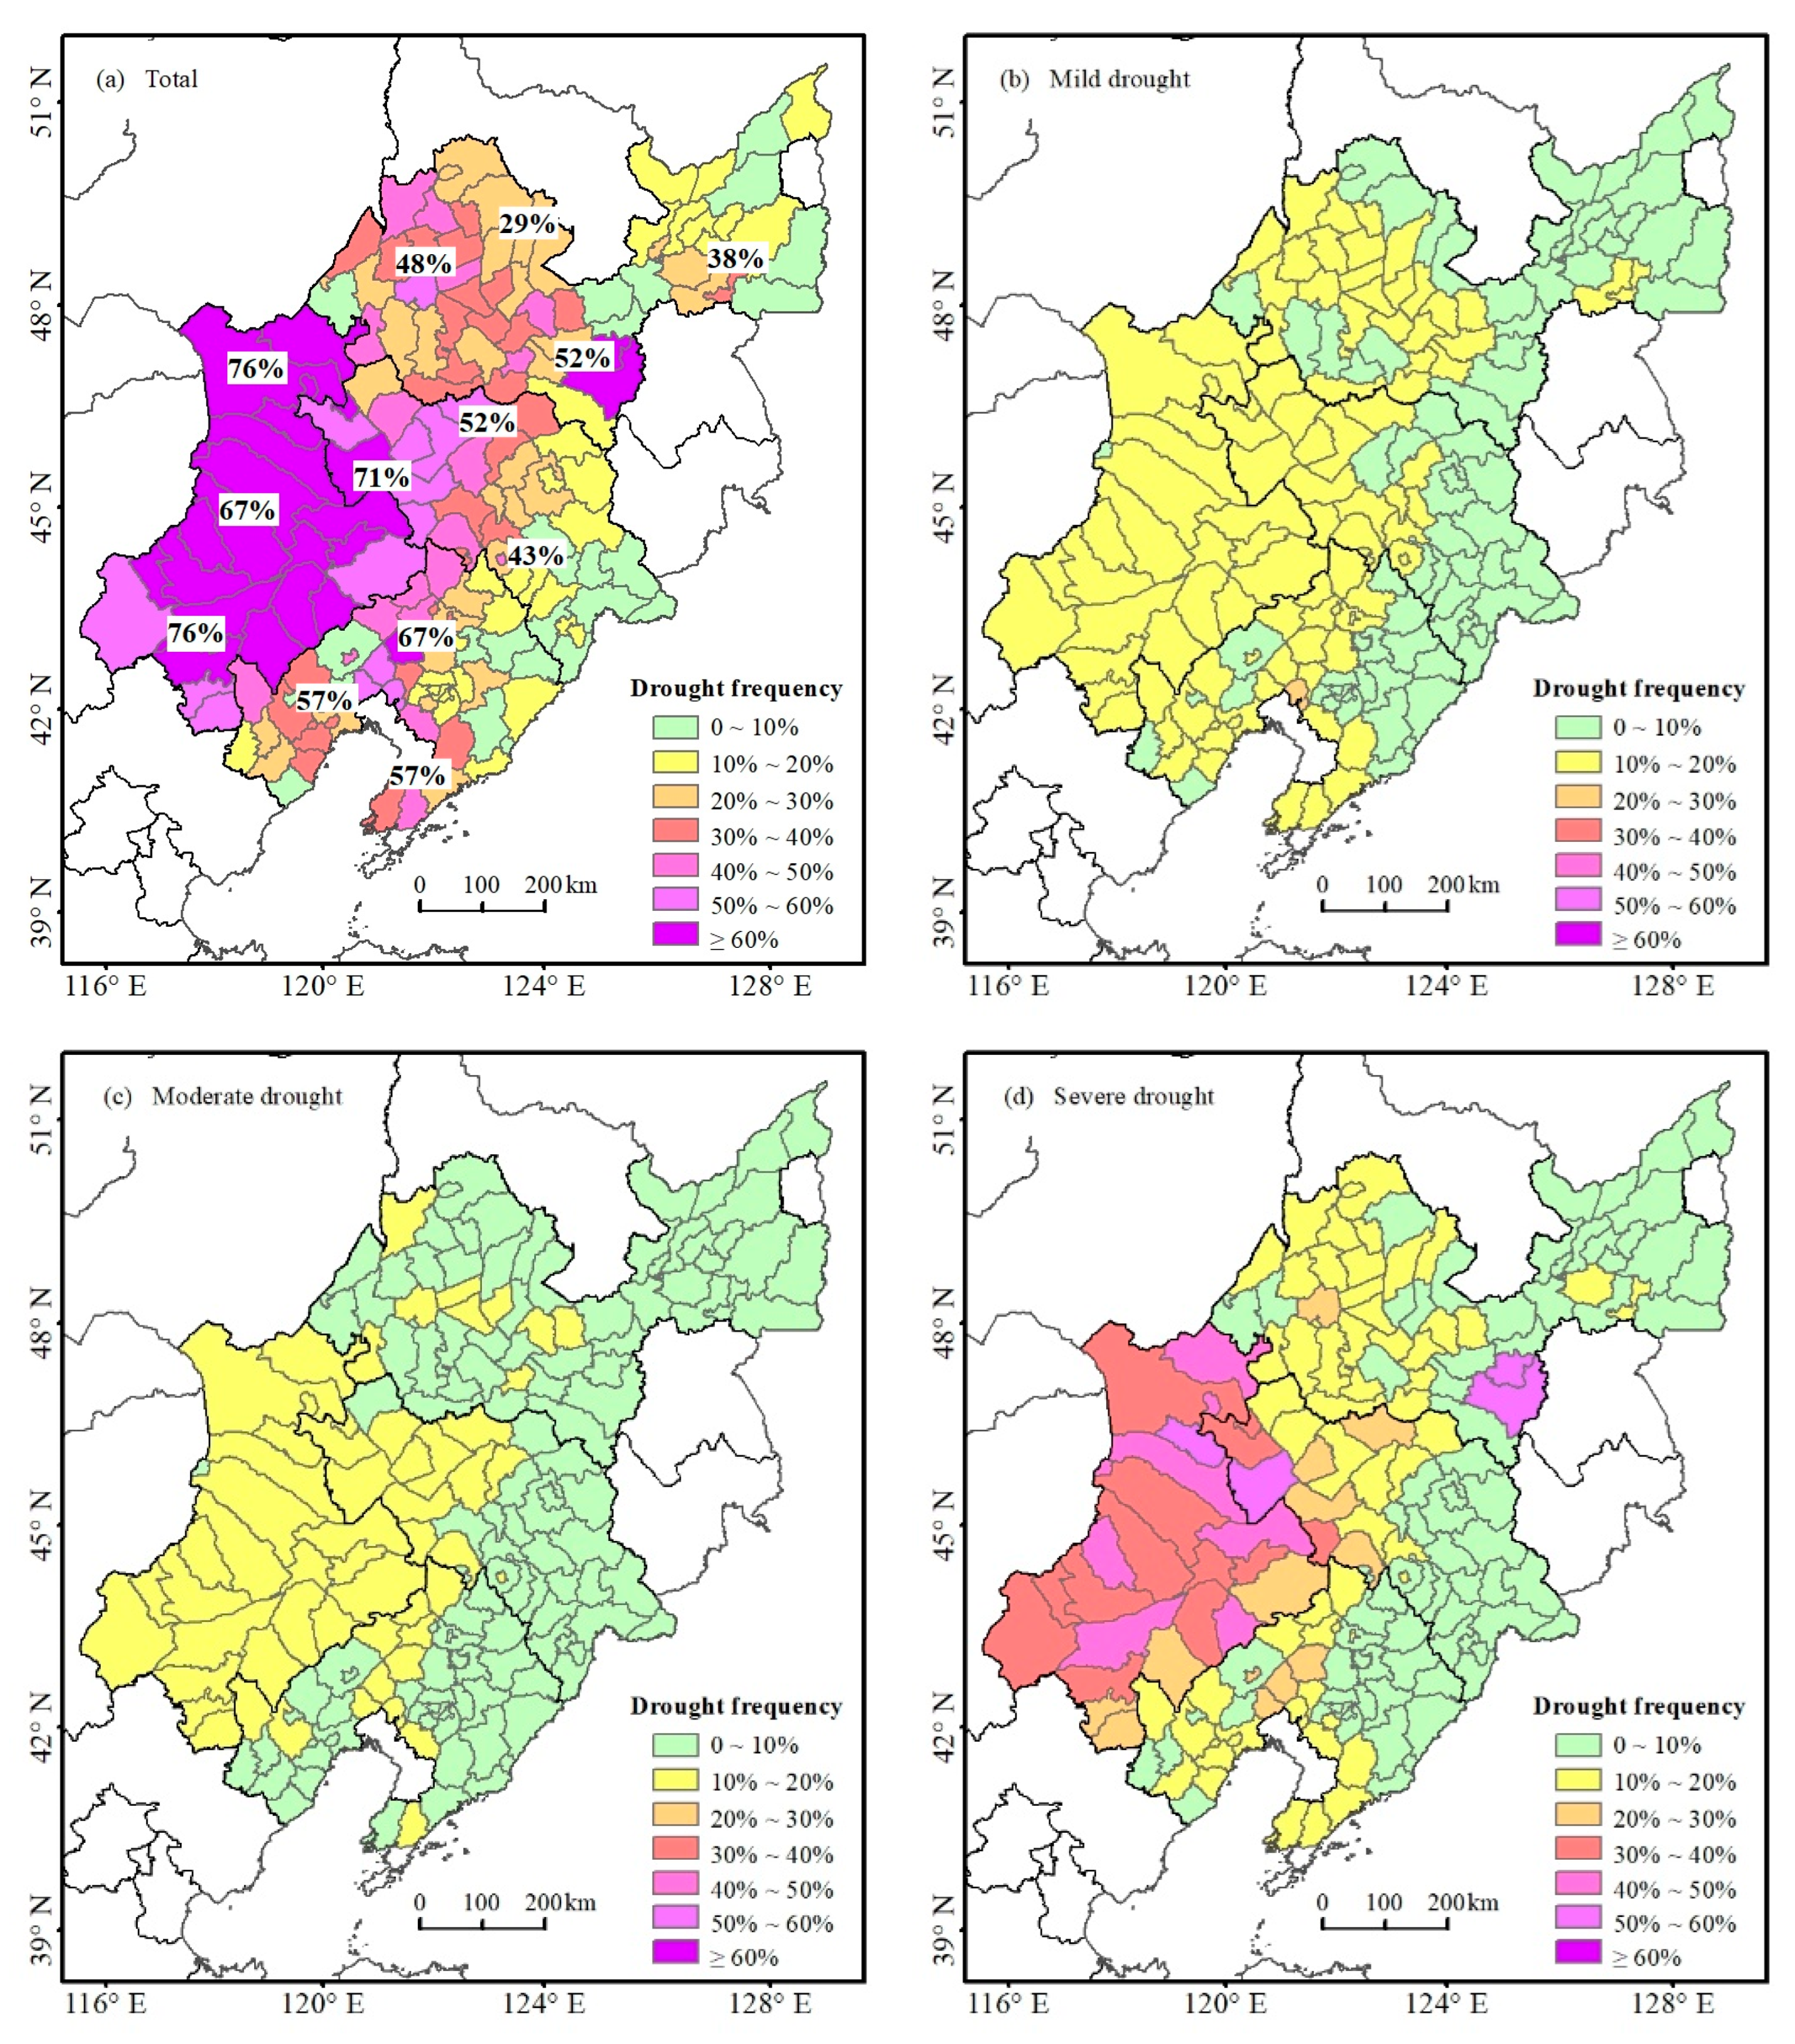
3.3. Distribution Characteristics of Drought Identified by VWI in 2000–2020

The drought status of 168 counties in the GMB from 2000 to 2020 was analyzed using the VWI and daily dynamic thresholds of different drought grades. Drought frequency of each county was the proportion of the years with drought as a fraction of the total number of years from 2000 to 2020. The spatial distributions of the frequencies of total (all drought grades), mild drought, moderate drought, and severe drought for spring maize in the GMB are shown in Figure 9.
Drought frequency showed an overall increasing trend from east to west in 2000–2020 (Figure 9a), which was consistent with the previous research of Li et al. (2020) [57] and the records in the Yearbook of Meteorological Disasters in China from 2003 to 2020 and the Meteorological Disaster Management System from 2000 to 2020 (the numbers displayed in Figure 9a). Drought frequencies in the northeastern and southeastern regions of the GMB were generally lower than 20% (a total of 52 counties). In the northern, central, and southern regions of the GMB, drought frequencies were generally 20–60%. The number of counties with drought frequencies of 20–40% (a total of 60 stations) was more than the number of counties with drought frequencies of 40–60% (a total of 32 stations). Drought frequencies in the western part of the GMB and for two stations at the southern part of Heilongjiang Province were higher than 60% (a total of 24 counties). The frequencies of mild drought for counties in the eastern GMB and parts of the central GMB were generally less than 10% (a total of 71 counties), while the remaining majority of counties had mild drought frequencies of 10–20% (a total of 96 counties). In addition, a county in the central part of Liaoning Province had a mild drought frequency of 20–30% (Figure 9b). Similar to the distribution characteristics of mild drought frequency, moderate drought frequency also showed an overall increasing trend from east to west (Figure 9c). There were 112 and 56 counties with moderate drought frequencies of 0–10% and 10–20%, respectively. The frequency of severe drought in the GMB also showed a distribution pattern of high in the west and low in the east (Figure 9d). Moreover, the frequency of severe drought for some counties was higher than the frequencies of mild and moderate drought, especially in the western part of the GMB.

4. Discussion

This study constructed a daily dynamic threshold model (VWI) for agricultural drought grades based on NIR and SWIR bands, and for monitored spring maize drought in the GMB in NEC. In the process of determining thresholds for different drought grades, historical actual drought records at 51 conventional disaster recording stations in the GMB from 2000 to 2013 were used to determine the thresholds suitable for monitoring agricultural drought for spring maize. Drought records in the Meteorological Disaster Management System from 2000 to 2020 and the Yearbook of Meteorological Disasters in China from 2003 to 2020 were used for validation of drought occurrence and severity.
Due to the strong absorption of water in the SWIR band, the SWIR band was highly sensitive to variations in vegetation water content [27,29,58]. Therefore, NDWI calculations based on NIR and SWIR bands are suitable for estimating crop water content [26,27,29,30] and evaluating vegetation drought [6,28,59]. At present, the daily drought monitoring index for various summer maize drought grades in the Huang-Huai-Hai Plain constructed using the NDWI had achieved good application results [6]. Due to differences in planting systems and climate, spring maize in different regions or development stages may have different tolerances to drought, and drought thresholds might also be different. Therefore, standardizing the days after planting (NDAP) and NDWI values (VWI) of spring maize in different regions could reduce the differences in results caused by regional and climatic conditions [6]. The dynamic changes in the daily drought threshold curves for three drought grades obtained using a double-logistic fitting function were consistent with the natural growth process of crops [6,48,49,50]. The three drought threshold curves had relatively small differences in the early spring maize growing season (small NDAP) due to the close VWI values for maize at this stage. The differences in the three drought threshold curves increased with spring maize growth and development [6,28], and all three curves reached their peak and then decreased in the mid-to-late growing season (VT–R3 stage). Compared with existing fixed threshold or fixed-stage threshold drought indices [8,9,28,38], the smooth and dynamic characteristics of drought thresholds for the VWI were more consistent with the growth and development process of crops and their response to drought [6].
The VWI constructed based on actual drought disaster records reflected the impact of agricultural drought on spring maize and provided an objective assessment of drought duration and intensity. Validation results exhibited high accuracy (84.6% of the records were completely consistent with historical records when considering drought levels, and 96.2% of the records differed by only one drought grade). The recognition grade of most samples with inconsistent verification results was lower than that of historical records. Monitoring results of drought in southwestern China using the NDWI also showed that drought grade monitored by the NDWI was relatively lower compared to actual drought grade [32]. The main reason is that the NDWI monitors the water content of vegetation canopy. There may not be a significant change in leaf moisture when drought occurs. Due to the process of changes in vegetation canopy moisture, there is a certain lag in response to drought [60]. In addition, the changes in drought also have a certain process. However, historical drought records are usually the most severe state throughout the entire drought process, which is another reason for the lower recognition grade of the VWI.
As a slow-forming natural disaster, drought not only has a slow and cumulative impact on crops, but also requires a certain amount of time for crop recovery after obtaining sufficient precipitation, and this process can be reflected in the calculated changes in the VWI [55]. The daily dynamic analysis of historical drought processes through the VWI reflected the characteristics of agricultural drought occurrence, development, and relief, as well as the actual effects of drought on crops (Figure 3). The temporal and spatial evolution verification results of typical drought processes indicated that daily VWI values could perfectly reflect the actual spring maize yield losses caused by drought disasters, and could be used for monitoring and evaluating disaster losses within a region (Figure 4 and Figure 5). The recognition of drought processes at the pixel scale through the VWI displayed rich and accurate detailed features in space that also strongly demonstrated the potential application of the VWI at a precise pixel level (Figure 5). In addition, the analysis results of the occurrence, development, and relief of drought during the spring maize growing season using the VWI conformed to actual recorded situations. These research results will provide theoretical guidance for drought monitoring and will be a significant reference for maize production and management in the GMB.
The phenophase observations used in the calculation process were determined as the multi-year average values for each research station. However, due to the large span of longitude and latitude in the study area [1], there might be significant differences in thermal resources, crop rotation systems, water resources, etc., in different regions. Therefore, there might be significant differences in the dates of maize phenology at different stations in the same year and the same station in different years. The errors caused by using the same maize phenology dates at the same station could be ignored when the climate and management were similar in different years. However, certain errors might be inevitable when a meteorological disaster occurs. The method of normalizing the number of DAP in this study could, to some extent, solve this problem; this strategy has also been confirmed in previous studies [6].
The historical disaster scenarios used in this study came from observation records from agricultural meteorological stations, relevant records in the Meteorological Disaster Management System, and the Yearbook of Meteorological Disasters in China. The actual onset and end dates, locations, and grades of the recorded droughts might not be sufficiently accurate [7,8]. Moreover, most of the recorded events were of significant impact. Mild drought could be identified by the VWI, but might not be reflected in the historical records, resulting in inconsistent validation results for some records [7]. Fortunately, the historical drought records from 2000 to 2013 used to construct the VWI accurately recorded the locations, onset dates, end dates, and drought grades of disasters, enabling us to construct daily dynamic thresholds for mild drought, moderate drought, and severe drought. Research results indicated that the VWI could reflect the actual occurrence, severity, and distribution of spring maize drought in the GMB on a daily time scale, and could be used to monitor and evaluate disaster losses within the region.
The observations from the agricultural meteorological stations and the records in the disaster yearbooks used in this study were consistent with the sources and formats used in reference [6], sharing similar limitations and challenges. However, the current research also incorporates data from the China Meteorological Data Sharing Service System to enhance the dataset’s comprehensiveness. In the process of constructing and validating the VWI indicators, samples with detailed disaster descriptions and accurate time records were selected as much as possible to improve the usability and credibility of the VWI. In subsequent research, the dataset will also be further expanded and standardized to make more robust data available for future studies. While the focus of reference [6] was on the construction and validation of drought indicators, the present research differs in geographical scope and has expanded data sources. Moreover, the application of the VWI in this study is pivotal, encompassing the impact of drought on yields and the drought characteristics in the GMB from 2000 to 2020.
Different seasons and degrees of drought have different impacts on the growth and yield of maize. Research has shown that delaying the emergence period by 1 day results in a 2.9% decrease in the per unit yield of maize [61]. Severe summer drought may lead to a significant reduction in yield, with a reduction rate of 39.6%. Furthermore, continuous drought in spring, summer, and autumn almost causes crop failure, with a reduction rate of up to 70.5% [62]. When analyzing the impact of drought on yield in this article, the reduction in yield was attributed to drought, without considering the impact of other disasters. Historical records showed that due to the summer drought occurring during a critical period of maize yield formation in 2014, maize production in severely drought-affected areas had decreased. The impact of drought has been the most severe in the past five years. Taking Huludao, Liaoning Province, as an example, the identification results of the VWI showed that spring maize in Huludao City experienced persistent drought during the V6-R3 stage in 2014, with a prolonged period of severe drought. Although the drought was alleviated in the later stage, the VWI was near the threshold of mild drought, resulting in a per unit yield 61% lower than the average per unit yield from 2011 to 2014 (collected yield data started from 2011). The impact of drought identified through the VWI on yield was basically consistent with historical records.
In future research, it will be necessary to integrate multi-source remote sensing data and meteorological data in order to generate more accurate and spatiotemporally continuous products [9,63]. With the continuous updating and improvement of spring maize observation data, it is necessary to update disaster records over time to further verify the accuracy of the VWI in identifying drought grades. In addition, the impact mechanism of drought on yield and quality is complex, and further research is needed to understand the impact mechanism of drought on crops. This is conducive to a comprehensive understanding and revelation of the impact of drought on crops, and is of great significance for further improving crop drought resistance and cultivating drought-resistant varieties.

5. Conclusions

The dynamic threshold model for the VWI based on NIR and SWIR bands was constructed for the daily agricultural drought monitoring of spring maize in the GMB in NEC. The VWI constructed through normalizing the NDWI and DAP can reduce the differences in results caused by regional or climatic conditions. Based on actual historical drought data, daily dynamic thresholds for different drought grades were determined using a double-logistic fitting function. Validation results based on drought records collected from the Meteorological Disaster Management System and the Yearbook of Meteorological Disasters in China exhibited high accuracy when using the VWI to identify drought grades. Of all of the validation records, 84.6% were completely consistent with the historical records regarding drought grade, and 96.2% of the records differed by only one drought grade level. The validation of drought processes at both regional and pixel scales also strongly proved that the VWI could reasonably reflect the occurrence, development, and relief process of drought in spring maize cultivation. The VWI could be used for drought disaster monitoring and evaluation. In addition, the overall analysis of drought during the spring maize growing seasons from 2000 to 2020 using the VWI showed that drought frequency in the GMB gradually increased from east to west. The results of this study can not only be used for the daily dynamic monitoring of agricultural drought for spring maize, but also well reflect the impact of drought on the yield of spring maize. The results provide theoretical guidance for drought monitoring, and also contribute to timely and effective drought warning and to the formulation of strategies for dealing with drought during the spring maize growing season.

Author Contributions

Conceptualization, P.W. and J.G.; data curation, X.W., Y.G., Y.Z., Q.W. and Y.L.; formal analysis, X.W.; funding acquisition, P.W.; methodology, X.W., P.W., Y.G. and Y.Z.; software, X.W. and S.H.; validation, X.W. and P.W.; visualization, X.W. and P.W.; writing—original draft, X.W. and Y.G.; writing—review and editing, P.W. All authors have read and agreed to the published version of the manuscript.

Funding

This research was funded by the National Key Research and Development Program of China (2022YFD2001003), the National Natural Science Foundation of China (32171916), the Special Project for Innovation and Development of CMA (CXFZ2024J050), the Basic Research Fund of CAMS (2023Z014 and 2024Z001), the Science and Technology Development Fund of CAMS (2023KJ025 and 2024KJ010), and the Key innovation team of the China Meteorological Administration (CMA2024ZD02).

Data Availability Statement

Data are available at Nadir BRDF-Adjusted Reflectance (nasa.gov) (last visited on 10 May 2023).

Acknowledgments

We would like to thank the reviewers for their constructive comments and suggestions, which have improved the quality of the article.

Conflicts of Interest

The authors declare no conflicts of interest.

References

  1. Wang, F.; Wang, C.Y.; Wu, D.R.; Yao, S.R.; Bai, Y.M.; Zhang, J.Q. Difference and cause analysis of drought characteristics during growth period between the corn belts of China and the United States in Past 30 Years. Chin. J. Agrometeor. 2018, 39, 398–410. [Google Scholar]
  2. Liu, X.; He, X.M.; You, S.C. Characteristics of agricultural meteorological disasters in China from 1976 to 2015. Chin. J. Agrometeor. 2017, 38, 481–487. [Google Scholar]
  3. Zhang, J.P.; He, Y.K.; Wang, J.; Zhao, Y.X.; Wang, C.Y. Impact simulation of drought at different growth stages on grain formation and yield of maize. Chin. J. Agrometeor. 2015, 36, 43–49. [Google Scholar]
  4. Wang, C.Y.; Lou, X.R.; Wang, J.L. Influence of agricultural meteorological disasters on output of crop in China. J. Nat. Disaster 2007, 16, 37–43. [Google Scholar]
  5. Seneviratne, S.I.; Zhang, X.; Adnan, M.; Badi, W.; Dereczynski, C.; Luca, A.D.; Ghosh, S.; Iskandar, I.; Kossin, J.; Lewis, S.; et al. Weather and Climate Extreme Events in a Changing Climate//IPCC Climate Change 2021: The Physical Science Basis; Cambridge University Press: Cambridge, MA, USA, 2021. [Google Scholar]
  6. Zhang, Y.D.; Wang, P.J.; Chen, Y.Y.; Yang, J.Y.; Wu, D.R.; Ma, Y.P.; Huo, Z.G.; Liu, S.X. Daily dynamic thresholds of different agricultural drought grades for summer maize based on the Vegetation Water Index. J. Hydrol. 2023, 625, 130070. [Google Scholar] [CrossRef]
  7. Wu, X.; Wang, P.J.; Huo, Z.G.; Wu, D.R.; Yang, J.Y. Crop Drought Identification Index for winter wheat based on evapotranspiration in the Huang-Huai-Hai Plain, China. Agric. Ecosyst. Environ. 2018, 263, 18–30. [Google Scholar] [CrossRef]
  8. Wu, X.; Wang, P.J.; Gong, Y.D.; Yang, J.Y. Analysis of drought identification and spatio-temporal characteristics for summer corn in Huang-Huai-Hai Plain in year of 1961–2015. Trans. Chin. Soc. Agric. Eng. 2019, 35, 189–199. [Google Scholar]
  9. Wu, X.; Wang, P.J.; Ma, Y.P.; Gong, Y.D.; Wu, D.R.; Yang, J.Y.; Huo, Z.G. Standardized relative humidity index can be used to identify agricultural drought for summer maize in the Huang-Huai-Hai Plain, China. Ecol. Indic. 2021, 131, 108222. [Google Scholar] [CrossRef]
  10. Wayne, C.P. Keeping track of crop moisture conditions, Nationwide: The new crop moisture index. Weatherwise 1968, 21, 156–161. [Google Scholar]
  11. Garen, D.C. Revised Surface-Water Supply Index for western United States. J. Water Resour. Plan. Manag. 1993, 119, 437–554. [Google Scholar] [CrossRef]
  12. Mckee, T.B.; Doesken, N.J.; Kleist, J. The relationship of drought frequency and duration to time scales. In Proceedings of the Eighth Conference on Applied Climatology, Anaheim, CA, USA, 17–22 January 1993. [Google Scholar]
  13. Akinremi, O.O.; Mcginn, S.M.; Barr, A.G. Evaluation of the Palmer Drought Index on the Canadian prairies. J. Clim. 2009, 9, 897–905. [Google Scholar] [CrossRef]
  14. Wu, R.J.; Shi, J.Q.; Guan, F.L.; Yao, S.R. Integrated index construction and zoning of drought risk: A case study of winter wheat area in Hebei Province. J. Nat. Disaster 2013, 22, 145–152. [Google Scholar]
  15. Rouse, J.; Haas, R.; Schell, J.; Deering, D. Monitoring Vegetation Systems in the Great Plains with ERTS; NASA Special Publication: Washington, DC, USA, 1974. [Google Scholar]
  16. Gao, B.-C. NDWI-A Normalized Difference Water Index for remote sensing of vegetation liquid water from space. Remote Sens. Environ. 1996, 58, 257–266. [Google Scholar] [CrossRef]
  17. McVicar, T.R.; Bierwirth, P.N. Rapidly assessing the 1997 drought in Papua New Guinea using composite AVHRR imagery. Int. J. Remote Sens. 2001, 22, 2109–2128. [Google Scholar] [CrossRef]
  18. Sandholt, I.; Rasmussen, K.; Andersen, J. A simple interpretation of the surface temperature/vegetation index space for assessment of surface moisture status. Remote Sens. Environ. 2002, 79, 213–224. [Google Scholar] [CrossRef]
  19. Su, Z.; Yacob, A.; Wen, J.; Roerink, G.; He, Y.B.; Gao, B.H.; Boogaard, H.; Diepen, C. Assessing relative soil moisture with remote sensing data: Theory, experimental validation, and application to drought monitoring over the North China Plain. Phys. Chem. 2003, 28, 89–101. [Google Scholar] [CrossRef]
  20. Brown, J.F.; Wardlow, B.D.; Tadesse, T.; Hayes, M.J.; Reed, B.C. The Vegetation Drought Response Index (VegDRI): A new integrated approach for monitoring drought stress in vegetation. GISci. Remote Sens. 2008, 45, 16–46. [Google Scholar] [CrossRef]
  21. Kogan, F.N. Global drought watch from space. Bull. Am. Meteor. Soc. 2010, 78, 67–69. [Google Scholar] [CrossRef]
  22. Peng, D.L.; Huang, J.F.; Cai, C.X.; Deng, R. Spatialization on monthly average air temperature in Xinjiang and the analysis of the result. J. Zhejiang Univ. (Sci. Ed.) 2007, 34, 580–584. [Google Scholar]
  23. Aghakouchak, A.; Farahmand, A.; Melton, F.S.; Teixeira, J.; Anderson, M.C.; Wardlow, B.D.; Hain, C.R. Remote sensing of drought: Progress, challenges and opportunities. Rev. Geophys. 2015, 53, 452–480. [Google Scholar] [CrossRef]
  24. Kalisa, W.; Zhang, J.H.; Igbawua, T.; Ujoh, F.; Ebohon, O.J.; Namugize, J.N.; Yao, F. Spatio-temporal analysis of drought and return periods over the East African region using Standardized Precipitation Index from 1920 to 2016. Agric. Water Manag. 2020, 237, 106195. [Google Scholar] [CrossRef]
  25. Cai, S.Y.; Zuo, D.P.; Wang, H.X.; Xu, Z.X.; Wang, G.Q.; Yang, H. Assessment of agricultural drought based on multi-source remote sensing data in a major grain producing area of Northwest China. Agric. Water Manag. 2023, 278, 108142. [Google Scholar] [CrossRef]
  26. Gao, B.-C.; Goetz, A. Extraction of dry leaf spectral features from reflectance spectra of green vegetation. Remote Sens. Environ. 1994, 47, 369–374. [Google Scholar] [CrossRef]
  27. Chen, D.; Huang, J.; Jackson, T. Vegetation water content estimation for corn and soybeans using spectral indices from MODIS near- and short-wave infrared bands. Remote Sens. Environ. 2005, 98, 225–236. [Google Scholar] [CrossRef]
  28. Gu, Y.; Brown, J.; Verdin, J.; Wardlow, B. A five-year analysis of MODIS NDVI and NDWI for grassland drought assessment over the central Great Plains of the United States. Geophys. Res. Lett. 2007, 34, 6. [Google Scholar] [CrossRef]
  29. Wolski, P.; Murray-Hudson, M.; Thito, K.; Cassidy, L. Keeping it simple: Monitoring flood extent in large data-poor wetlands using MODIS SWIR data. Int. J. Appl. Earth Obs. Geoinf. 2017, 57, 224–234. [Google Scholar] [CrossRef]
  30. Chen, Y.Y.; Wang, P.J.; Zhang, Y.D.; Yang, J.Y. Comparison of drought recognition of spring maize in Northern China based on 3 remote sensing indices. J. Appl. Meteor. Sci. 2022, 33, 466–476. [Google Scholar]
  31. Liu, X.L.; Qin, Z.H. Comparative analysis between NDWI and NDVI indices in regional drought monitoring. Remote Sens. Technol. Appl. 2007, 22, 608–612. [Google Scholar]
  32. Liu, Z.Y. Study on Comprehensive Drought Monitoring Index and Its Application Based on Multi-Source Data in Southwest China. Master’s Thesis, Southwest University, Chongqing, China, 2015. [Google Scholar]
  33. Yang, X.C.; Ming, B.; Tao, H.B.; Wang, P. Spatial distribution characteristics and impact on spring maize yield of drought in Northeast China. Chin. J. Eco-Agric. 2015, 23, 758–767. [Google Scholar]
  34. Yang, Y.; Qi, Y.; Zhao, H.; Ma, Y.H.; Zhu, D. Effects and evaluations of water stress on growth development and yield of maize during critical growthperiods in arid and semi-arid regions. J. Arid Meteor. 2022, 40, 1059–1067. [Google Scholar]
  35. Wang, L.Y.; Yuan, X. Two types of flash drought and their connections with seasonal drought. Adv. Atmos. Sci. 2018, 35, 1478–1490. [Google Scholar] [CrossRef]
  36. Ren, L.; Zhou, T.; Zhang, W. Attribution of the record-breaking heat event over Northeast Asia in summer 2018: The role of circulation. Environ. Res. Lett. 2020, 15, 054018. [Google Scholar] [CrossRef]
  37. Li, J.; Wang, Z.L.; Wu, X.S.; Zscheischler, J.; Guo, S.L.; Chen, X.H. A standardized index for assessing sub-monthly compound dry and hot conditions with application in China. Hydrol. Earth Syst. Sci. 2021, 25, 1587–1601. [Google Scholar] [CrossRef]
  38. Agutu, N.O.; Awange, J.L.; Zerihun, A.; Ndehedehe, C.E.; Kuhn, M.; Fukuda, Y. Assessing multi-satellite remote sensing, reanalysis, and land surface models’ products in characterizing agricultural drought in East Africa. Remote Sens. Environ. 2017, 194, 287–302. [Google Scholar] [CrossRef]
  39. Jurdao, S.; Yebra, M.; Guerschman, J.P.; Chuvieco, E. Regional estimation of woodland moisture content by inverting Radiative Transfer Models. Remote Sens. Environ. 2013, 132, 59–70. [Google Scholar] [CrossRef]
  40. Schaaf, C.B.; Gao, F.; Strahler, A.H.; Lucht, W.; Li, X.; Tsang, T.; Strugnell, N.C.; Zhang, X.Y.; Jin, Y.F.; Muller, J.; et al. First operational BRDF, albedo nadir reflectance products from MODIS. Remote Sens. Environ. 2002, 83, 135–148. [Google Scholar] [CrossRef]
  41. Luo, Y.C.; Zhang, Z.; Li, Z.Y.; Chen, Y.; Zhang, L.L.; Cao, J.; Tao, F.L. Identifying the spatiotemporal changes of annual harvesting areas for three staple crops in China by integrating multi-data sources. Environ. Res. Lett. 2020, 15, 074003. [Google Scholar] [CrossRef]
  42. National Meteorological Administration. Specification for Agrometeorological Observation (Volume I); China Meteorological Press: Beijing, China, 1993. [Google Scholar]
  43. Song, L.C. Yearbook of Meteorological Disasters in China (2016); China Meteorological Press: Beijing, China, 2017. [Google Scholar]
  44. Ritchie, S.W.; Hanway, J.J.; Benson, G.O. How a Corn Plant Develops; Special Report No. 48; Iowa State University: Ames, IA, USA, 1986. [Google Scholar]
  45. Li, Z.G.; Yang, P.; Tang, H.J.; Wu, W.B.; Chen, Z.X.; Liu, J.; Zhang, L.; Tan, J.Y.; Tang, P.Q. Trends of spring maize phenophases and spatio-temporal responses to temperature in three provinces of Northeast China during the past 20 years. Acta Ecol. Sin. 2013, 33, 5818–5827. [Google Scholar]
  46. Li, Y.L.; Gao, S.H. Analysis of water supply and demand for spring corn in China. Meteor. Mon. 2002, 2, 29–33. [Google Scholar]
  47. Chu, Z.; Guo, J.P. Effcets of climatic change on maize varieties distribution in the future of Northeast China. J. Appl. Meteor. Sci. 2018, 29, 165–176. [Google Scholar]
  48. Efron, B. Double exponential families and their use in generalized linear regression. J. Am. Stat. Assoc. 1986, 81, 709–721. [Google Scholar] [CrossRef]
  49. Fischer, A. A model for the seasonal variations of vegetation indices in coarse resolution data and its inversion to extract crop parameters. Remote Sens. Environ. 1994, 48, 220–230. [Google Scholar] [CrossRef]
  50. Kang, J.; Hou, X.H.; Liu, Z.; Gao, S.; Jia, K. Decision tree classification based on fitted phenology parameters from remotely sensed vegetation data. Trans. Chin. Soc. Agric. Eng. 2014, 30, 148–156. [Google Scholar]
  51. Jiang, L.X.; Li, X.F.; Zhu, H.X.; Gao, M.; Wang, Q.J.; Yan, P.; Gong, L.J.; Zhai, M.; Ji, Y.H.; Wang, P. Characteristics of combination of cold damage and drought during seedling period and its effects on maize yield in Heilongjang Province. Agric. Res. Arid Areas 2020, 38, 11. [Google Scholar]
  52. Song, L.C. Yearbook of Meteorological Disasters in China (2017); China Meteorological Press: Beijing, China, 2018. [Google Scholar]
  53. Song, L.C. Yearbook of Meteorological Disasters in China (2018); China Meteorological Press: Beijing, China, 2019. [Google Scholar]
  54. Song, L.C. Yearbook of Meteorological Disasters in China (2020); China Meteorological Press: Beijing, China, 2021. [Google Scholar]
  55. Zhang, X.; Chen, N.C.; Li, J.Z.; Chen, Z.H.; Dev, N. Multi-sensor integrated framework and index for agricultural drought monitoring. Remote Sens. Environ. 2017, 188, 141–163. [Google Scholar] [CrossRef]
  56. Wang, J.; Yang, X.G.; Li, Y.; Liu, Z.J.; Zhang, X.Y. Changes of China agricultural climate resources under the background of global climate change. VI. Change characteristics of precipitation resource and its possible effect on maize production in Sanjiang Plain of Heilongjiang Province. Chin. J. Appl. Ecol. 2011, 22, 1511–1522. [Google Scholar]
  57. Li, C.R.; You, S.C.; Wu, Y.F. Drought characteristics and dominant meteorological factors drivingdrought in spring maize growing season in northeast China. Trans. Chin. Soc. Agric. Eng. 2020, 36, 97–106. [Google Scholar]
  58. Judge, J.; Liu, P.-W.; Monsiváis-Huertero, A.; Bongiovanni, T.; Chakrabarti, S.; Steele-Dunne, S.C.; Preston, D.; Allen, S.; Bermejo, J.P.; Rush, P.; et al. Impact of vegetation water content information on soil moisture retrievals in agricultural regions: An analysis based on the SMAPVEX16-MicroWEX dataset. Remote Sens. Environ. 2021, 265, 112623. [Google Scholar] [CrossRef]
  59. Luna, D.A.; Pottier, J.; Picon-Cochard, C. Variability and drivers of grassland sensitivity to drought at different timescales using satellite image time series. Agric. For. Meteorol. 2023, 331, 109325. [Google Scholar] [CrossRef]
  60. Liu, H.; Liu, R.G.; Liu, S.Y. Review of drought monitoring by Remote Sensing. J. Geoinf. Sci. 2012, 14, 232–239. [Google Scholar] [CrossRef]
  61. Ma, S.Q.; Wang, Q.; Chen, F.T.; Xu, L.P.; Zhang, T.L.; Yu, H.; Ji, L.L. Impact of spring maize seeding growth on yield and assessment models ofproduction cut under background of spring drought. Trans. Chin. Soc. Agric. Eng. 2015, 31, 171–179. [Google Scholar]
  62. Ma, X.G.; Li, N.; Zhou, B.; Li, J.; Sun, K.; Liu, J.; Zuo, Z. Study on the effect of drought on grain yield in Fuxin. J. Catastrophol. 2019, 34, 139–144. [Google Scholar]
  63. Okpara, J.N.; Afiesimama, E.A.; Anuforom, A.C.; Owino, A.; Ogunjobi, K.O. The applicability of Standardized Precipitation Index: Drought characterization for early warning system and weather index insurance in West Africa. Nat. Hazards 2017, 89, 555–583. [Google Scholar] [CrossRef]
Figure 1. Locations of conventional disaster recording stations, agro-meteorological stations, and Taonan City in the “Golden Maize Belt” in northeast China.
Remotesensing 16 03260 g001
Figure 2. Rules for identifying drought grades by Vegetation Water Index. (A): at point A, an NDAP value of 32 corresponded to a VWI of 0.19. (B): at point B, an NDAP value of 36 corresponded to a VWI of 0.22.
Remotesensing 16 03260 g002
Figure 3. Evolution of drought at Taonan, China, during the 2017 spring maize growing season, as characterized by changes in VWI. Also shown are the precipitation amounts. NDAP is normalized days after planting. VWI is Vegetation Water Index.
Remotesensing 16 03260 g003
Figure 4. Drought spatial evolution at 10-day intervals identified by Vegetation Water Index in counties of the “Golden Maize Belt” in northeast China during a typical drought year (2018).
Remotesensing 16 03260 g004
Figure 5. Drought spatial evolution at 10-day intervals identified by Vegetation Water Index for a typical drought process in the spring maize planting area in western and north-central regions of Liaoning Province in 2020.
Remotesensing 16 03260 g005
Figure 6. Temporal distribution of mild, moderate, and severe drought frequencies as identified by Vegetation Water Index for the spring maize planting area in western and north-central regions of Liaoning Province for 2020.
Remotesensing 16 03260 g006
Figure 7. Temporal distribution of frequencies of total (all drought grades) (a), mild drought (b), moderate drought (c), and severe drought (d) for cities in Heilongjiang and Liaoning Provinces within the “Golden Maize Belt” in northeast China from 2011 to 2020.
Remotesensing 16 03260 g007
Figure 8. Temporal distribution of the average yield reduction rates of different drought grades in 22 cities of Liaoning and Heilongjiang Provinces within the “Golden Maize Belt” in northeast China from 2011 to 2020.
Remotesensing 16 03260 g008
Figure 9. Spatial distribution of frequencies of total (all drought grades) (a), mild drought (b), moderate drought (c), and severe drought (d) for counties in the “Golden Maize Belt” in northeast China from 2000 to 2020. (The numbers in (a) represent the statistical values of drought frequency recorded in the Yearbook of Meteorological Disasters in China from 2003 to 2020 and the Meteorological Disaster Management System from 2000 to 2020).
Remotesensing 16 03260 g009
Table 1. Dynamic threshold model for agricultural drought grades for spring maize in the “Golden Maize Belt” in northeast China.
Drought GradeDrought Threshold
Drought free V W I > f 1 ( t ) + f 2 ( t ) 2
Mild drought f 2 ( t ) + f 3 ( t ) 2 < V W I f 1 ( t ) + f 2 ( t ) 2
Moderate drought f 3 ( t ) + f 4 ( t ) 2 < V W I f 2 ( t ) + f 3 ( t ) 2
Severe drought V W I f 3 ( t ) + f 4 ( t ) 2
Note: f 1 ( t ) , f 2 ( t ) , f 3 ( t ) and f 4 ( t ) represent the fitting functions for drought free, mild drought, moderate drought and severe drought, respectively.
Table 2. Coefficient of determination (R2) values and fitting parameters for Vegetation Water Index fitted with the double-logistic function for spring maize in the “Golden Maize Belt” in northeast China from 2000 to 2013 for different drought grades.
Drought GradeR2abcd
Drought free0.9136.6011.2495.7411.15
Mild drought0.9139.4610.1593.3511.07
Moderate drought0.9341.1510.1591.3711.16
Severe drought0.9644.089.7689.5611.49
Table 3. Validation results of Vegetation Water Index for spring maize in the “Golden Maize Belt” in northeast China from 2014 to 2020.
Drought GradeAccuracy of ValidationNumber of
Drought Samples
Complete CorrespondenceWithin One Grade
Total84.6%96.2%78
Mild drought93.8%100.0%16
Moderate drought76.3%94.7%38
Severe drought91.7%95.8%24
Disclaimer/Publisher’s Note: The statements, opinions and data contained in all publications are solely those of the individual author(s) and contributor(s) and not of MDPI and/or the editor(s). MDPI and/or the editor(s) disclaim responsibility for any injury to people or property resulting from any ideas, methods, instructions or products referred to in the content.

