Article

Evaluation of Urban Microscopic Nighttime Light Environment Based on the Coupling Observation of Remote Sensing and UAV Observation

1
Laboratory of Building Environment and New Energy Resources, Faculty of Infrastructure Engineering, Dalian University of Technology, Dalian 116024, China
2
School of Architecture and Fine Art, Dalian University of Technology, Dalian 116024, China
3
Aerospace Information Research Institute, Chinese Academy of Sciences (CAS), Beijing 100094, China
*
Author to whom correspondence should be addressed.
Remote Sens. 2024, 16(17), 3288; https://doi.org/10.3390/rs16173288
Submission received: 5 July 2024 / Revised: 18 August 2024 / Accepted: 29 August 2024 / Published: 4 September 2024
(This article belongs to the Special Issue Nighttime Light Remote Sensing Products for Urban Applications)

Abstract

:
The urban canopy refers to the spatial area at the average height range of urban structures. The light environment of the urban canopy not only influences the ecological conditions of the canopy layer region but also serves as an indicator of the upward light influx of artificial nighttime light in the urban environment. Previous research on urban nighttime light environment mainly focused on the urban surface layer and urban night sky layer, lacking attention to the urban canopy layer. This study observes the urban canopy layer with the flight and photography functions of an unmanned aerial vehicle (UAV) and combines color band remote sensing data with ground measurement data to explore the relationship between the three levels of the urban nighttime light environment. Furthermore, a three–dimensional observation method is established for urban nighttime light environments based on a combination of three observation methods. The research results indicate that there is a good correlation between drone aerial photography data and remote sensing data (R2 = 0.717), as well as between ground–measured data and remote sensing data (R2 = 0.876). It also shows that UAV images can serve as a new path for the observation of urban canopy nighttime light environments because of the accuracy and reliability of UAV aerial data. Meanwhile, the combination of UAV photography, ground measurement, and remote sensing data provides a new method for the monitoring and control of urban nighttime light pollution.

1. Introduction

Night lighting is one of the essential infrastructures for people to engage in nighttime life. Good nighttime lighting can improve pedestrian safety, promote nighttime economic growth, and create beautiful nighttime landscapes [1]. Urban nighttime lighting is also considered an important element in attracting residents and tourists after dark [2]. However, the rapid growth of urban nighttime lighting has also had negative impacts on astronomical observations [3], ecological environment [4,5,6], human health [7,8,9], energy consumption [10,11], traffic safety [12], and other aspects. Research has shown that as of 2016, over 80% of the global population lived under the influence of nighttime light pollution, which has become a global problem [13].
Remote sensing technology and ground measurement methods are widely utilized in the examination of urban environments. Nighttime light remote sensing can capture images of vast geographical areas and accumulate data over extended periods, forming multi–year time series [14,15,16,17,18]. Ground measurements can obtain precise and high–quality environmental information along with a rich set of data parameters, making them suitable for small–scale studies of nighttime light environments. However, influenced by the measurement range of the instruments, accessibility, and efficiency of manual measurement, only the surface layer of the Earth can be observed [19,20,21]. Remote sensing technology has the advantages of high data collection efficiency, wide data coverage, good stability, and strong data consistency. However, because the observation points of remote sensing satellites are in the night sky layer, they can only receive light emitted towards the night sky layer [22,23]. The two main methods of observing nighttime light environments are primarily macroscopic observations through satellites in the night sky layer and through instruments at the Earth’s surface layer [24,25]. The urban canopy is the transitional zone between the artificial light environment of the Earth’s surface layer and the light environment of the night sky layer. The urban canopy light environment is mainly influenced by urban uplight, spill light, and reflected light. Previous studies on urban light environments have mainly focused on the urban surface layer and the urban night sky layer, lacking attention to the urban canopy layer. Therefore, observation and research on the urban canopy layer will help to further study the impact of urban artificial light at night [26].
Unmanned Aerial Vehicle (UAV) technology, as an emerging method for environmental monitoring, offers advantages such as ease of use, flexibility, wide observation range, and the ability to capture high–resolution images [27]. It finds widespread applications in research fields such as agriculture [28,29,30], ecological environment [31,32], marine areas [33], disaster relief [34,35], air monitoring [36], and urban planning [37,38]. In terms of nighttime light environment observation, compared to ground measurements and remote sensing, UAVs have the advantage of real–time collection of high–resolution data. The flexibility of flight allows UAVs to capture and record specific area details with greater precision. Importantly, UAVs can provide aerial data with high altitude, similar to that of aircraft photography. Furthermore, due to the ability to change positions and angles, UAVs can obtain data from various perspectives and altitudes, offering a more comprehensive and multi–angle observation. In recent years, UAVs have been applied in the research of urban nighttime illumination. Bouroussis et al. utilized UAV images to assess lighting conditions, leveraging the flexibility of UAVs in three–dimensional space. They introduced three UAV measurement forms tailored to different lighting conditions and conducted aerial observations and lighting evaluations across various scenes, including highways, parking lots, and individual buildings [39]. Massetti et al. employed a UAV equipped with a SQM and digital cameras to estimate ground surface brightness. They investigated the correlation between nighttime images and ground brightness measured by downward–mounted optical devices. The sky quality data collected by the UAV showed a significant correlation with nighttime ground brightness, suggesting that UAVs equipped with sky quality meters can effectively assess light pollution areas on the ground [40]. Tabaka utilized UAVs to assess the luminous flux emitted upward by two types of spherical individual lamps, with and without covering the upper surface [41]. Li et al. used UAVs to observe hourly light dynamics in cities at night. The observation results aligned with the measurements from ground–sky mass meters, demonstrating the effectiveness of UAVs as tools for studying urban nighttime lighting dynamics [42]. Bahia et al. proposed a method for generating ground illuminance maps using UAVs. They constructed a three–dimensional model of a road using overlapping aerial images, visualized and analyzed road illuminance, and established a regression model between RGB data captured by UAVs and ground illuminance data [43]. In another study, the comparison of Jilin–1 satellite images with nighttime color UAV images revealed that the correlation of the blue channel was consistently the lowest, while the correlation of the red channel was the highest in the RGB channel comparison between Jilin–1 and UAV. This discrepancy may be attributed to Rayleigh scattering in the atmosphere, where shorter wavelengths of light scatter more, making remote sensing more challenging for monitoring blue light [44].
The nighttime light environment in cities can be divided into three levels based on the spatial location, including the urban surface layer, urban canopy layer, and urban night sky layer [45]. The urban canopy layer refers to the spatial region at the average height range of urban structures. This layer’s light environment can reflect the upward light flux of the urban nighttime environment. Assessing the upward light flux in the urban nighttime environment is helpful in understanding the extent of light pollution and its potential impact on astronomical observations, wildlife, and human health, such as the survival and migration of birds. Previous research on urban nighttime environments has mainly focused on micro–scale ground measurements at the surface layer and macro–scale remote sensing observations of the night sky layer. UAVs can fly freely at different altitudes, angles, and positions without being restricted by terrain. Using UAVs enables the observation of the urban canopy layer light environment, filling the gap in observing intermediate layers in the urban nighttime environment. The existing research on the application of UAV in nighttime light environment research mainly uses UAV direct observation or combines UAV observation with ground measurement. There is relatively little research combining ground measurement, remote sensing observation, and UAV observation. This study focuses on the nighttime light environment of certain campuses at Dalian University of Technology. The study’s objectives are as follows: (1) To explore the feasibility of using UAVs to evaluate urban nighttime lighting from an aerial perspective. (2) To explore a nighttime light environment observation method that combines both sky and ground perspectives, investigating the coupling relationship between macro remote sensing observation, mesoscopic UAV photography, and micro ground measurement methods. (3) To construct a regional light environment map and identify regional areas of improper lighting use

2. Materials and Methods

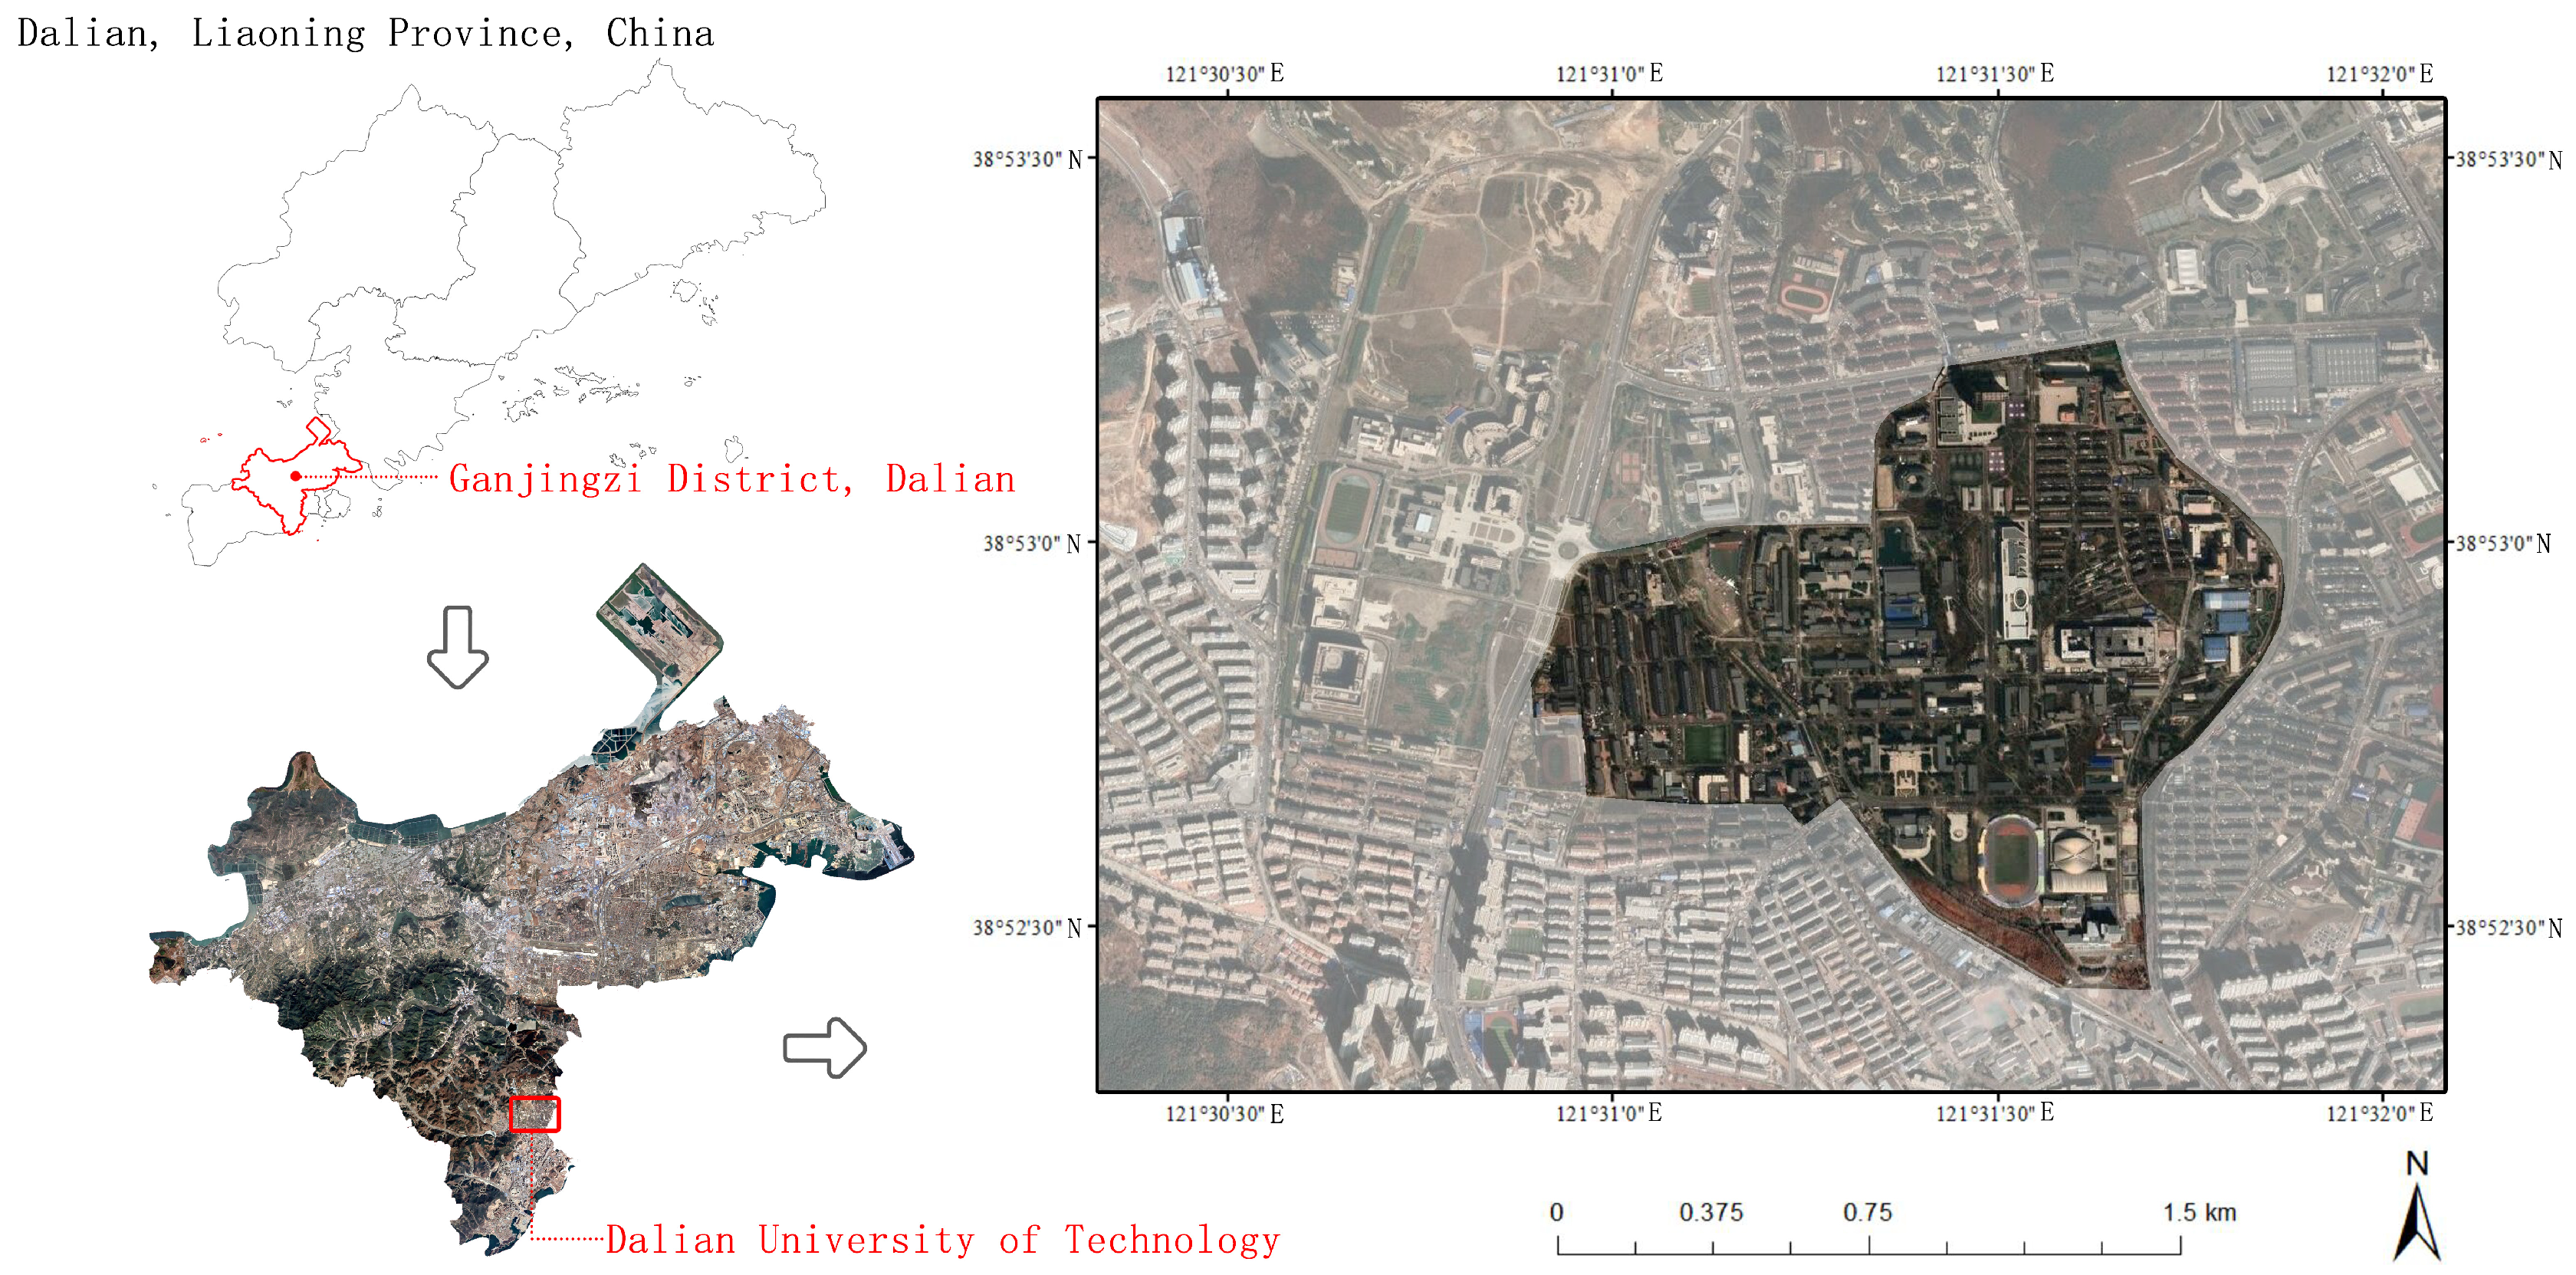
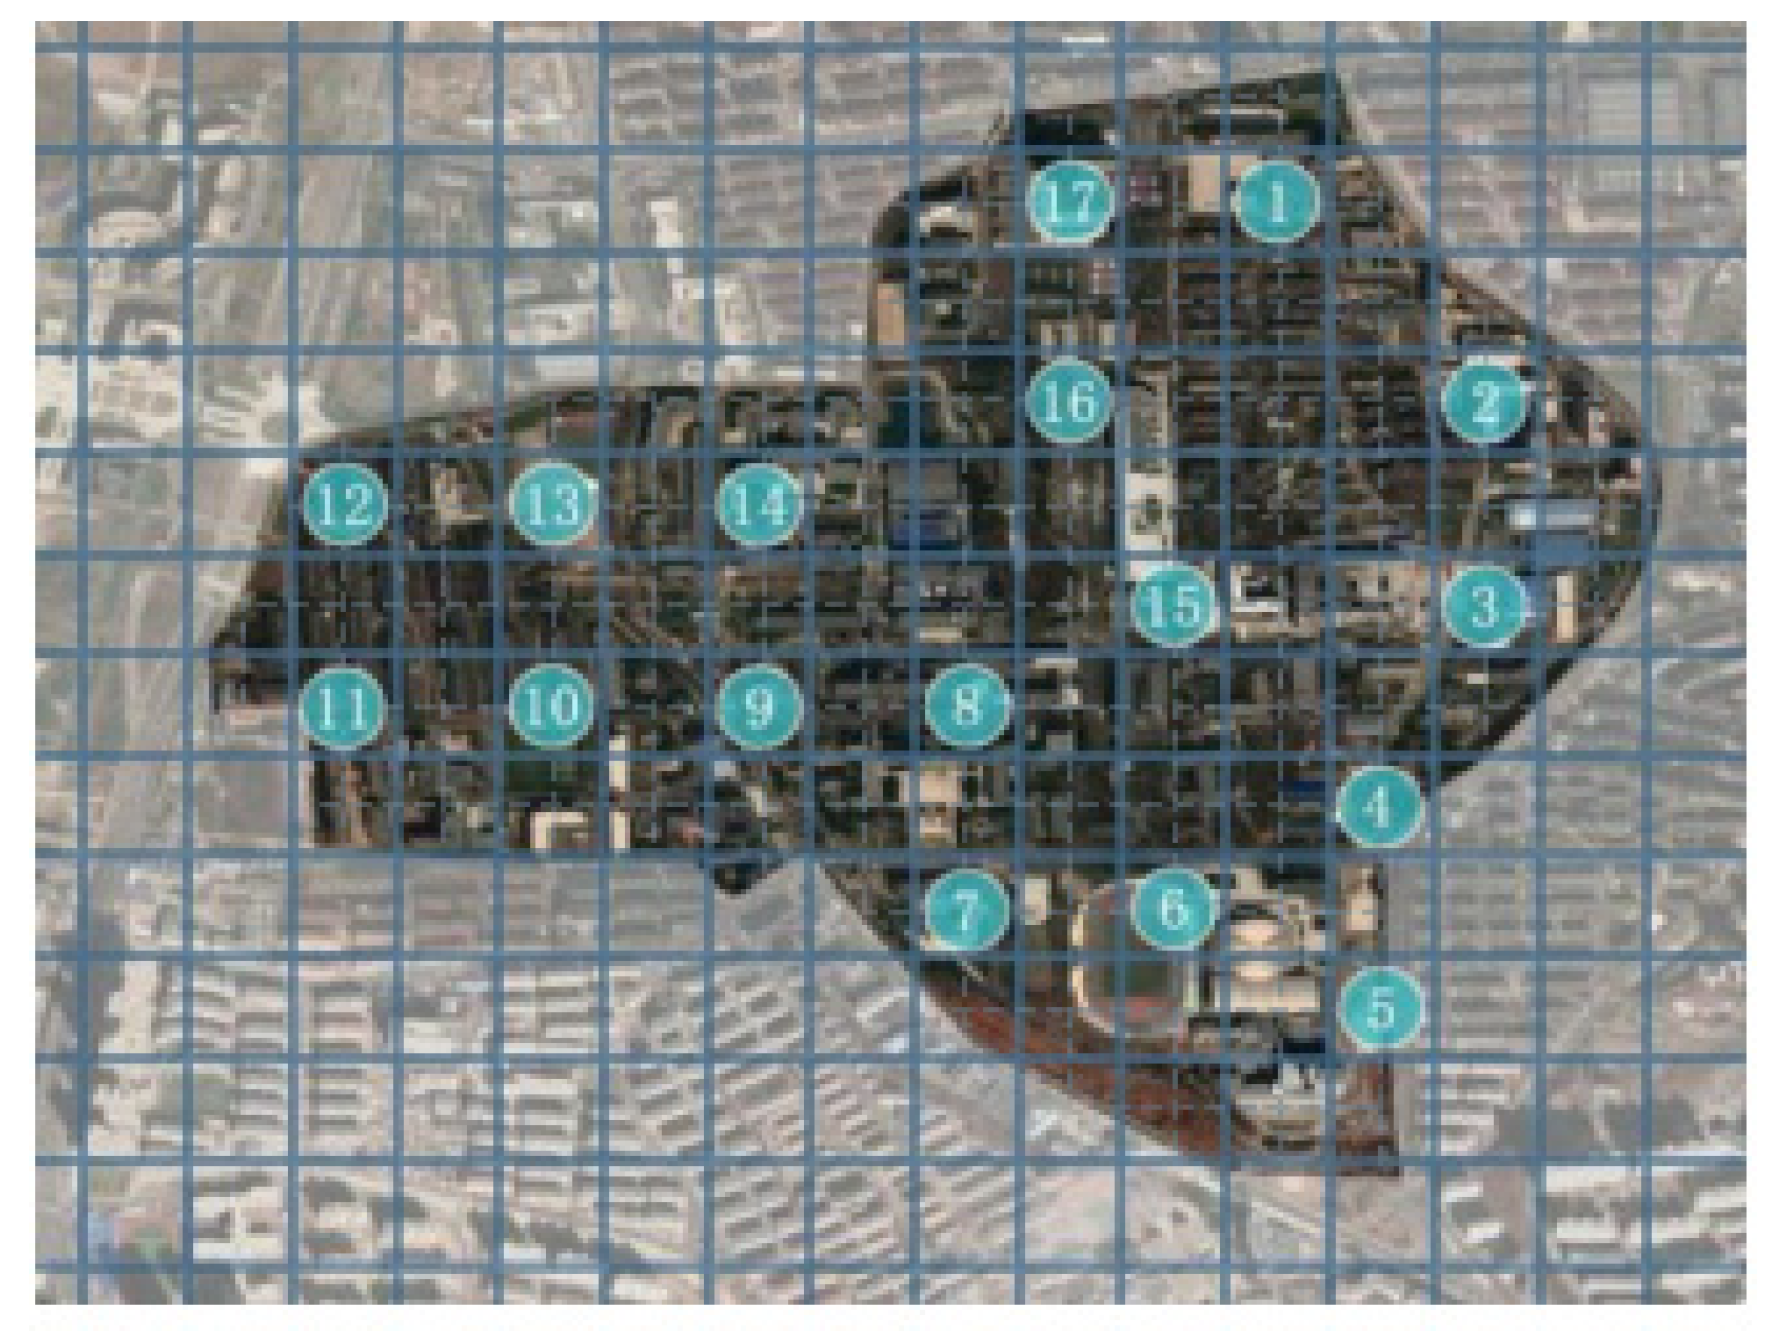
2.1. Study Area and Time

Dalian is at the southern end of the Liaodong Peninsula in Liaoning Province, China. The research area is located on the main campus of Dalian University of Technology in Dalian, Liaoning Province, China (Figure 1). The study area is an irregular area of approximately 1.012 km2. The southeast part of the campus is selected as the main research area, which includes functional areas such as teaching, offices, dormitories, sports fields, commercial areas, green spaces, and transportation roads, with complete lighting facilities in the area.
The nighttime lighting environment on campus is affected by the time the dormitory lights are turned off, which is different from the changes in nighttime lighting environment in cities. To ensure the accuracy of the measured data, the horizontal window illumination of four typical functional areas on campus, including teaching, activities, commerce, and dormitories, is measured from 19:00 to 23:00 on 31 March 2023. According to previous studies [19], it is found that the horizontal view window has the highest correlation with remote sensing data. The specific measurement methods (see Figure 2) and references are presented in the main text. This study preliminarily judges the nighttime light environment and thus determines the measurement time period as from 19:00 to 21:30. This study mainly focuses on weekdays to explore patterns and methods. All measurements are ensured to be conducted under the same time periods and conditions to ensure the consistency and comparability of the data. This study primarily aims to preliminarily explore the three–dimensional measurement methods for the urban micro–scale nighttime light environment. From Figure 3, the nighttime illumination on campus changes relatively smoothly between 19:00 and 23:00, gradually decreasing between 21:00 and 22:00, and rapidly decreasing between 22:00 and 23:00. In summary, the time between 19:00 and 21:30 is selected as the measurement time, which has relatively stable changes.
The actual measurement date is selected between April and May, and the detailed time is shown in Table 1. To eliminate the influence of factors such as weather, air pollution, and moon phases on the research results, clear, cloudless, moonless nights with similar air quality are selected for this study [46].

2.2. Research Data and Methods

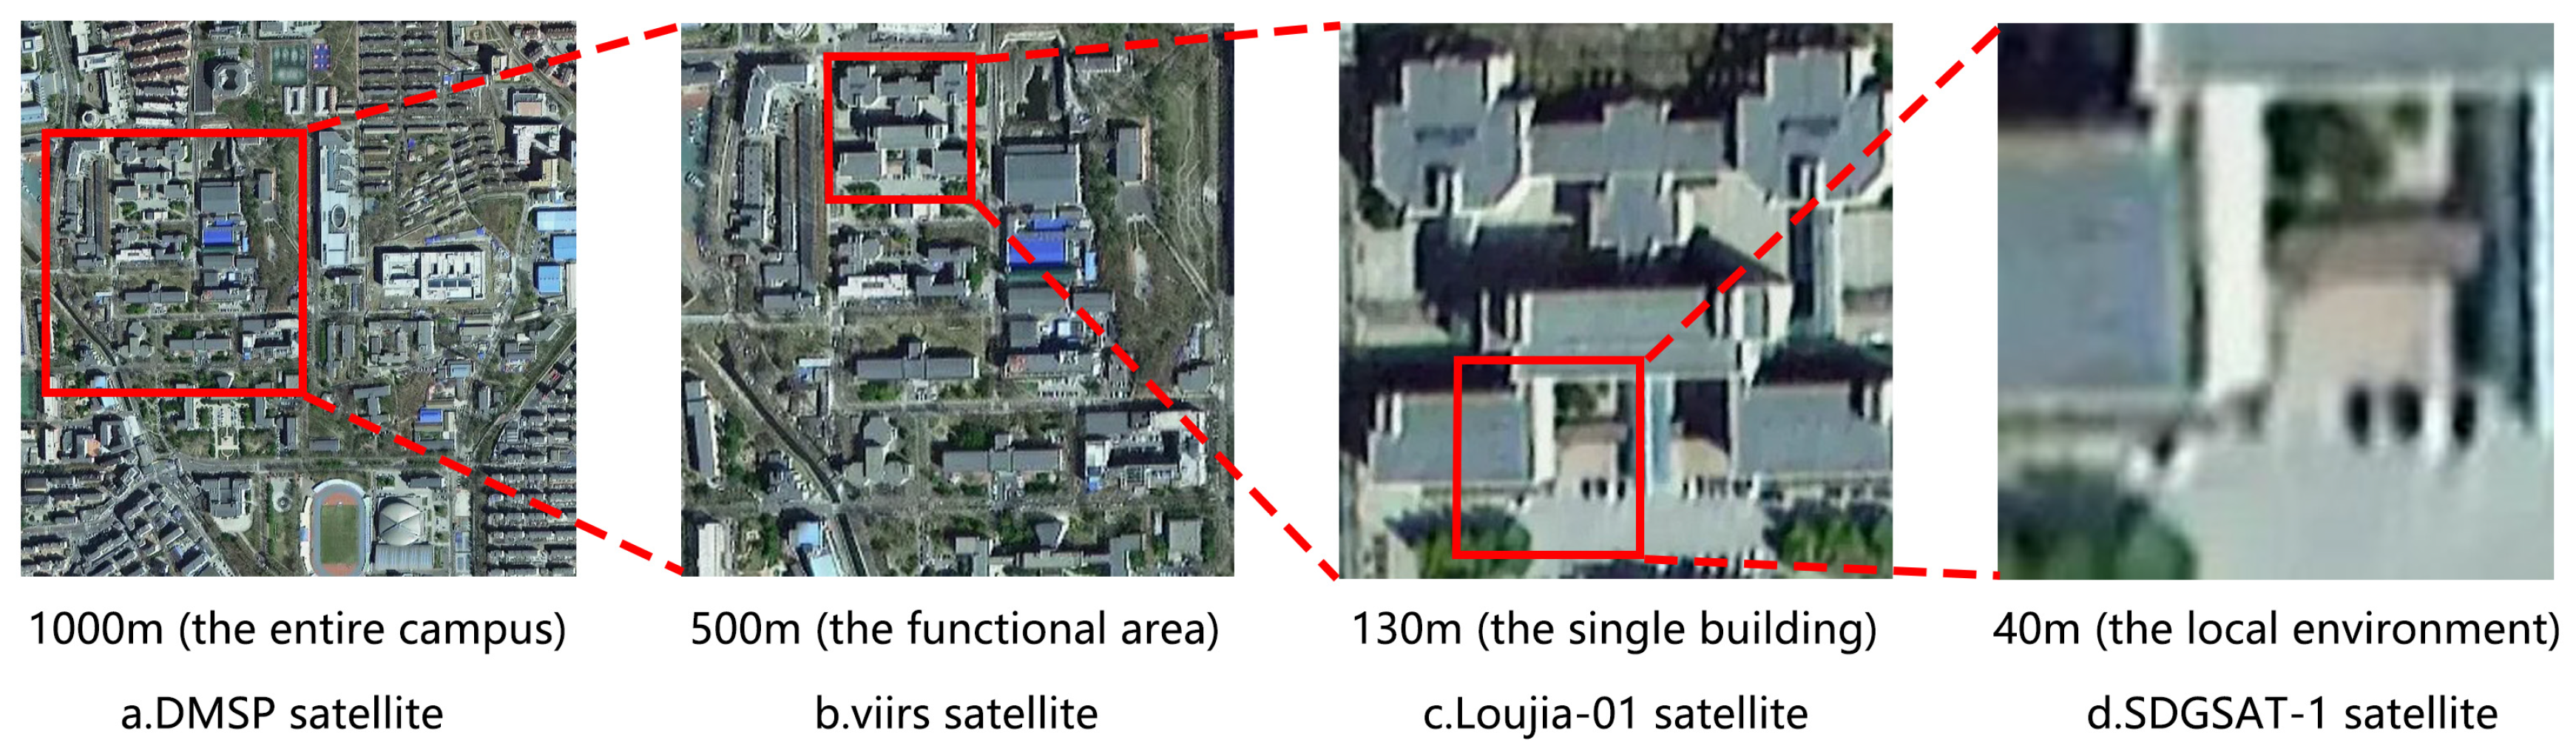
2.2.1. Remote Sensing Data

In this study, the remote sensing data of Sustainable Development Science Satellite–1 (SDGSAT–1) were used to study the urban nighttime light environment at the micro–scale. The early remote sensing data from satellites such as DMSP and VIIRS typically have resolutions of several hundred meters to several kilometers (see Figure 4). It has the characteristics of low resolution and fuzzy remote sensing images. It can only analyze the urban nighttime light environment at a macro–scale, and it is difficult to analyze the nighttime light environment of the specific functional areas of the city at the micro–scale. The spatial resolution of SDGSAT–1 data is 40 m. Under the support of SDGSAT–1 remote sensing data, the city can be partitioned at a scale of 40 m to form a smaller scale of urban space, such as campus, residential, urban square, commercial block, and so on. In this paper, the campus area is selected as the scope of this study and is divided into different areas, such as the campus square, stadium, and teaching buildings. The scale of aerial measurement is based on the resolutions of the SDGSAT–1 and Luojia–1 satellites (see Figure 4 and Section 2.2.3). Combined with UAV aerial data and remote sensing data, the regression equation is established to explore the night light environment stereo observation method at the micro–scale of the city. This study takes the micro–scale campus interior space as the research object and has a strong fitting degree with the urban micro–space. Therefore, the research conclusion of the campus micro–scale nighttime light environment can be applied to the nighttime light environment of the whole city micro–scale.
SDGSAT–1 is the world’s first scientific satellite dedicated to serving the United Nations’ 2030 Sustainable Development Agenda [48]. In this study, data from three color bands (RGB) captured in Dalian on 29 March 2023 are used, with a resolution of 40 m. The original remote sensing data digital values (DN values) are transformed into physically meaningful radiance values through radiometric calibration. The calibration formula provided by CBAS is as follows:
L = DN × Gain + Bias,
where L represents the radiance at the sensor entrance pupil, measured in W/m2/sr/μm. DN represents the count value of the image after relative radiometric calibration. The absolute radiometric calibration coefficients for the low–light sensor in the exploration band are shown in Table 2, sourced from the SDGSAT–1 satellite user manual. The radiometric calibration coefficients are derived from the SDGSAT–1 satellite user manual.

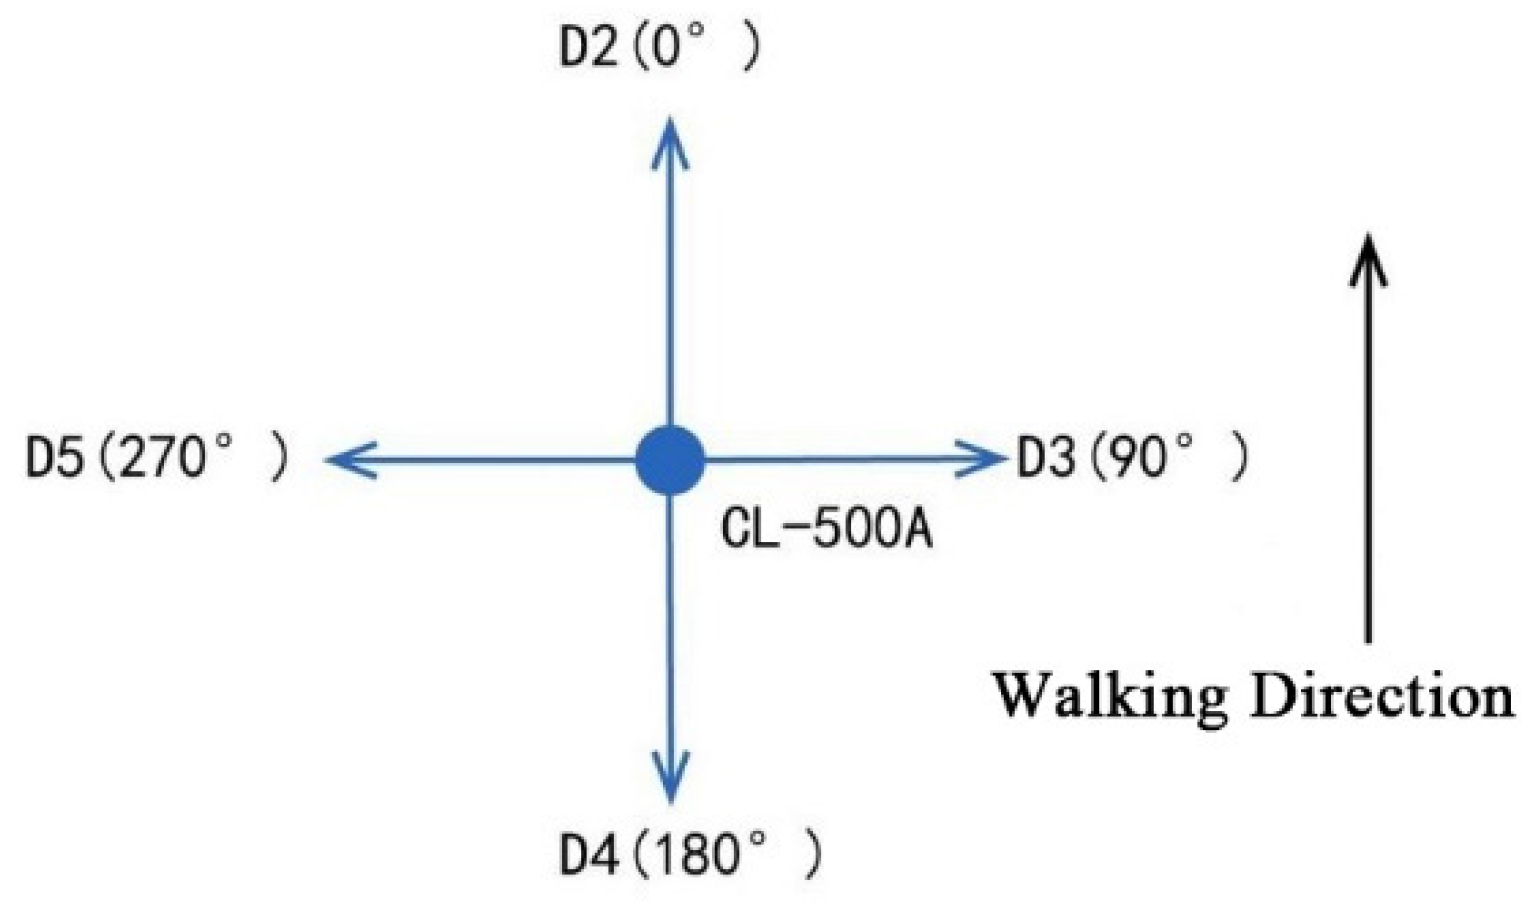
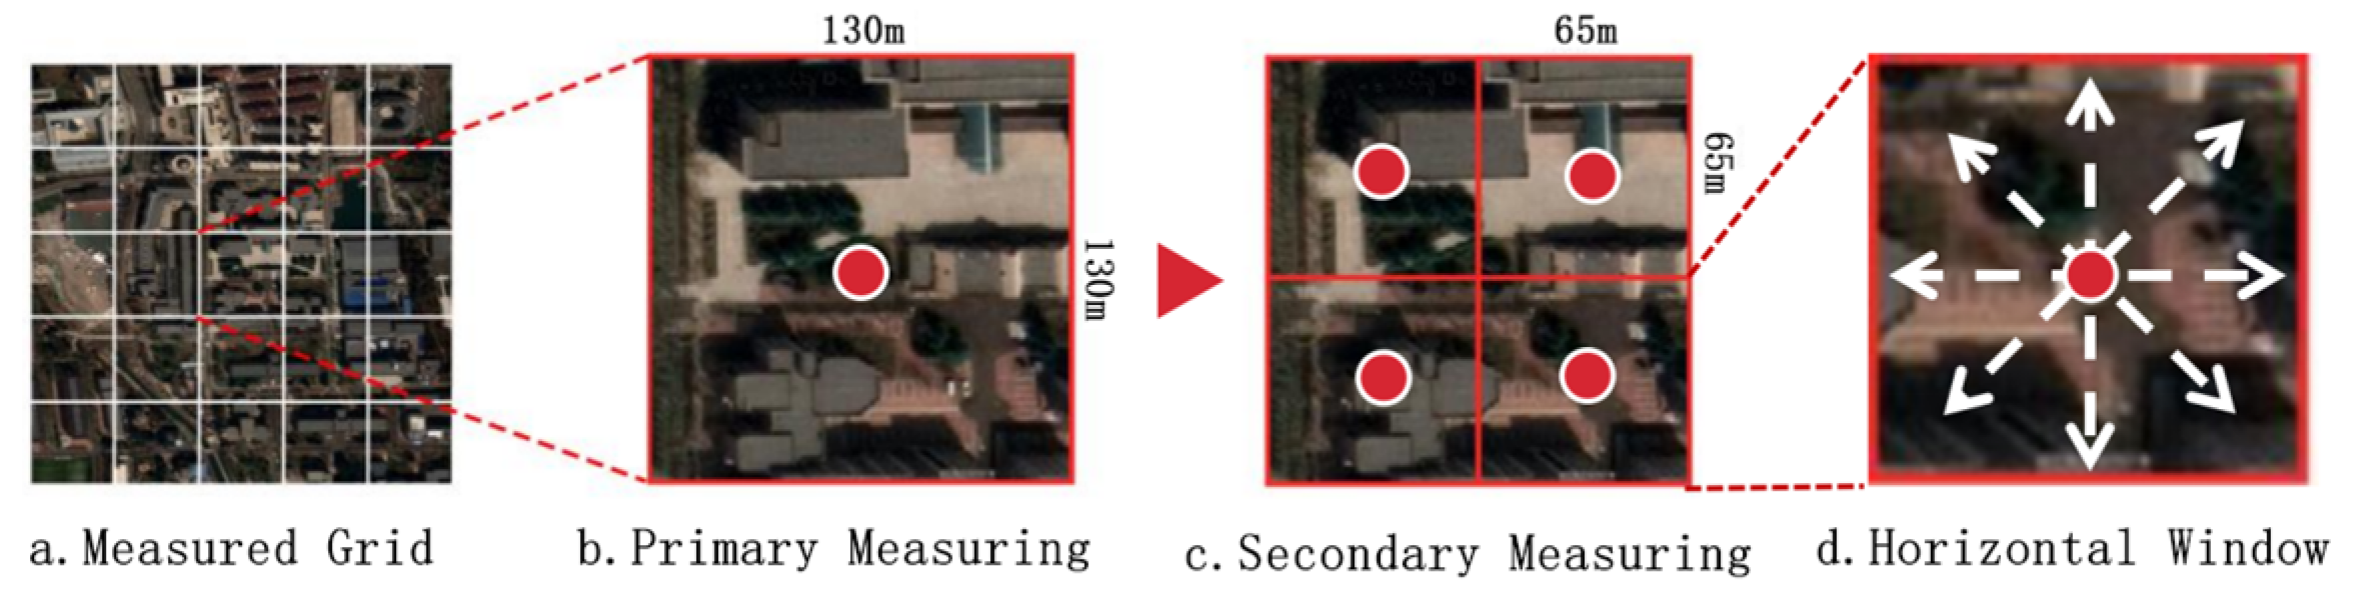
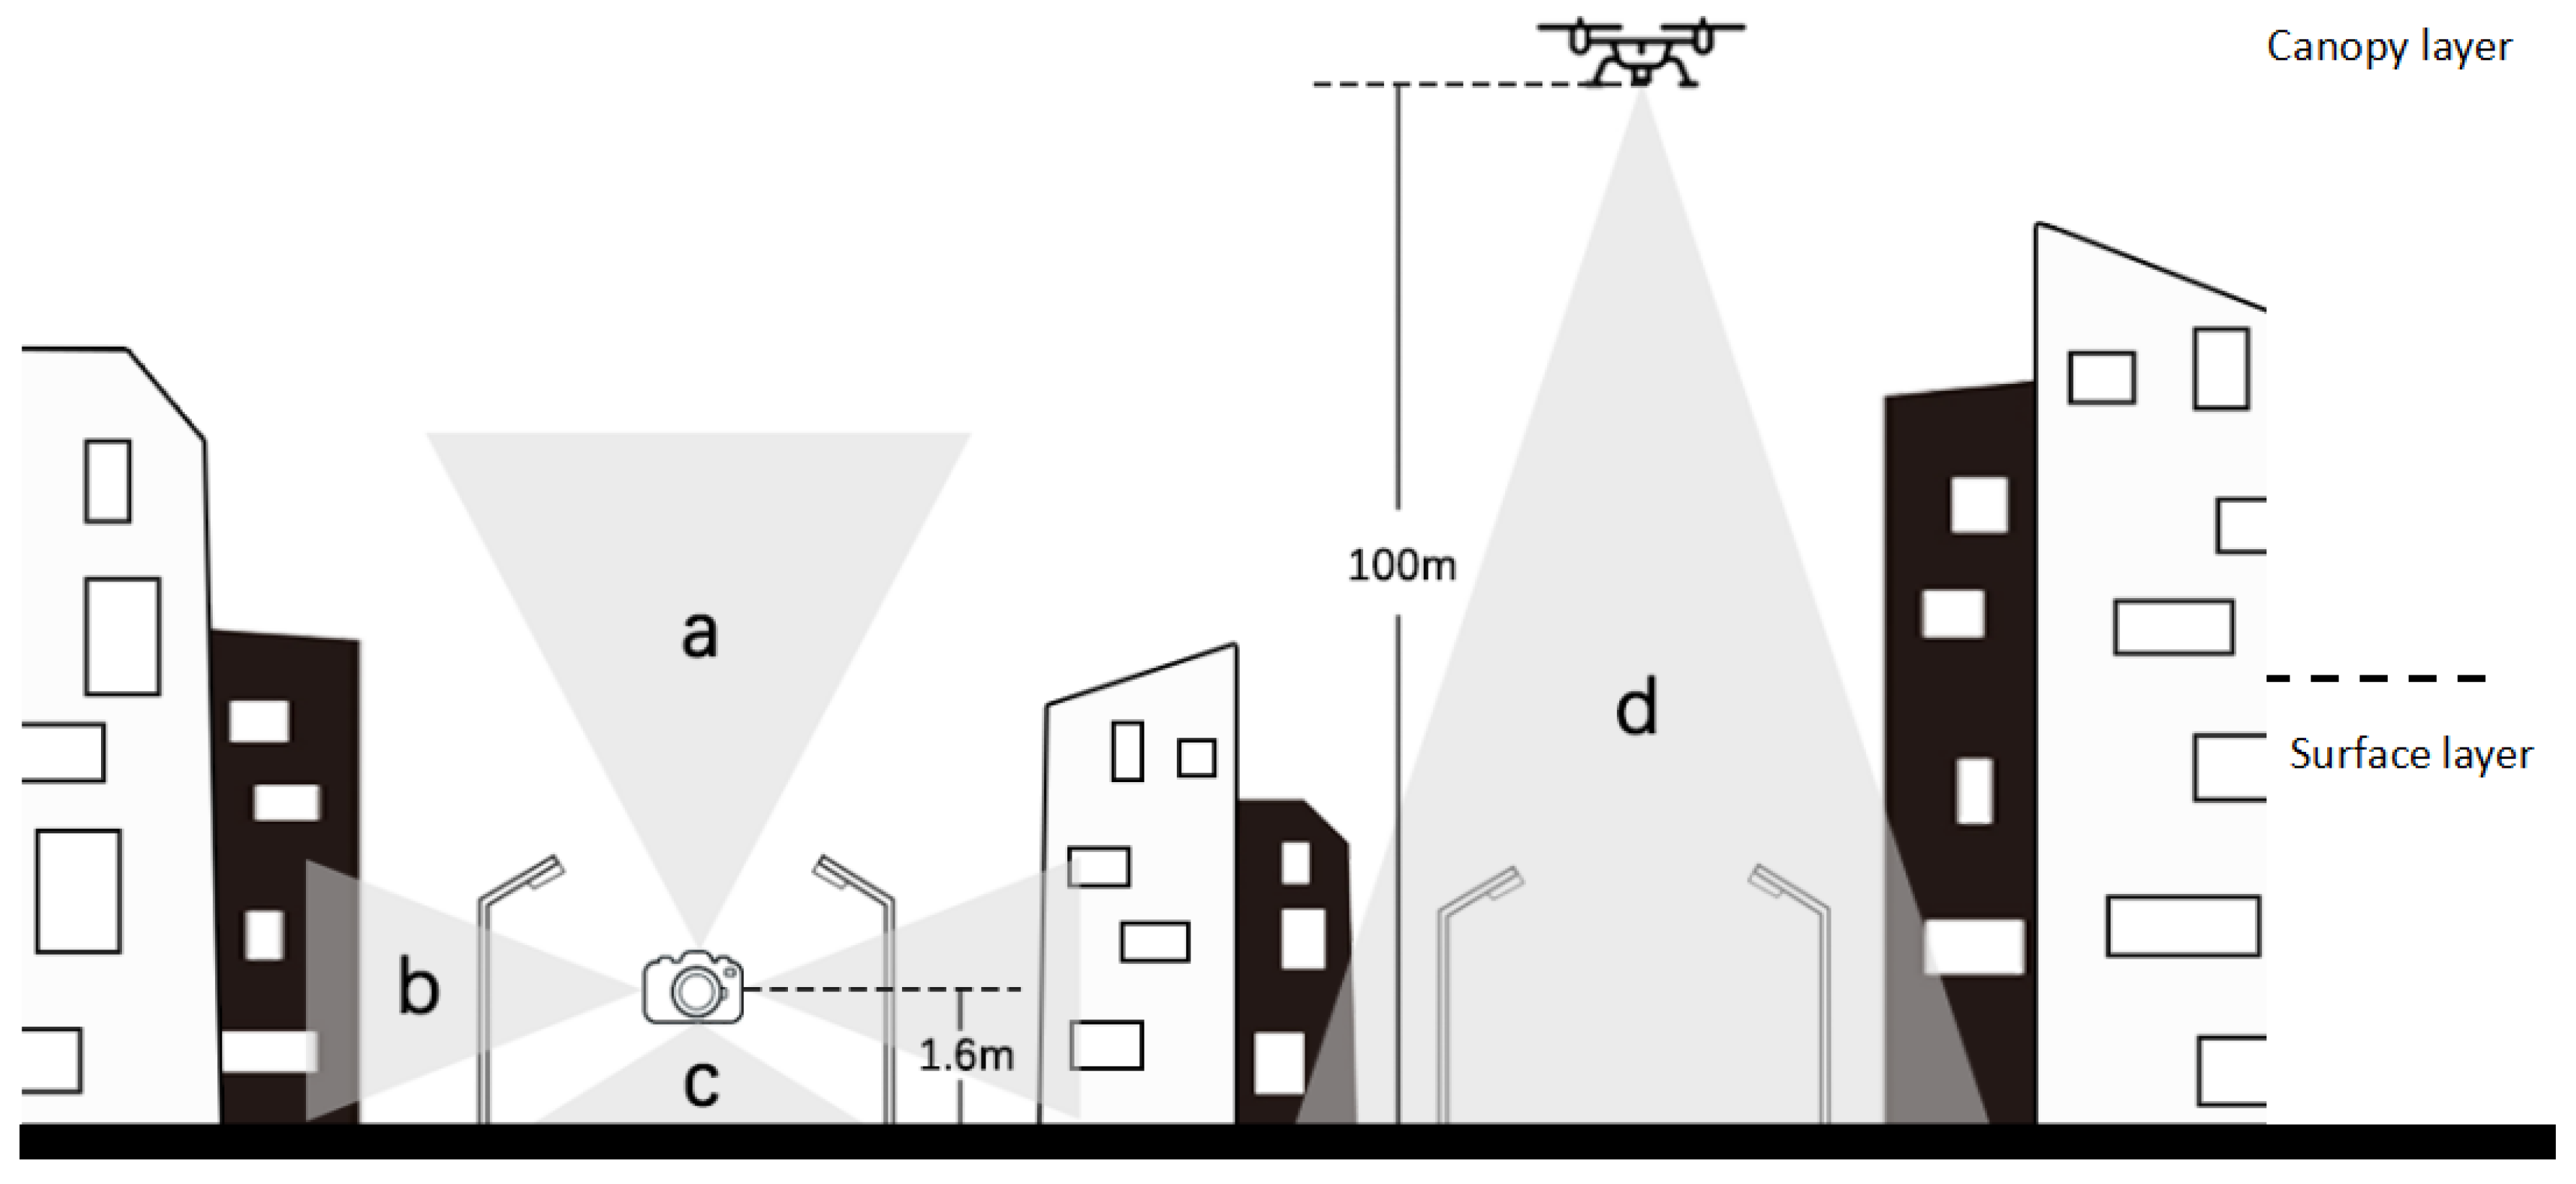
2.2.2. Ground–Measured Data

The measurement area is divided into 130 m × 130 m grid units. Each grid serves as a primary measurement point, and the primary measurement points are further evenly divided into four secondary measurement points (Figure 5). The final step involves calculating the Arithmetic Mean of the actual measurements from multiple secondary points and using this Arithmetic Mean as the value for the primary measurement point. The layout rule of measurement units is that the maximum spacing between each unit shall not exceed 3 grid sizes, and the minimum spacing shall not be less than 1 grid size (Figure 6).
The instruments used for ground measurements include the CL–500 lux meter and the CCD panoramic camera (equipped with a fisheye lens). The measurement method adopts the night light environment measurement window division method from the patented “Urban Night Light Pollution Test Method”. At each measurement point, three observation windows of the urban space are considered, including an upper window (where the measurement sensor is parallel to the ground, observing the night sky zenith light environment upwards), a horizontal window (where the measurement sensor is perpendicular to the ground, observing the light environment in the outward line of sight), and a lower window (where the measurement sensor is parallel to the ground, observing the ground light environment downwards) [49]. The instruments are set at a height of 1.6 m, corresponding to the height of the human eye. The obtained data from the measurements include horizontal illuminance (El), upper illuminance (Eu), and lower illuminance (Ed), where El represents the mean of eight measurements in the horizontal direction (Figure 5d).

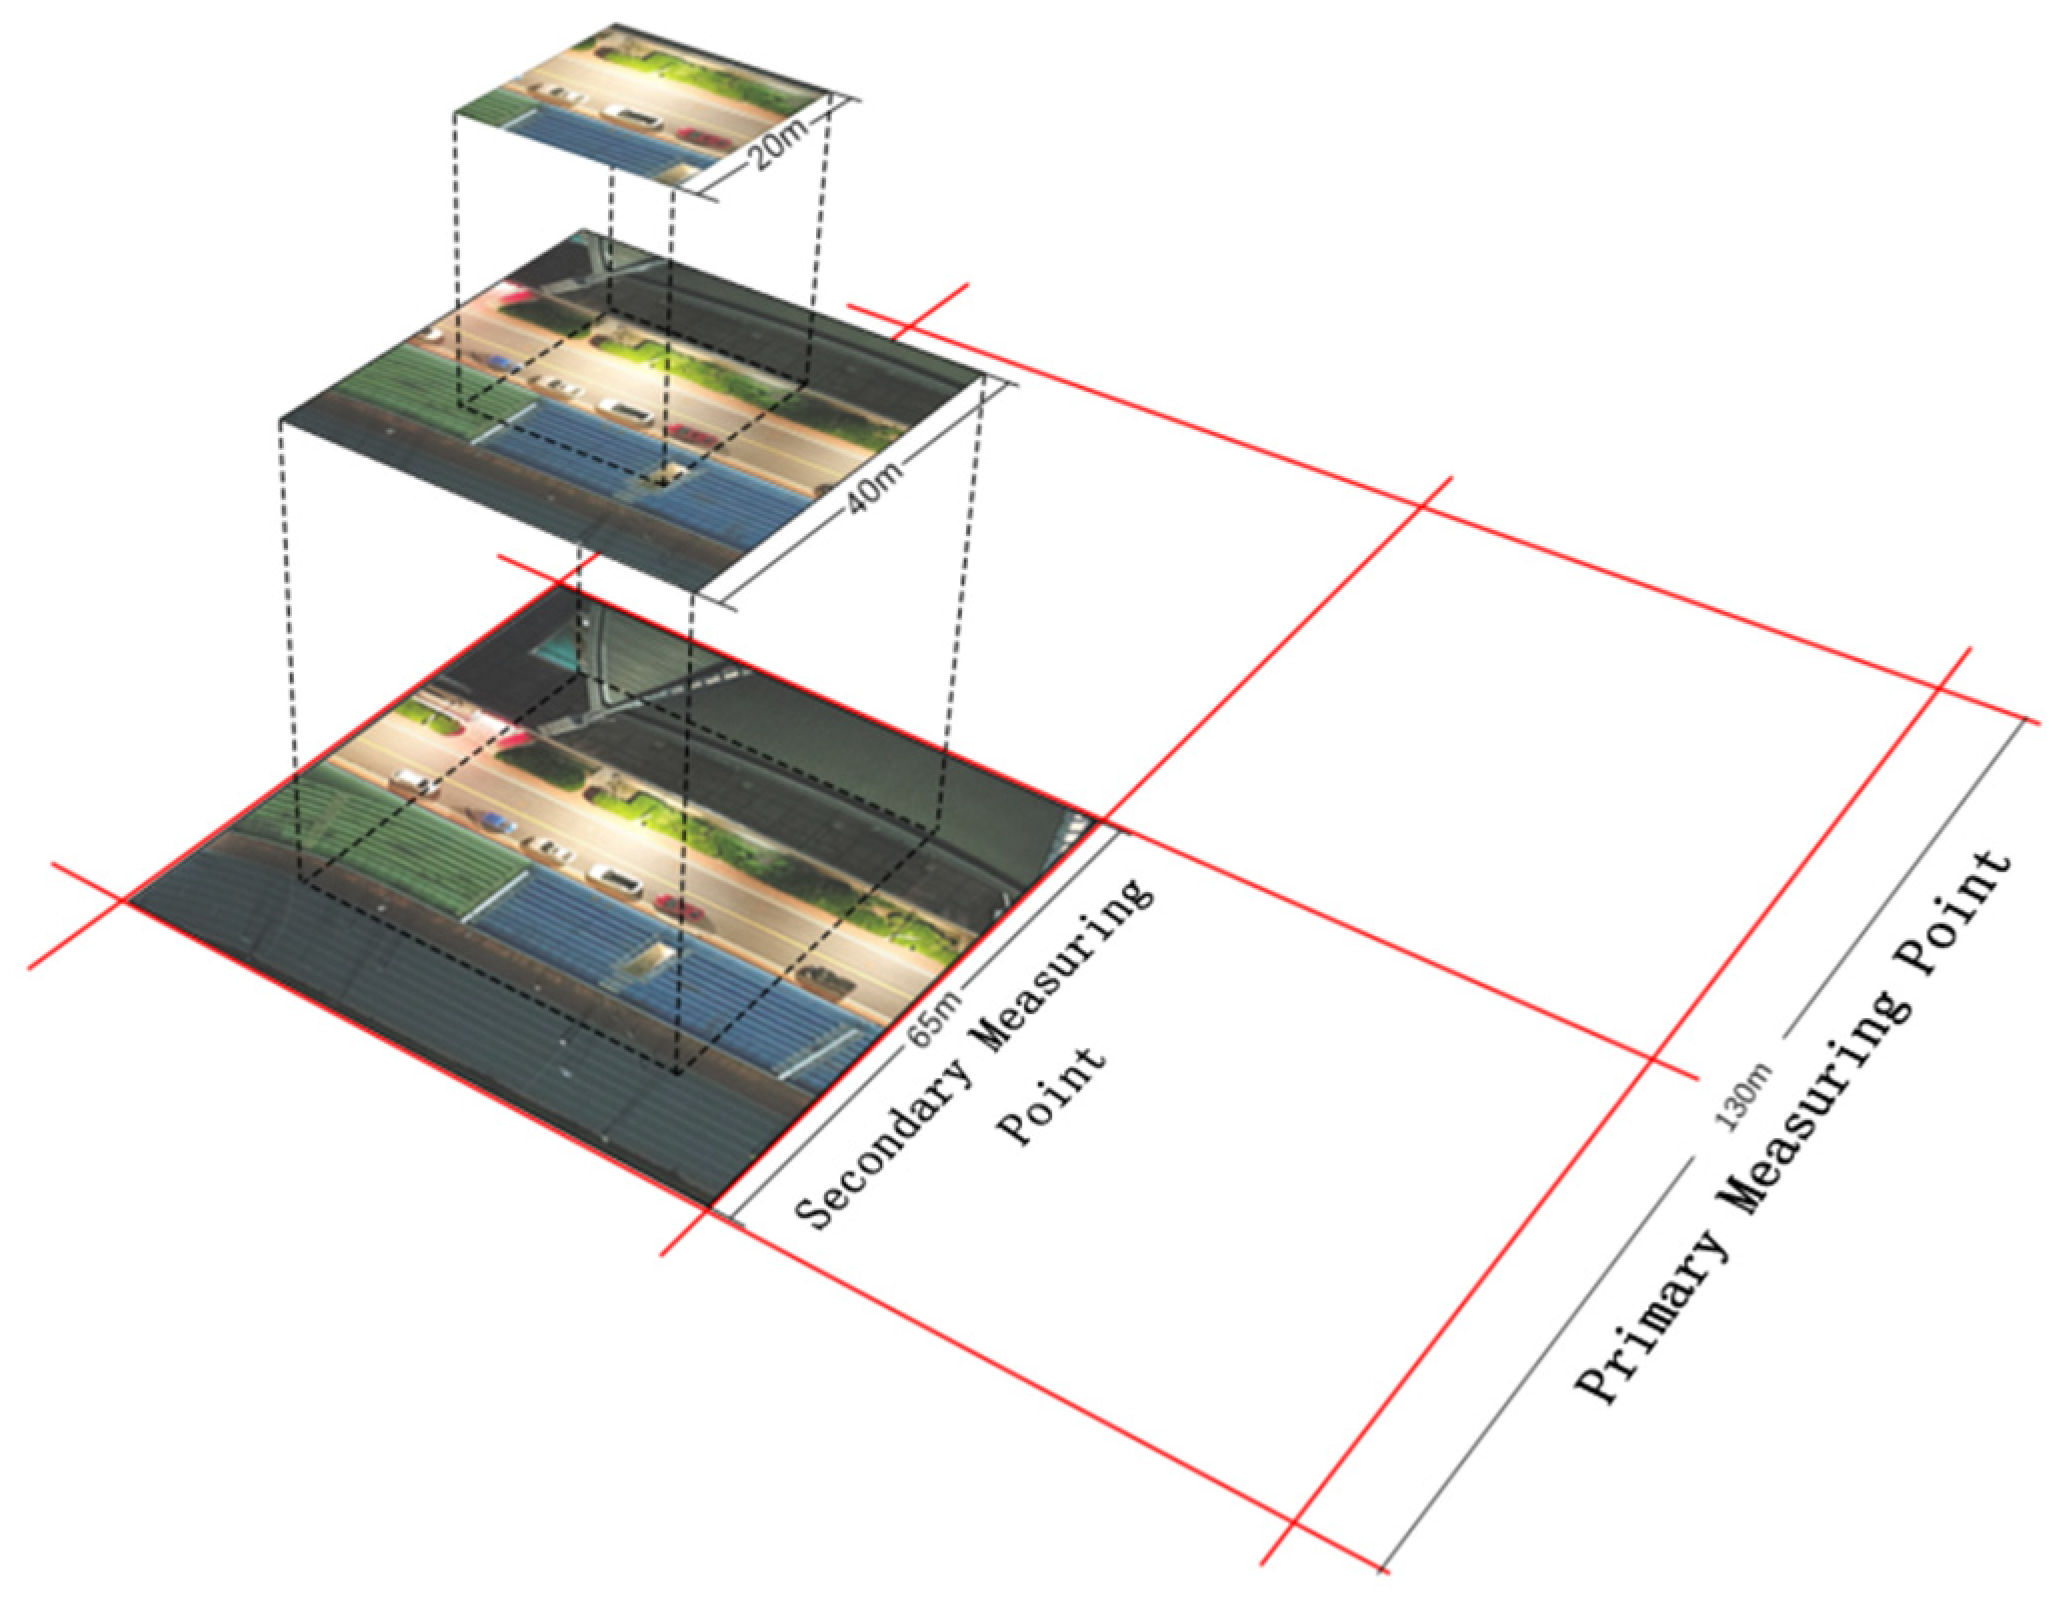
2.2.3. UAV Measurement Data

This study uses the DJ Phantom 4 UAV, which supports both JPEG and DNG image formats. The parameters for the drone image are ISO–1600, f/2.8, and 1/4 s. In this study, the UAV flies to an altitude of 100 m relative to the ground (with a height limit of 120 m), and the JPG images captured vertically downwards are used as aerial data for the UAV (Figure 7). The UAV aerial photography points are located according to the measured grid mentioned above, and the aerial photography points correspond vertically to the ground–measured secondary measurement points.
Using MATLAB R2022b software to extract the Digital Number (DN) values of the pixels in the R, G, and B channels of an image, the color luminance (L) of R, G, and B is calculated based on the CIE–XYZ color space system as follows:
L = R + 4.5907G + 0.0601B,
The luminance formula L = R + 4.5907G + 0.0601B is derived from the 1931 CIE–RGB color space standard, which specifies the spectral tristimulus values for the standard colorimetric observer. The coefficients within this equation correspond to the relative luminous contributions of the red, green, and blue components to human vision. Specifically, within the 1931 CIE–RGB system, the luminance ratios for equal quantities of the primary colors are defined as L(R):L(G):L(B) = 1.0000:4.5907:0.0601. This ratio illustrates that the green component has a substantially greater influence on perceived luminance, approximately 4.59 times that of the red component, while the contribution of the blue component is minimal. The equation L = R + 4.5907G + 0.0601B encapsulates the relative luminance of a color, with R, G, and B denoting the tristimulus values and L representing their weighted sum, indicative of the overall brightness perception [50].
The luminance of the four secondary measurement point aerial photos is assigned to the primary measurement points. And the aerial images are cropped into the following three scales: 65 m (L65), 40 m (L40), and 20 m (L20) to study the relationship between aerial data and ground–measured data at different scales (Figure 8).

3. Result and Analysis

3.1. Data Analysis

3.1.1. Ground–Measured Data and Remote Sensing Data

To investigate the relationship between ground–based measurements and remote sensing data, regression analyses are conducted between ground–based measurements and the R(Sr), G(Sg), and B(Sb) bands of SDGSAT–1. The fitting degrees of the three bands with El are as follows: Sr > Sg > Sb (Figure 9). The fitting degrees of the three observation windows with Sr are as follows: horizontal > down > up (Figure 10).

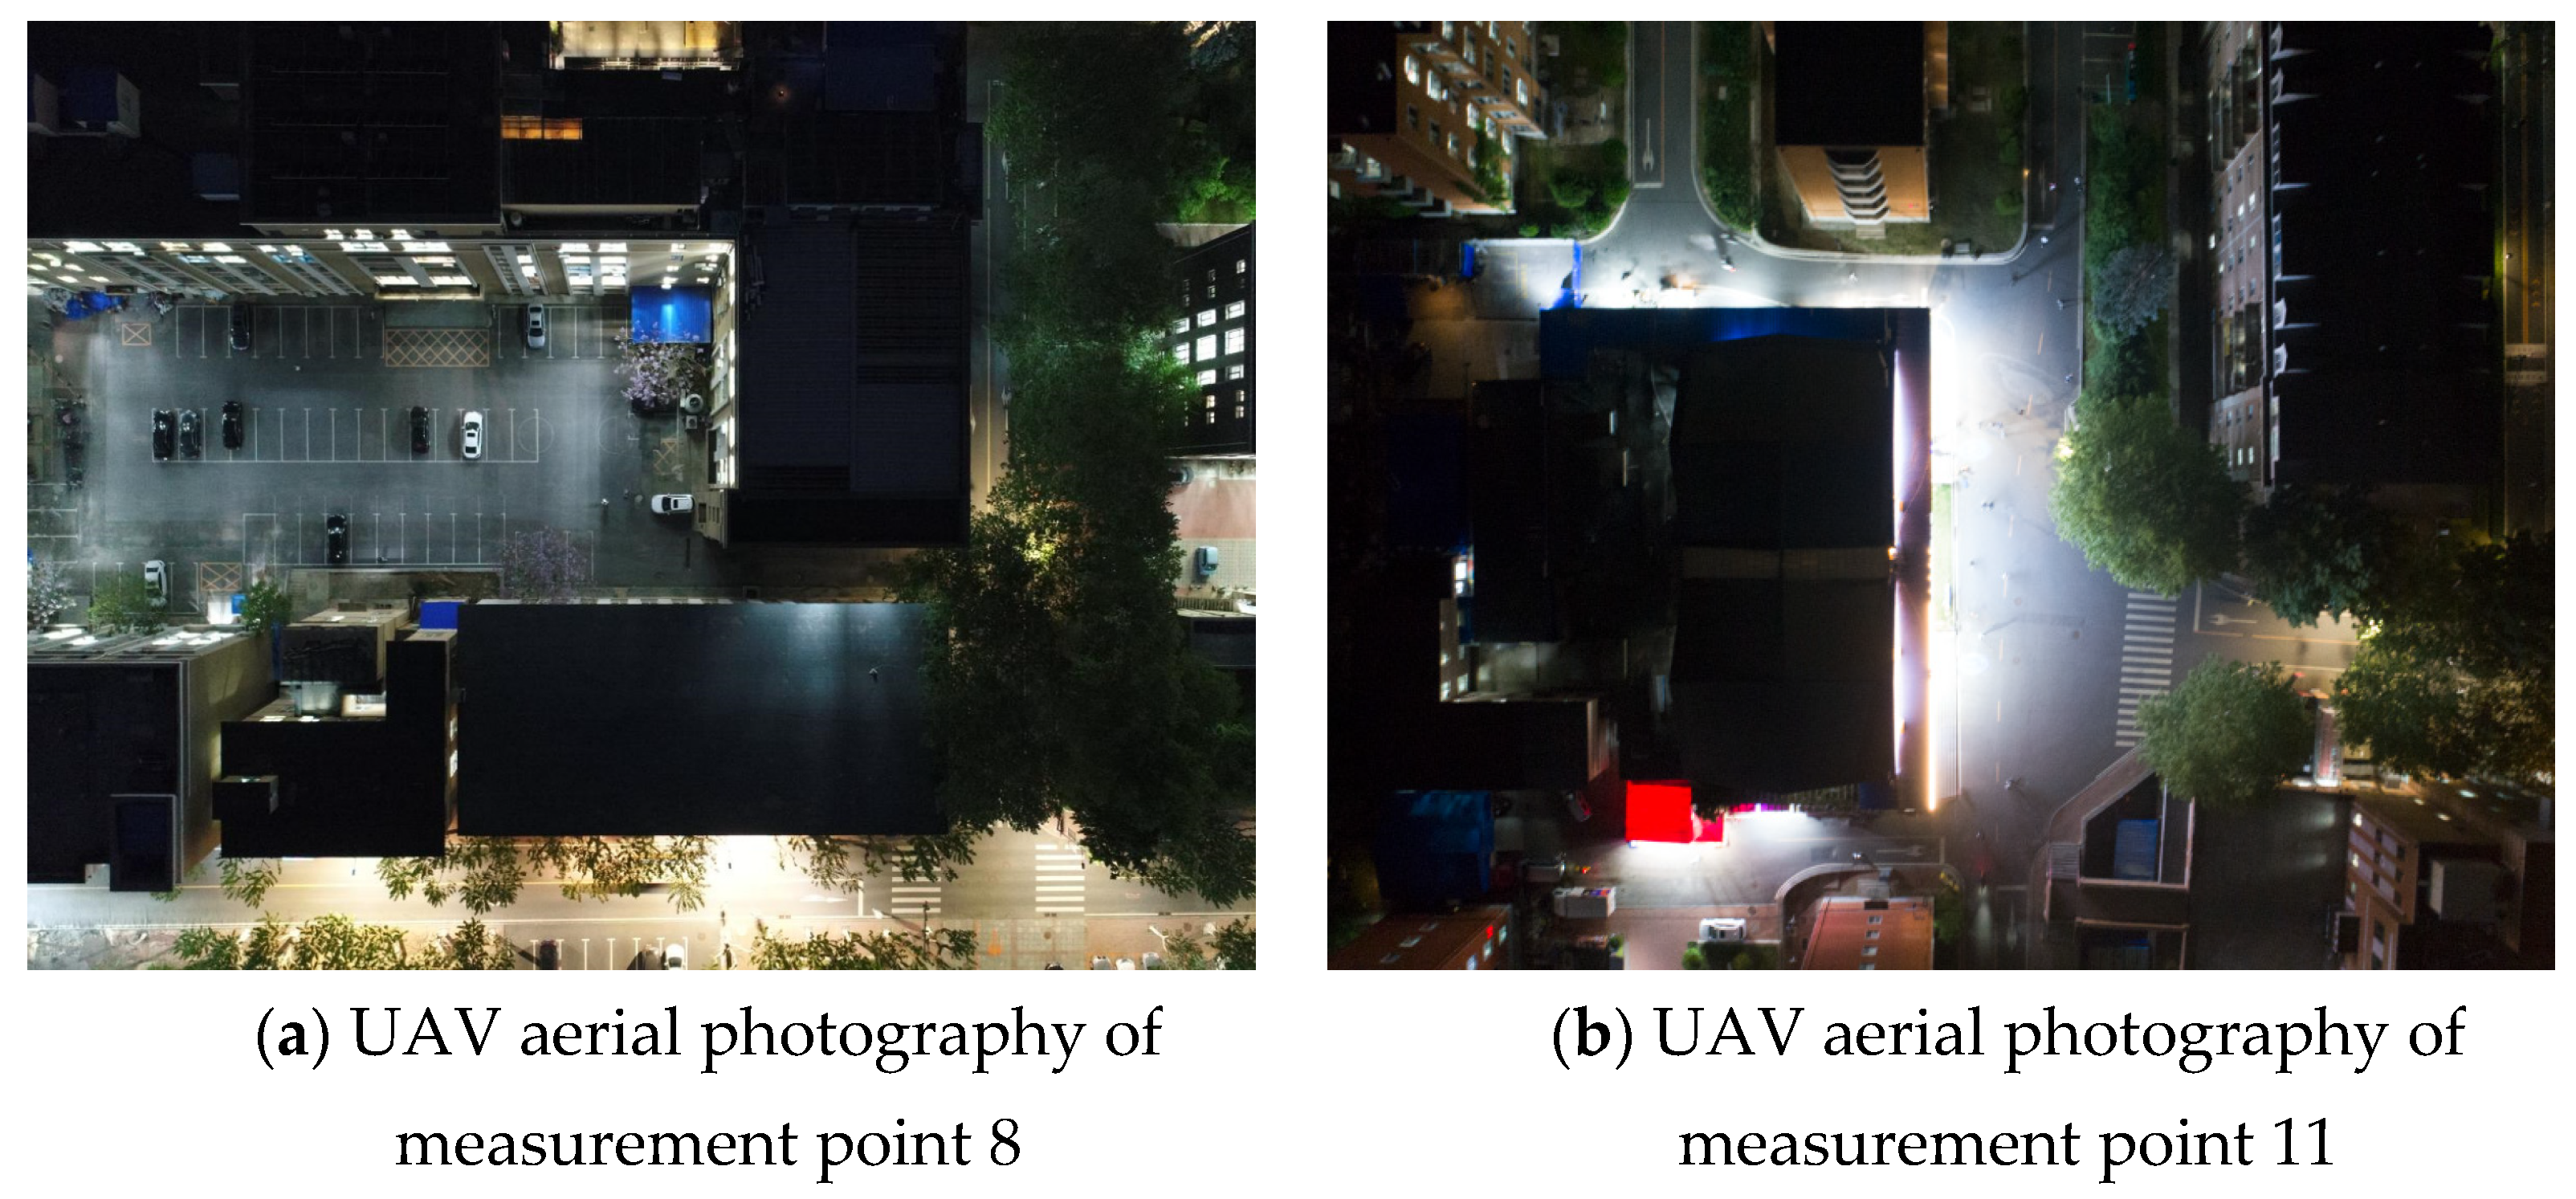
3.1.2. Ground–Measured Data and UAV Aerial Photography Data

The limitations of measurement distance and environmental factors on ground–measured data may lead to inconsistency between the ground–measured range and the UAV aerial photography range. To study the relationship between ground–measured data and UAV aerial images, regression analysis is performed on the ground–measured data with UAV aerial images at three scales of 65 m, 40 m, and 20 m, respectively.
The fitting degrees between ground illuminance data and drone aerial photography data are as follows: horizontal > down > up (Figure 11). The fitting degrees of three–view illuminance data with different scales of drone data are: L65 > L40 > L20 (Figure 12).

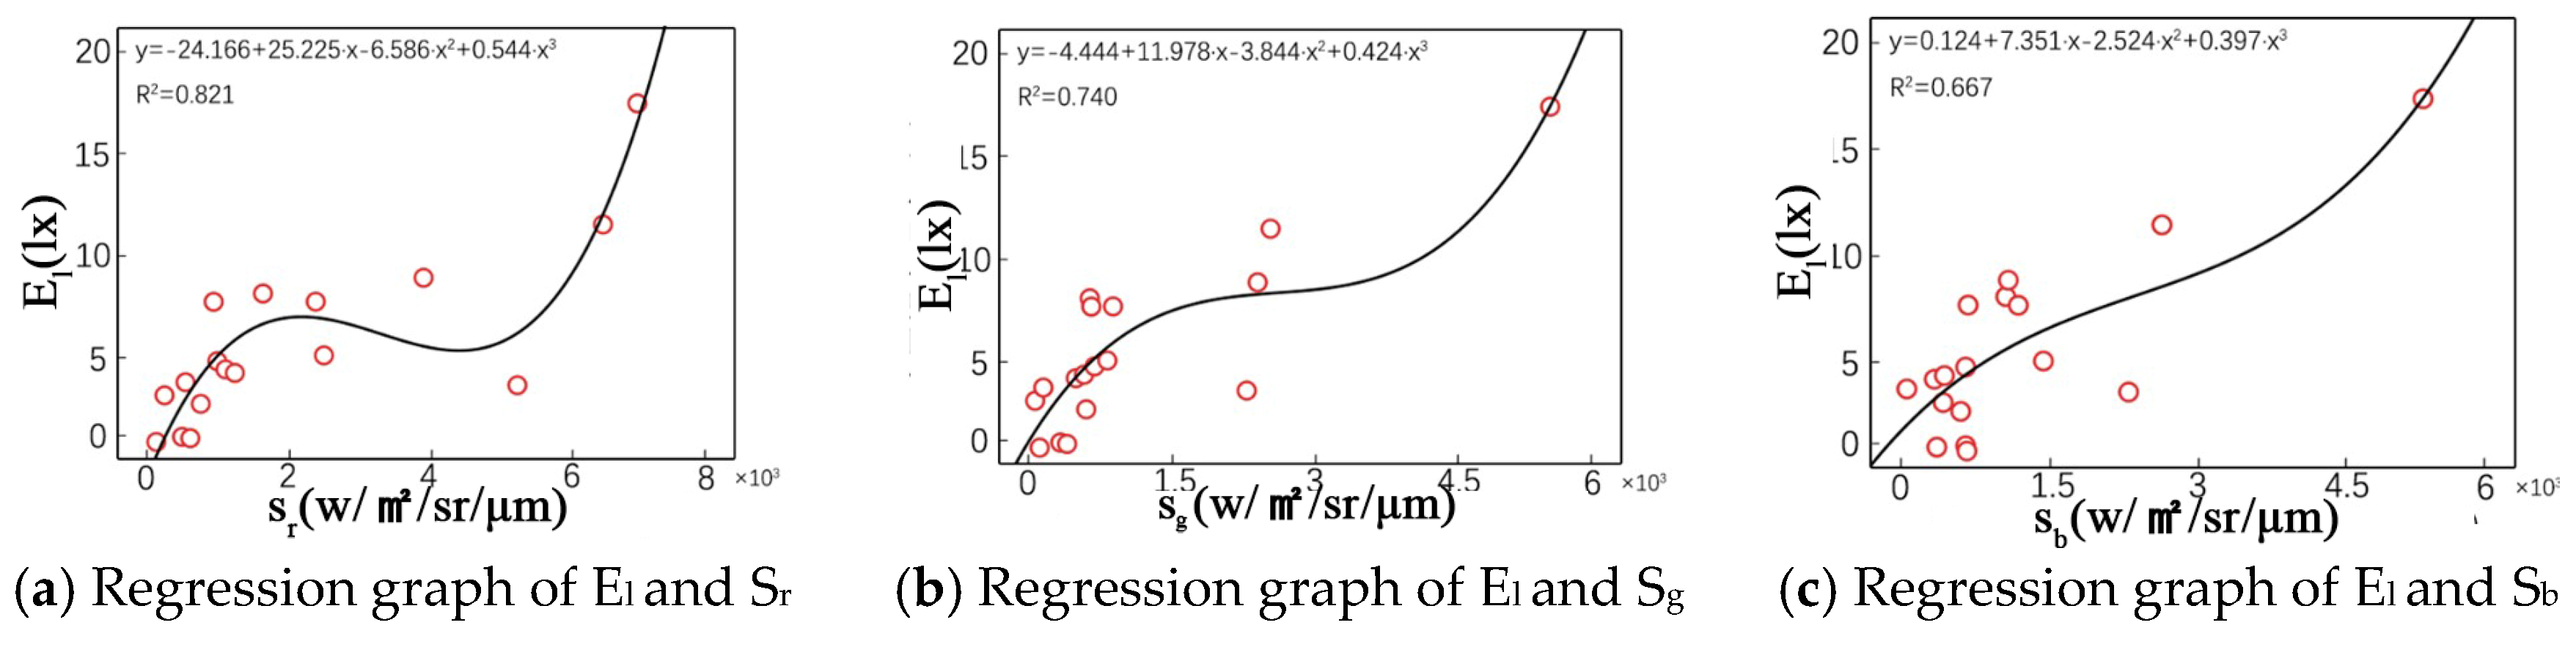
3.1.3. UAV Aerial Photography Data and Remote Sensing Data

To investigate the relationship between drone aerial data and remote sensing data, regression models are established. These models consider the brightness of drone aerial photography as the dependent variable and the three bands of remote sensing data as independent variables (Figure 13). In terms of the fitting degree between remote sensing data and drone aerial photography data, Sr > Sg > Sb.

3.2. Data Comparative Analysis

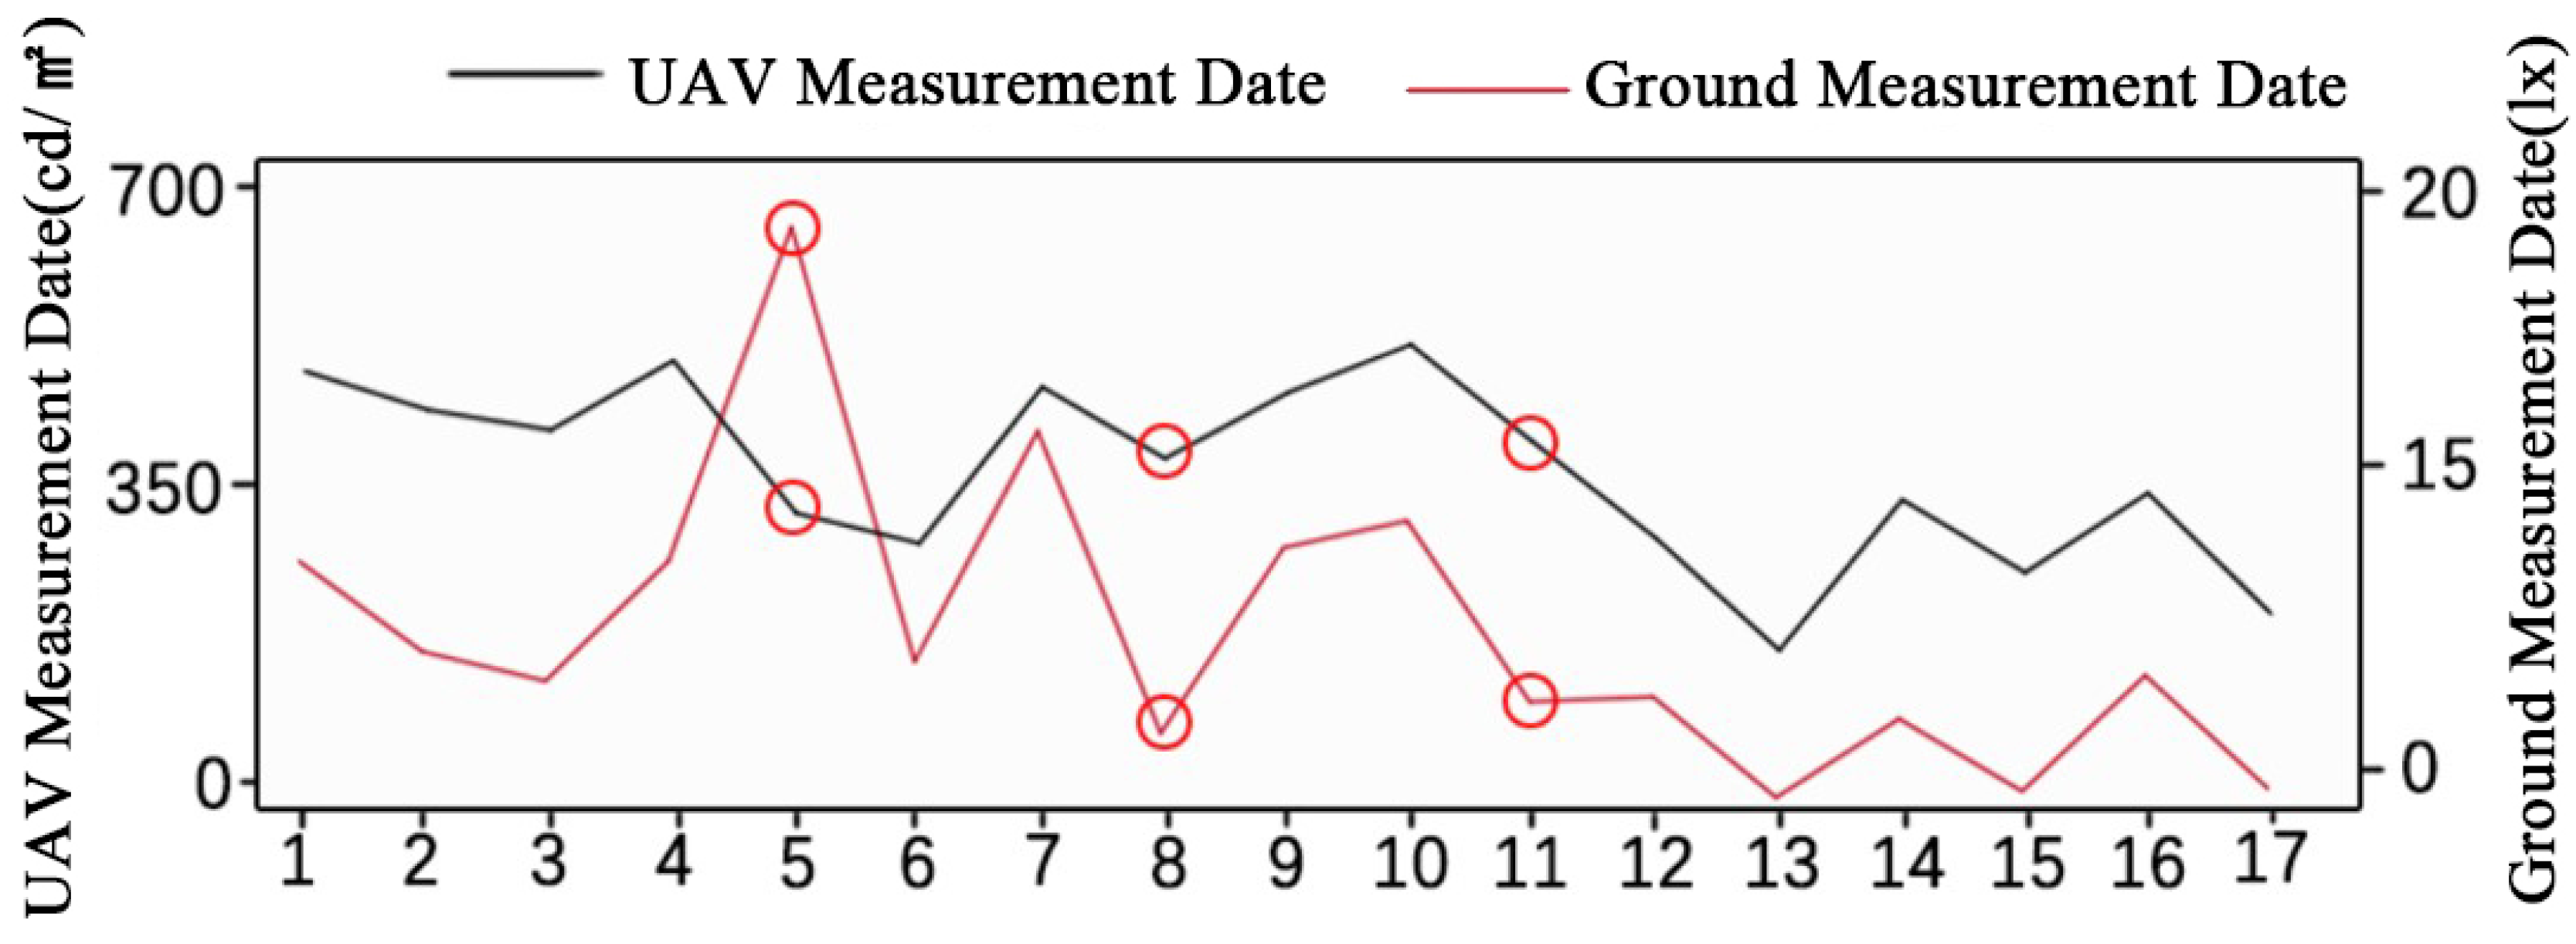
3.2.1. Ground–Measured Data and UAV Aerial Photography Data Comparative Analysis

From the fitting graph of the data above, it can be observed that there are a few prominent outlier data points. Using the same X–axis to represent the locations and plotting the illuminance (E) and luminance (L) data separately on the Y–axis, a coordinate system is established graphically to compare the variation trends between the UAV data and ground measurements data (Figure 14). From the graph, it is evident that El and L65 exhibit opposite variation trends at measurement points 5, 8, and 11. Specifically at point 5, L is lower while E is higher. Observing the drone image of this point (Figure 15), it is noted that the measurement is located at the eastern edge of the study area. Among the five measurement points, 5A and 5D represent outdoor sports areas with high campus lighting intensity, while 5B and 5C represent urban roads and residential areas with low nighttime lighting intensity. In the ground measurements of 5B and 5C regions, due to environmental constraints such as slope and greenery (Figure 16), it is not feasible to obtain lighting information for the residential areas through ground measurements, resulting in an overall higher measured value for that measurement point. However, drones are not affected by ground environment limitations and can capture most of the lighting information within the measurement points.
By observing the drone images of points 8 and 11 (Figure 17), both areas have intricate layouts of buildings and greenery, leading to the internal segmentation of the regions into multiple sections by buildings and vegetation. These sections exhibit distinct lighting conditions, potentially influenced by diffuse light from building facades, commercial lighting, and road illumination. During single–point ground lighting measurements, the covered area is limited due to obstructions caused by buildings and vegetation, making it challenging to comprehensively collect lighting information. Conversely, employing drones for aerial surveys provides an overhead view of the entire area, circumventing the aforementioned issues and yielding a more comprehensive understanding of the lighting conditions across the region.

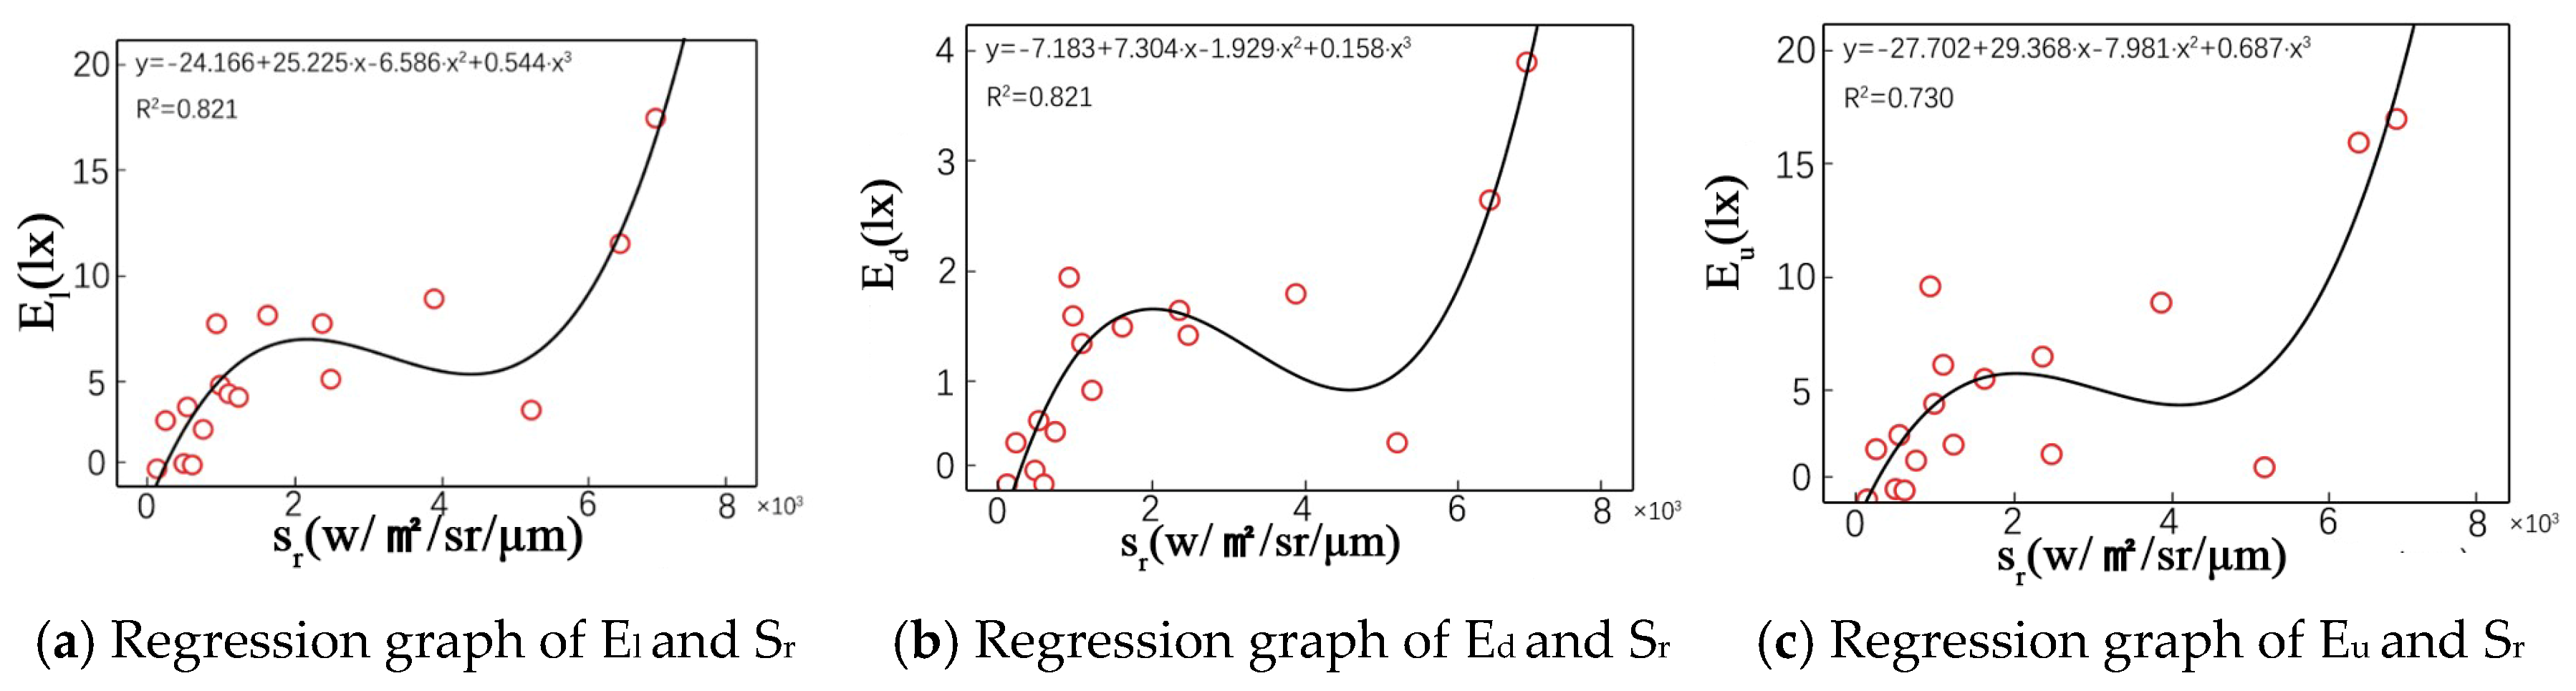
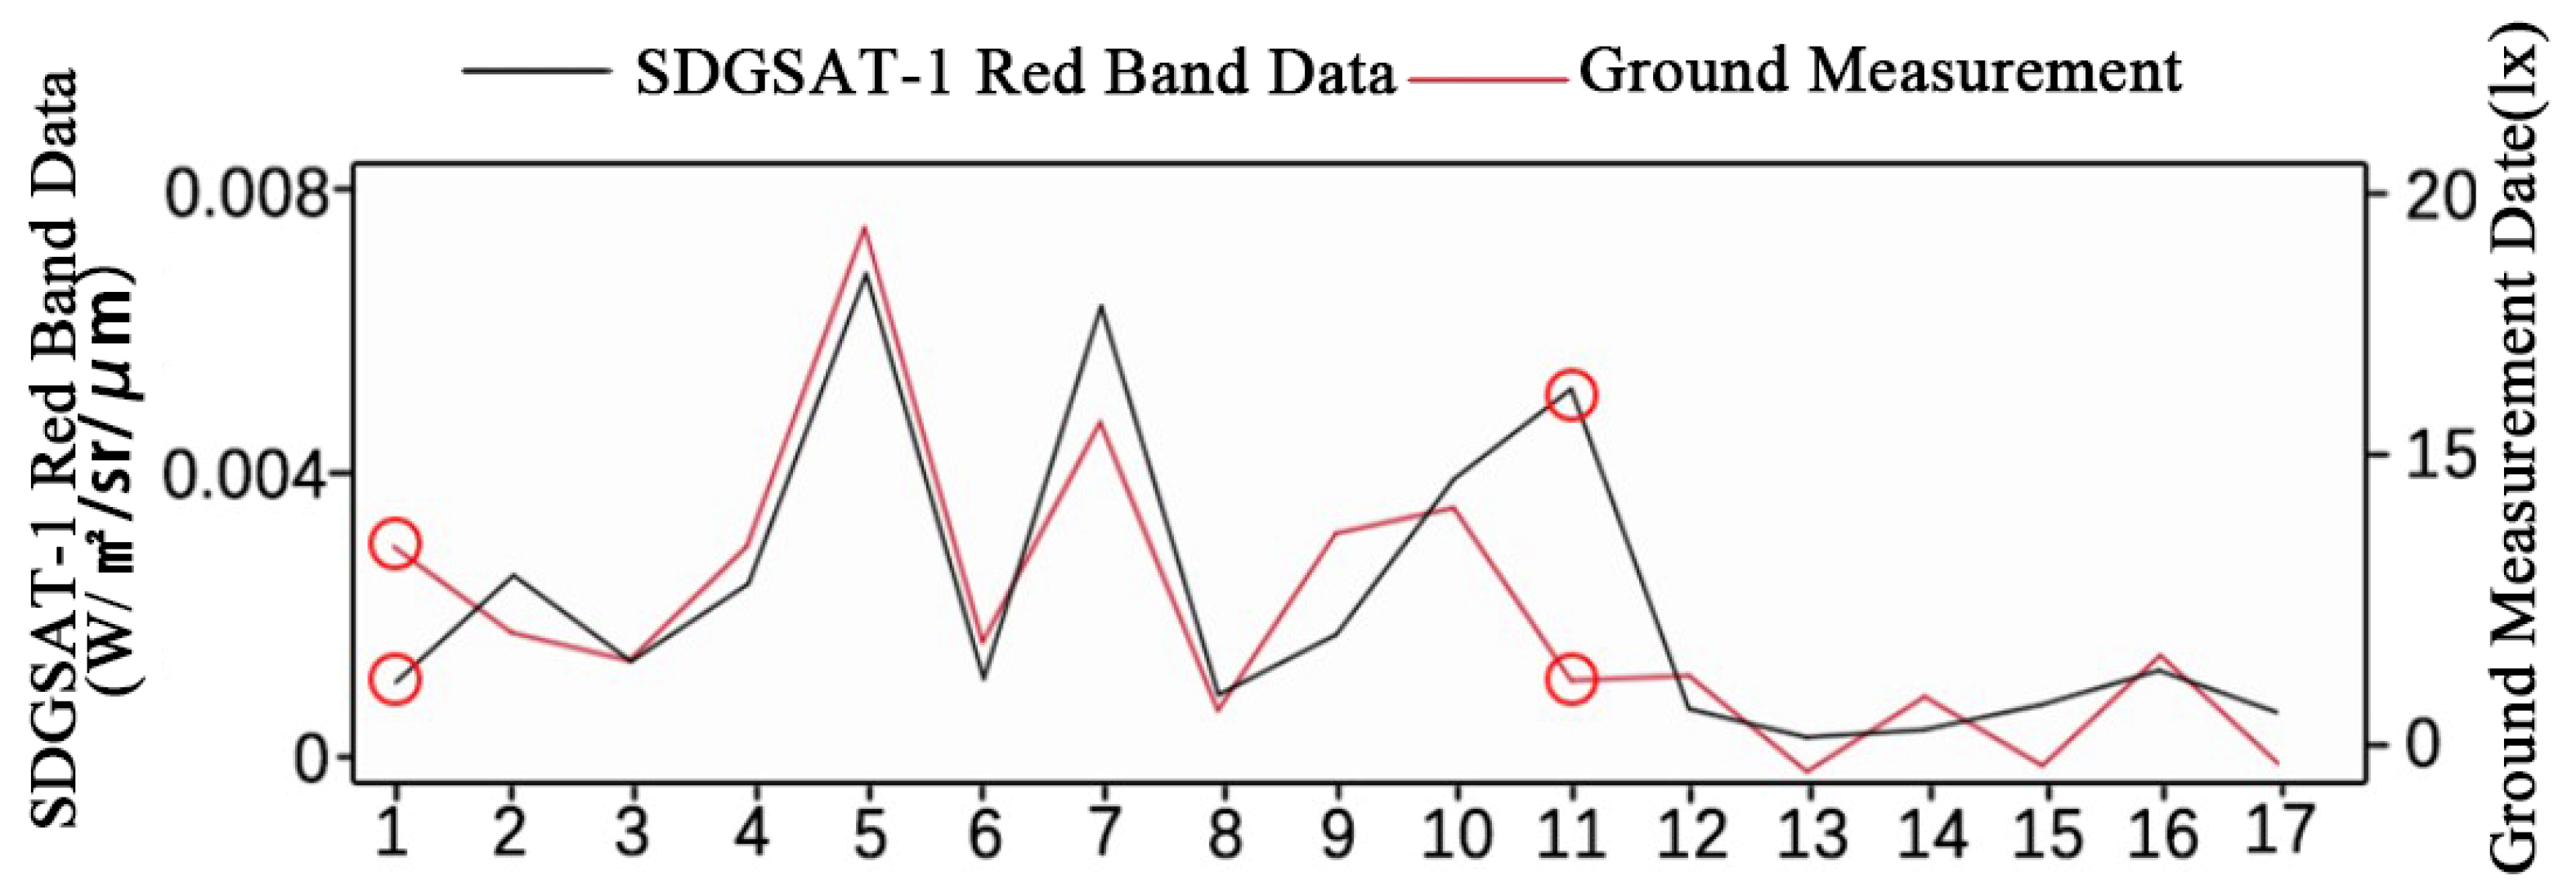
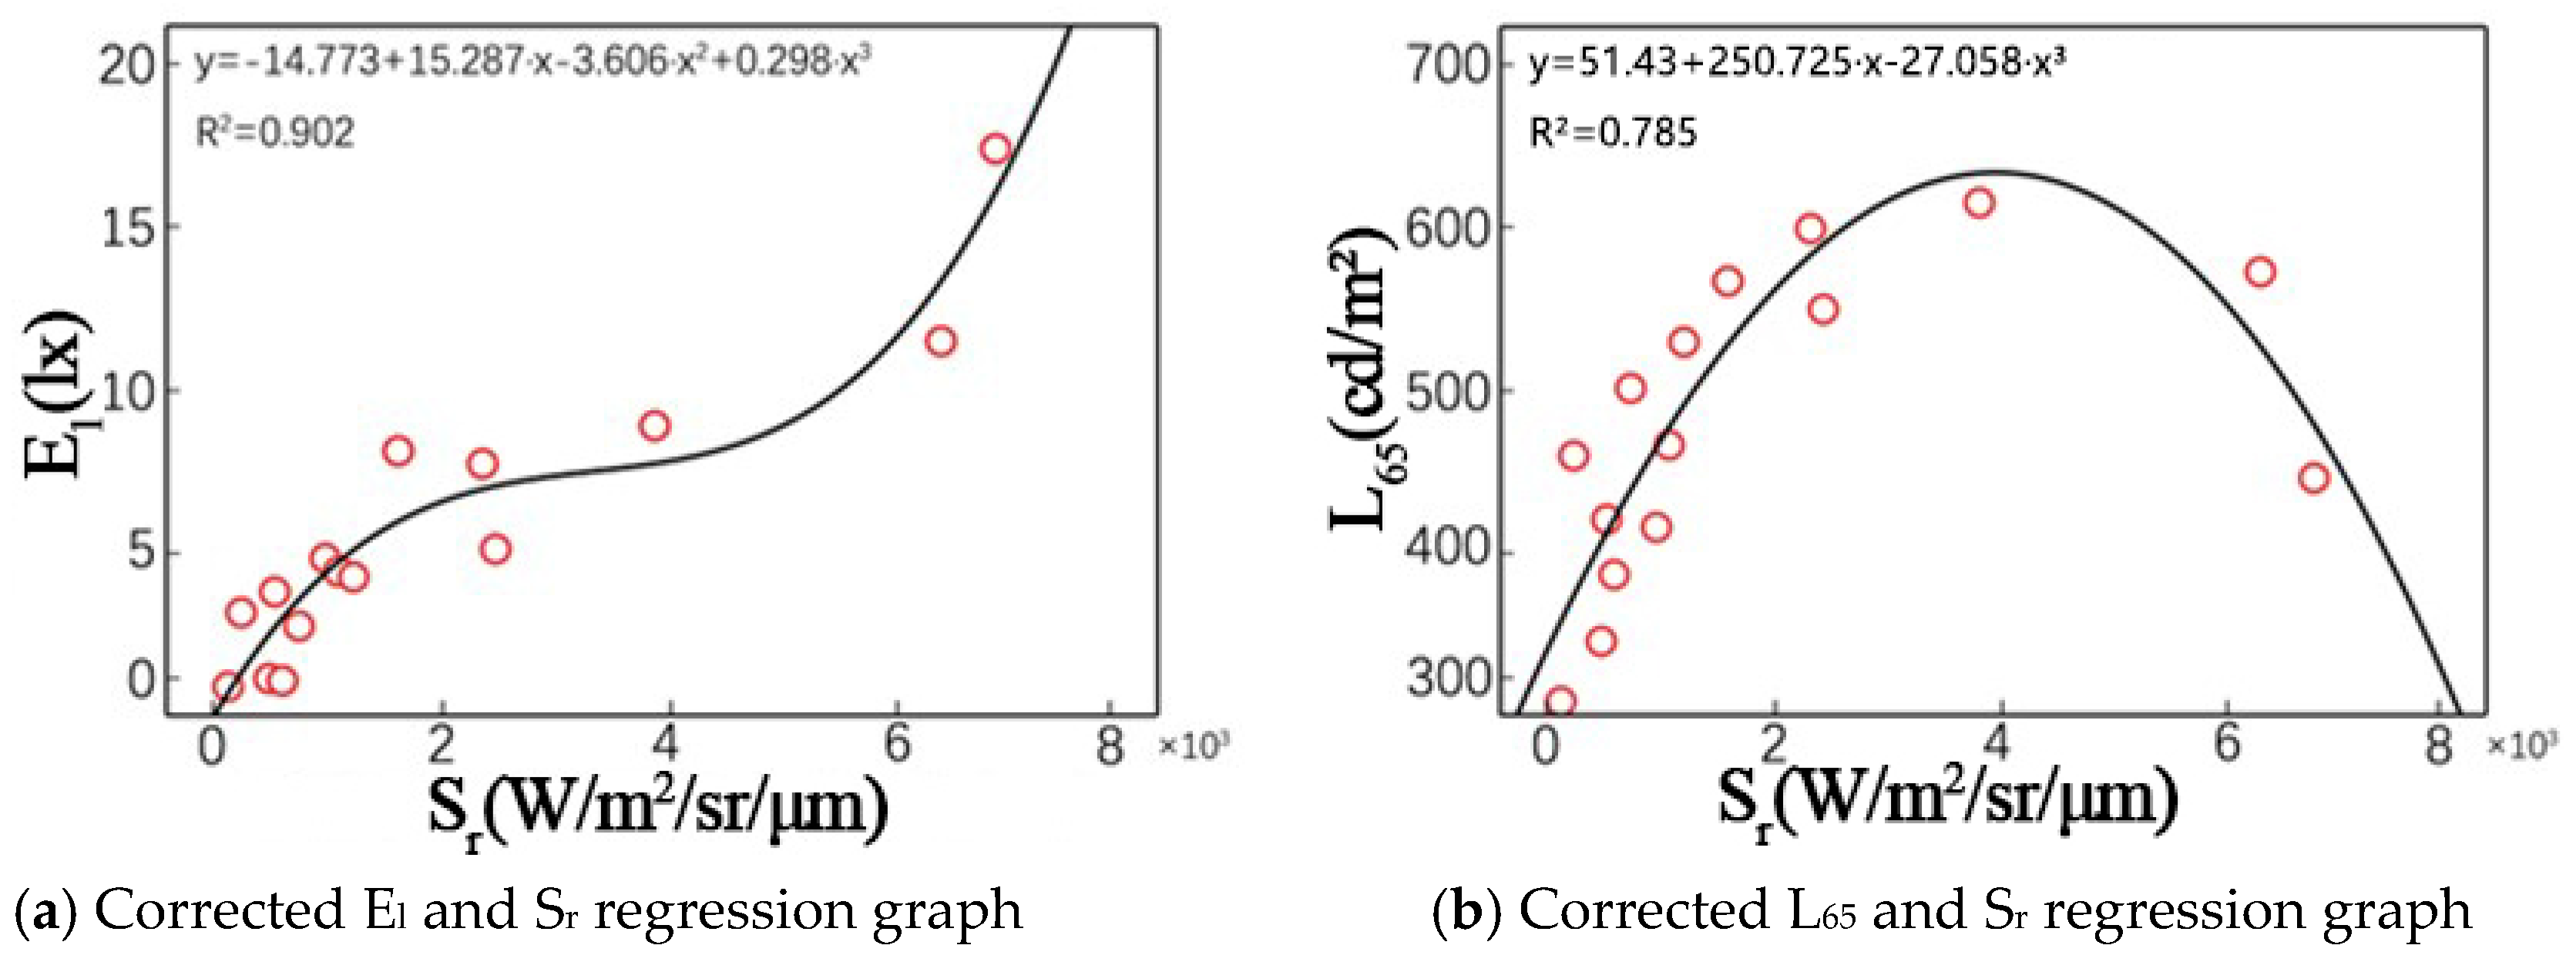
3.2.2. Ground–Measured Data and Remote Sensing Data Comparative Analysis
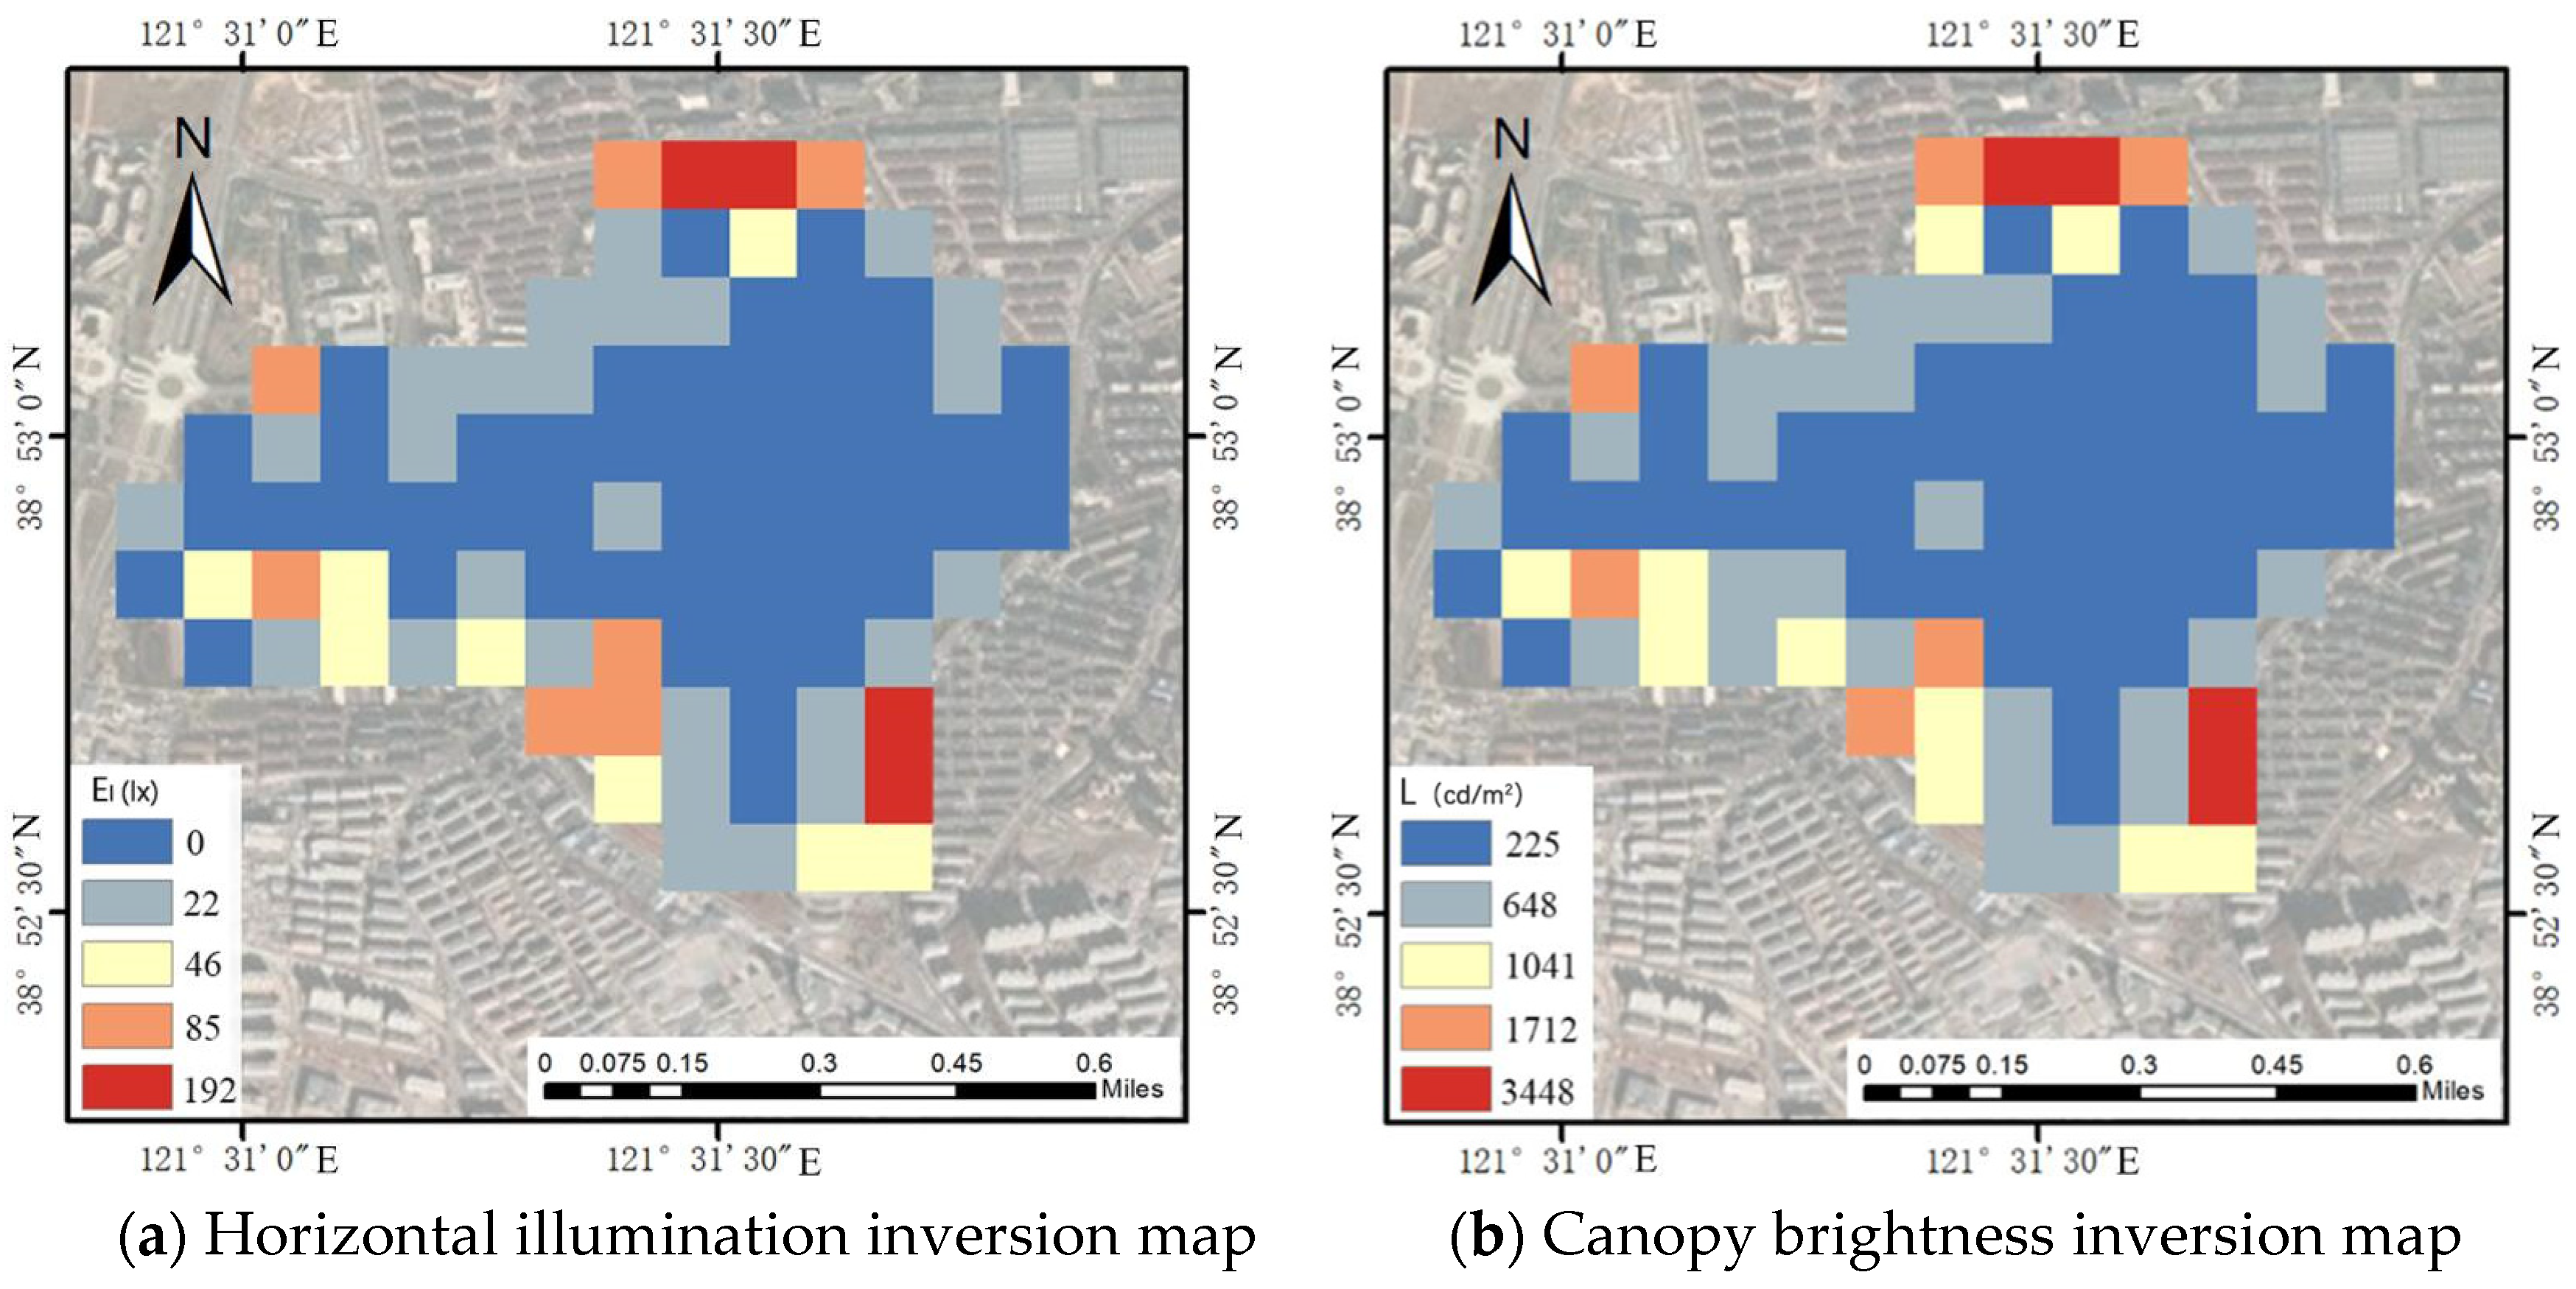
Using the same X–axis to represent measurement points and plotting illuminance (E) and radiance values (Sr) data on the Y–axis, a coordinate system is established to graphically compare the trends between actual measurements and remote sensing (Figure 18). Combining information from the previous curve fitting graphs, it is evident that E and R exhibit opposing trends at points 1 and 11. At point 1, E is higher, and Sr is lower. Observing the drone image for this point (Figure 19), it is apparent that the primary light source is the outward scattering of indoor lighting from buildings. This can be captured through drone aerial photography and ground measurement instruments. However, the satellite’s higher spatial position, compared to the previous two satellites, weakens its ability to capture the vertical facades of buildings (Figure 20). These reasons lead to the remote sensing observations at point 1 being lower than the actual ground illuminance. The reasons for differences observed at point 11 are the same as described earlier.

3.3. Inversion Map

By establishing a mathematical relationship between remote sensing data and ground truth measurements, an inversion model for urban nighttime light environments on the ground is constructed. In the inversion results, the ground data obtained from the inversion model combine the advantages of both remote sensing and actual measurements. Compared to the ground truth data, the inverted data offer the advantages of broader coverage and higher regional data consistency. In contrast to remote sensing radiance data, the inversion results possess advantages such as photometric calibration and high accuracy.
Based on the analysis in the preceding text, after excluding data from measurement points 1 and 11, curve fitting is performed for the two types of actual measurement data with Sr. The optimal curve fitting for E and Sr is illustrated in Figure 21a. The mathematical inversion model for El and Sr within the study area is as follows:
El = −14.773 + 15.287 × Sr −3.606 × Sr2+ 0.298 × Sr3
The optimal curve fitting for L65 and Sr is depicted in Figure 21b. The mathematical inversion model for L65 and Sr within the study area is as follows:
L65 = 51.43 + 250.725 × Sr − 27.058 × Sr3
Utilizing the data visualization functionality of ArcGIS, the inverted map of ground illumination and the inverted map of canopy top brightness within the study area are plotted (Figure 22).

3.4. Analysis of Campus Nighttime Light Environment and Verification of Inversion Results

The nighttime lighting environment of outdoor public spaces affects the safety and comfort of pedestrians after dark [51]. The lighting attributes that influence the above perceptions mainly include illuminance, color temperature, uniformity, glare, etc. [52]. Portnov et al. found a positive correlation between FoS, light level, and uniformity in their study [53]. Saad et al.’s research shows that by using warmer light and increasing the uniformity of light, 30–50% of road lighting energy can be saved while maintaining a reasonable level of safety perception [54].
From the above research, it can be seen that illuminance and illuminance uniformity are important factors that affect the safety and comfort of pedestrians at night. This section is based on inverted maps, with illumination and uniformity as the main parameters to analyze the nighttime light environment on campus. Meanwhile, by conducting on–site research and comparing the inversion results with the actual light environment, the accuracy of the inversion results is verified.

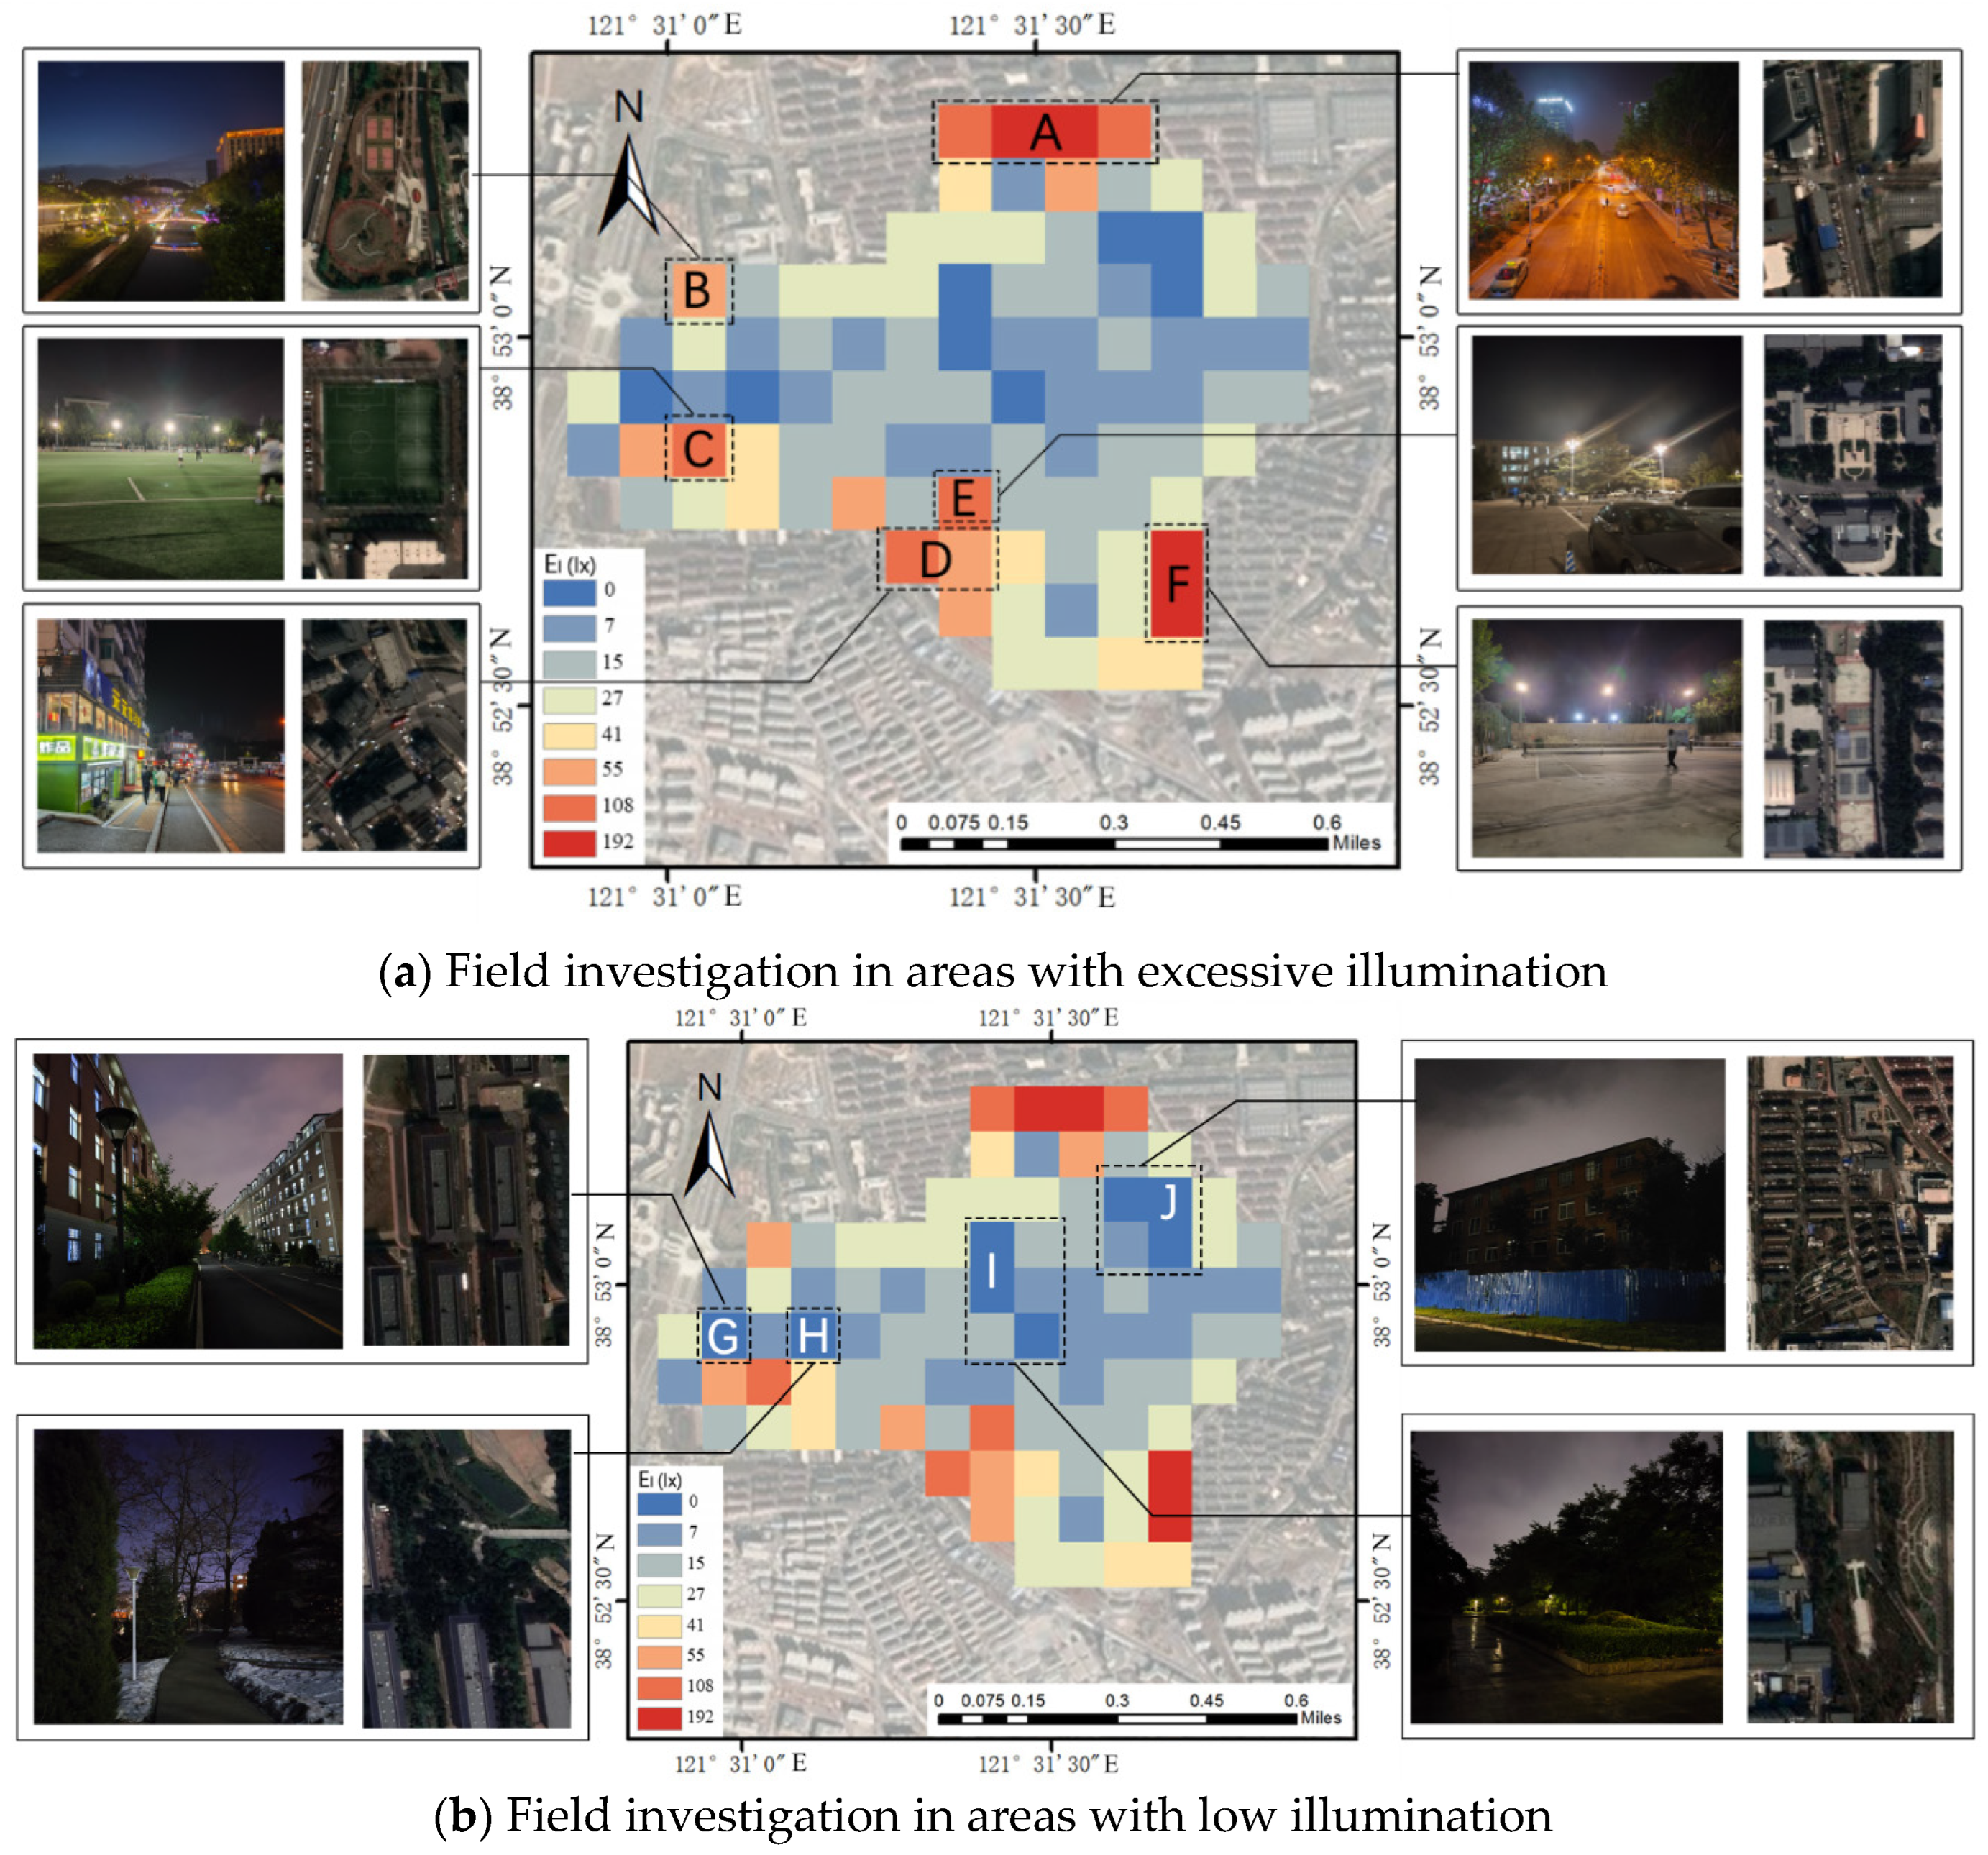
3.4.1. Verification of Campus Nighttime Environmental Illumination and Inversion Results

Applying the natural breaks method [55], the data are segmented into eight intervals, and visual representation is conducted using ArcGIS. Figure 23 illustrates the distribution of excessive and insufficient lighting within the study area. Combining this with real–world imagery provides a more intuitive understanding.
Area A is located on the north boundary of the campus and adjacent to the urban road, and its high grid environmental illumination is mainly affected by urban road lighting and commercial lighting. Area B is mainly used for transportation, with Dalian Management College located above it. From the actual photos, Dalian Management College uses a large amount of outdoor landscape lighting and building lighting, resulting in excessive lighting intensity in Area B. Area C is the campus cafeteria and outdoor football field. The square in front of the cafeteria and the football field both use lamps with a large lighting range and high lighting intensity, and there is no obstruction around or above the area, resulting in excessive environmental illumination in the area. Area D is adjacent to urban roads, and the reason for its high environmental illumination is the same as Area A. Area E is an outdoor plaza with extremely high illuminance from the lighting fixtures, and their diffusion extends quite extensively. Despite having some green cover in this area, the height of the fixtures significantly surpasses the vegetation layer, resulting in excessively high illuminance. Area F, identified as an outdoor sports facility, similarly exhibits elevated nighttime illumination.
In areas with insufficient lighting, Area G corresponds to residential quarters where some road lighting is damaged, resulting in inadequate illumination. Area H and I are green landscape areas that experience lower nighttime utilization, leading to reduced illumination. Area J is a construction area with limited nighttime lighting facilities.
In summary, areas with excessive lighting are mainly affected by the lighting intensity of the surrounding environment, followed by areas with high lighting intensity and a lack of occlusion measures. Most of the areas with excessively dark lighting are areas that are rarely used at night, such as greenery and vacant spaces. Some dormitory areas lack road lighting, resulting in excessively dark lighting.
At the same time, from the actual images corresponding to the inverted map in Figure 22, it can be seen that the areas that are too bright and too dark in the inverted map are consistent with the actual lighting environment, indicating that the inversion results are in good agreement with the actual lighting situation.

3.4.2. Uniformity of Campus Night Environment Illumination

The ‘Lighting Measurement Methods’ GB/T 5700—2023 specify that the definition of lighting uniformity is the ratio of the minimum illuminance to the average illuminance on the defined surface [56]. This definition is suitable for the study of light environments in local areas or small ranges but not applicable to large–scale studies measured by grid scales. This paper defines the absolute value of the difference between the illuminance of the central grid and the average illuminance of the adjacent eight grids as the illuminance difference value of the central grid (e–point illuminance difference = |(Ea + Eb + Ec + Ed + Ef + Eg + Eh + Ei)/8 − Ee|, Figure 24). It represents the uniformity of illuminance in a 3 × 3 grid area. The higher the illuminance difference value, the worse the uniformity of illuminance in that range. The lower the illuminance difference value, the better the uniformity of illuminance within that range.
The natural breaks method is applied to divide the Ed data into five intervals. Figure 25 illustrates the distribution of Ed within the study area. Contrasting Figure 25 reveals an overlap between areas with high Ed values and those experiencing excessive lighting. These areas not only exhibit relatively higher illumination intensity but also demonstrate significant differences in lighting environment compared to their surrounding areas. This indicates the presence of an uneven distribution of lighting within the studied region.

3.4.3. Influence Factors of Environmental Illuminance and Illuminance Uniformity

From the above two sections, it can be seen that the lighting intensity within a single grid not only affects the environmental lighting of the grid itself but also affects the environmental illumination and uniformity of illumination within the surrounding grids, caused by light diffuses into the surrounding area through various propagation methods [57]. Secondly, the lighting method and lighting fixtures can also affect the environmental illuminance and uniformity of illumination. As shown in Figure 23, the lighting fixtures used in areas C and E have high intensity, dense lighting arrangements, and a lack of obstruction around them.

4. Conclusions

This paper combines ground measurements, unmanned aerial photography, and remote sensing to propose an integrated urban light environment measurement method that combines sky, land, and sea perspectives. Vertically corresponding layered nighttime light environment maps are created (Figure 26), providing a new approach for the monitoring and management of urban light pollution. The corrected data exhibit a high degree of consistency, indicating that drones are an effective tool for measuring the urban nighttime light environment. At the same time, unmanned aerial photography also provides a new pathway for observing the urban canopy and nighttime light environment.
There are certain limitations and deficiencies in this study, such as the need for manual operation in unmanned aerial photography, which reduces the accuracy of the captured images and increases labor costs. The density of measurement points needs to be determined based on the study area.
In future research, measurements will be conducted within the urban area, increasing the measurement range and the diversity of measurement area functions, to verify the universality of the integrated sky–land nighttime light environment measurement method for urban nighttime light environments. Furthermore, the color images of unmanned aerial photography are combined with remote sensing images to further explore the characteristics of urban nighttime light environments, such as color temperature. Based on the integrated sky–land urban light environment measurement method, the impact of the nighttime light environment on human health, wildlife, and ecosystem processes and proposed mitigation strategies for urban light pollution are analyzed.

Author Contributions

Conceptualization, M.L., B.Z. and R.L.; methodology, M.L., B.Z. and R.L.; software, J.L. and L.F.; validation, J.L. and H.Z.; formal analysis, J.L.; investigation, R.L. and L.F.; resources, M.L.; data curation, L.F.; writing—original draft preparation, B.Z. and M.L.; writing—review and editing, M.L., B.Z., W.J. and L.L.; visualization, M.L. and L.F.; supervision, M.L., B.Z., W.J. and L.L.; and funding acquisition, M.L. All authors have read and agreed to the published version of the manuscript.

Funding

This research was funded by the National Natural Science Foundation of China, grant number 52178067, and the National Key Research and Development Program of China, grant number 2017YFE0125900.

Data Availability Statement

The ground-based observation data presented in this study are available on request from the corresponding author.

Acknowledgments

The authors would like to thank editors and the anonymous reviewers for their valuable and constructive comments to improve our manuscript. It is acknowledged that the SDGSAT–1 data are kindly provided by CBAS. Part of the map pictures come from the Ovie map.

Conflicts of Interest

The authors declare no conflicts of interest.

References

  1. Boyce, P.R. The benefits of light at night. Build. Environ. 2019, 151, 356–367. [Google Scholar] [CrossRef]
  2. Zielinska–Dabkowska, K.M.; Xavia, K. Looking up to the stars. A call for action to save New Zealand’s dark skies for future generations to come. Sustainability 2021, 13, 13472. [Google Scholar] [CrossRef]
  3. Riegel, K.W. Light Pollution: Outdoor lighting is a growing threat to astronomy. Science 1973, 179, 1285–1291. [Google Scholar] [CrossRef]
  4. Bennie, J.; Davies, T.W.; Cruse, D.; Gaston, K.J. Ecological effects of artificial light at night on wild plants. J. Ecol. 2016, 104, 611–620. [Google Scholar] [CrossRef]
  5. La Sorte, F.A.; Fink, D.; Buler, J.J.; Farnsworth, A.; Cabrera Cruz, S.A. Seasonal associations with urban light pollution for nocturnally migrating bird populations. Glob. Change Biol. 2017, 23, 4609–4619. [Google Scholar] [CrossRef]
  6. Dimitriadis, C.; Fournari Konstantinidou, I.; Sourbès, L.; Koutsoubas, D.; Mazaris, A.D. Reduction of sea turtle population recruitment caused by nightlight: Evidence from the Mediterranean region. Ocean Coast. Manag. 2018, 153, 108–115. [Google Scholar] [CrossRef]
  7. Rybnikova, N.; Stevens, R.G.; Gregorio, D.I.; Samociuk, H.; Portnov, B.A. Kernel density analysis reveals a halo pattern of breast cancer incidence in Connecticut. Spat. Spatio–Temporal Epidemiol. 2018, 26, 143–151. [Google Scholar] [CrossRef]
  8. Touitou, Y.; Reinberg, A.; Touitou, D. Association between light at night, melatonin secretion, sleep deprivation, and the internal clock: Health impacts and mechanisms of circadian disruption. Life Sci. 2017, 173, 94–106. [Google Scholar] [CrossRef] [PubMed]
  9. Tancredi, S.; Urbano, T.; Vinceti, M.; Filippini, T. Artificial light at night and risk of mental disorders: A systematic review. Sci. Total Environ. 2022, 833, 155185. [Google Scholar] [CrossRef]
  10. Kerem, A. Assessing the electricity energy efficiency of university campus exterior lighting system and proposing energy–saving strategies for carbon emission reduction. Microsyst. Technol. 2022, 28, 2623–2640. [Google Scholar] [CrossRef]
  11. Kyba, C.C.; Kuester, T.; Sánchez De Miguel, A.; Baugh, K.; Jechow, A.; Hölker, F.; Bennie, J.; Elvidge, C.D.; Gaston, K.J.; Guanter, L. Artificially lit surface of Earth at night increasing in radiance and extent. Sci. Adv. 2017, 3, e1701528. [Google Scholar] [CrossRef]
  12. Ying, H.; Xinshuo, Z.; Li, Q.; Rouyi, M.; Yong, C.; Jingfeng, X.; Zhen, T. Influence of colored light projected from night–time excessive luminance outdoor LED display screens on vehicle driving safety along urban roads. Build. Environ. 2021, 188, 107448. [Google Scholar]
  13. Falchi, F.; Cinzano, P.; Duriscoe, D.; Kyba, C.C.; Elvidge, C.D.; Baugh, K.; Portnov, B.A.; Rybnikova, N.A.; Furgoni, R. The new world atlas of artificial night sky brightness. Sci. Adv. 2016, 2, e1600377. [Google Scholar] [CrossRef] [PubMed]
  14. Levin, N.; Kyba, C.C.; Zhang, Q.; de Miguel, A.S.; Román, M.O.; Li, X.; Portnov, B.A.; Molthan, A.L.; Jechow, A.; Miller, S.D. Remote sensing of night lights: A review and an outlook for the future. Remote Sens. Environ. 2020, 237, 111443. [Google Scholar] [CrossRef]
  15. Ye, T.; Zhao, N.; Yang, X.; Ouyang, Z.; Liu, X.; Chen, Q.; Hu, K.; Yue, W.; Qi, J.; Li, Z. Improved population mapping for China using remotely sensed and points–of–interest data within a random forests model. Sci. Total Environ. 2019, 658, 936–946. [Google Scholar] [CrossRef]
  16. Li, M.; Zhang, W.; Zheng, X.; Xu, K. Analysis of Urban Expansion Characteristics of Yangtze River Delta Urban Agglomeration Based on Dmsp/ols Nighttime Light Data. Isprs Ann.Photogramm. Remote Sens. Spat. Inf. Sci. 2022, 3, 241–246. [Google Scholar] [CrossRef]
  17. Chen, Z.; Wei, Y.; Shi, K.; Zhao, Z.; Wang, C.; Wu, B.; Qiu, B.; Yu, B. The potential of nighttime light remote sensing data to evaluate the development of digital economy: A case study of China at the city level. Comput. Environ. Urban Syst. 2022, 92, 101749. [Google Scholar] [CrossRef]
  18. Xiao, H.; Ma, Z.; Mi, Z.; Kelsey, J.; Zheng, J.; Yin, W.; Yan, M. Spatio–temporal simulation of energy consumption in China’s provinces based on satellite night–time light data. Appl. Energy 2018, 231, 1070–1078. [Google Scholar] [CrossRef]
  19. Liu, Y. Construction and Application of Urban Nighttime Light Environment Inversion Method Based on Remote Sensing and Field Measurement. Master’s Thesis, Dalian University of Technology, Dalian, China, 2021. [Google Scholar]
  20. Tahar, M.R. Spatial Model of Sky Brightness Magnitude in Langkawi Island, Malaysia. Res. Astron. Astrophys. 2017, 17, 037. [Google Scholar] [CrossRef]
  21. Wu, P.; Xu, W.; Yao, Q.; Yuan, Q.; Chen, S.; Shen, Y.; Wang, C.; Zhang, Y. Spectral–level assessment of light pollution from urban façade lighting. Sustain. Cities Soc. 2023, 98, 104827. [Google Scholar] [CrossRef]
  22. Robles, J.; Zamorano, J.; Pascual, S.; Sánchez De Miguel, A.; Gallego, J.; Gaston, K.J. Evolution of brightness and color of the night sky in Madrid. Remote Sens. 2021, 13, 1511. [Google Scholar] [CrossRef]
  23. Hung, L.; Anderson, S.J.; Pipkin, A.; Fristrup, K. Changes in night sky brightness after a countywide LED retrofit. J. Environ. Manag. 2021, 292, 112776. [Google Scholar] [CrossRef] [PubMed]
  24. Katz, Y.; Levin, N. Quantifying urban light pollution—A comparison between field measurements and EROS–B imagery. Remote Sens. Environ. 2016, 177, 65–77. [Google Scholar] [CrossRef]
  25. Li, J.; Xu, Y.; Cui, W.E.A. Monitoring of nighttime light pollution in Nanjing City based on Luojia 1—01 remote sensing data. Remote Sensing for Natural Resources 2022, 34, 289. [Google Scholar]
  26. Bettanini, C.; Bartolomei, M.; Aboudan, A.; Colombatti, G.; Olivieri, L. Flight test of an autonomous payload for measuring sky brightness and ground light pollution using a stratospheric sounding balloon. Acta Astronaut. 2022, 191, 11–21. [Google Scholar] [CrossRef]
  27. Elmeseiry, N.; Alshaer, N.; Ismail, T. A detailed survey and future directions of unmanned aerial vehicles (uavs) with potential applications. Aerospace 2021, 8, 363. [Google Scholar] [CrossRef]
  28. Aslan, M.F.; Durdu, A.; Sabanci, K.; Ropelewska, E.; Gültekin, S.S. A comprehensive survey of the recent studies with UAV for precision agriculture in open fields and greenhouses. Appl. Sci. 2022, 12, 1047. [Google Scholar] [CrossRef]
  29. Zhang, H.; Wang, L.; Tian, T.; Yin, J. A review of unmanned aerial vehicle low–altitude remote sensing (UAV–LARS) use in agricultural monitoring in China. Remote Sens. 2021, 13, 1221. [Google Scholar] [CrossRef]
  30. Maimaitijiang, M.; Sagan, V.; Sidike, P.; Hartling, S.; Esposito, F.; Fritschi, F.B. Soybean yield prediction from UAV using multimodal data fusion and deep learning. Remote Sens. Environ. 2020, 237, 111599. [Google Scholar] [CrossRef]
  31. Boucher, P.B.; Hockridge, E.G.; Singh, J.; Davies, A.B. Flying high: Sampling savanna vegetation with UAV-lidar. Methods Ecol. Evol. 2023, 14, 1668–1686. [Google Scholar] [CrossRef]
  32. Ventura, D.; Bonifazi, A.; Gravina, M.F.; Belluscio, A.; Ardizzone, G. Mapping and classification of ecologically sensitive marine habitats using unmanned aerial vehicle (UAV) imagery and object–based image analysis (OBIA). Remote Sens. 2018, 10, 1331. [Google Scholar] [CrossRef]
  33. Chen, R. Application of UAV–low altitude remote sensing system in sea area supervision. Earth Sci. Res. J. 2021, 25, 65–68. [Google Scholar] [CrossRef]
  34. Dominici, D.; Alicandro, M.; Massimi, V. UAV photogrammetry in the post–earthquake scenario: Case studies in L’Aquila. Geomat. Nat. Hazards Risk 2017, 8, 87–103. [Google Scholar] [CrossRef]
  35. Yuan, C.; Liu, Z.; Zhang, Y. UAV–based forest fire detection and tracking using image processing techniques. In Proceedings of the 2015 International Conference on Unmanned Aircraft Systems (ICUAS), Denver, CO, USA, 9–12 June 2015; pp. 639–643. [Google Scholar]
  36. Li, X.; Peng, Z.; Lu, Q.; Wang, D.; Hu, X.; Wang, D.; Li, B.; Fu, Q.; Xiu, G.; He, H. Evaluation of unmanned aerial system in measuring lower tropospheric ozone and fine aerosol particles using portable monitors. Atmos. Environ. 2020, 222, 117134. [Google Scholar] [CrossRef]
  37. Hu, D.; Minner, J. UAVs and 3D City Modeling to Aid Urban Planning and Historic Preservation: A Systematic Review. Remote Sens. 2023, 15, 5507. [Google Scholar] [CrossRef]
  38. Zhao, X.; Xu, J.; Liu, X.; Zhu, X. Observations of Winter Physical Activities in Urban Parks Using UAVs: A Case Study of Four City Parks in Harbin. Chin. Landsc. Archit. 2019, 35, 40–45. [Google Scholar]
  39. Bouroussis, C.A.; Topalis, F.V. Assessment of outdoor lighting installations and their impact on light pollution using unmanned aircraft systems–The concept of the drone–gonio–photometer. J. Quant. Spectrosc. Radiat. Transf. 2020, 253, 107155. [Google Scholar] [CrossRef]
  40. Massetti, L.; Paterni, M.; Merlino, S. Monitoring light pollution with an unmanned aerial vehicle: A case study Comparing RGB images and night ground brightness. Remote Sens. 2022, 14, 2052. [Google Scholar] [CrossRef]
  41. Tabaka, P. Pilot measurement of illuminance in the context of light pollution performed with an unmanned aerial vehicle. Remote Sens. 2020, 12, 2124. [Google Scholar] [CrossRef]
  42. Li, X.; Levin, N.; Xie, J.; Li, D. Monitoring hourly night–time light by an unmanned aerial vehicle and its implications to satellite remote sensing. Remote Sens. Environ. 2020, 247, 111942. [Google Scholar] [CrossRef]
  43. Bahia, R.T.; Estur, M.C.; Blanco, A.C.; Soriano, M. Illuminance Mapping of Nighttime Road Environment Using Unmanned Aerial System. Int. Arch. Photogramm. Remote Sens. Spat. Inf. Sci. 2019, 42, 39–46. [Google Scholar] [CrossRef]
  44. Guk, E.; Levin, N. Analyzing spatial variability in night–time lights using a high spatial resolution color Jilin–1 image–Jerusalem as a case study. Isprs–J. Photogramm. Remote Sens. 2020, 163, 121–136. [Google Scholar] [CrossRef]
  45. Li, W. Research on Observation Methods and Spatial Distribution Characteristics of Urban Night Light Pollution. Master’s Thesis, Dalian University of Technology, Dalian, China, 2017. [Google Scholar]
  46. Liu, M.; Yang, X.; Liu, Y. Comparison and Analysis of the Light Pollution Effect at Night in the Typical Commercial Areas of Milan and Dalian. China Illum. Eng. J. 2020, 31, 94–101. [Google Scholar]
  47. He, L.; Lü, M.; Zhu, T. Integration of DMSP–OLS and NPP–VIIRS nighttime light remote sensing images. Bull. Surv. Mapp. 2023, 31–38. [Google Scholar]
  48. Guo, H.; Dou, C.; Chen, H.; Liu, J.; Fu, B.; Li, X.; Zou, Z.; Liang, D. SDGSAT–1: The world’s first scientific satellite for sustainable development goals. Sci. Bull. 2023, 68, 34–38. [Google Scholar] [CrossRef] [PubMed]
  49. Liu, M.; Guo, X.; Zhang, B.; Hao, Q.; Li, W. Urban Nighttime Light Pollution Testing Method; Dalian University of Technology: Dalian, China, 2017. [Google Scholar]
  50. CIE. Colorimetry—Part 1: CIE Standard Colorimetric Observers; International Commission on Illumination: Vienna, Austria, 1931. [Google Scholar]
  51. Liu, M.; Zhang, B.; Luo, T.; Liu, Y.; Portnov, B.A.; Trop, T.; Jiao, W.; Liu, H.; Li, Y.; Liu, Q. Evaluating street lighting quality in residential areas by combining remote sensing tools and a survey on pedestrians’ perceptions of safety and visual comfort. Remote Sens. 2022, 14, 826. [Google Scholar] [CrossRef]
  52. Liu, M.; Luo, T.; Li, Y.; Liu, Q. Research on the Distribution Characteristics of Night Light Environment Security Levelin Old Residential Areas. China Illum. Eng. J. 2022, 33, 166–173. [Google Scholar]
  53. Portnov, B.A.; Saad, R.; Trop, T.; Kliger, D.; Svechkina, A. Linking nighttime outdoor lighting attributes to pedestrians’ feeling of safety: An interactive survey approach. PLoS ONE 2020, 15, e0242172. [Google Scholar] [CrossRef] [PubMed]
  54. Saad, R.; Portnov, B.A.; Trop, T. Saving energy while maintaining the feeling of safety associated with urban street lighting. Clean Technol. Environ. Policy 2021, 23, 251–269. [Google Scholar] [CrossRef]
  55. Li, Y.; Chen, G.; Su, T.; Liu, H.; Sun, H. Calibration of Bus Free–flow Travelling Speed Based on Natural Break Method. J. Wuhan Univ. Technol. (Transp. Sci. Eng.) 2023, 47, 982–986. [Google Scholar]
  56. China Academy of Building Research. Lighting Measurement Methods; China Standard Publishing House: Beijing, China, 2023. [Google Scholar]
  57. Liu, M. Measurement, Experiment and Evaluation on Main Light Pollutions from Urban Lighting; Tianjin University: Tianjin, China, 2007. [Google Scholar]
Figure 1. Study area.
Remotesensing 16 03288 g001
Figure 2. Schematic diagram of illumination measurement direction.
Remotesensing 16 03288 g002
Figure 3. Graph of illuminance over time in the study area.
Remotesensing 16 03288 g003
Figure 4. Urban scale study of remote sensing satellite data with different resolutions [47].
Remotesensing 16 03288 g004
Figure 5. Alignment relationship between remote sensing data and measured grids.
Remotesensing 16 03288 g005
Figure 6. Layout of measurement units (The measurement points, that is, the numbers, are evenly distributed throughout the campus at a resolution of 130 m).
Remotesensing 16 03288 g006
Figure 7. Three windows and UAV aerial photography range: a. upper window, b. horizontal window, c. lower windows, and d. UAV aerial photography range.
Remotesensing 16 03288 g007
Figure 8. Three types of UAV aerial scale images.
Remotesensing 16 03288 g008
Figure 9. Regression relationship between El and remote sensing data.
Remotesensing 16 03288 g009
Figure 10. Regression relationship between illuminance data and Sr.
Remotesensing 16 03288 g010
Figure 11. Regression relationship between illuminance data and L65.
Remotesensing 16 03288 g011
Figure 12. Regression relationship between El and UAV data.
Remotesensing 16 03288 g012
Figure 13. Regression relationship between UAV data and remote sensing data.
Remotesensing 16 03288 g013
Figure 14. Comparison of the variation trends between the UAV data and ground measurements data.
Remotesensing 16 03288 g014
Figure 15. UAV aerial photography of measurement point 5.
Remotesensing 16 03288 g015
Figure 16. Real image of measurement point 5.
Remotesensing 16 03288 g016
Figure 17. UAV aerial photography.
Remotesensing 16 03288 g017
Figure 18. Comparison of the variation trends between the remote sensing data and ground measurement data.
Remotesensing 16 03288 g018
Figure 19. Image of measurement point 1.
Remotesensing 16 03288 g019
Figure 20. Schematic diagram of three observation methods for the observation range of building facades.
Remotesensing 16 03288 g020
Figure 21. Regression relationship.
Remotesensing 16 03288 g021
Figure 22. The 130 m resolution inversion map of the study area.
Remotesensing 16 03288 g022
Figure 23. Field investigation in areas.
Remotesensing 16 03288 g023
Figure 24. Illuminance difference calculation method schematic diagram.
Remotesensing 16 03288 g024
Figure 25. Field investigation on lighting uniformity.
Remotesensing 16 03288 g025
Figure 26. Application of the stereo measurement method of urban light environment to night light environment visualization of Xi’an Road.
Remotesensing 16 03288 g026
Table 1. Actual measurement date and basic atmospheric and climatic conditions.
ItemsDateTimeWeatherSunset TimeAverage Temperature (°C)AQICloud Cover
Ground measurement7 April 202319:00–22:00clear18:17851cloudless
Ground measurement8April 202319:00–22:00clear18:1811.590cloudless
Ground measurement12 April 202319:00–22:00clear18:2313.544cloudless
Ground measurement16 April 202319:00–22:00clear18:271244cloudless
UAV aerial photography9 May 202319:30–22:00clear18:5219.557cloudless
UAV aerial photography10 May 202319:30–22:00clear18:531948cloudless
UAV aerial photography11 May 202319:30–22:00clear18:541952cloudless
Note: AQI stands for Air Quality Index.
Table 2. The radiometric calibration coefficients and detection spectral bands of SDGSAT–1.
BandsGainBiasDetection Spectral Bands
R0.000013540.0000136754600~894 nm
G0.000005070.000006084506~612 nm
B0.00000992530.0000099253424~526 nm
Disclaimer/Publisher’s Note: The statements, opinions and data contained in all publications are solely those of the individual author(s) and contributor(s) and not of MDPI and/or the editor(s). MDPI and/or the editor(s) disclaim responsibility for any injury to people or property resulting from any ideas, methods, instructions or products referred to in the content.

