
Validation and Comparison of Long-Term Accuracy and Stability of Global Reanalysis and Satellite Retrieval AOD


 and
and
Abstract
1. Introduction
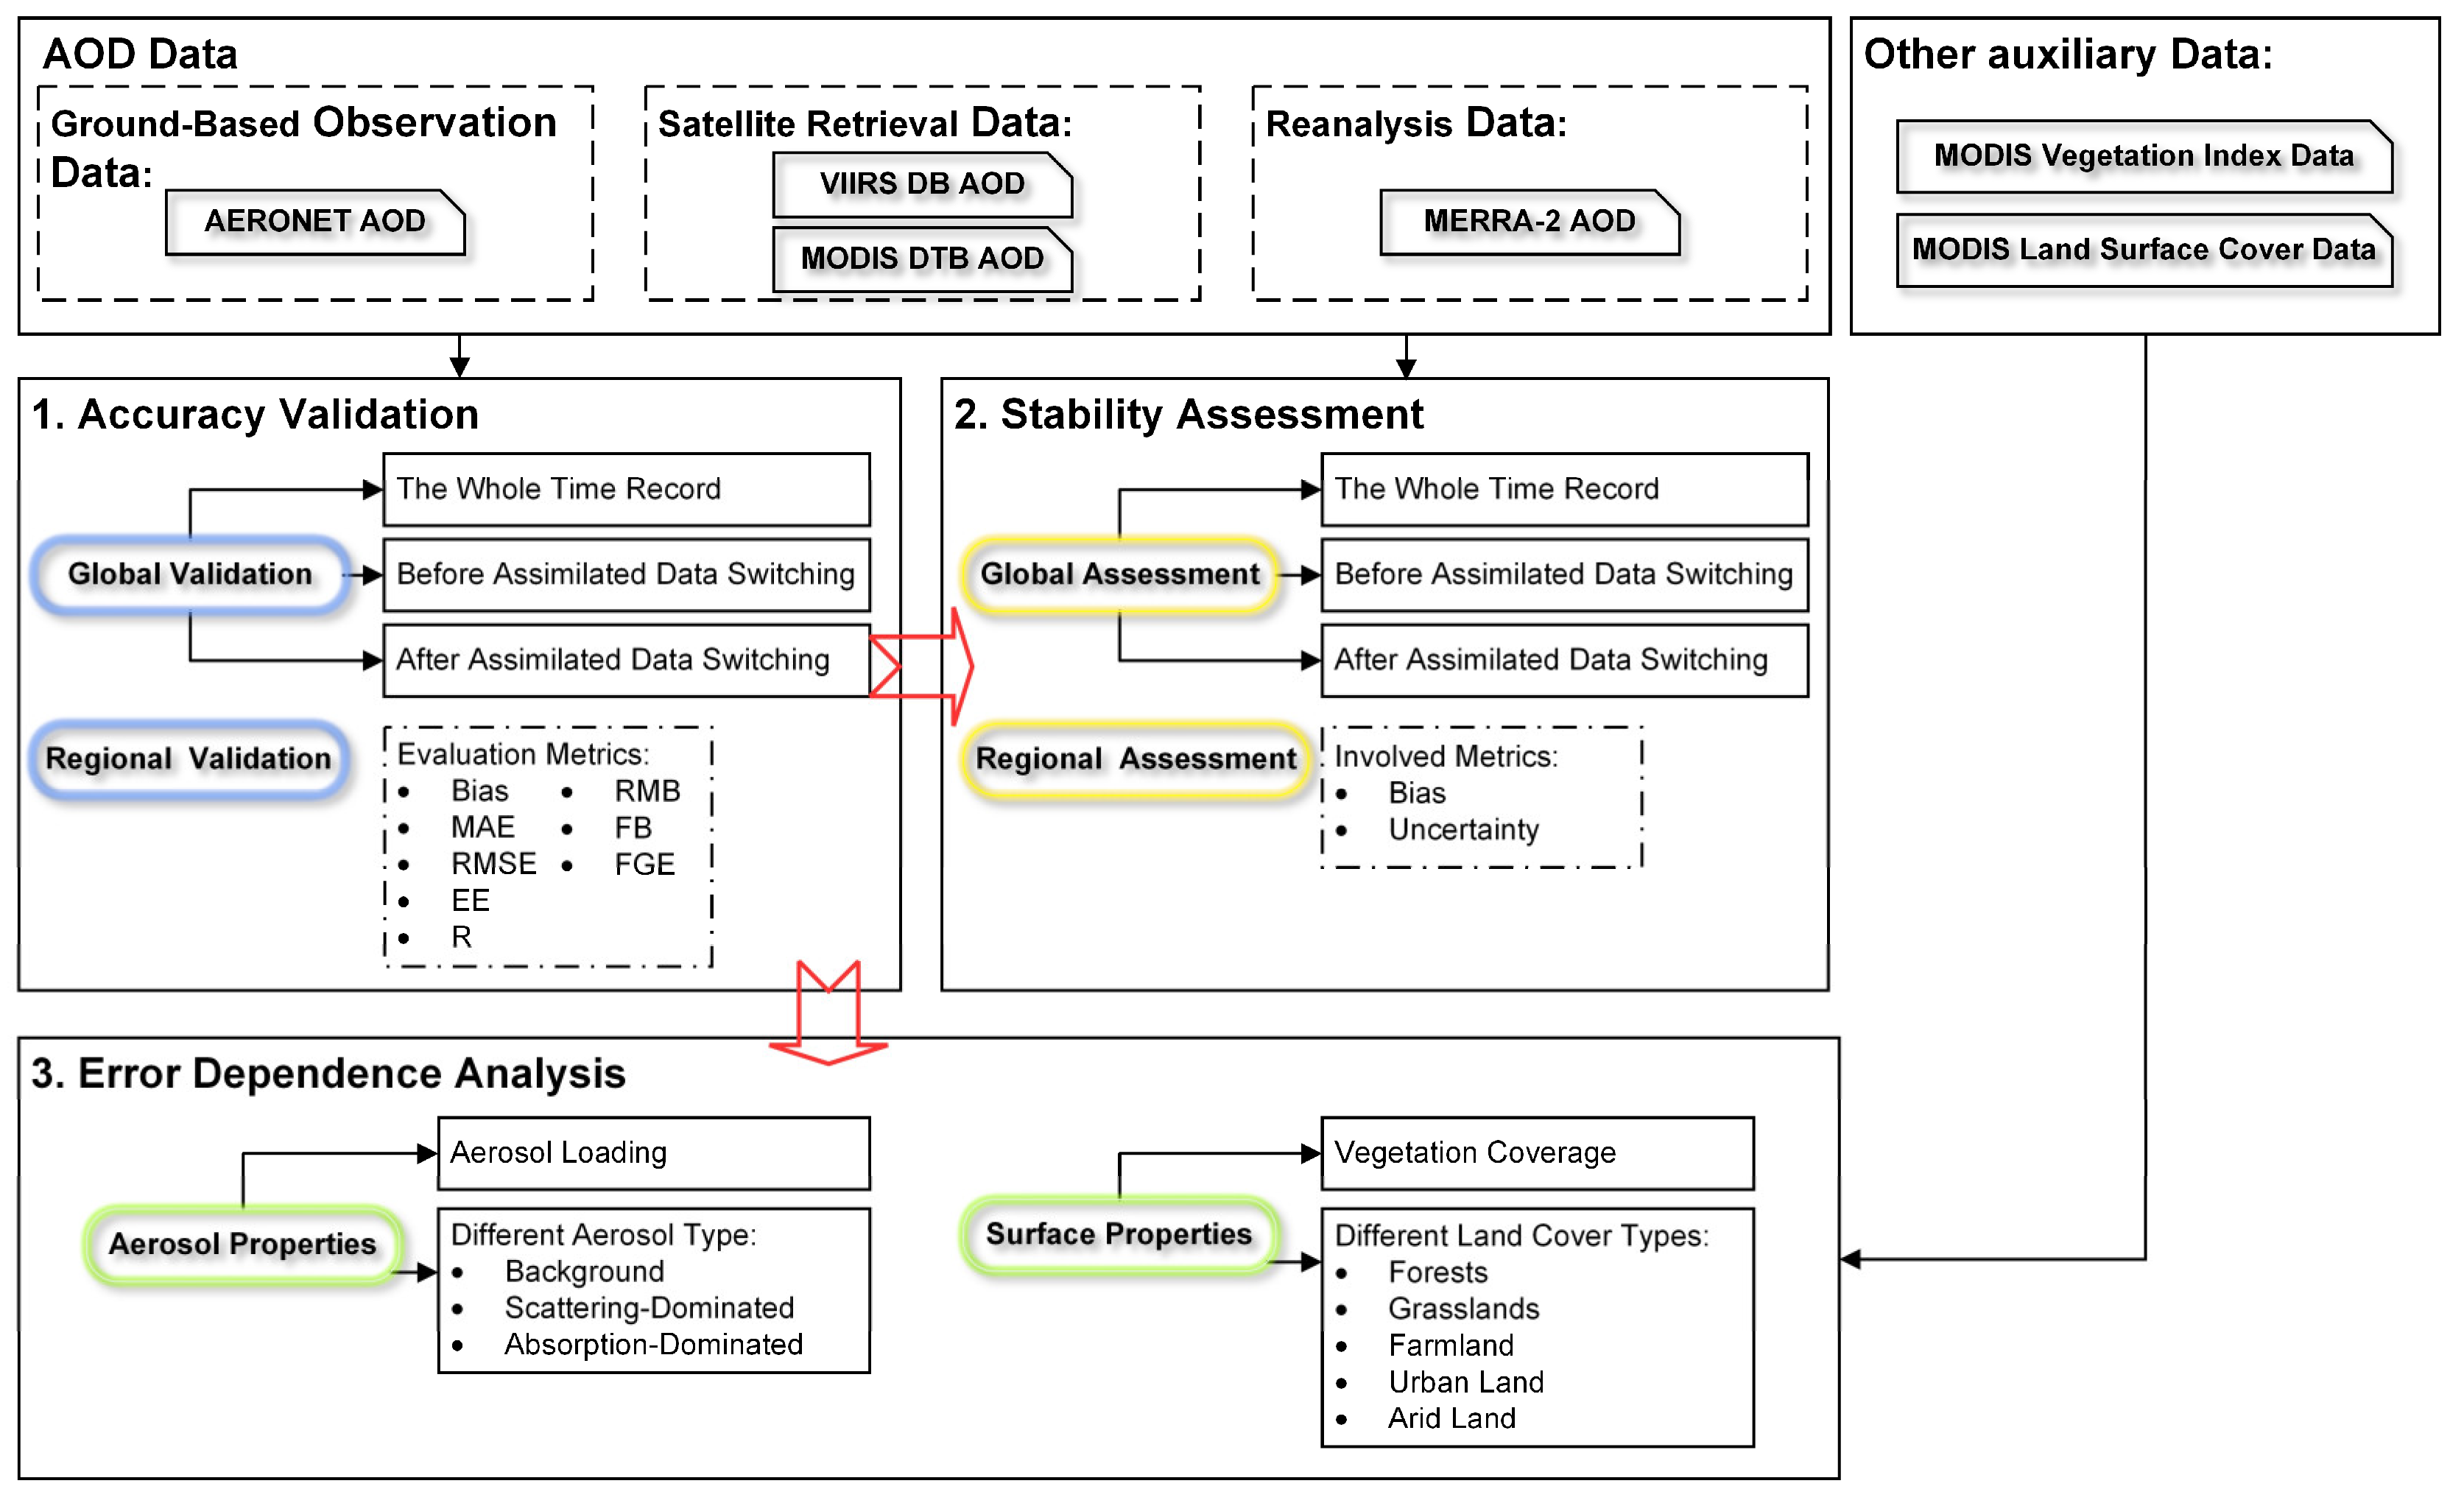
2. Data and Method
2.1. MERRA-2 Reanalysis Data
2.2. Satellite Retrieval Data
2.3. Other Auxiliary Data
2.4. Ground-Based Observation Data
2.5. Accuracy Validation Method
2.6. Stability Assessment Method
2.7. Error Dependence Analysis Method
3. Result and Discussion
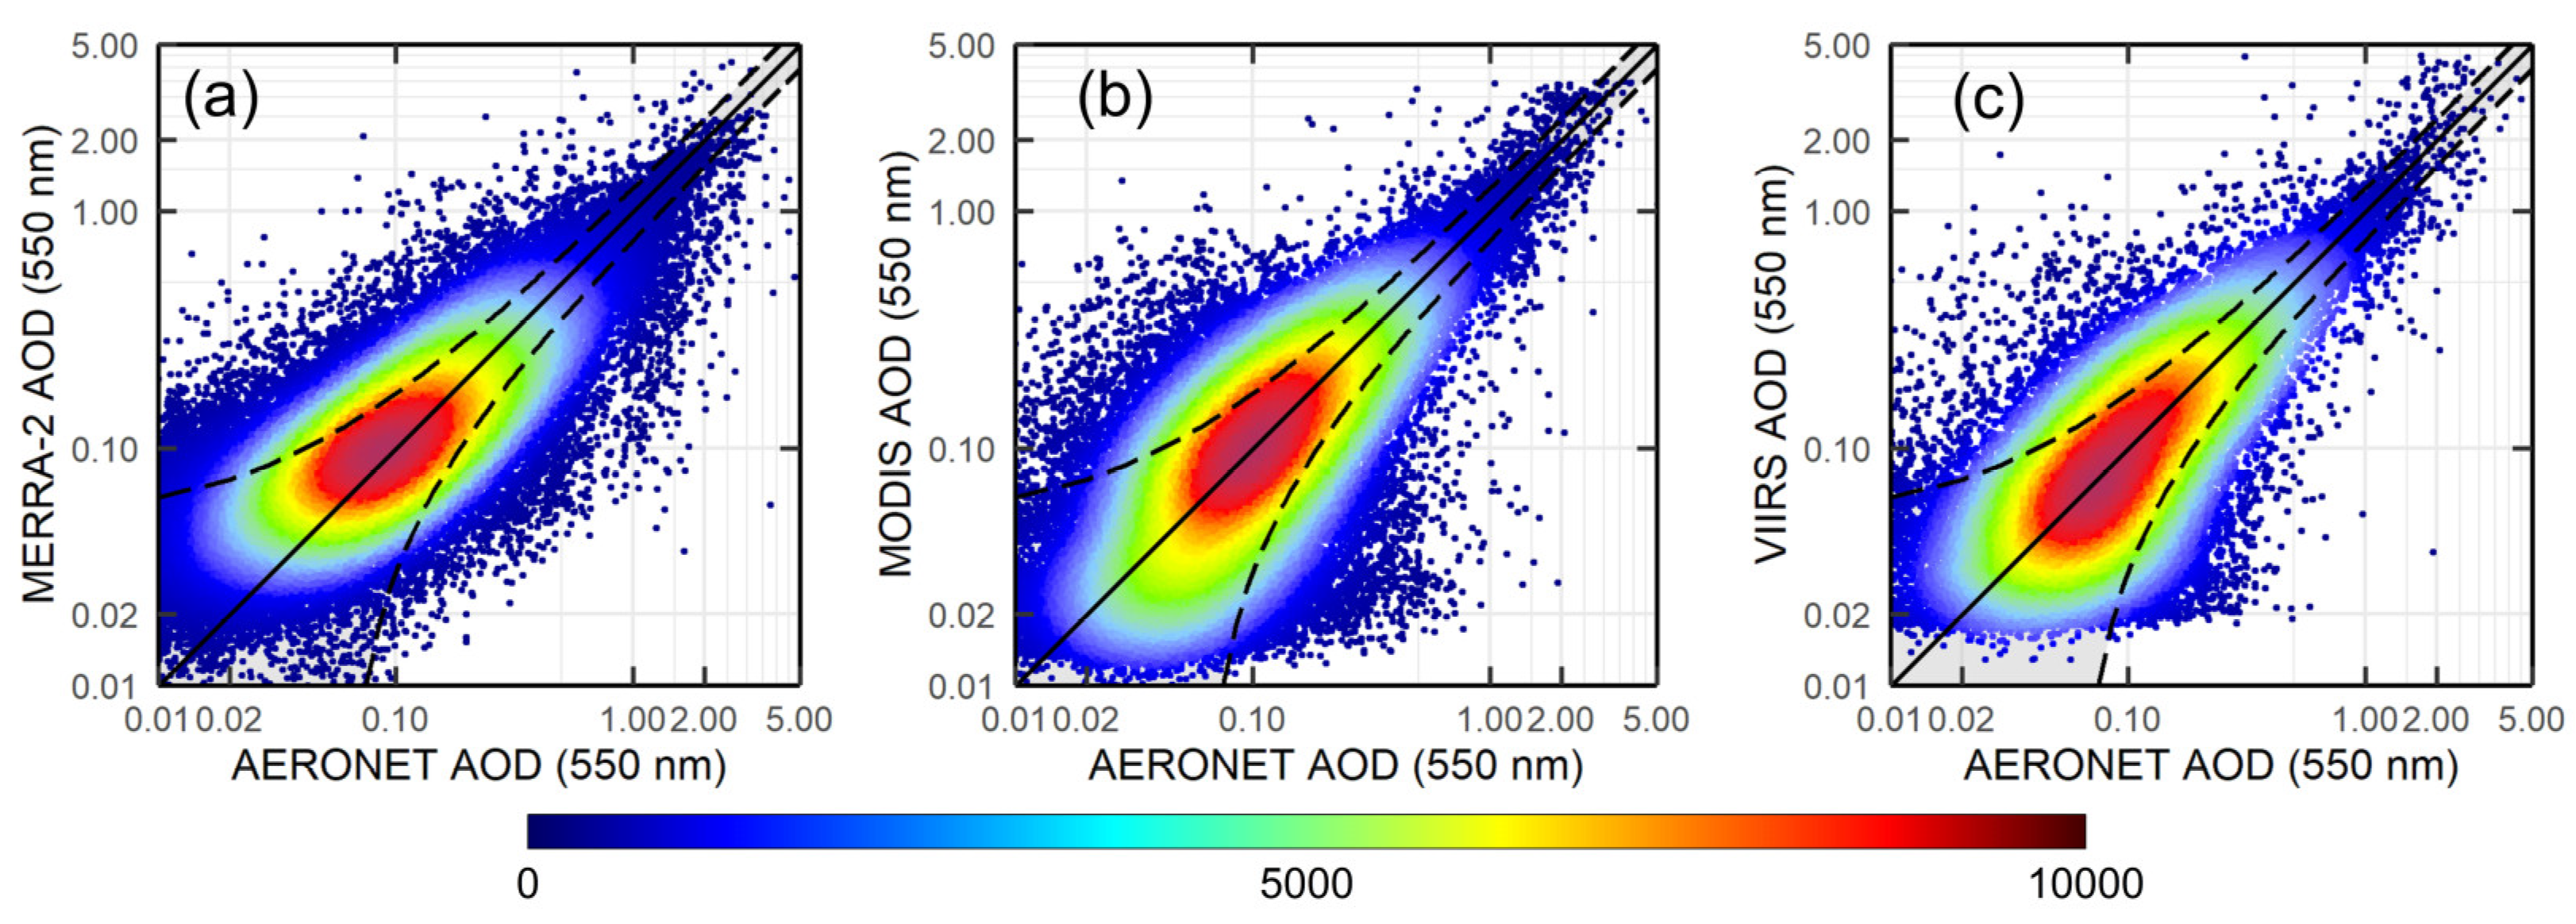
3.1. Overall Accuracy Evaluation and Comparison
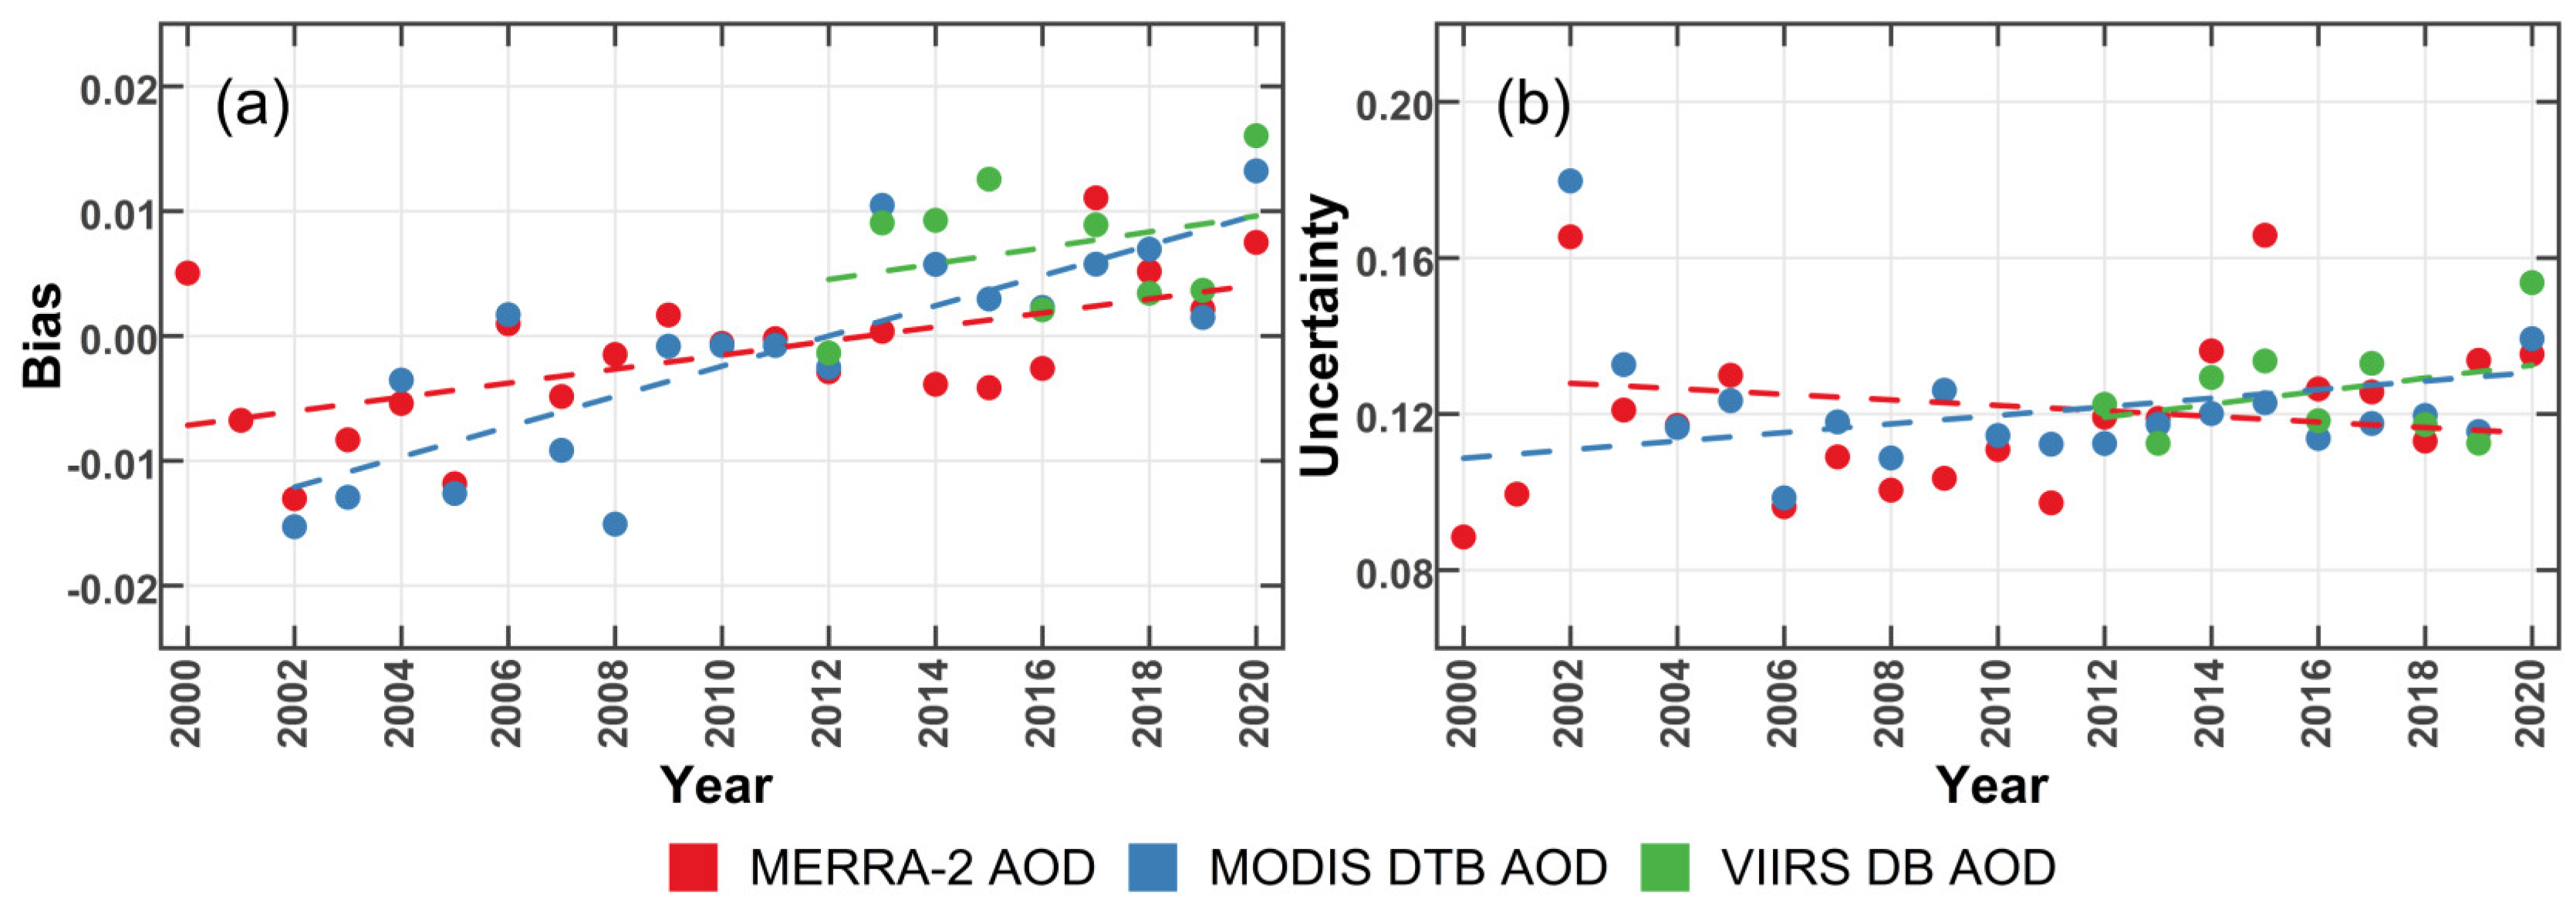
3.2. Stability Evaluation and Comparison
3.3. Impact of Assimilated Data Changes on Accuracy and Stability
3.4. Regional Performance
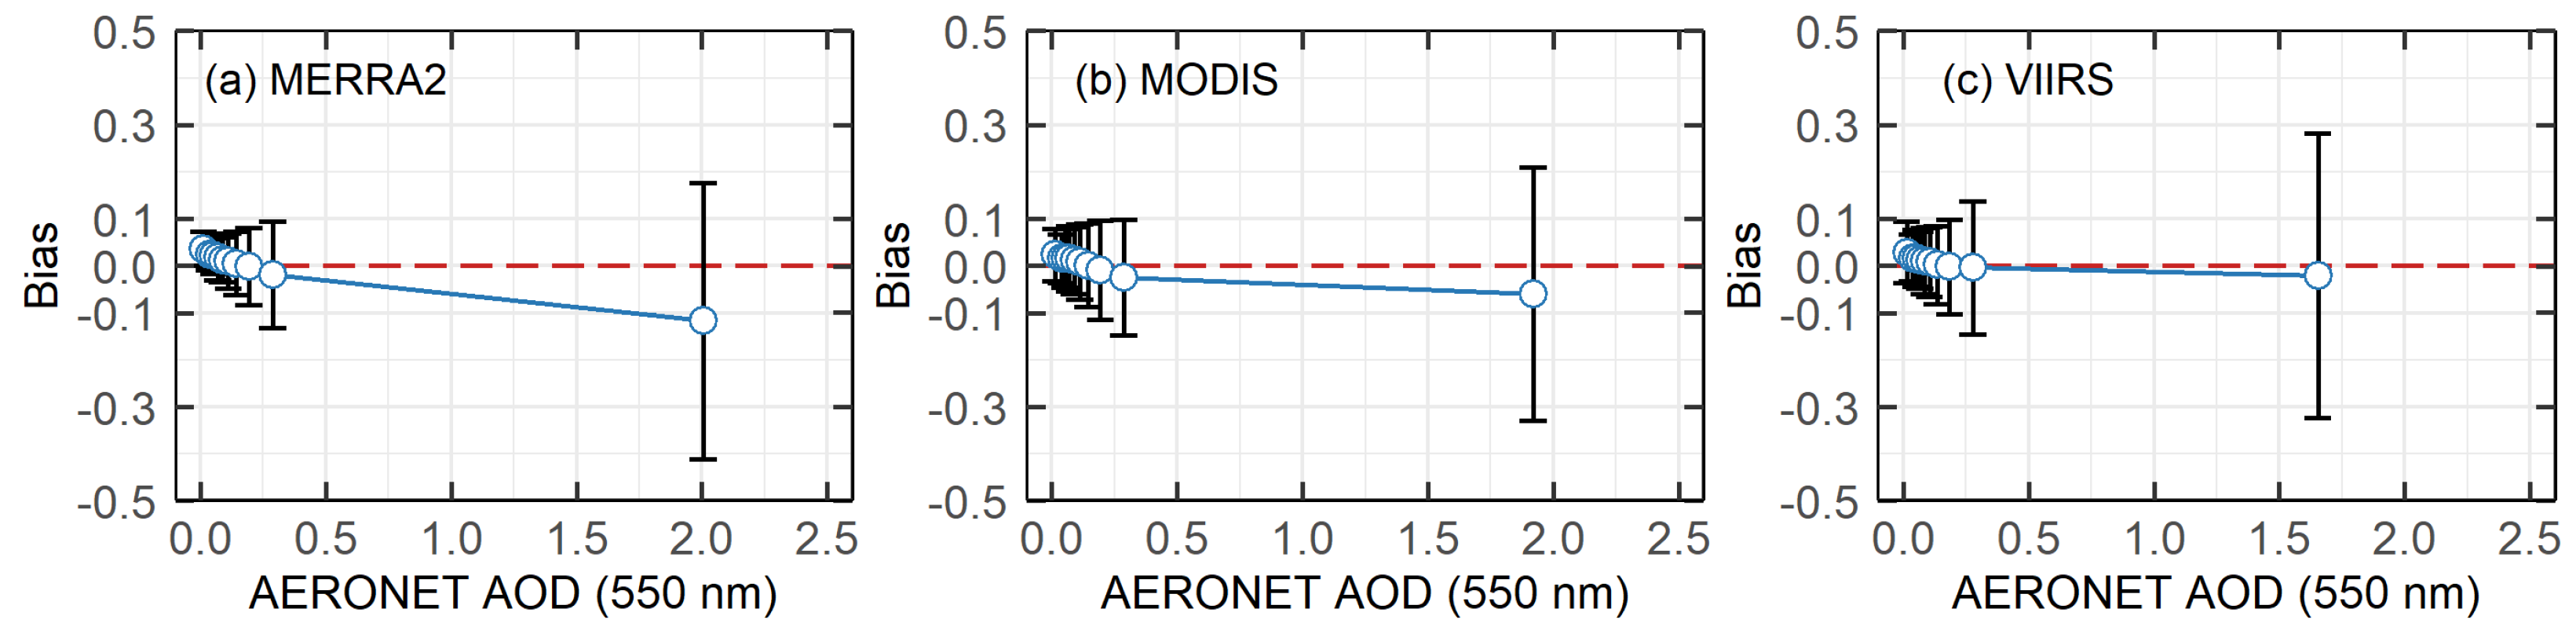
3.5. Error Dependence Analysis
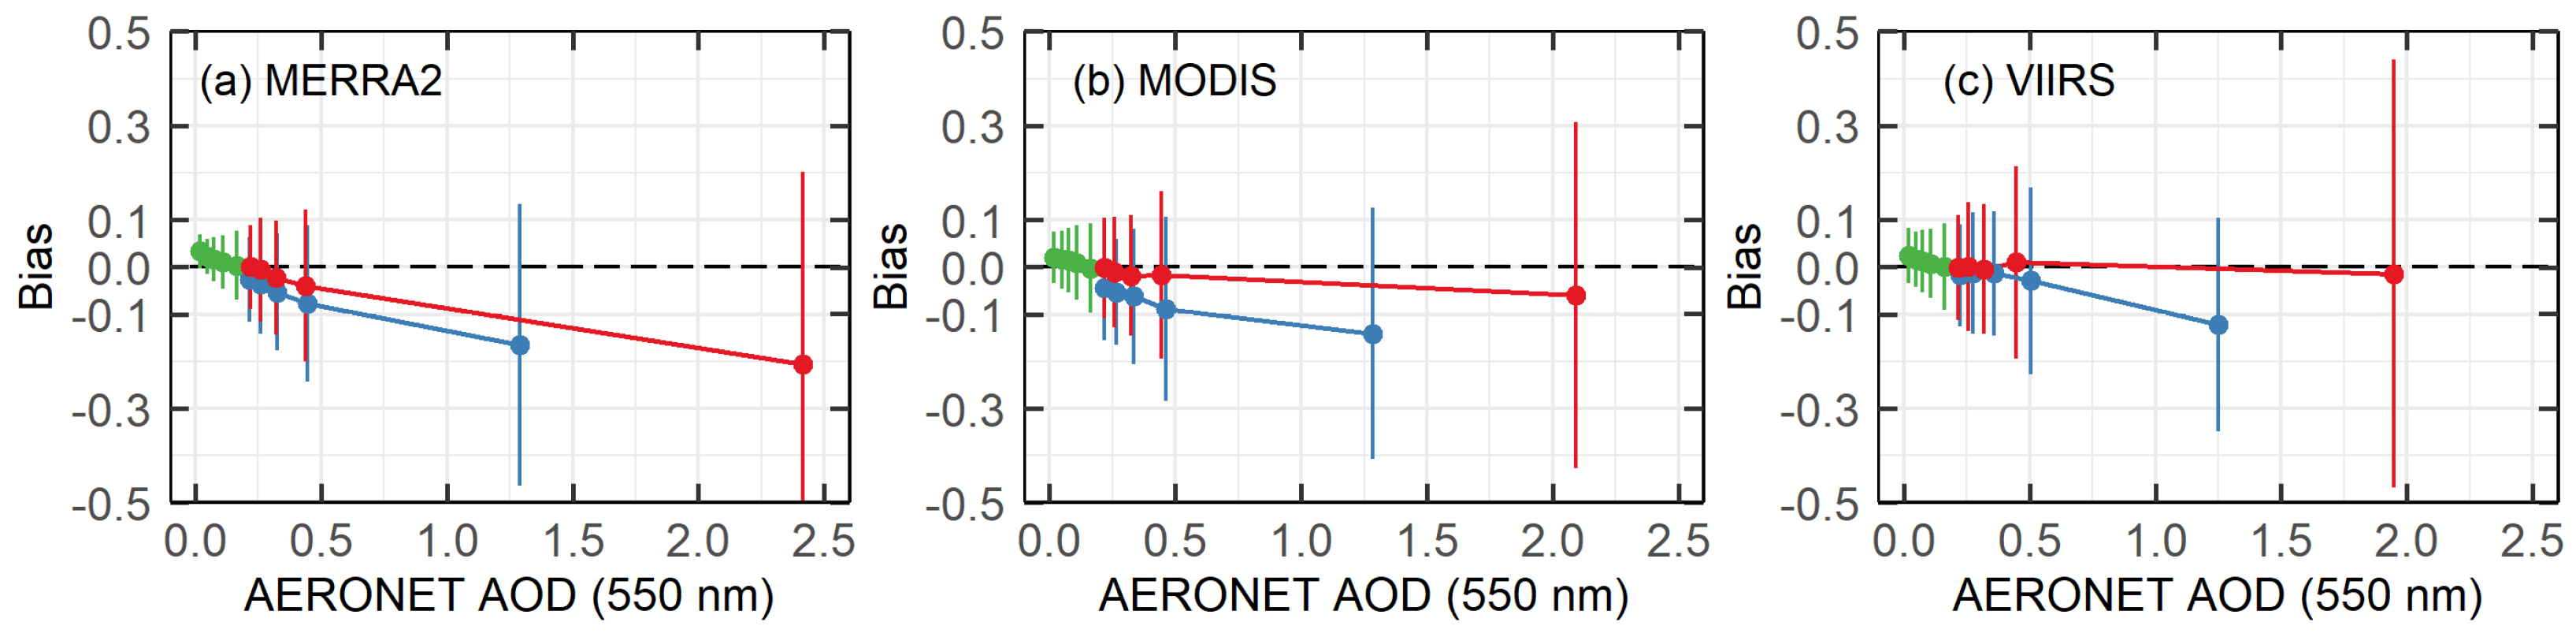
3.5.1. Aerosol Properties
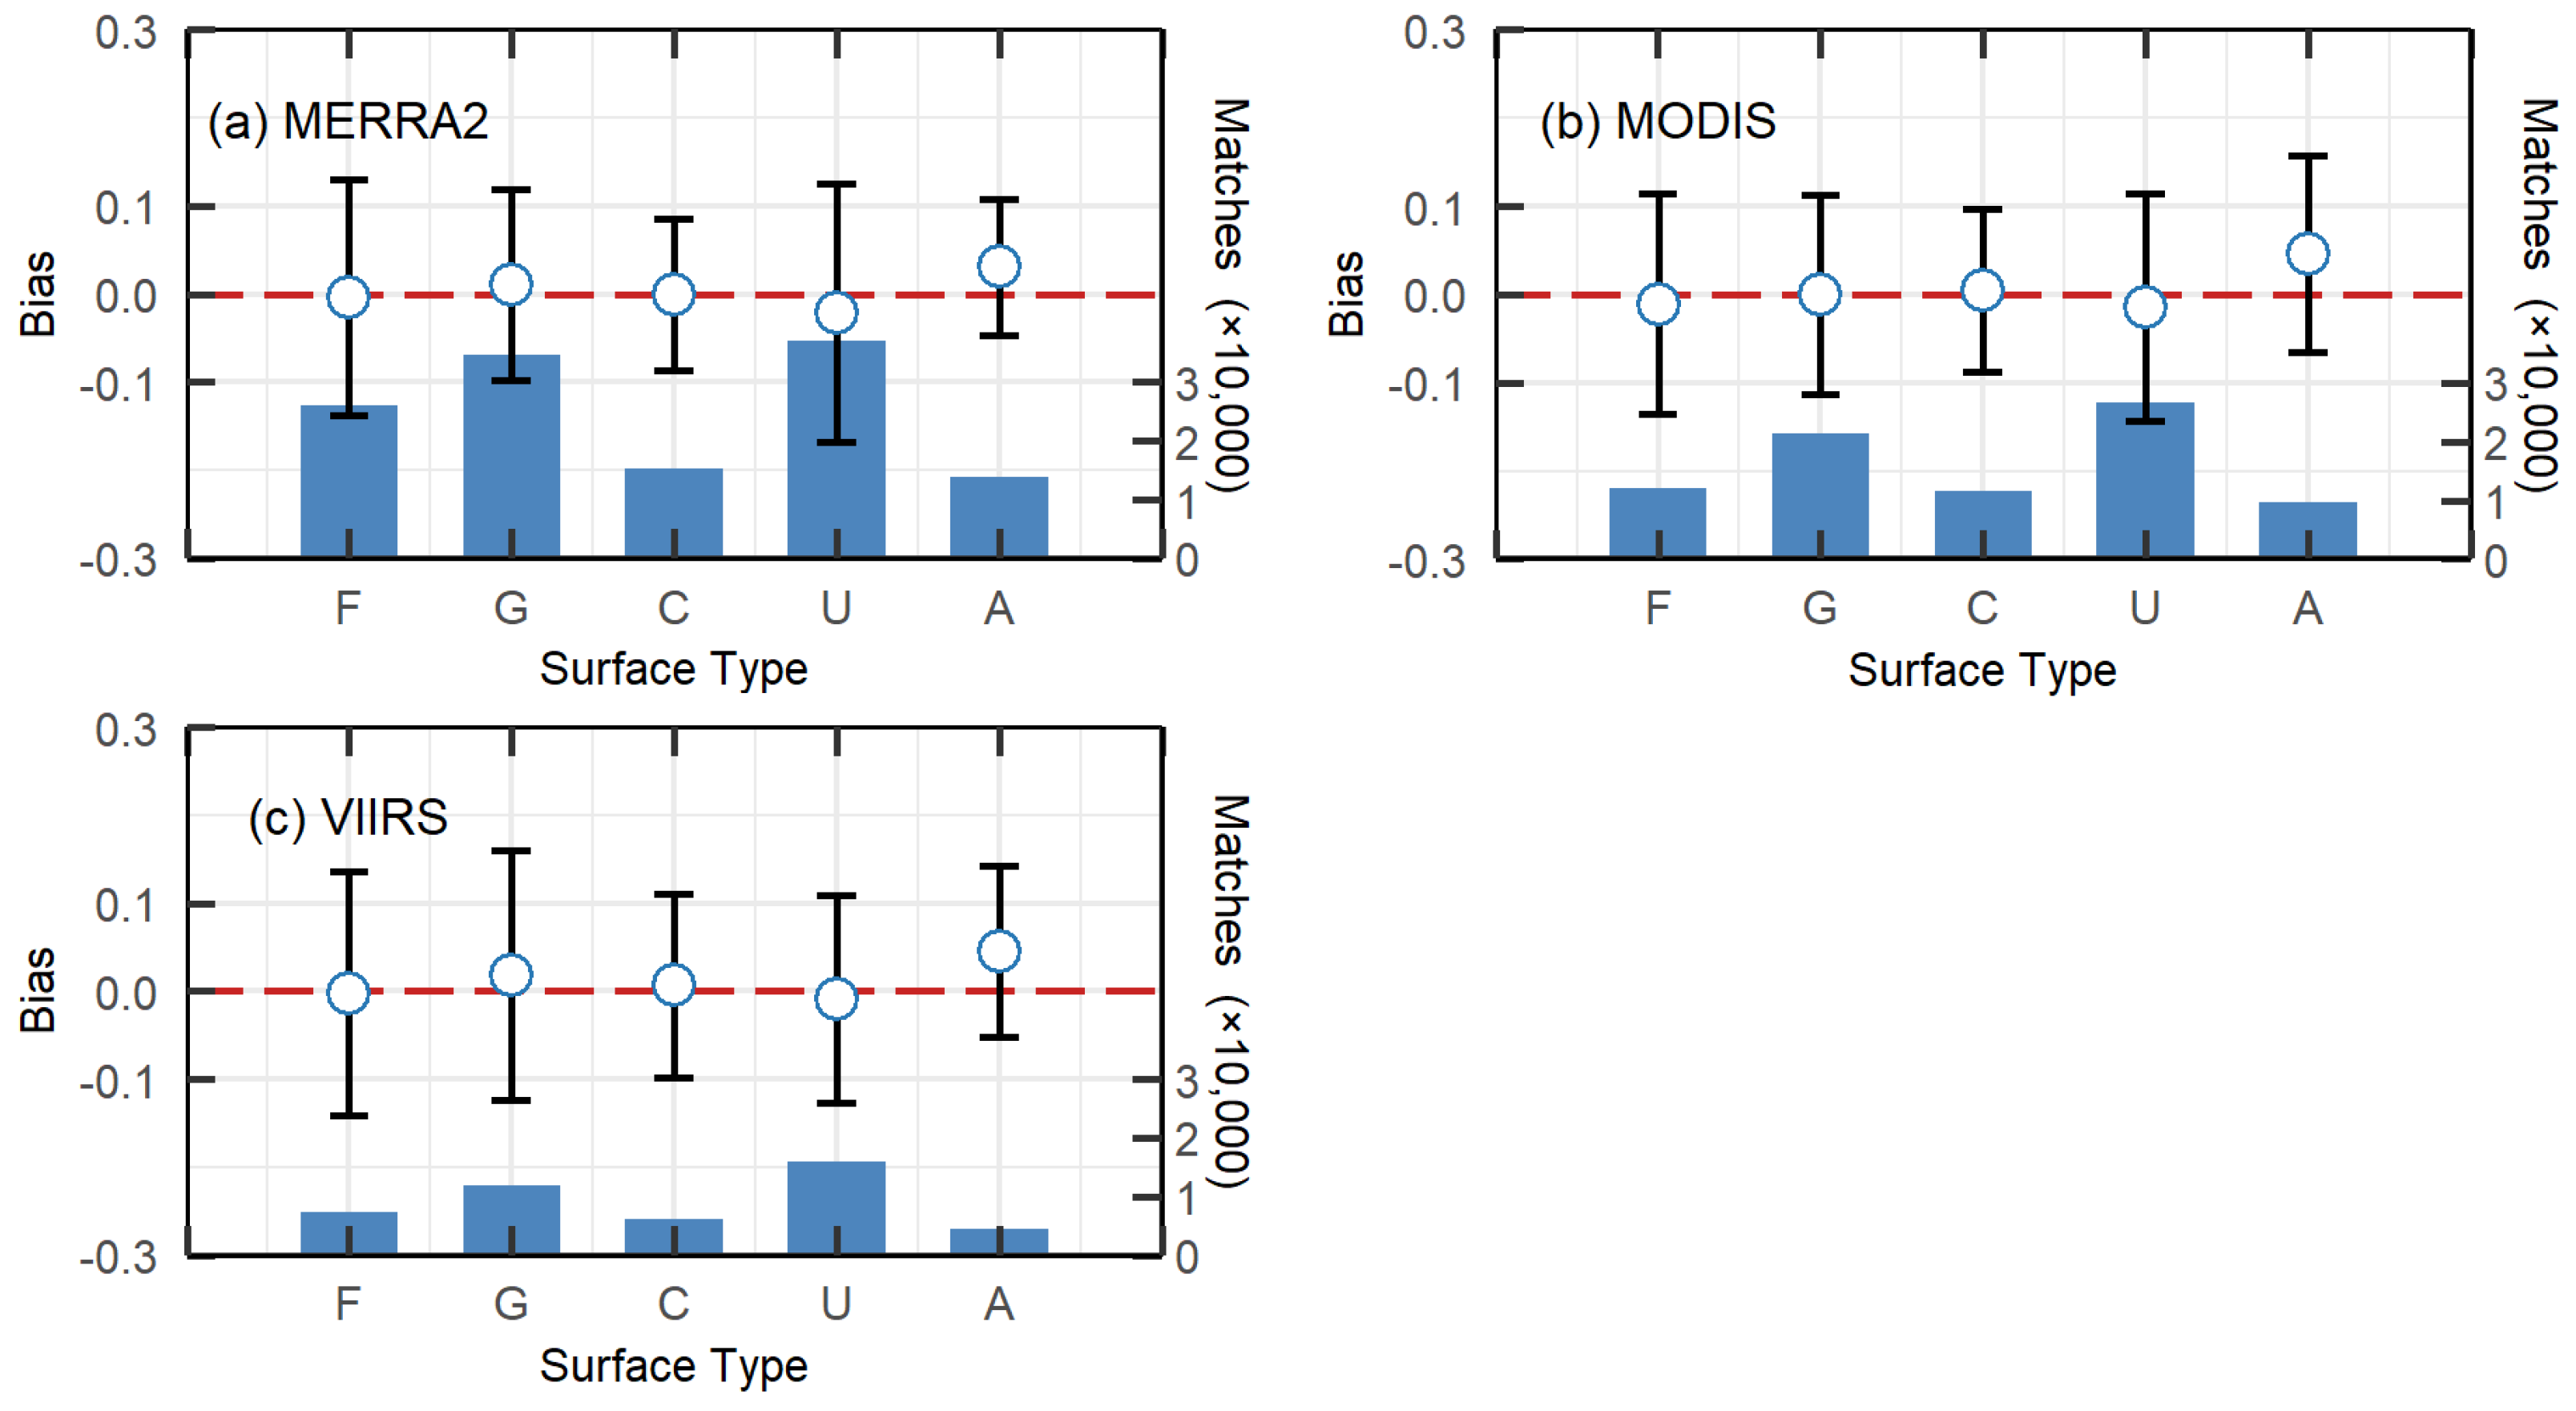
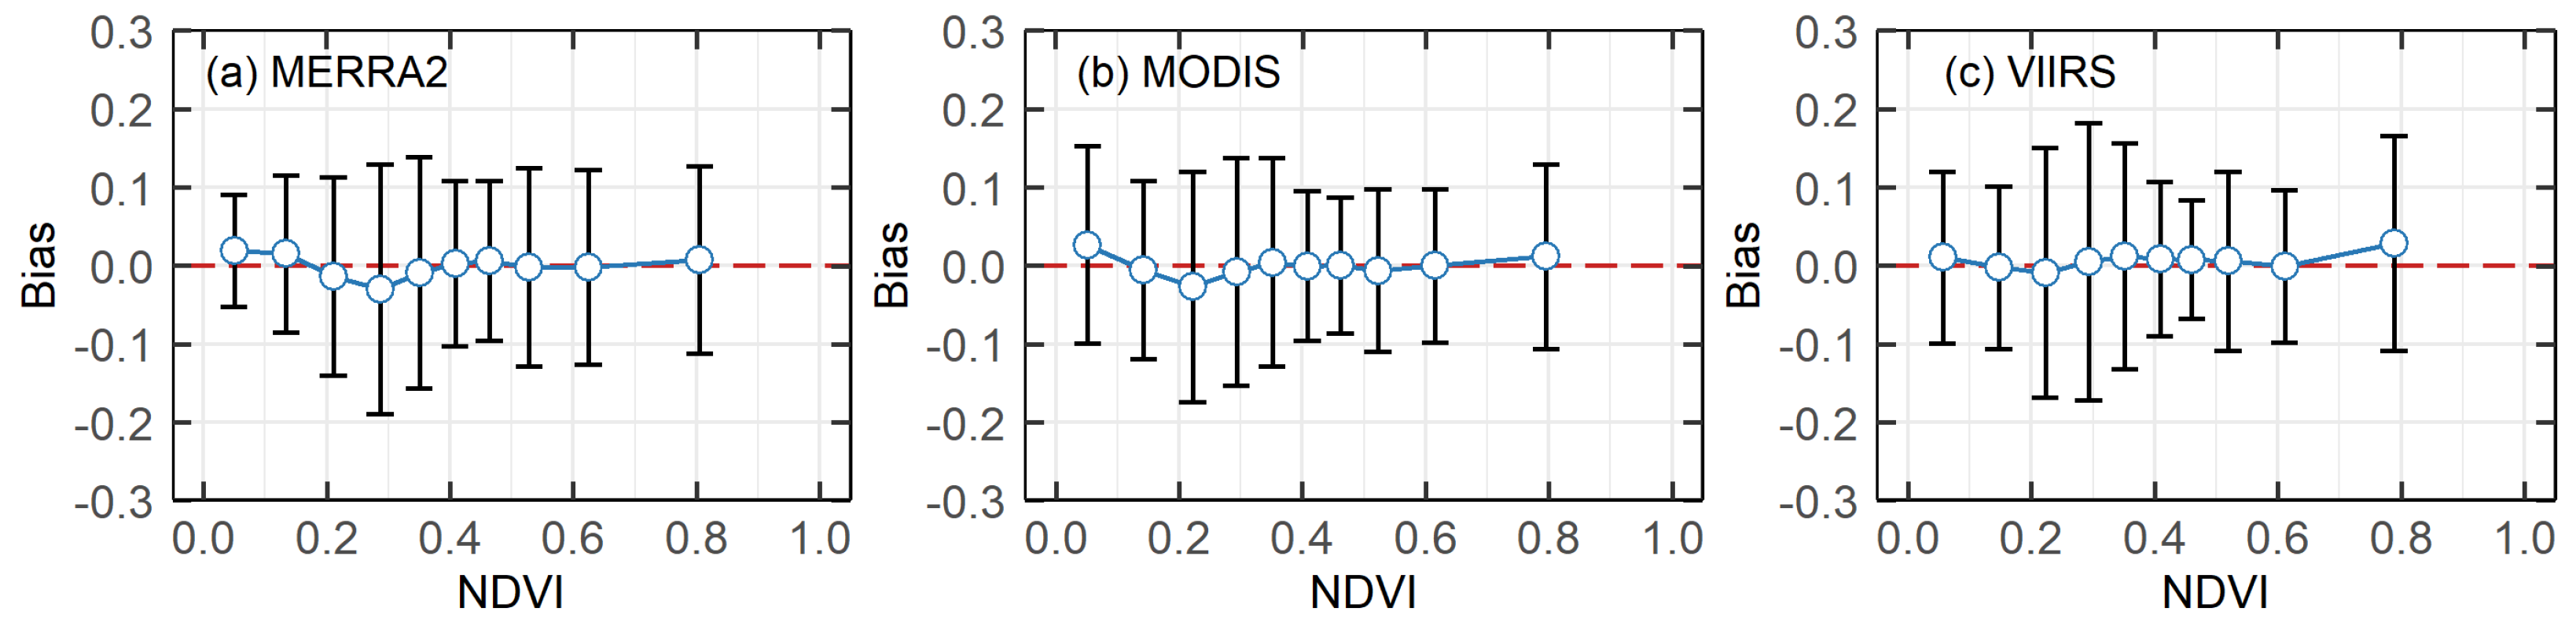
3.5.2. Surface Properties
4. Conclusions
Author Contributions
Funding
Data Availability Statement
Acknowledgments
Conflicts of Interest
References
- Bellouin, N.; Quaas, J.; Gryspeerdt, E.; Kinne, S.; Stier, P.; Watson-Parris, D.; Boucher, O.; Carslaw, K.S.; Christensen, M.; Daniau, A.-L. Bounding Global Aerosol Radiative Forcing of Climate Change. Rev. Geophys. 2020, 58, e2019RG000660. [Google Scholar] [CrossRef] [PubMed]
- Elsey, J.; Bellouin, N.; Ryder, C. Sensitivity of Global Direct Aerosol Shortwave Radiative Forcing to Uncertainties in Aerosol Optical Properties. Atmos. Chem. Phys. 2024, 24, 4065–4081. [Google Scholar] [CrossRef]
- Su, T.; Li, Z.; Henao, N.R.; Luan, Q.; Yu, F. Constraining Effects of Aerosol-Cloud Interaction by Accounting for Coupling between Cloud and Land Surface. Sci. Adv. 2024, 10, eadl5044. [Google Scholar] [CrossRef] [PubMed]
- Lelieveld, J.; Evans, J.S.; Fnais, M.; Giannadaki, D.; Pozzer, A. The Contribution of Outdoor Air Pollution Sources to Premature Mortality on a Global Scale. Nature 2015, 525, 367–371. [Google Scholar] [CrossRef] [PubMed]
- Zhao, X.; Wu, T.; Zhou, W.; Han, L.; Neophytou, A.M. Reducing Air Pollution Does Not Necessarily Reduce Related Adults’ Mortality Burden: Variations in 177 Countries with Different Economic Levels. Sci. Total Environ. 2024, 933, 173037. [Google Scholar] [CrossRef]
- Textor, C.; Schulz, M.; Guibert, S.; Kinne, S.; Balkanski, Y.; Bauer, S.; Berntsen, T.; Berglen, T.; Boucher, O.; Chin, M.; et al. Analysis and Quantification of the Diversities of Aerosol Life Cycles within AeroCom. Atmos. Chem. Phys. 2006, 6, 1777–1813. [Google Scholar] [CrossRef]
- Sayer, A.M. How Long Is Too Long? Variogram Analysis of AERONET Data to Aid Aerosol Validation and Intercomparison Studies. Earth Space Sci. 2020, 7, e2020EA001290. [Google Scholar] [CrossRef]
- Li, J.; Carlson, B.E.; Yung, Y.L.; Lv, D.; Hansen, J.; Penner, J.E.; Liao, H.; Ramaswamy, V.; Kahn, R.A.; Zhang, P. Scattering and Absorbing Aerosols in the Climate System. Nat. Rev. Earth Environ. 2022, 3, 363–379. [Google Scholar] [CrossRef]
- Kaufman, Y.J.; Tanré, D.; Boucher, O. A Satellite View of Aerosols in the Climate System. Nature 2002, 419, 215–223. [Google Scholar] [CrossRef]
- Su, X.; Wang, L.; Gui, X.; Yang, L.; Li, L.; Zhang, M.; Qin, W.; Tao, M.; Wang, S.; Wang, L. Retrieval of Total and Fine Mode Aerosol Optical Depth by an Improved MODIS Dark Target Algorithm. Environ. Int. 2022, 166, 107343. [Google Scholar] [CrossRef]
- Wang, L.; Su, X.; Wang, Y.; Cao, M.; Lang, Q.; Li, H.; Sun, J.; Zhang, M.; Qin, W.; Li, L. Towards Long-Term, High-Accuracy, and Continuous Satellite Total and Fine-Mode Aerosol Records: Enhanced Land General Aerosol (e-LaGA) Retrieval Algorithm for VIIRS. ISPRS J. Photogramm. Remote Sens. 2024, 214, 261–281. [Google Scholar] [CrossRef]
- Yu, L.; Zhang, M.; Wang, L.; Qin, W.; Jiang, D.; Li, J. Variability of Surface Solar Radiation under Clear Skies over Qinghai-Tibet Plateau: Role of Aerosols and Water Vapor. Atmos. Environ. 2022, 287, 119286. [Google Scholar] [CrossRef]
- Hammer, M.S.; van Donkelaar, A.; Bindle, L.; Sayer, A.M.; Lee, J.; Hsu, N.C.; Levy, R.C.; Sawyer, V.; Garay, M.J.; Kalashnikova, O.V. Assessment of the Impact of Discontinuity in Satellite Instruments and Retrievals on Global PM2. 5 Estimates. Remote Sens. Environ. 2023, 294, 113624. [Google Scholar] [CrossRef]
- Colarco, P.; Da Silva, A.; Chin, M.; Diehl, T. Online Simulations of Global Aerosol Distributions in the NASA GEOS-4 Model and Comparisons to Satellite and Ground-based Aerosol Optical Depth. J. Geophys. Res. Atmos. 2010, 115, D14207. [Google Scholar] [CrossRef]
- Colarco, P.R.; Nowottnick, E.P.; Randles, C.A.; Yi, B.; Yang, P.; Kim, K.; Smith, J.A.; Bardeen, C.G. Impact of Radiatively Interactive Dust Aerosols in the NASA GEOS-5 Climate Model: Sensitivity to Dust Particle Shape and Refractive Index. J. Geophys. Res. Atmos. 2014, 119, 753–786. [Google Scholar] [CrossRef]
- Randles, C.A.; Da Silva, A.M.; Buchard, V.; Colarco, P.R.; Darmenov, A.; Govindaraju, R.; Smirnov, A.; Holben, B.; Ferrare, R.; Hair, J.; et al. The MERRA-2 Aerosol Reanalysis, 1980 Onward. Part I: System Description and Data Assimilation Evaluation. J. Clim. 2017, 30, 6823–6850. [Google Scholar] [CrossRef] [PubMed]
- Li, L.; Che, H.; Su, X.; Zhang, X.; Gui, K.; Zheng, Y.; Zhao, H.; Zhao, H.; Liang, Y.; Lei, Y.; et al. Quantitative Evaluation of Dust and Black Carbon Column Concentration in the MERRA-2 Reanalysis Dataset Using Satellite-Based Component Retrievals. Remote Sens. 2023, 15, 388. [Google Scholar] [CrossRef]
- Su, X.; Huang, Y.; Wang, L.; Cao, M.; Feng, L. Validation and Diurnal Variation Evaluation of MERRA-2 Multiple Aerosol Properties on a Global Scale. Atmos. Environ. 2023, 311, 120019. [Google Scholar] [CrossRef]
- Gueymard, C.A.; Yang, D. Worldwide Validation of CAMS and MERRA-2 Reanalysis Aerosol Optical Depth Products Using 15 Years of AERONET Observations. Atmos. Environ. 2020, 225, 117216. [Google Scholar] [CrossRef]
- Shi, H.; Xiao, Z.; Zhan, X.; Ma, H.; Tian, X. Evaluation of MODIS and Two Reanalysis Aerosol Optical Depth Products over AERONET Sites. Atmos. Res. 2019, 220, 75–80. [Google Scholar] [CrossRef]
- Shaheen, A.; Wu, R.; Aldabash, M. Long-Term AOD Trend Assessment over the Eastern Mediterranean Region: A Comparative Study Including a New Merged Aerosol Product. Atmos. Environ. 2020, 238, 117736. [Google Scholar] [CrossRef]
- Jiang, D.; Wang, L.; Yi, X.; Su, X.; Zhang, M. Comprehensive Evaluation of Multisource Aerosol Optical Depth Gridded Products over China. Atmos. Environ. 2022, 278, 119088. [Google Scholar] [CrossRef]
- Wang, Y.; Yuan, Q.; Shen, H.; Zheng, L.; Zhang, L. Investigating Multiple Aerosol Optical Depth Products from MODIS and VIIRS over Asia: Evaluation, Comparison, and Merging. Atmos. Environ. 2020, 230, 117548. [Google Scholar] [CrossRef]
- Hu, Z.; Jin, Q.; Ma, Y.; Pu, B.; Ji, Z.; Wang, Y.; Dong, W. Temporal Evolution of Aerosols and Their Extreme Events in Polluted Asian Regions during Terra’s 20-Year Observations. Remote Sens. Environ. 2021, 263, 112541. [Google Scholar] [CrossRef]
- Kuttippurath, J.; Raj, S. Two Decades of Aerosol Observations by AATSR, MISR, MODIS and MERRA-2 over India and Indian Ocean. Remote Sens. Environ. 2021, 257, 112363. [Google Scholar] [CrossRef]
- Wang, L.; Bi, J.; Meng, X.; Geng, G.; Huang, K.; Li, J.; Tang, L.; Liu, Y. Satellite-Based Assessment of the Long-Term Efficacy of PM2.5 Pollution Control Policies across the Taiwan Strait. Remote Sens. Environ. 2020, 251, 112067. [Google Scholar] [CrossRef]
- Sayer, A.M.; Hsu, N.C.; Lee, J.; Kim, W.V.; Dutcher, S.T. Validation, Stability, and Consistency of MODIS Collection 6.1 and VIIRS Version 1 Deep Blue Aerosol Data Over Land. J. Geophys. Res. Atmos. 2019, 124, 4658–4688. [Google Scholar] [CrossRef]
- Su, X.; Wei, Y.; Wang, L.; Zhang, M.; Jiang, D.; Feng, L. Accuracy, Stability, and Continuity of AVHRR, SeaWiFS, MODIS, and VIIRS Deep Blue Long-Term Land Aerosol Retrieval in Asia. Sci. Total Environ. 2022, 832, 155048. [Google Scholar] [CrossRef]
- Gelaro, R.; McCarty, W.; Suárez, M.J.; Todling, R.; Molod, A.; Takacs, L.; Randles, C.A.; Darmenov, A.; Bosilovich, M.G.; Reichle, R.; et al. The Modern-Era Retrospective Analysis for Research and Applications, Version 2 (MERRA-2). J. Clim. 2017, 30, 5419–5454. [Google Scholar] [CrossRef]
- Randles, C.A.; da Silva, A.M.; Buchard, V.; Darmenov, A.; Colarco, P.R.; Aquila, V.; Bian, H.; Nowottnick, E.P.; Pan, X.; Smirnov, A.; et al. The MERRA-2 Aerosol Assimilation; Technical Report Series on Global Modeling and Data Assimilation; NASA/TM–2016-104606; NASA: Washington, DC, USA, 2016; Volume 45, p. 143. Available online: https://gmao.gsfc.nasa.gov/pubs/docs/Randles887.pdf (accessed on 1 June 2024).
- Buchard, V.; Randles, C.A.; Da Silva, A.M.; Darmenov, A.; Colarco, P.R.; Govindaraju, R.; Ferrare, R.; Hair, J.; Beyersdorf, A.J.; Ziemba, L.D.; et al. The MERRA-2 Aerosol Reanalysis, 1980 Onward. Part II: Evaluation and Case Studies. J. Clim. 2017, 30, 6851–6872. [Google Scholar] [CrossRef]
- Levy, R.C.; Mattoo, S.; Munchak, L.A.; Remer, L.A.; Sayer, A.M.; Patadia, F.; Hsu, N.C. The Collection 6 MODIS Aerosol Products over Land and Ocean. Atmos. Meas. Tech. 2013, 6, 2989–3034. [Google Scholar] [CrossRef]
- Levy, R.C.; Munchak, L.A.; Mattoo, S.; Patadia, F.; Remer, L.A.; Holz, R.E. Towards a Long-Term Global Aerosol Optical Depth Record: Applying a Consistent Aerosol Retrieval Algorithm to MODIS and VIIRS-Observed Reflectance. Atmos. Meas. Tech. 2015, 8, 4083–4110. [Google Scholar] [CrossRef]
- Hsu, N.C.; Tsay, S.C.; King, M.D.; Herman, J.R. Aerosol Properties over Bright-Reflecting Source Regions. IEEE Trans. Geosci. Remote Sens. 2004, 42, 557–569. [Google Scholar] [CrossRef]
- Hsu, N.C.; Jeong, M.-J.; Bettenhausen, C.; Sayer, A.M.; Hansell, R.; Seftor, C.S.; Huang, J.; Tsay, S.-C. Enhanced Deep Blue Aerosol Retrieval Algorithm: The Second Generation. J. Geophys. Res. Atmos. 2013, 118, 9296–9315. [Google Scholar] [CrossRef]
- Bilal, M.; Nichol, J.E.; Wang, L. New Customized Methods for Improvement of the MODIS C6 Dark Target and Deep Blue Merged Aerosol Product. Remote Sens. Environ. 2017, 197, 115–124. [Google Scholar] [CrossRef]
- Bilal, M.; Qiu, Z.; Campbell, J.R.; Spak, S.N.; Shen, X.; Nazeer, M. A New MODIS C6 Dark Target and Deep Blue Merged Aerosol Product on a 3 Km Spatial Grid. Remote Sens. 2018, 10, 463. [Google Scholar] [CrossRef]
- Lyapustin, A.; Wang, Y.; Korkin, S.; Huang, D. MODIS Collection 6 MAIAC Algorithm. Atmos. Meas. Tech. 2018, 11, 5741–5765. [Google Scholar] [CrossRef]
- Sayer, A.M.; Munchak, L.A.; Hsu, N.C.; Levy, R.C.; Bettenhausen, C.; Jeong, M.-J. MODIS Collection 6 Aerosol Products: Comparison between Aqua’s e-Deep Blue, Dark Target, and “Merged” Data Sets, and Usage Recommendations. J. Geophys. Res. Atmos. 2014, 119, 13965–13989. [Google Scholar] [CrossRef]
- Sayer, A.M.; Hsu, N.C.; Bettenhausen, C.; Jeong, M.-J.; Meister, G. Effect of MODIS Terra Radiometric Calibration Improvements on Collection 6 Deep Blue Aerosol Products: Validation and Terra/Aqua Consistency. J. Geophys. Res. Atmos. 2015, 120, 12157–12174. [Google Scholar] [CrossRef]
- Levy, R.C.; Mattoo, S.; Sawyer, V.; Shi, Y.; Colarco, P.R.; Lyapustin, A.I.; Wang, Y.; Remer, L.A. Exploring Systematic Offsets between Aerosol Products from the Two MODIS Sensors. Atmos. Meas. Tech. 2018, 11, 4073–4092. [Google Scholar] [CrossRef]
- Su, X.; Cao, M.; Wang, L.; Gui, X.; Zhang, M.; Huang, Y.; Zhao, Y. Validation, Inter-Comparison, and Usage Recommendation of Six Latest VIIRS and MODIS Aerosol Products over the Ocean and Land on the Global and Regional Scales. Sci. Total Environ. 2023, 884, 163794. [Google Scholar] [CrossRef] [PubMed]
- Holben, B.N.; Eck, T.F.; Slutsker, I.; Tanré, D.; Buis, J.P.; Setzer, A.; Vermote, E.; Reagan, J.A.; Kaufman, Y.J.; Nakajima, T.; et al. AERONET—A Federated Instrument Network and Data Archive for Aerosol Characterization. Remote Sens. Environ. 1998, 66, 1–16. [Google Scholar] [CrossRef]
- Eck, T.F.; Holben, B.N.; Reid, J.S.; Dubovik, O.; Smirnov, A.; O’Neill, N.T.; Slutsker, I.; Kinne, S. Wavelength Dependence of the Optical Depth of Biomass Burning, Urban, and Desert Dust Aerosols. J. Geophys. Res. Atmos. 1999, 104, 31333–31349. [Google Scholar] [CrossRef]
- Giles, D.M.; Sinyuk, A.; Sorokin, M.G.; Schafer, J.S.; Smirnov, A.; Slutsker, I.; Eck, T.F.; Holben, B.N.; Lewis, J.R.; Campbell, J.R. Advancements in the Aerosol Robotic Network (AERONET) Version 3 Database–Automated near-Real-Time Quality Control Algorithm with Improved Cloud Screening for Sun Photometer Aerosol Optical Depth (AOD) Measurements. Atmos. Meas. Tech. 2019, 12, 169–209. [Google Scholar] [CrossRef]
- Sawyer, V.; Levy, R.C.; Mattoo, S.; Cureton, G.; Shi, Y.; Remer, L.A. Continuing the MODIS Dark Target Aerosol Time Series with VIIRS. Remote Sens. 2020, 12, 308. [Google Scholar] [CrossRef]
- Che, H.; Gui, K.; Xia, X.; Wang, Y.; Holben, B.N.; Goloub, P.; Cuevas-Agulló, E.; Wang, H.; Zheng, Y.; Zhao, H.; et al. Large Contribution of Meteorological Factors to Inter-Decadal Changes in Regional Aerosol Optical Depth. Atmos. Chem. Phys. 2019, 19, 10497–10523. [Google Scholar] [CrossRef]
- Gui, K.; Che, H.; Wang, Y.; Xia, X.; Holben, B.N.; Goloub, P.; Cuevas-Agulló, E.; Yao, W.; Zheng, Y.; Zhao, H.; et al. A Global-Scale Analysis of the MISR Level-3 Aerosol Optical Depth (AOD) Product: Comparison with Multi-Platform AOD Data Sources. Atmos. Pollut. Res. 2021, 12, 101238. [Google Scholar] [CrossRef]
- Yousefi, R.; Wang, F.; Ge, Q.; Shaheen, A. Long-Term Aerosol Optical Depth Trend over Iran and Identification of Dominant Aerosol Types. Sci. Total Environ. 2020, 722, 137906. [Google Scholar] [CrossRef]
- Van Der Werf, G.R.; Randerson, J.T.; Giglio, L.; Collatz, G.J.; Mu, M.; Kasibhatla, P.S.; Morton, D.C.; DeFries, R.S.; Jin, Y.; Van Leeuwen, T.T. Global Fire Emissions and the Contribution of Deforestation, Savanna, Forest, Agricultural, and Peat Fires (1997–2009). Atmos. Chem. Phys. 2010, 10, 11707–11735. [Google Scholar] [CrossRef]
- Ginoux, P.; Prospero, J.M.; Gill, T.E.; Hsu, N.C.; Zhao, M. Global-Scale Attribution of Anthropogenic and Natural Dust Sources and Their Emission Rates Based on MODIS Deep Blue Aerosol Products. Rev Geophys 2012, 50, RG3005. [Google Scholar] [CrossRef]
- Spada, M.; Jorba, O.; Pérez García-Pando, C.; Janjic, Z.; Baldasano, J.M. Modeling and Evaluation of the Global Sea-Salt Aerosol Distribution: Sensitivity to Size-Resolved and Sea-Surface Temperature Dependent Emission Schemes. Atmos Chem Phys 2013, 13, 11735–11755. [Google Scholar] [CrossRef]
- Sayer, A.M.; Hsu, N.C.; Bettenhausen, C.; Jeong, M.-J. Validation and Uncertainty Estimates for MODIS Collection 6 “Deep Blue” Aerosol Data. JGR Atmos. 2013, 118, 7864–7872. [Google Scholar] [CrossRef]
- Levy, R.C.; Remer, L.A.; Dubovik, O. Global Aerosol Optical Properties and Application to Moderate Resolution Imaging Spectroradiometer Aerosol Retrieval over Land. J. Geophys. Res. 2007, 112, D13210. [Google Scholar] [CrossRef]
- Ou, Y.; Li, Z.; Chen, C.; Zhang, Y.; Li, K.; Shi, Z.; Dong, J.; Xu, H.; Peng, Z.; Xie, Y.; et al. Evaluation of MERRA-2 Aerosol Optical and Component Properties over China Using SONET and PARASOL/GRASP Data. Remote Sens. 2022, 14, 821. [Google Scholar] [CrossRef]


| Products | N | R | Bias | RMSE | MAE | RMB | FGE (%) | IOA | >EE (%) | =EE (%) | <EE (%) |
|---|---|---|---|---|---|---|---|---|---|---|---|
| MERRA-2 | 128,815 | 0.826 | −0.0009 | 0.122 | 0.056 | 0.994 | 12.239 | 0.900 | 6.23 | 83.24 | 10.53 |
| MODIS | 81,379 | 0.856 | −0.0002 | 0.119 | 0.066 | 0.999 | −4.475 | 0.924 | 9.83 | 76.75 | 13.42 |
| VIIRS | 45,569 | 0.851 | 0.0068 | 0.126 | 0.062 | 1.042 | 1.543 | 0.919 | 7.92 | 79.43 | 12.64 |
| Product (Years) | 10 × Fitting Coefficient | 2 × Normalized Standard Deviation | Total * | ||
|---|---|---|---|---|---|
| (Bias and Uncertainty) | (Bias and Uncertainty) | Mean | |||
| MERRA-2 (21) | −0.006 | 0.011 | 0.006 | 0.020 | 0.010 |
| MODIS (19) | −0.012 | −0.007 | 0.009 | 0.017 | 0.011 |
| VIIRS (9) | −0.006 | 0.016 | 0.012 | 0.029 | 0.016 |
| Product | Timespan | N | R | Bias | RMSE | MAE | RMB | FGE (%) | IOA | <EE (%) | =EE (%) | >EE (%) |
|---|---|---|---|---|---|---|---|---|---|---|---|---|
| MERRA-2 | Before | 84,021 | 0.843 | −0.003 | 0.114 | 0.053 | 0.983 | 9.246 | 0.911 | 5.95 | 85.19 | 8.86 |
| After | 44,794 | 0.796 | 0.003 | 0.135 | 0.062 | 1.018 | 17.852 | 0.879 | 6.76 | 79.57 | 13.67 | |
| MODIS | Before | 52,548 | 0.851 | −0.003 | 0.118 | 0.067 | 0.983 | −0.068 | 0.921 | 10.44 | 76.63 | 12.93 |
| After | 28,831 | 0.865 | 0.005 | 0.120 | 0.064 | 1.031 | −0.002 | 0.928 | 8.72 | 76.96 | 14.32 | |
| VIIRS | Before | 14,410 | 0.826 | 0.006 | 0.123 | 0.065 | 1.033 | 0.011 | 0.906 | 8.58 | 77.97 | 13.45 |
| After | 31,159 | 0.860 | 0.007 | 0.127 | 0.061 | 1.047 | 0.018 | 0.923 | 7.62 | 80.11 | 12.27 |
| Product | Timespan | 10 × Fitting Coefficient | 2 × Normalized Standard Deviation | Total | ||
|---|---|---|---|---|---|---|
| (Bias and Uncertainty) | (Bias and Uncertainty) | Mean * | ||||
| MERRA-2 | Before | 0.004 | 0.002 | 0.007 | 0.026 | 0.010 |
| After | 0.016 | −0.025 | 0.016 | 0.046 | 0.026 | |
| MODIS | Before | 0.016 | −0.023 | 0.013 | 0.030 | 0.020 |
| After | 0.012 | 0.045 | 0.012 | 0.038 | 0.027 | |
| VIIRS | Before | / | / | / | / | / |
| After | 0.000 | 0.049 | 0.015 | 0.055 | 0.030 | |
| Region | Products | AERONET AOD | Product AOD | N | R | Bias | MAE | RMSE | RMB | FGE (%) | IOA | EE (%) |
|---|---|---|---|---|---|---|---|---|---|---|---|---|
| WNA | MERRA-2 | 0.077 | 0.087 | 24,837 | 0.751 | 0.010 | 0.037 | 0.101 | 1.136 | 30.230 | 0.844 | 88.98 |
| MODIS | 0.083 | 0.081 | 16,734 | 0.836 | −0.002 | 0.045 | 0.107 | 0.973 | −9.800 | 0.908 | 84.70 | |
| VIIRS | 0.085 | 0.090 | 9474 | 0.844 | 0.006 | 0.046 | 0.148 | 1.068 | 1.388 | 0.886 | 89.09 | |
| ENA | MERRA-2 | 0.135 | 0.130 | 27,299 | 0.796 | −0.005 | 0.042 | 0.089 | 0.960 | 4.968 | 0.877 | 89.38 |
| MODIS | 0.130 | 0.132 | 16,149 | 0.717 | 0.002 | 0.054 | 0.102 | 1.014 | 4.723 | 0.843 | 81.44 | |
| VIIRS | 0.126 | 0.133 | 8659 | 0.788 | 0.006 | 0.046 | 0.094 | 1.051 | 9.472 | 0.881 | 85.56 | |
| SAM | MERRA-2 | 0.179 | 0.167 | 11,753 | 0.944 | −0.012 | 0.050 | 0.092 | 0.932 | −1.628 | 0.966 | 85.42 |
| MODIS | 0.181 | 0.142 | 7554 | 0.922 | −0.039 | 0.069 | 0.118 | 0.783 | −31.098 | 0.954 | 72.89 | |
| VIIRS | 0.138 | 0.110 | 5405 | 0.886 | −0.028 | 0.061 | 0.088 | 0.794 | −36.305 | 0.932 | 70.90 | |
| EUR | MERRA-2 | 0.153 | 0.148 | 25,772 | 0.800 | −0.005 | 0.043 | 0.073 | 0.967 | 0.923 | 0.888 | 87.88 |
| MODIS | 0.148 | 0.147 | 18,329 | 0.801 | −0.002 | 0.051 | 0.075 | 0.988 | −5.678 | 0.892 | 82.21 | |
| VIIRS | 0.136 | 0.143 | 9635 | 0.804 | 0.006 | 0.044 | 0.064 | 1.045 | 3.963 | 0.893 | 85.88 | |
| IND | MERRA-2 | 0.493 | 0.397 | 4258 | 0.667 | −0.095 | 0.155 | 0.272 | 0.806 | −18.429 | 0.757 | 67.10 |
| MODIS | 0.544 | 0.485 | 3033 | 0.800 | −0.059 | 0.150 | 0.228 | 0.892 | −13.482 | 0.883 | 64.59 | |
| VIIRS | 0.570 | 0.530 | 2126 | 0.822 | −0.040 | 0.140 | 0.222 | 0.930 | −0.375 | 0.869 | 69.14 | |
| AFC | MERRA-2 | 0.223 | 0.253 | 15,779 | 0.917 | 0.030 | 0.070 | 0.115 | 1.134 | 33.395 | 0.954 | 71.73 |
| MODIS | 0.277 | 0.341 | 8644 | 0.885 | 0.065 | 0.114 | 0.153 | 1.234 | 35.325 | 0.926 | 52.15 | |
| VIIRS | 0.273 | 0.349 | 3958 | 0.909 | 0.075 | 0.115 | 0.162 | 1.275 | 40.266 | 0.939 | 50.73 | |
| SEA | MERRA-2 | 0.218 | 0.180 | 3582 | 0.795 | −0.038 | 0.071 | 0.193 | 0.826 | −6.953 | 0.785 | 83.92 |
| MODIS | 0.185 | 0.195 | 1253 | 0.784 | 0.010 | 0.093 | 0.165 | 1.055 | −16.263 | 0.850 | 70.15 | |
| VIIRS | 0.216 | 0.267 | 577 | 0.652 | 0.051 | 0.155 | 0.245 | 1.235 | −14.484 | 0.742 | 48.53 | |
| ESA | MERRA-2 | 0.242 | 0.245 | 10,644 | 0.599 | 0.003 | 0.121 | 0.222 | 1.013 | 11.706 | 0.753 | 62.20 |
| MODIS | 0.201 | 0.211 | 6260 | 0.774 | 0.009 | 0.091 | 0.159 | 1.046 | −0.076 | 0.875 | 68.79 | |
| VIIRS | 0.193 | 0.209 | 4152 | 0.735 | 0.017 | 0.087 | 0.160 | 1.086 | 4.053 | 0.854 | 74.13 | |
| OCE | MERRA-2 | 0.086 | 0.104 | 4593 | 0.771 | 0.018 | 0.039 | 0.077 | 1.204 | 28.843 | 0.854 | 86.07 |
| MODIS | 0.085 | 0.048 | 3423 | 0.773 | −0.038 | 0.045 | 0.092 | 0.559 | −52.891 | 0.846 | 84.84 | |
| VIIRS | 0.083 | 0.072 | 1583 | 0.739 | −0.011 | 0.036 | 0.056 | 0.864 | −21.384 | 0.847 | 88.69 |
| Region | Product | 10 × Fitting Coefficient (Bias and Uncertainty) | 2 × Normalized Standard Deviation (Bias and Uncertainty) | Total Mean * | ||
|---|---|---|---|---|---|---|
| WNA | MERRA-2 | −0.012 | 0.011 | 0.009 | 0.039 | 0.018 |
| MODIS | −0.007 | 0.030 | 0.012 | 0.036 | 0.021 | |
| VIIRS | 0.008 | 0.111 | 0.020 | 0.152 | 0.073 | |
| ENA | MERRA-2 | −0.015 | −0.031 | 0.011 | 0.029 | 0.021 |
| MODIS | −0.031 | −0.045 | 0.02 | 0.044 | 0.035 | |
| VIIRS | −0.038 | −0.046 | 0.024 | 0.071 | 0.045 | |
| SAM | MERRA-2 | −0.013 | −0.031 | 0.019 | 0.046 | 0.027 |
| MODIS | −0.027 | −0.059 | 0.027 | 0.061 | 0.044 | |
| VIIRS | −0.01 | 0.017 | 0.036 | 0.031 | 0.023 | |
| EUR | MERRA-2 | −0.005 | −0.017 | 0.009 | 0.023 | 0.013 |
| MODIS | −0.014 | −0.016 | 0.013 | 0.019 | 0.015 | |
| VIIRS | −0.018 | −0.003 | 0.017 | 0.006 | 0.011 | |
| IND | MERRA-2 | 0.065 | 0.149 | 0.053 | 0.114 | 0.095 |
| MODIS | −0.039 | 0.078 | 0.032 | 0.064 | 0.053 | |
| VIIRS | −0.036 | −0.035 | 0.061 | 0.062 | 0.049 | |
| AFC | MERRA-2 | −0.014 | 0.018 | 0.012 | 0.021 | 0.016 |
| MODIS | 0.015 | 0.008 | 0.026 | 0.021 | 0.018 | |
| VIIRS | 0.040 | −0.017 | 0.048 | 0.056 | 0.04 | |
| SEA | MERRA-2 | 0.033 | 0.063 | 0.04 | 0.098 | 0.058 |
| MODIS | −0.050 | 0.055 | 0.121 | 0.093 | 0.08 | |
| VIIRS | 0.477 | −0.302 | 0.33 | 0.228 | 0.334 | |
| ESA | MERRA-2 | −0.016 | −0.004 | 0.030 | 0.044 | 0.024 |
| MODIS | −0.042 | −0.034 | 0.034 | 0.052 | 0.04 | |
| VIIRS | −0.001 | −0.030 | 0.016 | 0.049 | 0.024 | |
| OCE | MERRA-2 | −0.002 | −0.005 | 0.012 | 0.037 | 0.014 |
| MODIS | 0.006 | −0.039 | 0.025 | 0.047 | 0.029 | |
| VIIRS | −0.037 | 0.027 | 0.036 | 0.027 | 0.032 | |
Disclaimer/Publisher’s Note: The statements, opinions and data contained in all publications are solely those of the individual author(s) and contributor(s) and not of MDPI and/or the editor(s). MDPI and/or the editor(s) disclaim responsibility for any injury to people or property resulting from any ideas, methods, instructions or products referred to in the content. |
© 2024 by the authors. Licensee MDPI, Basel, Switzerland. This article is an open access article distributed under the terms and conditions of the Creative Commons Attribution (CC BY) license (https://creativecommons.org/licenses/by/4.0/).
Share and Cite
Su, X.; Huang, G.; Wang, L.; Wei, Y.; Ma, X.; Wang, L.; Feng, L. Validation and Comparison of Long-Term Accuracy and Stability of Global Reanalysis and Satellite Retrieval AOD. Remote Sens. 2024, 16, 3304. https://doi.org/10.3390/rs16173304
Su X, Huang G, Wang L, Wei Y, Ma X, Wang L, Feng L. Validation and Comparison of Long-Term Accuracy and Stability of Global Reanalysis and Satellite Retrieval AOD. Remote Sensing. 2024; 16(17):3304. https://doi.org/10.3390/rs16173304
Chicago/Turabian StyleSu, Xin, Ge Huang, Lin Wang, Yifeng Wei, Xiaoyu Ma, Lunche Wang, and Lan Feng. 2024. "Validation and Comparison of Long-Term Accuracy and Stability of Global Reanalysis and Satellite Retrieval AOD" Remote Sensing 16, no. 17: 3304. https://doi.org/10.3390/rs16173304
APA StyleSu, X., Huang, G., Wang, L., Wei, Y., Ma, X., Wang, L., & Feng, L. (2024). Validation and Comparison of Long-Term Accuracy and Stability of Global Reanalysis and Satellite Retrieval AOD. Remote Sensing, 16(17), 3304. https://doi.org/10.3390/rs16173304