Article

Spatial–Temporal Variations in the Climate, Net Ecosystem Productivity, and Efficiency of Water and Carbon Use in the Middle Reaches of the Yellow River

College of Geography and Environmental Science, Northwest Normal University, Lanzhou 730070, China
*
Author to whom correspondence should be addressed.
Remote Sens. 2024, 16(17), 3312; https://doi.org/10.3390/rs16173312
Submission received: 15 July 2024 / Revised: 30 August 2024 / Accepted: 4 September 2024 / Published: 6 September 2024
(This article belongs to the Special Issue Assessment of Ecosystem Services Based on Satellite Data)

Abstract

:
An accurate assessment of the spatial–temporal variations in regional net ecosystem productivity (NEP), water use efficiency (WUE), and carbon use efficiency (CUE) are vital for understanding the water–carbon cycle. We analyzed the spatial–temporal patterns of the NEP, WUE, and CUE in the middle reaches of the Yellow River (MRYR) from 2001 to 2022, and the factors that influenced them using remote sensing data, NEP estimation models, and various statistical methods. The results indicate that the recovery of the ecosystem in the MRYR is a result of the combined effects of climate change and human activities. Climate change in the MRYR led to warming and humidification from 2001 to 2022. The NEP, WUE, and CUE were characterized by increasing trends, with average growth rates of 7.75 gC m−2a−1, 0.012 gC m−2 mm−1a−1, and 0.009a−1, respectively. For four vegetation types, the interannual rates of change were, in descending order, grassland, cropland, shrubs, and forest. Spatially, the NEP, WUE, and CUE showed significant regional heterogeneity, increasing from the northwest to the southeast. Based on an analysis of the interannual anomalies, precipitation accumulation contributed to carbon sink accumulation. The correlation of the NEP, WUE, and CUE with the drought severity index (DSI) was high, and their correlation with precipitation showed latitudinal zonality, which suggests that precipitation (PRE) is the main climatic factor influencing the water–carbon cycle in the MRYR rather than temperature (TEM). There were 67,671.27 km2 of land that changed use during 2001–2022, and 15.07 Tg of NEP was added to these areas.

1. Introduction

The water–carbon cycle is one of the significant links in ecosystems, and small changes in it pose great challenges to food security, and even the continuation of biological life [1,2]. The pressure on water resources has been exacerbated by increasing water demand and decreasing water supply under the dual effects of global change and human activity [3]. This century, many countries have experienced the threat of diminishing water resources, especially the relatively arid regions of northwestern China [4]. Surface vegetation has also shown significant greening under these dual impacts, and the carbon sequestration capacity of plants has increased [5]. In view of this, it is essential to study the carbon (C) uptake and water consumption of ecosystems, and it is of great importance to examine the effects of climate on carbon sequestration and the efficiency of vegetation from the perspectives of water–carbon use. It is useful to analyze these interactions at regional and national levels to provide policymakers with the necessary information [6]. A deeper understanding of the spatial and temporal variability in vegetation productivity and the efficiency of water and carbon use, and an exploration of their relationships with various environmental elements are important for regional ecological restoration, as well as sustainable development.
The net ecosystem productivity (NEP) is a key indicator for quantitatively assessing an ecosystem’s carbon sources and sinks [7,8]. The NEP is the result of the total ecosystem’s primary productivity (GPP) minus the total ecosystem’s respiration over a given period of time [9]. In general, ecosystems are carbon sinks when the NEP is positive and vice versa [10,11,12]. Carbon sinks are spatially influenced by factors such as vegetation type, climate, human activities, etc., while changes in carbon sinks over time are primarily influenced by changes in climatic factors [13]. In relatively arid regions, the temperature and precipitation are the main controlling factors [13]. Solar radiation has the greatest impact on carbon sinks in humid and semi-humid regions [14]. Thus, it is clear that the degree of response of vegetation to environmental factors and human activity varies in different regions [15,16]. Different vegetation types respond differently to climate change due to their physiological structure and function [17,18]. Thus, understanding the impacts of climate on land cover change can lead to more effective land management strategies.
The carbon use efficiency (CUE) and water use efficiency (WUE) are significant parameters used for evaluating carbon sequestration and water use in vegetation [19]. The CUE is the proportion of carbon used by organisms to form biomass to the total carbon they take up [20]. A higher carbon use efficiency means that organisms release less carbon, which is conducive to carbon stabilization and long-term sequestration. According to related studies, the CUE can be subdivided into the vegetation CUE (CUEa), microbial CUE (CUEh), and ecosystem CUE (CUEe) [21]. Both the CUEa and CUEh are interconnected through aboveground and belowground apomictic material [22], which is expressed as the CUEe, the ecosystem CUE. The CUEe is calculated by the formula NEP/GPP, which reflects the carbon sequestration potential of the vegetation in an ecosystem [23,24]. In this study, the concept of the CUEe is used to analyze the study area. The WUE is the rate of carbon sequestration per unit of water consumption [25]. The WUE is calculated using different methods depending on the purpose [26]. Here, the WUE is defined as NEP/ETa, with ETa being the actual evapotranspiration. The CUE was initially thought to be converging to 0.5 [27]. However, due to the physiological structure of vegetation itself, and the strength of photosynthesis and respiration caused by the changes in environmental factors, scholars have rejected the constant value of CUE = 0.5 [19]. Thus, the study of WUE and CUE can help human beings to better understand climate change and CO2 emissions, which will be important for managing ecosystems in the future.
In the last decades, there has been extensive research interest in the relationship between plant C assimilation and water depletion, especially with regard to the relationship between WUE and CUE and meteorological factors, as well as techniques with which to enhance vegetative WUE and CUE [28]. With advancements in observation techniques and the improvement of plant physiological models, scholars have gained a better understanding of the interaction of WUE and CUE with environmental factors at different scales [20,21,22,24,25,26,29]. Nevertheless, traditional site observation, modeling, and experimental methods have difficulties meeting the needs of large-scale research. These methods have large uncertainties in the conversion process from sample points to regions, making the study of the water–carbon cycle at large spatial scales challenging [15]. Fortunately, access to various biophysical parameters and hydrologic indices have become feasible with the support of remote sensing-based public domain data, providing unique opportunities for regional- and global-scale studies.
The MRYR are located on the Loess Plateau, the largest in the world. The region has experienced severe ecological damage [30]. In response, China has implemented many ecological restoration measures over the past 40 years, and the Loess Plateau has shown an obvious greening trend [30,31,32,33]. Nevertheless, the impact of anthropogenic vegetation restoration on the key processes of water and carbon cycling in terrestrial ecosystems are still poorly understood [34]. Therefore, it remains a challenge to study the changes in ecosystem productivity, WUE, and CUE during vegetation restoration and to link such changes to various natural factors. To address this challenge, the main objectives of this study were the following: (1) to analyze the characteristics of the changes in the climate variables in the MRYR during 2001–2022; (2) to quantify the spatial–temporal interannual variations in the NEP, WUE, and CUE; (3) to analyze the relationship between the NEP, WUE, and CUE and climate factors (PRE, TEM, and DSI) to determine how they are controlled by environmental variables; and (4) to quantify the impact of land cover change on the NEP. The main contribution of this paper is its study of the NEP, WUE, and CUE in the context of anthropogenic restoration in the MRYR. It makes up for the fact that there are fewer studies of this area. Further, this study analyzes the WUE and CUE based on the NEP, which is more in-depth than previous studies based on the NPP.

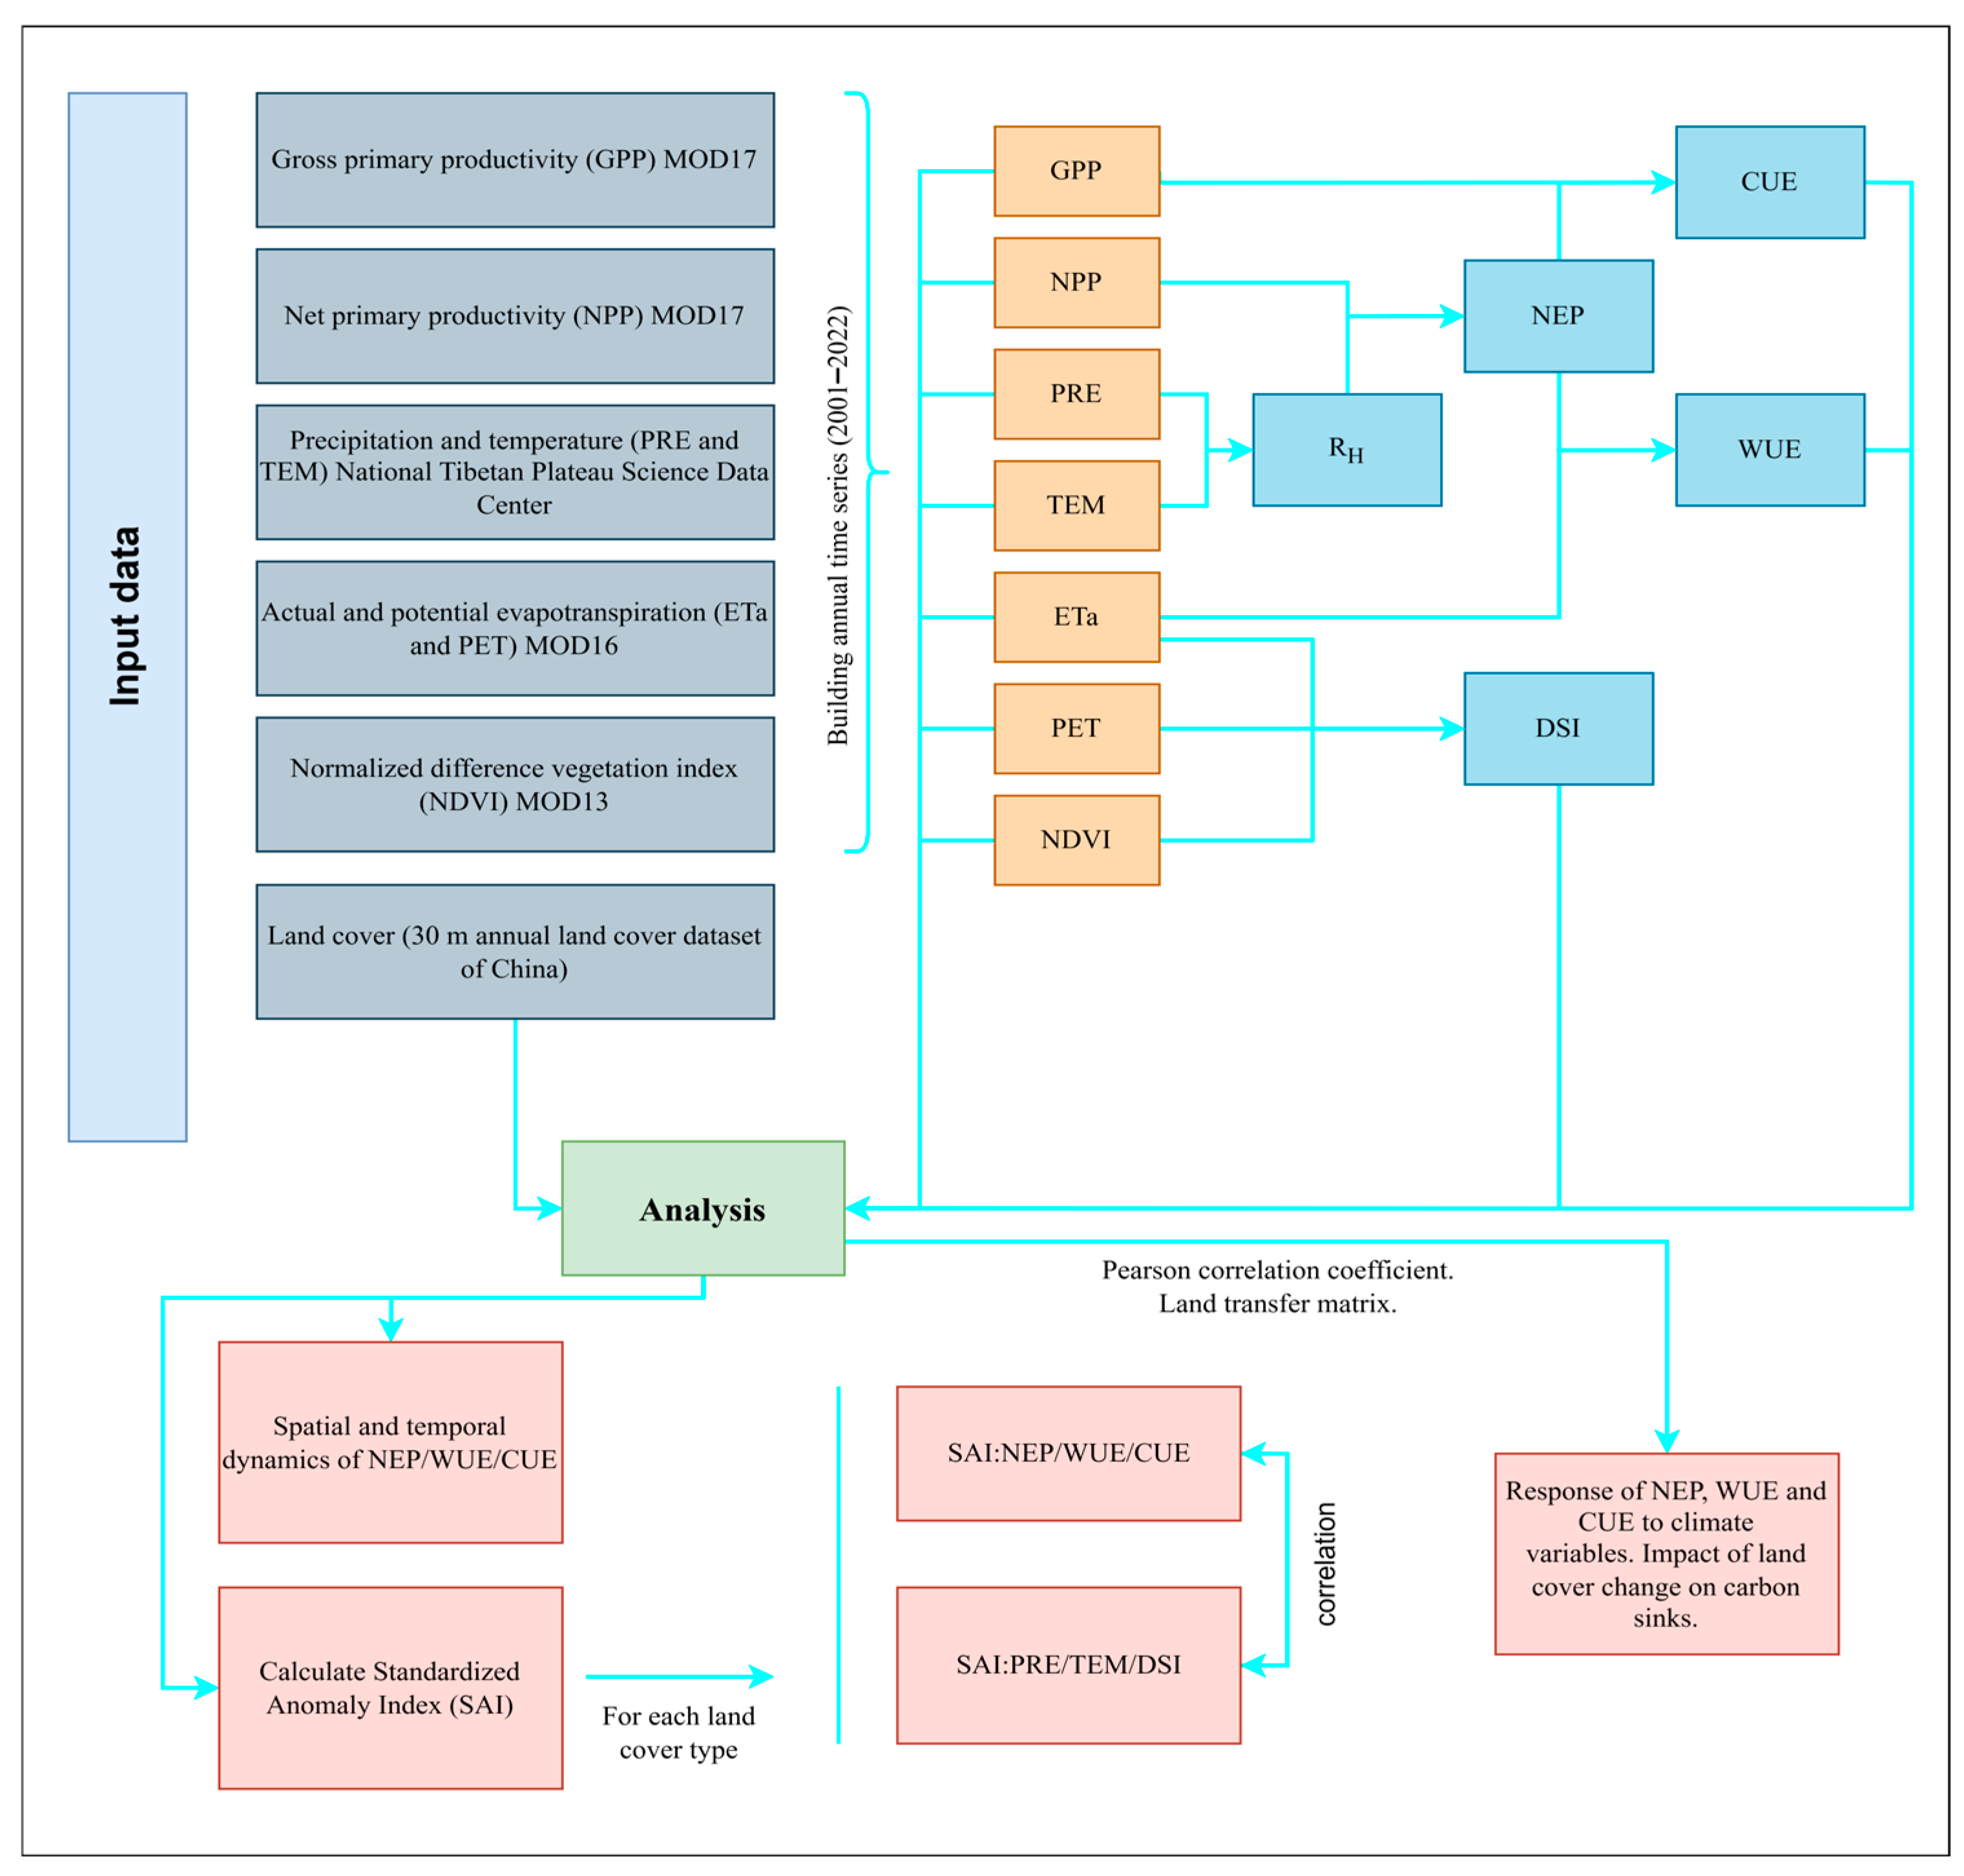
2. Materials and Methods
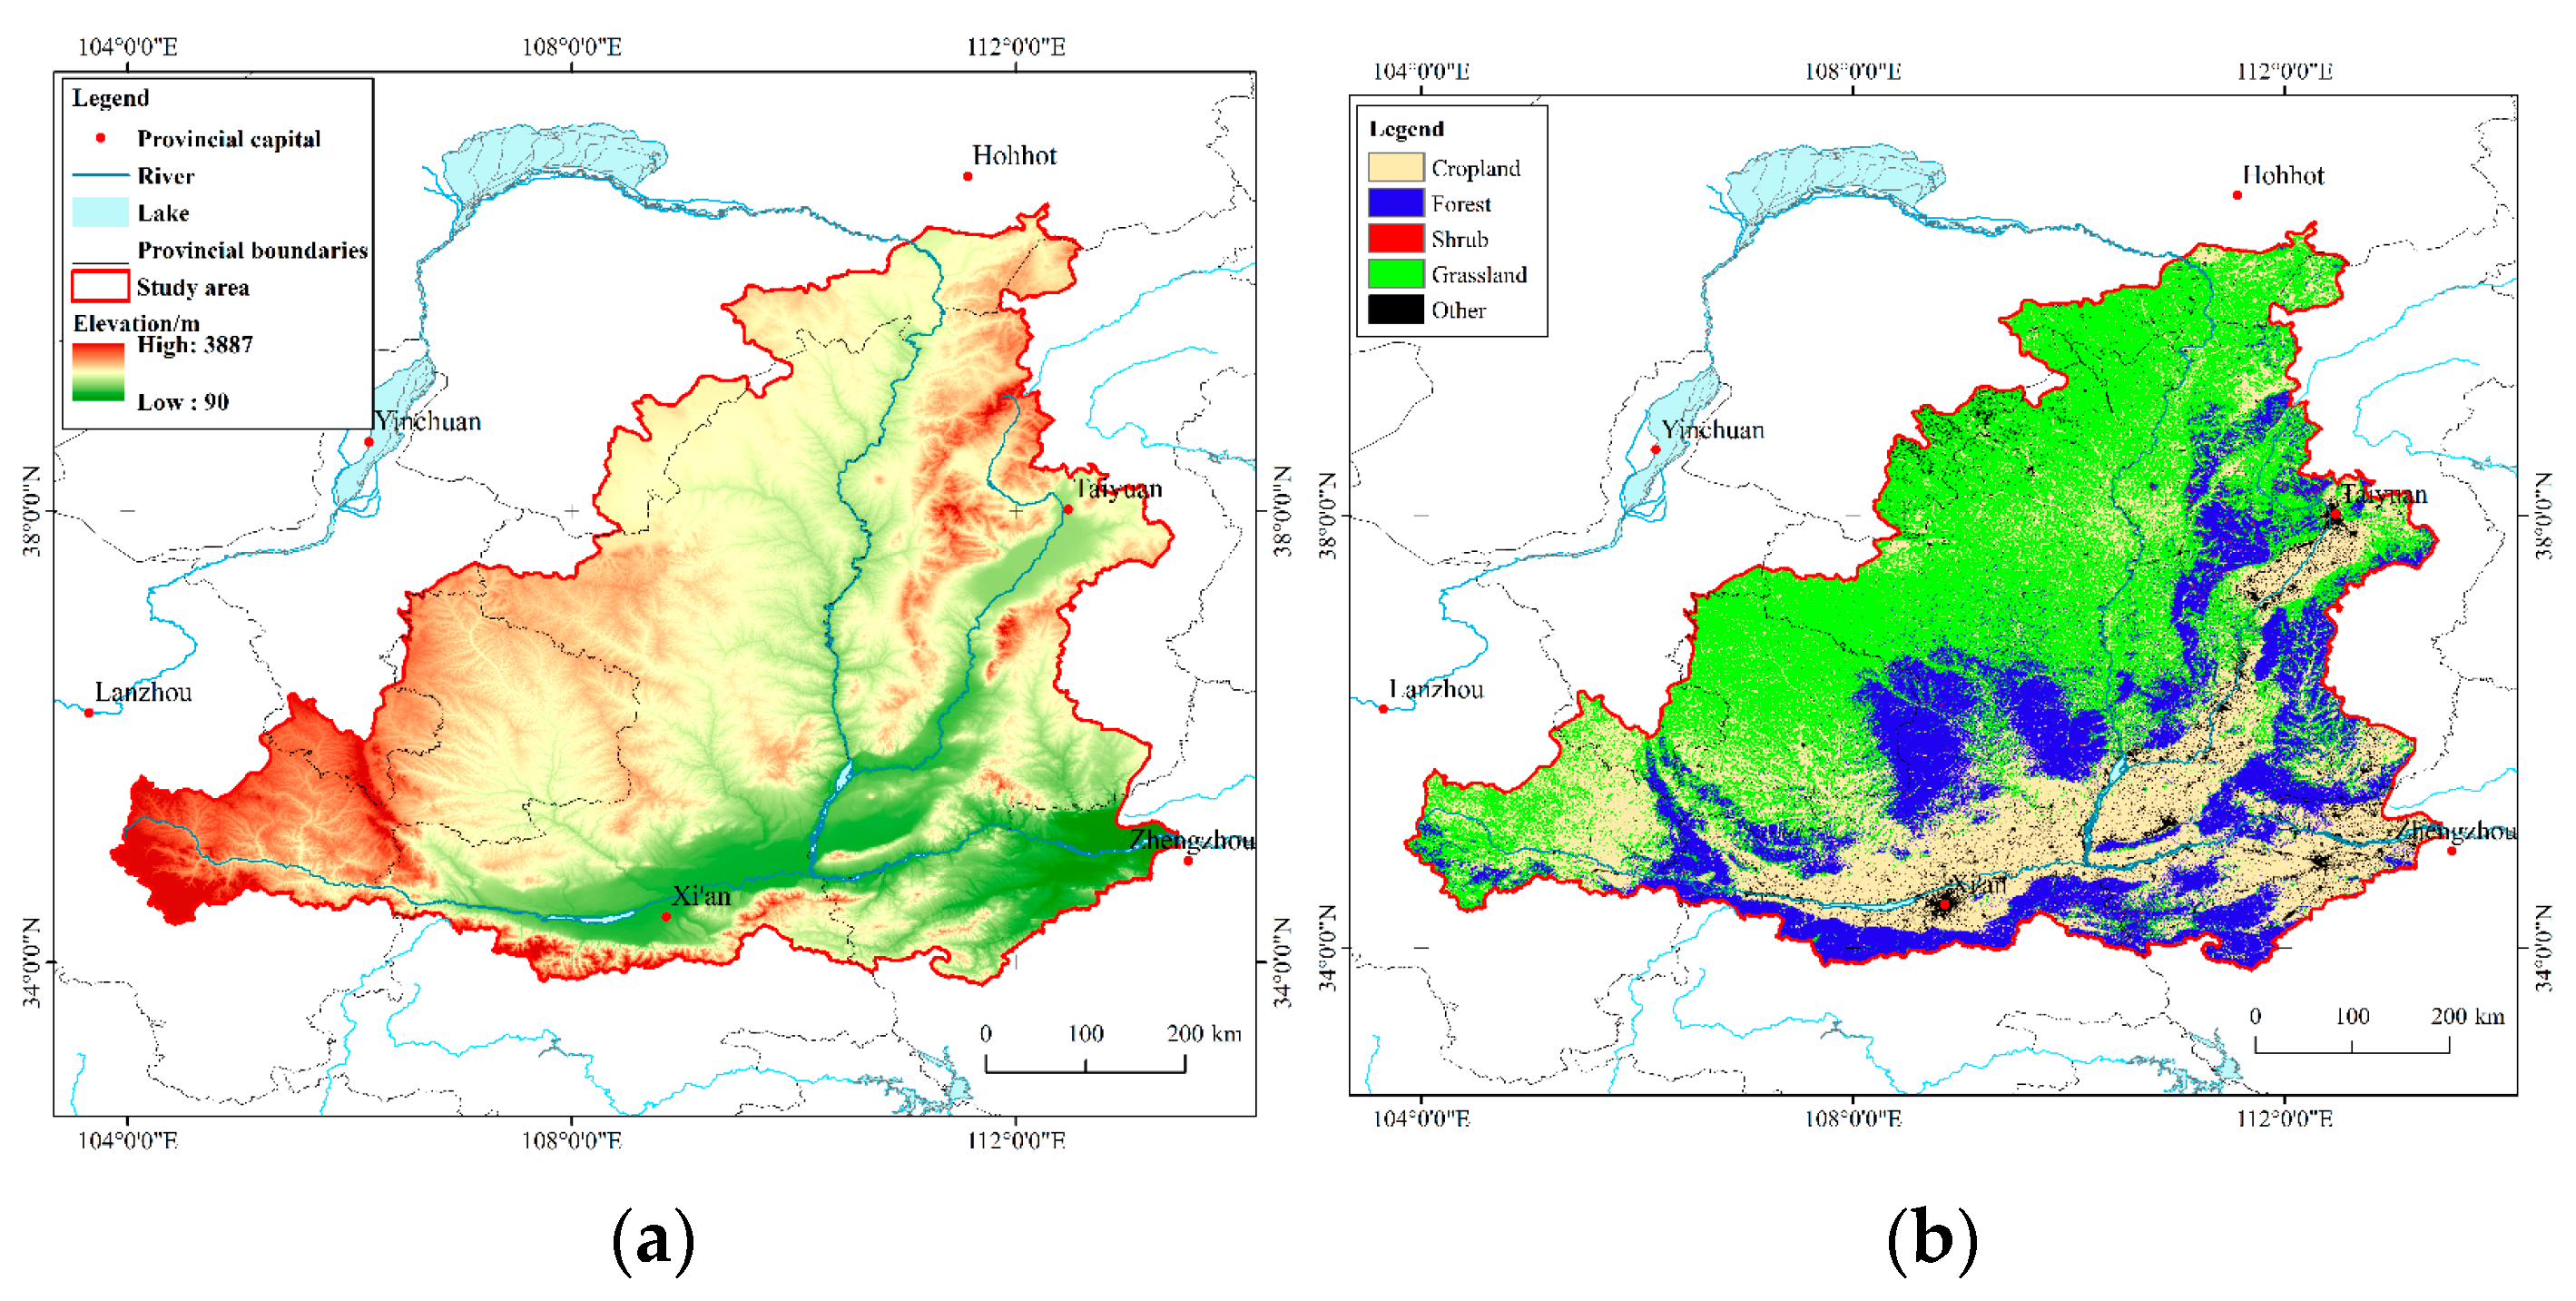
In this study, which focused on anthropogenic vegetation restoration in the study area, Moderate Resolution Imaging Spectroradiometer (MODIS) products were selected as the main data source with which to analyze the characteristics of the changes in the climate, NEP, WUE, and CUE in the study area, and to explore their relationships. Specifically, the change characteristics of the climate elements were analyzed, followed by the change characteristics of the NEP, WUE, and CUE. Third, the climate elements, NEP, WUE, and CUE, were subjected to standardized anomaly calculations to analyze the standardized anomaly index (SAI) and their relationships. Finally, the relationship between the climate variables and the NEP, WUE, and CUE were quantified using the Pearson correlation method, and a transfer matrix was used to analyze the relationship between land cover change and carbon sinks (Figure 1).

2.1. Study Area

The middle reaches of the Yellow River (MRYR) are located in central China, between 34°N~40°N and 104°E~114°E, with a total length of 1206.4 km and a watershed area of about 3.44 × 10⁵ km2 (Figure 2). The region belongs to the continental monsoon climate zone, controlled by the East Asian monsoon, and the climate is zonal. The distribution of PRE is extremely uneven, and as far as the seasons are concerned, it is generally dry in the winter and rainy in the summer; its spatial distribution decreases from the southeast to northwest. The average annual TEM range is 8~14 °C, and the average annual PRE is about 520.45 mm [35]. The MRYR have a high evaporation intensity, with a potential evapotranspiration of more than 1000 mm per year.

2.2. Data and Pre-Processing

The data used in this study are from the public domain and span the period 2001–2022. In accordance with the NEP, WUE, CUE, and DSI calculation requirements, we obtained the NPP, GPP, PRE, TEM, ETa, potential evapotranspiration (PET), and normalized difference vegetation index (NDVI) data, and used these in conjunction with the land cover data for the present analysis (Table 1).
Here, the land cover types in the MRYR were categorized into a total of five land classes: grassland, cropland, forest, shrubs, and other (Figure 2). The land cover data used the 30 m annual land cover dataset for China, which was constructed based on Landsat imagery [36], and for which the data from 2001 to 2022 were selected. Figure 2 shows the land cover in 2012. We mainly studied the grasslands, croplands, shrubs, and forests. The PRE and TEM data were obtained from the National Tibetan Plateau Science Data Center, which is the 1 km monthly precipitation and mean temperature dataset for China (1901–2022) [37]. These two datasets were generated by the Delta spatial downscaling program in China based on the global 0.5° climate dataset released by the Climate Research Unit (CRU), and the global high-resolution climate dataset released by WorldClim. The dataset was validated against the observations (TEM and PRE) of 496 national meteorological stations between 1951 and 2016, and the validation results were credible [37]. The data have been updated to 2022. The MODIS data used in this paper were the ETa, PET, NDVI, GPP, and NPP. To maintain consistency in the spatial resolution, all were resampled to 1 km.

2.3. Methodology

2.3.1. Drought Severity Index (DSI)

The drought severity index (DSI) is calculated based on the MODIS data for the NDVI, ETa, and PET. It combines agricultural drought and meteorological drought [38], and has been shown to capture major global drought events [39,40,41]. Therefore, the DSI was used in this paper to monitor drought conditions in the MRYR during 2001–2022. The DSI was calculated as a standardized value with the following equation:
A N D V I = N D V I N D V I ¯ δ N D V I
A E V A = ( E T a / P E T ) ( E T a / P E T ) ¯ δ ( E T a / P E T )
A = A N D V I + A E V A
D S I = A A ¯ δ A
where ANDVI is the standardized anomaly for the NDVI, calculated from the mean ( N D V I ¯ ) and standard deviation ( δ N D V I ) of the NDVI from 2001 to 2022. AEVA is the standardized anomaly for the ratio of ETa to PET (ETa/PET). A is the sum of ANDVI and AEVA. DSI is the standardized anomaly for A. The DSI drought categories are shown in Table 2 [38].

2.3.2. NEP, WUE, and CUE

The net ecosystem productivity (NEP) was proposed by Woodwell [42] in 1978, considering the NEP as the NPP minus heterotrophic respiration.
N E P = N P P R H
where NEP is the net ecosystem productivity, NPP is the net primary productivity, and RH is the heterotrophic respiration.
Heterotrophic respiration is calculated by the temperature- and precipitation-based carbon emission regression equation proposed by Pei et al. [43]. This equation model has been widely validated in Northwest China and Central Asia [8,44,45], so it is used in this study. The equations are as follows:
R H = 0.22 × ( exp ( 0.0913 × T E M ) + ln ( 0.3145 × P R E + 1 ) ) × 30 × 46.5 %
where TEM is temperature, PRE is precipitation, 30 is because monthly data were used, and 46.5% is the fraction of carbon emissions released by microbial respiration.
In this study, the CUE is the ecosystem carbon use efficiency [21]. Therefore, the WUE is also calculated by the NEP. The formula is as follows:
C U E = N E P G P P
W U E = N E P E T a
where CUE is the carbon use efficiency, WUE is the water use efficiency, GPP is the gross primary productivity, and ETa is the actual evapotranspiration.
For the MODIS productivity data, Zhang et al. [46] deployed a close-path eddy covariance (CPEC) flux tower in the eastern foothills of the Taihang Mountains in the MRYR, and found that the CPEC-observed GPP correlates well with the MODIS GPP (R2 = 0.69, p < 0.01); for the MODIS evapotranspiration data, Zhang et al. [47] used measured data for the Han River basin near the MRYR for a correlation analysis with MOD16 products, and the correlation coefficients were all above 0.87. Therefore, we believe that the MODIS data are reliable for use in this study area. In addition, to give more credibility to our findings, relevant studies of NEP, WUE, and CUE based on MODIS products are summarized [8,44,45,48,49,50,51,52,53] (Table 3). MODIS satellite data can be effectively used in studies related to NEP, WUE, and CUE due to its high spatial and temporal resolution. Thus, MODIS productivity and evapotranspiration products are used in this study.

2.3.3. Trend Analysis

The combination of the Theil–Sen median trend analysis and the Mann–Kendall (M–K) trend test is a very effective method for analyzing time series data [54]. Compared to other trend analysis methods, the Theil–Sen trend has the property of being insensitive to outliers, which reduces the impact of outliers to a large extent [46,55]. The M–K test is a rank-based nonparametric statistical test [56]. It is applicable to all distributions (i.e., the sample data can fail to satisfy the normal distribution) and can eliminate the effects of outliers.

2.3.4. Standardized Anomaly Indices

In order to monitor the interannual anomalous variations in the climate variables, NEP, WUE, and CUE, their standardized anomaly indices (SAI) were calculated to analyze their anomalous variations and their correlations within the study timeframe. The formulas are given below:
S A I = ( Y ( i , j , t ) Y ¯ ( i , j ) ) s t d ( Y ( i , j ) )
where Y(i, j, t) is the original value of image element (i, j) at moment t, Y ¯ ( i , j ) is the mean value of image element (i, j) from 2001 to 2022, and std(Y(i, j)) is the standard deviation of image element (i, j) from 2001 to 2022.

2.3.5. Pearson Correlation Coefficient

To analyze the relationship between the NEP, WUE, and CUE and climatic variables, we used the Pearson correlation coefficient method. For the climatic variables, we selected the temperature, precipitation, and DSI. The Pearson correlation coefficient method is used to calculate the correlation between two things by using the principle of statistics, which is widely used in geography research [57].

3. Results

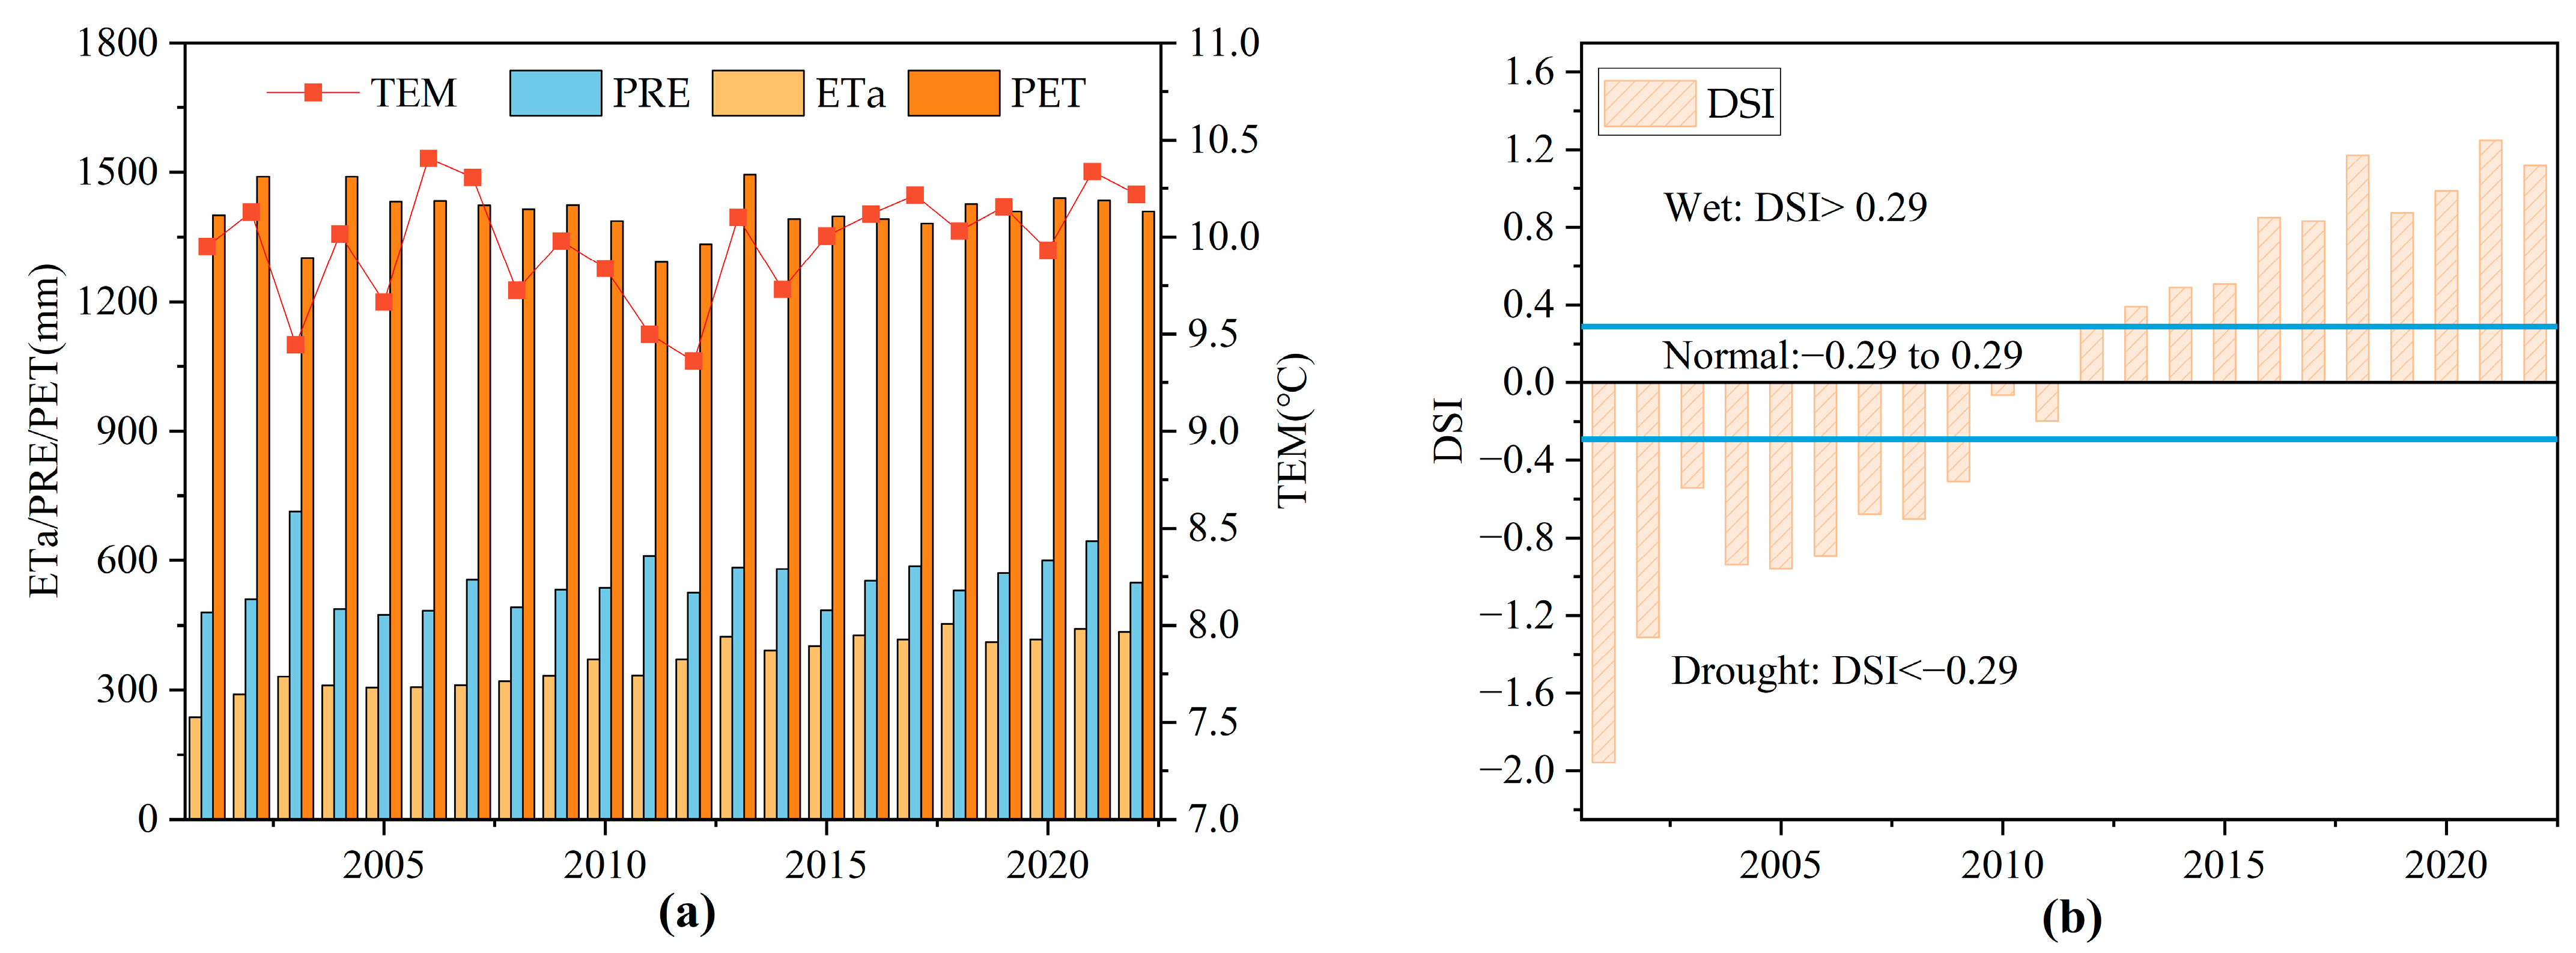
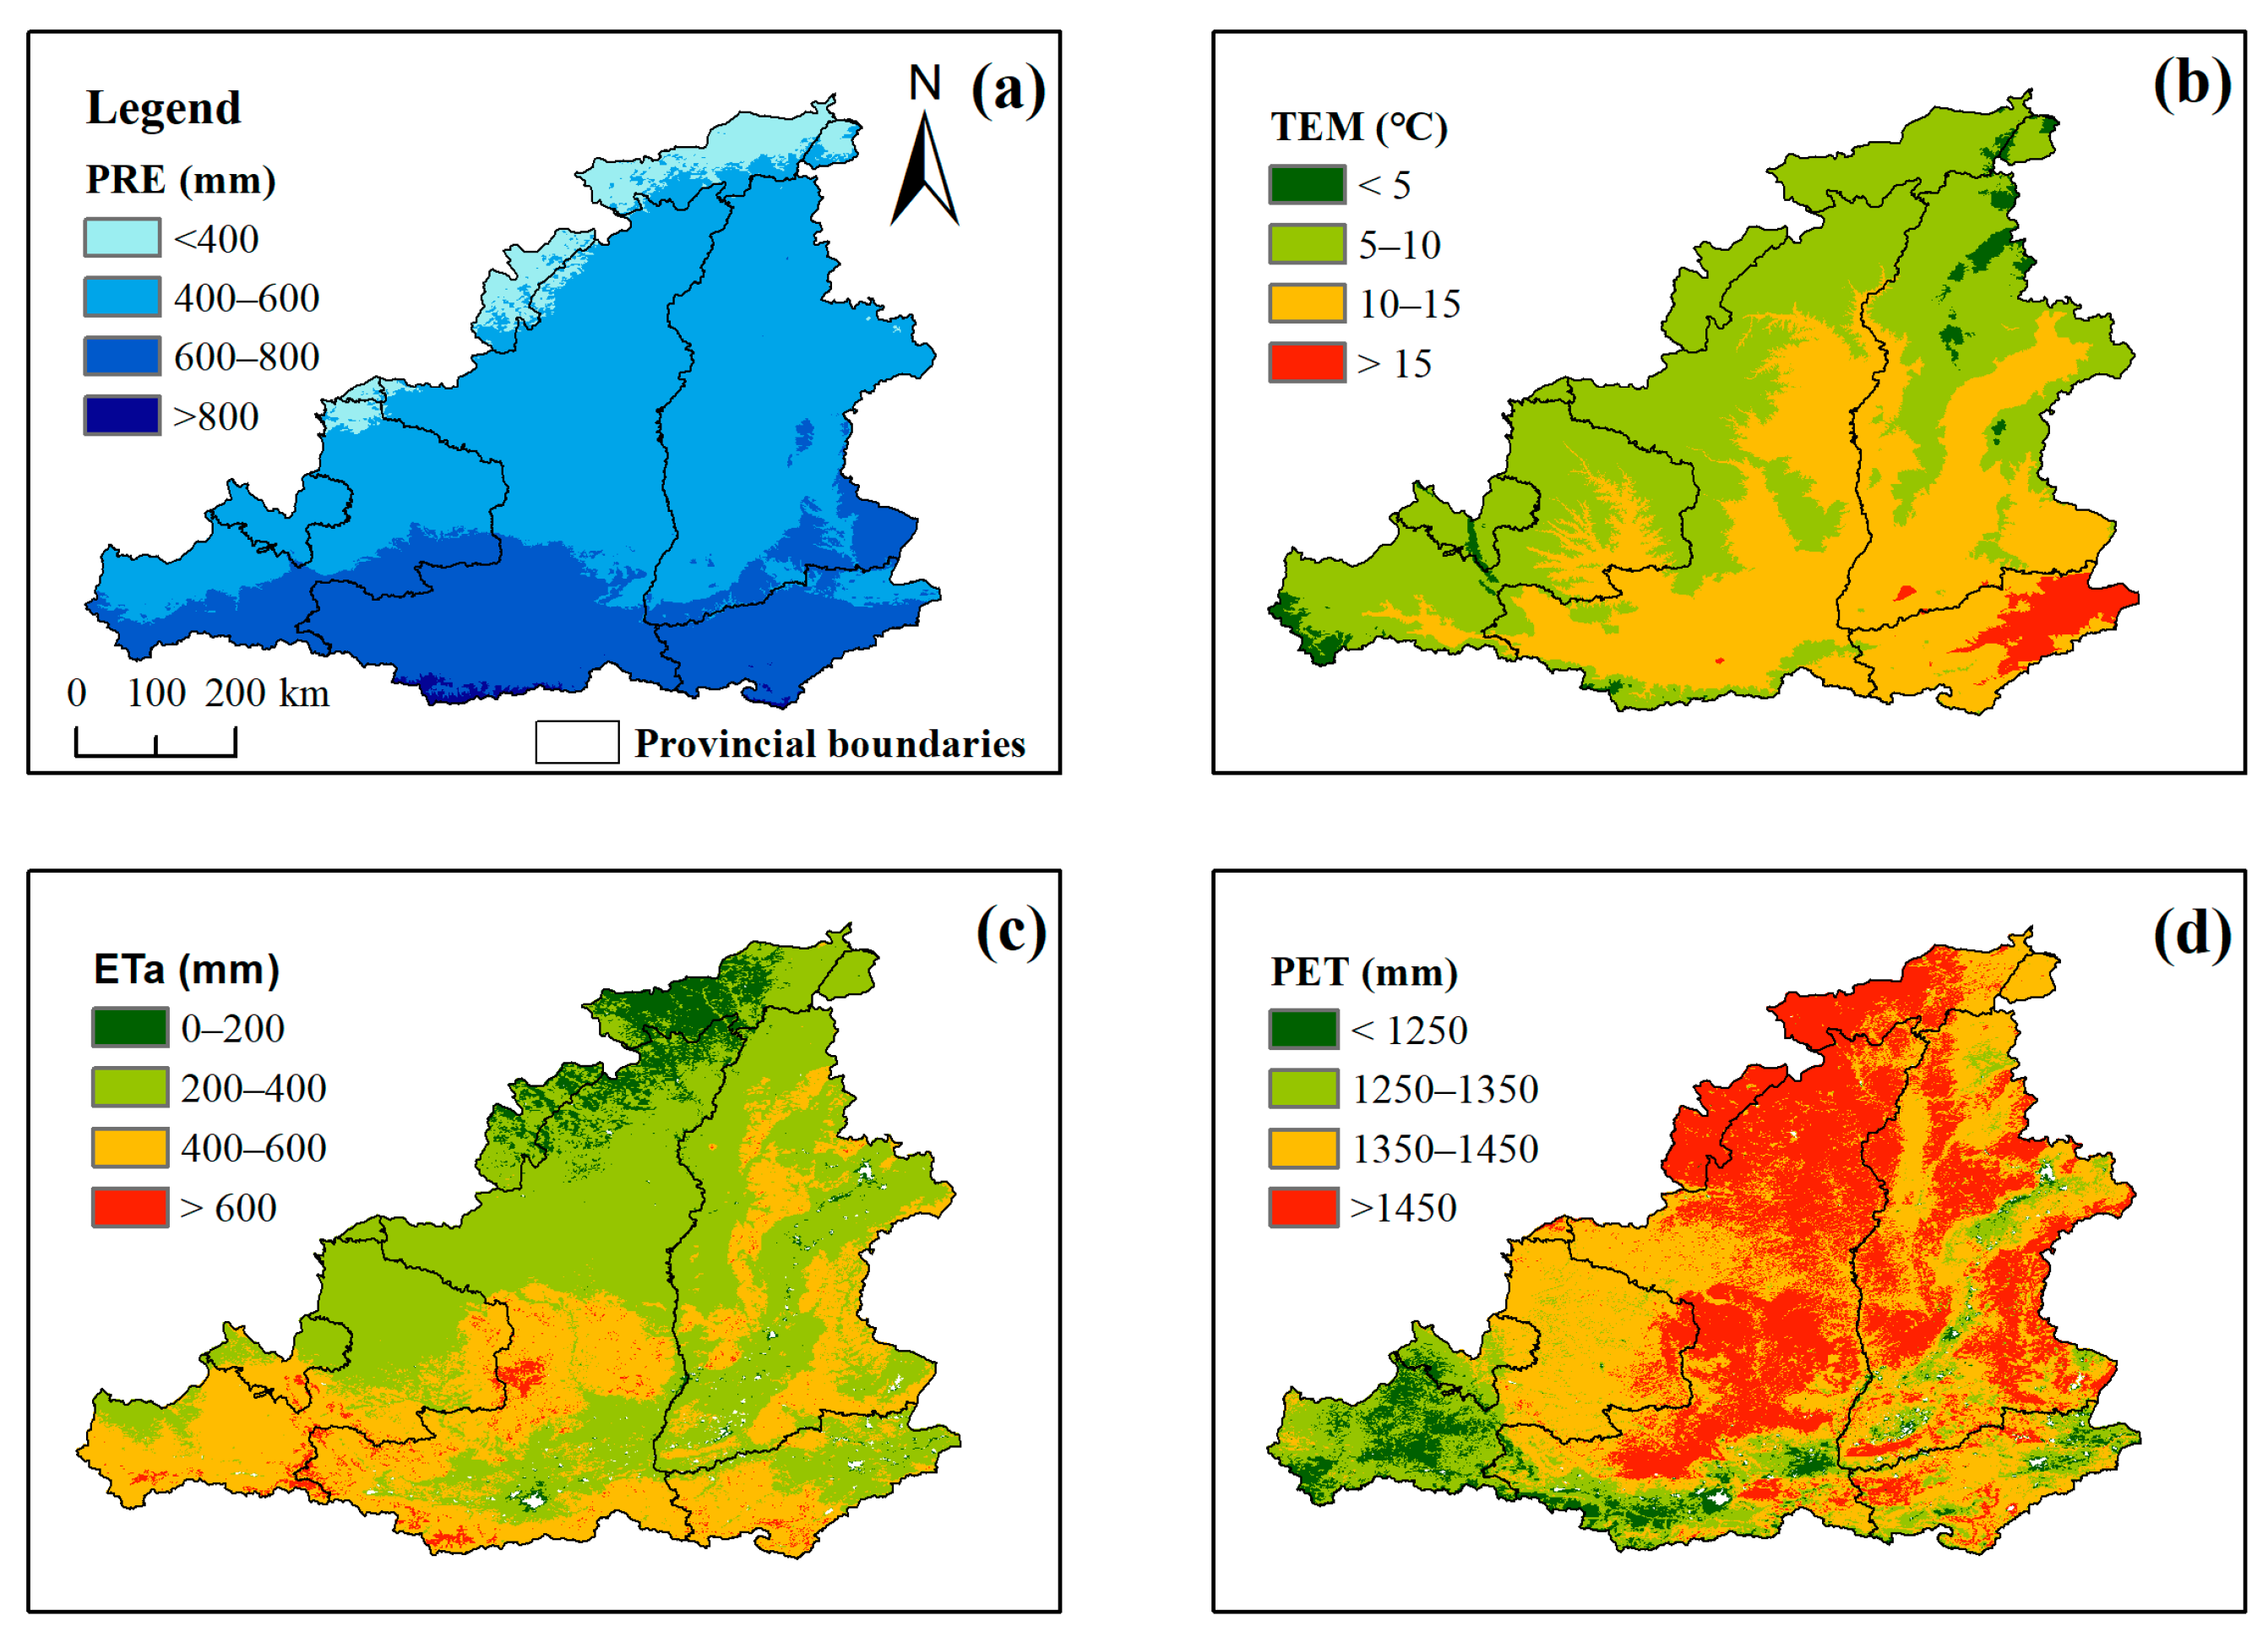
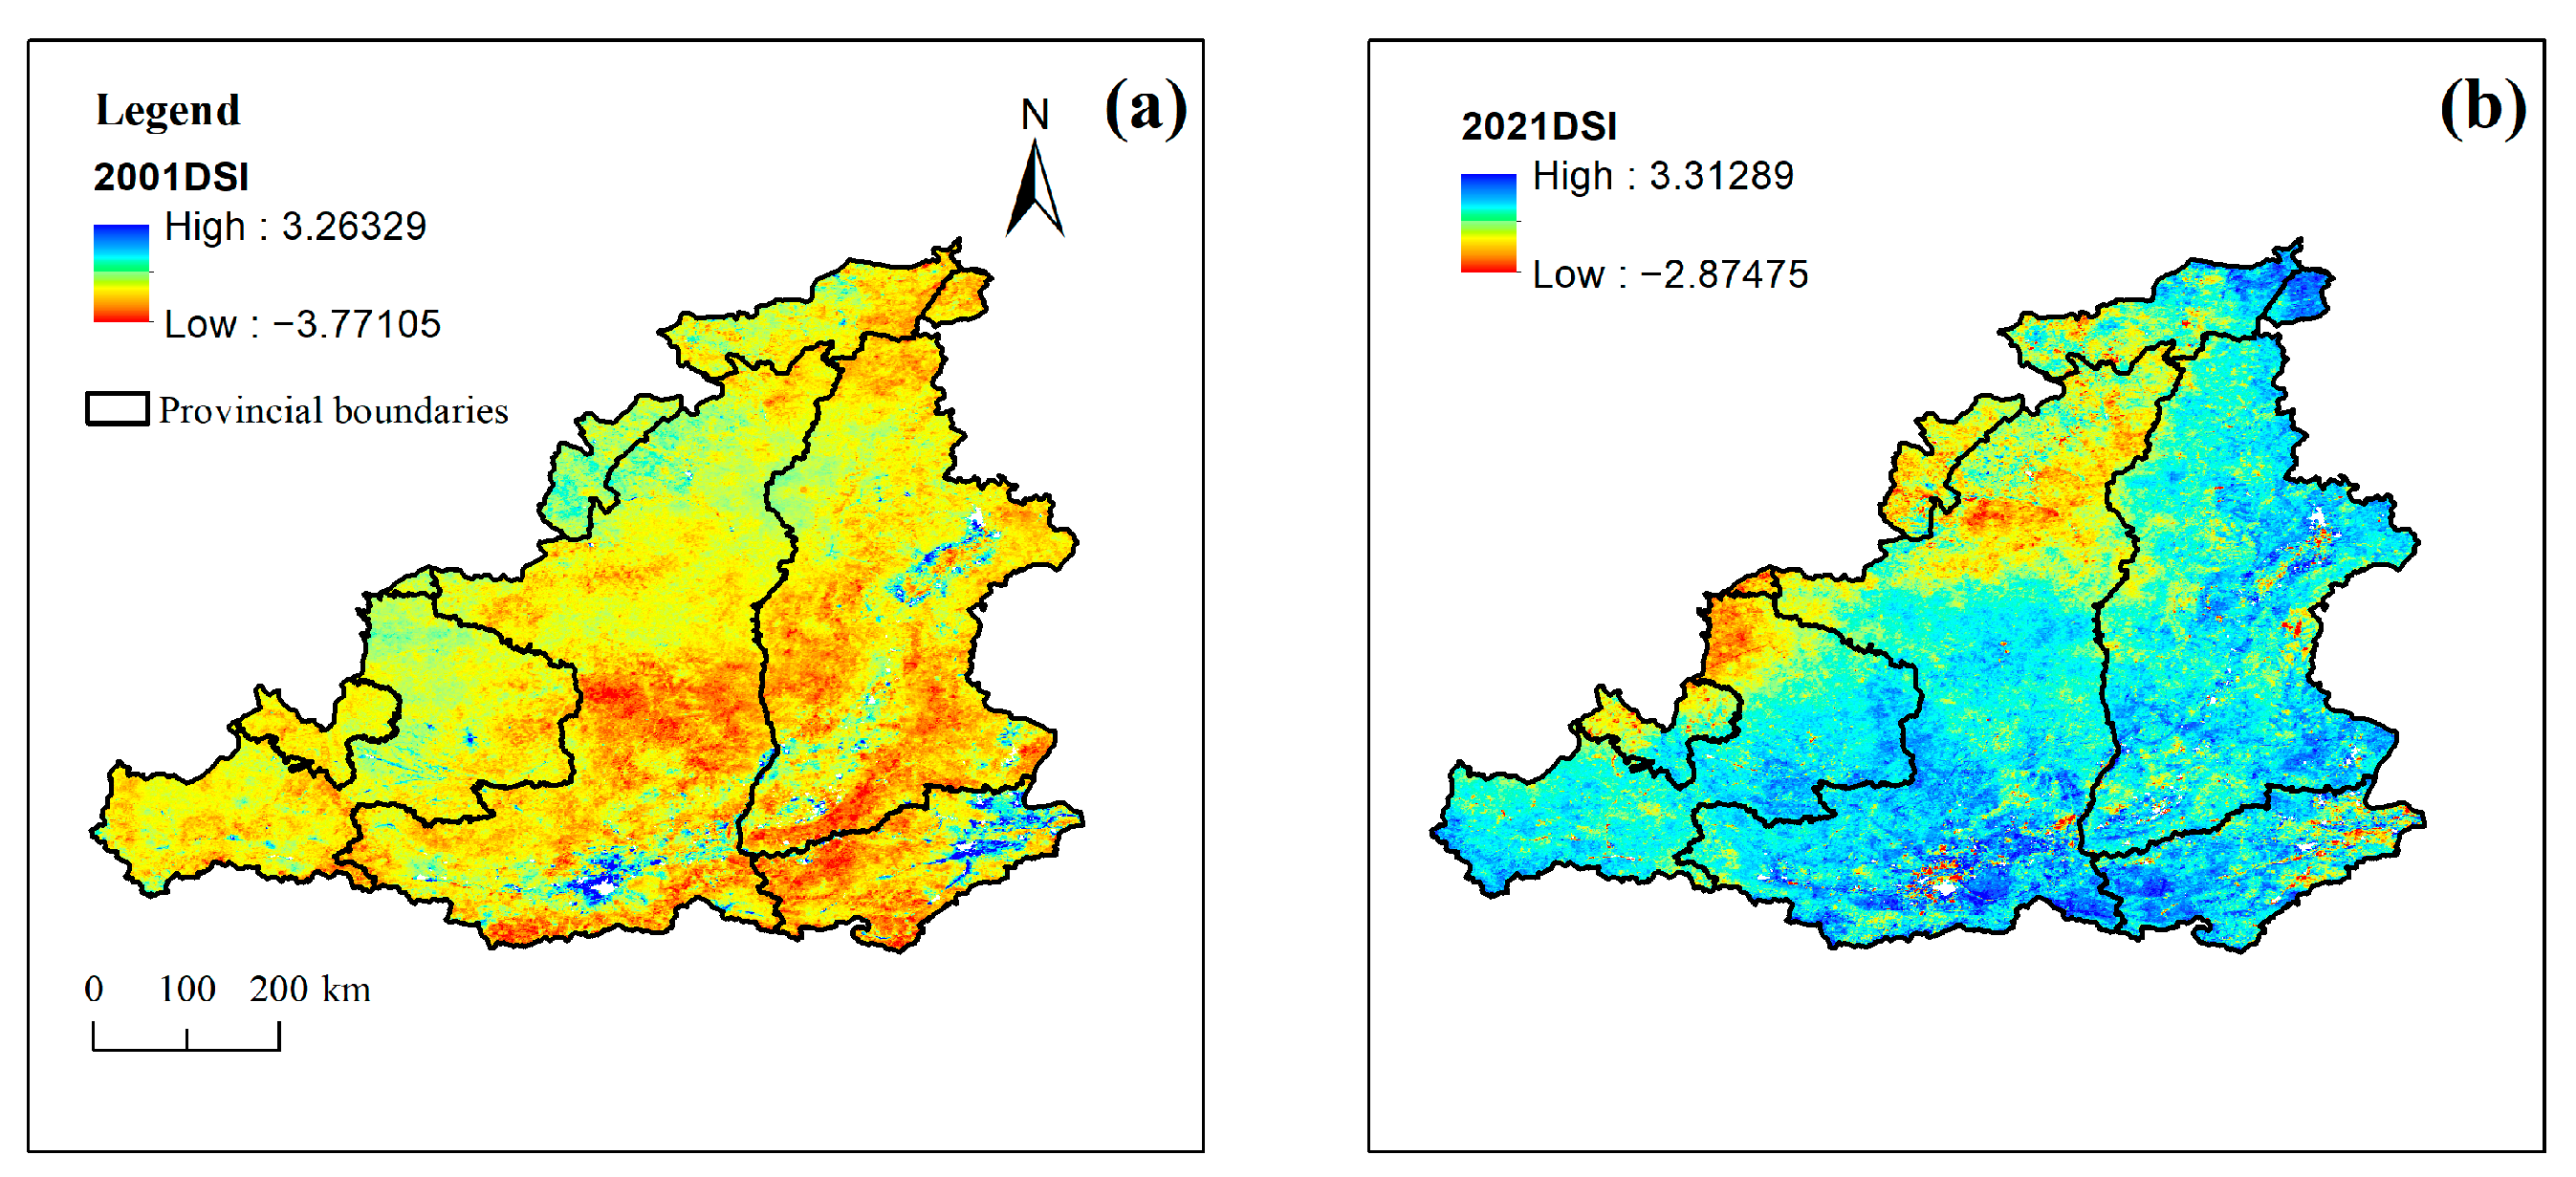
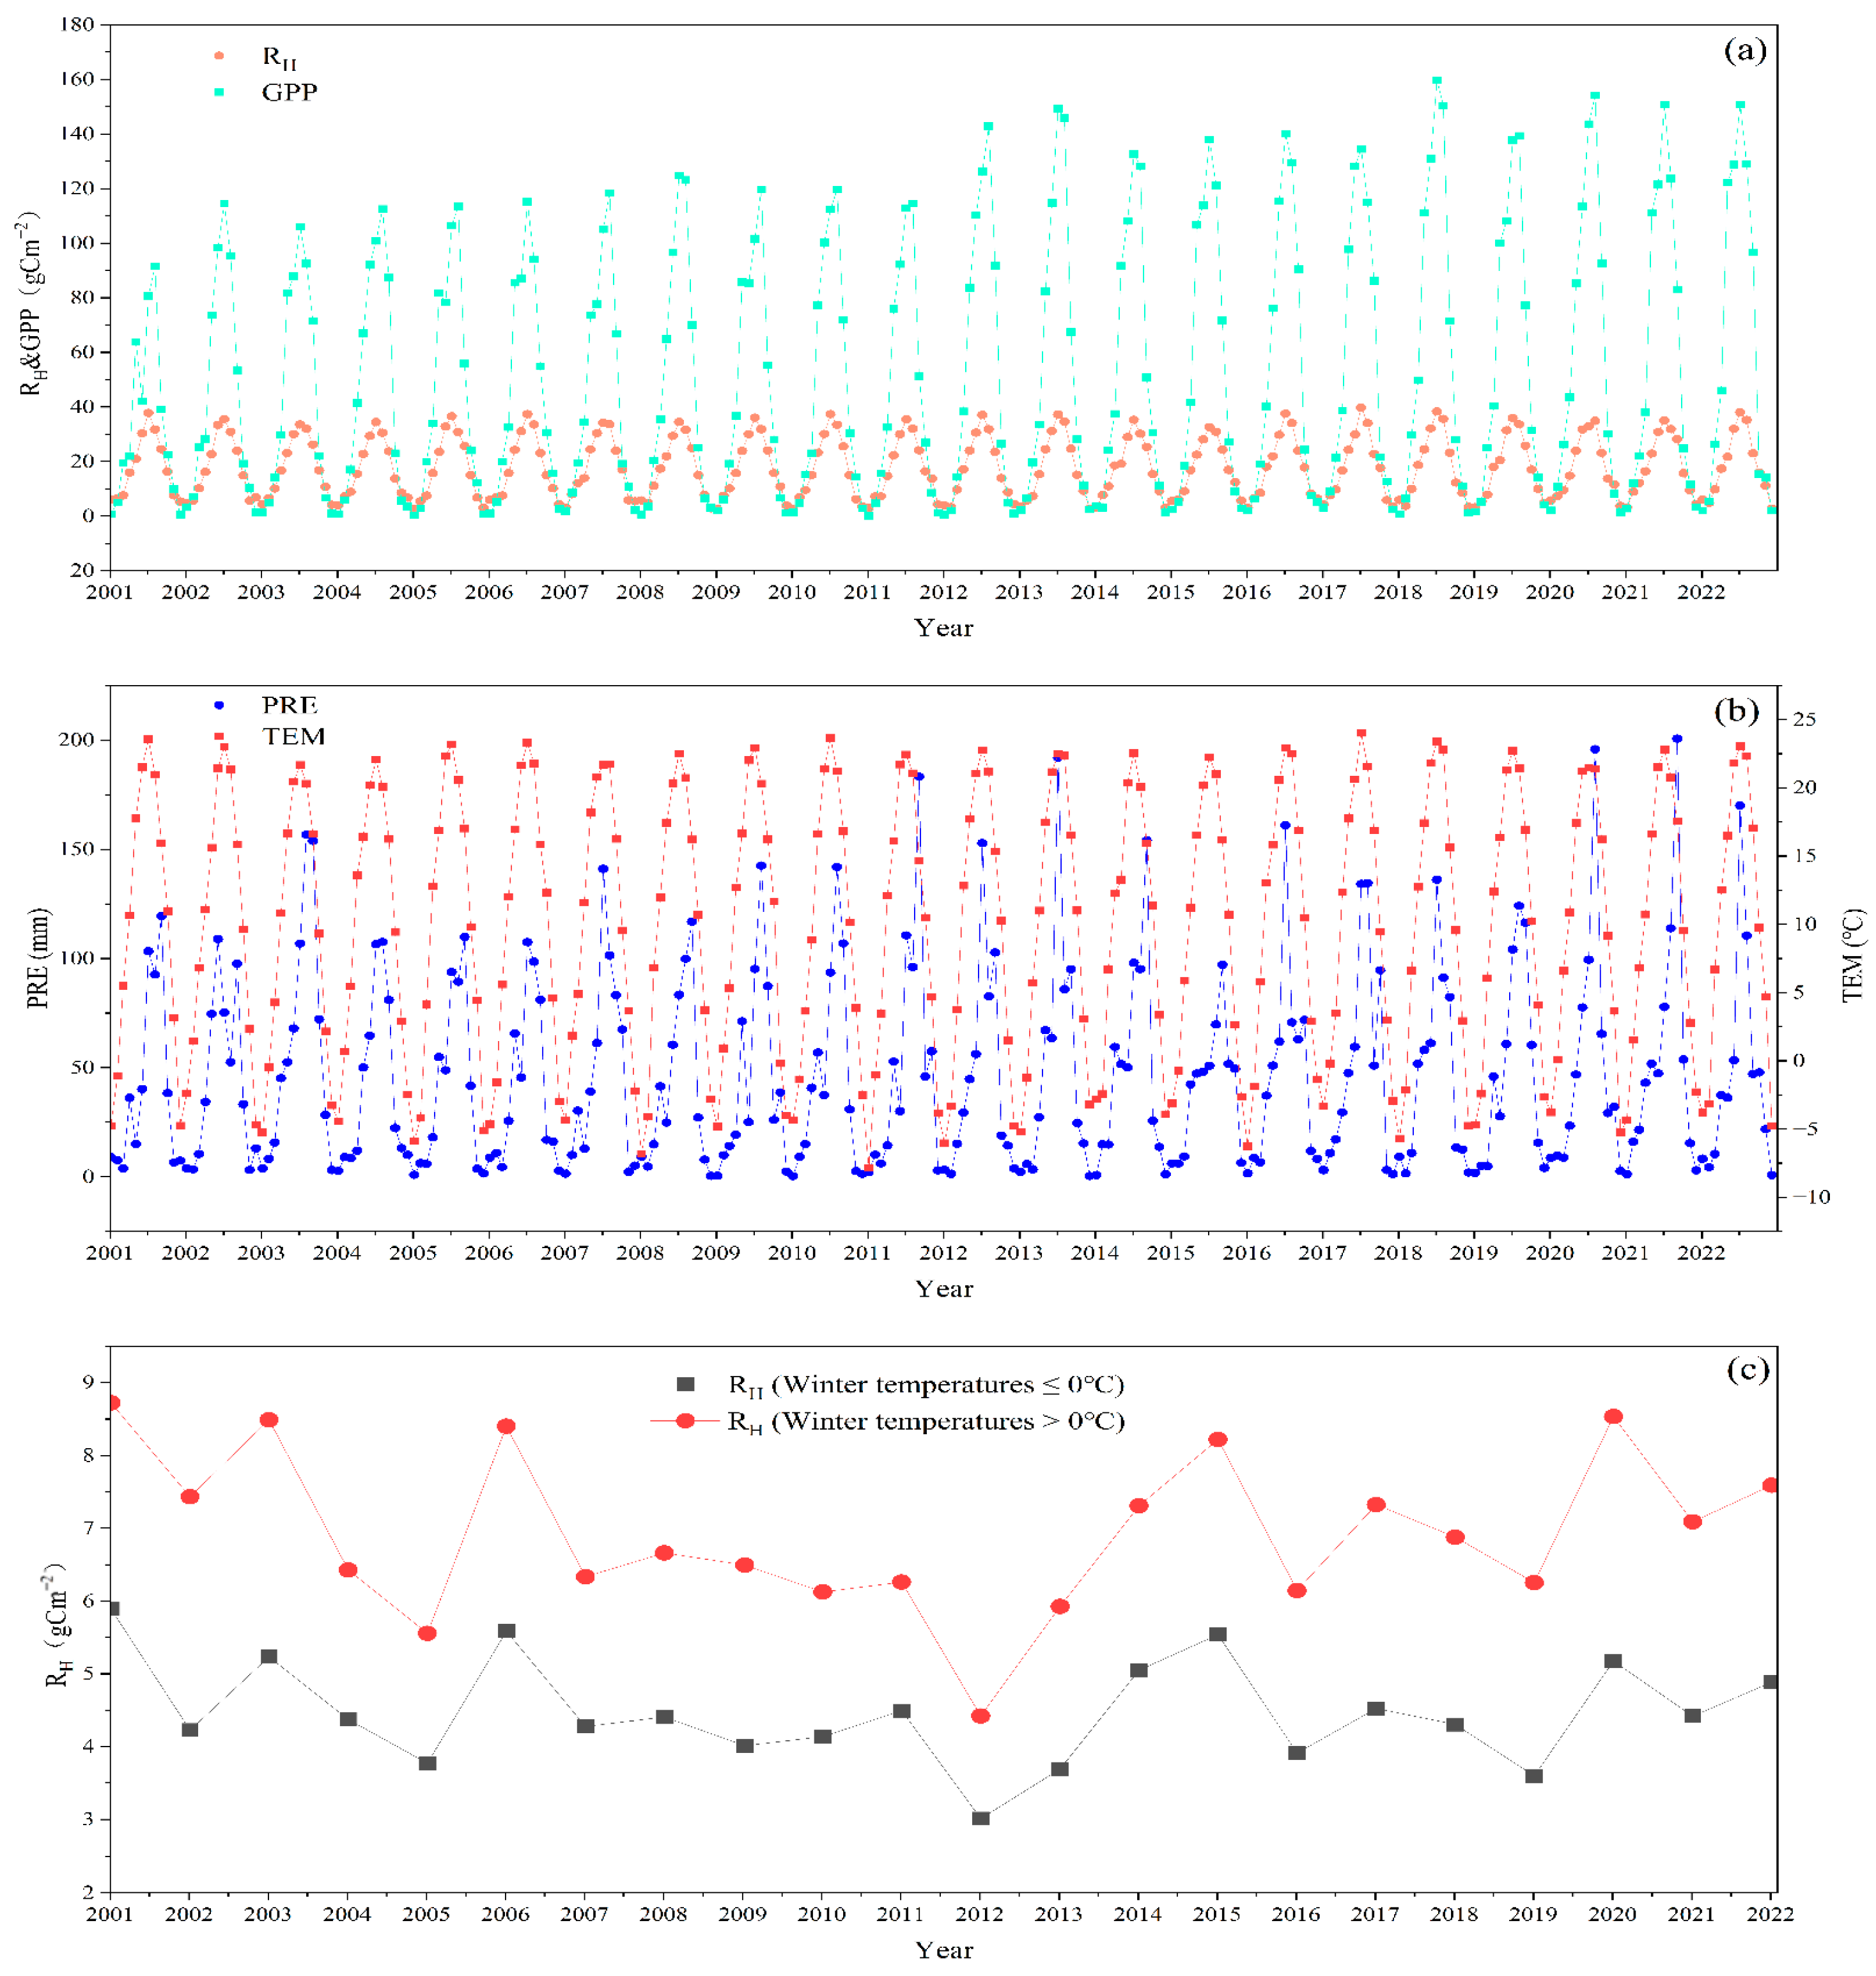
3.1. Climate Conditions from 2001 to 2022

The average multi-year PRE in the MRYR from 2001 to 2022 was 549.32 mm (Figure 3a), with 400 mm~800 mm being the main range in the study area (Figure 4a). The lowest precipitation was in 2005 (474.69 mm); the highest precipitation was in 2003 (714.35 mm). The PRE showed a fluctuating upward trend. Spatially, the PRE decreased from south to north (Figure 4a).
During the study period, the average annual TEM was 9.96 °C. The highest TEM occurred in 2006, and the lowest was in 2012, and were 10.41 °C and 9.36 °C, respectively. The multi-year temperatures showed a fluctuating upward trend (Figure 3a). The areas greater than 10 °C are mainly dominated by cropland, and the areas less than 5 °C are scattered within forested areas (Figure 4b).
On average, the multi-year ETa in the MRYR was 365.26 mm, and the PET was 1409.18 mm (Figure 3a). The highest values of ETa and PET occurred in 2018 and 2013, respectively. The lowest values of ETa and PET occurred in 2001 and 2003, respectively. The interannual variations in the ETa showed an upward trend, and the PET showed a fluctuating downward trend. The spatial distribution of the ETa was very closely related to the land cover type (Figure 4c). The areas with an ETa greater than 400 mm were dominated by forests and shrubs; the areas below 400 mm were dominated by croplands and grasslands.
The dryness and wetness of the study area were analyzed using the DSI (Figure 3b). The most severe drought occurred in 2001, reaching D5, followed by 2002, reaching D4. During the study period, the DSI trended upward, and by 2010, the DSI had shifted to WD. By 2013, it had shifted to a wet state. The year 2021 was significantly wetter than 2001, and the study area overall became wetter (Figure 5). Combined with the changes in the TEM and PRE, it is clear that the eastward warming and humidification of Northwest China has completely affected the MRYR [58].

3.2. Temporal and Spatial Dynamics of NEP/WUE/CUE

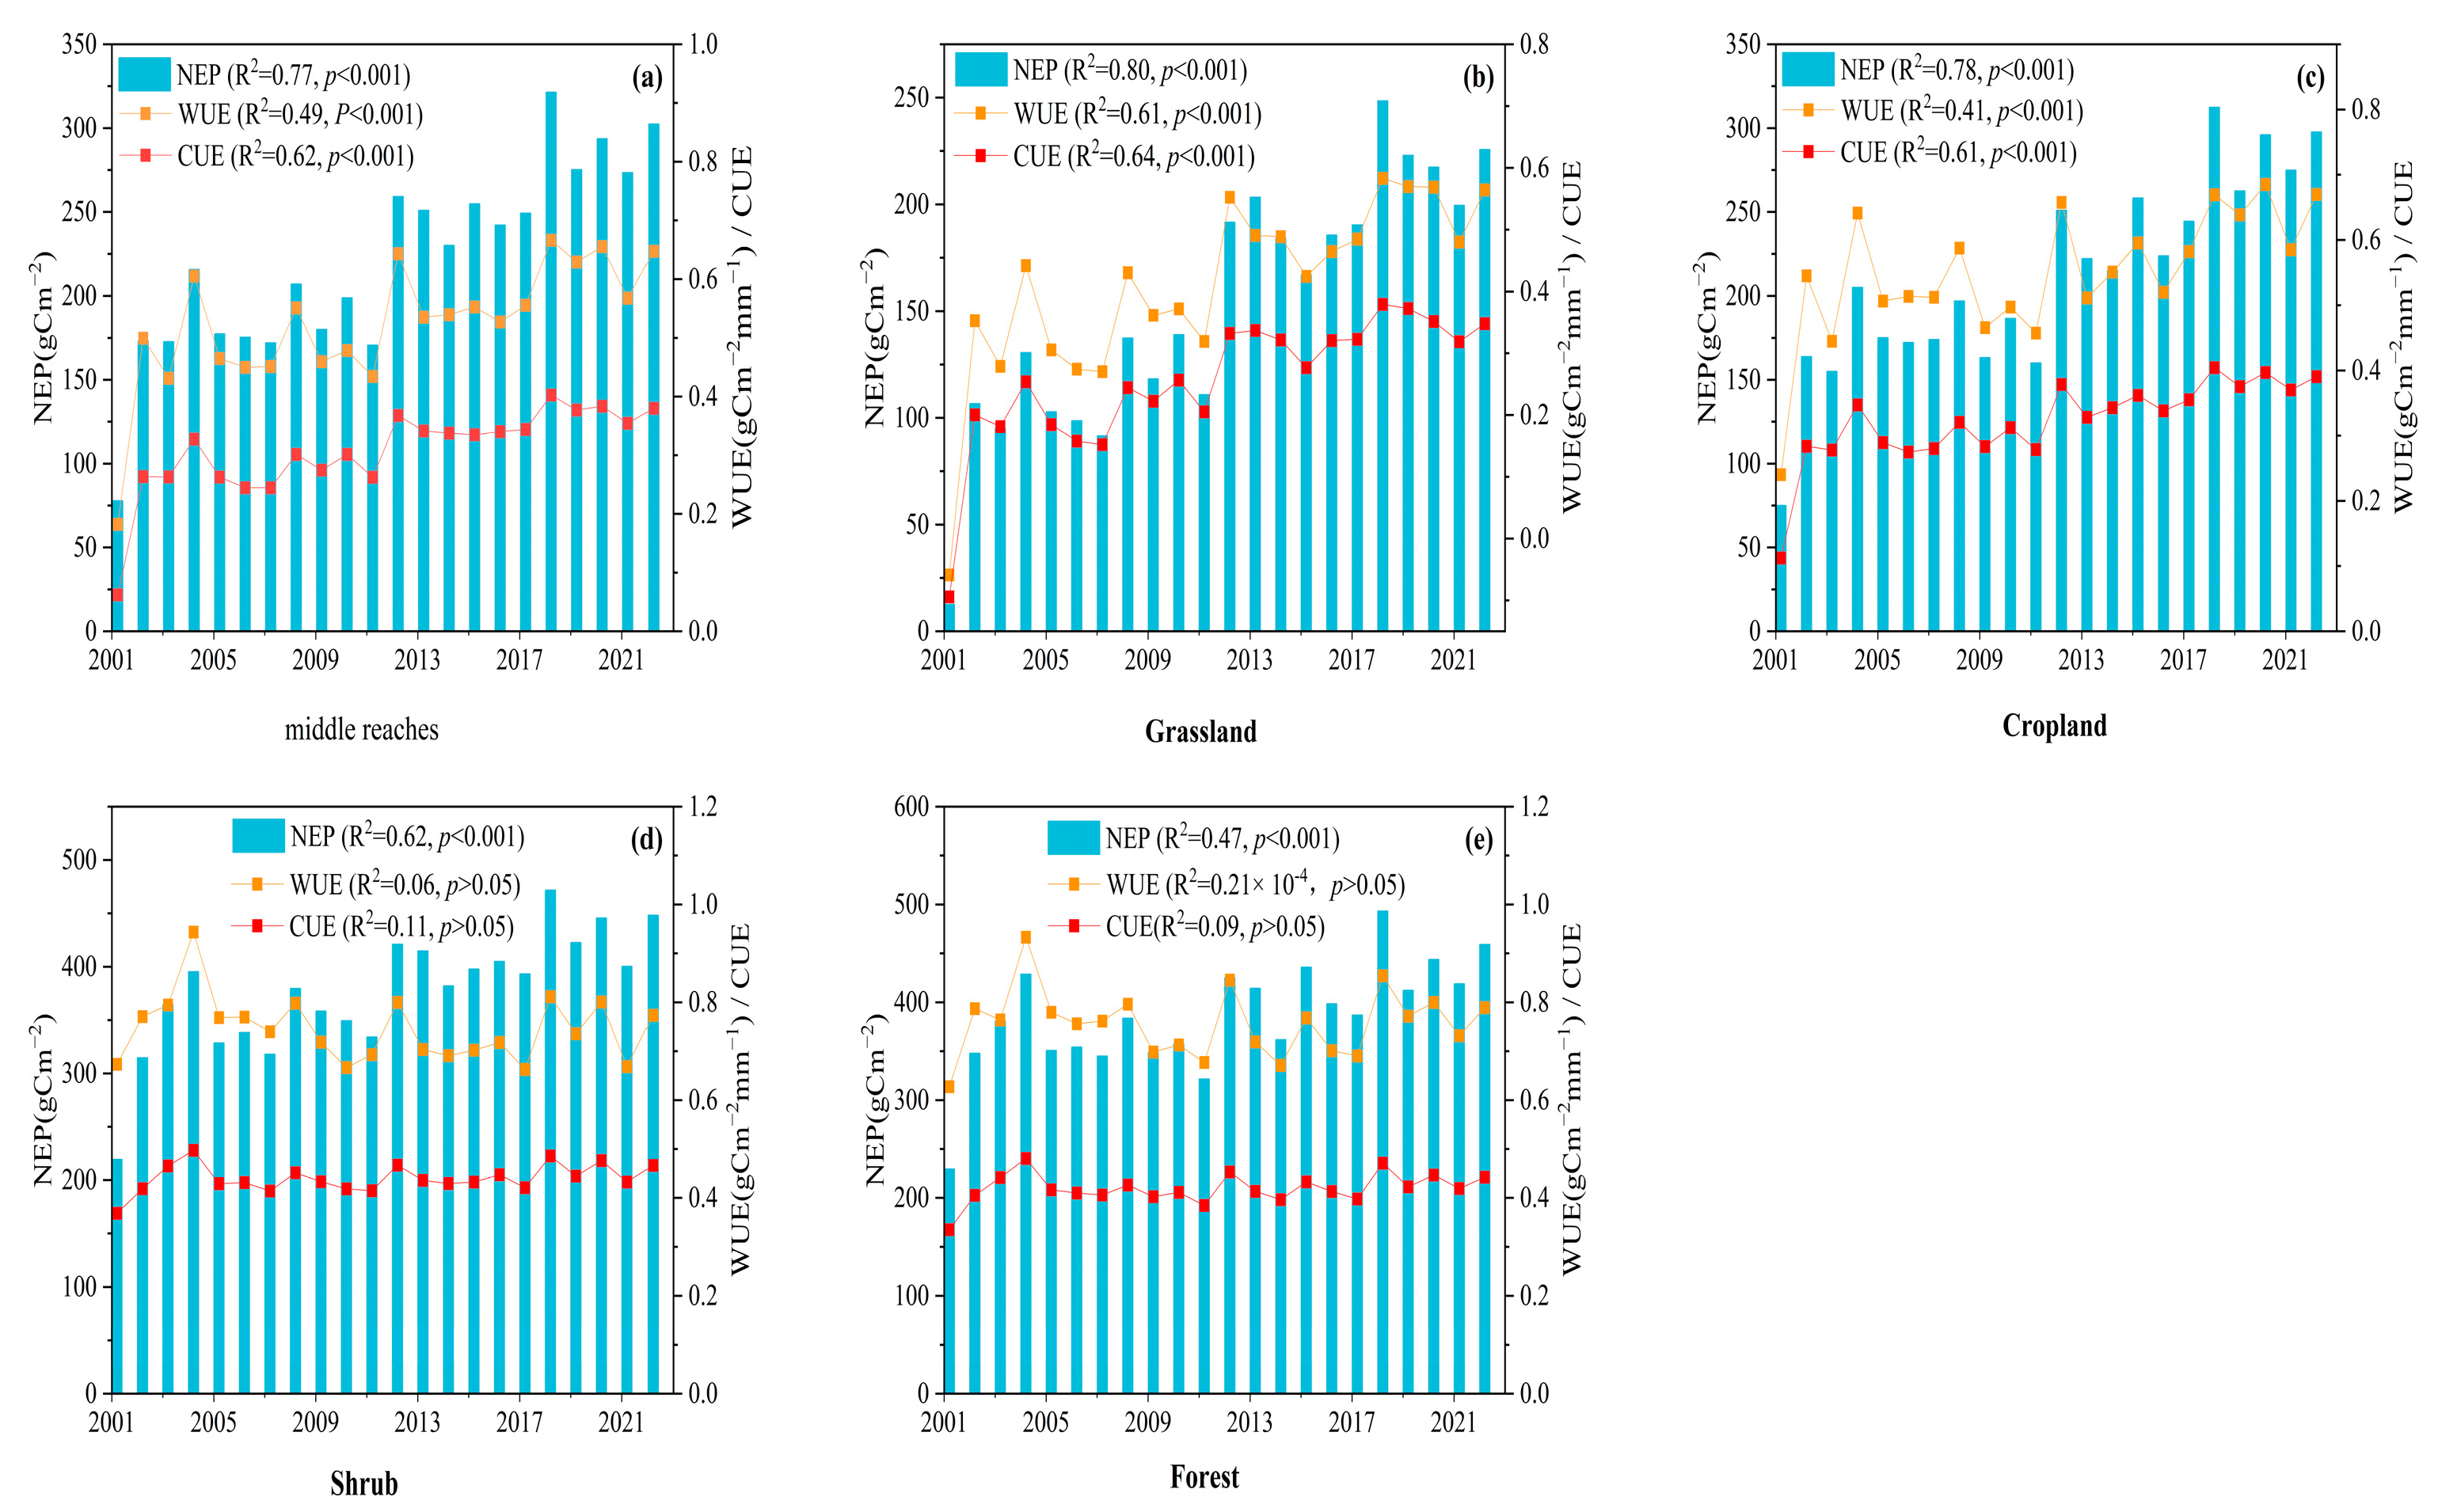
3.2.1. Temporal Variability in NEP/WUE/CUE

During the study period, the mean value of the NEP in the MRYR was 221.49 gC m−2, which varied between 77.64 gC m−2 in 2001 and 321.38 gC m−2 in 2018 (Figure 6). Overall, the MRYR showed a stable upward trend. Due to the structure, morphology, and function of the vegetation itself, the highest multi-year mean NEP was for the forests, followed by the shrubs, croplands, and grasslands (Figure 6). The NEP growth rates were the opposite, with the grassland ecosystems showing the largest increase of 8.05 gCm−2a−1, and the forest ecosystems showing the smallest change of 5.87 gC m−2 a−1.
The WUE and CUE fluctuated upward from 2001 to 2022 (p < 0.001) (Figure 6). The linear rate of increase in the WUE was 0.012 gC m−2 mm−1 a −1, and its mean value was 0.52 gC m−2 mm−1, which suggest that in the MRYR, about 0.52 gC is fixed when one millimeter of water evaporates. The linear rate of increase in the CUE was 0.009 a−1, with a mean value of 0.31 (Figure 6). Regarding the vegetation types, excluding shrubs, the trend for the WUE was greater than 0 for all vegetation types (the forests tended to be closer to 0); among them, the grassland ecosystems showed the greatest increasing trend. The significant increase in the NEP with a flatter ETa caused a significant increase in the WUE across the land cover types. The mean CUE values for shrubs, forests, croplands, and grasslands were 0.44, 0.42, 0.32, and 0.26, respectively. Similarly, the grasslands had the highest linear growth rate (0.013a−1), followed by croplands (0.007a−1); the CUE for the shrubs and forests increased, but none of them were significant (p > 0.05). The trends of the NEP, WUE, and CUE show that the environmental quality of the MRYR has recovered significantly.

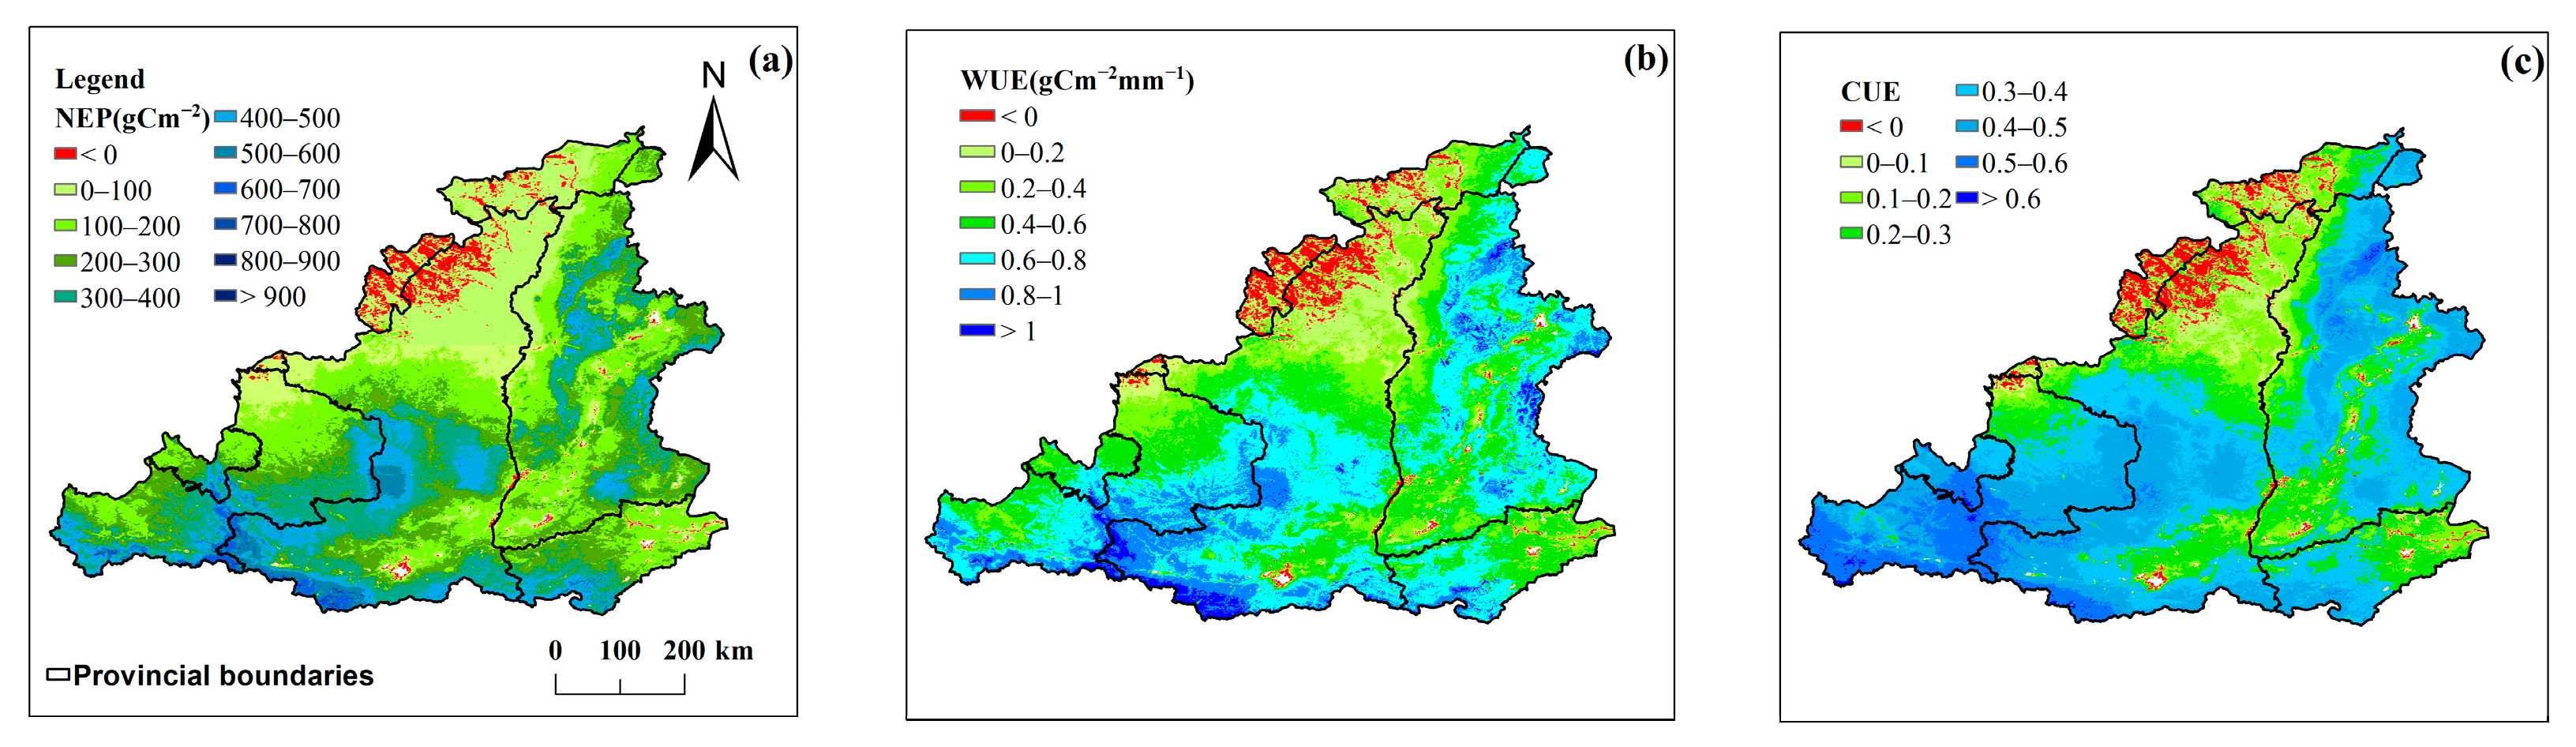
3.2.2. NEP/WUE/CUE Spatial Patterns

The total annual NEP during the study period was about 0.076 PgC (1 Pg = 1015 g), with an overall pattern of being high in the southeast and low in the northwest (Figure 7a). The vast majority of the area is a carbon sink, accounting for 96.51% of the MRYR. The distribution of 100–200 gCm−2 is the largest, accounting for about 24.32%, followed by 200–300 gCm−2, accounting for about 22.37%. The carbon sources are distributed in and around the Maowusu Sand. This may be related to the arid climate in these areas. Moreover, the vicinity of rivers and lakes are also carbon sources. The variations in the trends of the vegetation’s NEP, WUE, and CUE in the MRYR are shown in Figure 8. The vegetation’s NEP in the MRYR ranges from −16.09 to 20.62 gCm−2a−1, with an overall significantly increasing trend (Figure 8a,d), and a decreasing trend is only observed for the croplands sporadically distributed near rivers and lakes (Figure 8a). The increase in the NEP is not significant in some of the areas in the eastern and southern parts of the MRYR (Figure 8d), even though these areas are covered with more vegetation throughout the year.
Within the study area, 29.32% of the area had a WUE lower than 0.4 gCm−2mm−1, 56.63% of the area had a WUE in the range of 0.4–0.8 gCm−2mm−1, and 14.05% of the area had a WUE greater than 0.8 gCm−2mm−1 (Figure 7b). The high WUE values were distributed along the border of Gansu and Shaanxi and the southern part of the MRYR, and the low values were mainly found in the arid northwestern part of the MRYR. The uneven variations in environmental factors and the spatial heterogeneity of the vegetation types led to the large differences in the WUE trends across the region. The trend of WUE change in the MRYR was between −0.41 and 0.43 gC m−2 mm−1a−1 (Figure 8b), with an increasing trend for about 78.75% of the area. Of these, the areas with significant and highly significant increases accounted for 7.18% and 44.73% of the total (Figure 8e), mainly the grasslands in the arid northwestern region and some of croplands within Shanxi.
The areas with a CUE greater than 0.5 accounted for only 8.71% of the MRYR and were distributed in the eastern part of Gansu; the areas with 0.3–0.5 accounted for 50.60%; and the areas with less than 0.3 accounted for 40.70%, and were mainly distributed among the croplands in the east–central part of the MRYR and the grasslands in the northern part of the study area (Figure 7c). Nearly 90% of the areas showed a CUE with an increasing trend (Figure 8c), which was significant in the grasslands and for most of the croplands (Figure 8f).

3.3. Interannual Anomalies in NEP, WUE, CUE, and Climate Variables

The standardized anomalies index (SAI) for the NEP, WUE, CUE, and climatic variables were calculated for the MRYR from 2001 to 2022 (Figure 9). Throughout the study period, each index showed a high interannual variability. The year 2001 showed very strong negative anomalies for the NEP, WUE, and CUE, perhaps related to the drought of that year. The year 2012 was a clear boundary for the NEP, WUE, and CUE, with the anomalies changing from negative to positive. Meanwhile, the year 2004 was an exception, with largely positive anomalies for the NEP, WUE, and CUE.
The positive and negative anomaly changes in the DSI are very similar to those of the NEP (Figure 9), suggesting that drought has a very direct effect on the NEP, and to a high degree. In inland areas, PRE and TEM are likely to be the most influential climate factors. Due to the nature of water, precipitation accumulation has a strong influence on carbon sinks, such as the positive anomaly exhibited by the carbon sink in 2004. In grasslands, the NEP, WUE, and CUE are directly affected by precipitation changes, as shown by the synoptic response of the NEP, WUE, and CUE to precipitation (Figure 9). Croplands, shrubs, and forests do not have an immediate response to precipitation. For croplands, this may be related to human intervention; Zhang et al. [59] analyzed many environmental factors (e.g., soil physicochemical properties, biology, and temperature) as reasons for the existence of a time-lag effect of carbon sinks on precipitation.

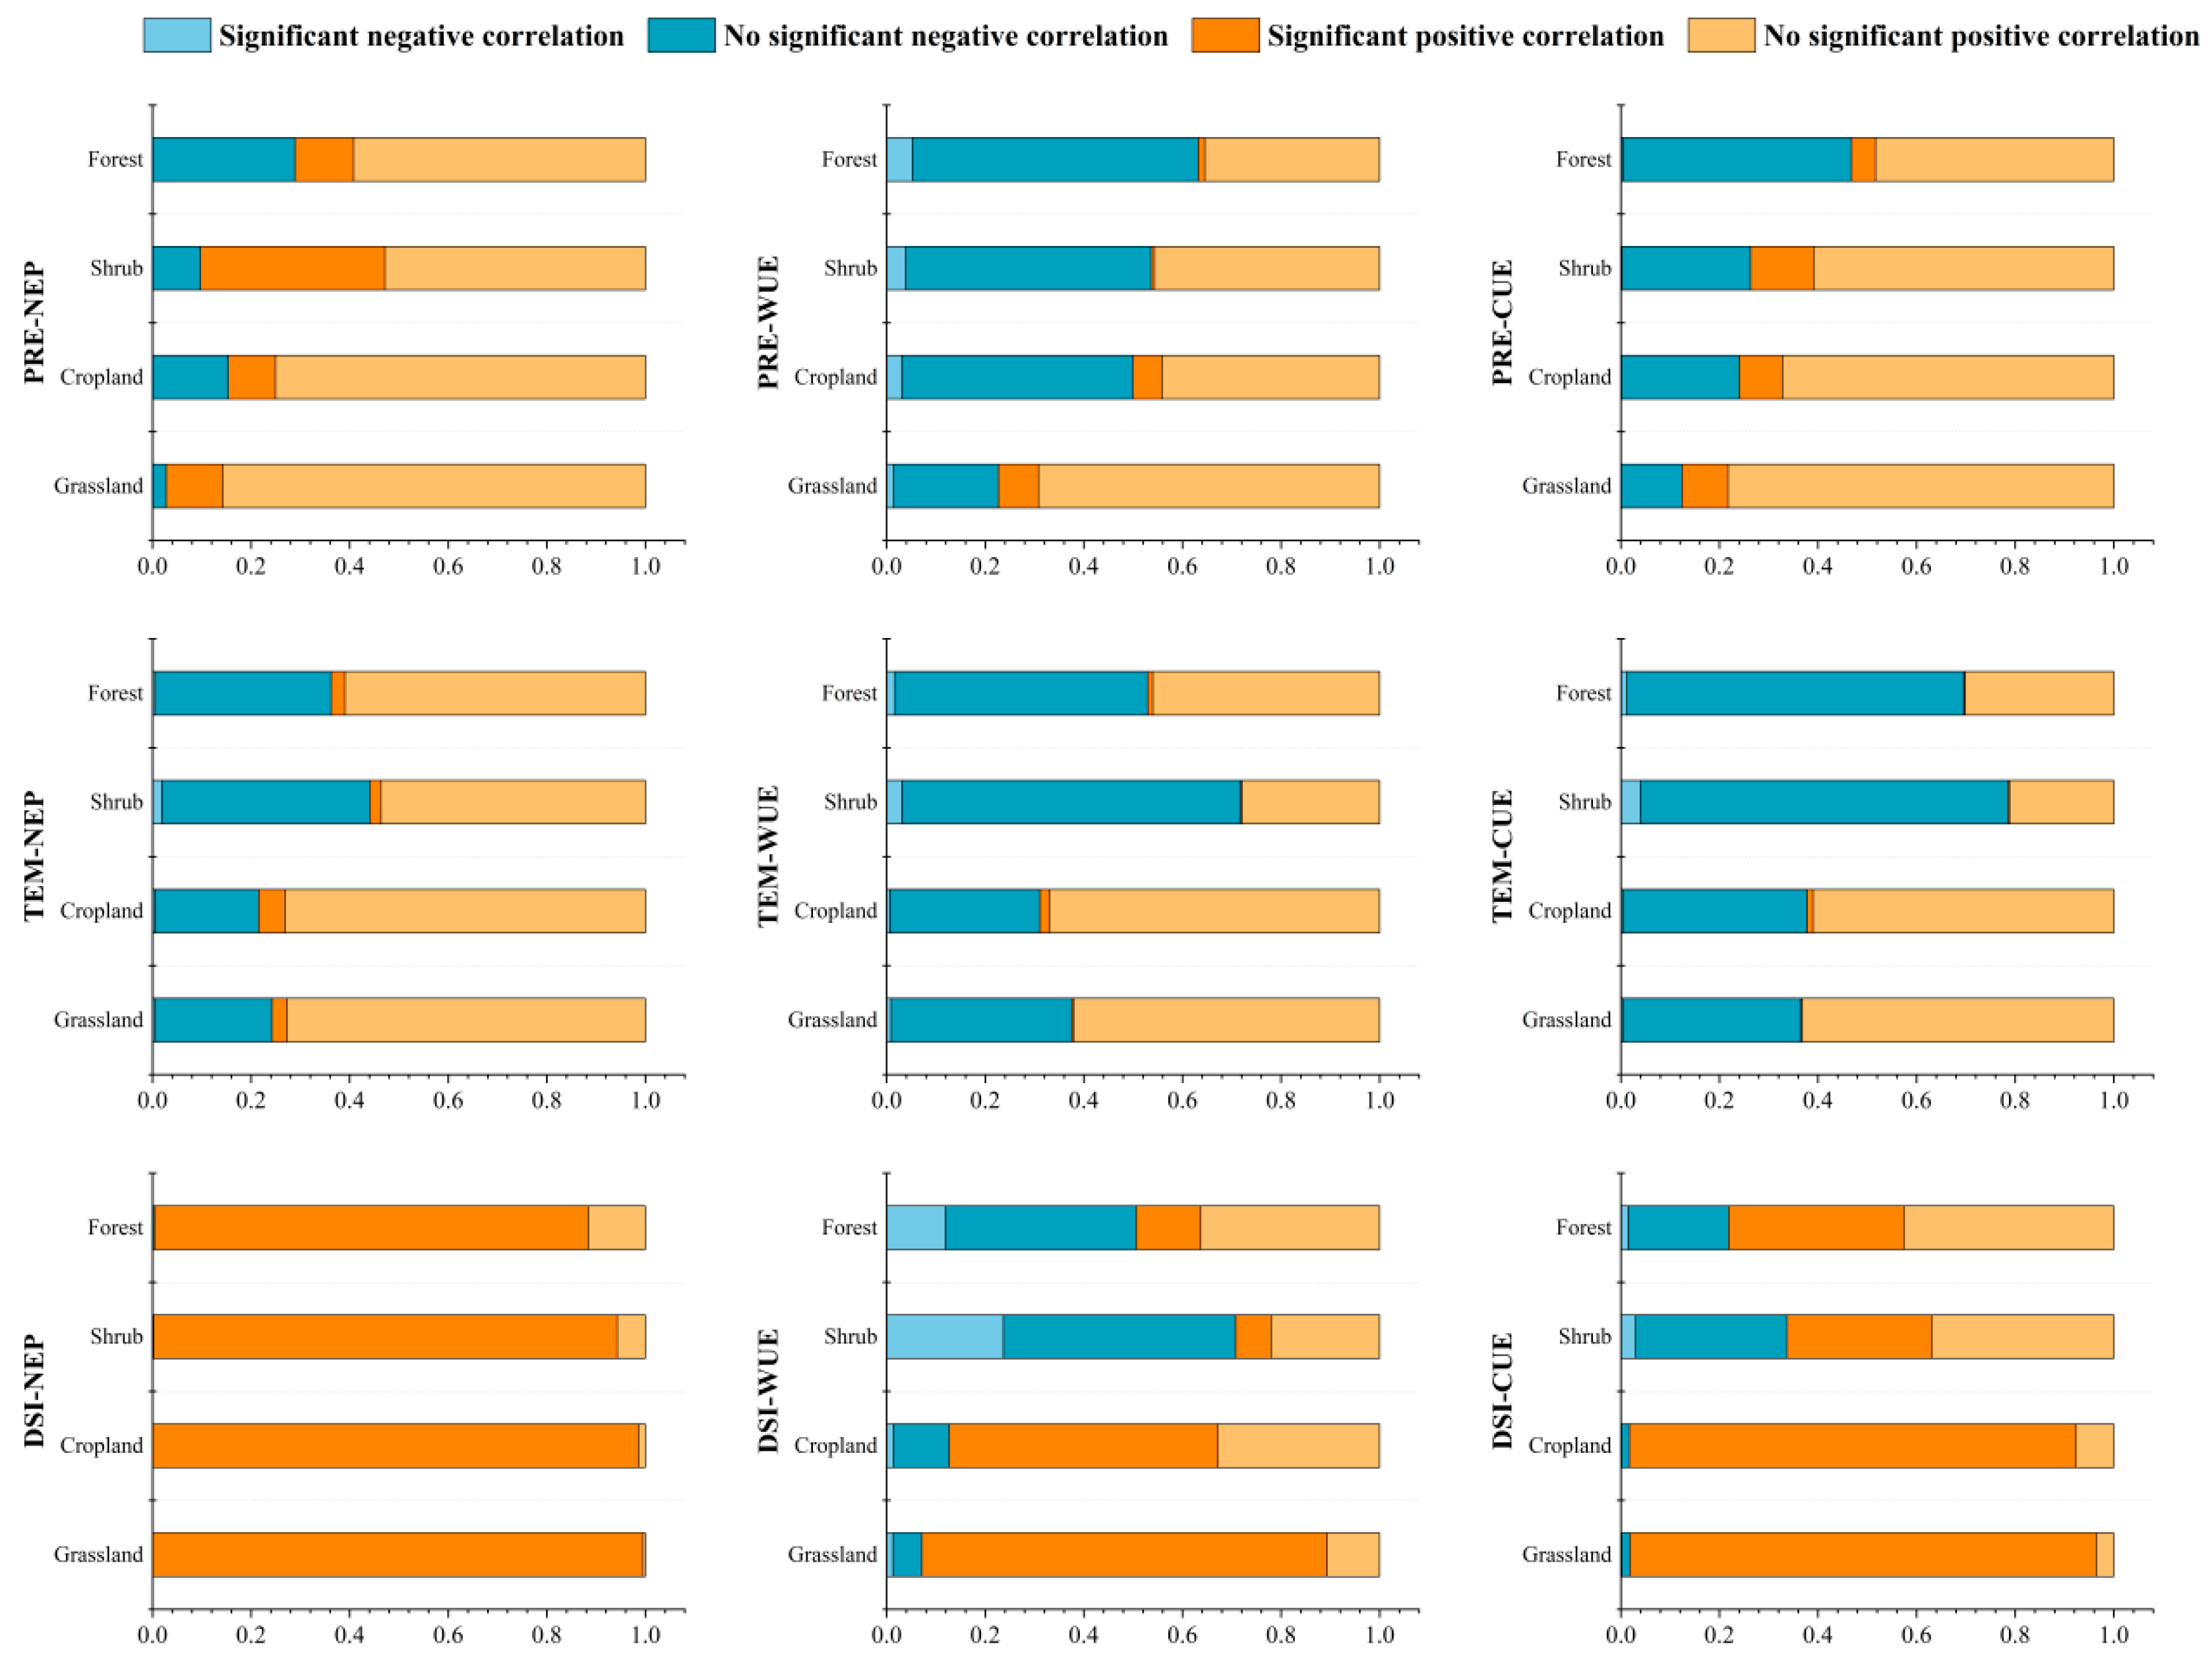
3.4. Correlation of NEP, WUE, and CUE with Climate Variables

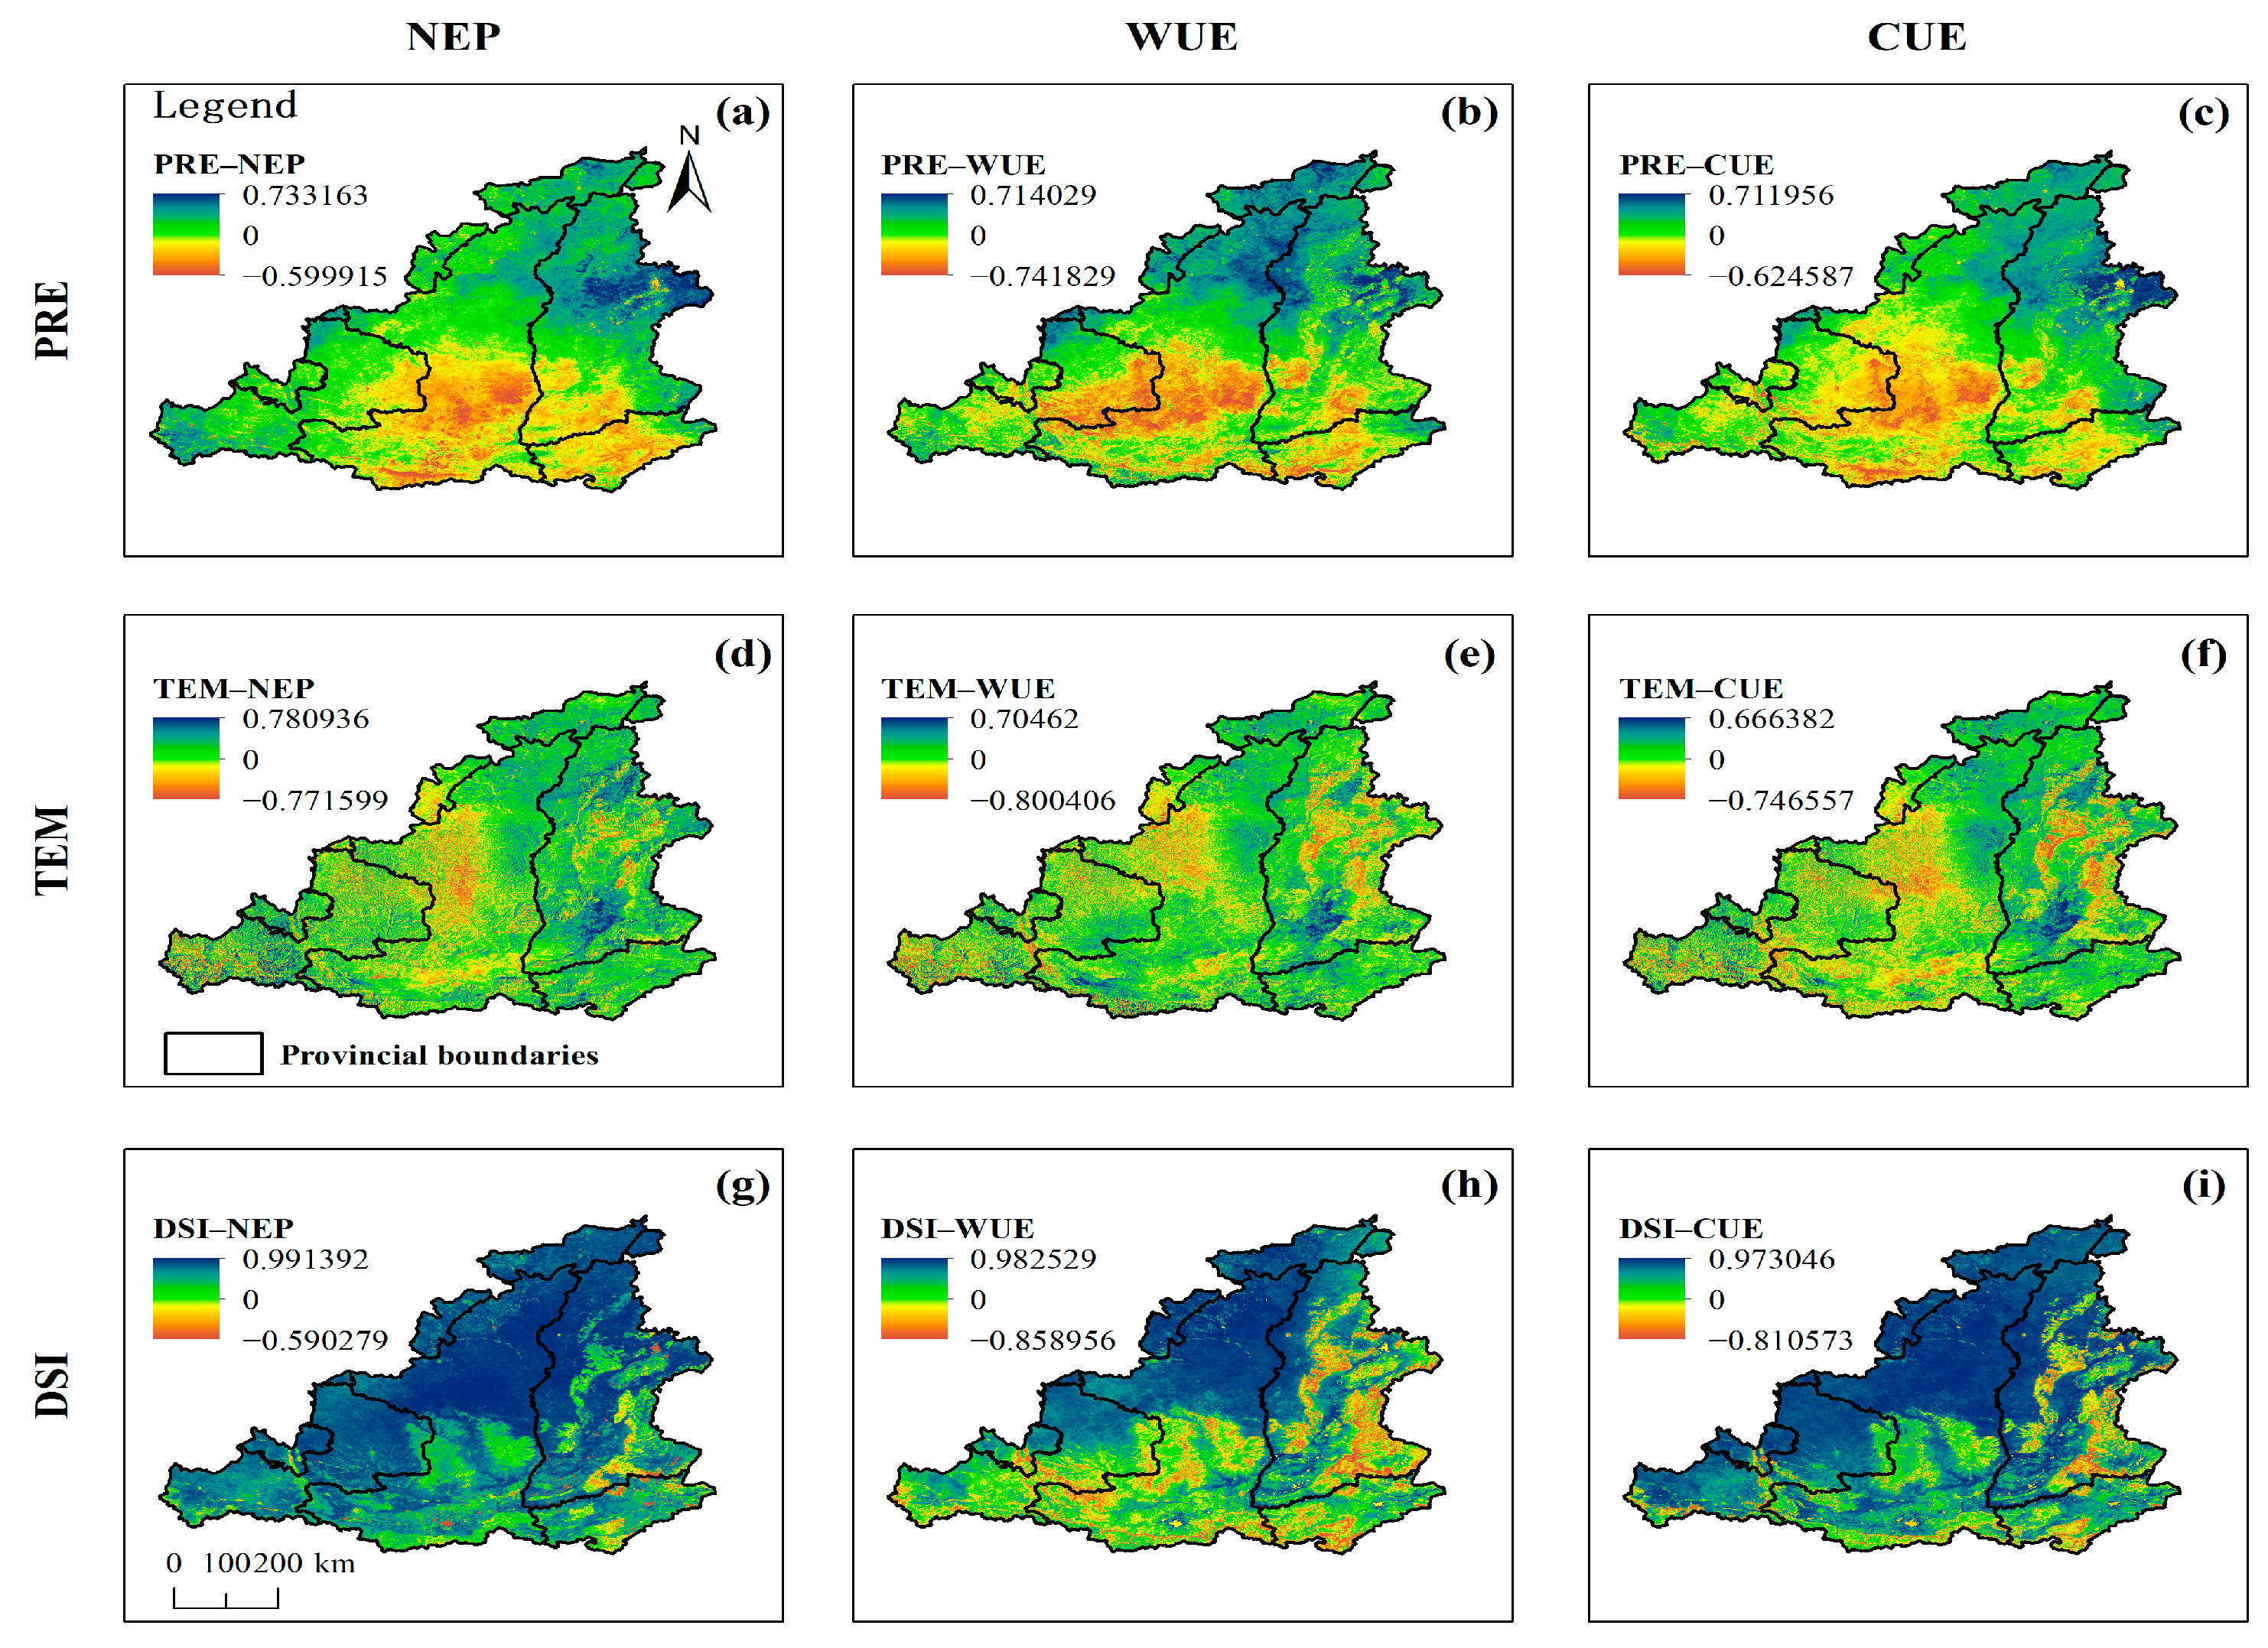
3.4.1. Correlation with Precipitation

There were significant regional differences in the correlations among the factors (Figure 10). The correlation coefficients of precipitation (PRE) and NEP ranged from −0.60 to 0.73, with a mean value of 0.21. In the northeastern part of the MRYR, the central part of Gansu, and the northwestern boundary of the MRYR, the NEP was significantly and positively correlated with precipitation (p < 0.05), accounting for 13.75% of the MRYR. The NEP was negatively correlated with PRE in the central and southern parts of the MRYR. The correlation between the NEP and PRE was higher for the shrubs and grasslands, 0.29 and 0.27, respectively, and lower for the croplands and forests, 0.18 and 0.13, respectively. Among them, PRE was significantly and positively correlated with the NEP in 11.45% of the grasslands, 9.58% of the croplands, 37.44% of the shrubs, and 11.89% of the forests (p < 0.05) (Figure 11). The forest NEP and PRE were predominantly positively correlated in northwestern Shanxi, while the forests in central and southern Shaanxi were predominantly negatively correlated.
In the northern region, where grassland dominates, the vegetation is more able to regulate precipitation, and the WUE has a higher correlation with precipitation. A large area of negative correlation between the WUE and PRE is distributed in the south–central regions. There is a clear latitudinal zonality between water use efficiency and PRE in the MRYR. From south to north, it ranges from a negative correlation in the semi-humid zone to a positive correlation in the semi-arid zone. For the different vegetation types, positive correlations are dominant in the grasslands and croplands, while negative correlations are observed in the shrubs and forests. Among these, the grassland and cropland areas with a significant positive correlation (p < 0.05) account for 8.09% and 5.84% of their respective areas, while the shrub and forest areas with a significant negative correlation (p < 0.05) account for 3.85% and 5.19% of their respective areas (Figure 11).
The areas where the CUE and precipitation are negatively correlated are more widely distributed, involving more of the western region (Figure 10c). The PRE and CUE are predominantly positively correlated across the four vegetation types, with 9.40% of the grasslands, 8.78% of the croplands, 12.78% of the shrubs, and 4.92% of the forests significantly positively correlated with the CUE. Overall, the vegetation’s NEP, WUE, and CUE in the MRYR show higher values in regions with more precipitation.

3.4.2. Correlation with Temperature

As shown in Figure 10, the correlations of the NEP, WUE, and CUE with temperature in the MRYR show obvious regional differences. The correlation coefficients of the NEP and TEM range from −0.67 to 0.78, with a mean value of 0.12. The positive correlation area between the NEP and TEM accounts for 74.75% of the study area, which is widely distributed in the MRYR. The south–central part of the MRYR has a wide distribution of negative correlations. The correlation coefficients of WUE, CUE, and TEM range from −0.80 to 0.70 and from −0.75 to 0.67, with mean values of 0.04 and 0.01, respectively. In the distribution of their correlation with temperature, both are similar to the NEP. However, the distribution of negative correlations between WUE and CUE is larger. The correlation between the NEP and temperature is predominantly positive for the four vegetation types. In contrast, WUE and CUE are predominantly positively correlated in the grasslands and croplands, and negatively correlated in the shrubs and forests.

3.4.3. Correlation with DSI

The temperature and precipitation reflect the hydrothermal conditions under which local vegetation grows. The factors affecting the NEP, WUE, and CUE are intricate. Moisture limitation has an important impact on the water–carbon cycle in inland areas. Thus, there is a need to explore the relationship of these factors with the moisture limitation index. The drought severity index (DSI) was selected for the correlation analysis (Figure 10g–i). The correlation of the NEP, WUE, and CUE with the DSI all showed a high value, with mean values of 0.82, 0.43, and 0.64, respectively; the regions with a positive correlation accounted for 99.89%, 81.79%, and 94.01% of the MRYR, respectively. The regions in which each index reached the level of significance (p < 0.05) were also very high, accounting for 97.08%, 71.89%, and 86.66% of the respective positively correlated regions.
Given the above, the environment in the MRYR became wetter during the study years, and more biomass was accumulated by the consumption of more water. It is noteworthy that there is a large negative correlation in the southeastern part of the MRYR. This may be because the forest cover reached saturation and the increase in precipitation could no longer improve the vegetation cover [54]. On the contrary, in the north, under ecological engineering and warm humidification trends, the grass cover increased significantly, and biomass accumulated substantially. In terms of the different vegetation types, the areas with a significant positive correlation between the DSI and NEP accounted for more than 80% of the respective vegetation types; the proportion of areas with a negative correlation between the WUE and CUE and DSI was even higher in the forests and shrubs (Figure 11).

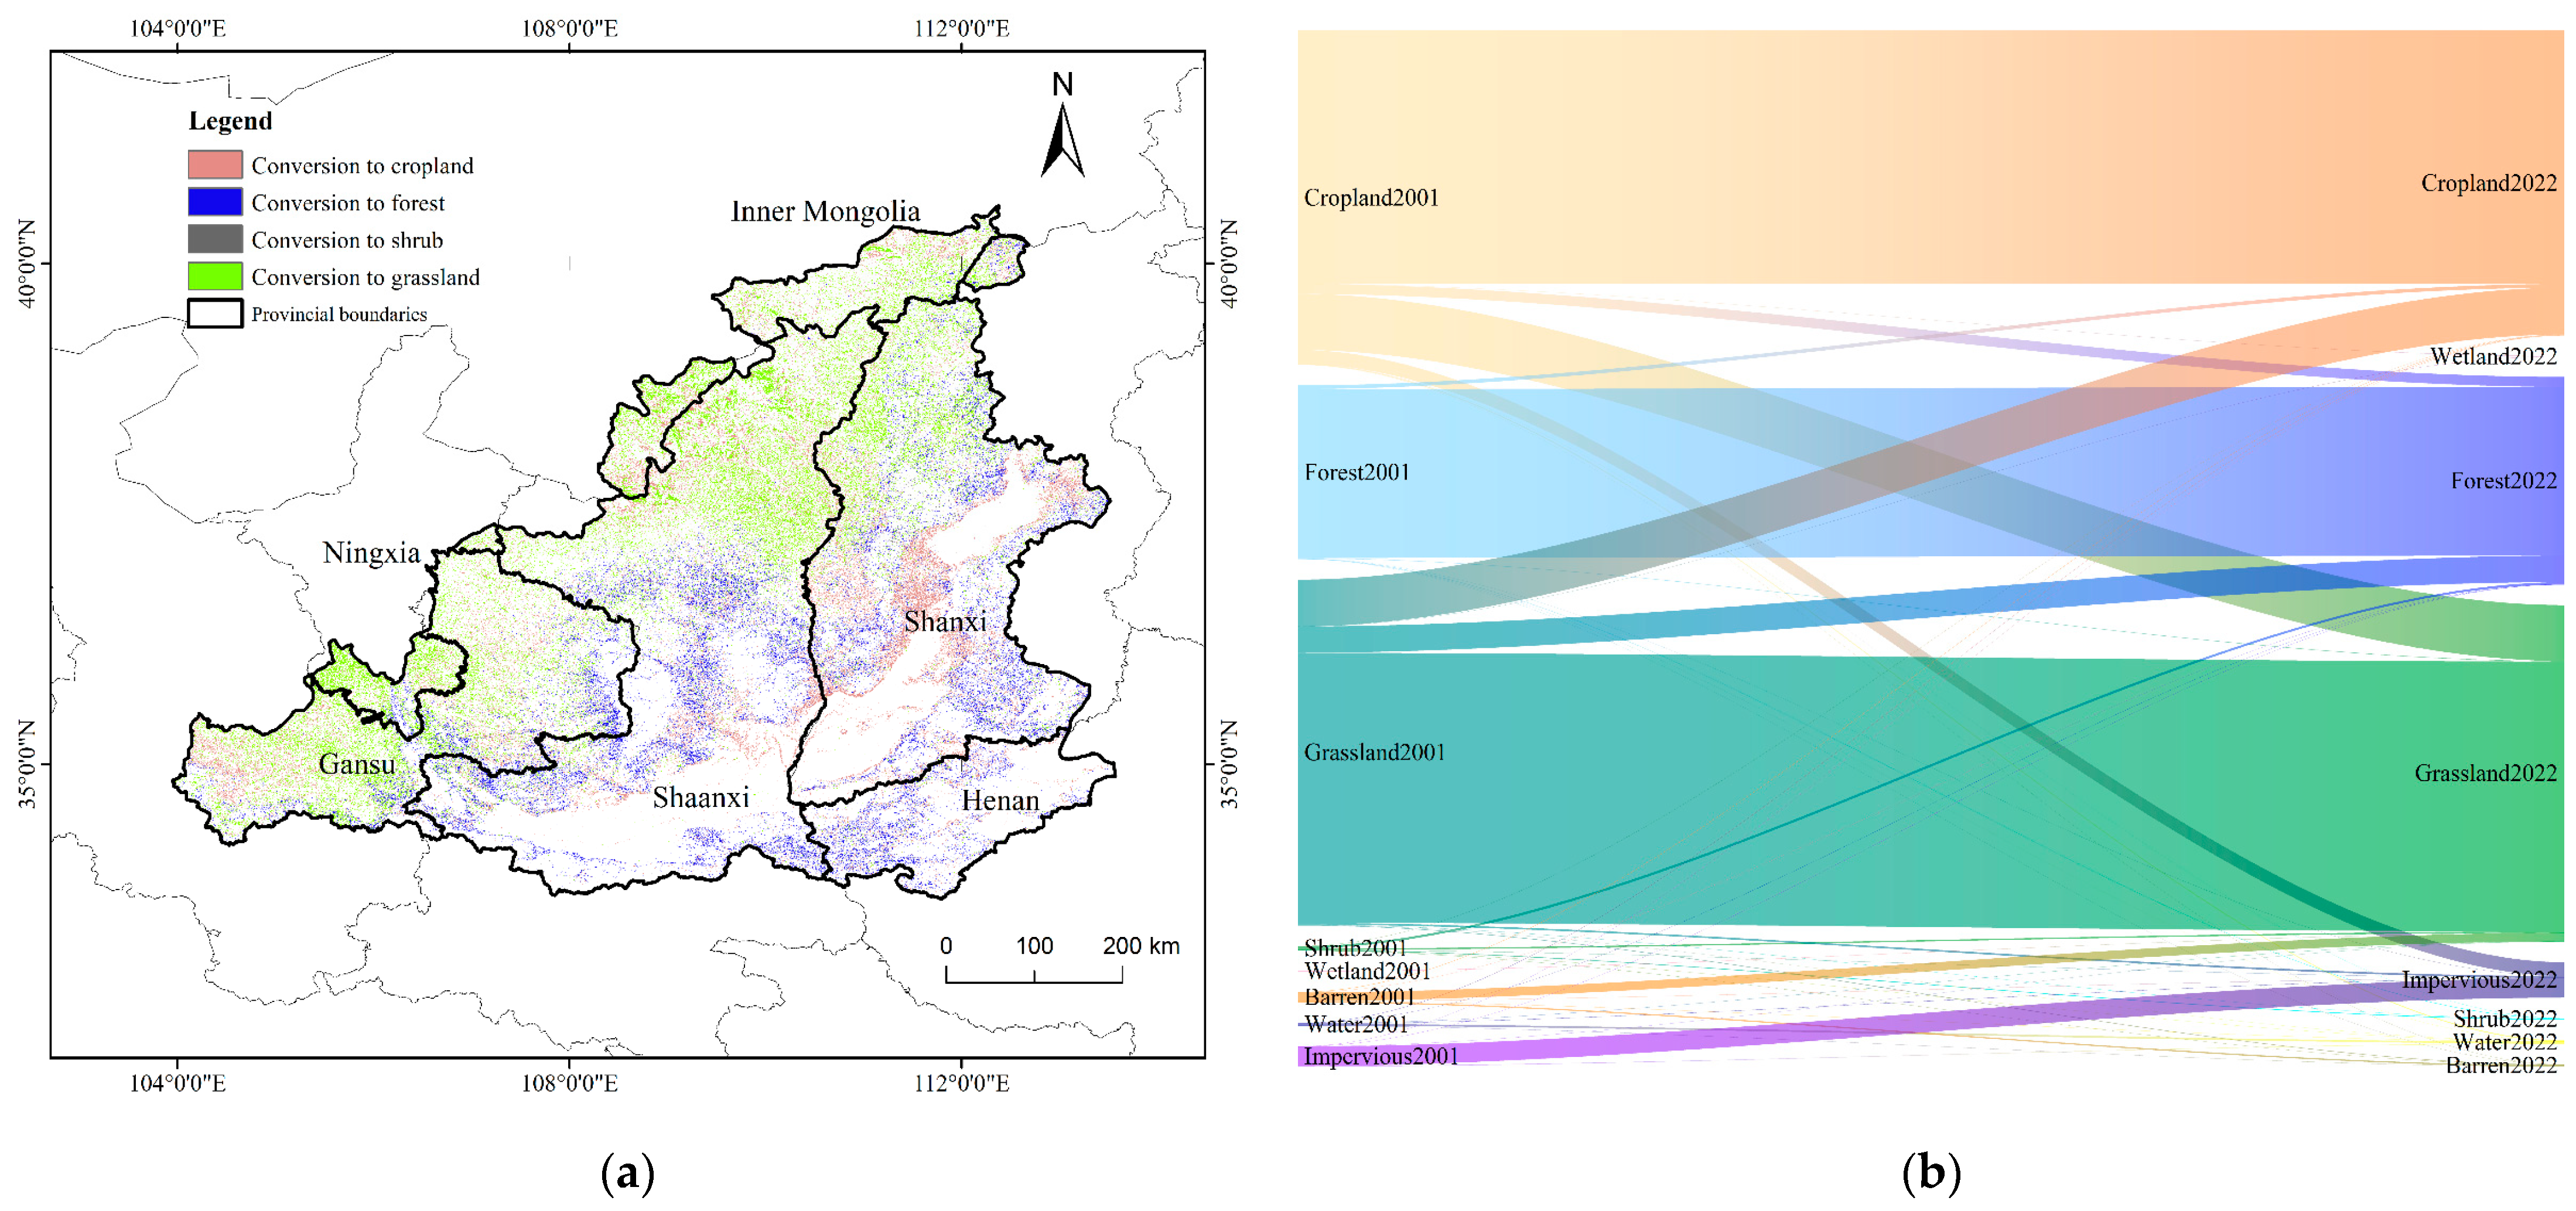
3.5. Impact of Land Cover on Carbon Sinks

Land cover change is the main manifestation of human activity and the main way regional carbon sinks are influenced. Therefore, the land cover change in the MRYR was analyzed (Figure 12 and Table 4). As shown in Figure 12, the MRYR underwent obvious land cover changes after ecological protection measures were instituted. The restored forest land was mainly distributed in Shanxi, Northern Shaanxi, and Northern Henan. The areas transformed into grassland were mainly distributed in the western and northern parts of the MRYR. In addition, due to the different areas of the MRYR being occupied by different provinces, the restored areas of forests, shrubs, and grasslands are also different. Shaanxi is the most concentrated restoration area (14,675.28 km2), followed by Shanxi (10,194.90 km2) and Gansu (8707.19 km2).
A total of 67,671.27 km2 of land changed use from 2001 to 2022, of which the area of forest land increased by 19.54%, grassland decreased by 2.72%, cropland decreased by 8.73%, and shrubs decreased by 69.46%. Among the latter three, 22.97% (3824.11 km2) of the cropland, 7.62% (10,166.11 km2) of the grassland, and 51.26% (869.69 km2) of the shrubs were converted to forests. Interconversions between grassland, forest, and cropland accounted for 81.60% of the changed area. Furthermore, the NEP in these areas increased by 15.07 Tg. Table 4 shows that the most changed unit was of cropland to grassland. A total of 3824.11 km2 of cropland was transformed into forest, and the NEP increased by 1.49 Tg. The conversion of grassland to cropland and forest accounted for 41.71% of the changed area, and the NEP increased by 9.69 Tg. A total of 1407.19 km2 of forest was converted to cropland, but the NEP increased.

4. Discussion

4.1. Climate Change and Its Impacts

The results of this study indicate that precipitation (PRE), temperature (TEM), and ETa in the MRYR have fluctuating upward trends, and PET has experienced fluctuating downward trends since the beginning of the 21st century. Overall, the degree of aridity in the MRYR has weakened, and the climate state has shifted in the direction of warming and humidification. The trend of humidification in Northwest China has expanded significantly eastward since the beginning of this century [58,60]; the eastern part of Northwest China has also begun to enter a period of increased PRE [61], and its area of influence includes most of the MRYR. There are two views on the change in PET in Northwest China: one is that evaporation is decreasing, i.e., the “evaporation paradox”, which is contrary to the possibility that global warming may lead to an increase in evaporation [62,63]; the other is that evaporation shifted from a decrease to an increase in the 1990s [64,65]. The results of the PET study in this paper are similar to the first view. The increase in ETa is most likely caused by the greening of large areas of vegetation in the study area under ecological measures. In general, vegetation greening increases evaporation in an area, which enhances the water vapor cycle in that area and results in increased PRE in the downwind area [66].
In the context of warming, winters in the middle and high latitudes will be milder [67], and freeze–thaw phenomena will become more widespread and frequent [68]. The rate of soil CO2 emission increases during thawing [69], thus further exacerbating the greenhouse effect. The soil respiration in the study area was relatively strong during the initial phase of the freeze–thaw (fall–winter alternation, November), eventually declined to a more stable level (winter freeze), and then soil respiration increased again (winter–spring alternation, March) (Figure 13a). The RH in winter, spring, summer, and fall accounted for 7.04%, 22.96%, 46.87%, and 23.13% of the total, respectively. Since the NPP is an annual dataset, we analyzed the monthly changes in the GPP from 2001 to 2022 (Figure 13a). There were many months when the GPP was lower than the RH in winter, suggesting that the MRYR is dominated by carbon sources in winter. It can be seen that the changes in soil respiration and carbon sinks in the MRYR were mainly concentrated in summer, which had higher temperatures and more concentrated PRE (Figure 13b). The soil respiration fell sharply at temperatures below freezing and rose sharply at temperatures above freezing [70]. The same finding was observed in this study, where the RH was significantly higher at temperatures > 0 °C than at temperatures ≤ 0 °C under very low PRE in winter (Figure 13c). Overwinter temperature changes (including the frequency of freeze–thaw and snowmelt processes) are more pronounced in open agricultural land compared to forest or grassland soils [71]. Similar results were found in the present study, in which areas with winter temperatures > 0 °C were mainly dominated by cropland. Different methods of vegetation restoration affect the spatial and temporal variability in physicochemical properties during freeze–thaw processes [72,73], which in turn affects soil respiration and the carbon pool size [67,74]. In this study, the RH was also analyzed for the different vegetation types, but no corresponding results were obtained. This may be related to the soil respiration equation used in this study, and the need for smaller-scale observations to analyze the corresponding results.
The trend of humidification is not only manifested in the average state, but also the short calendar time during which heavy precipitation and extreme precipitation prominently contribute to the total precipitation for the year [75,76,77,78]. The western and northern regions of China are prone to sudden extreme precipitation events [79]. For example, the number of days with heavy precipitation and precipitation intensity increased significantly (p < 0.05) in the Loess Plateau from 2000 to 2020 [80]. Warming and humidification are a double-edged sword. Warming and humidification bring precipitation, increase the carbon sink capacity of vegetation, and drought is alleviated to some extent. However, warming may cause drastic changes in soil carbon pools; increased extreme precipitation events also pose a threat to the environment and public safety. Therefore, in the face of warming and humidification, a mechanism should be proactively explored, and a specific prediction model should be developed to deal with the threats they may pose. This will provide some theoretical support for the future environmental security, economic development, and sustainable development of the region.

4.2. Characterization of Changes in NEP, WUE, and CUE

In this study, the results show that the NEP, WUE, and CUE in the MRYR show an increasing trend in general. This is inextricably linked to China’s ecological protection measures. The magnitude of the NEP is closely related to the biomass and, in general, the larger the biomass, the larger the NEP. The NEP of the forests and shrubs in this study show higher values, which is the same as the results of previous studies [81,82]. However, the interannual growth rate of the NEP is the opposite, with the grassland being significantly higher than that of the other vegetation. This is related to the physiognomy of the vegetation and the stability of the community, as the effect of climate on vegetation is inversely related to the stability of the vegetation community [83]. The trend of NEP growth in the southeastern and northwestern edges of the MRYR is significantly less than that of the other regions. This may be due to higher heterotrophic respiration (RH) caused by high TEM and PRE in the southeastern part of the MRYR (Figure 14). In contrast, the arid climate in the northwestern part of the MRYR causes a slower growth of carbon sinks.
The performance of WUE is forest > shrub > cropland > grassland. The forest and shrub ecosystems have a stronger ability to accumulate organic matter, and their biomass is significantly higher than that of the other vegetation types. Cropland has a higher carbon sink and sufficient water due to human intervention (irrigation and fertilization). The WUE shows a spatial distribution of being high in the southeast and low in the northwest, which is mainly related to the spatial distribution of the vegetation [28]. Moreover, the WUE of the natural vegetation around croplands show higher values, which is similar to the study of Tian et al. [84] of the Loess Plateau. In forests and shrubs, the increasing trend of ETa is higher than that of the NEP, resulting in a decreasing trend of its WUE. This may be due to the increase in tall trees, such as in forests under ecological conservation projects, which require water resources that are not only supplemented by precipitation but may also require the deep absorption of soil moisture and groundwater resources by the root system, thus enhancing plant transpiration [85]. This may be one of the reasons why the depth of the dry soil layer in the Loess Plateau has deepened [86]. Therefore, when implementing ecological conservation policies, they should be adapted to the local conditions and not involve the blind planting of trees and grasses. Although the soil moisture content is decreasing [54,86], the vegetation still shows a greening trend, and the carbon sink is still increasing. This may be caused by atmospheric CO2 fertilization [87]. Studies have shown that the WUE growth rate is higher in more arid areas, suggesting that the vegetation in areas of moderate water scarcity has a better ability to adapt to drought [28]. This study shows similar results.
The CUE of the shrubs and forests is higher than that of the other two vegetation types, which is inconsistent with most studies [7]. This is because the CUE in this paper is calculated based on the NEP, and the other articles calculated it by the NPP. There is a process of heterotrophic respiration between the NPP and NEP. The multi-year mean value of the NPP in the MRYR is 351.31 gCm−2 for grasslands, 439.47 gCm−2 for croplands, and the mean value of the shrubs and forests are around 580 gCm−2. The mean value of RH is 211.64 gCm−2, and the RH for grassland, cropland, shrubs, and forest are 198.30 gCm−2, 228.55 gCm−2, 193.21 gCm−2, and 203.28 gCm−2, respectively (Figure 14). The NPP varies greatly among different vegetation types, while RH does not have such a large gap. This phenomenon reflects the fact that more CO2 is released through respiration in dry areas, and CO2 uptake is the main feature of humid climates [88]. This phenomenon also explains the global CUEa of 0.52 [7] and the CUE of only 0.31 in this study.
In 2001, the NEP, WUE, and CUE showed the lowest values, and both the WUE and CUE of the grassland showed negative values, which was related to the severe drought in 2001. Hou et al. [54] combined the two drought indices to find that the Loess Plateau suffered a drought event in May–July 2001, which had a significant negative impact on the carbon sink.

4.3. Analysis of Impact Mechanisms

The change in the NEP in the MRYR is the result of the joint action of environmental and human activity factors. Anthropogenic impacts on land cover profoundly change the structure and function of natural ecosystems, which in turn changes the carbon fluxes of ecosystems [89]. From 2001 to 2022, 1407.19 km2 of forest was converted to cropland, but the NEP increased. This shows that not only do human activities have a great influence on the NEP, but climate change also considerably contributes to the increase in carbon sinks.
From 2001 to 2022, PRE and TEM in the MRYR increased by 68.74 mm and 0.29 °C, respectively, resulting in more favorable conditions for vegetation growth [90,91]. In relatively arid regions, the effect of PRE on vegetation tends to be stronger relative to the TEM [92]. Liang et al. [93] also found a lack of correlation between interannual changes in the temperature and carbon sinks in arid and semi-arid regions. In this study, the correlation of the NEP, WUE, and CUE with PRE was significantly higher than that with TEM. In the interannual anomalies, we found that an increase in precipitation not only affects a carbon sink in that year, but also has a strong effect on the accumulation of the carbon sink in the following year. This confirms that PRE is the main controlling factor for carbon sink accumulation in the MRYR.
Precipitation and temperature affect photosynthesis and evapotranspiration, which in turn affect vegetation development [94]. An increase in PRE and TEM enhances ETa and carbon sinks, which lead to differences in the WUE and CUE across different vegetation types and regions. The correlation of WUE and CUE with PRE and TEM in the northern part of the MRYR is positive. One reason for this is that grassland is the dominant vegetation type, and increased PRE and higher temperatures enhance grassland NEP; the other is that the temperature is relatively low and there is low evapotranspiration and, in the face of drought stress, these reduce leaf stomatal conductance with increasing temperature to enhance its own WUE [95]. The correlation between WUE and PRE has a clear latitudinal zonality [96]. Excluding cropland, the value of WUE shifts from a negative to a positive correlation as the latitude increases. Similar results were found in the study of Zhang et al. [28] of the Loess Plateau. Changes in CUE are produced by a combination of factors, and the correlation between vegetation CUE and TEM may be confounded due to a combination of CO2 fertilization, nitrogen deposition, saturated water vapor pressure, and other factors.
There was a very high positive correlation (p < 0.05) between the NEP and DSI in the MRYR. This indicates that droughts have a direct effect on carbon sinks. Carbon sinks have been reported to increase in many regions of the globe during drought years [14,97,98]. The reason for this may be that temperature affects vegetation respiration, which in turn promotes an increase in carbon sinks [40]. In particular, light droughts are coupled with high temperatures, and high temperatures may offset the reduction in carbon sinks caused by moisture deficits [97]. However, this phenomenon did not occur in this study area, and the moisture content in the MRYR was likely already at a very low level which supported an increase in carbon sinks. The correlation between the WUE, CUE, and DSI has a clear vegetation differentiation. There are very high correlations in the grasslands and croplands, lower correlations in the forests and shrubs, and even a large number of negative correlations in the eastern part of the MRYR. This phenomenon could be related to the resilience of vegetation to cope with drought; grassland and cropland do not have the function and structure of forests and shrubs, and drought affects them more rapidly and directly.

4.4. Uncertainty Analysis and Directions for Further Research

There are several areas of uncertainty in the results. (1) Uncertainty in MODIS NPP: The MODIS product used to calculate vegetation autotrophic respiration (RA) has a high-temperature sensitivity parameter, which can lead to a decrease in the NPP with increasing temperature [53]. The MODIS product overestimates the value of the product in low-productivity areas and underestimates the value of the product in high-productivity areas [99]. As a result, the value of the NPP is inaccurate in some areas, leading to errors in the NEP results. (2) Uncertainty in heterotrophic respiration (RH): This study adopted an empirical equation based on temperature and precipitation [43], and although this equation has been used in many studies [8,44,45,48,49,50,51,52,53], the homogeneous nature of the equation makes it difficult to account for the differences caused by differences in soil and vegetation. The soil structure, number of freeze–thaw alternations, and soil biological properties also affect the magnitude of soil respiration under seasonal freezing and thawing, which in turn affects the carbon sink. The improvement of this equation requires the continued monitoring of field data, a step that could not be pursued due to the limitations of this study. (3) Uncertainty in MODIS ETa: more clouds reduce the MODIS surface albedo and may increase the uncertainty in the reanalyzed data, deteriorating ETa accuracy under an overcast sky [100]. (4) The problem of mixed pixels: Although the land cover data in this study has high spatial resolution, pixel problems are unavoidable. For instance, there is no obvious demarcation line for each vegetation type, which leads to errors when calculating the NEP of each vegetation type separately. Moreover, because of the ecological restoration project in the MRYR, the land cover types change to a certain extent every year, which may lead to an essential change in the land use type in a certain area in a year.
Through this analysis and discussion of the results, we believe that increasing the spatial and temporal scale of the NPP data will play a decisive role in measuring the NEP more accurately. For example, the parametric model CASA could be used [8]. It is capable of inputting higher-resolution remote sensing data, improving the spatial resolution of the NPP, and realizing the integration of monthly and seasonal NPP data. Finally, three representative climate factors were selected to calculate the correlations with climate variables. In addition, three more, i.e., the CO2 concentration, altitude, and solar radiation, can profoundly affect the NEP, WUE, and CUE. Furthermore, we calculated the correlations using a linear correlation approach. The relationship between climate variables and productivity is often very complex, and the relationship is likely to be nonlinear. Therefore, in subsequent studies, more factors should be selected, and better mathematical fitting methods should be adopted to assess the water–carbon cycle in a region. These are all elements that deserve further research.

5. Conclusions

In this study, the spatial and temporal variations in the NEP, WUE, and CUE in the MRYR, as well as the corresponding variations in meteorological factors, were estimated using the Geographic Information System (GIS), Google Earth Engine (GEE), and remote sensing (RS) techniques. The correlation between the NEP, WUE, and CUE of different vegetation types and meteorological factors, as well as the effects of land cover on carbon sinks, were emphasized. The main conclusions are as follows:
(1)
Based on the changes in precipitation, temperature, ETa, PET, and DSI from 2001 to 2022, the drought trend in the MRYR is weakening, and climate change has been moving toward warming and humidification.
(2)
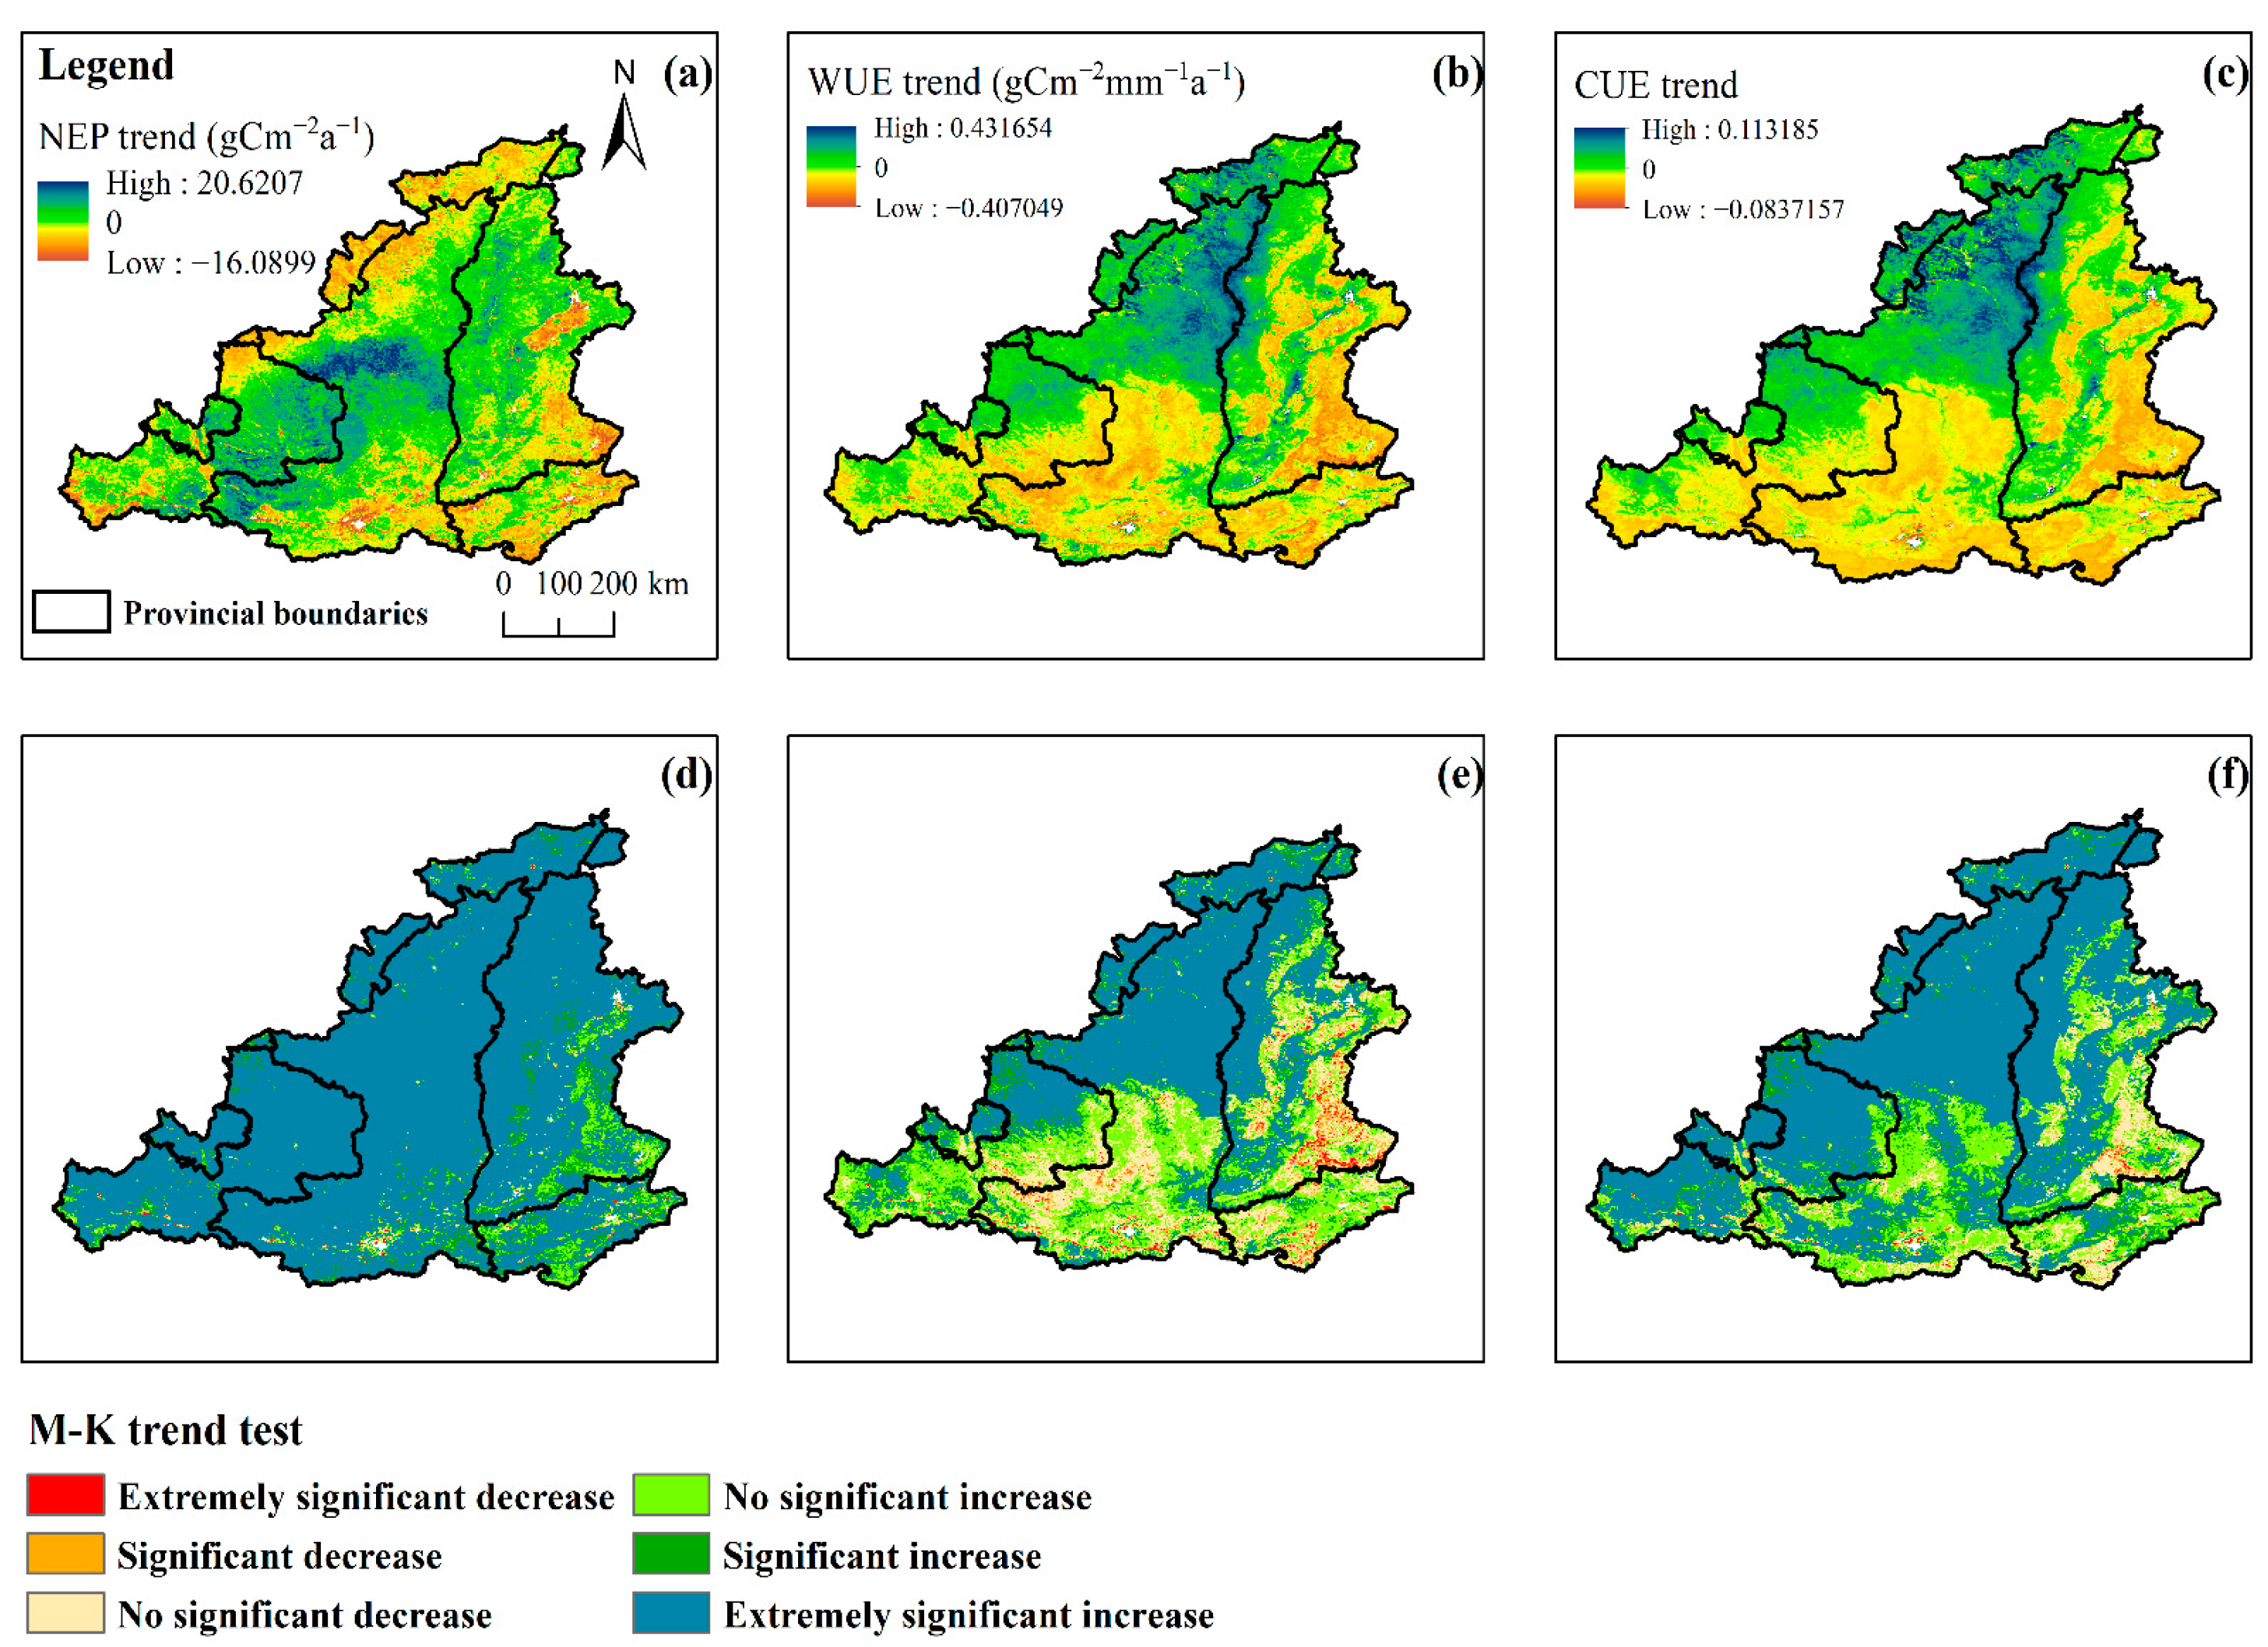
The NEP, WUE, and CUE generally showed an upward trend from 2001 to 2022, with annual mean values of 221.49 gCm−2, 0.52 gC m−2mm−1, and 0.31, respectively, and average growth rates of 7.75 gC m−2a−1, 0.012 gC m−2 mm−1a−1, and 0.009 a−1, respectively. Spatially, the fastest growth rate was observed in the more arid northwestern part of the MRYR. In contrast, the growth rate was lower in the southeastern region, where water resources are relatively abundant. Of the four vegetation types, the grassland NEP, WUE, and CUE had the highest growth rates, followed by cropland; however, in the forests and shrubs, the WUE and CUE growth rates tended to be close to 0 or less than 0.
(3)
An analysis of the standardized anomaly indices showed that precipitation accumulation contributed to the accumulation of carbon sinks. Among the three selected meteorological factors, the DSI had the highest correlation with the NEP, WUE, and CUE, and the correlation of precipitation with the NEP, WUE, and CUE showed latitudinal zonality. This suggests that precipitation is the main control factor affecting the water–carbon cycle in the region, not temperature.
(4)
From 2001 to 2022, a total of 67,671.27 km2 of land cover types changed in the MRYR, and the regional NEP increased by 15.07 Tg. The interconversion between grassland, forest, and cropland accounted for 81.60% of the changed area.

Author Contributions

Conceptualization, X.H. and B.Z.; methodology, X.H. and B.Z.; software, X.H. and Z.-L.S.; formal analysis, X.H., Q.-Q.H., and X.-Y.Z.; validation, X.H.; data curation, X.H. and H.Y.; visualization, X.H. and Q.-Q.H.; writing—original draft preparation, X.H.; writing—review and editing, B.Z.; funding acquisition, B.Z. All authors have read and agreed to the published version of the manuscript.

Funding

This research was funded by the National Natural Science Foundation of China (41561024).

Data Availability Statement

No new data were created or analyzed in this study. Data sharing is not applicable to this article.

Acknowledgments

Thanks to Zhang Bo of Northwest Normal University for their constructive comments on this article.

Conflicts of Interest

The authors declare no conflicts of interest.

References

  1. Vörösmarty, C.J.; Green, P.; Salisbury, J.; Lammers, R.B. Global Water Resources: Vulnerability from Climate Change and Population Growth. Science 2000, 289, 284–288. [Google Scholar] [CrossRef]
  2. Rosegrant, M.; Cai, X.; Cline, S. Will The World Run Dry? Global Water and Food Security. Environ. Sci. Policy Sustain. Dev. 2003, 45, 24–36. [Google Scholar] [CrossRef]
  3. Gang, C.; Wang, Z.; Chen, Y.; Yang, Y.; Li, J.; Cheng, J.; Qi, J.; Odeh, I. Drought-Induced Dynamics of Carbon and Water Use Efficiency of Global Grasslands from 2000 to 2011. Ecol. Indic. 2016, 67, 788–797. [Google Scholar] [CrossRef]
  4. Yu, P.; Krysanova, V.; Wang, Y.; Xiong, W.; Mo, F.; Shi, Z.; Liu, H.; Vetter, T.; Huang, S. Quantitative Estimate of Water Yield Reduction Caused by Forestation in a Water-Limited Area in Northwest China. Geophys. Res. Lett. 2009, 36, L02406. [Google Scholar] [CrossRef]
  5. Chen, C.; Park, T.; Wang, X.; Piao, S.; Xu, B.; Chaturvedi, R.K.; Fuchs, R.; Brovkin, V.; Ciais, P.; Fensholt, R.; et al. China and India Lead in Greening of the World through Land-Use Management. Nat. Sustain. 2019, 2, 122–129. [Google Scholar] [CrossRef]
  6. Peng, D.; Zhang, B.; Wu, C.; Huete, A.R.; Gonsamo, A.; Lei, L.; Ponce-Campos, G.E.; Liu, X.; Wu, Y. Country-Level Net Primary Production Distribution and Response to Drought and Land Cover Change. Sci. Total Environ. 2017, 574, 65–77. [Google Scholar] [CrossRef] [PubMed]
  7. Bloom, A.A.; Exbrayat, J.-F.; van der Velde, I.R.; Feng, L.; Williams, M. The Decadal State of the Terrestrial Carbon Cycle: Global Retrievals of Terrestrial Carbon Allocation, Pools, and Residence Times. Proc. Natl. Acad. Sci. USA 2016, 113, 1285–1290. [Google Scholar] [CrossRef]
  8. Zhang, J.; Hao, X.; Hao, H.; Fan, X.; Li, Y. Climate Change Decreased Net Ecosystem Productivity in the Arid Region of Central Asia. Remote Sens. 2021, 13, 4449. [Google Scholar] [CrossRef]
  9. Chapin, F.S.; Woodwell, G.M.; Randerson, J.T.; Rastetter, E.B.; Lovett, G.M.; Baldocchi, D.D.; Clark, D.A.; Harmon, M.E.; Schimel, D.S.; Valentini, R.; et al. Reconciling Carbon-Cycle Concepts, Terminology, and Methods. Ecosystems 2006, 9, 1041–1050. [Google Scholar] [CrossRef]
  10. Liang, L.; Geng, D.; Yan, J.; Qiu, S.; Shi, Y.; Wang, S.; Wang, L.; Zhang, L.; Kang, J. Remote Sensing Estimation and Spatiotemporal Pattern Analysis of Terrestrial Net Ecosystem Productivity in China. Remote Sens. 2022, 14, 1902. [Google Scholar] [CrossRef]
  11. Ruimy, A.; Saugier, B.; Dedieu, G. Methodology for the Estimation of Terrestrial Net Primary Production from Remotely Sensed Data. J. Geophys. Res. Atmos. 1994, 99, 5263–5283. [Google Scholar] [CrossRef]
  12. Feng, X.; Fan, Q.; Qu, J.; Ding, X.; Niu, Z. Characteristics of Carbon Sources and Sinks and Their Relationships with Climate Factors during the Desertification Reversal Process in Yulin, China. Front. For. Glob. Chang. 2023, 6, 1288449. [Google Scholar] [CrossRef]
  13. Li, Z.; Chen, Y.; Wang, Y.; Fang, G. Dynamic Changes in Terrestrial Net Primary Production and Their Effects on Evapotranspiration. Hydrol. Earth Syst. Sci. 2016, 20, 2169–2178. [Google Scholar] [CrossRef]
  14. Liu, Y.; Xiao, J.; Ju, W.; Zhou, Y.; Wang, S.; Wu, X. Water Use Efficiency of China’s Terrestrial Ecosystems and Responses to Drought. Sci. Rep. 2015, 5, 13799. [Google Scholar] [CrossRef]
  15. Qiu, R.; Han, G.; Ma, X.; Xu, H.; Shi, T.; Zhang, M. A Comparison of OCO-2 SIF, MODIS GPP, and GOSIF Data from Gross Primary Production (GPP) Estimation and Seasonal Cycles in North America. Remote Sens. 2020, 12, 258. [Google Scholar] [CrossRef]
  16. Liu, W.L.; Jiang, L.L.; Liu, B.; Xiao, Z.L.; Zhang, Y.W. Spatio-Temporal Evolution Characteristics and Driving Factors Analysis of Vegetation Carbon Sources/Sinks in China. Acta Ecol. Sin. 2024, 44, 1456–1467. [Google Scholar] [CrossRef]
  17. Knapp, A.K.; Smith, M.D. Variation Among Biomes in Temporal Dynamics of Aboveground Primary Production. Science 2001, 291, 481–484. [Google Scholar] [CrossRef]
  18. van der Molen, M.K.; Dolman, A.J.; Ciais, P.; Eglin, T.; Gobron, N.; Law, B.E.; Meir, P.; Peters, W.; Phillips, O.L.; Reichstein, M.; et al. Drought and Ecosystem Carbon Cycling. Agric. For. Meteorol. 2011, 151, 765–773. [Google Scholar] [CrossRef]
  19. Khalifa, M.; Elagib, N.A.; Ribbe, L.; Schneider, K. Spatio-Temporal Variations in Climate, Primary Productivity and Efficiency of Water and Carbon Use of the Land Cover Types in Sudan and Ethiopia. Sci. Total Environ. 2018, 624, 790–806. [Google Scholar] [CrossRef]
  20. Tucker, C.L.; Bell, J.; Pendall, E.; Ogle, K. Does Declining Carbon-use Efficiency Explain Thermal Acclimation of Soil Respiration with Warming? Glob. Chang. Biol. 2013, 19, 252–263. [Google Scholar] [CrossRef]
  21. Sinsabaugh, R.L.; Moorhead, D.L.; Xu, X.; Litvak, M.E. Plant, Microbial and Ecosystem Carbon Use Efficiencies Interact to Stabilize Microbial Growth as a Fraction of Gross Primary Production. New Phytol. 2017, 214, 1518–1526. [Google Scholar] [CrossRef] [PubMed]
  22. DI, Y.; Zeng, H.; Zhang, Y.; Chen, N.; Cong, N. Research Advances in Carbon Use Efficiency at Multiple Scales. Chin. J. Ecol. 2021, 40, 1849–1860. [Google Scholar] [CrossRef]
  23. Xia, J.; McGuire, A.D.; Lawrence, D.; Burke, E.; Chen, G.; Chen, X.; Delire, C.; Koven, C.; MacDougall, A.; Peng, S.; et al. Terrestrial Ecosystem Model Performance in Simulating Productivity and Its Vulnerability to Climate Change in the Northern Permafrost Region. J. Geophys. Res. Biogeosci. 2017, 122, 430–446. [Google Scholar] [CrossRef]
  24. Manzoni, S.; Čapek, P.; Porada, P.; Thurner, M.; Winterdahl, M.; Beer, C.; Brüchert, V.; Frouz, J.; Herrmann, A.M.; Lindahl, B.D.; et al. Reviews and Syntheses: Carbon Use Efficiency from Organisms to Ecosystems—Definitions, Theories, and Empirical Evidence. Biogeosciences 2018, 15, 5929–5949. [Google Scholar] [CrossRef]
  25. Tang, X.; Li, H.; Desai, A.R.; Nagy, Z.; Luo, J.; Kolb, T.E.; Olioso, A.; Xu, X.; Yao, L.; Kutsch, W.; et al. How Is Water-Use Efficiency of Terrestrial Ecosystems Distributed and Changing on Earth? Sci. Rep. 2014, 4, 7483. [Google Scholar] [CrossRef] [PubMed]
  26. Ito, A.; Inatomi, M. Water-Use Efficiency of the Terrestrial Biosphere: A Model Analysis Focusing on Interactions between the Global Carbon and Water Cycles. J. Hydrometeorol. 2012, 13, 681–694. [Google Scholar] [CrossRef]
  27. DeLUCIA, E.H.; Drake, J.E.; Thomas, R.B.; Gonzalez-Meler, M. Forest Carbon Use Efficiency: Is Respiration a Constant Fraction of Gross Primary Production? Glob. Chang. Biol. 2007, 13, 1157–1167. [Google Scholar] [CrossRef]
  28. Zhang, T.; Peng, J.; Liang, W.; Yang, Y.; Liu, Y. Spatial–Temporal Patterns of Water Use Efficiency and Climate Controls in China’s Loess Plateau during 2000–2010. Sci. Total Environ. 2016, 565, 105–122. [Google Scholar] [CrossRef]
  29. Niu, S.; Xing, X.; Zhang, Z.; Xia, J.; Zhou, X.; Song, B.; Li, L.; Wan, S. Water-Use Efficiency in Response to Climate Change: From Leaf to Ecosystem in a Temperate Steppe. Glob. Chang. Biol. 2011, 17, 1073–1082. [Google Scholar] [CrossRef]
  30. Fu, B.; Wu, X.; Wang, Z.; Wu, X.; Wang, S. Coupling Human and Natural Systems for Sustainability: Experience from China’s Loess Plateau. Earth Syst. Dyn. 2022, 13, 795–808. [Google Scholar] [CrossRef]
  31. Yu, Y.; Zhao, W.; Martinez-Murillo, J.F.; Pereira, P. Loess Plateau: From Degradation to Restoration. Sci. Total Environ. 2020, 738, 140206. [Google Scholar] [CrossRef]
  32. Naeem, S.; Zhang, Y.; Zhang, X.; Tian, J.; Abbas, S.; Luo, L.; Meresa, H.K. Both Climate and Socioeconomic Drivers Contribute to Vegetation Greening of the Loess Plateau. Sci. Bull. 2021, 66, 1160–1163. [Google Scholar] [CrossRef] [PubMed]
  33. Wu, X.; Wang, S.; Fu, B.; Feng, X.; Chen, Y. Socio-Ecological Changes on the Loess Plateau of China after Grain to Green Program. Sci. Total Environ. 2019, 678, 565–573. [Google Scholar] [CrossRef]
  34. Ogutu, B.O.; D’Adamo, F.; Dash, J. Impact of Vegetation Greening on Carbon and Water Cycle in the African Sahel-Sudano-Guinean Region. Glob. Planet. Chang. 2021, 202, 103524. [Google Scholar] [CrossRef]
  35. Li, Y.; Liu, C.; Liu, X.; Liang, K.; Bai, P.; Feng, Y. Impact of the Grain for Green Project on the Land Use/Cover Change in the Middle Yellow River. J. Nat. Resour. 2016, 31, 2005–2020. [Google Scholar] [CrossRef]
  36. Yang, J.; Huang, X. The 30 m Annual Land Cover Dataset and Its Dynamics in China from 1990 to 2019. Earth Syst. Sci. Data 2021, 13, 3907–3925. [Google Scholar] [CrossRef]
  37. Peng, S.; Ding, Y.; Liu, W.; Li, Z. 1 km monthly temperature and precipitation dataset for China from 1901 to 2017. Earth Syst. Sci. Data 2019, 11, 1931–1946. [Google Scholar] [CrossRef]
  38. Mu, Q.; Zhao, M.; Kimball, J.S.; McDowell, N.G.; Running, S.W. A Remotely Sensed Global Terrestrial Drought Severity Index. Bull. Am. Meteorol. Soc. 2013, 94, 83–98. [Google Scholar] [CrossRef]
  39. Khan, R.; Gilani, H. Global Drought Monitoring with Drought Severity Index (DSI) Using Google Earth Engine. Theor. Appl. Climatol. 2021, 146, 411–427. [Google Scholar] [CrossRef]
  40. Zhao, M.; Running, S.W. Drought-Induced Reduction in Global Terrestrial Net Primary Production from 2000 through 2009. Science 2010, 329, 940–943. [Google Scholar] [CrossRef]
  41. Zhang, X.; Yamaguchi, Y. Characterization and Evaluation of MODIS Derived Drought Severity Index (DSI) for Monitoring the 2009/2010 Drought over Southwestern China. Nat. Hazards 2014, 74, 2129–2145. [Google Scholar] [CrossRef]
  42. Woodwell, G.M.; Whittaker, R.H.; Reiners, W.A.; Likens, G.E.; Delwiche, C.C.; Botkin, D.B. The Biota and the World Carbon Budget. Science 1978, 199, 141–146. [Google Scholar] [CrossRef]
  43. Pei, Z.-Y.; Ouyang, H.; Zhou, C.-P.; Xu, X.-L. Carbon Balance in an Alpine Steppe in the Qinghai-Tibet Plateau. J. Integr. Plant Biol. 2009, 51, 521–526. [Google Scholar] [CrossRef] [PubMed]
  44. Wang, C.; Zhao, W.; Zhang, Y. The Change in Net Ecosystem Productivity and Its Driving Mechanism in a Mountain Ecosystem of Arid Regions, Northwest China. Remote Sens. 2022, 14, 4046. [Google Scholar] [CrossRef]
  45. Li, X.; Lin, G.; Jiang, D.; Fu, J.; Wang, Y. Spatiotemporal Evolution Characteristics and the Climatic Response of Carbon Sources and Sinks in the Chinese Grassland Ecosystem from 2010 to 2020. Sustainability 2022, 14, 8461. [Google Scholar] [CrossRef]
  46. Zhang, T.; Zhou, J.; Yu, P.; Li, J.; Kang, Y.; Zhang, B. Response of Ecosystem Gross Primary Productivity to Drought in Northern China Based on Multi-Source Remote Sensing Data. J. Hydrol. 2023, 616, 128808. [Google Scholar] [CrossRef]
  47. Zhang, J.; Ren, Z. Spatiotemporal Characteristics of Evapotranspiration Based on MOD16 in the Hanjiang River Basin. Sci. Geogr. Sin. 2017, 37, 274–282. [Google Scholar] [CrossRef]
  48. Zhang, K.; Zhu, C.; Ma, X.; Zhang, X.; Yang, D.; Shao, Y. Spatiotemporal Variation Characteristics and Dynamic Persistence Analysis of Carbon Sources/Sinks in the Yellow River Basin. Remote Sens. 2023, 15, 323. [Google Scholar] [CrossRef]
  49. Yang, S.; Zhang, J.; Zhang, S.; Wang, J.; Bai, Y.; Yao, F.; Guo, H. The Potential of Remote Sensing-Based Models on Global Water-Use Efficiency Estimation: An Evaluation and Intercomparison of an Ecosystem Model (BESS) and Algorithm (MODIS) Using Site Level and Upscaled Eddy Covariance Data. Agric. For. Meteorol. 2020, 287, 107959. [Google Scholar] [CrossRef]
  50. Tang, X.; Ma, M.; Ding, Z.; Xu, X.; Yao, L.; Huang, X.; Gu, Q.; Song, L. Remotely Monitoring Ecosystem Water Use Efficiency of Grassland and Cropland in China’s Arid and Semi-Arid Regions with MODIS Data. REMOTE Sens. 2017, 9, 616. [Google Scholar] [CrossRef]
  51. Gang, C.; Zhang, Y.; Guo, L.; Gao, X.; Peng, S.; Chen, M.; Wen, Z. Drought-Induced Carbon and Water Use Efficiency Responses in Dryland Vegetation of Northern China. Front. Plant Sci. 2019, 10, 224. [Google Scholar] [CrossRef] [PubMed]
  52. Du, L.; Gong, F.; Zeng, Y.; Ma, L.; Qiao, C.; Wu, H. Carbon Use Efficiency of Terrestrial Ecosystems in Desert/Grassland Biome Transition Zone: A Case in Ningxia Province, Northwest China. Ecol. Indic. 2021, 120, 106971. [Google Scholar] [CrossRef]
  53. He, Y.; Piao, S.; Li, X.; Chen, A.; Qin, D. Global Patterns of Vegetation Carbon Use Efficiency and Their Climate Drivers Deduced from MODIS Satellite Data and Process-Based Models. Agric. For. Meteorol. 2018, 256–257, 150–158. [Google Scholar] [CrossRef]
  54. Hou, X.; Zhang, B.; Chen, J.; Zhou, J.; He, Q.-Q.; Yu, H. Response of Vegetation Productivity to Greening and Drought in the Loess Plateau Based on VIs and SIF. Forests 2024, 15, 339. [Google Scholar] [CrossRef]
  55. Li, Y.; Li, M.; Zheng, Z.; Shen, W.; Li, Y.; Rong, P.; Qin, Y. Trends in Drought and Effects on Carbon Sequestration over the Chinese Mainland. Sci. Total Environ. 2023, 856, 159075. [Google Scholar] [CrossRef] [PubMed]
  56. Fuller, D.O.; Wang, Y. Recent Trends in Satellite Vegetation Index Observations Indicate Decreasing Vegetation Biomass in the Southeastern Saline Everglades Wetlands. Wetlands 2014, 34, 67–77. [Google Scholar] [CrossRef]
  57. Li, Y.; Qin, Y.; Rong, P. Evolution of Potential Evapotranspiration and Its Sensitivity to Climate Change Based on the Thornthwaite, Hargreaves, and Penman–Monteith Equation in Environmental Sensitive Areas of China. Atmos. Res. 2022, 273, 106178. [Google Scholar] [CrossRef]
  58. Zhang, Q.; Yang, J.; Duan, X.; Ma, P.; Lu, G.; Zhu, B.; Liu, X.; Yue, P.; Wang, Y.; Liu, W. The Eastward Expansion of the Climate Humidification Trend in Northwest China and the Synergistic Influences on the Circulation Mechanism. Clim. Dyn. 2022, 59, 2481–2497. [Google Scholar] [CrossRef]
  59. Zhang, X.; Susan Moran, M.; Zhao, X.; Liu, S.; Zhou, T.; Ponce-Campos, G.E.; Liu, F. Impact of Prolonged Drought on Rainfall Use Efficiency Using MODIS Data across China in the Early 21st Century. Remote Sens. Environ. 2014, 150, 188–197. [Google Scholar] [CrossRef]
  60. SONG, L.; ZHANG, C. Changing Features of Precipitation over Northwest China During the 20th Century. J. Glaciol. Geocryol. 2003, 25, 143–148. [Google Scholar] [CrossRef]
  61. Zhang, Q.; Yang, J.H.; Wang, P.L.; Yu, H.P.; Yue, P.; Liu, X.Y.; Lin, J.J.; Duan, X.Y.; Zhu, B.; Yan, X.Y. Progress and prospect on climate warming and humidification in Northwest China. Chin. Sci. Bull. 2023, 68, 1814–1828. (In Chinese) [Google Scholar] [CrossRef]
  62. Yang, L.; Feng, Q.; Adamowski, J.F.; Yin, Z.; Wen, X.; Wu, M.; Jia, B.; Hao, Q. Spatio-Temporal Variation of Reference Evapotranspiration in Northwest China Based on CORDEX-EA. Atmos. Res. 2020, 238, 104868. [Google Scholar] [CrossRef]
  63. Huo, Z.; Dai, X.; Feng, S.; Kang, S.; Huang, G. Effect of Climate Change on Reference Evapotranspiration and Aridity Index in Arid Region of China. J. Hydrol. 2013, 492, 24–34. [Google Scholar] [CrossRef]
  64. Li, Z.; Chen, Y.; Shen, Y.; Liu, Y.; Zhang, S. Analysis of Changing Pan Evaporation in the Arid Region of Northwest China. Water Resour. Res. 2013, 49, 2205–2212. [Google Scholar] [CrossRef]
  65. Xing, W.; Wang, W.; Shao, Q.; Yu, Z.; Yang, T.; Fu, J. Periodic Fluctuation of Reference Evapotranspiration during the Past Five Decades: Does Evaporation Paradox Really Exist in China? Sci. Rep. 2016, 6, 39503. [Google Scholar] [CrossRef]
  66. Yang, Y.; Roderick, M.L.; Guo, H.; Miralles, D.G.; Zhang, L.; Fatichi, S.; Luo, X.; Zhang, Y.; McVicar, T.R.; Tu, Z.; et al. Evapotranspiration on a Greening Earth. Nat. Rev. Earth Environ. 2023, 4, 626–641. [Google Scholar] [CrossRef]
  67. Kurganova, I.; Teepe, R.; Loftfield, N. Influence of Freeze-Thaw Events on Carbon Dioxide Emission from Soils at Different Moisture and Land Use. Carbon Balance Manag. 2007, 2, 2. [Google Scholar] [CrossRef]
  68. Wang, X.; Li, F.; Zhao, S. Freeze-Thaw Regime Effects on Soil CO2 Emission: A Review. Chin. J. Soil Sci. 2022, 53, 728–737. [Google Scholar]
  69. Goulden, M.L.; Wofsy, S.C.; Harden, J.W.; Trumbore, S.E.; Crill, P.M.; Gower, S.T.; Fries, T.; Daube, B.C.; Fan, S.-M.; Sutton, D.J.; et al. Sensitivity of Boreal Forest Carbon Balance to Soil Thaw. Science 1998, 279, 214–217. [Google Scholar] [CrossRef]
  70. Mikan, C.J.; Schimel, J.P.; Doyle, A.P. Temperature Controls of Microbial Respiration in Arctic Tundra Soils above and below Freezing. Soil Biol. Biochem. 2002, 34, 1785–1795. [Google Scholar] [CrossRef]
  71. Edwards, A.C.; Creasey, J.; Cresser, M.S. Soil Freezing Effects on Upland Stream Solute Chemistry. Water Res. 1986, 20, 831–834. [Google Scholar] [CrossRef]
  72. Bo, L.; Li, Z.; Li, P.; Xu, G.; Xiao, L.; Ma, B. Soil Freeze-Thaw and Water Transport Characteristics Under Different Vegetation Types in Seasonal Freeze-Thaw Areas of the Loess Plateau. Front. Earth Sci. 2021, 9, 704901. [Google Scholar] [CrossRef]
  73. Xiao, L.; Yao, K.; Li, P.; Liu, Y.; Zhang, Y. Effects of Freeze-Thaw Cycles and Initial Soil Moisture Content on Soil Aggregate Stability in Natural Grassland and Chinese Pine Forest on the Loess Plateau of China. J. Soils Sediments 2020, 20, 1222–1230. [Google Scholar] [CrossRef]
  74. Liu, S.; Wu, J.; Li, G.; Yang, C.; Yuan, J.; Xie, M. Seasonal Freeze-Thaw Characteristics of Soil Carbon Pools under Different Vegetation Restoration Types on the Longzhong Loess Plateau. Front. Ecol. Evol. 2022, 10, 1019627. [Google Scholar] [CrossRef]
  75. Zhang, Q.; Zhu, B.; Yang, J.H.; Wang, D.W. New Characteristics about the Climate Humidification Trend in Northwest China. Chin. Sci. Bull. 2021, 66, 3757–3771. (In Chinese) [Google Scholar] [CrossRef]
  76. Han, T.; Guo, X.; Zhou, B.; Hao, X. Recent Changes in Heavy Precipitation Events in Northern Central China and Associated Atmospheric Circulation. Asia-Pac. J. Atmos. Sci. 2021, 57, 301–310. [Google Scholar] [CrossRef]
  77. Wang, C.; Zhang, S.; Li, K.; Zhang, F.; Yang, K. Change Characteristics of Precipitation in Northwest China from 1961 to 2018. Chin. J. Atmos. Sci. 2021, 45, 713–724. [Google Scholar] [CrossRef]
  78. Li, X.; Zhang, K.; Bao, H.; Zhang, H. Climatology and Changes in Hourly Precipitation Extremes over China during 1970–2018. Sci. Total Environ. 2022, 839, 156297. [Google Scholar] [CrossRef]
  79. Huang, H.; Cui, H.; Singh, V.P. Clustering Daily Extreme Precipitation Patterns in China. Water 2023, 15, 3651. [Google Scholar] [CrossRef]
  80. Yang, M.; Zhao, Y.; Wang, T. Extreme Precipitation Changes and Its Effects on Fractional Vegetation Cover in the Loess Plateau. Sci. Technol. Eng. 2024, 24, 3086–3095. [Google Scholar] [CrossRef]
  81. PAN, J.; LI, Z. Temporal-Spatial Change of Vegetation Net Primary Productivity in the Arid Region of Northwest China during 2001 and 2012. Chin. J. Ecol. 2015, 34, 3333. [Google Scholar] [CrossRef]
  82. Wei, X.; Yang, J.; Luo, P.; Lin, L.; Lin, K.; Guan, J. Assessment of the Variation and Influencing Factors of Vegetation NPP and Carbon Sink Capacity under Different Natural Conditions. Ecol. Indic. 2022, 138, 108834. [Google Scholar] [CrossRef]
  83. Xu, Y.; Zheng, Z.; Meng, Y.; Pan, Y.; Guo, Z.; Zhang, Y. Spatio-Temporal Variation in Net Primary Productivity of Different Vegetation Types and Its Influencing Factors Exploration in Southwest China. Environ. Sci. 2024, 45, 262–274. [Google Scholar] [CrossRef]
  84. Tian, H.; Lu, C.; Chen, G.; Xu, X.; Liu, M.; Ren, W.; Tao, B.; Sun, G.; Pan, S.; Liu, J. Climate and Land Use Controls over Terrestrial Water Use Efficiency in Monsoon Asia. Ecohydrology 2011, 4, 322–340. [Google Scholar] [CrossRef]
  85. Liu, Y.; Xiao, J.; Ju, W.; Xu, K.; Zhou, Y.; Zhao, Y. Recent Trends in Vegetation Greenness in China Significantly Altered Annual Evapotranspiration and Water Yield. Environ. Res. Lett. 2016, 11, 094010. [Google Scholar] [CrossRef]
  86. Shao, M.; Jia, X.; Wang, Y.; Zhu, Y. A Review of Studies on Dried Soil Layers in the Loess Plateau. Adv. Earth Sci. 2016, 31, 14–22. [Google Scholar]
  87. Keenan, T.F.; Luo, X.; Stocker, B.D.; De Kauwe, M.G.; Medlyn, B.E.; Prentice, I.C.; Smith, N.G.; Terrer, C.; Wang, H.; Zhang, Y.; et al. A Constraint on Historic Growth in Global Photosynthesis Due to Rising CO2. Nat. Clim. Chang. 2023, 13, 1376–1381. [Google Scholar] [CrossRef]
  88. Ahlström, A.; Raupach, M.R.; Schurgers, G.; Smith, B.; Arneth, A.; Jung, M.; Reichstein, M.; Canadell, J.G.; Friedlingstein, P.; Jain, A.K.; et al. The Dominant Role of Semi-Arid Ecosystems in the Trend and Variability of the Land CO2 Sink. Science 2015, 348, 895–899. [Google Scholar] [CrossRef] [PubMed]
  89. Yang, H.; Zhong, X.; Deng, S.; Xu, H. Assessment of the Impact of LUCC on NPP and Its Influencing Factors in the Yangtze River Basin, China. Catena 2021, 206, 105542. [Google Scholar] [CrossRef]
  90. Oishi, A.C.; Miniat, C.F.; Novick, K.A.; Brantley, S.T.; Vose, J.M.; Walker, J.T. Warmer Temperatures Reduce Net Carbon Uptake, but Do Not Affect Water Use, in a Mature Southern Appalachian Forest. Agric. For. Meteorol. 2018, 252, 269–282. [Google Scholar] [CrossRef]
  91. Wang, M.; Zhao, J.; Wang, S.; Chen, B.; Li, Z. Detection and Attribution of Positive Net Ecosystem Productivity Extremes in China’s Terrestrial Ecosystems during 2000–2016. Ecol. Indic. 2021, 132, 108323. [Google Scholar] [CrossRef]
  92. Fang, X.; Zhang, C.; Wang, Q.; Chen, X.; Ding, J.; Karamage, F. Isolating and Quantifying the Effects of Climate and CO2 Changes (1980–2014) on the Net Primary Productivity in Arid and Semiarid China. Forests 2017, 8, 60. [Google Scholar] [CrossRef]
  93. Liang, W.; Yang, Y.; Fan, D.; Guan, H.; Zhang, T.; Long, D.; Zhou, Y.; Bai, D. Analysis of Spatial and Temporal Patterns of Net Primary Production and Their Climate Controls in China from 1982 to 2010. Agric. For. Meteorol. 2015, 204, 22–36. [Google Scholar] [CrossRef]
  94. Feng, X.; Fu, B.; Lu, N.; Zeng, Y.; Wu, B. How Ecological Restoration Alters Ecosystem Services: An Analysis of Carbon Sequestration in China’s Loess Plateau. Sci. Rep. 2013, 3, 2846. [Google Scholar] [CrossRef] [PubMed]
  95. Zhao, F.; Wu, Y.; Yao, Y.; Sun, K.; Zhang, X.; Winowiecki, L.; Vågen, T.-G.; Xu, J.; Qiu, L.; Sun, P.; et al. Predicting the Climate Change Impacts on Water-Carbon Coupling Cycles for a Loess Hilly-Gully Watershed. J. Hydrol. 2020, 581, 124388. [Google Scholar] [CrossRef]
  96. Gao, Y.; Zhu, X.; Yu, G.; He, N.; Wang, Q.; Tian, J. Water Use Efficiency Threshold for Terrestrial Ecosystem Carbon Sequestration in China under Afforestation. Agric. For. Meteorol. 2014, 195–196, 32–37. [Google Scholar] [CrossRef]
  97. Sun, B.; Zhao, H.; Wang, X. Effects of Drought on Net Primary Productivity: Roles of Temperature, Drought Intensity, and Duration. Chin. Geogr. Sci. 2016, 26, 270–282. [Google Scholar] [CrossRef]
  98. Pei, F.; Li, X.; Liu, X.; Lao, C. Assessing the Impacts of Droughts on Net Primary Productivity in China. J. Environ. Manag. 2013, 114, 362–371. [Google Scholar] [CrossRef]
  99. Turner, D.P.; Ritts, W.D.; Cohen, W.B.; Gower, S.T.; Running, S.W.; Zhao, M.; Costa, M.H.; Kirschbaum, A.A.; Ham, J.M.; Saleska, S.R.; et al. Evaluation of MODIS NPP and GPP Products across Multiple Biomes. Remote Sens. Environ. 2006, 102, 282–292. [Google Scholar] [CrossRef]
  100. Wang, Y.; Li, R.; Hu, J.; Wang, X.; Kabeja, C.; Min, Q.; Wang, Y. Evaluations of MODIS and Microwave Based Satellite Evapotranspiration Products under Varied Cloud Conditions over East Asia Forests. Remote Sens. Environ. 2021, 264, 112606. [Google Scholar] [CrossRef]
Figure 1. Technology flowchart.
Remotesensing 16 03312 g001
Figure 2. (a) An overview of the MRYR; (b) land cover (2012).
Remotesensing 16 03312 g002
Figure 3. Characteristics of interannual changes in climate elements in MRYR from 2001 to 2022. (a) TEM: temperature, PRE: precipitation, ETa: actual evapotranspiration, and PET: potential evapotranspiration; (b) DSI: drought severity index.
Remotesensing 16 03312 g003
Figure 4. Mean distribution of climatic elements in MRYR, 2001–2022. (a) PRE: precipitation; (b) TEM: temperature; (c) ETa: actual evapotranspiration; and (d) PET: potential evapotranspiration.
Remotesensing 16 03312 g004
Figure 5. DSI for dry and wet years. (a) DSI 2001 (driest year); (b) DSI 2021 (wettest year).
Remotesensing 16 03312 g005
Figure 6. Interannual variation in NEP, WUE, and CUE in MRYR and under different land types, 2001–2022. (ae) Represent MRYR grasslands, croplands, shrubs, and forests, respectively.
Remotesensing 16 03312 g006
Figure 7. Spatial distribution of mean NEP (a), WUE (b), and CUE (c), 2001–2022.
Remotesensing 16 03312 g007
Figure 8. Spatial trends and significance tests for NEP, WUE, and CUE, 2001–2022. (ac) Trends; (df) corresponding significance tests.
Remotesensing 16 03312 g008
Figure 9. Interannual anomalies in NEP, WUE, CUE, and climate elements for different land covers in the MRYR, 2001–2022. (ad) Grasslands, croplands, shrubs, and forests, respectively.
Remotesensing 16 03312 g009
Figure 10. Spatial distribution of correlations of NEP, WUE, and CUE with climate variables. (ac) Correlations of NEP, WUE, and CUE with PRE, respectively; (df) correlations with TEM; and (gi) correlations with DSI.
Remotesensing 16 03312 g010
Figure 11. Significance analysis of the correlations between NEP, WUE, CUE, and climate variables in the MRYR.
Remotesensing 16 03312 g011
Figure 12. (a) Land transfer distribution map, 2001–2022; (b) land transfer flow map, 2001–2022.
Remotesensing 16 03312 g012
Figure 13. (a): Time-varying characteristics of RH and GPP, 2001–2022. (b) Characteristics of temporal changes in precipitation and temperature, 2001–2022. (c) Characteristics of temporal changes in RH in region with winter temperatures >0 °C and ≤0 °C, 2001–2022.
Remotesensing 16 03312 g013
Figure 14. Spatial distribution of mean values of NPP (a) and RH (b) in MRYR, 2001–2022.
Remotesensing 16 03312 g014
Table 1. Data details and sources.
DataSourceTime ResolutionSpatial ResolutionDownload Site
Land coverNational Cryosphere Desert Data CentreAnnual30 mhttp://www.ncdc.ac.cn/portal/
(accessed on 1 April 2024)
PRE and TEMNational Tibetan Plateau Science Data CenterMonthly1 kmhttp://data.tpdc.ac.cn/
(accessed on 1 April 2024)
ETa and PETMOD16A28 days500 mhttps://earthengine.google.com/
(accessed on 1 April 2024)
NDVIMOD13A116 days500 m
GPPMOD17A2H8 days500 m
NPPMOD17A2HAnnual500 m
Table 2. DSI classification.
FormDegree (Level or Extent)DSI
D5Extreme drought<−1.50
D4Severe drought−1.50–−1.20
D3Moderate drought−1.19–−0.90
D2Mild drought−0.89–−0.60
D1Incipient drought−0.59–−0.30
WDNear normal−0.29–0.29
W1Incipient wet0.30–0.59
W2Slightly wet0.60–0.89
W3Moderately wet0.90–1.19
W4Very wet1.20–1.50
W5Extremely wet>1.50
Table 3. NEP/WUE/CUE-related research.
StudyModel UsedLocationStudy PeriodKey Results
Zhang et al. [48] NEP = NPP − RHYellow River Basin2000–2020
(1)
The total amount of NEP shows a general upward trend;
(2)
There is uncertainty about the development of NEP.
Wang et al. [44]NEP = NPP − RHQilian Mountains (QLM)2000–2020
(1)
The NEP in the QLM significantly increased during the study period;
(2)
Natural environmental factors (e.g., elevation and soil type) and climatic factors (e.g., temperature and precipitation) are the main determinants of the spatial distribution of NEP.
Li et al. [45]Vegetation production model; NEP = NPP − RHChina Grassland2010–2020
(1)
China’s grassland ecosystem’s cumulative carbon sequestration from 2010 to 2020 was 14.46 PgC;
(2)
Precipitation promotes NEP, while temperature does the opposite.
Zhang et al. [8]CASA model; NEP = NPP − RH Central Asia2001–2019
(1)
NEP is more sensitive to temperature and decreases with increasing temperature;
(2)
Temperature contributes more to NEP than precipitation.
Yang et al. [49]WUE = GPP/ETa; BESS modelGlobal 2000–2014
(1)
Coupling the carbon–water cycles into RS-based models can improve their performance in global WUE estimation.
Tang et al. [50] WUE = GPP/ETaHeihe River Basin2013–2015
(1)
MODIS WUE captures trends in grassland WUE.
Gang et al. [51]WUE = NPP/ETa; CUE = NPP/GPPNorthern China2000–2011
(1)
The CUE and WUE of the forests in Northern China have been more affected by recent droughts than the grasslands;
(2)
Compared to the grasslands, the forest CUE and WUE are more sensitive to drought.
Du et al. [52]CUE = NPP/ETaNingxia2001–2017
(1)
The decrease in CUE is mainly caused by land use changes;
(2)
Water stress and heat stress increase CUE during ecosystem processes, but temperature affects different ecosystems differently.
He et al. [53]CUE = NPP/GPP; Process-based carbon cycle modelsGlobal 2000–2012
(1)
The process-based model yields a global average CUE of 0.45, slightly lower than the MODIS data of 0.48.
CASA: Carnegie–Ames–Stanford approach; BESS: Breathing Earth System Simulator.
Table 4. Major land type transformations and their impact on NEP.
LUCC (2001–2022)Area/km2Percentage of ChangeCumulative PercentageChange in NEP/Tg (1 Tg = 1012 g)
Cropland–Grassland21,592.8631.91%31.91%3.25
Grassland–Cropland18,064.2626.69%58.60%5.15
Grassland–Forest10,166.1115.02%73.63%4.54
Cropland–Impervious5306.007.84%81.47%−0.40
Cropland–Forest3824.115.65%87.12%1.49
Barren–Grassland3340.924.94%92.05%0.754
Forest–Cropland1407.192.08%94.13%0.096
Disclaimer/Publisher’s Note: The statements, opinions and data contained in all publications are solely those of the individual author(s) and contributor(s) and not of MDPI and/or the editor(s). MDPI and/or the editor(s) disclaim responsibility for any injury to people or property resulting from any ideas, methods, instructions or products referred to in the content.

