Review

Methodology for Performing Bathymetric and Photogrammetric Measurements Using UAV and USV Vehicles in the Coastal Zone

Department of Transport and Logistics, Gdynia Maritime University, Morska 81-87, 81-225 Gdynia, Poland
Remote Sens. 2024, 16(17), 3328; https://doi.org/10.3390/rs16173328 (registering DOI)
Submission received: 15 May 2024 / Revised: 10 August 2024 / Accepted: 19 August 2024 / Published: 8 September 2024

Abstract

:
The coastal zone is constantly exposed to marine erosion, rising water levels, waves, tides, sea currents, and debris transport. As a result, there are dynamic changes in the coastal zone topography, which may have negative effects on the aquatic environment and humans. Therefore, in order to monitor the changes in landform taking place in the coastal zone, periodic bathymetric and photogrammetric measurements should be carried out in an appropriate manner. The aim of this review is to develop a methodology for performing bathymetric and photogrammetric measurements using an Unmanned Aerial Vehicle (UAV) and an Unmanned Surface Vehicle (USV) in a coastal zone. This publication shows how topographic and bathymetric monitoring should be carried out in this type of zone in order to obtain high-quality data that will be used to develop a Digital Terrain Model (DTM). The methodology for performing photogrammetric surveys with the use of a drone in the coastal zone should consist of four stages: the selection of a UAV, the development of a photogrammetric flight plan, the determination of the georeferencing method for aerial photos, and the specification as to whether there are meteorological conditions in the studied area that enable the implementation of an aerial mission through the use of a UAV. Alternatively, the methodology for performing bathymetric measurements using a USV in the coastal zone should consist of three stages: the selection of a USV, the development of a hydrographic survey plan, and the determination of the measurement conditions in the studied area and whether they enable measurements to be carried out with the use of a USV. As can be seen, the methodology for performing bathymetric and photogrammetric measurements using UAV and USV vehicles in the coastal zone is a complex process and depends on many interacting factors. The correct conduct of the research will affect the accuracy of the obtained measurement results, the basis of which a DTM of the coastal zone is developed. Due to dynamic changes in the coastal zone topography, it is recommended that bathymetric measurements and photogrammetric measurements with the use of UAV and USV vehicles should be carried out simultaneously on the same day, before or after the vegetation period, to enable the accurate measurement of the shallow waterbody depth.

1. Introduction

The coastal zone, i.e., the area encompassing the seashore and adjacent parts of the land and sea, is of particular importance from the point of view of ecological and economic policy in coastal states, due to the fact that it is rich in natural resources. This means that approx. 50% of the world’s population lives in areas located within 100 km from the coastline [1]. For this reason, it is necessary to conduct continuous bathymetric monitoring and predict dynamic changes in the coastal zone topography [2].
The existing methods for carrying out geodetic and hydrographic surveys in the coastal zone are neither highly accurate nor reliable, due to the small coverage of the coastal strip and the lack of actual measurement data in this area. Hence, as part of the INNOBAT project [3], it was decided to develop an integrated system using autonomous unmanned aerial and surface vehicles intended for bathymetric monitoring in the coastal zone. It allows the seabed topography to be surveyed in accordance with the requirements set out for the second most stringent order of hydrographic surveys, namely the International Hydrographic Organization (IHO) Special Order (horizontal position error ≤ 2 m (p = 0.95), vertical position error ≤ 0.25 m (p = 0.95)) [4]. The INNOBAT system enables an accurate and precise determination of the entire relief of the coastal zone based on the data acquired by a camera, a Light Detection And Ranging (LiDAR) and a Global Navigation Satellite System (GNSS)/Inertial Navigation System (INS), which are mounted on an Un-manned Aerial Vehicle (UAV), as well as by a GNSS Real Time Kinematic (RTK) receiver and a MultiBeam EchoSounder (MBES), which are installed on an Unmanned Surface Vehicle (USV). LiDAR data allow a digital land area model to be developed. The aerial photos taken by these cameras enable the determination of the coastline, as well as the determination of the waterbody depth between the coastline and the minimum isobath, recorded by an echo sounder mounted on the USV. The remaining part of the seabed is surveyed by an integrated hydrographic system (GNSS/RTK receiver and MBES) mounted on the USV. Further on in the process, geospatial data integration methods are employed to develop a final Digital Terrain Model (DTM) of the coastal zone. The model generated in this manner enables the assessment of the hydrographic and navigation conditions of a shallow waterbody (Figure 1) [3,5]. In order to achieve the intended measurement accuracy, hydrographic surveys using unmanned vehicles in the coastal zone should be carried out in a strictly defined manner. Therefore, it is necessary to develop a methodology for acquiring bathymetric and photogrammetric data using autonomous unmanned aerial and surface measurement platforms in the coastal zone.
This publication is structured as follows: in Section 2, entitled “Materials and Methods”, the factors influencing the methodology for performing bathymetric and photogrammetric measurements using UAV and USV vehicles in the coastal zone are discussed in detail. In Section 3, entitled “Results”, a diagram of the methodology for carrying out this type of research is presented. In Section 4, entitled ”Discussion”, the most relevant publications regarding the methodology for performing bathymetric and photogrammetric measurements in the coastal zone are described. The review ends with conclusions, summarising the research.

2. Materials and Methods

2.1. Methodology for Performing Photogrammetric Surveys Using a UAV in the Coastal Zone

2.1.1. Selection of a UAV

UAVs are commonly used measurement platforms for acquiring photogrammetric data. Digital cameras or laser scanners (LiDAR) combined with GNSS/INS systems have become very popular. This combination allows very precise georeferencing of the photos or scans taken, which consequently enables the development of an accurate photogrammetric compilation. Given the multitude of aerial drones available on the market, it is easy to find a UAV in a very wide price range and then to adjust it to one’s needs [6,7,8].
As for the drones used for surveys, two types of technological solutions can be distinguished. The first one involves the measurement equipment forming an integral part of a UAV, while the second solution involves the use of separate modules incorporating survey instruments.
As regards aerial drones with integrated measurement equipment, popular solutions are UAVs equipped with a camera, LiDAR or the GNSS/INS system. The NEXUS 800, manufactured by HYPACK, can be mentioned here, as an example. Both a digital camera and a LiDAR, coupled with the GNSS/INS system, are mounted on this drone. The essence of its operation is the integration of photogrammetric data from the camera and the LiDAR, followed by their processing using the specialised hydrographic HYPACK software [9].
The second solution, gaining in popularity, is the use of separate modules incorporating measurement equipment, which enables the complete separation of a UAV from the research apparatus. The survey modules described here can interact with any aerial drone that satisfies certain criteria, such as the maximum working load limit and appropriate load space dimensions. This solution is more versatile, as it enables the use of a single UAV for a variety of measurement purposes, depending on the module being installed [10].
An example of the application of such a solution is the INNOBAT optoelectronic module. The module comprises nine components: a camera, a communication module, a gimbal, GNSS/INS system, Internet modem, LiDAR, a module supporting camera and gimbal control, a power control module, and a single-board computer. The aforementioned components weigh approx. 5 kg, which represents the minimum working load limit of a UAV interacting with the INNOBAT system [2].
In order to select a UAV that can serve as a carrier of measurement modules, a number of criteria and factors that directly relate to its ability to perform the aerial mission correctly must be taken into consideration. The most important parameters to consider when choosing an aerial drone include the physical requirements related to the space available in terms of the load and the maximum weight, enabling the UAV to fly safely. The weight of survey modules is determined by the components incorporated and usually range from 2 to 5 kg. For this reason, the vast majority of UAVs available on the market will not be able to carry out flights with advanced professional measurement instruments [11].
The weight criterion is closely linked to the maximum flight time, based on a single battery. This parameter is important in terms of the mission duration and whether or not a flight based on a single battery enables the entire mission, or a part, to be completed. Figure 2 shows the dependence of the flight time on the weight of the load being carried for selected mass-produced UAVs [10].
It can be seen from Figure 2 that the flight time decreases with a gradual increase in the load weight. With the maximum load applied to a UAV, its flight time is reduced by approx. 50% in relation to a flight performed without load. Both the flight duration and the power output of the receivers and transmitters on the drone and ground station determine the flight range. This parameter is particularly important in a situation where the operator is required to stay in a specific location, while the UAV needs to perform the flight along profiles that are distant from it.

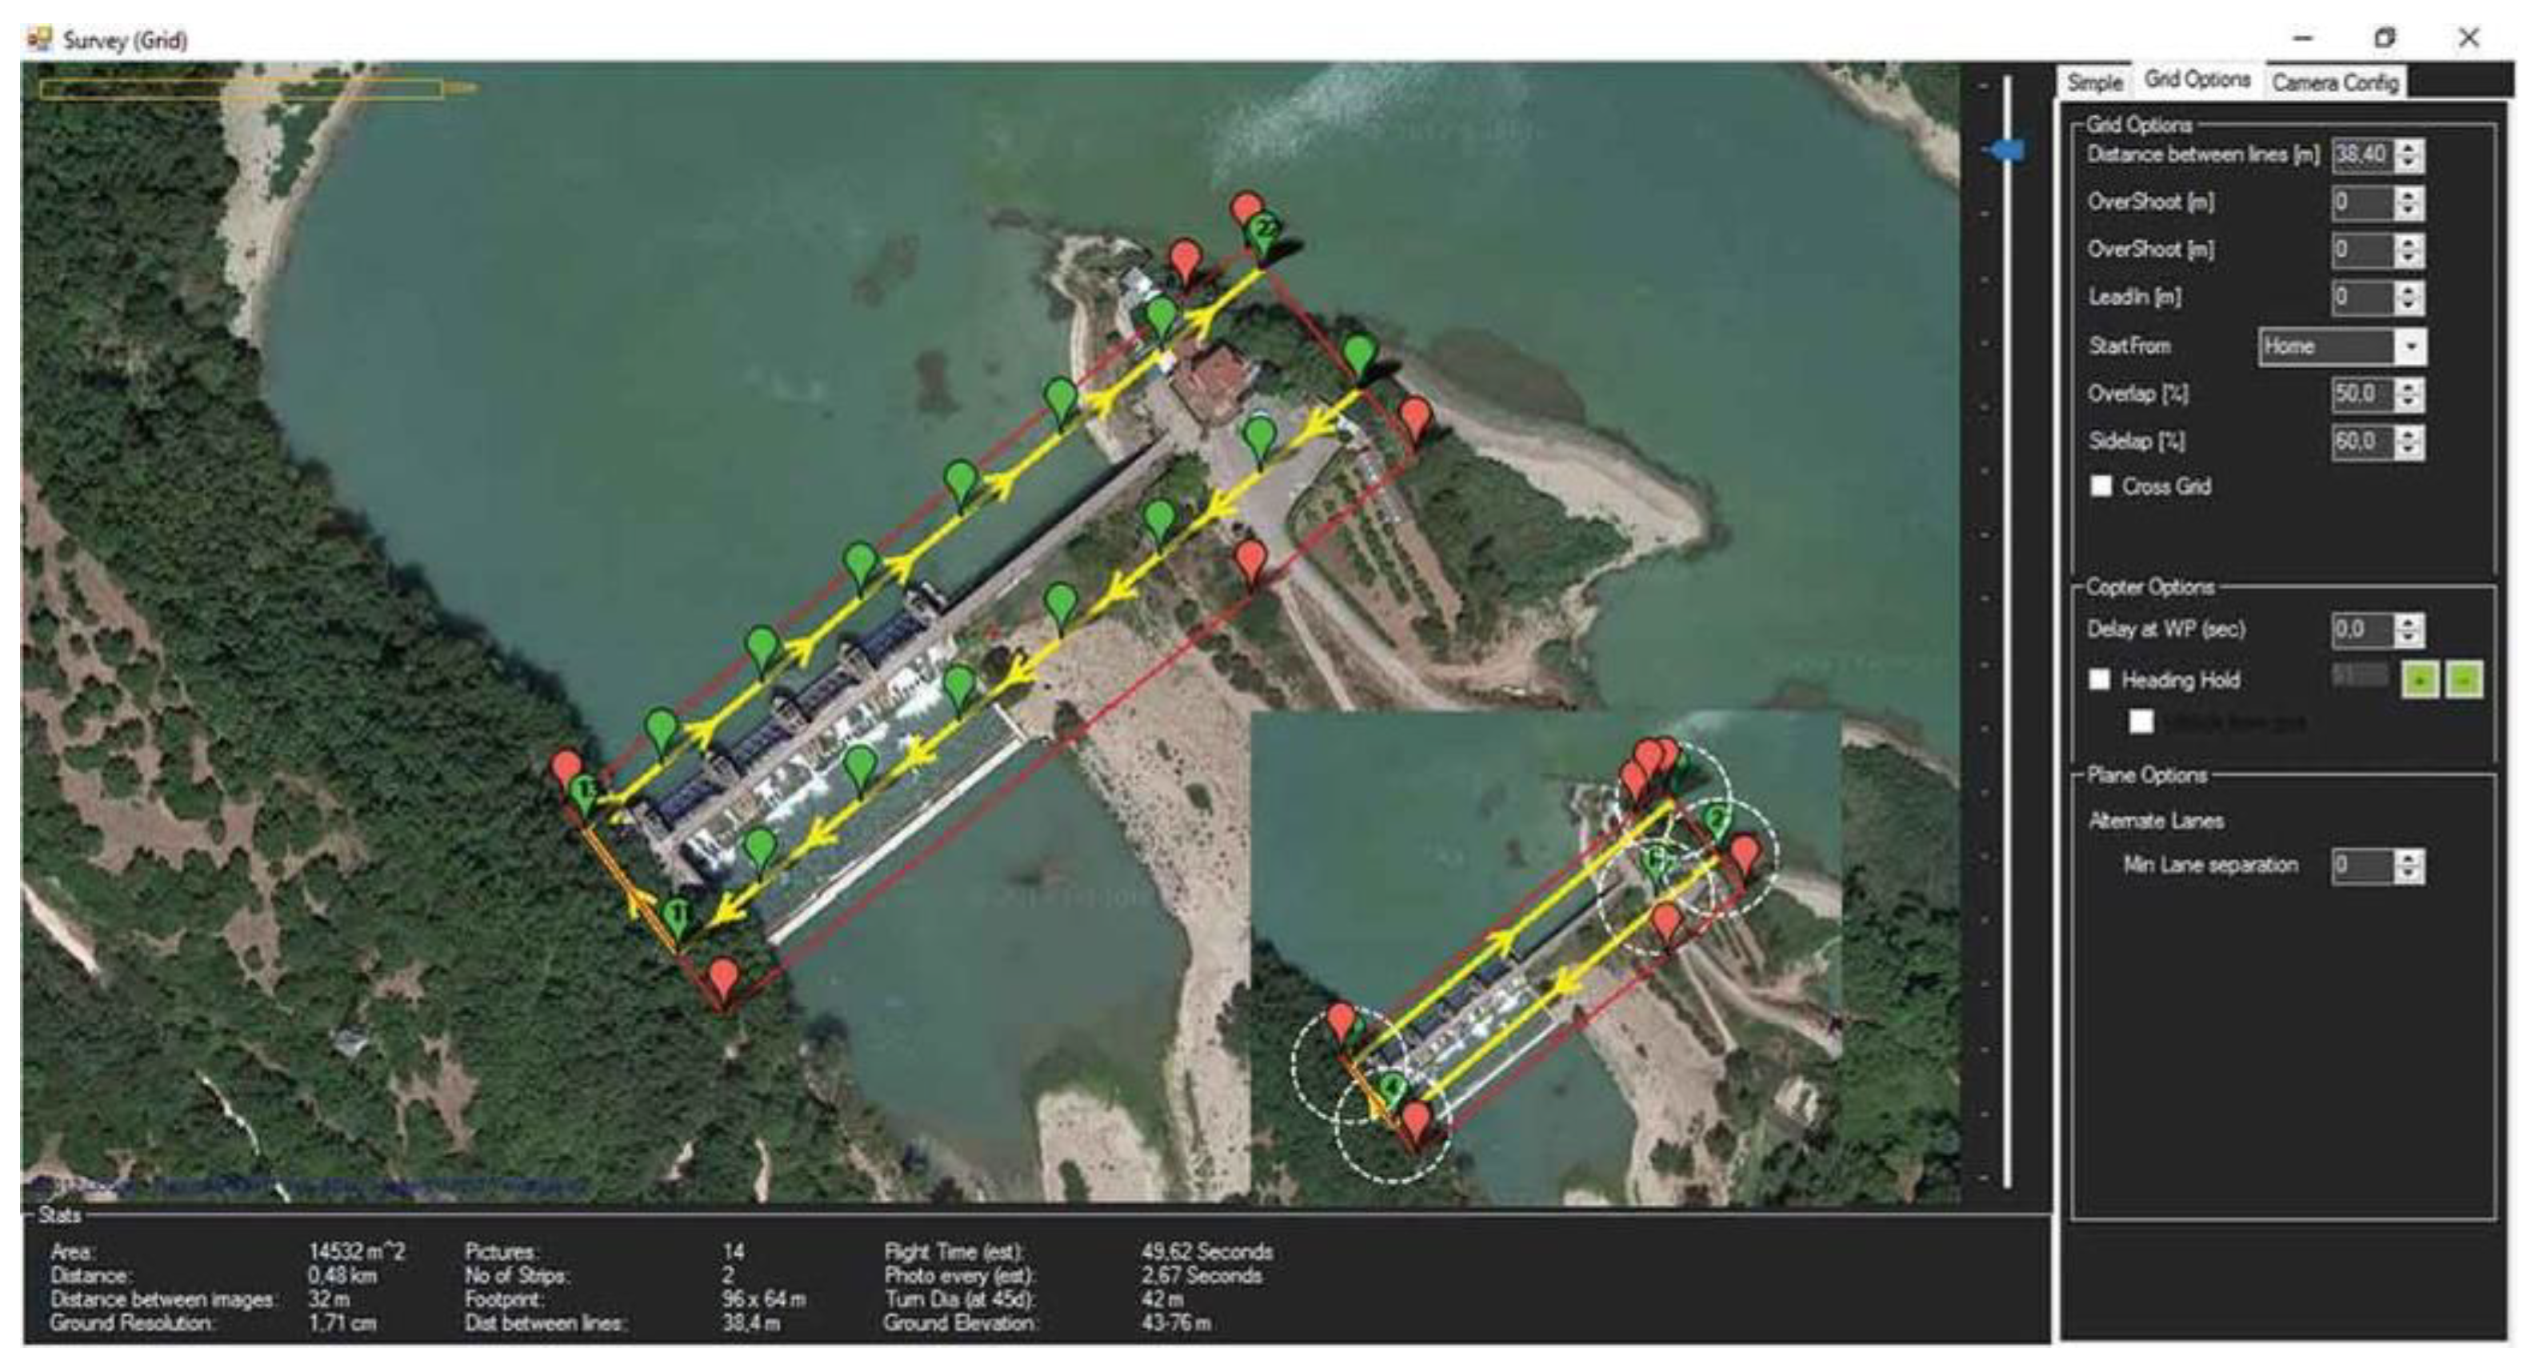
2.1.2. Photogrammetric Flight Plan

The quality of a photogrammetric compilation (DTM or orthophotomap for the coastal zone) is affected by the geometric parameters of the photos taken by an aerial vehicle. Therefore, the performance of photogrammetric surveys using drones should be based on a photogrammetric flight plan containing all the technical information on the planned flight, as follows (Figure 3) [12,13,14]:
  • Determination of the type of aerial photos and the method for triggering them;
  • Calculation of the Ground Sampling Distance (GSD);
  • Determination of the flight altitude of a UAV;
  • Selection of the longitudinal and transverse coverage of aerial photos;
  • Calculation of the minimum distance between flight profiles;
  • Determination of the flight speed of a UAV.
Figure 3. Geometric parameters of a set of photos taken from a low altitude by a UAV. Own study based on: [15].
Remotesensing 16 03328 g003
where
Bx is the distance between points in space from which adjacent photos in a row were taken,
By is the distance between the axes of adjacent rows,
f is the camera focal length,
I is the length of the side of the photo,
L is the field range of the photo,
Pm is the terrain surface covered by one stereogram (two photos of an object taken from different points in space),
Pn is the new surface (terrain increment) covered by each subsequent photo,
H is the shooting height.
The coastal zone is an area usually characterised by flat and horizontal topography. Therefore, photos taken from a low altitude by a UAV should feature a vertical orientation of the camera axis and a horizontal orientation of the plate frame. However, it should be noted that images of this type cannot be taken in practice. Thus, aerial photos should be near vertical, which means that the axis should deviate from the vertical line by 0.5° for a suspended camera without stabilisation, or by 1–1.5° for a suspended camera with stabilisation. However, in areas with varied terrain or in areas covered by shadow, it is recommended to take tilted images, the axis of which is deviated from the vertical line by more than 3°, or oblique photos, the axis of which is tilted along the vertical line by such an angle that the horizon line is visible in the camera’s Field of View (FoV). This allows for better “insight” into the area [15,16]. When taking aerial photos, the camera should be levelled, e.g., using an image stabiliser (gimbal), and its sides should be oriented along the flight direction.
Nowadays, aerial photos can be triggered by a camera in two ways. The first of them involves triggering the camera shutter at specified time intervals, e.g., every few seconds. In order to provide the assumed longitudinal coverage of images taken in a row, the flight speed must be adjusted to the camera’s shutter-triggering capabilities, so that the centre of the photos in adjacent rows, as well as the corresponding stereograms and the zones of the triple image coverage, correspond to each other. This method for triggering aerial photos is increasingly less commonly used in photogrammetric surveys. An alternative solution that is commonly used nowadays is the triggering of the camera’s shutter at pre-planned locations in space. Aerial images taken in this way are referred to as targeted photos. Thanks to the GNSS/INS system, it is possible to trigger the camera’s shutter in such a manner that the centre of the photos in adjacent rows, as well as the corresponding stereograms and the zones of the triple image coverage, correspond to each other [15].
Nowadays, the vast majority of photogrammetric missions are carried out using digital cameras. Therefore, the main qualitative parameter for evaluating photos is the GSD and not the scale of the images, like when using analogue cameras. The field pixel size is the distance between field points, represented by the centres of neighbouring pixels in a digital image. A photogrammetric flight plan is mainly designed according to the GSD. For the purpose of high-resolution photogrammetric compilations, it is assumed that the field pixel size should be approx. 2–3 cm. The GSD can be calculated using the following formula [17]:
G S D = H w f i w ,
where
GSD is the ground sampling distance,
w is the camera sensor width,
iw is the photo width.
When designing a photogrammetric pass, the flight altitude also needs to be determined. During bathymetric and topographic measurements in the coastal zone using a UAV, it was verified that the aerial photos used to create a point cloud for a water area using the Structure-from-Motion (SfM) method must be taken from the highest permissible flight altitude. This is due to the fact that the so-called tie points, i.e., characteristic points in the land or artificially signalled points, must be visible in the images in order for the SfM algorithm to be able to merge these photos together [18,19]. Aerial photos, in which only water is visible, while the tie points are not, cannot be merged together and, therefore, they will not be used in the process of generating a point cloud using the SfM technique. The effect of the flight altitude and the number of tie points on the density of a point cloud developed for the coastal zone located at the Vistula Śmiała River mouth in Gdańsk is shown in Figure 4. The 3D point clouds were generated using the Pix4Dmapper software.
It can be seen from Figure 4a that the point cloud generated based on aerial photos taken at an altitude of 70 m enables a low level of coverage of the seabed, with the collected measurements. The density of the 3D point cloud may also have been affected by the small number of artificially signalled points (7) that were distributed along the coastline. It can be seen from Figure 4b that the point cloud generated based on aerial images taken at the maximum permissible altitude of 120 m enables full coverage of the seabed with measurements at depths not exceeding 1 m. Obtaining such a dense 3D point cloud was not only possible due to the flight altitude, but also thanks to the large number of artificially signalled points (23) that were evenly distributed (approx. every 10 m) along the coastline. In addition, it should be noted that both the generated point clouds are dense in the land part of the coastal zone.
The issue of the altitude at which UAVs can fly is governed by EU legislation and addressed in Commission Delegated Regulation (EU) 2019/945 of 12 March 2019 on unmanned aircraft systems and on third-country operators of unmanned aircraft systems [20], as well as in Commission Implementing Regulation (EU) 2019/947 of 24 May 2019 on the rules and procedures for the operation of unmanned aircraft [21]. It follows from the abovementioned legislation that the maximum permissible flight altitude using an aerial drone is 120 m when performing an open category operation, or more than 120 m when performing a specific/certified category operation.
When carrying out photogrammetric surveys using UAVs to take high-resolution aerial photos, it is recommended that the flight altitude does not exceed 120 m. This is due to the fact that the GSD increases with an increase in the flight altitude. As regards photogrammetric surveys using LiDAR technology, aimed at surveying the relief of the land part of a coastal zone, it is recommended that the flight altitude is lower than that for taking aerial images. This height is determined by the operating range of the laser scanner. For example, the Velodyne VLP-16 Lite LiDAR system, commonly used in photogrammetry, has an operating range of 100 m [22,23]. Therefore, the flight altitude using this laser scanner must be lower than its range of operation.
When designing a photogrammetric flight, the longitudinal and transverse coverage of the aerial photos, among other things, need to be determined. The coverage of images is the common part of successive photos taken in a row, i.e., along the flight axis (longitudinal coverage), and the common part of images located in adjacent rows (transverse coverage) (Figure 5). The longitudinal and transverse coverage of aerial photos can be calculated using the following formulas [24,25]:
o f o r w a r d = 1 d f o r w a r d f H w 100 % ,
o s i d e = 1 d s i d e f H w 100 % ,
where
oforward is the longitudinal coverage of photos,
oside is the transverse coverage of photos,
dforward is the distance between successive photos,
dside is the distance between flight profiles [26].
Figure 5. Graphic interpretation of the longitudinal and transverse coverage of aerial photos [17].
Remotesensing 16 03328 g005
For the purpose of high-resolution photogrammetric compilations, it is assumed that the longitudinal coverage of the photos should be at least 70–90%, while the transverse coverage of the images should not be less than 60–80% [27,28]. It should be noted that in the coastal zone, flight profiles should be oriented both perpendicular and parallel to the coastline course.
When the longitudinal coverage of the photos (oforward), the camera height above ground level (H), and selected technical parameters of the camera (w and f) are known, the minimum distance between the flight profiles (dforward) can be calculated using the following relationship [17]:
d f o r w a r d = 100 % o f o r w a r d H w f .
The last parameter to be determined before commencing a photogrammetric flight is its speed. It follows from a literature review [14,29,30,31] that photogrammetric flights using UAVs can be carried out at speeds of up to 50–70 km/h. On the other hand, typical speeds at which photogrammetric surveys are carried out using aerial drones range from 20 to 30 km/h [17].
To design a photogrammetric flight (the type of photos and method for their triggering, GSD, flight altitude, longitudinal and traverse coverage of the images, distance between the profiles, and the UAV’s speed), software for planning aerial missions using aerial drones can be used. Most software of this type allow survey profiles to be designed based on the measurement area that is visualised in an orthophotomap. The most commonly used software for planning photogrammetric surveys and monitoring the UAV’s position in real-time include DJIFlightPlanner, Mission Planner (Figure 6) [32], PIX4Dcapture Pro, or QGroundControl.

2.1.3. Georeferencing Aerial Photos

When carrying out photogrammetric surveys, aerial photos are geometrically tied to the control network during the aerotriangulation process. To make this possible, it is necessary to know the three-dimensional geodetic coordinates of the points forming the control network, the so-called photopoints. The control network that is created for the purpose of photogrammetric compilations is referred to as the photogrammetric control network. This control network is made up of photopoints that can be clearly identified in the aerial photos taken [33,34].
For the purpose of photogrammetric compilations, the control network should consist of special signal marks or natural photopoints that can be clearly identified in aerial photos. The dimensions of the points that make up the photogrammetric control network are largely determined by the GSD. When carrying out photogrammetric surveys from a low altitude, it is advisable to use square signal marks (with a 20 or 30 cm side) that contrast with the background. These marks can be painted in a chequered pattern, with fields alternating between light (white or yellow) and dark (navy blue or black). It should be noted that the signal marks should be painted centrically in relation to the control mark, which is usually its geometric centre [35].
In the coastal zone, photopoints should be distributed evenly along the coastline of the waterbody under survey, in such a manner that they are visible in the zones of the triple image coverage. This enables multiple projections of a photopoint in aerial photos [36,37]. The points that make up the photogrammetric control network should be located in exposed locations, on flat ground, and in close proximity to the shore, so that they are not shifted by the wave action occurring in the surf zone in open waterbodies.
After creating the photogrammetric control network, the position coordinates of this control network should be determined by geodetic methods, e.g., real-time satellite positioning methods, in which the position coordinates are determined on an ongoing basis by a GNSS receiver [38,39]. Kinematic measurement methods include the RTK technique and the increasingly common Real Time Network (RTN). The RTN method involves the development of correction data based on observations from not a single reference station, as in the case of the RTK technique, but from at least several reference stations. Its advantage is that the position error does not increase with the distance from the station (even up to 70–80 km) and that the results obtained are not worse than those generated from regular RTK measurements. The position accuracy achieved by the abovementioned satellite techniques is several centimetres and is mainly determined by the Dilution Of Precision (DOP), which describes the instantaneous distribution of GNSS constellations in the sky [40]. The second group of geodetic methods is the rapid topographic measurement method, known as tacheometry. The tacheometric method involves the determination of the position of a point based on the survey of horizontal and vertical angles, as well as distances, usually carried out using a total station. This method is characterised by a high (millimetre) level of position accuracy [41,42].
It should be noted that some modern UAVs are equipped with integrated GNSS/INS systems that accurately determine the orientation parameters of the external camera taking aerial photos. In this case, it is not necessary to create a photogrammetric control network, but the direct georeferencing process should be carried out [43,44].
Direct georeferencing involves a direct survey of the external orientation of the camera without using photopoints [45]. For this purpose, it is necessary to determine the spatial and temporal relationships between three devices: the camera, the GNSS antennas, and the Inertial Measurement Unit (IMU) [46]. The direct georeferencing process involves the transformation of the vector of the image point in the camera system (rc) into a vector of the i-th field point in the geodetic coordinate system ( r i m ) [15,47]:
r i m = r G N S S / I N S m t + R b m t λ i R c b r c + a b ,
where
r i m is the vector of the i-th field point in the geodetic coordinate system,
t is the moment the photo was taken,
r G N S S / I N S m t is the vector of the IMU’s position in the geodetic coordinate system at the moment the photo is being taken,
R b m t is the rotation matrix of the IMU in the geodetic coordinate system at the moment the photo is being taken,
λi is the scale factor of the image of the i-th point in the photo,
R c b is the rotation matrix between the camera system and the IMU,
rc is the vector of the image point in the camera system (plate coordinates of the point and the focal length),
ab is the vector of the IMU’s centre in relation to the centre of the camera projections.
There are four unknowns in Formula (5): the three-dimensional coordinates of the i-th field point ( r i m ), and the scale factor of the image at this point in the photo (λi). The depiction of a point in a single image allows a system of three equations, with four unknowns, to be written down. In order to solve it, a second photo, in which the depicted point will be visible, must be taken. This results in three more equations and one unknown (a new scale factor). With a system of five equations with six unknowns, it is possible to determine a vector of the i-th field point in the adjustment process [15].
In order to develop a photogrammetric product, each aerial photo must contain information on its orientation (three coordinates, namely X0, Y0, Z0, and three angles of rotation, namely ω, ϕ, κ). At the moment the camera shutter is triggered, the linear elements of the camera’s external orientation, i.e., the coordinates of the camera’s projection centres, must be measured. In addition, it is necessary to determine the camera’s inclination angles. To measure all six elements of the camera’s external orientation (geotagging), GNSS systems integrated with INS systems can be used. The integration of GNSS and INS systems enables the determination of the position and orientation by continuously measuring, along three orthogonal axes, the linear acceleration values and the angular components of the course. Normally, aerial images, along with georeferenced data, are saved as metadata in the Exchangeable Image File Format (EXIF).
It should be noted that GNSS antennas and the IMU are found at a certain distance from the centre of camera projections. In addition, the axes of the camera and IMU spatial system are rotated in relation to the camera coordinate system. Therefore, in order to correctly determine the external orientation elements of the photos, it is necessary to determine the geometric relationship between individual devices before starting to carry out photogrammetric surveys. The GNSS/INS systems that receive RTK and RTN corrections help provide geocoded photos, whose position accuracy is a few centimetres, and the angle accuracy is at a level of 0.005–0.01°. Such positioning solutions completely eliminate the need to carry out aerotriangulation [15,47].

2.1.4. Meteorological Conditions

Before starting to carry out photogrammetric surveys in the coastal zone, it is necessary to determine whether meteorological conditions, which enable the implementation of an aerial mission using a UAV, are present in relation to the waterbody under survey. The main parameters that determine the feasibility of photogrammetric surveys using a drone and their quality include the illumination value, the ratio between direct and diffuse illumination, and the position of the Sun, as well as the weather conditions [48].
Solar energy is absorbed and diffused as it passes through the atmosphere. This is due to the fact that the atmosphere is not an optically neutral environment, as it contains gas molecules and water vapour, as well as dust, which cause the partial absorption and diffusion of luminous energy. The atmospheric transparency coefficient value is largely determined by the wavelength. Based on Figure 7a, it should be concluded that the atmosphere is almost completely opaque for wavelengths not exceeding 300 nm. It can then be observed that the atmospheric transparency coefficient value increases rapidly with an increase in the wavelength. The value of this parameter at the boundary of the visible spectrum (λ = 400 nm) is 0.58, while for the Near InfraRed (NIR) range (λ = 900 nm), its value reaches almost 0.90. The significant attenuation of shortwave radiation and, to a much lesser extent, of longwave radiation, is due to the phenomenon of light diffusion in the atmosphere [48].
It can be seen in Figure 7b that the value of the atmospheric transparency coefficient shows seasonal fluctuations. During spring and summer (from March to June), the transparency of the atmosphere in the wavelength range of 400–600 nm decreases significantly. Therefore, taking this parameter into account, it is preferable to take aerial photos from a low altitude, using a UAV, from September to October. However, it is important to bear in mind that due to changes in the height of the Sun above the horizon, the time available for taking images during the day is limited. World statistics show that the global average flight of a drone is 5.7 h during the day, or 2.0 h during sunshine hours [49].
The direct illumination of objects on the Earth’s surface is determined by the atmospheric transparency and the Sun’s height over the horizon. The graphical relationship between the illumination of the Earth’s surface and the Sun’s height above the horizon is shown in Figure 8. It should be noted that these data refer to the summer season and central European conditions.
Based on Figure 8, it can be observed that the illumination intensity is mainly determined by the state of the atmosphere and the height of the Sun over the horizon. Therefore, when taking aerial photos from a low altitude using a UAV, the Sun’s height over the horizon should be no less than 25° and no more than 60°. It should also be noted that the illumination value varies for objects located in the shade (illuminated only by reflected and diffused light) and in the Sun (illuminated by direct sunlight). Large contrasts can be observed in cloudless weather and high Sun that occurs during the midday hours. In such a situation, the illumination of an object in the shade and in the Sun can differ by up to seven times. Such significant contrast has an adverse effect on the quality of the obtained images. Hence, it is advisable to take aerial photos in the presence of high clouds, which increase the proportion of diffused light, thus considerably reducing contrasts [48].
When carrying out photogrammetric surveys in the coastal zone, it is advisable to use a polarising filter on the camera. This filter only transmits light that is linearly polarised in a selected direction, which results in the light diffused in the atmosphere (haze) being partially absorbed by it, which is evident when photographing the sky. A polarising filter enables an increase in the colour saturation of opaque surfaces (e.g., the green of plants) and a reduction in reflections from transparent surfaces (e.g., the water surface) [50,51]. Based on the experience gained when carrying out photogrammetric surveys using a UAV in the coastal zone, it was found that the use of a polarising filter on the camera allowed a more dense point cloud to be obtained for a water area.
Another factor that determines the feasibility of an aerial mission using a UAV is wind speed [52]. Based on a literature review [53], it is recommended that photogrammetric surveys should be carried out in wind speeds of approx. 4–14 m/s. This recommendation applies to all aerial drones, irrespective of their weight or size. Wind speeds exceeding 15 m/s are not recommended for carrying out aerial missions, and wind speeds above 18 m/s are considered unsafe [54,55].
Obviously, it should be remembered to carry out photogrammetric surveys in the absence of precipitation (drizzle, rain, or snow). For example, in Poland, the aerial photography period lasts from the time the snow cover disappears (usually in the second half of March) to October or November. In addition, flights using UAVs should be performed in positive air temperatures, expressed in degrees Celsius (°C) [15,56].

2.2. Methodology for Performing Bathymetric Measurements Using a USV in the Coastal Zone

2.2.1. Selection of a USV

Bathymetric measurements are carried out by national hydrographic offices. In Poland, these include the Hydrographic Office of the Polish Navy, the Maritime Office in Gdynia, and the Maritime Office in Szczecin. When carrying out hydrographic surveys in a shallow waterbody (at depths of less than 1 m), a suitable vessel is required. It follows from the analysis of the technical parameters of the hydrographic vessels owned by Polish institutions that none of them owns a vessel capable of carrying out bathymetric measurements in a shallow waterbody. This is due to the excessive draft of hydrographic vessels (approx. 1 m and more) and the possibility of damaging sensors that are usually mounted on the bow of vessels. This has resulted in a situation where large areas exist for which no depth data have been acquired. Consequently, as a result of such measurements, a bathymetric chart of a waterbody is obtained, in which all the isobaths for shallow depths are equidistant from each other. This is an effect of linear interpolation between the surveyed (most commonly by geodetic methods) coastline and the bathymetric measurements carried out up to an isobath of 1 m [57].
The lack of a possibility to use classic (manned) vessels when carrying out bathymetric measurements in shallow waterbodies necessitates the search for other alternative solutions. In the last decade, it has become popular to use USVs in hydrographic surveys [58,59], including bathymetric monitoring of marine and inland waterbodies [60,61,62]. A particular advantage of vessels of this type is their shallow draft (often 10–20 cm), which allows them to enter a waterbody that is difficult to access due to the occurrence of shallow water [63,64,65].
In this part of the review, an analysis will also be carried out of the equipment used with USVs, which enables the performance of bathymetric measurements in shallow waterbodies. It should be assumed that the technical equipment as part of unmanned surface vehicles should include:
  • a miniature MBES [66,67] or a Single Beam Echo Sounder (SBES) [57];
  • a GNSS/INS system equipped with a RTK receiver [68].
When choosing an echo sounder, the main consideration should be the frequency of its operation. Therefore, when carrying out bathymetric measurements in shallow waterbodies, echo sounders operating in the high-frequency range should be used. In addition to this, an important parameter that should be taken into account when choosing a hydroacoustic device is its minimum operating range, which determines the minimum depth of a waterbody that can be entered by a USV [57]. In order to record the three-dimensional coordinates of the seabed, a miniature MBES or SBES should be coupled with the GNSS/INS system. The main requirement to be followed when selecting an inertial navigation system is the possibility of carrying out kinematic GNSS measurements using the RTK or RTN technique [69,70].

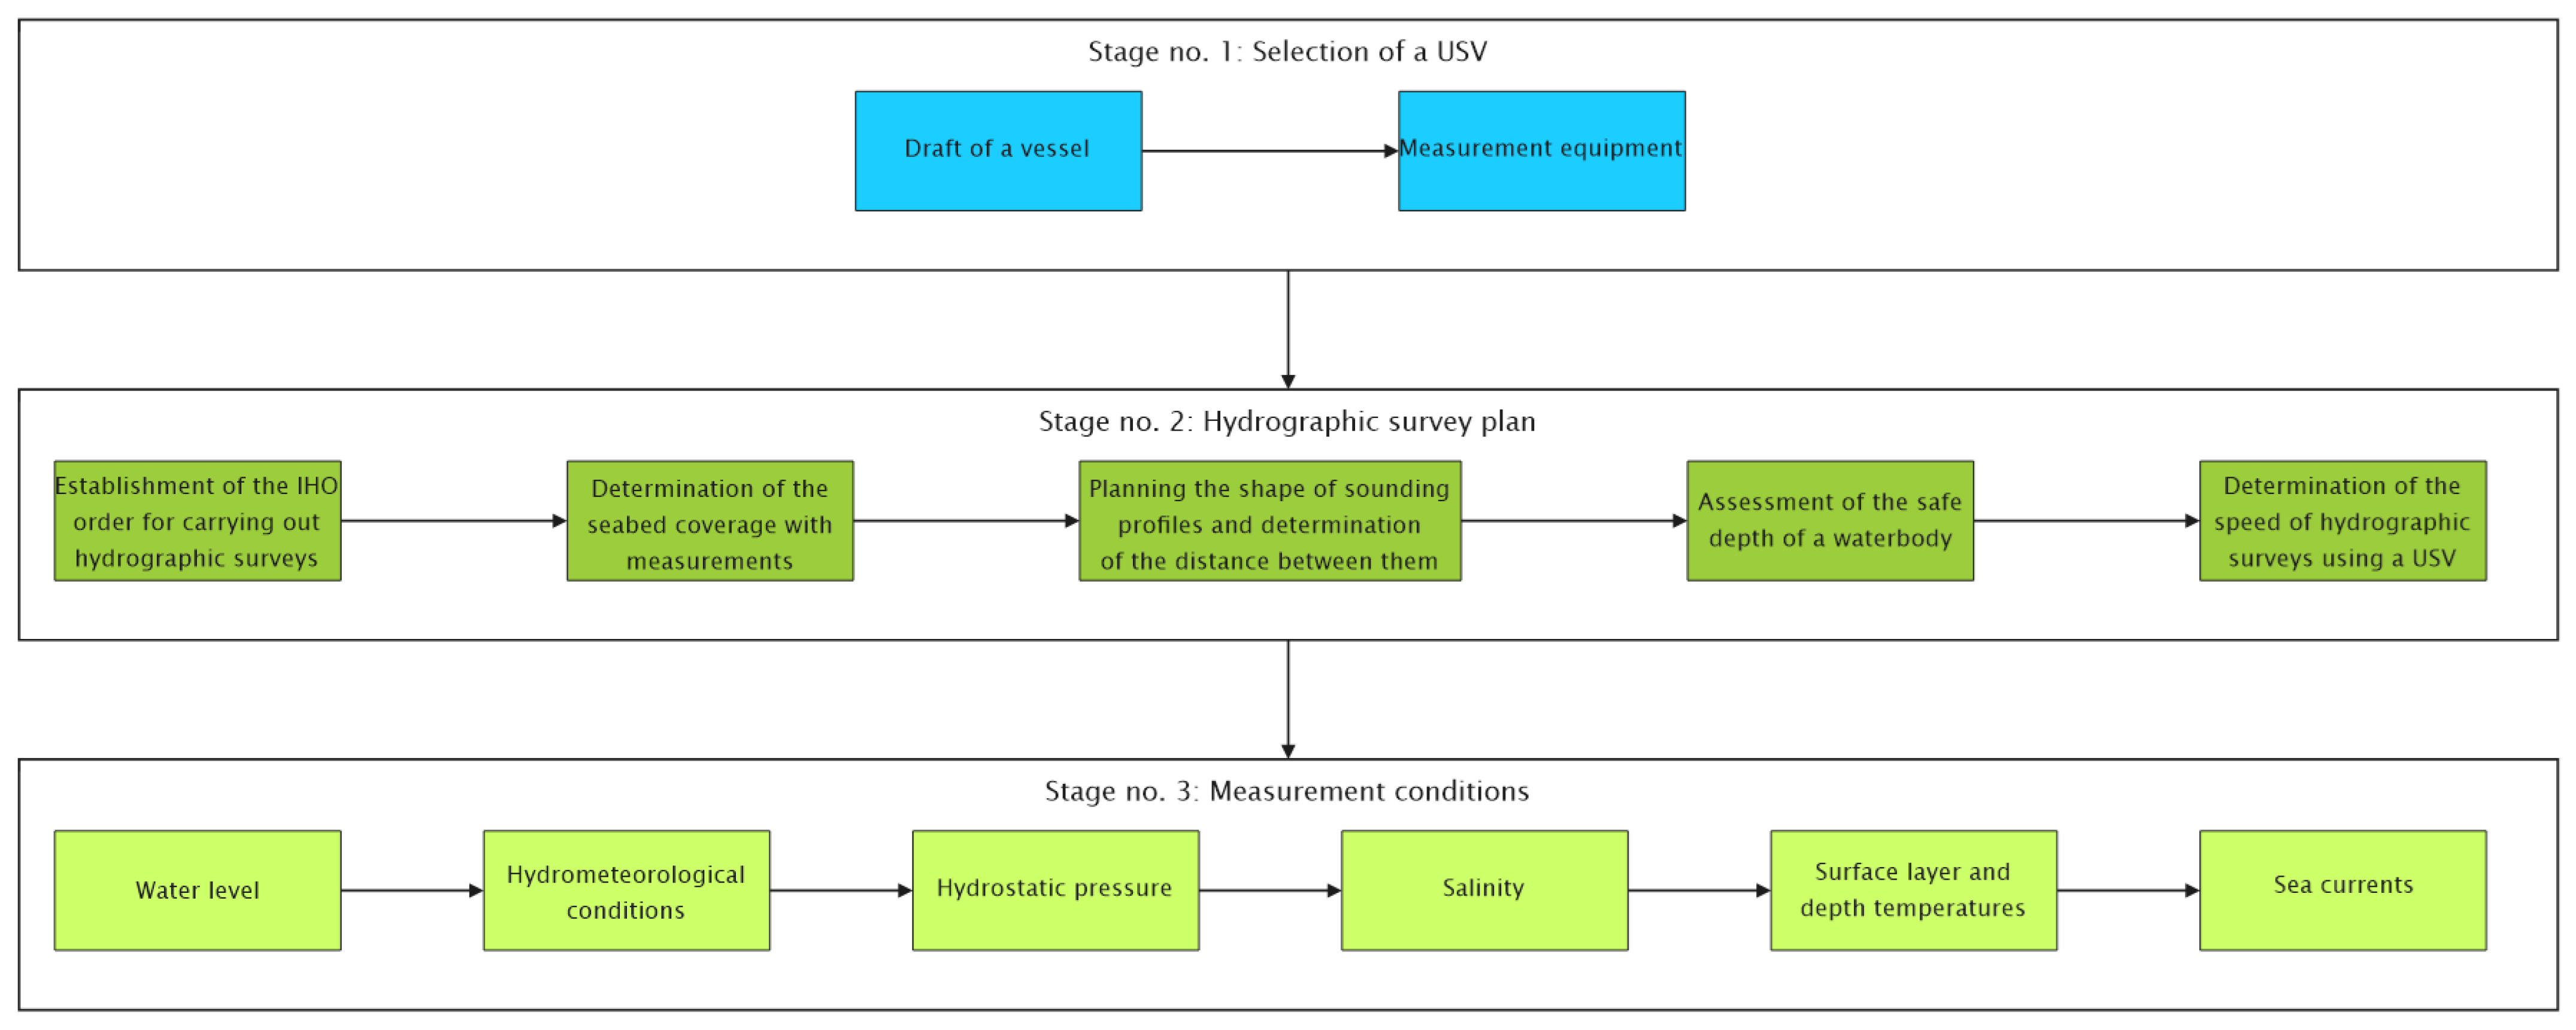
2.2.2. Hydrographic Survey Plan

The quality of a hydrographic compilation (DTM) is affected by the density and accuracy of the depth data recorded by a USV. Therefore, the performance of a bathymetric survey using unmanned surface vehicles should be based on a hydrographic survey plan that contains all the technical information on the planned route, as follows [35,71,72]:
  • Establishment of the IHO order for carrying out hydrographic surveys;
  • Determination of the seabed coverage with measurements;
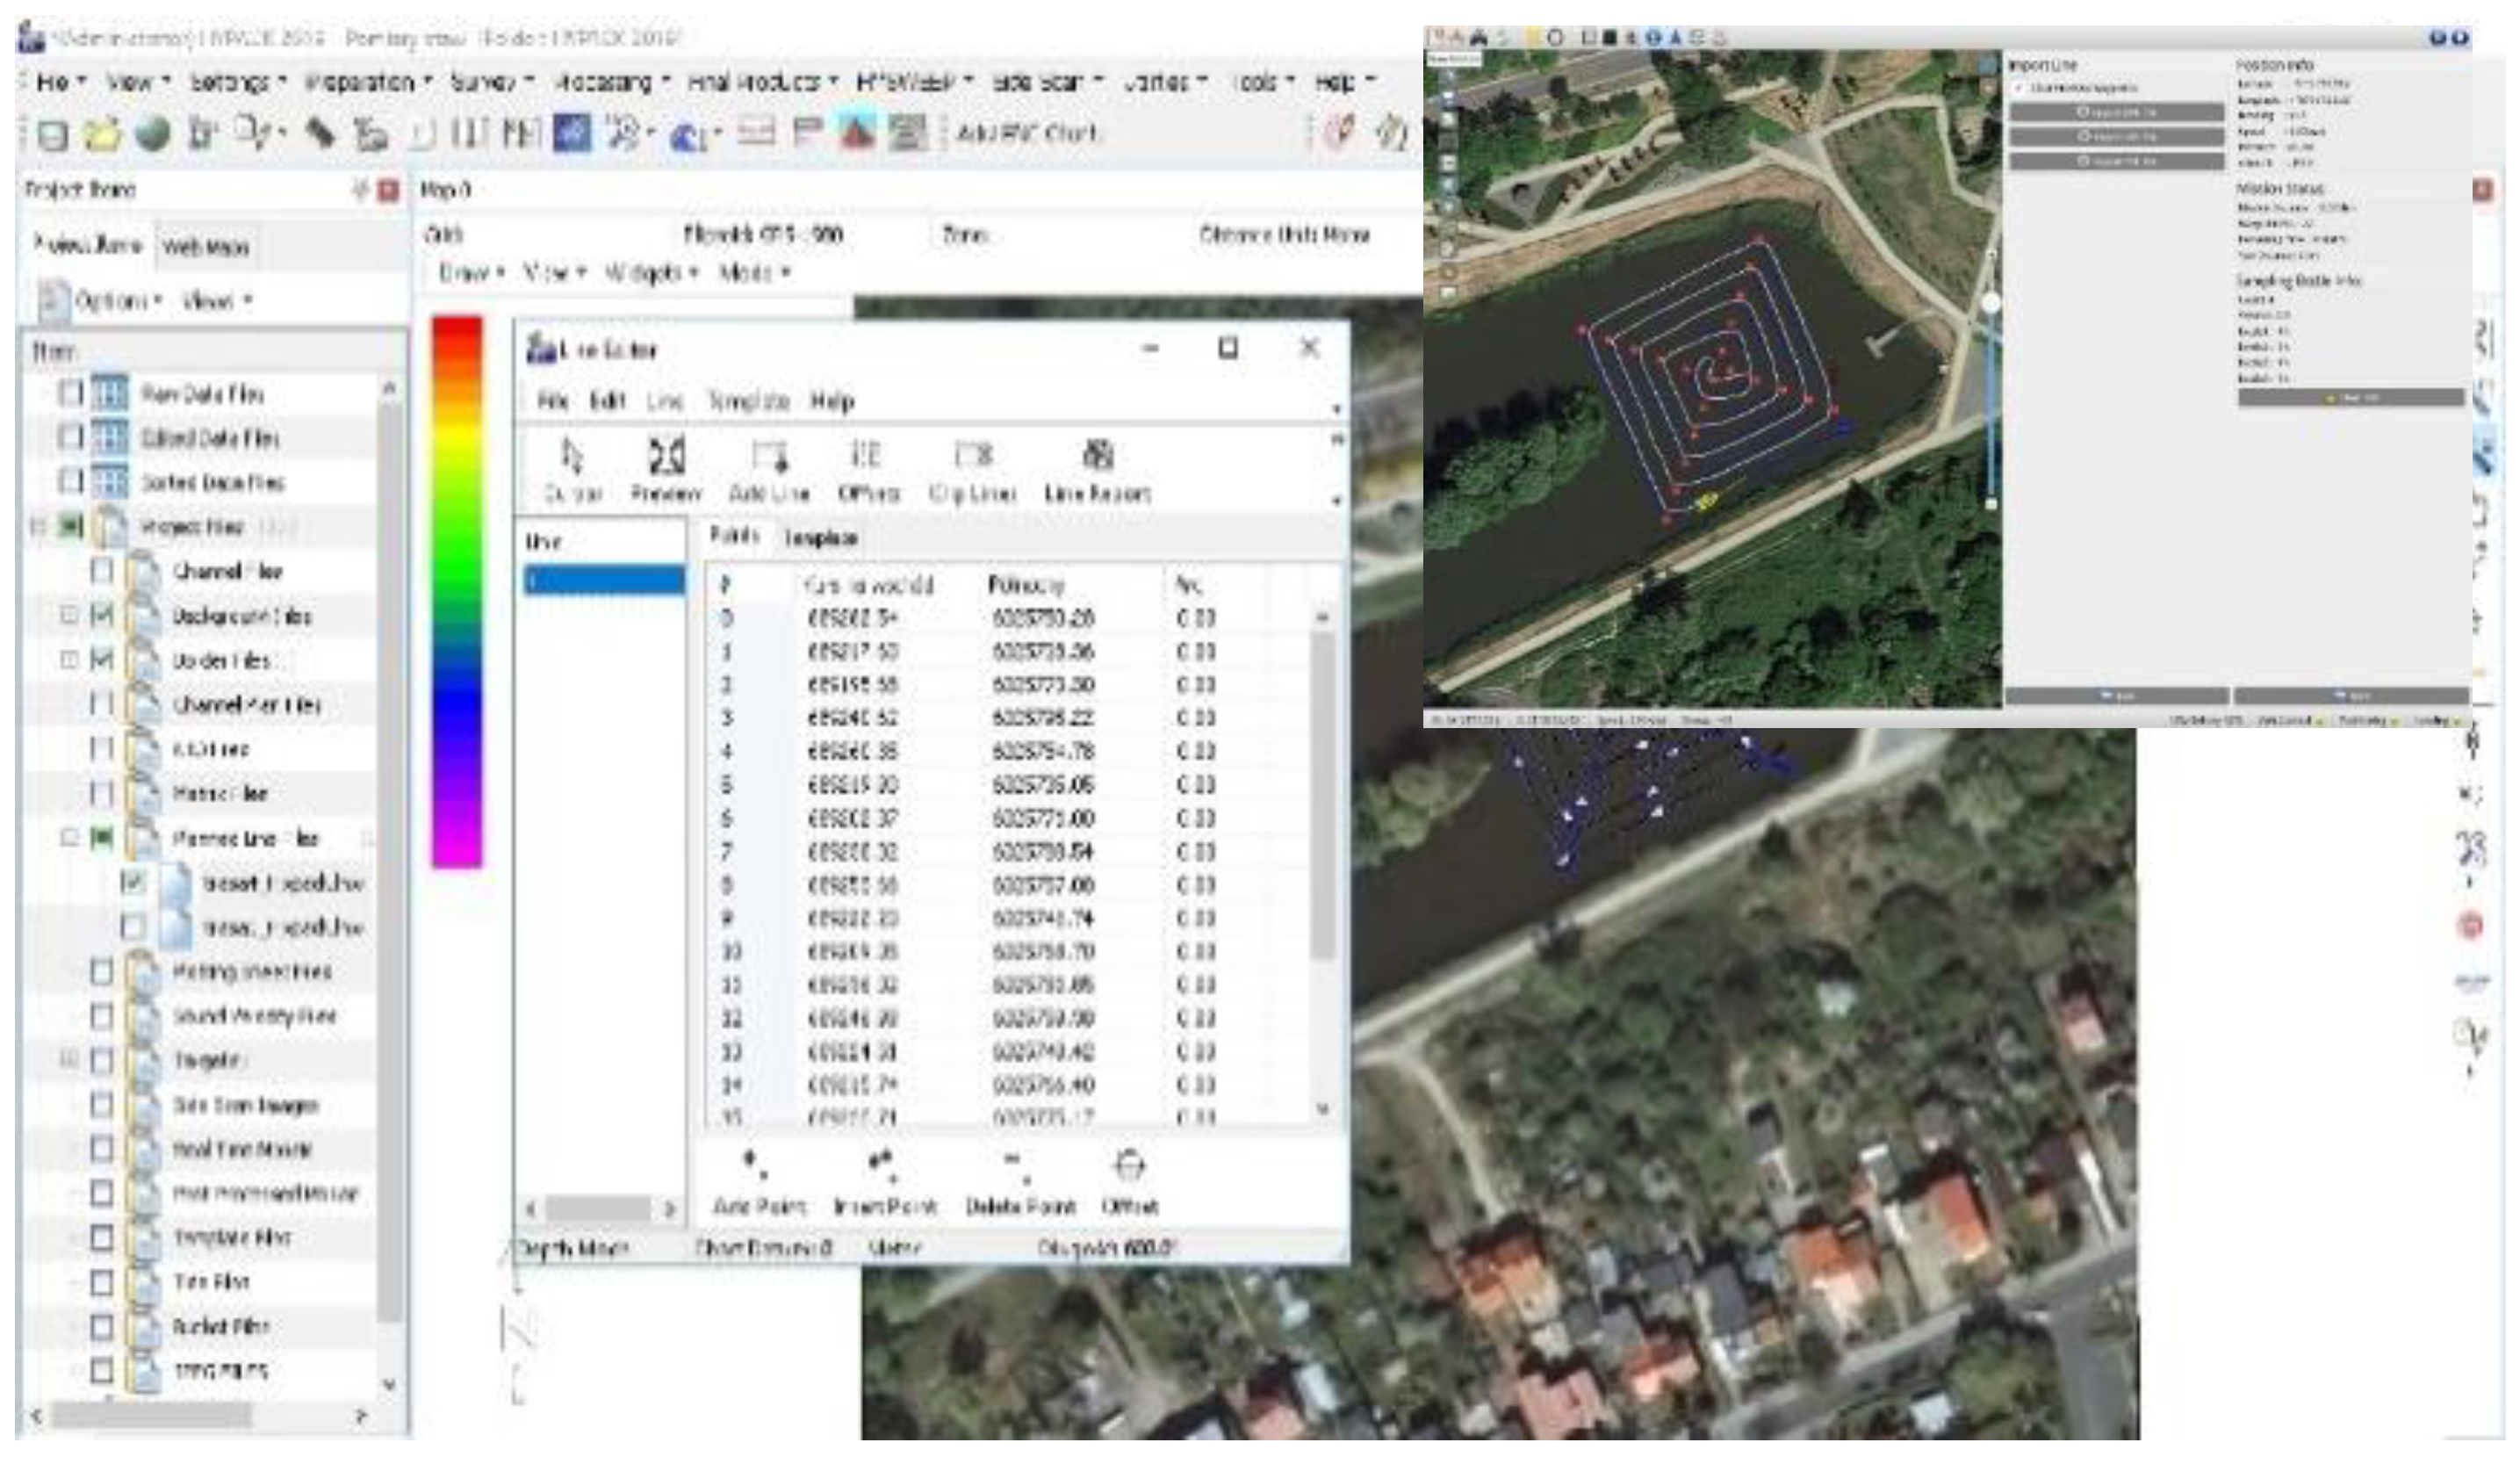
  • Planning of the shape of sounding profiles and determination of the distance between them;
  • Assessment of the safe depth of a waterbody;
  • Determination of the speed of hydrographic surveys using a USV.
One can distinguish several international standards that set out detailed recommendations on the planning of soundings and the requirements imposed on hydrographic surveys. The most important, and also the most popular of these, is the standard issued by IHO, named “IHO Standards for Hydrographic Surveys” [4], which specifies, for e.g., the maximum permissible errors in terms of the 2D position determination and depth measurement for a confidence level of 95%, bathymetric coverage, and the maximum distance between the sounding profiles, as well as the accuracy of determining the coastline course for five IHO orders of hydrographic surveys, etc. (Table 1). From the perspective of the performance of bathymetric measurements in shallow waterbodies, it seems reasonable to carry them out in accordance with the requirements provided for the two most stringent IHO orders of hydrographic surveys, namely Exclusive and Special Orders.
It follows from Table 1 that the maximum 2D position error should be 1 m (p = 0.95) for the Exclusive Order and 2 m (p = 0.95) for the Special Order [4]. In order to meet these accuracy requirements, GNSS/INS systems, additionally supported by RTK receivers, should be used when carrying out hydrographic surveys [69,70,73]. On the other hand, the maximum depth error (TVUmax(d)) is determined by the depth of the waterbody being sounded and the constants (a and b), which differ depending on the IHO order of hydrographic surveys [4]:
T V U m a x d = a 2 + b d 2 ,
where
TVUmax(d) is the maximum depth error for a confidence level of 95%,
a is the depth-independent component of the measurement error,
b is the coefficient representing the depth-dependent component of the measurement error,
d is the depth of the waterbody being sounded.
It follows from Formula (6) that the depth error in a shallow waterbody must not be greater than 0.15 m (p = 0.95) for the Exclusive Order and 0.25 m (p = 0.95) for the Special Order. These accuracy requirements apply to water areas in which full seabed coverage with measurements must be ensured. It is worth noting that for the most stringent IHO hydrographic survey orders, no maximum distance between the sounding profiles was provided [4]. This means that hydrographic surveys according to the Exclusive Order, Special Order, or Order 1a should be carried out using an MBES [74], or a bathymetric LiDAR [66,75].
Most of the other standards concerning the performance of hydrographic surveys refer to the requirements provided in the IHO S-44 standard. One of them is a standard issued by the National Oceanic and Atmospheric Administration (NOAA), named “Hydrographic Surveys Specifications and Deliverables” [76]. However, there are certain differences between these standards as regards the planning of sounding profiles [77]. For example, a standard issued by the United States Army Corps of Engineers (USACE), entitled “Engineering And Design: Hydrographic Surveying”, sets out the acceptable distance between sounding profiles when carrying out hydrographic surveys using an MBES [78]:
O = 2 d tan S W 2 1 p
where
O is the distance between sounding profiles,
SW is the MBES swath angle,
P is the overlap zone between neighbouring swaths, which should be 20–100%.
Based on a literature review, it can be concluded that no international standards concerning the performance of hydrographic surveys have specified at what angle and in relation to what the sounding profiles should be designed. Information on this subject can be found in books, national recommendations, and publications in the field of hydrography [77].
In addition to establishing the distance between the sounding profiles, the direction of their course should be determined. Bathymetric measurements in shallow waterbodies should be carried out along the main profiles, which are the primary sounding lines, and control profiles that are designed to verify the correctness of the surveys performed. The main profiles should be run in parallel to the coastline course, while the control profiles should be designed perpendicular to the coastline.
The determination of the course of sounding lines is affected by the safe depth of a waterbody, to which bathymetric measurements can be carried out using a USV. The safe depth of a waterbody protects a vessel from running aground or hitting the hull against the seabed. Its value should be greater than the sum of the USV’s draft and the Under Keel Clearance (UKC). In addition, this isobath should not be smaller than the minimum operating range of the MBES or SBES. An important element in determining the safe depth of a water area is the assessment of the UKC, which depends on many factors, namely the accuracy of hydrographic surveys, the determination of the tidal height, water level fluctuations, the accuracy of determining the roll and draft of a USV, the settlement, and the components dependent on waves, etc. [79].
The last parameter to be determined before commencing a hydrographic sounding operation is the USV speed. It follows from a literature review that unmanned surface vehicles can move at speeds exceeding 40 knots. They are classified as fast-moving USVs [80]. On the other hand, typical speeds at which bathymetric measurements are carried out using unmanned surface vehicles range from 2 to 5 knots [58,72,81].
To determine the distance between the sounding profiles and the direction of their course, hydrographic software for planning (distributing) sounding profiles and visualising the position of a vessel on a map can be used. Most software of this type allow sounding profiles to be designed based on the waterbody under survey, which is visualised on an orthophotomap. The software most commonly used for planning hydrographic surveys and monitoring the vessel’s position in real-time include HYPACK (Figure 9) [69], Mission Planner, or Qinsy.

2.2.3. Measurement Conditions

When carrying out hydrographic surveys, it is necessary to know the current water level in the area where the measurements are being performed. Thanks to this information, the measured depths can be reduced to the pre-determined reference level, the so-called chart datum. The majority of national hydrographic offices assume the chart datum to be the Lowest Astronomical Tide (LAT) [82]. It is defined as the lowest tide level that can be predicted to occur under average meteorological conditions and under any combination of astronomical conditions [83].
For example, in Poland, the units responsible for registering, sharing, and archiving information on water levels are the Maritime Branches of the Institute of Meteorology and Water Management (IMGW). Information on water levels can be obtained from stream gauges located in harbours and ports. Stream gauging stations are equipped with an instrument for observing water level fluctuations (staff gauge) or instruments for observing and recording measurement data (tide gauge) and with survey markers to which the water level is tied. One of the most commonly used stream gauges is the staff gauge. However, it is increasingly being replaced by Automatic Telemetric Hydrological Stations (ATHS), which enable the continuous recording of changes in the water level. ATHSs are equipped with water level sensors and a General Packet Radio Service (GPRS) or radio modem for transferring data to IMGW-PIB databases. Thanks to these functions, information on the current water level is made available on an ongoing basis by the Hydro IMGW-PIB ICT system in Coordinated Universal Time (UTC) for the last three days. It should be noted that the above-mentioned methods enable measurement of the water level with an accuracy of 1 cm [77,84].
The water level refers to a height system in force in a particular country. For example, in Poland, water levels should be reduced according to the PL-EVRF2007-NH height system, which is made up of normal heights referred to as the mean level of the North Sea, determined by the tide gauge in Amsterdam (Dutch: Normaal Amsterdams Peil) [85]. Since 1 January 2024, this has been the only height system in which normal heights in Poland are provided [86].
It should be noted that for non-tidal waterbodies, such as, for e.g., the Baltic Sea, the differences in water level between successive hours are negligible, amounting to a maximum of a few centimetres [87]. However, where tidal waterbodies are concerned, hourly water level recordings may prove insufficient for accurate height determination. In such a situation, it is necessary to determine the current water level based on the tide table that is issued annually by the British Admiralty [88].
When carrying out hydrographic surveys, the determination of the interrelationships between the processes and phenomena occurring in the aquatic environment is required [89]. In addition to the abovementioned water level measurements, selected oceanographic parameters should be measured, including the hydrostatic pressure, salinity, sea currents, surface layer and depth temperatures, as well as wave and wind speed [77].
In the first instance, it is necessary to determine whether the hydrometeorological conditions prevailing over the waterbody under survey enable the performance of hydrographic surveys using a USV. Based on the experience gained, it was found that an “AutoDron” USV, weighing approx. a dozen kg, was not capable of carrying out bathymetric measurements in the coastal zone involving small waves (0–1° on the Douglas scale) and low wind (0–1° on the Beaufort scale). Winds blowing at higher speeds of 7–11 km/h (2° on the Beaufort scale) produce small waves up to 20 cm high. This may adversely affect the maintenance of a USV along sounding profiles and its stability when carrying out hydrographic surveys [90]. Therefore, before and during the performance of hydrographic surveys, it is necessary to check what weather conditions will be prevailing over the waterbody under survey. For this purpose, short-term meteorological forecasts that provide information on the direction and strength of winds and water levels, such as, for e.g., the Bałtyk IMGW-PIB website, can be used [91].
After determining advantageous weather conditions from the perspective of the performance of bathymetric measurements using a USV, it is necessary to determine the oceanographic parameters (hydrostatic pressure, salinity, temperature), which have a direct impact on the speed of sound in water. This, in turn, affects the accuracy of depth measurements recorded by hydroacoustic instruments [92,93]. The speed of sound in water can be determined in a direct manner using a Sound Velocity Profile (SVP), with an accuracy of ±0.05 m/s [94,95].
Another method for determining the speed of sound in water is a Conductivity, Temperature, Depth (CTD) sensor designed for measuring the temperature and salinity of water and other physical properties in the depths and on the surface of water [96,97]. Based on the physical properties measured by a CTD sensor, the speed of sound in water is determined. It is most commonly calculated using the empirical formulas by Chen and Millero [98,99], Del Grosso [100], Mackenzie [101,102], Medwin [103], or Wilson [104].
The most variable parameter, and the one with the greatest influence on the speed of sound in water, is temperature. The speed of sound in water increases by an average of 4.5 m/s with a temperature increase of 1 °C. The second factor that has a moderate effect on the speed of sound in water is salinity. The speed of sound in water increases by an average of 1.3 m/s with a salinity increase of 1‰. The third factor, which has a negligible influence on the speed of sound in water, is hydroacoustic pressure (depth). The speed of sound in water increases by an average of 1.6 m/s with a depth increase of 100 m. Therefore, it can be assumed that hydrostatic pressure has practically no effect on the speed of sound in water when conducting bathymetric measurements in shallow waterbodies.
It should be noted that the speed of sound in water can be significantly affected by short-term (daily) changes in the water surface temperature caused by the heating of the water surface layer by the Sun (the afternoon effect) (Figure 10). The range of daily changes in the speed of sound in water can be as high as 40 m/s during the summer season [96,105].
The last oceanographic parameter to be considered before starting to carry out bathymetric measurements using a USV are sea currents, which have an effect on the maintenance of an unmanned surface vehicle along sounding profiles. It should be noted that excessively strong sea currents may prevent the performance of hydrographic surveys in the coastal zone. Information on the direction and speed of sea currents can be obtained free of charge from specialised websites, such as Ocean Motion [106] or SatBałtyk [107]. These websites provide maps of the distribution of sea currents, presenting graphically the direction of the water flow (using arrows) and their speed (using a scale included in the diagram) [108].

3. Results

This chapter presents the stages of bathymetric and photogrammetric measurements of shallow waterbodies using UAV and USV vehicles in the coastal zone. It should be noted that as a result of the bathymetric and photogrammetric measurements, geospatial data will be obtained from the onboard sensors of unmanned measurement platforms, such as: the echo sounder, GNSS RTK receiver, GNSS/INS system, LiDAR system, and photogrammetric camera. Then, on the basis of this data, a DTM of the coastal zone area will be developed.
The methodology for performing photogrammetric surveys using a UAV in the coastal zone should consist of four stages (Figure 11). First of all, choose a drone that will enable this type of research to be conducted. When selecting a UAV, the following criteria should be taken into account:
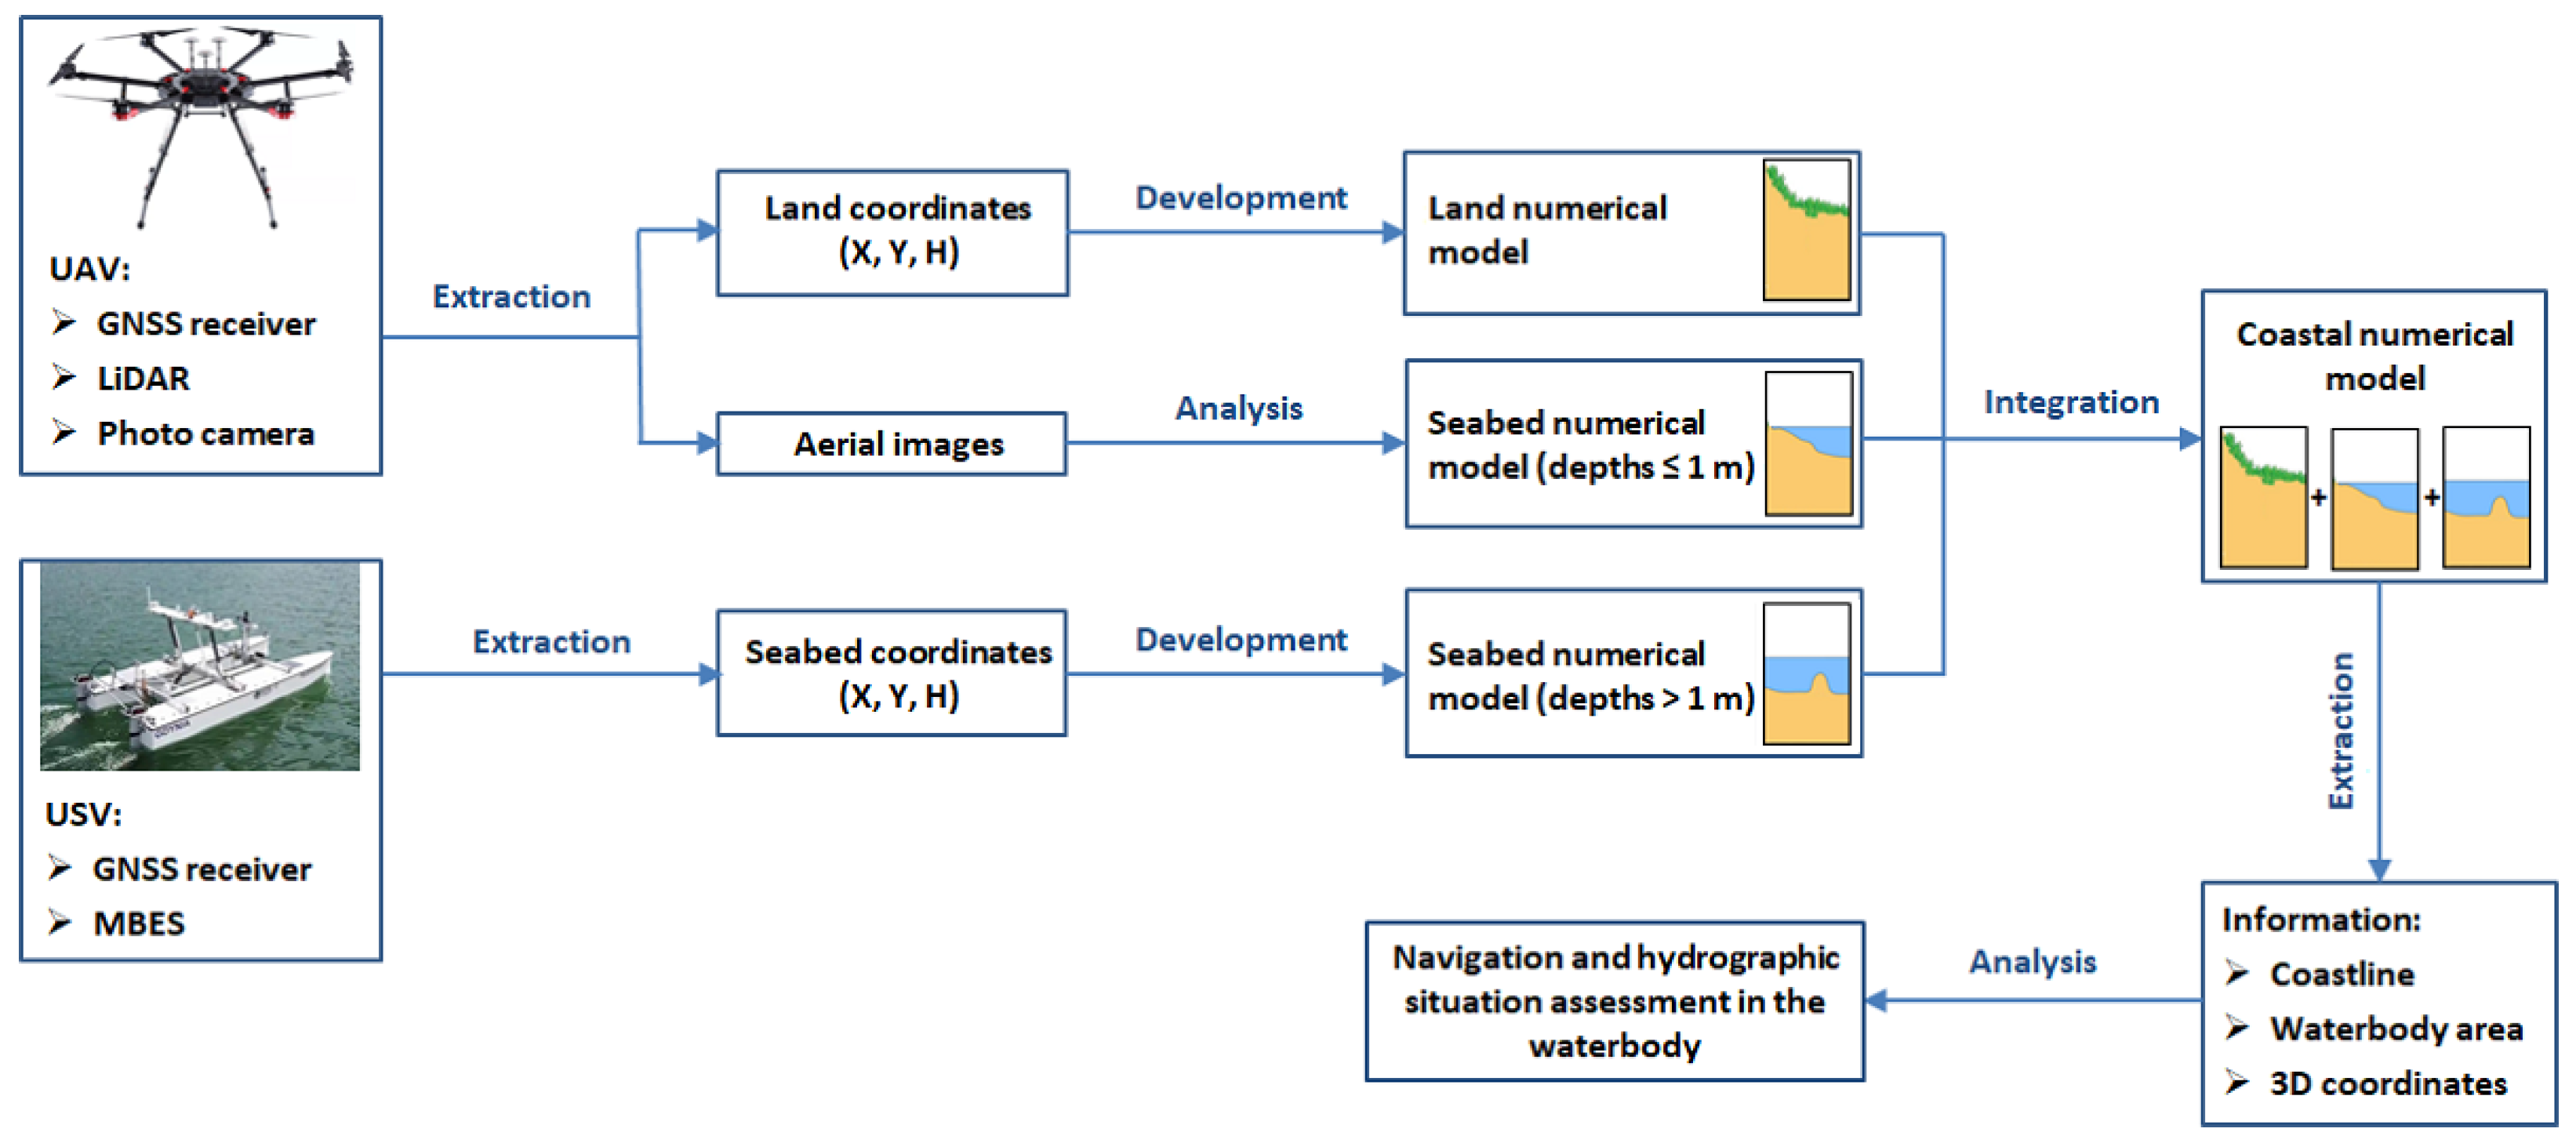
  • Measurement equipment. To take photos or scans of the studied area, the use of measurement equipment is necessary, which may include a camera and/or a LiDAR system integrated with a GNSS/INS system. This setup enables precise georeferencing of the photos or scans taken, which ultimately allows for the development of a photogrammetric product;
  • Maximum working load limit and appropriate load space dimensions. These are the most important parameters that determine whether a UAV can fly safely. The weight of the measurement modules necessary to carry out photogrammetric surveys ranges from 2 to 5 kg. The max payload of the drone must be no less than the weight of the measurement modules;
  • Flight duration. The maximum mission time based on one battery is closely related to the UAV’s weight criterion. This parameter is important in the context of the flight duration and whether the mission based on a single battery will be completed in whole or in part.
Secondly, the photogrammetric flight plan should be prepared containing all the technical information on the planned flight, as follows:
  • Determination of the type of aerial photos and the method for triggering them. Due to the orientation of the camera axis, four types of images can be distinguished: vertical, almost vertical, inclined, and oblique. The choice depends on the purpose of the aerial photos and the terrain. When it comes to the method for triggering images, a commonly used solution today is the triggering of the camera’s shutter at pre-planned locations in space. Aerial photos taken in this way are referred to as targeted images. Thanks to the GNSS/INS system, it is possible to trigger the camera’s shutter in such a manner that the centres of the photos in adjacent rows, as well as the corresponding stereograms and zones of the triple image coverage, correspond to each other;
  • Calculation of the GSD. The photogrammetric flight plan is mainly designed according to the ground sampling distance. For the purpose of high-resolution photogrammetric compilations, it is assumed that the field pixel size should be approx. 2–3 cm;
  • Determination of the flight altitude of a UAV. Typical heights at which photogrammetric surveys are carried out using drones are in the range 70–120 m;
  • Selection of the longitudinal and transverse coverage of aerial photos. For the purpose of high-resolution photogrammetric compilations, it is assumed that the longitudinal coverage of images should be at least 70–90%, while the transverse coverage of photos cannot be less than 60–80%;
  • Calculation of the minimum distance between flight profiles. Knowing the longitudinal coverage of the photos, the flight altitude, and the selected technical parameters of the camera (camera sensor size and camera focal length), it is possible to determine the minimum distance between the flight profiles;
  • Determination of the flight speed of a UAV. Typical speeds at which photogrammetric surveys are carried out using drones are in the range 20–30 km/h.
Thirdly, the method for georeferencing aerial photos should be selected:
  • Indirect georeferencing involves an indirect survey of the external orientation of the camera using photopoints. For this purpose, a photogrammetric control network should be established to make it possible to geometrically tie aerial photos to the control network during the aerotriangulation process. The photopoints should be evenly distributed along the shoreline and appropriately signalled. After creating the photogrammetric control network, the coordinates of the points in this network should be determined using geodetic methods;
  • Direct georeferencing involves a direct survey of the external orientation of the camera without using photopoints. For this purpose, it is necessary to determine the spatial and temporal relationships between three devices: the camera, GNSS antennas, and IMU.
In the fourth and last stage, it is necessary to determine what meteorological conditions prevail in the studied waterbody and whether they enable measurements to be carried out using a UAV. The main parameters that define the feasibility and quality of photogrammetric surveys performed with the use of a drone are as follows:
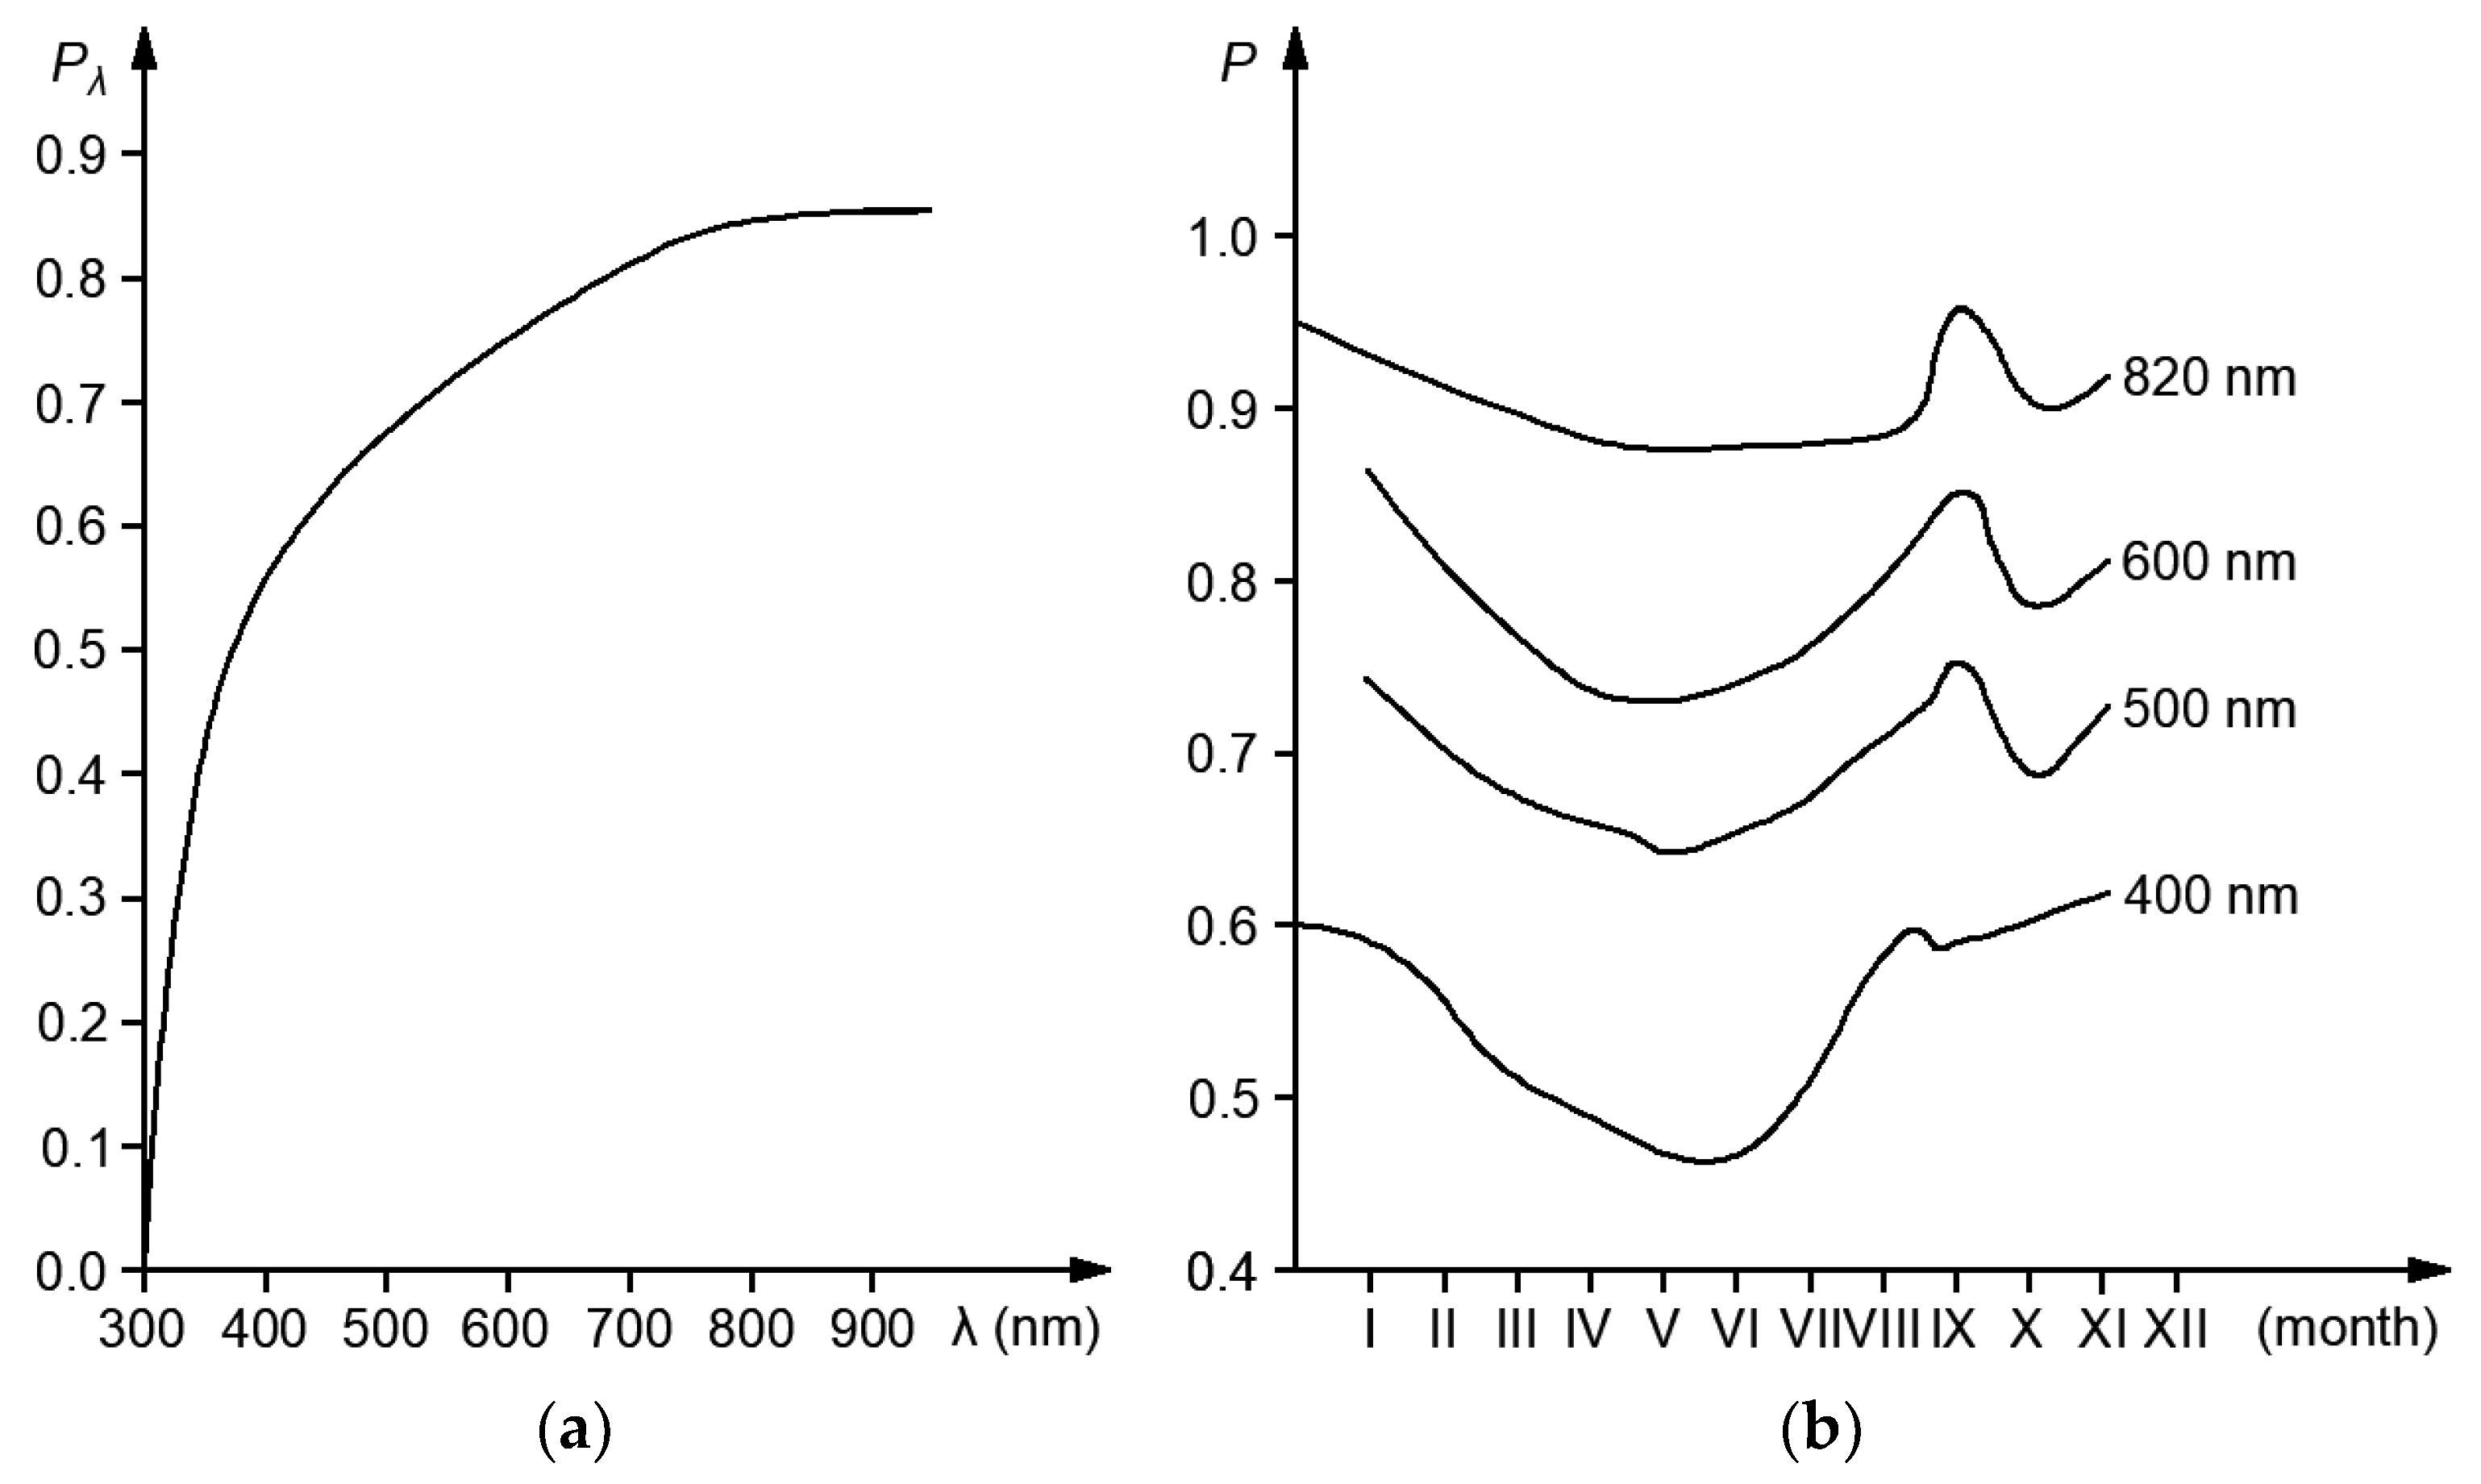
  • Cloud cover and illumination. When taking aerial photos from a low altitude with a UAV, the height of the Sun above the horizon should be no less than 25° and not more than 60°. Moreover, it is recommended that there are high clouds when taking images, which significantly reduces contrasts;
  • Wind speed. Another factor determining the possibility of carrying out an aerial mission using a UAV is the wind speed. It is recommended that photogrammetric surveys are performed at wind speeds of approx. 4–14 m/s;
  • Other parameters. Photogrammetric surveys should be carried out when there is no precipitation (drizzle, rain, or snow). In addition, flights using UAVs should be performed at positive air temperatures, expressed in degrees Celsius (°C).
The methodology for performing bathymetric measurements using a USV in the coastal zone should consist of four stages (Figure 12). First of all, choose an unmanned vessel that will enable this type of research to be conducted. When selecting a USV, the following criteria should be taken into account:
  • Draft of a vessel. When carrying out bathymetric measurements in shallow waterbodies, it is recommended to use unmanned vessels with the smallest possible draft in order to measure as large an area near the shore as possible;
  • Measurement equipment. To conduct bathymetric surveys, the use of measurement equipment is necessary, which may include a miniature MBES or SBES coupled with a GNSS/INS system, equipped with a RTK receiver. Such hardware integration enables precise depth measurement, which ultimately allows for the development of an accurate bathymetric chart.
Secondly, the hydrographic survey plan should be prepared containing all the technical information on the planned route, as follows:
  • Establishment of the IHO order for carrying out hydrographic surveys. From the point of view of the accuracy of bathymetric measurements in shallow waterbodies, it seems reasonable to conduct them in accordance with the requirements provided for the two most stringent IHO orders of hydrographic surveys, namely Exclusive and Special Orders;
  • Determination of the seabed coverage with measurements. Depending on the IHO order of hydrographic surveys, appropriate seabed coverage with measurements should be ensured. For IHO Exclusive and Special Orders, full bottom coverage by surveys is required;
  • Planning the shape of sounding profiles and determination of the distance between them. In order to ensure appropriate seabed coverage with measurements, the distance between sounding profiles and the direction of their course should be determined. Bathymetric measurements in shallow waterbodies should be carried out along the main and control profiles;
  • Assessment of the safe depth of a waterbody. Its value should be greater than the sum of the USV’s draft and the UKC. Moreover, the isobath should be no less than the minimum operating range of the MBES or SBES;
  • Determination of the speed of hydrographic surveys using a USV. Typical speeds at which bathymetric measurements are carried out with the use of USVs amount to 2–5 knots.
Thirdly, it is necessary to determine what measurement conditions prevail in the studied waterbody and whether they enable surveys to be carried out using a USV. The main parameters that define the feasibility and quality of bathymetric measurements performed with the use of an unmanned vessel are as follows:
  • Water level. When carrying out hydrographic surveys, it is necessary to know the current water level in the area where measurements are to be taken. Thanks to this information, the measured depths can be reduced to the chart datum;
  • Hydrometeorological conditions. These conditions mainly determine whether hydrographic surveys using a USV can take place. It is recommended to carry out bathymetric measurements in the coastal zone with small waves (0–1° on the Douglas scale) and low wind (0–1° on the Beaufort scale);
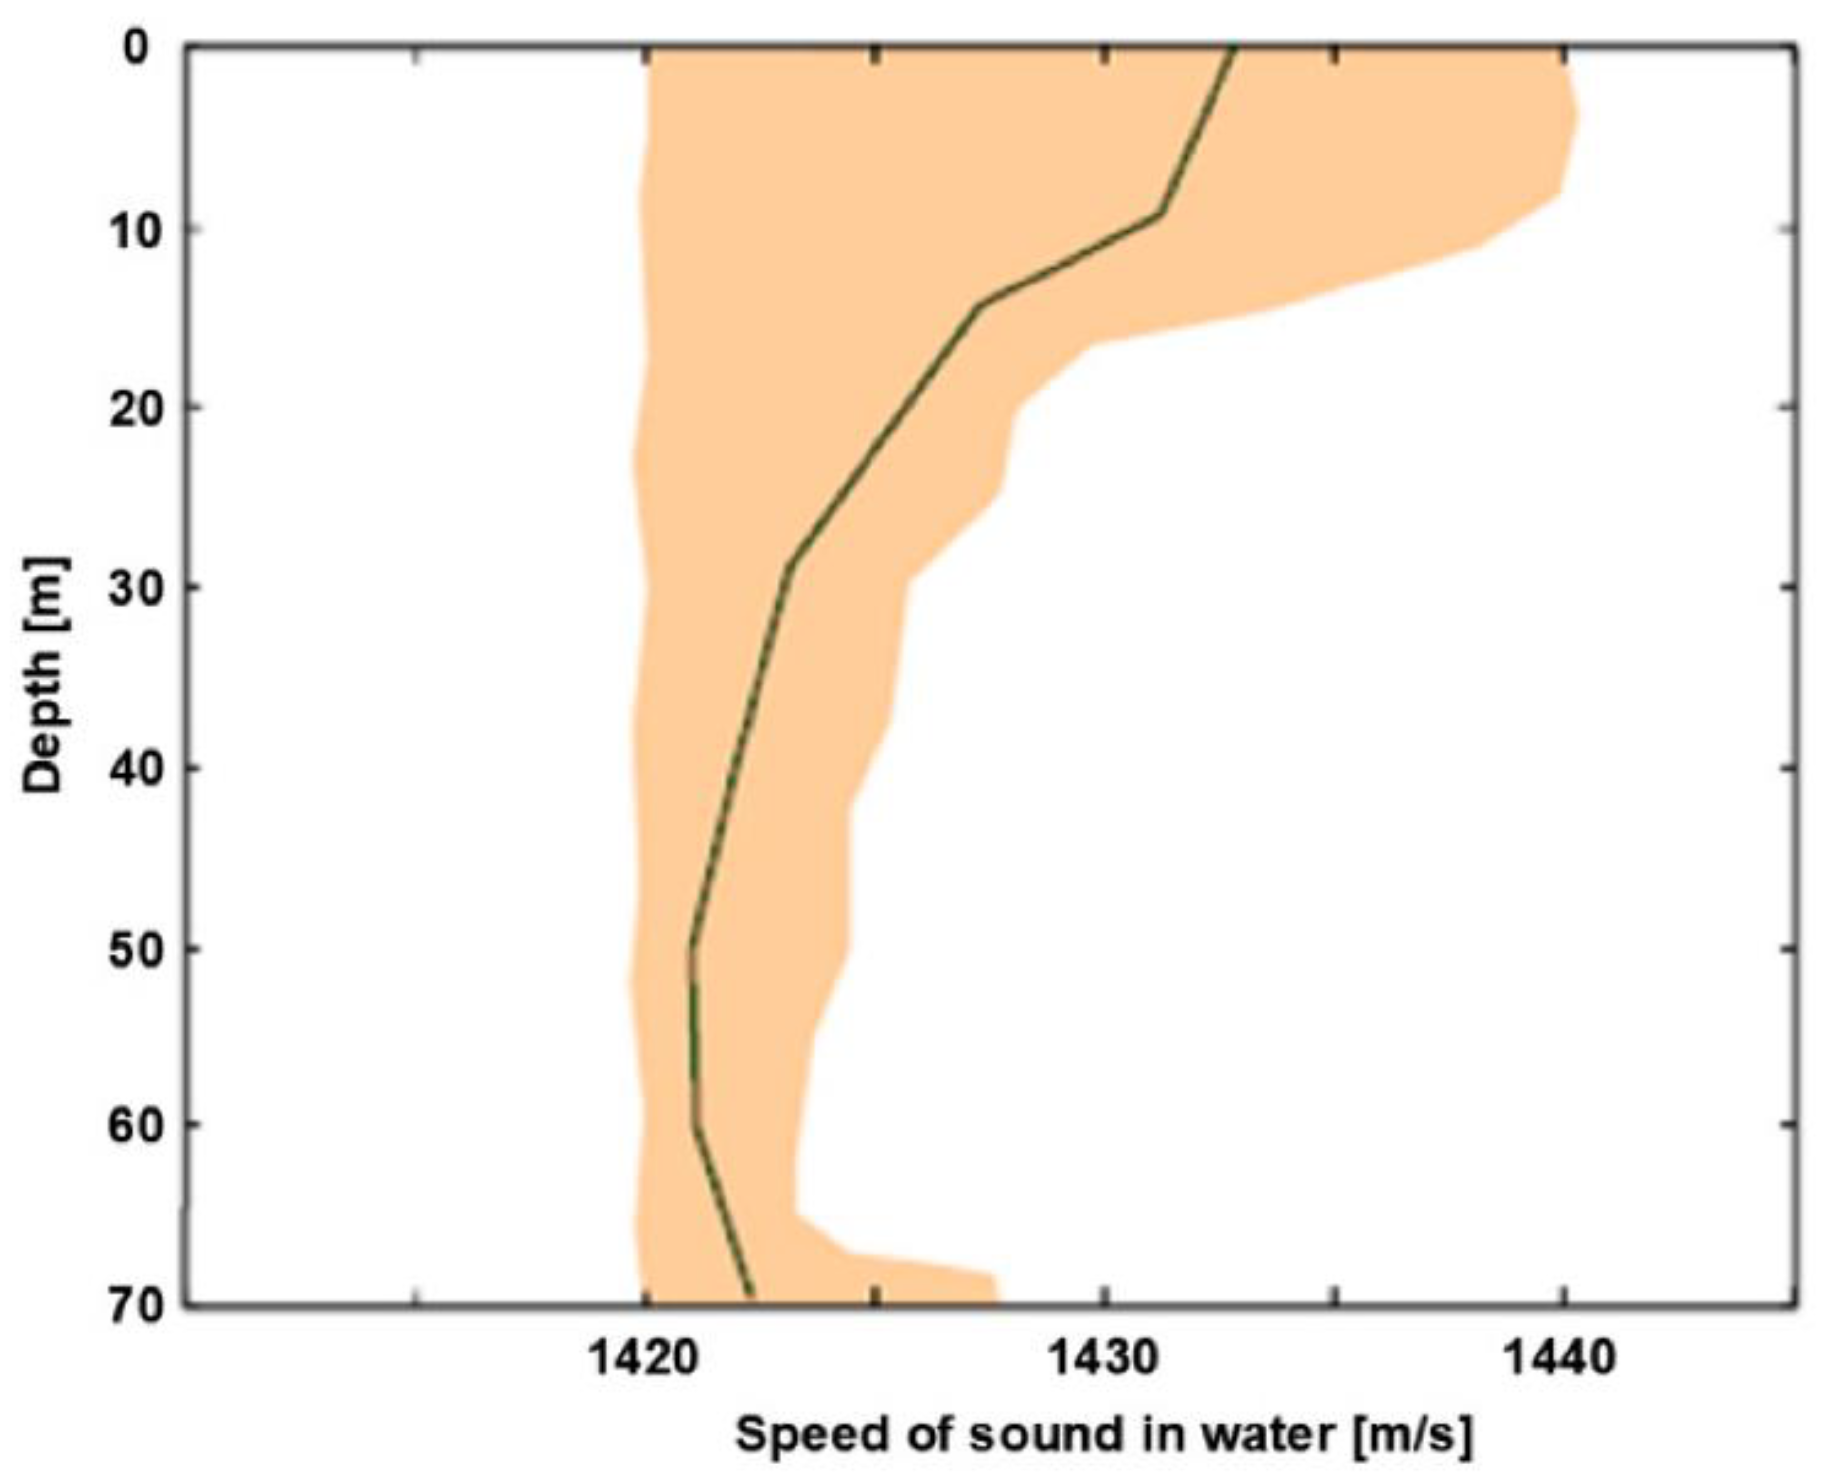
  • Oceanographic parameters. It is necessary to determine the pressure, salinity, and temperature, which have a direct impact on the speed of sound in water. This in turn affects the accuracy of the depth measurements recorded by the echo sounder. Moreover, before carrying out bathymetric measurements using a USV, it should be defined whether there are sea currents in the studied waterbody. They have an impact on the maintenance of an unmanned vessel along sounding profiles.
Due to dynamic changes in the coastal zone topography, it is recommended that bathymetric measurements and photogrammetric measurements using UAV and USV vehicles should be carried out simultaneously, on the same day. Moreover, when choosing the date for carrying out the research, the vegetation period should be taken into account. Bathymetric and photogrammetric surveys should be conducted during the early vegetation of plants (until mid-May or June), or after the end of plant vegetation (from September). This is due to the fact that as a result of the intensive growth and development of plants, water blooms may occur, which makes it impossible to accurately determine the depth of shallow waterbodies.

4. Discussion

Although bathymetric and topographic monitoring in the coastal zone is becoming more and more popular, there are no publications that describe in detail how to conduct this type of research using UAV and USV vehicles.
The closest resources in this respect are the guidelines created by the NOAA [109], which describe the methodology for performing photogrammetric surveys, the aim of which is to develop a bathymetric chart for a shallow waterbody based on a UAV point cloud, generated using the SfM technique. The Authors of this publication determined what measurement equipment is necessary to carry out bathymetric and photogrammetric measurements, as well as which parameters have a decisive impact on the success of an aerial mission. When choosing a drone, the following criteria should be taken into account: the method of georeferencing aerial photos, flight duration, takeoff and landing requirements, the method of conducting a flight mission, airframe size and weight, battery capacity, as well as wind and weather resistance, etc. In addition, the technical parameters that should be taken into account when choosing a photogrammetric camera are specified. The most important of parameters include timestamping, the camera sensor size and type, camera shutter, camera lens, and camera cycle rate, as well as gimbal and vibration damping. The measurement conditions under which it is recommended to conduct bathymetric measurements using a UAV are also defined. The following factors influence the success of such research: water clarity, bottom texture, wave conditions, tides and wind conditions. Moreover, it was shown how to plan and execute photogrammetric surveys using a drone in the coastal zone. When planning a flight mission, the following aspects must be performed or specified: the area of interest size, takeoff and landing location, flight line overlap/sidelap, altitude, water surface reflections, GCP locations, and instantaneous water level, etc.
Specht et al. [77] proposed an effective and optimal method for performing bathymetric measurements to enable territorial sea baseline determination in selected waterbodies in Poland. Such research presents a method for planning hydrographic surveys using both manned and unmanned vessels, defines the oceanographic parameters that should be determined before and during bathymetric measurements, as well as a method of choosing the measurement equipment used in hydrographic surveys involving shallow waters. Research has shown that using an unmanned vessel, on which a multi-GNSS receiver and a miniature MBES or SBES can be installed, is currently the optimum and most effective method for determining the territorial sea baseline.
In other publications, such as [90,110,111], the aim of which was not to present the methodology for performing bathymetric and photogrammetric measurements in the coastal zone, the general method for conducting this type of research was presented.

5. Conclusions

The aim of this review was to develop a methodology for performing bathymetric and photogrammetric measurements using UAV and USV vehicles in the coastal zone. As can be seen, the proposed methodology is a complex process and depends on many interacting factors. Correct conduct of the research will affect the accuracy of the obtained measurement results, based on which a DTM of the coastal zone is developed.
The methodology for performing photogrammetric surveys using a UAV in the coastal zone should consist of four stages. First of all, choose a drone that will enable this type of research to be conducted. When selecting a UAV, the following criteria should be taken into account: the measurement equipment, maximum working load limit, appropriate load space dimensions, and flight duration. Secondly, a photogrammetric flight plan should be prepared containing all the technical information on the planned flight: determination of the type of aerial photos and the method for triggering them, calculation of the GSD, determination of the flight altitude of a UAV, selection of the longitudinal and transverse coverage of aerial photos, calculation of the minimum distance between flight profiles, as well as determination of the flight speed of a UAV. Thirdly, the method for georeferencing aerial photos should be determined. In the fourth and last stage, it should be specified whether there are meteorological conditions in the studied area that enable the implementation of an aerial mission with the use of a drone. The main parameters that define the feasibility and quality of photogrammetric surveys performed using a UAV are: cloud cover and illumination, wind speed, as well as other parameters, such as air temperature and precipitation.
The methodology for performing bathymetric measurements using a USV in the coastal zone should consist of four stages. First of all, choose an unmanned vessel that will enable this type of research to be conducted. When selecting a USV, the following criteria should be taken into account: draft of a vessel and the measurement equipment. Secondly, a hydrographic survey plan should be prepared containing all the technical information on the planned route: establishment of the IHO order for carrying out hydrographic surveys, determination of the seabed coverage with measurements, planning the shape of sounding profiles and determination of the distance between them, assessment of the safe depth of a waterbody, as well as determination of the speed of hydrographic surveys with the use of an unmanned vessel. Thirdly, it is necessary to determine what measurement conditions prevail in the studied waterbody and whether they enable surveys to be carried out using a USV. The main parameters that define the feasibility and quality of bathymetric measurements performed with the use of an unmanned vessel are: the water level, hydrometeorological conditions, as well as other oceanographic parameters, such as pressure, salinity, temperature, and sea currents.

Funding

This research was funded by the statutory activities of Gdynia Maritime University, grant number WN/2024/PZ/05.

Conflicts of Interest

The author declares that there are no conflicts of interest.

References

  1. Li, Z.; Zhai, J.; Wu, F. Shape Similarity Assessment Method for Coastline Generalization. ISPRS Int. J. Geo-Inf. 2018, 7, 283. [Google Scholar] [CrossRef]
  2. Specht, O.; Specht, M.; Stateczny, A.; Specht, C. Concept of an Innovative System for Dimensioning and Predicting Changes in the Coastal Zone Topography Using UAVs and USVs (4DBatMap System). Electronics 2023, 12, 4112. [Google Scholar] [CrossRef]
  3. Specht, M.; Stateczny, A.; Specht, C.; Widźgowski, S.; Lewicka, O.; Wiśniewska, M. Concept of an Innovative Autonomous Unmanned System for Bathymetric Monitoring of Shallow Waterbodies (INNOBAT System). Energies 2021, 14, 5370. [Google Scholar] [CrossRef]
  4. IHO. IHO Standards for Hydrographic Surveys, 6.1.0 ed.; IHO Publication No. 44; IHO: Monte Carlo, Monaco, 2022. [Google Scholar]
  5. Lewicka, O.; Specht, M.; Stateczny, A.; Specht, C.; Dardanelli, G.; Brčić, D.; Szostak, B.; Halicki, A.; Stateczny, M.; Widźgowski, S. Integration Data Model of the Bathymetric Monitoring System for Shallow Waterbodies Using UAV and USV Platforms. Remote Sens. 2022, 14, 4075. [Google Scholar] [CrossRef]
  6. Drummond, C.D.; Harley, M.D.; Turner, I.L.; Matheen, N.; Glamore, W.C. UAV Applications to Coastal Engineering. In Proceedings of the Australasian Coasts & Ports Conference 2015, Auckland, New Zealand, 15–18 September 2015. [Google Scholar]
  7. Nex, F.; Remondino, F. UAV for 3D Mapping Applications: A Review. Appl. Geomat. 2014, 6, 1–15. [Google Scholar] [CrossRef]
  8. Siebert, S.; Teizer, J. Mobile 3D Mapping for Surveying Earthwork Projects Using an Unmanned Aerial Vehicle (UAV) System. Autom. Constr. 2014, 41, 1–14. [Google Scholar] [CrossRef]
  9. HYPACK. NEXUS 800 Powered by HYPACK. Available online: https://www.hypack.com/File%20Library/Resource%20Library/Brochures%20and%20Catalogs/Nexus-800-Brochure.pdf (accessed on 7 September 2024).
  10. Specht, M.; Widźgowski, S.; Stateczny, A.; Specht, C.; Lewicka, O. Comparative Analysis of Unmanned Aerial Vehicles Used in Photogrammetric Surveys. TransNav Int. J. Mar. Navig. Saf. Sea Transp. 2023, 17, 433–443. [Google Scholar] [CrossRef]
  11. Tuśnio, N.; Krzysztofik, I.; Tuśnio, J. Application of Unmanned Aerial Vehicles as a Mobile Monitoring of Fire Hazard. Probl. Mechatr. 2014, 5, 101–114. (In Polish) [Google Scholar]
  12. Danchenkov, A.; Belov, N. Comparative Analysis of the Unmanned Aerial Vehicles and Terrestrial Laser Scanning Application for Coastal Zone Monitoring. Russ. J. Earth. Sci. 2023, 23, ES4008. [Google Scholar] [CrossRef]
  13. Pargieła, K. Optimising UAV Data Acquisition and Processing for Photogrammetry: A Review. Geomat. Environ. Eng. 2023, 17, 29–59. [Google Scholar] [CrossRef]
  14. Suziedelyte Visockiene, J.; Puziene, R.; Stanionis, A.; Tumeliene, E. Unmanned Aerial Vehicles for Photogrammetry: Analysis of Orthophoto Images over the Territory of Lithuania. Int. J. Aerosp. Eng. 2016, 2016, 4141037. [Google Scholar] [CrossRef]
  15. Kurczyński, Z. Photogrammetry; Polish Scientific Publishers PWN: Warsaw, Poland, 2014. (In Polish) [Google Scholar]
  16. Rojek, M. Designing Aerial Photos for Measurement Purposes. Acta Sci. Acad. Ostroviensis 2010, 34, 49–56. (In Polish) [Google Scholar]
  17. Lewicka, O.; Specht, M.; Specht, C. Assessment of the Steering Precision of a UAV along the Flight Profiles Using a GNSS RTK Receiver. Remote Sens. 2022, 14, 6127. [Google Scholar] [CrossRef]
  18. Mousavi, V.; Varshosaz, M.; Rashidi, M.; Li, W. A New Multi-criteria Tie Point Filtering Approach to Increase the Accuracy of UAV Photogrammetry Models. Drones 2022, 6, 413. [Google Scholar] [CrossRef]
  19. Mousavi, V.; Varshosaz, M.; Remondino, F. Evaluating Tie Points Distribution, Multiplicity and Number on the Accuracy of UAV Photogrammetry Blocks. Int. Arch. Photogramm. Remote Sens. Spatial Inf. Sci. 2021, 43, 39–46. [Google Scholar] [CrossRef]
  20. EC. Commission Delegated Regulation (EU) 2019/945 of 12 March 2019 on Unmanned Aircraft Systems and on Third-Country Operators of Unmanned Aircraft Systems; EC: Brussels, Belgium, 2019.
  21. EC. Commission Implementing Regulation (EU) 2019/947 of 24 May 2019 on the Rules and Procedures for the Operation of Unmanned Aircraft; EC: Brussels, Belgium, 2019.
  22. Lassiter, H.A.; Whitley, T.; Wilkinson, B.; Abd-Elrahman, A. Scan Pattern Characterization of Velodyne VLP-16 Lidar Sensor for UAS Laser Scanning. Sensors 2020, 20, 7351. [Google Scholar] [CrossRef]
  23. Hyyppä, J.; Yu, X.; Hakala, T.; Kaartinen, H.; Kukko, A.; Hyyti, H.; Muhojoki, J.; Hyyppä, E. Under-canopy UAV Laser Scanning Providing Canopy Height and Stem Volume Accurately. Forests 2021, 12, 856. [Google Scholar] [CrossRef]
  24. Goodbody, T.R.H.; Coops, N.C.; White, J.C. Digital Aerial Photogrammetry for Updating Area-based Forest Inventories: A Review of Opportunities, Challenges, and Future Directions. Curr. For. Rep. 2019, 5, 55–75. [Google Scholar] [CrossRef]
  25. Seifert, E.; Seifert, S.; Vogt, H.; Drew, D.; van Aardt, J.; Kunneke, A.; Seifert, T. Influence of Drone Altitude, Image Overlap, and Optical Sensor Resolution on Multi-view Reconstruction of Forest Images. Remote Sens. 2019, 11, 1252. [Google Scholar] [CrossRef]
  26. Falkner, E.; Morgan, D. Aerial Mapping: Methods and Applications, 2nd ed.; CRC Press: Boca Raton, FL, USA, 2002. [Google Scholar]
  27. Jiménez-Jiménez, S.I.; Ojeda-Bustamante, W.; Marcial-Pablo, M.d.J.; Enciso, J. Digital Terrain Models Generated with Low-cost UAV Photogrammetry: Methodology and Accuracy. ISPRS Int. J. Geo-Inf. 2021, 10, 285. [Google Scholar] [CrossRef]
  28. Tiwari, A.; Sharma, S.K.; Dixit, A.; Mishra, V. UAV Remote Sensing for Campus Monitoring: A Comparative Evaluation of Nearest Neighbor and Rule-based Classification. J. Indian Soc. Remote Sens. 2021, 49, 527–539. [Google Scholar] [CrossRef]
  29. Grayson, B.; Penna, N.T.; Mills, J.P.; Grant, D.S. GPS Precise Point Positioning for UAV Photogrammetry. Photogramm. Rec. 2018, 33, 427–447. [Google Scholar] [CrossRef]
  30. Luis-Ruiz, J.M.d.; Sedano-Cibrián, J.; Pereda-García, R.; Pérez-Álvarez, R.; Malagón-Picón, B. Optimization of Photogrammetric Flights with UAVs for the Metric Virtualization of Archaeological Sites. Application to Juliobriga (Cantabria, Spain). Appl. Sci. 2021, 11, 1204. [Google Scholar] [CrossRef]
  31. Vautherin, J.; Rutishauser, S.; Schneider-Zapp, K.; Choi, H.F.; Chovancova, V.; Glass, A.; Strecha, C. Photogrammetric Accuracy and Modeling of Rolling Shutter Cameras. ISPRS Ann. Photogramm. Remote Sens. Spatial Inf. Sci. 2016, 3, 139–146. [Google Scholar] [CrossRef]
  32. Pepe, M.; Fregonese, L.; Scaioni, M. Planning Airborne Photogrammetry and Remote-sensing Missions with Modern Platforms and Sensors. Eur. J. Remote Sens. 2018, 51, 412–436. [Google Scholar] [CrossRef]
  33. Ferrer-González, E.; Agüera-Vega, F.; Carvajal-Ramírez, F.; Martínez-Carricondo, P. UAV Photogrammetry Accuracy Assessment for Corridor Mapping Based on the Number and Distribution of Ground Control Points. Remote Sens. 2020, 12, 2447. [Google Scholar] [CrossRef]
  34. Zhang, K.; Okazawa, H.; Hayashi, K.; Hayashi, T.; Fiwa, L.; Maskey, S. Optimization of Ground Control Point Distribution for Unmanned Aerial Vehicle Photogrammetry for Inaccessible Fields. Sustainability 2022, 14, 9505. [Google Scholar] [CrossRef]
  35. Specht, M.; Szostak, B.; Lewicka, O.; Stateczny, A.; Specht, C. Method for Determining of Shallow Water Depths Based on Data Recorded by UAV/USV Vehicles and Processed Using the SVR Algorithm. Measurement 2023, 221, 113437. [Google Scholar] [CrossRef]
  36. Simonetto, E.; Charlet, C.; Labergerie, E.; Batifol, G.; Guivarch, T.; Le Goff, T.; Senra, C. Practical Implementation of Photogrammetry for the Modelling of a Cylindrical Historical Building. Int. Arch. of the Photogramm., Rem. Sens. Spatial Inf. Sci. 2023, 48, 1473–1478. [Google Scholar] [CrossRef]
  37. Tuttas, S.; Braun, A.; Borrmann, A.; Stilla, U. Evaluation of Acquisition Strategies for Image-based Construction Site Monitoring. Int. Arch. of the Photogramm., Rem. Sens. Spatial Inf. Sci. 2016, 41, 733–740. [Google Scholar] [CrossRef]
  38. Baptista, P.; Bastos, L.; Bernardes, C.; Cunha, T.; Dias, J. Monitoring Sandy Shores Morphologies by DGPS—A Practical Tool to Generate Digital Elevation Models. J. Coast. Res. 2008, 24, 1516–1528. [Google Scholar] [CrossRef]
  39. Specht, C.; Specht, M.; Cywiński, P.; Skóra, M.; Marchel, Ł.; Szychowski, P. A New Method for Determining the Territorial Sea Baseline Using an Unmanned, Hydrographic Surface Vessel. J. Coast. Res. 2019, 35, 925–936. [Google Scholar] [CrossRef]
  40. Nowak, A.; Naus, K. Real Time Network Corrections Availability on the Gulf of Gdansk Area during GNSS/RTN Measurements, in the Context of Ship’s Movement Parameters Determination. Logistics 2014, 6, 7913–7922. (In Polish) [Google Scholar]
  41. Koljonen, S.; Huusko, A.; Mäki-Petäys, A.; Louhi, P.; Muotka, T. Assessing Habitat Suitability for Juvenile Atlantic Salmon in Relation to In-stream Restoration and Discharge Variability. Restor. Ecol. 2012, 21, 344–352. [Google Scholar] [CrossRef]
  42. Lane, S.N.; Richards, K.S.; Chandler, J.H. Developments in Monitoring and Modelling Small-scale River Bed Topography. Earth Surf. Process. Landf. 1994, 19, 349–368. [Google Scholar] [CrossRef]
  43. Gabrlik, P. The Use of Direct Georeferencing in Aerial Photogrammetry with Micro UAV. IFAC-Pap. 2015, 48, 380–385. [Google Scholar] [CrossRef]
  44. Liu, X.; Lian, X.; Yang, W.; Wang, F.; Han, Y.; Zhang, Y. Accuracy Assessment of a UAV Direct Georeferencing Method and Impact of the Configuration of Ground Control Points. Drones 2022, 6, 30. [Google Scholar] [CrossRef]
  45. Correia, C.A.M.; Andrade, F.A.A.; Sivertsen, A.; Guedes, I.P.; Pinto, M.F.; Manhães, A.G.; Haddad, D.B. Comprehensive Direct Georeferencing of Aerial Images for Unmanned Aerial Systems Applications. Sensors 2022, 22, 604. [Google Scholar] [CrossRef]
  46. Jekeli, C. Inertial Navigation Systems with Geodetic Applications; Walter de Gruyter: Berlin, Germany, 2012. [Google Scholar]
  47. Bagherbandi, M.; Jouybari, A.; Nilfouroushan, F.; Ågren, J. Deflection of Vertical Effect on Direct Georeferencing in Aerial Mobile Mapping Systems: A Case Study in Sweden. Photogramm. Rec. 2022, 37, 285–305. [Google Scholar] [CrossRef]
  48. Kurczyński, Z.; Preuss, R. Basics of Photogrammetry, 5th ed.; Publishing House of the Warsaw University of Technology: Warsaw, Poland, 2011. (In Polish) [Google Scholar]
  49. Gao, M.; Hugenholtz, C.H.; Fox, T.A.; Kucharczyk, M.; Barchyn, T.E.; Nesbit, P.R. Weather Constraints on Global Drone Flyability. Sci. Rep. 2021, 11, 12092. [Google Scholar] [CrossRef]
  50. DSLR TIPS. DSLR Tips Workshop: Using Polarizing Filters to Cut through Haze and Deepen Blue Skies. Available online: http://www.dslrtips.com/workshops/How_to_use_polarizing_filters/reduce_haze_deep_blue_sky.shtml (accessed on 7 September 2024).
  51. FreePhotoCourse.com. HOW TO... Create a Dramatic Dark Sky Effect in Photography. Available online: https://freephotocourse.com/how-to---dramatic-dark-sky-effect.html (accessed on 7 September 2024).
  52. Schweiger, K.; Schmitz, R.; Knabe, F. Impact of Wind on eVTOL Operations and Implications for Vertiport Airside Traffic Flows: A Case Study of Hamburg and Munich. Drones 2023, 7, 464. [Google Scholar] [CrossRef]
  53. Mohsan, S.A.H.; Khan, M.A.; Noor, F.; Ullah, I.; Alsharif, M.H. Towards the Unmanned Aerial Vehicles (UAVs): A Comprehensive Review. Drones 2022, 6, 147. [Google Scholar] [CrossRef]
  54. Gianfelice, M.; Aboshosha, H.; Ghazal, T. Real-time Wind Predictions for Safe Drone Flights in Toronto. Results Eng. 2022, 15, 100534. [Google Scholar] [CrossRef]
  55. Wingtra. What Are the Best Mapping Drones in Wind? Available online: https://wingtra.com/best-mapping-drones-in-wind/ (accessed on 7 September 2024).
  56. Kim, S.J.; Lim, G.J.; Cho, J. Drone Flight Scheduling Under Uncertainty on Battery Duration and Air Temperature. Comput. Ind. Eng. 2018, 117, 291–302. [Google Scholar] [CrossRef]
  57. Specht, C.; Weintrit, A.; Specht, M. Determination of the Territorial Sea Baseline—Aspect of Using Unmanned Hydrographic Vessels. TransNav Int. J. Mar. Navig. Saf. Sea Transp. 2016, 10, 649–654. [Google Scholar] [CrossRef]
  58. Constantinoiu, L.-F.; Bernardino, M.; Rusu, E. Autonomous Shallow Water Hydrographic Survey Using a Proto-type USV. J. Mar. Sci. Eng. 2023, 11, 799. [Google Scholar] [CrossRef]
  59. Sotelo-Torres, F.; Alvarez, L.V.; Roberts, R.C. An Unmanned Surface Vehicle (USV): Development of an Autonomous Boat with a Sensor Integration System for Bathymetric Surveys. Sensors 2023, 23, 4420. [Google Scholar] [CrossRef]
  60. Erena, M.; Atenza, J.F.; García-Galiano, S.; Domínguez, J.A.; Bernabé, J.M. Use of Drones for the Topo-bathymetric Monitoring of the Reservoirs of the Segura River Basin. Water 2019, 11, 445. [Google Scholar] [CrossRef]
  61. Lubczonek, J.; Kazimierski, W.; Zaniewicz, G.; Lacka, M. Methodology for Combining Data Acquired by Unmanned Surface and Aerial Vehicles to Create Digital Bathymetric Models in Shallow and Ultra-shallow Waters. Remote Sens. 2022, 14, 105. [Google Scholar] [CrossRef]
  62. Specht, O. Land and Seabed Surface Modelling in the Coastal Zone Using UAV/USV-based Data Integration. Sensors 2023, 23, 8020. [Google Scholar] [CrossRef]
  63. Giordano, F.; Mattei, G.; Parente, C.; Peluso, F.; Santamaria, R. Integrating Sensors into a Marine Drone for Bathymetric 3D Surveys in Shallow Waters. Sensors 2016, 16, 41. [Google Scholar] [CrossRef]
  64. Romano, A.; Duranti, P. Autonomous Unmanned Surface Vessels for Hydrographic Measurement and Environmental Monitoring. In Proceedings of the FIG Working Week 2012, Rome, Italy, 6–10 May 2012. [Google Scholar]
  65. Specht, C.; Świtalski, E.; Specht, M. Application of an Autonomous/Unmanned Survey Vessel (ASV/USV) in Bathymetric Measurements. Pol. Marit. Res. 2017, 24, 36–44. [Google Scholar] [CrossRef]
  66. Li, S.; Su, D.; Yang, F.; Zhang, H.; Wang, X.; Guo, Y. Bathymetric LiDAR and Multibeam Echo-sounding Data Registration Methodology Employing a Point Cloud Model. Appl. Ocean. Res. 2022, 123, 103147. [Google Scholar] [CrossRef]
  67. Madricardo, F.; Foglini, F.; Kruss, A.; Ferrarin, C.; Pizzeghello, N.M.; Murri, C.; Rossi, M.; Bajo, M.; Bellafiore, D.; Campiani, E.; et al. High Resolution Multibeam and Hydrodynamic Datasets of Tidal Channels and Inlets of the Venice Lagoon. Sci. Data 2017, 4, 170121. [Google Scholar] [CrossRef]
  68. Li, D.; Shangguan, D.; Wang, X.; Ding, Y.; Su, P.; Liu, R.; Wang, M. Expansion and Hazard Risk Assessment of Glacial Lake Jialong Co in the Central Himalayas by Using an Unmanned Surface Vessel and Remote Sensing. Sci. Total Environ. 2021, 784, 147249. [Google Scholar] [CrossRef] [PubMed]
  69. Marchel, Ł.; Specht, C.; Specht, M. Assessment of the Steering Precision of a Hydrographic USV along Sounding Profiles Using a High-precision GNSS RTK Receiver Supported Autopilot. Energies 2020, 13, 5637. [Google Scholar] [CrossRef]
  70. Xiang, M.; Chai, H.; Yin, H.; Du, Z.; Jin, K. Precise Navigation of USV Based on PPP-RTK/MEMS in the Offshore Environment. Mar. Geod. 2023, 46, 441–459. [Google Scholar] [CrossRef]
  71. Lubczonek, J.; Zaniewicz, G. Application of Filtering Techniques to Smooth a Surface of Hybrid Digital Bathymetric Model. Remote Sens. 2023, 15, 4737. [Google Scholar] [CrossRef]
  72. Makar, A. Coastal Bathymetric Sounding in Very Shallow Water Using USV: Study of Public Beach in Gdynia, Poland. Sensors 2023, 23, 4215. [Google Scholar] [CrossRef]
  73. Stateczny, A.; Specht, C.; Specht, M.; Brčić, D.; Jugović, A.; Widźgowski, S.; Wiśniewska, M.; Lewicka, O. Study on the Positioning Accuracy of GNSS/INS Systems Supported by DGPS and RTK Receivers for Hydrographic Surveys. Energies 2021, 14, 7413. [Google Scholar] [CrossRef]
  74. Kim, H.; Jung, J.; Lee, J.; Wie, G. Water Bottom and Surface Classification Algorithm for Bathymetric LiDAR Point Clouds of Very Shallow Waters. Can. J. Remote Sens. 2023, 49, 2172957. [Google Scholar] [CrossRef]
  75. Andersen, M.S.; Gergely, Á.; Al-Hamdani, Z.; Steinbacher, F.; Larsen, L.R.; Ernstsen, V.B. Processing and Performance of Topobathymetric LiDAR Data for Geomorphometric and Morphological Classification in a High-energy Tidal Environment. Hydrol. Earth Syst. Sci. 2017, 21, 43–63. [Google Scholar] [CrossRef]
  76. NOAA. Hydrographic Surveys Specifications and Deliverables; NOAA: Silver Spring, MD, USA, 2017.
  77. Specht, M.; Specht, C.; Wąż, M.; Naus, K.; Grządziel, A.; Iwen, D. Methodology for Performing Territorial Sea Baseline Measurements in Selected Waterbodies of Poland. Appl. Sci. 2019, 9, 3053. [Google Scholar] [CrossRef]
  78. USACE. Engineering And Design: Hydrographic Surveying, Engineer Manual No. 1110-2-1003; USACE: Washington, DC, USA, 2013.
  79. Łubczonek, J.; Juszkiewicz, W. A Conception of Visualisation of Safe Depth Area. Sci. J. Marit. Univ. Szczec. 2004, 2, 245–254. (In Polish) [Google Scholar]
  80. Zhuang, J.; Zhang, L.; Wang, B.; Su, Y.; Sun, H.; Liu, Y.; Bucknall, R. Navigating High-speed Unmanned Surface Vehicles: System Approach and Validations. J. Field Robot. 2021, 38, 619–652. [Google Scholar] [CrossRef]
  81. Šiljeg, A.; Marić, I.; Domazetović, F.; Cukrov, N.; Lovrić, M.; Panđa, L. Bathymetric Survey of the St. Anthony Channel (Croatia) Using Multibeam Echosounders (MBES)—A New Methodological Semi-automatic Approach of Point Cloud Post-processing. J. Mar. Sci. Eng. 2022, 10, 101. [Google Scholar] [CrossRef]
  82. Calderbank, B.; MacLeod, A.M.; McDorman, T.L.; Gray, D.H. Canada’s Offshore: Jurisdiction, Rights and Management, 3rd ed.; Trafford Publishing: Victoria, BC, Canada, 2006. [Google Scholar]
  83. EC. Commission Regulation (EU) No. 102/2011 of 4 February 2011 Amending Regulation (EU) No. 1089/2010 Implementing Directive 2007/2/EC of the European Parliament and of the Council as Regards Interoperability of Spatial Data Sets and Services; EC: Brussels, Belgium, 2011.
  84. IMGW-PIB. Vademecum—Hydrological Measurements and Observations. Available online: https://docplayer.pl/51615096-Pomiary-i-obserwacje-hydrologiczne.html (accessed on 7 September 2024). (In Polish).
  85. Council of Ministers of the Republic of Poland. Ordinance of the Council of Ministers of 15 October 2012 on the National Spatial Reference System; Council of Ministers of the Republic of Poland: Warsaw, Poland, 2012. (In Polish)
  86. Council of Ministers of the Republic of Poland. Ordinance of the Council of Ministers of 19 December 2019 Amending the Regulation on the National Spatial Reference System; Council of Ministers of the Republic of Poland: Warsaw, Poland, 2019. (In Polish)
  87. Medvedev, I.P.; Rabinovich, A.B.; Kulikov, E.A. Tidal Oscillations in the Baltic Sea. Oceanology 2013, 53, 526–538. [Google Scholar] [CrossRef]
  88. UKHO. ADMIRALTY Tide Tables; UKHO: Taunton, Great Britain, 2023.
  89. Talley, L.D.; Pickard, G.L.; Emery, W.J.; Swift, J.H. Descriptive Physical Oceanography: An Introduction, 6th ed.; Academic Press: Cambridge, MA, USA, 2011. [Google Scholar]
  90. Specht, C.; Lewicka, O.; Specht, M.; Dąbrowski, P.; Burdziakowski, P. Methodology for Carrying out Measurements of the Tombolo Geomorphic Landform Using Unmanned Aerial and Surface Vehicles near Sopot Pier, Poland. J. Mar. Sci. Eng. 2020, 8, 384. [Google Scholar] [CrossRef]
  91. IMGW-PIB. Forecasts for the Baltic Sea. Available online: https://baltyk.imgw.pl/ (accessed on 7 September 2024). (In Polish).
  92. Amoroso, P.P.; Parente, C. The Importance of Sound Velocity Determination for Bathymetric Survey. Acta IMEKO 2021, 10, 46–53. [Google Scholar] [CrossRef]
  93. Makar, A. Simplified Method of Determination of the Sound Speed in Water on the Basis of Temperature Measurements and Salinity Prediction for Shallow Water Bathymetry. Remote Sens. 2022, 14, 636. [Google Scholar] [CrossRef]
  94. Li, C.; Xue, B.; Yang, Z. Direct Measurement of the Sound Velocity in Water Based on the Acousto-optic Signal. Appl. Opt. 2021, 60, 2455–2464. [Google Scholar] [CrossRef] [PubMed]
  95. Zhang, S.; Xu, X.; Xu, D.; Long, K.; Shen, C.; Tian, C. The Design and Calibration of a Low-cost Underwater Sound Velocity Profiler. Front. Mar. Sci. 2022, 9, 996299. [Google Scholar] [CrossRef]
  96. Makar, A. Method of Determination of Acoustic Wave Reflection Points in Geodesic Bathymetric Surveys. Annu. Navig. 2008, 14, 1–89. [Google Scholar]
  97. Xiao, S.; Zhang, M.; Liu, C.; Jiang, C.; Wang, X.; Yang, F. CTD Sensors for Ocean Investigation Including State of Art and Commercially Available. Sensors 2023, 23, 586. [Google Scholar] [CrossRef]
  98. Chen, C.T.; Millero, F.J. Reevaluation of Wilson’s Sound-speed Measurements for Pure Water. J. Acoust. Soc. Am. 1976, 60, 1270–1273. [Google Scholar] [CrossRef]
  99. Chen, C.T.; Millero, F.J. Speed of Sound in Seawater at High Pressures. J. Acoust. Soc. Am. 1977, 62, 1129–1135. [Google Scholar] [CrossRef]
  100. Del Grosso, V.A. New Equation for the Speed of Sound in Natural Waters (with Comparisons to Other Equations). J. Acoust. Soc. Am. 1974, 56, 1084–1091. [Google Scholar] [CrossRef]
  101. Mackenzie, K.V. Nine Equation for Sound Speed in the Oceans. J. Acoust. Soc. Am. 1981, 33, 1498–1504. [Google Scholar] [CrossRef]
  102. Mackenzie, K.V. Nine-term Equation for Sound Speed in the Oceans. J. Acoust. Soc. Am. 1981, 70, 807–812. [Google Scholar] [CrossRef]
  103. Medwin, H. Speed of Sound in Water: A Simple Equation for Realistic Parameters. J. Acoust. Soc. Am. 1975, 58, 1318–1319. [Google Scholar] [CrossRef]
  104. Wilson, W.D. Equation for the Speed of Sound in Sea Water. J. Acoust. Soc. Am. 1960, 32, 1357. [Google Scholar] [CrossRef]
  105. Makar, A.; Naus, K. Obtaining of Data for Digital Sea Bottom Model. Archives of Photogrammetry, Cartography and Remote Sensing 2003, 13, 163–170. (In Polish) [Google Scholar]
  106. NASA. Ocean Surface Currents (OSCAR). Available online: http://oceanmotion.org/html/resources/oscar.htm (accessed on 7 September 2024).
  107. Ostrowska, M.; Darecki, M.; Krężel, A.; Ficek, D.; Furmańczyk, K. Practical Applicability and Preliminary Results of the Baltic Environmental Satellite Remote Sensing System (Satbałtyk). Pol. Marit. Res. 2015, 22, 43–49. [Google Scholar] [CrossRef]
  108. Ostrowska, M.; Darecki, M.; Kowalewski, M.; Krężel, A.; Dera, J. SatBałtyk System: Satellite Monitoring of the Baltic Sea Environment, Structure, Functioning, Operational Possibilities; IO PAN: Sopot, Poland, 2015. (In Polish) [Google Scholar]
  109. NOAA. Guidelines for Bathymetric Mapping and Orthoimage Generation Using sUAS and SfM. Available online: https://coastalscience.noaa.gov/data_reports/guidelines-for-bathymetric-mapping-and-orthoimage-generation-using-suas-and-sfm-an-approach-for-conducting-nearshore-coastal-mapping/ (accessed on 7 September 2024).
  110. Gonçalves, J.A.; Henriques, R. UAV Photogrammetry for Topographic Monitoring of Coastal Areas. ISPRS J. Photogramm. Remote Sens. 2015, 104, 101–111. [Google Scholar] [CrossRef]
  111. Zanutta, A.; Lambertini, A.; Vittuari, L. UAV Photogrammetry and Ground Surveys as a Mapping Tool for Quickly Monitoring Shoreline and Beach Changes. J. Mar. Sci. Eng. 2020, 8, 52. [Google Scholar] [CrossRef]
Figure 1. A diagram of the operation and functioning of an innovative autonomous unmanned system for bathymetric monitoring of shallow waterbodies (INNOBAT system) [3].
Remotesensing 16 03328 g001
Figure 2. Dependence of the flight time on the weight of the load being carried for selected mass-produced UAVs [10].
Remotesensing 16 03328 g002
Figure 4. The 3D point clouds for the coastal zone located at the Vistula Śmiała River mouth in Gdańsk, generated based on aerial photos taken at an altitude of 70 m (a) and 120 m (b).
Remotesensing 16 03328 g004
Figure 6. Mission Planner software for planning photogrammetric surveys [32].
Remotesensing 16 03328 g006
Figure 7. Atmospheric transparency coefficient as a function of wavelength (a) and seasonal changes (b). Own study based on: [48].
Remotesensing 16 03328 g007
Figure 8. Direct illumination of the Earth’s surface as a function of the Sun’s height over the horizon under various atmospheric conditions: high, woolly clouds in the Sun (1); no clouds in the Sun (2); high, woolly clouds in the shade (3); no clouds in the shade (4); and full cloud cover (5). Own study based on: [48].
Remotesensing 16 03328 g008
Figure 9. HYPACK software used for planning hydrographic surveys [69].
Remotesensing 16 03328 g009
Figure 10. The range of daily changes in the speed of sound in water during the summer season in Gdańsk Bay [96,105].
Remotesensing 16 03328 g010
Figure 11. Methodology for performing photogrammetric surveys using a UAV in the coastal zone.
Remotesensing 16 03328 g011
Figure 12. Methodology for performing photogrammetric surveys using a USV in the coastal zone.
Remotesensing 16 03328 g012
Table 1. Summary of selected requirements for IHO hydrographic surveys. Own study based on: [4].
CriterionExclusiveOrder1a1b2
Area descriptionAreas where there is strict minimum UKC and manoeuvrability criteriaAreas where UKC is criticalAreas where UKC is considered not to be critical but features of concern in regard to surface shipping may existAreas where UKC is not considered to be an issue for the type of surface shipping expected to transit the areaAreas where a general description of the sea floor is considered adequate
THU1 m2 m5 m + 5% of depth5 m + 5% of depth20 m + 5% of depth
TVUa = 0.15 m
b = 0.0075
a = 0.25 m
b = 0.0075
a = 0.5 m
b = 0.013
a = 0.5 m
b = 0.013
a = 1.0 m
b = 0.023
Bathymetric coverage200%100%≤100%5%5%
Maximum distance between the sounding profilesNot specifiedNot specifiedNot specifiedThree times water depth or 25 m, whichever is greaterFour times water depth
Accuracy of determining the coastline5 m10 m10 m10 m10 m
Disclaimer/Publisher’s Note: The statements, opinions and data contained in all publications are solely those of the individual author(s) and contributor(s) and not of MDPI and/or the editor(s). MDPI and/or the editor(s) disclaim responsibility for any injury to people or property resulting from any ideas, methods, instructions or products referred to in the content.

