Article

Design of a Near-Field Synthetic Aperture Radar Imaging System Based on Improved RMA

School of Physics and Electronics, Shandong Normal University, Jinan 250358, China
*
Author to whom correspondence should be addressed.
Remote Sens. 2024, 16(17), 3342; https://doi.org/10.3390/rs16173342
Submission received: 28 July 2024 / Revised: 3 September 2024 / Accepted: 4 September 2024 / Published: 9 September 2024
(This article belongs to the Special Issue State-of-the-Art and Future Developments: Short-Range Radar)

Abstract

:
Traditional near-field synthetic aperture radar (SAR) imaging algorithms reveal target features by exploiting signal amplitude and phase information. However, electromagnetic wave propagation is constrained by short distance. Therefore, the spherical wave approximation needs to be considered. In addition, it is also limited by equipment ambient noise, azimuth-distance coupling, wave scattering, and transmission power. Both the amplitude and phase of the signal suffer from the interference of multiple clutter, so they cannot be effectively utilized. To address these issues, this paper introduces a covering penetration detection system based on an improved Range Migration Algorithm (IMRMA) imaging method. Firstly, the proposed method minimizes interferences from the front end of the system using an optimized window to balance denoising and information preservation. Next, interval non-uniform interpolation, instead of Stolt interpolation decoupling, is employed to reduce the computational overhead significantly. To minimize the effects due to wave scattering and propagation loss, distance information is enhanced using amplitude and phase compensation. This reduces scattering effects and enhances image quality. An experimental system is constructed based on a vector network analyzer (VNA) to image the target. The proposed method takes about half the time of traditional RMA. The PSNR in the chunky bowl experiment is higher than 14 dB, which is higher than all the compared methods in the paper. The test results show that the designed system and the reported method can effectively achieve high-resolution images by strengthening the target intensity and suppressing the environmental artifacts.

1. Introduction

Microwave imaging technology has been widely utilized in various fields, such as security [1,2], medical diagnosis [3], non-destructive testing [4], ground probing, and pipeline leakage detection [5,6], due to its low ionizing radiation, high resolution, and penetrative capabilities. With the development of the synthetic aperture radar (SAR) in recent years, the near-field SAR has made its presence in many fields [7,8]. Compared with the complexity of inverse backscattering methods [9], the SAR method is more concise and efficient. There are many well-established imaging algorithms for various specific SAR methods. For example, the back projection algorithm (BPA) is a time-domain algorithm [10] without geometrical approximation. However, the BPA encounters the challenge of a heavy computational burden for imaging. The frequency domain algorithms, such as RDA [11] and CSA [12], utilizing approximation conditions to simplify the imaging process, are not directly applicable to near-field imaging. Compared with the above methods, the Range Migration Algorithm (RMA) uses Stolt interpolation to correct the coupling of distance direction with azimuth and altitude direction in the three-dimensional (3D) frequency domain. RMA was originated from seismic migration techniques [13] and demonstrated by a preliminary 3D radar RMA imaging system [14]. This method is more accurate among frequency domain algorithms and requires a lower computational overhead than BPA. However, imaging quality and costs need to be continuously enhanced with the increasing requirements of reality.
To minimize the effects of noise, the vector network analyzer (VNA) developed in [15] uses a single-conversion technique and phase noise cancellation to suppress the injection pulling effect and local oscillator (LO) phase noise. Nevertheless, it is generally insufficient to rely solely on hardware front-end processing when faced with more intricate scenarios. To achieve universality and simplicity in the implementation the system starts with decoupling the transmission signal and antenna. Regarding algorithms [16], a novel clutter mitigation algorithm, combined with singular value decomposition (SVD) and response cross-correlation analysis, was proposed in [17] to reduce clutter interference. However, the effects of multiple heterogeneous ground clutter were not examined. The focusing strength of the target is another important issue in the case of reducing the influence of noise.
In near-field propagation, the imaging quality is degraded due to the curvature of the spherical wavefront, which is affected by wave scattering and loss. In [18], imaging based on the time-domain minimum entropy method was proposed to realize super-resolution (SR) near-field target imaging. However, there is still a problem of incomplete data that affects imaging quality. At low signal-to-noise ratios, the imaging quality further deteriorates. Amplitude attenuation is not negligible. Multiple-input multiple-output (MIMO) RMA [19] for near-field millimeter wave range compensation was better suited to compensate for the propagation loss. The amplitude of received signals has attracted more attention. The phase information in the distance aspect, which has a great potential to improve imaging performance, has been largely neglected. With the help of a two-dimensional phase unfolding technique [20], finer distance information was obtained. In recent research, phase error estimation was replaced with a controlled point spread function optimization [21]. Therefore, target focusing can be enhanced by obtaining accurate phase migration and amplitude compensation.
Although improving imaging quality is a central theme in target detection, real-time operation is also critical when faced with practical applications, particularly in terms of quick acquisition and processing efficiency.
While RMA improves the computational efficiency over BPA, interpolation still incurs some overhead. To further reduce the computational burden, a novel transverse spectral deconvolution RMA has been proposed [22]. It was faster and more accurate than the traditional RMA processing. Moreover, it required expensive imaging equipment and new implementations with frequency-varying antennas. To minimize the system cost, it was worth considering incorporating super-resolution (SR) into the RMA algorithm [23] to improve computational efficiency. To reduce the time-consuming operation of interpolation, distance summation can be used as a substitute for interpolation [24]. This avoided Stolt mapping and 3D IFFT. In addition, FFT can be used in the uniform direction in k-space, and SAR can be used in the non-uniform direction [25]. This allowed for the rapid reconstruction of SAR images.
In addition to improving the efficiency of the algorithms, increasing the rate of the acquisition is another way to achieve real-time performance. In system configuration, uniform scanning is required to accommodate the RMA algorithm [26]. This consumes a lot of time and restricts the types of arrays that can be used in practice. Therefore, many researchers have reduced the data acquisition time by optimizing the scanning structure. Efficient 3D SAR imaging of arbitrary linear MIMO array topologies was presented in [27]. The above were plane-based linear array scans. These methods fail when the moving target undergoes non-regular motion. For this reason, small shape factor multiple-input multiple-output (MIMO) radars and efficient single-site planar image reconstruction algorithms [28] can be exploited in near-field imaging of non-regular scanning geometries.
In this paper, we utilize the high resolution and resolvability of the SAR imaging method to expand the radar imaging, which is from the original large-viewing angle far distance to the near-field distance. Since the VNA [29] can flexibly implement radar experiments for a wide range of radar topologies and detection scenarios, the VNA combined with a frequency domain RMA is proposed to image an aircraft model and a few metallic objects [30]. For this purpose, we use the VNA to transmit signals and store data. Combined with the above analysis, we have implemented a SAR imaging algorithm with lower complexity compared to the inverse scattering solution of the pathology equation. This approach aims to reduce the computational complexity and improve the imaging design [31] by integrating distance information enhancement and physical correction.
The main contributions of this paper are listed as follows:
  • A near-field SAR system is constructed using the VNA, a programmable logic controller (PLC), and horn antennas to image the covered object. The automatic data acquisition procedures are developed independently, which greatly reduced the data acquisition time. We also cascade the scanning and acquisition systems together. Only data acquisition is required for imaging; no separate reorganization and computation is needed. The scanning system can adaptively parameterize the scanning scene according to the quality of the image.
  • To obtain more accurate data, isolated wave-absorbing materials and an optimized window are added to reduce interference. The results using the image evaluation metrics are adapted from a well-matched filter window. The enhancement of the imaging results by the above methods was verified through a series of experiments.
  • Based on the traditional RMA algorithm, the compensation and interpolation are improved. A magnitude factor is introduced in the field of view to achieve distance enhancement. Phase correction for phase compensation is used to achieve a better imaging effect. The Stolt interpolation method is changed to improve the computing efficiency of the algorithm.
The rest of the paper is organized as follows. Section 2 focuses on the antenna and system configuration. Section 3 describes the basic principle and the steps of the improved algorithm. Section 4 mainly describes the experiments and discusses the experimental results, including simulated images and real data imaging to demonstrate the effectiveness and robustness of the proposed method. The superiority of the proposed method is demonstrated by comparing the imaging results of the proposed method and the basic method. Finally, the conclusion summarizes the applicability of the system developed in this paper and the validity of the method, as well as some insights for future work.

2. System Configuration

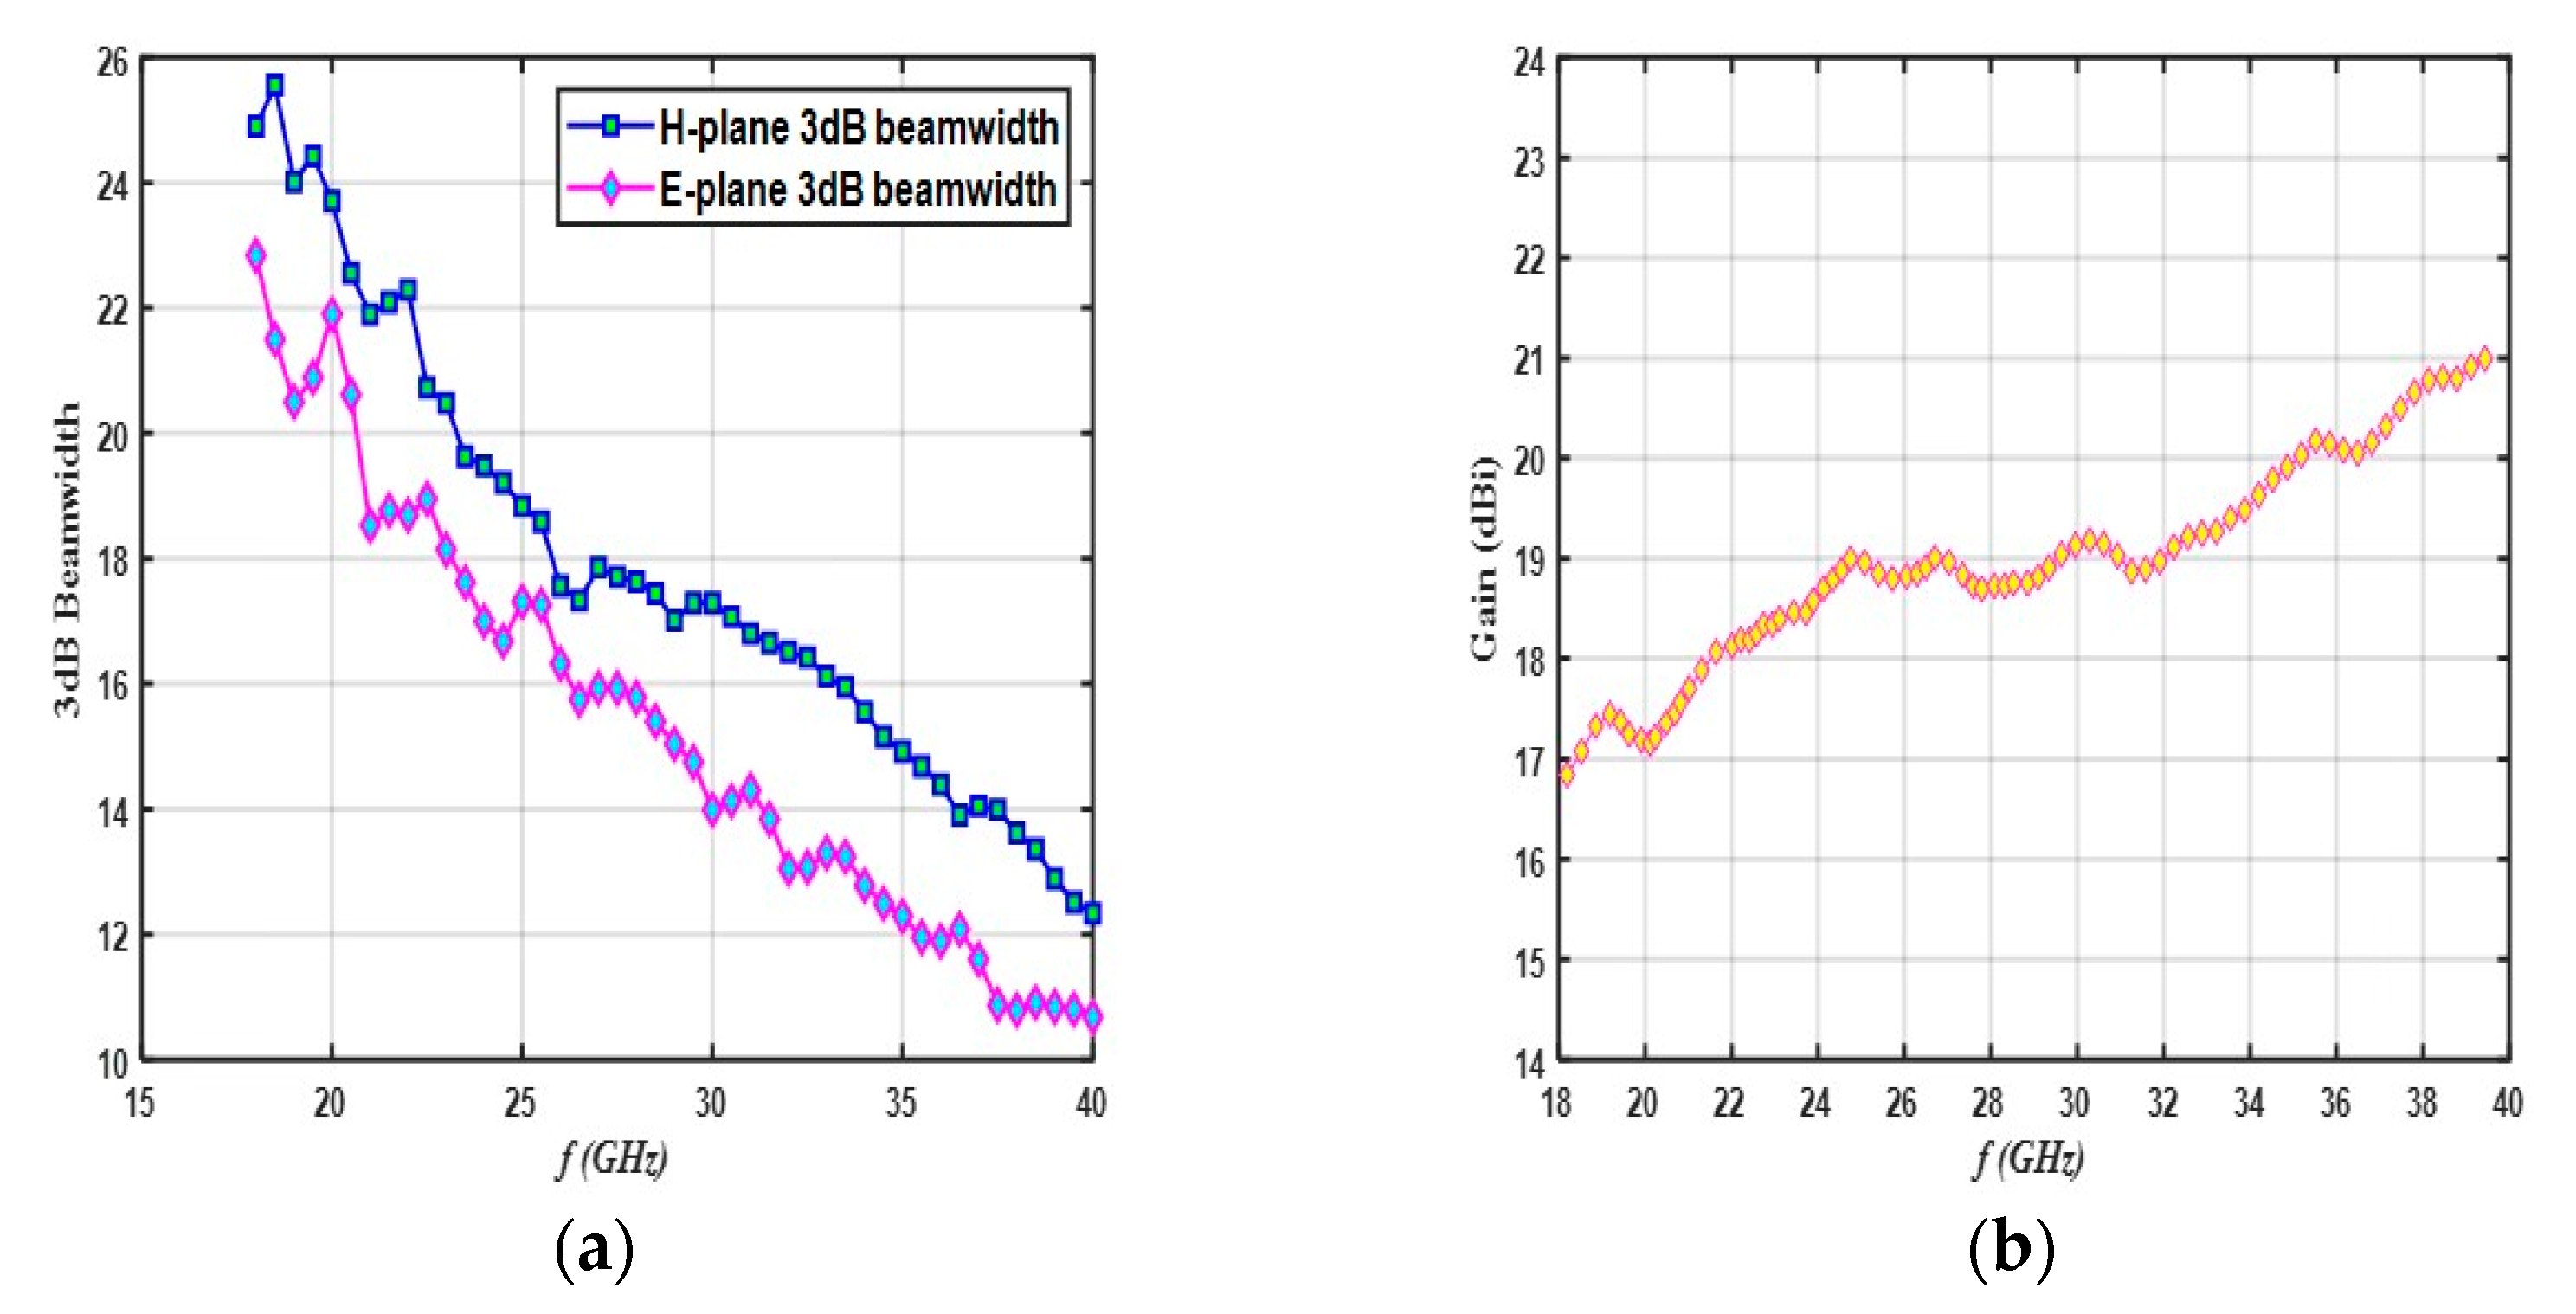
2.1. Description of the Antenna

The system proposed in this paper comprises two subsystems: data acquisition and data processing. Data acquisition is primarily carried out by hardware acquisition devices. Among them, the antenna acts as a signal converter, which has significant impacts on the accuracy of data collection. In this paper, two antennas with different frequency bands are used to enhance the quality of signal receptions. Because the studied targets have a thin covering, the need for resolution is greater than penetration. Consequently, the Ka-band, which is the slightly higher of the two frequency bands, is chosen as the primary band. The antenna selected for the experiment is a horn antenna manufactured by Inland Microwave. It has an allowable frequency range of 18–40 GHz, is linearly polarized with a cross-polarization isolation of 35 dB, and has a dimension of 55 × 55 × 87 mm3. The 3 dB beamwidth and the gain of the antenna are presented in Figure 1.
A near-field SAR system was constructed in a real environment to explore the detection performance of obscured objects. Beyond antenna’s excellence, data acquisition to processing was meticulously handled. It aimed to evaluate detection under coverings and broaden application areas.

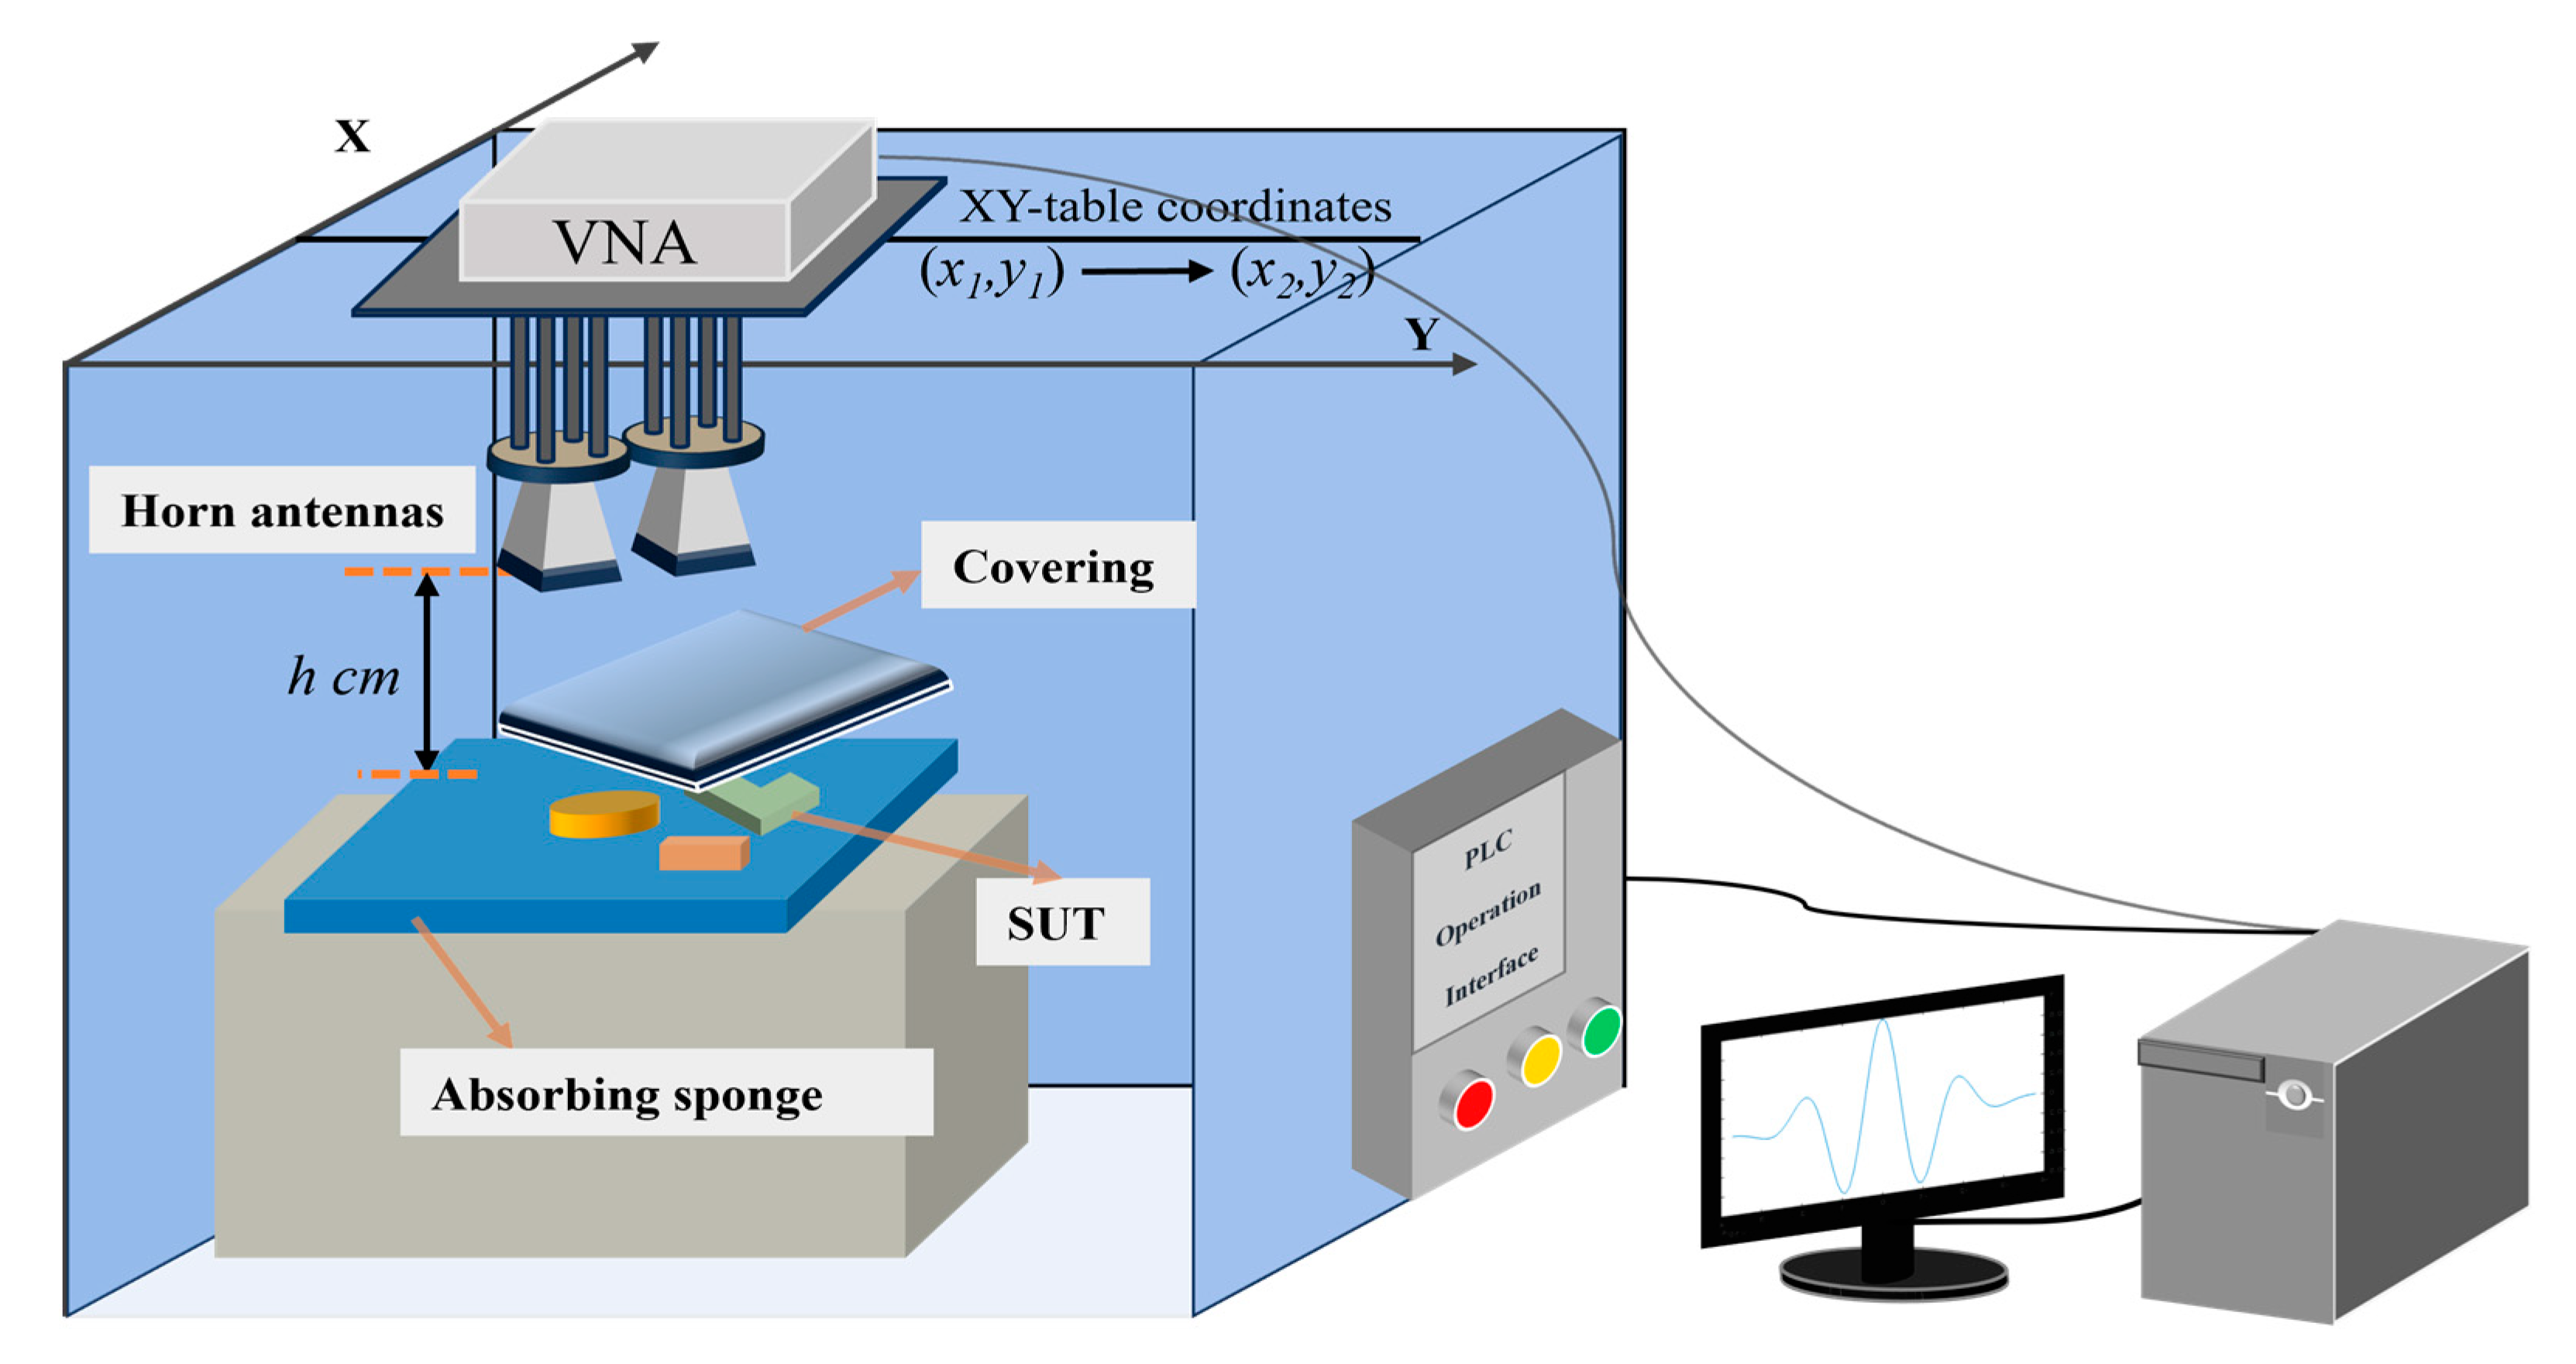
2.2. System Structure

The system has three main parts: PLC, the radar scanning system, and data acquisition. The PLC is manufactured by Siemens and is programmed and designed using WinCCFlexibleSMARTV3SP2. The Copper Mountain VNA S5243 dual-port, which can support the 10 M–44 GHz SFCW output, is selected. The part number of the antenna is described in Section 2.1. The specific model is LB-180400-20-C-KF manufactured by Inland Microwave. The overall scenario is shown in Figure 2. The scanning and imaging systems are cascaded together, and this integrated approach not only improves the processing speed but also the accuracy of target reconstruction. The combination of VNA and independent antenna is chosen to constitute the signal transceiver. This can cope with the demands of multiple scenes. The coherent combination of signals using multiple frequency bands is used to enhance the resolution of the image.
PLC allows users to send experimental parameters and operational commands via a software interface to the control system and enables automated antenna scanning for data collection. The software is compiled in Python 3.7 and the acquisition equipment is composed of two antennas and a VNA. We compare the radar acquisition method, which differs from the shipborne, airborne, and star-carried methods. When collecting data on a small scale, the impact of operations on imaging results will be magnified. We pay attention to the scanning methods in the field of radar imaging in terms of the cost and the complexity of implementation. In the initial stage, we adopt the simpler scanning methods of S-type and Z-type structures. Compared to other methods such as irregular scanning structures and phased arrays that have been gradually expanding in recent years, it greatly reduces theoretical complexity and cost. However, these scanning structures also bring the corresponding problems, namely, low scanning efficiency and high time overhead costs.
Data acquisition is conducted by a software program to greatly improve the acquisition efficiency and reduce the errors made by manual acquisition. The pre-set experimental parameters are inputted into the software, which connects the PLC control interface and the data acquisition interface. This process enables the complete automation of the data acquisition process, including launching, transmitting, receiving, and storing the data. Establishing the data collection time threshold at the point where data stability transitions to instability is crucial to prevent an excessively rapid data collection pace. Nonetheless, in situations where time requirements are not particularly strict, a compromise between speed and actual application scenarios can be adopted. In a simple scanning mode, speeding up the data collection process as much as possible is tried.

3. Imaging Methods

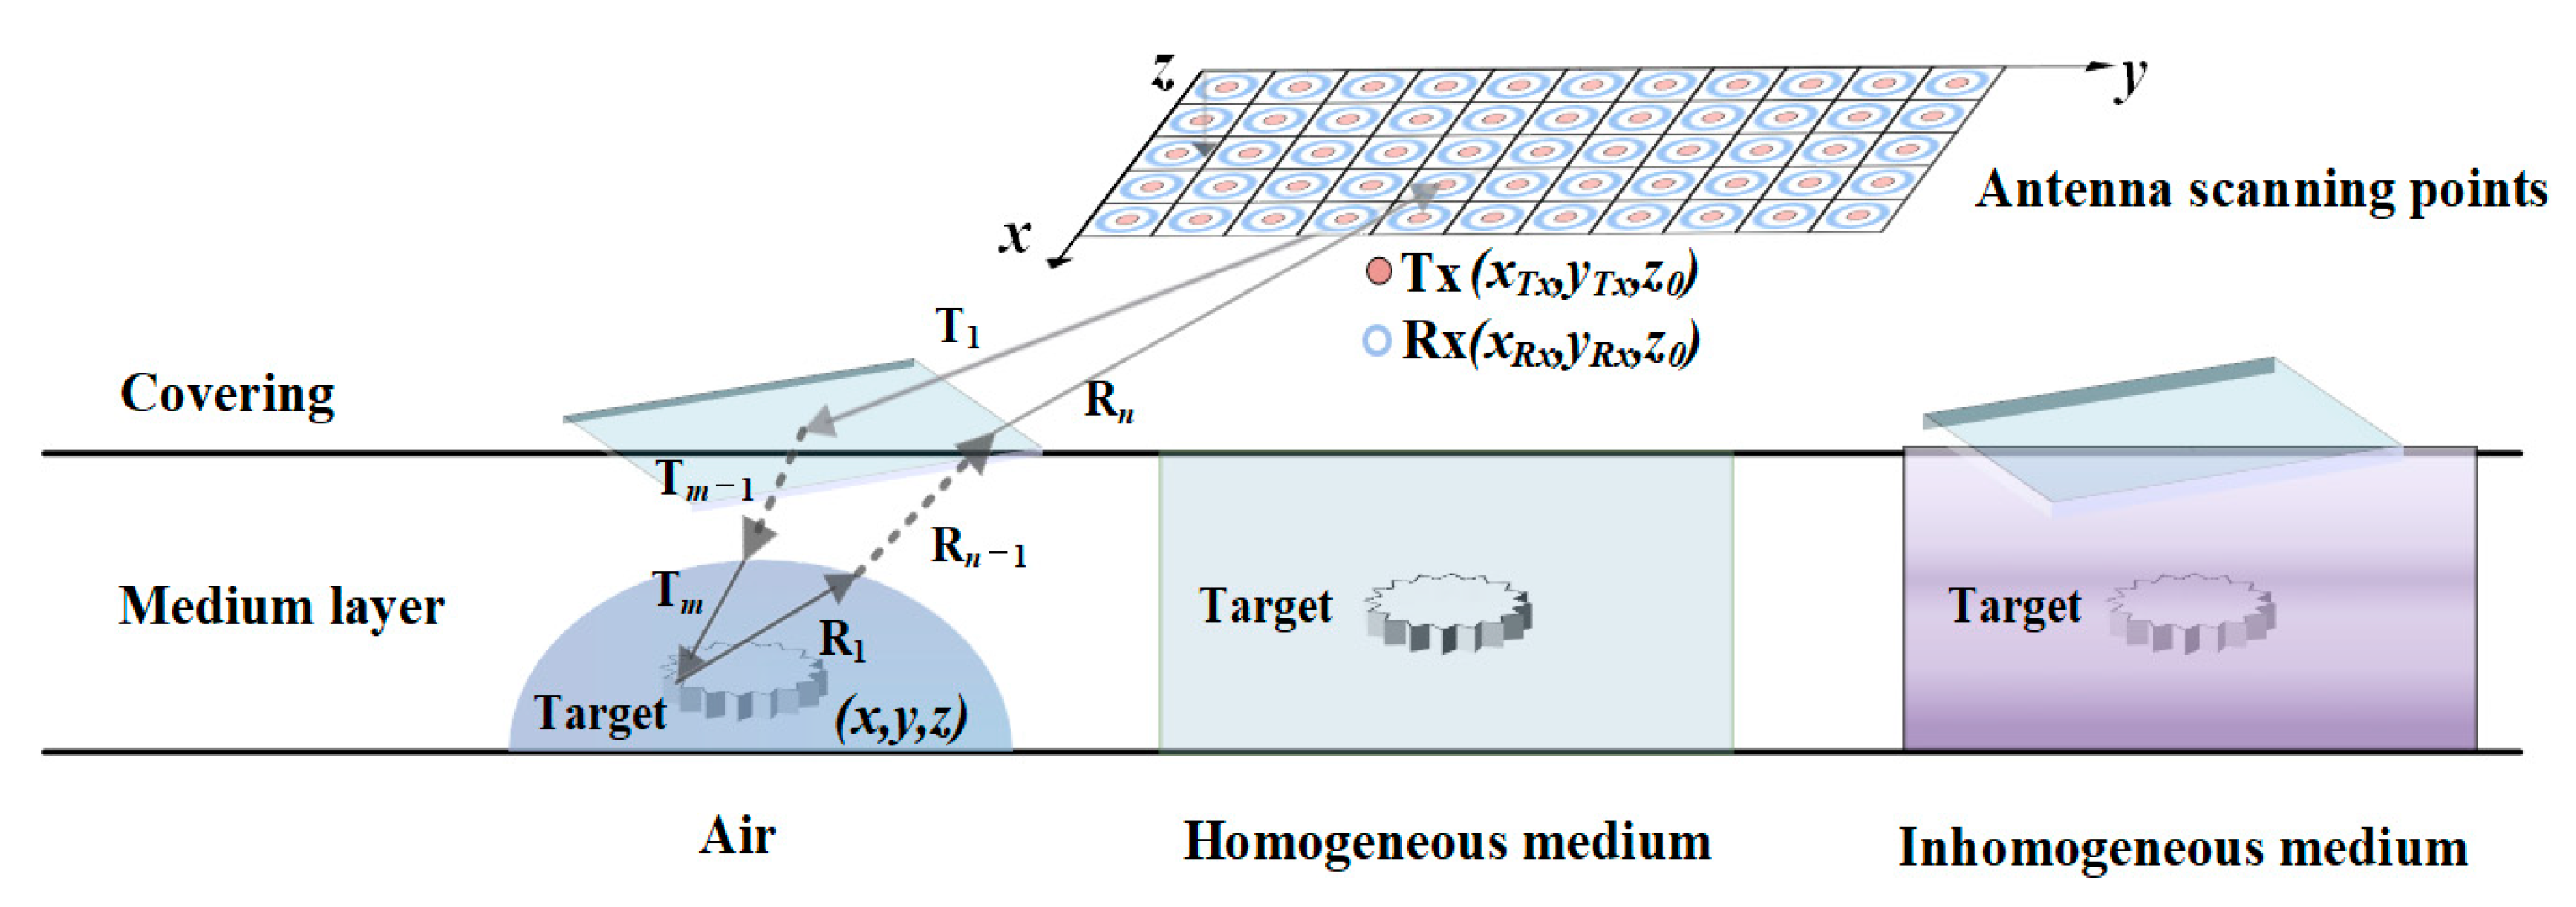
3.1. Signal Transmission Model

Electromagnetic waves are deflected during an inhomogeneous transmission environment [32]. In long-range radar detection with a wide field of view, the beam propagates approximately in a straight line. For near-field imaging, the curvature of the electromagnetic wavefront radiated by the antenna cannot be ignored. To obtain accurate information about the obscured object, it is necessary to understand the interaction process between the electromagnetic wave and the object [33]. After the interaction between electromagnetic waves and objects, complex propagation paths are generated. To solve this problem, a deep study of the transmission mechanism of electromagnetic waves in media is needed. The first step is to address model construction and solve the inverse scattering problem. However, the solving process will face issues with the ill-posed nature of the electromagnetic wave equations, resulting in different solutions for different test subjects.
Signals radiate from antennas above hidden objects, are weakened during transmission in the air, and further attenuated when passing through the hidden objects. If non-uniform media are filled below the hidden objects, severe scattering phenomena and propagation losses of signals will occur. This paper focuses on the action on the target after passing through the covering in the air. It is illustrated in Figure 3. The signal is transmitted from TX in the scanned area with transmission path Tm (m = 1, 2, 3...) and reception path Rn (n = 1, 2, 3...). Eventually, the signal is received at RX.
In the near-field scenario, capturing all the echo signals to reconstruct the target image, the response of the point source signals needs to be extracted.
Suppose the m th antenna transmits a signal at the position (xTm, yTm, zTm) and the target located at (x, y, z). The propagation field Eprop,m of the signal toward the target is
E p r o p , m ( x , y , z ) = σ ( x , y , z ) e j k ( x x T m ) 2 + ( y y T m ) 2 + ( z z T m ) 2 Δ χ
where σ (x, y, z) is the target reflectivity and Δχ represents the approximation factor, which is mainly determined by the wave approximation theory, such as scalar diffraction theory, Fresnel diffraction, and Fraunhofer diffraction.
After the interactions with the target, the wave is received by the n th receiving antenna at the position (xTn, yTn, zTn). The received scattered field [25] Escatt,n is
E scatt , n x T n , y T n , z T n = z x y E p r o p , m ( x , y , z ) e j k ( x x T n ) 2 + ( y y T n ) 2 + ( z z T n ) 2 d x d y d z
The scattered field at a single point location can be obtained by convolving the propagating field with Green’s function, so Equation (2) can be expressed as
E scatt , n x T n , y T n , z T n = z x y E p r o p , m ( x , y , z ) g r x T n , y T n , z T n d x d y d z
( ) denotes a convolution operation. As proved in [14,19,34], when the depth is zs, the propagating field can be represented as
E p r o p , m ( x , y , z s ) = E scatt , n x T n , y T n , z s g r 1 x T n , y T n , z s
where
g k 1 ( x r , y r , z s ) g k ( x r , y r , z s ) = δ ( x r , y r )
The form of the complex field is treated in a simplified way by the angle of the signal, under the Born approximation.
From [35,36], it is known that the single point echo signal can be represented as
s ( x Tx , x Rx , y Tx , y Rx , t ) = 1 4 π R Tx R Rx σ ( x , y , z ) δ t R Tx c R Rx c
where RTx and RRx represent the distance of the target point from the transmitting and receiving antennas, respectively.
R Tx = ( x Tx x ) 2 + y 2 + ( z Tx z ) 2 R Rx = ( x Rx x ) 2 + y 2 + ( z Rx z ) 2
The dispersion relationship is as follows [36]:
k x = k x _ T + k x _ R k y = k y _ T + k y _ R k z = k 2 k x _ T 2 k y _ T 2 + k 2 k x _ R 2 k y _ R 2

3.2. The Proposed Method

The previous section briefly introduced the signal transmission model. Due to the complexity of signal propagation in complex media compared to homogeneous media, the reflectivity difference is uneven. Moreover, the target’s reflected intensity is easily submerged under the strong reflectivity coverings. Therefore, there is an urgent need to enhance the quality of signals from the objects. To this end, enhancing the reflective intensity of weak scattering targets concentrates the signal response of the target and attenuates the response of non-target regions. In terms of efficiency, it mainly refers to the computational complexity of the imaging algorithm to meet the requirements of real-time processing.

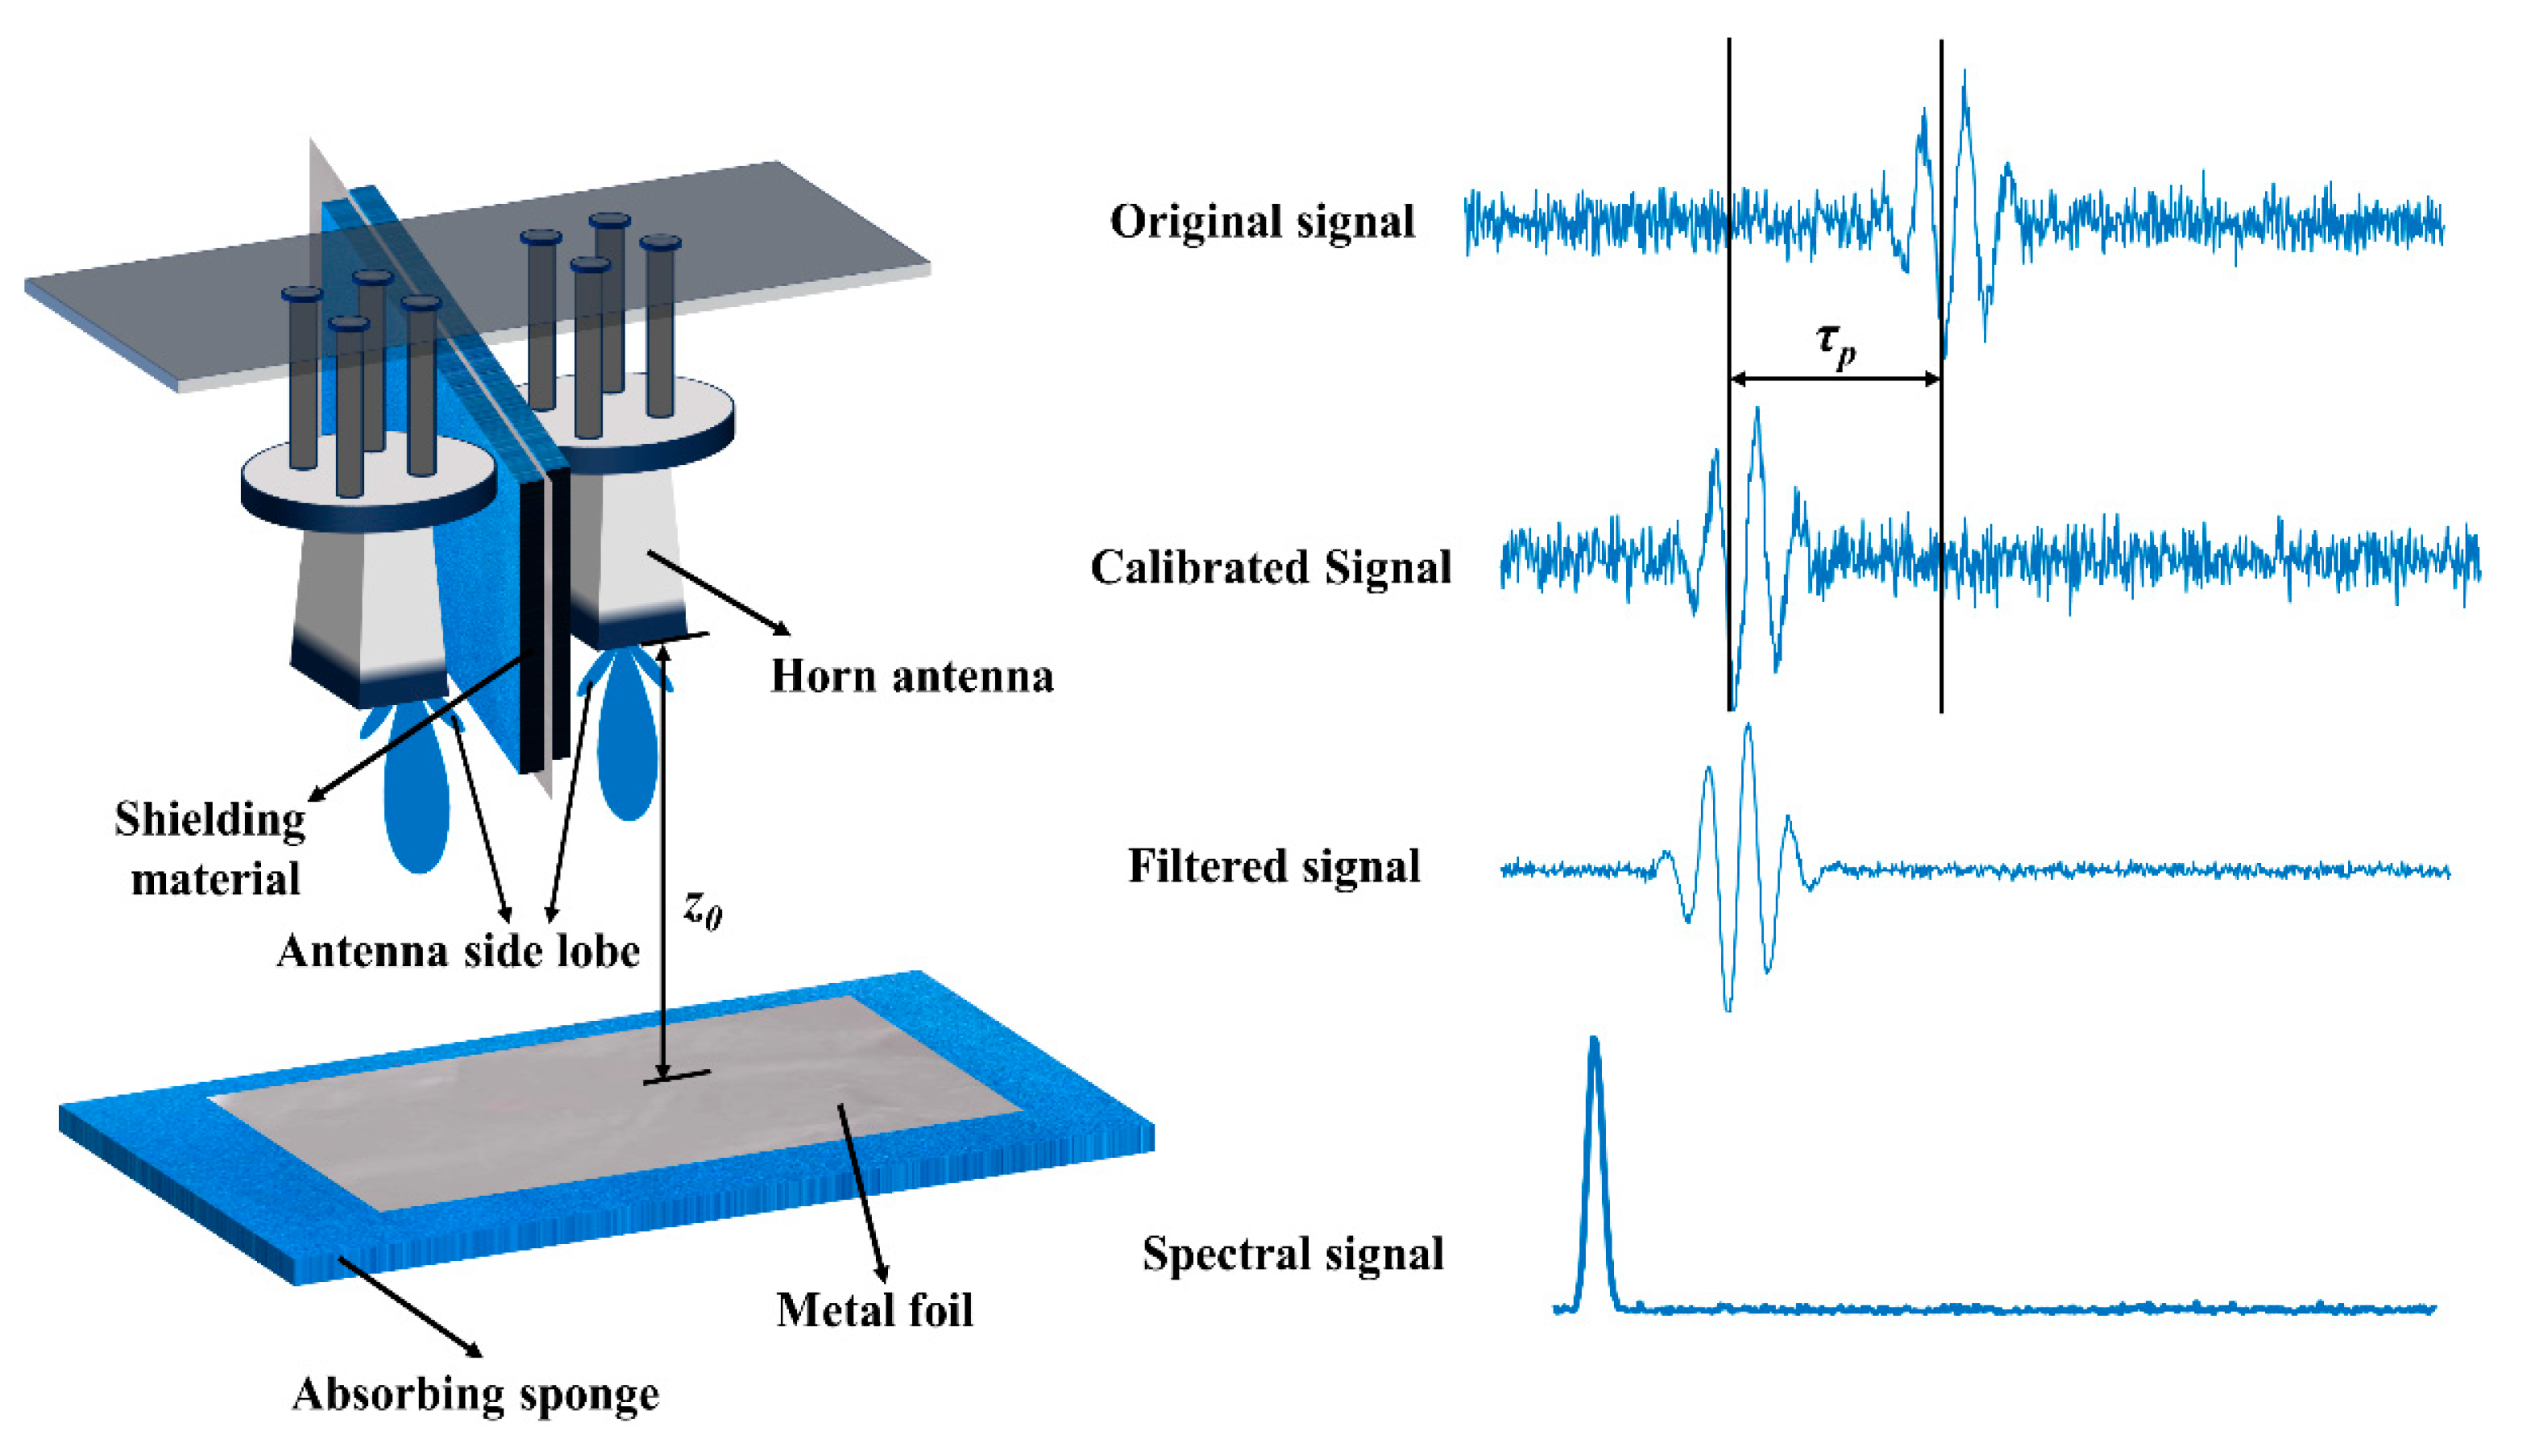
3.2.1. Design of Wave-Absorbing Materials

The efforts on imaging quality are mainly on the suppression and removal of clutter to obtain an accurate position, shape, and size of the target. The antennas are coupled at the front end of the data collection. To mitigate the effects of coupling between antennas, wave scattering is shielded by incorporating isolation-absorbing materials.
The isolation baffle is mainly composed of metal foil and wave-absorbing material. Metal foil effectively shields electromagnetic wave signals. Consequently, the wave-absorbing material is used to absorb the wave scattering caused by the opponent’s antenna. The size of the isolation baffle cannot be infinite, and the size of the isolation baffle needs to be determined according to the experimental waveforms. If it is too small, it will play a negligible role, and will not be able to effectively filter out the wave scattering between the antennas. If it is too large, it will shield many useful signals and reduce the quality of imaging. We introduce equations to outline the above process. Equation (6) after the isolation operation becomes
s ^ = Ω s ( x Tx , x Rx , y Tx , y Rx , t ) Isolation   threshold   Ω Ω 1 , Ω 2
where represents the isolation to indicate the shielding effect on antenna coupling.
Phase correction is the last step to be performed before formal data acquisition. The signal propagates within a time interval which is related to the travel distance of the signal. Therefore, calibration is necessary to obtain an accurate target position. For this reason, we propose the following approach. This calibration is mainly conducted by using metal foil to correct the phase. Accurate data are mainly stored in the form of metal foils. Equation (9) becomes
s ^ = s ^ ( x Tx , x Rx , y Tx , y Rx , t + τ p )
τ p = l 1 + l 2 c l 2 c
The correction brings about an inverse delay τp. While l1 represents the distance between the antenna and the signal generator, l2 represents the distance from the antenna to the target.

3.2.2. Clutter Suppression Using an Optimized Window

After phase correction, the distance between the antenna and the target is estimated. However, jitter at the equipment interface, background noise, and the internal noise of the equipment can affect the purity of the received signal. This can result in an unacceptable defocusing blur and range offset in the image. For this, we proposed an optimized window to minimize front-end clutter interference, reduce spectral leakage, and highlight the main peaks of the signal. The received signal is generally mixed with the interference from the system and its environment. The windowing operation can effectively reduce the undesirable impact on the imaging quality. Here, let us introduce image entropy (IE) and image contrast (IC) to measure the quality of the image, as shown in Equation (12) and Equation (13), respectively. The selection of the window length is determined by these two indexes. The smaller IE means the clearer the image, and the larger IC means the obvious difference between the high brightness and low brightness [37].
IE = i = 1 m j = 1 n g i , j 2 G F 2 ln g i , j 2 G F 2
IC = m n G F 2 i = 1 m j = 1 n g i , j 4 1
where gi,j and ||G||F represent the complex image and Frobenius paradigms of the target image matrix, respectively.
After obtaining the image window thresholds achieving maximum IE and minimum IC, the peak signal-to-noise ratio (PSNR) is used to identify the image window corresponding to the optimal image. This eliminates the need for multiple experiments to find the appropriate window function to be used. After phase correction, the signal s ^ is obtained after filtering out spurious interference using an optimization window. The window function ο(τ) parameter can be selected at the transmitter side of the signal. Assuming that the window length is T, after the window function selection, the signal is imaged by the propagation, receiving and importing the algorithm to obtain the image I. We choose PSNR as one of the evaluation metrics. The images I1, and I2 are obtained using IE and IC, respectively. I1 and I2 correspond to the minimum IE and maximum IC. This is interval-valued, and so the most suitable window length T is then determined by traversing the process from I1 to I2.
f τ = s ^ ο τ ο τ = r e c t τ T
f τ arg T max P S N R I 1 I 2 I 1 = min T I E ( I ) I 2 = max T I C ( I ) s . t .             τ 1 τ τ 2 ; τ 1 = min t , τ 2 = max t
where τ1, τ2 represent the minimum and maximum values of the time instants at which the signal is located, respectively.
The above measures in terms of hardware facilities and basic signal processing are shown in Figure 4.

3.2.3. Interval Non-Uniform Interpolation Instead of Stolt Interpolation

In terms of the computational burden of data processing algorithms, non-uniform interpolation in the spatial domain instead of Stolt interpolation decouples and optimizes the computational program. The process of converting the received signals in the frequency domain requires the interpolation of the inhomogeneous directions to facilitate the inverse Fourier transform. The received signal S (x, y, ω) is a single-site response signal and is the spectrum domain of the time-domain signal s (x, y, t). In practical applications, MIMO arrays are often used to collect signals simultaneously. In a planar antenna array consisting of x × y, a total of x2 × y2 (xt × xr × yt × yr) channels are formed because each antenna can both send and receive data. S (x, y, ω) becomes S (xt, yt, xr, yr, ω), and the spectrum of the reconstructed signal is S (kxt, kyt, kxr, kyr, f). Since the reconstructed signal spectrum is uniformly sampled in the kxt, kyt, kxr, kyr, f directions, the mapped mesh is uniform along the kx and ky directions but inhomogeneous along the kz direction. To facilitate 3D IFFT, Stolt interpolation is commonly employed to acquire data on a uniform grid of (kx, ky, kz). However, obtaining the expected data one by one is very computationally intensive. Although Stolt interpolation can be approximated by regular interpolation methods such as linear, cubic, and spline interpolation to improve efficiency, in some cases, the interpolation accuracy is insufficient. Operations that do not require a Fourier transform are searched for during the computation, and the kz direction is directly computed to convert the Fourier transform into the Fourier transform of the 2D signal itself. From Equation (8), it follows
d k z = 2 k k 2 k x T 2 k y T 2 d k + 2 k k 2 k x R 2 k y R 2 d k = 2 k k z T + k z R k z T k z R d k
Substitute this equation for part of the Stolt interpolation operation. This is specified in Equation (26).

3.2.4. Implementation of Improved Distance Enhancement

To address the defocusing blur caused by wave scattering and wave loss, utilizing amplitude and phase information can help alleviate this issue. However, this will result in a huge amount of data. To achieve the goal of restructuring, some of the data are useless, as they come from outside the target area. Therefore, based on the RMA, the amplitude weighting factor is divided according to the presence or absence of the target in the field of view. This approach excludes the non-target area and compensates only the target area in the field of view. On the one hand, it can fully utilize the scanning space and reduce the extra operation for the non-target area. On the other hand, it can more accurately improve the reflectance intensity. Overall, the improvement of distance focusing primarily involves two aspects: amplitude compensation and accurate signal phase focusing. Accordingly, amplitude compensation was carried out under the theory of scalar diffraction and the method of stationary phase (MSP) [38]. Phase-based distance enhancement was proposed by [20], which mainly discusses the advantages of the proposed method in the case of setting a reference point. To obtain better imaging results, this paper combines the advantages of both phase focusing and amplitude compensation to propose a distance enhancement method suitable for our designed system.
To focus the signal on the target as much as possible, the received signal is filtered in the wave number domain by multiplying the phase reference factor at the reference point. Before filtering, it is necessary to convert the time-domain signal to the wave number domain, then Equation (10) becomes Equation (17).
S ^ = F s ^ ( x Tx , x Rx , y Tx , y Rx , t + τ p )   = s ^ ( x Tx , x Rx , y Tx , y Rx , k ) e j k τ p   = 1 4 π R Tx R Rx σ ( x , y , z ) δ k e j k R Tx c + R Rx c e j k τ p
After filtering, it becomes
S ^ ( x Tx , x Rx , y Tx , y Rx , k ) = S ^ e j k z c
when the broadband millimeter wave frequency range and center frequency are f1~f2 and fc = (f1 + f2)/2, respectively, the corresponding wave number range and center wave number are kn∈ [k1, k2] and kc = (k1 + k2)/2, respectively, where k = 2kn 2kc, k1 = (2πf1/c), and k2 = (2πf2/c). By variable substitution [20], (18) can be rewritten as follows:
S ^ ( x Tx , x Rx , y Tx , y Rx , k ) = 1 4 π R Tx R Rx σ ( x , y , z ) δ ( k ) e j k R Tx e j k R Rx e j 2 k n z c e j k τ p   = 1 4 π R Tx R Rx σ ( x , y , z ) δ ( k ) e j k + 2 k c z c R Tx + R Rx e j k τ p
where zc is the distance of the antenna from the reference point. According to MSP, the transceiver antenna spacing is approximated to be at the same position, as in
x = x T + x R 2 y = y T + y R 2
According to [19], the processed signal can be converted into a 3D signal if in the single-station case. Therefore, the multi-station radar configuration is converted into a single-station radar configuration, so that the received echo data are converted from 5D data to 3D data.
S ^ ˜ ( x , y , k ) = S ( x Tx , x Rx , y Tx , y Rx , k ) e j 2 k R c e j k ( R T + R R )
Let Lk = k2k1. To obtain the reflectivity distribution, the filtered signals in the wave number domain are converted into the spatial domain by applying the Fourier inverse transform:
s ^ ( x , y , z ) = σ ( x , y , z ) e j k n z c R Tx + R Rx τ p sin c L k z R Tx + R Rx z c π
The above results are converted to the wave number domain for subsequent compensation operations.
According to [39], the Rayleigh–Sommerfeld diffraction equation is
U ( x 0 , y 0 , Z 0 ) = 1 j λ U ( x , y , 0 ) e j k r r cos θ d x d y
where U(x0, y0, Z0) represents the field of the observer, U(x, y, 0) is the field of the scatterer at the diffraction aperture, r is the distance between the observer and the scatterer, and cosθ = Z0/r is the inclination factor.
The unidirectional optical field propagation process is similar to the round-trip millimeter-wave imaging due to the common superposition calculation. The equation could be rewritten as
s ( x 0 , y 0 , k ) = Z 0 + j λ 2 z A ( f x , f y , z ) e j z 4 k 2 k x 2 k y 2 × e j 2 π ( f x x 0 + f y y 0 ) d f x d f y d z
The relationship between the received signal and the reflectivity function in Equation (24) is solved inversely. A(fx, fy, z) represents the 2D Fourier transform of U(x, y, z). The reflectivity function is obtained by Fourier transforming, Stolt interpolating, inverse Fourier transforming, Fourier transforming, and finally multiplying the compensation factor to the received signal [19].
σ x , y , z = 2 z + z 0 j λ e j k c z F T F T 2 D 1 S t o l t F T 2 D s x 0 , y 0 , k e j Z 0 k z
The above improvements are partially brought into Equation (25) to achieve the final imaging output. Equation (16) is replaced with Stolt interpolation. At the same time, the improved processed signal (Equation (22)) is converted to the 2D wave number domain brought into the above equation, so the above equation becomes the following:
σ x , y , z = 2 z + z 0 j λ e j k c z I F T k x , k y S ^ k k x , k y , z , k · e j k z 0 z · j 4 k 2 π 4 d k
The final target reflectance function is obtained as
σ x , y , z = z ( 2 z + z 0 j λ e j k c z I F T k x , k y S ^ k k x , k y , z , k · e j k z 0 z · j 4 k 2 π 4 d k ) d z
In the case of planar scanning, there are two categories of imaging resolution: azimuthal resolution and down-range resolution. The azimuthal resolution includes horizontal and vertical resolutions. From [35,36,40], it is known that the imaging resolution is determined by multiple factors. The cross-range resolutions along horizontal and vertical directions can be estimated as
δ x λ z 0 2 A l x
δ y λ z 0 2 A l y
where λ represents the wavelength, Alx represents the distance traveled along the x-axis, and Aly represents the distance traveled along the y-axis.
The down-range resolution is
δ r = c 2 n B sin η
where c is the speed of light, n is the refractive index of the medium, η is the angle between the antenna and the plane perpendicular to the target, and B is the frequency bandwidth. Since this paper focuses on a thin covering of uniform media and the vertical irradiation of the target to be measured, the sine term becomes 1. The refractive index term is tentatively 1. However, these factors will be considered in future investigations involving multilayered media. Therefore, the down-range resolution can be simplified as follows:
δ r = c 2 B
According to the equation above, the frequency or wavelength, height, and aperture range will have an impact on the resolution. Given the fixed nature of real-life objects to be measured and the certainty of frequency band selection, height and aperture range will be emphasized and provide a parameter basis for subsequent experiments. After analyzing the imaging resolution, the cost of scanning time is also considered. The scanning process is affected by the frequency or wavelength, height, aperture range, target size, etc. This parameter determines the sampling time, which needs to satisfy Nyquist’s sampling criteria in the spatial domain.
d x λ min A l x + D x 2 / 4 + z 0 2 2 A l x + D x
d y λ min A l y + D y 2 / 4 + z 0 2 2 A l y + D y
where dx represents the distance traveled further along the x-axis, Alx represents the distance traveled along the x-axis, and z0 represents the distance of the object from the scanning plane. Dx denotes the maximum length of the target in the x-direction (similarly, the y-axis has the same meaning as the x-axis).
Consider the limit case when the antenna is infinitely close to the target, i.e., z0 ≈ 0, the
d x = d y λ min / 4

3.2.5. Computational Complexity

The method proposed in this paper is based on multiple stations. A single-station method was used during the experimental testing phase due to equipment cost issues. Specific operational details are shown in Table 1. The combined computational complexity of the proposed IMRMA can be expressed as follows:
C I M R M A = N f N min + N x t + N x r 1 N y t + N y r 1 × N f log 2 N x t + N x r 1 N y t + N y r 1 + N x t + N x r 1 N y t + N y r 1 N z × log 2 N x t + N x r 1 N y t + N y r 1 + N x t + N x r 1 N y t + N y r 1 N z + N z
N min = min N x t + N x r 1 , N y t + N y r 1
where Nf represents the number of frequency points and Nmin represents the computational workload for data reorganization. The received data are mainly determined by the frequency points, transceiver arrays, or scan points. Therefore, in the case where the number of frequency points is determined, only the smaller of the two-dimensional scan points is required to complete the data reorganization. In a multi-station configuration, Nxt, Nxr, Nyt, Nyr are the numbers of transmitters and receivers. Nx = Nxt + Nxr − 1 and Ny = Nyt + Nyr −1 refer to the number of the monostatic spatial wave-number after data rearrangement. Nz represents the number of sampling points along the z direction. In a single-station scan, we define the scanning range and step size, as shown in Equations (28)–(33) and Figure 5b. Therefore, Nx and Ny can be expressed as follows:
N x = A l x d x N y = A l y d y
Finally, in the simplified single-station scan, Equation (35) can be expressed as follows:
C I M R M A = N f N min + N x N y N f log 2 N x N y + N x N y N z + N x N y N z log 2 N x N y + N z
Compared to the traditional RMA method, the BP method uses pure complex multiplication operations [41], which take the most time. If we let Nx = Ny = Nf = N, Nxt = Nxr = Nyt = Nyr = N½, then the computational complexity of BP can be intuitively represented as O (N6). RMA [34] takes much less time than BP, with a complexity of O (N3 log2N). Although the AC-RMA method involves more complex steps, it mainly focuses on amplitude compensation to improve quality. There are not many changes in the computational operations, so the computational cost of AC-RMA is about 1.2 times that of RMA [42]. HIA has the shortest actual time consumption. The proposed IMRMA achieves improvements through hardware enhancements, as well as amplitude compensation and phase correction, so this part does not introduce additional time costs. On the other hand, it reduces the computational load by replacing Stolt interpolation with interval non-uniform interpolation, thus consuming less time than BP, RMA, and AC-RMA.

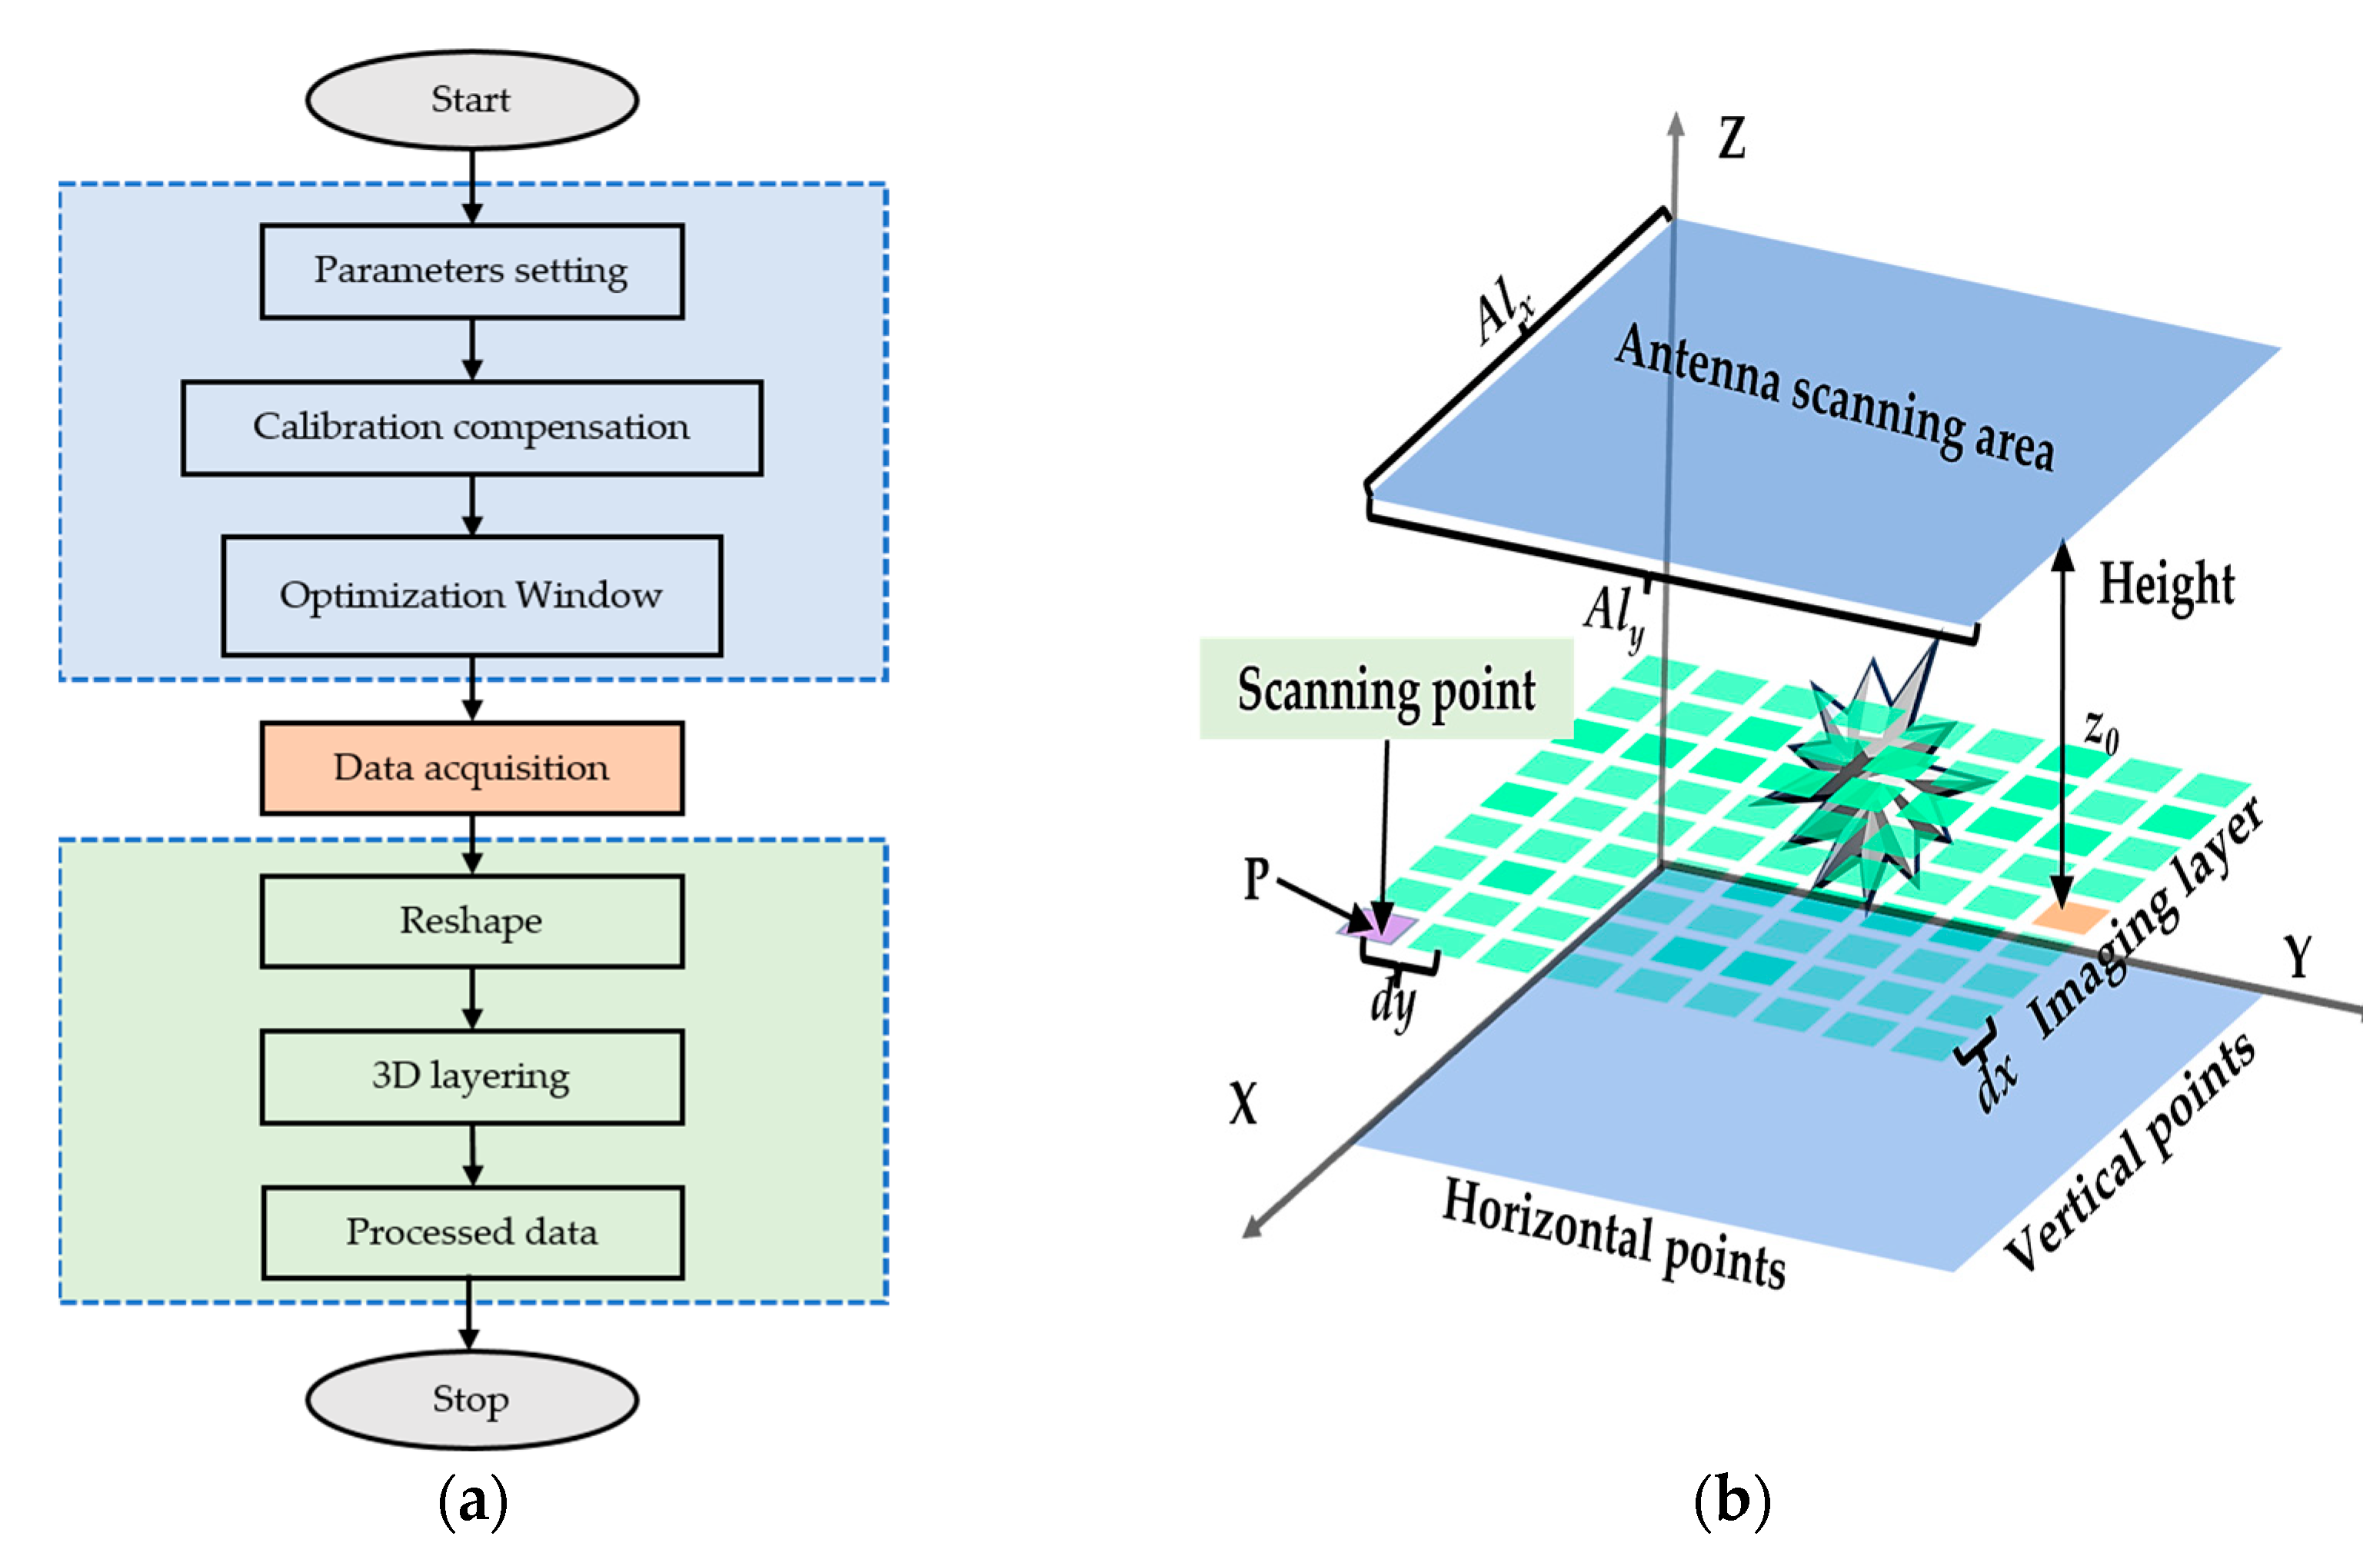
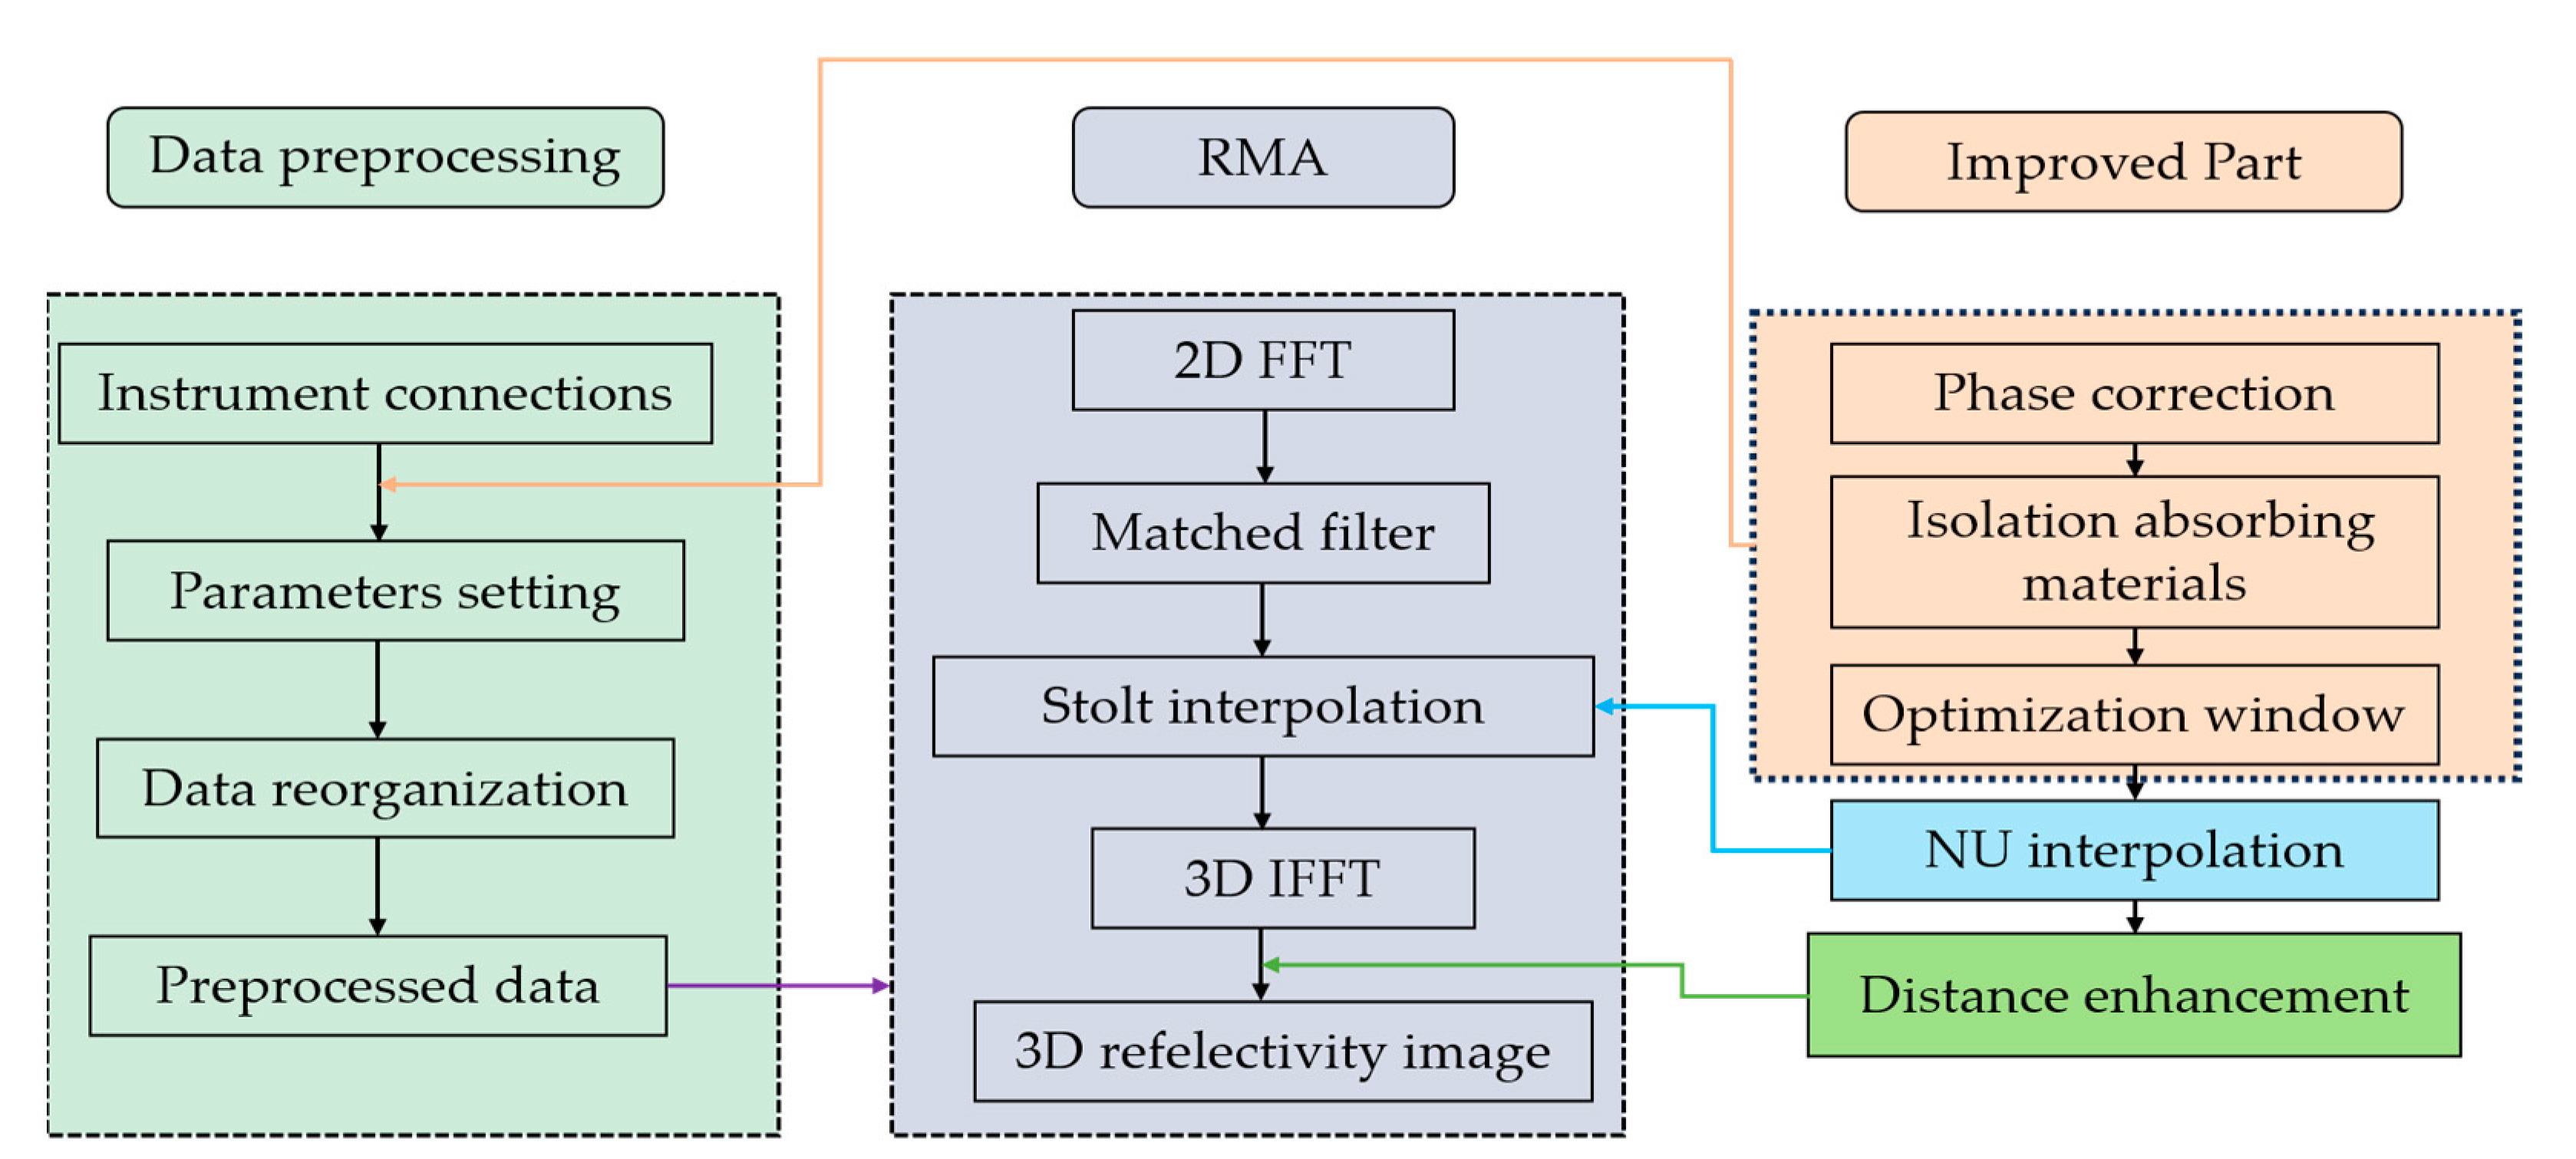
3.3. Data Preprocessing and Overall Algorithmic Procedures

Each data element is initially recorded with its position information corresponding to a specific imaging area. In the Alx × Aly scanning aperture range, the acquisition interval is dx in one direction and dy in the other. The number of acquisition points is P, resulting in a data size of (Alx/dx) × (Aly/dy) × P elements. This dataset contains comprehensive information within the scanning region, including both amplitude and phase, which ensures the integrity of the information for high-quality target reconstruction.
It is necessary to reorganize the data before imaging. The 3D imaging is achieved in all dimensions by implementing distance stacking in the height direction. The specific data extraction process is shown in Figure 5a. The 3D display of the data is shown in Figure 5b.
The details of each component of the overall imaging system are given through the system configuration in Section 2 and the imaging algorithms in Section 3. The method proposed in this paper for near-field targets consists of three subsystems: data preprocessing, RMA imaging, and improved RMA imaging. Data preprocessing is used to reorganize the received signals for SAR imaging. This includes decoupling and optimized window processing to obtain high-quality data. The algorithm enhancement section makes two primary contributions. Firstly, it focuses on enhancing the computational efficiency of RMA interpolation. Secondly, it addresses propagation losses by utilizing amplitude and phase information for compensation. The specific imaging algorithm is shown in Figure 6.

4. Experiment and Result Analysis

The focusing effect of the proposed method for image reconstruction is verified by a numerical simulation and experiment. A uniform MIMO antenna array is used in the simulation. In the experiments, the point-by-point scanning method is used to collect the signal from a single station. The basic situation of the experimental scene is shown in Figure 7. Figure 7a shows the scene diagram of the planar wave-absorbing sponge for reducing environmental interference. This ensures that the signal is transmitted as free as possible from the interference of other signals. The height of the antenna from the object, which affects the aperture size of the wave-scanning object, is shown in Figure 7b. Figure 7c shows the antenna and the object calibration. This operation divides the imaging results by distance, allowing a better match between the results and the actual imaging results.

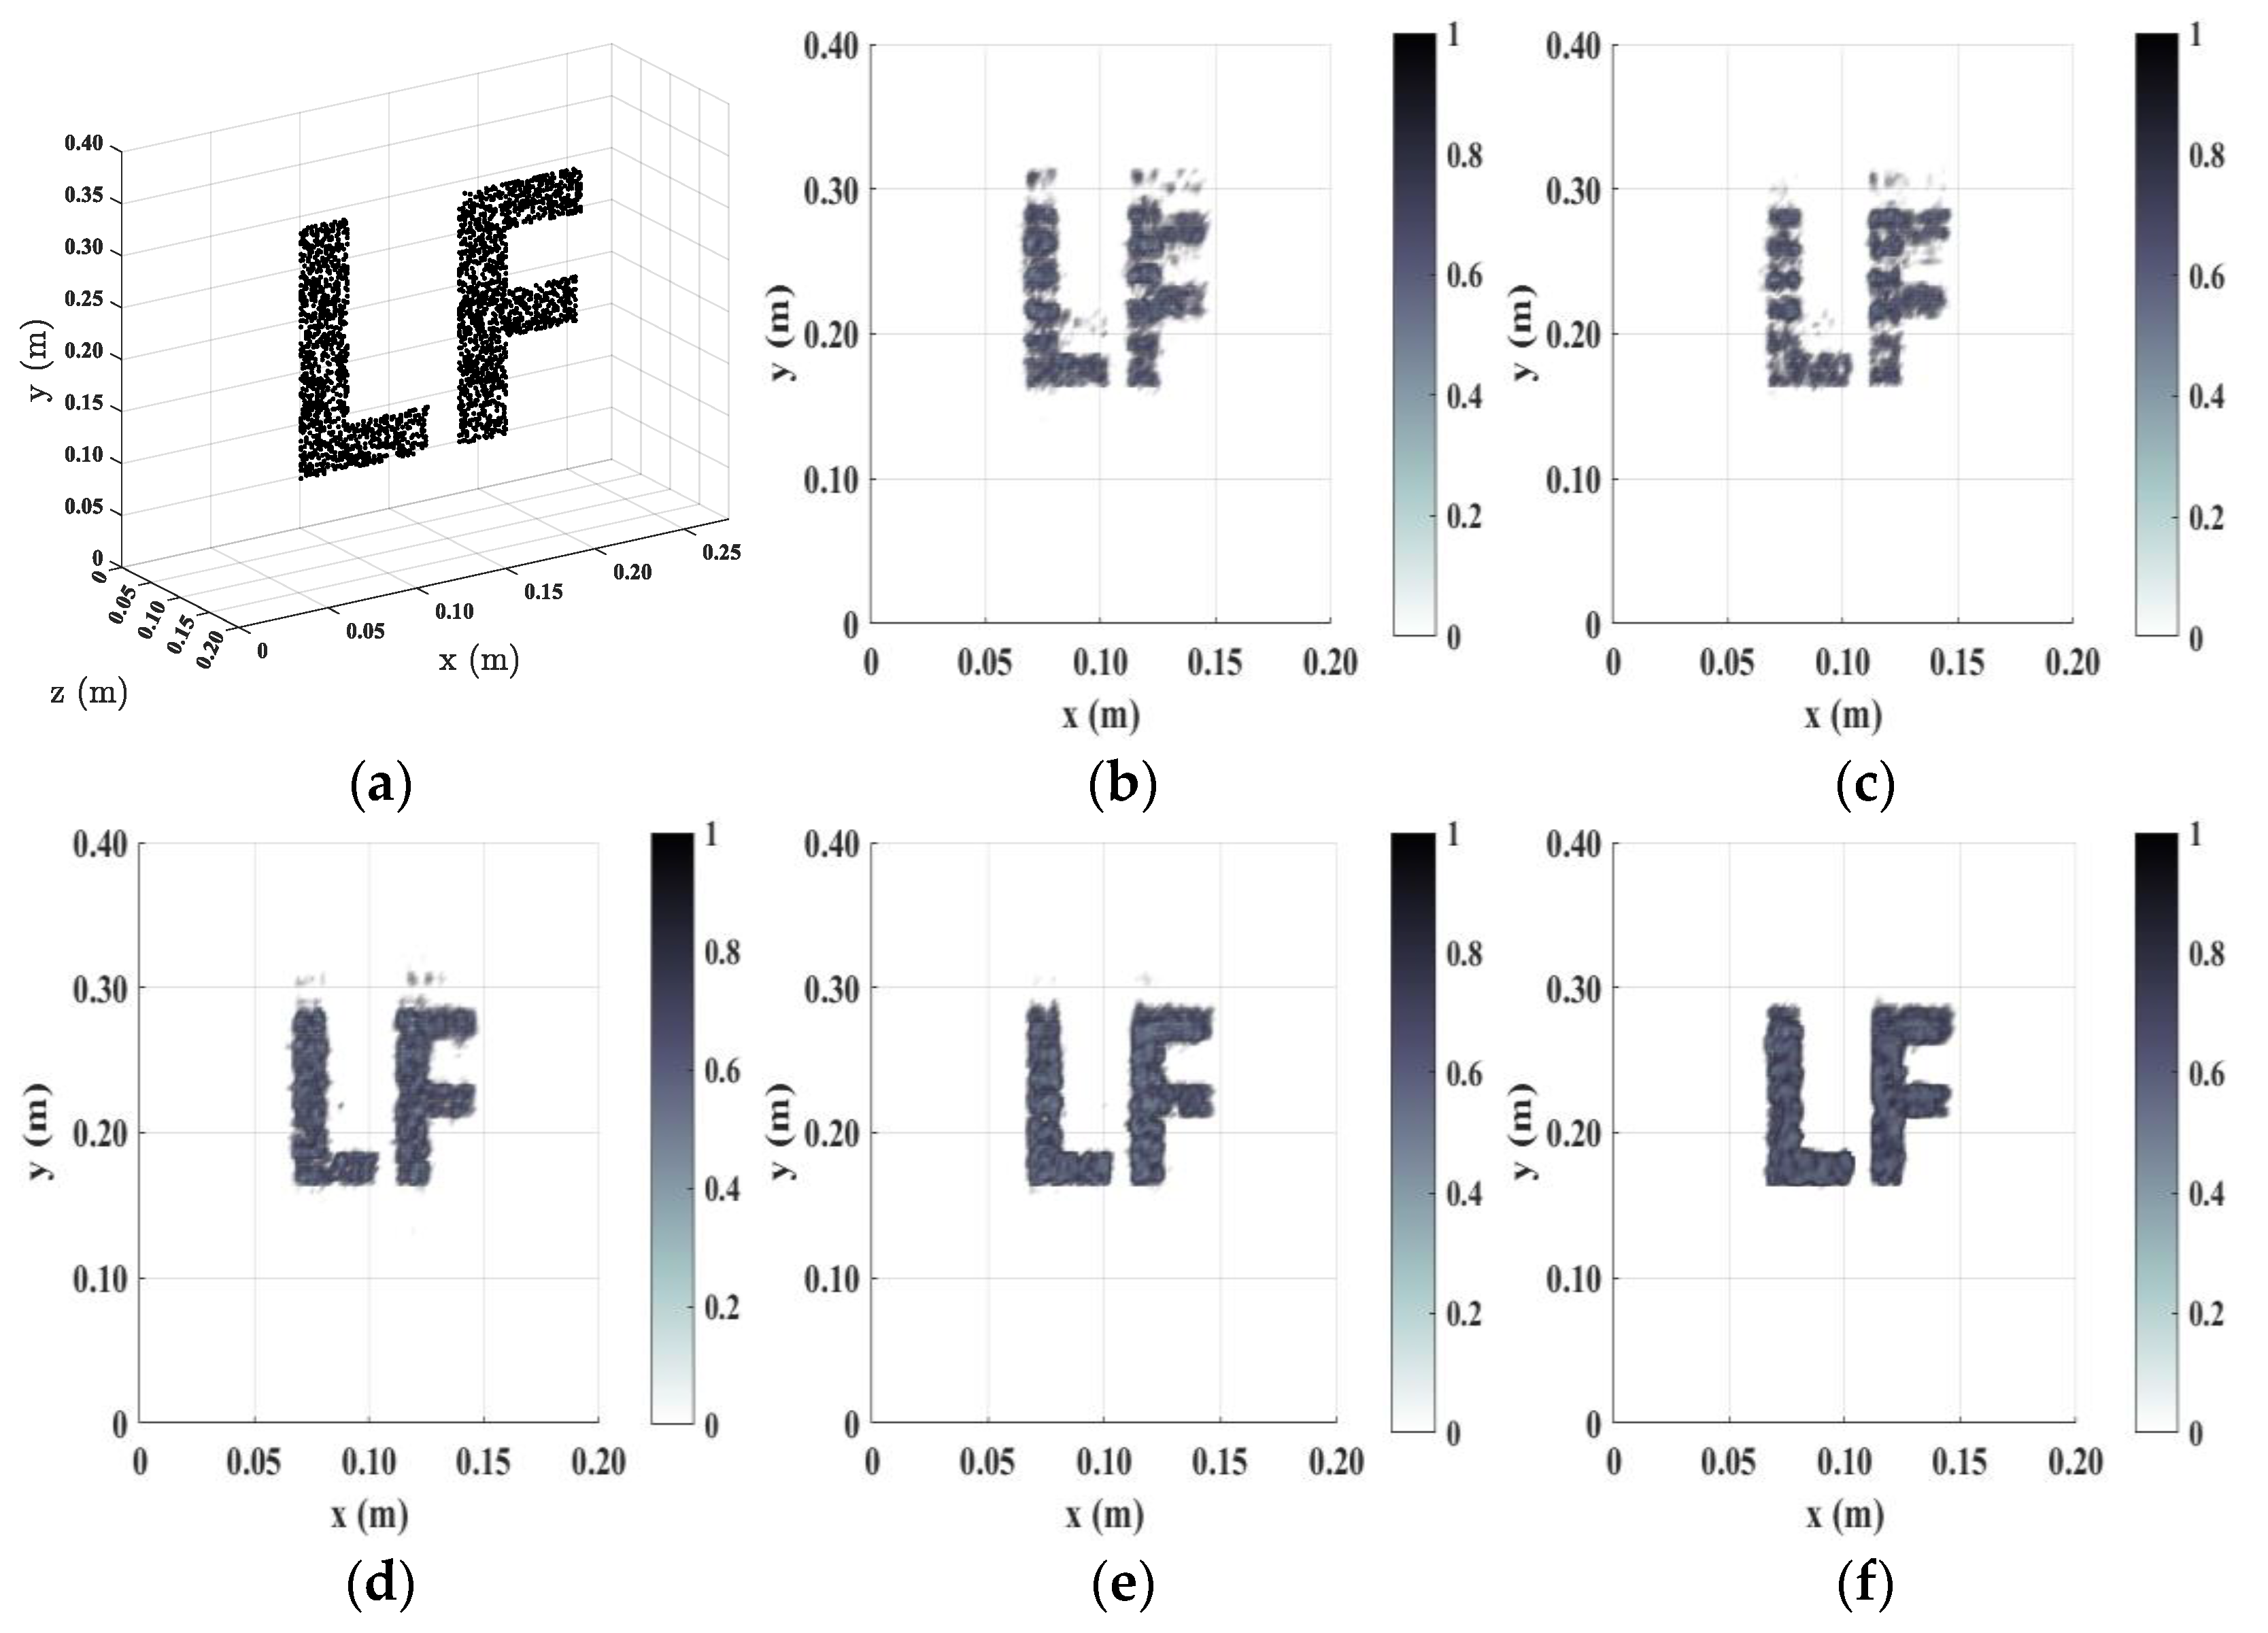
4.1. Numerical Simulation

To demonstrate the effectiveness of the proposed method, we perform multipoint target simulation experiments in free space. These elements collectively constitute the character “LF”. In terms of antenna setup, due to sufficient resources, a MIMO array is used for multi-static planar array configuration to quickly simulate the process of wave transmission and reception. This reduces the data collection time, which is universally applicable. The specific experimental parameters are shown in Table 2.
To objectively describe the imaging results to show the superiority of the proposed method, the evaluation metric PSNR was introduced in Equation (39).
M S E = 1 M N i = 1 M j = 1 N [ I ( i , j ) K ( i , j ) ] 2 P S N R = 20 log 10 255 M S E
where M, N represent the total energy of image I and image K, respectively, and I represents the energy distribution map of the reference image. In this work, the processed energy map of the optical image of the original target scene is taken as the energy distribution map of the reference image, and K represents the energy distribution map obtained after different methods of processing.
To show the performance of the proposed method, it is compared with other methods. These include the traditional RMA and BP. In addition, the recently proposed methods HIA [24] and AC-RMA [42] are also listed. The imaging results are shown in Figure 8. The lowest PSNR value obtained by RMA is 13.6479 dB, and the highest PSNR value is 17.4383 dB for the IMRMA method. The results presented by the traditional RMA method are somewhat ambiguous due to the interpolation approximation. The small scanning area and the distance between the antenna and the target also weaken the results to some extent. The BP image quality is slightly lower than that of RMA. AC-RMA improves the image quality by using the amplitude compensation method. It is better than RMA in performance evaluation, but lower than IMRMA. HIA imaging mainly lies in the improvement of efficiency and is slightly inferior to AC-RMA in imaging quality. IMRMA also considers the effect of the phase band on the distance information in addition to the amplitude compensation. During the data acquisition phase, phase correction is used to obtain an accurate target response, and an optimized window is utilized to remove the effects of clutter within the system and the surrounding environment. These operations make a significant contribution to the input of clean signals. The results show that the proposed method obtains a higher PSNR and higher imaging quality compared to other methods. In terms of time cost, the traditional method took 10.1 s and the improved method took 4.5 s. With the IMRMA method, the target is reconstructed more clearly and the contrast between the ambient and target areas is enhanced, and distance compensation is more accurate.

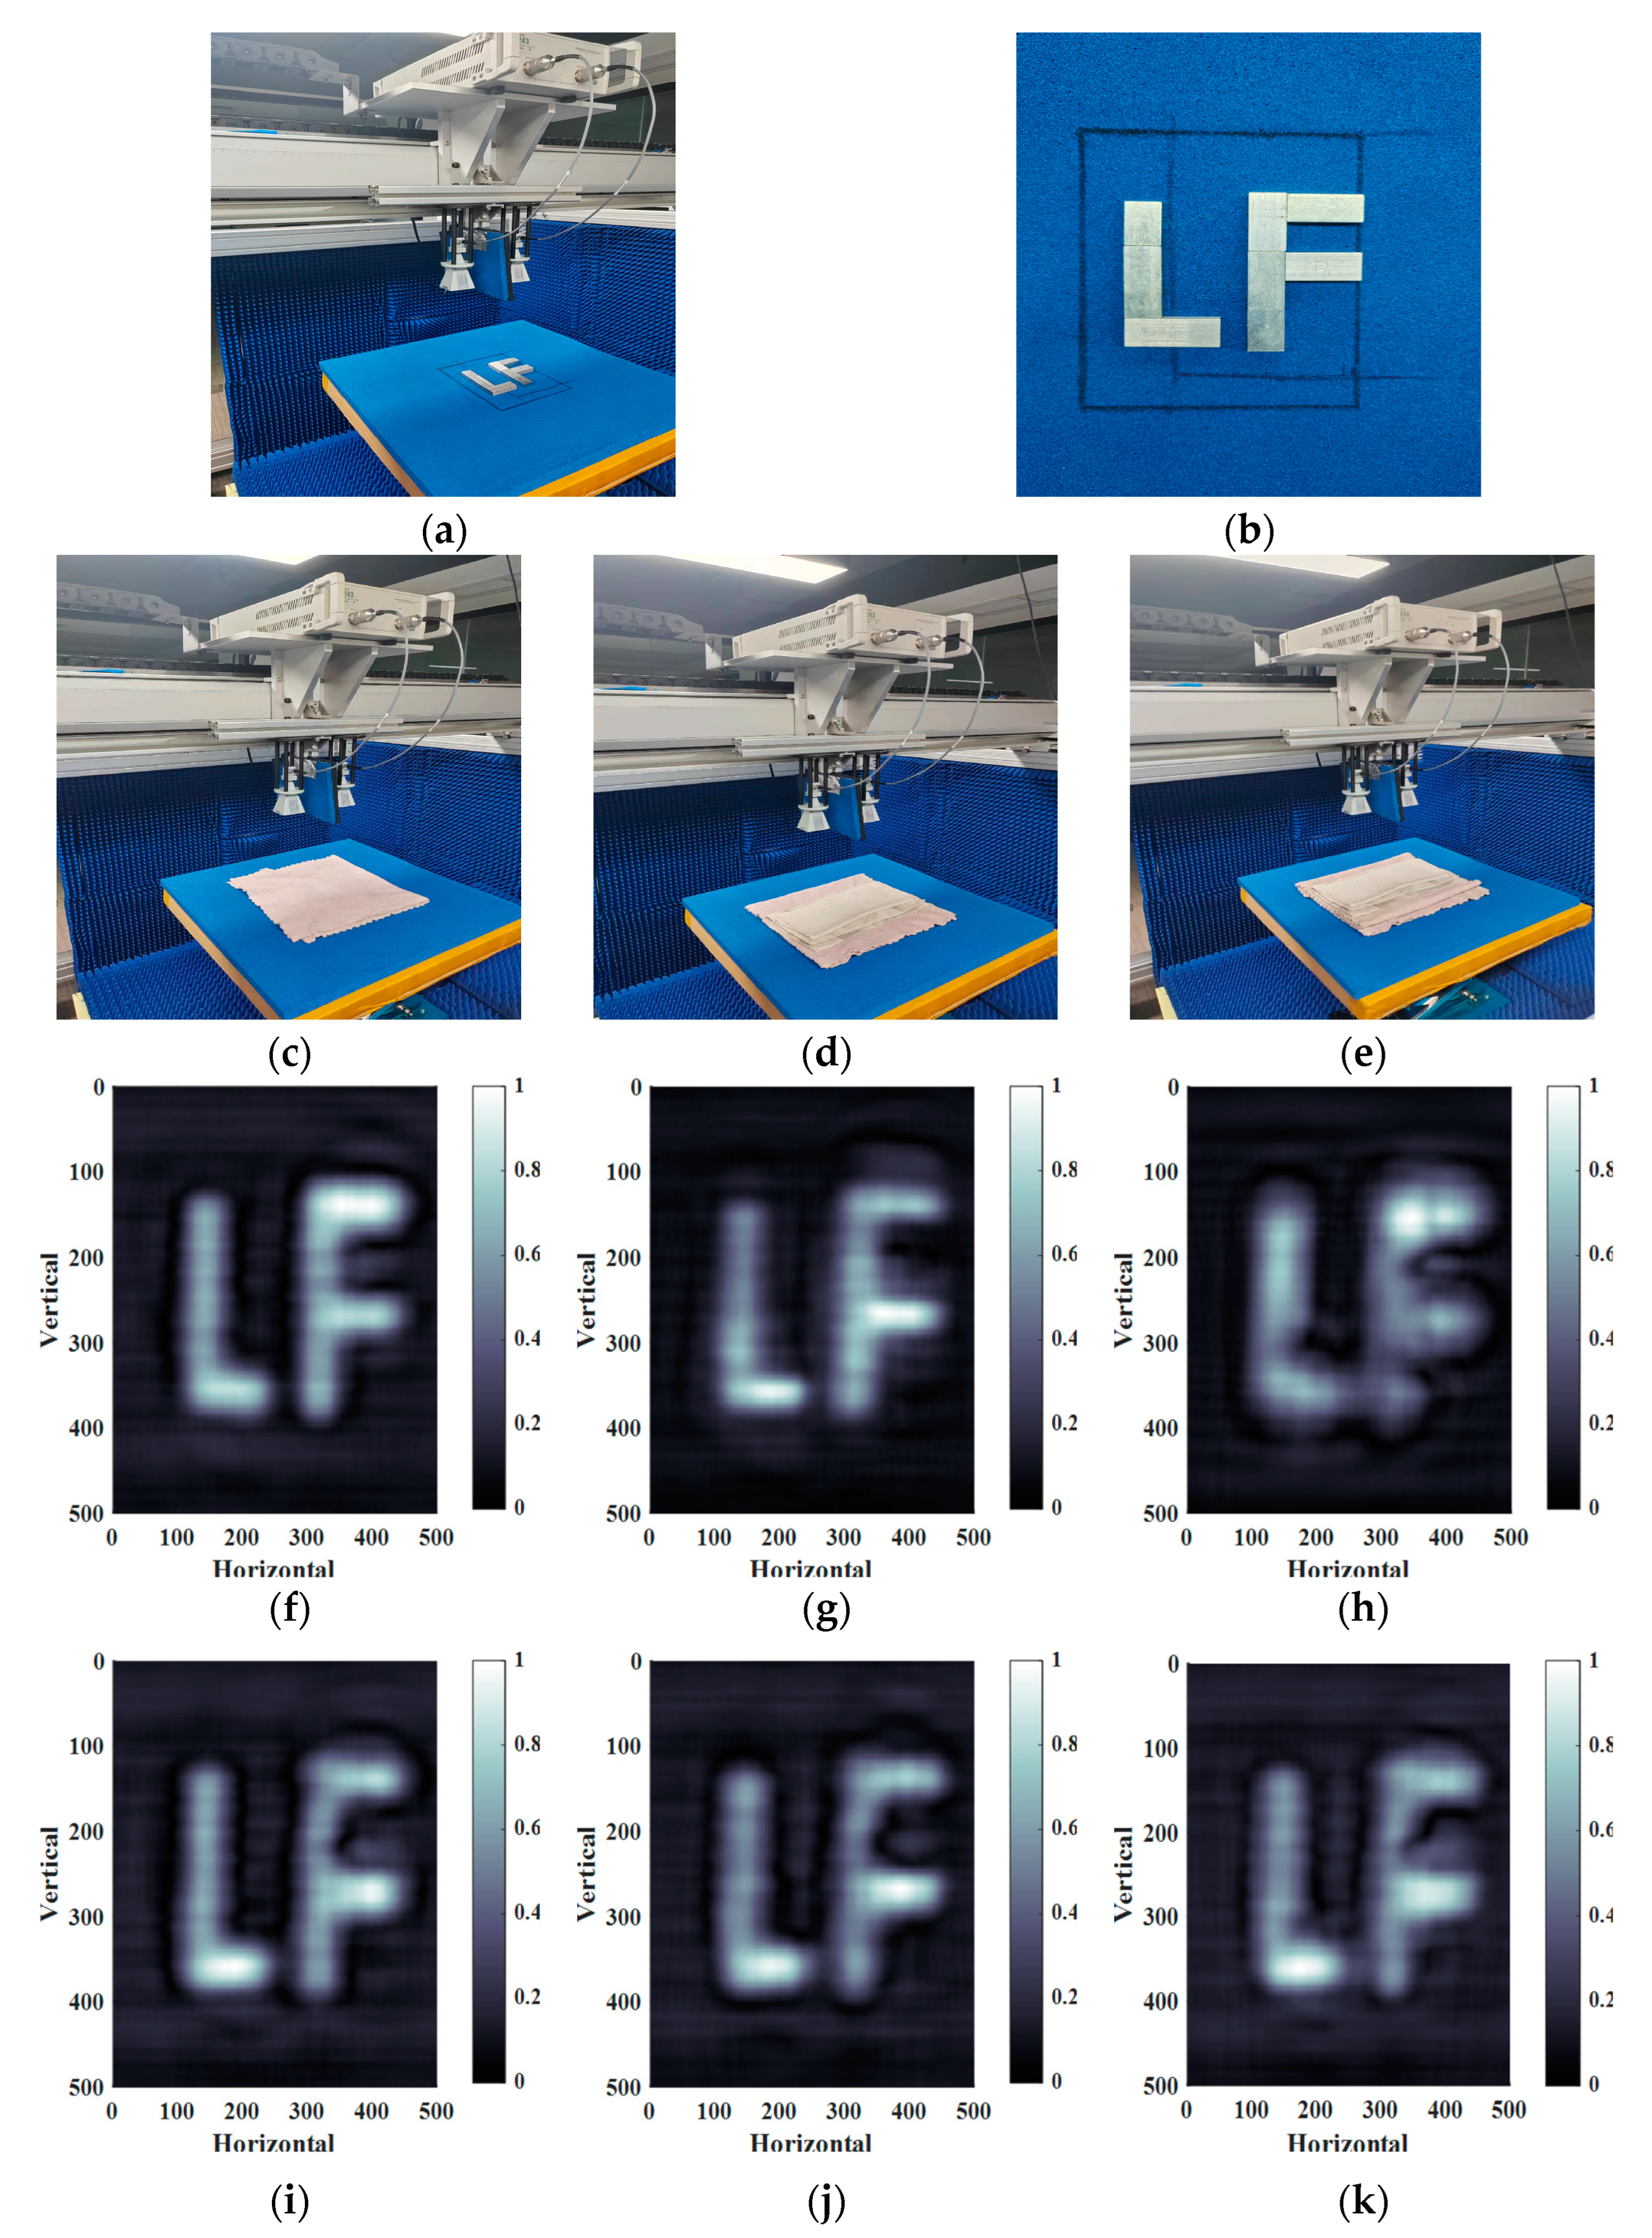
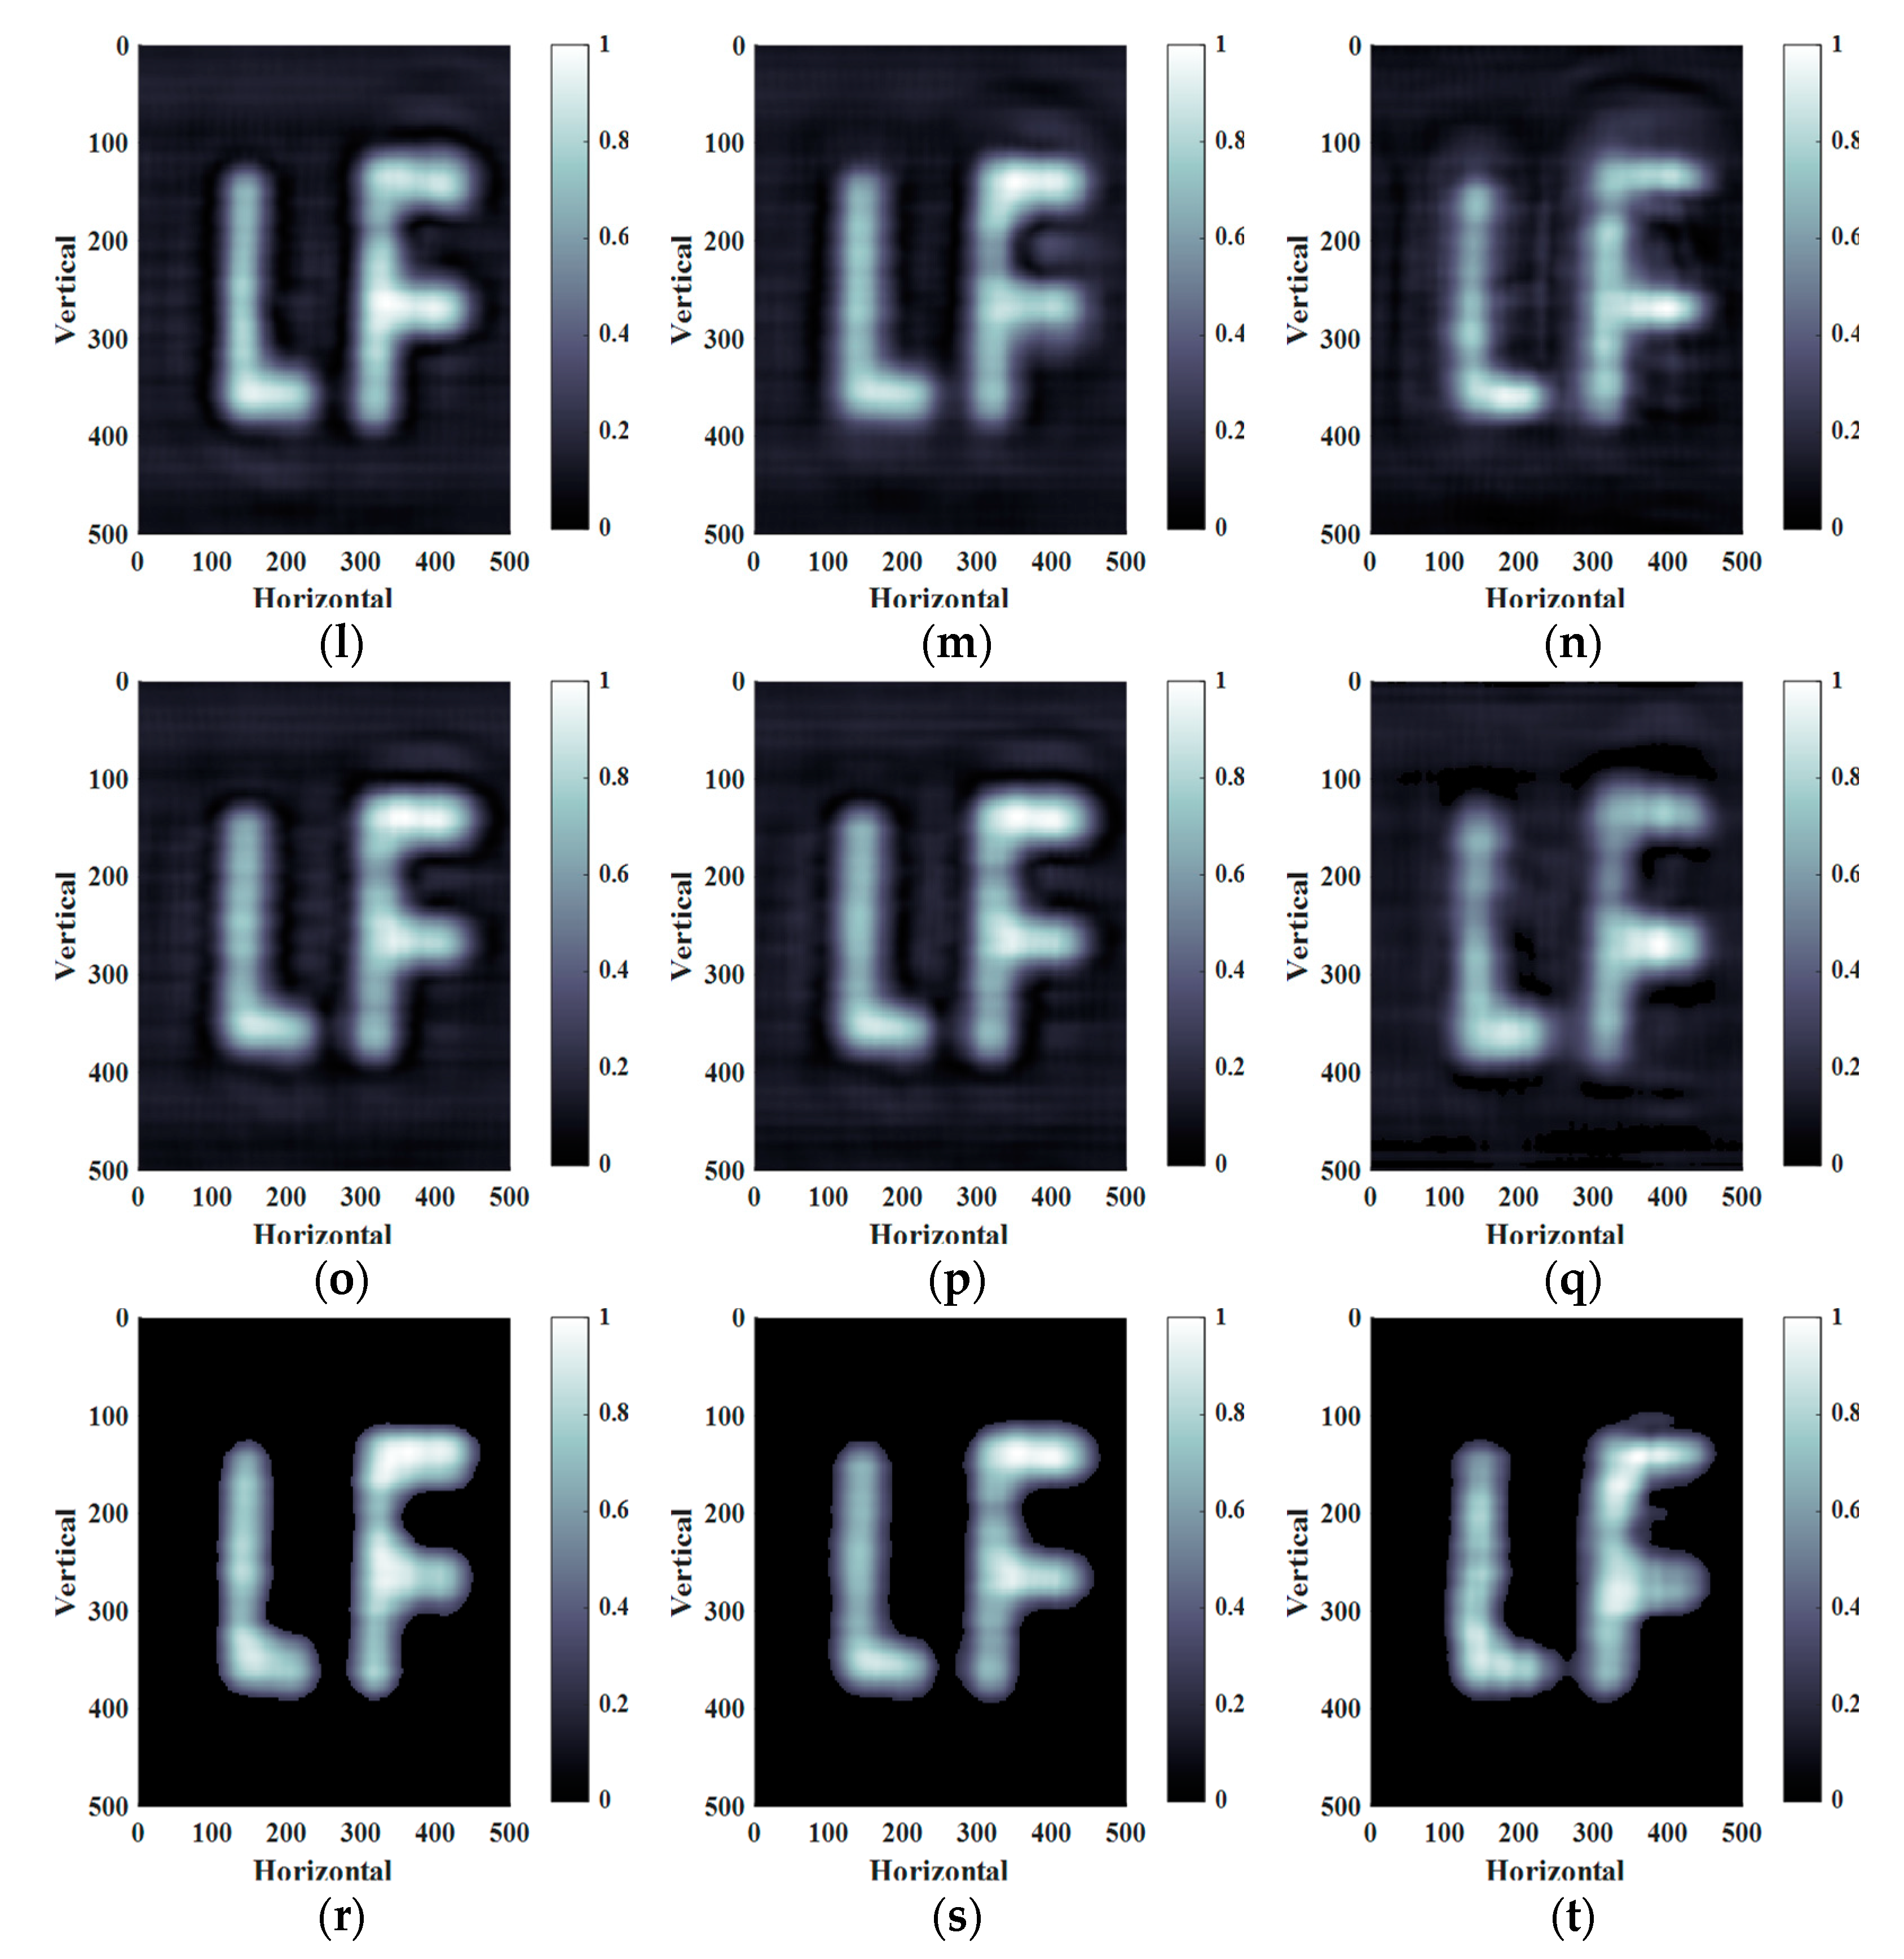
4.2. Experiments with Glyph Blocks with Coverings

In the actual test, several sets of experiments with and without different types of coverings were designed. In the experimental process, the imaging effect is observed by applying different coverings for each group of experiments. There is a distinction between simulation and actual experimentation, as the simulation environment is achieved through parameterization and offers a high level of controllability. On the contrary, the practical test environment is subject to various unquantifiable factors. These may include human errors when testing scene parameters, equipment imperfection errors, and interference from external sources such as noise. To minimize these error effects, the hardware improvement in Section 3.2 is implemented. Figure 9 illustrates the signal waveforms during different periods after the hardware and signal preprocessing improvements. To clearly demonstrate the processing, we have selected the waveforms from a single target situation. The first half of the wave is the reflection of the signal at the VNA signal source and transmission feeder cable, while the middle part of the strong emission is the reflected signal in contact with the target to be measured. It can be seen that the front-end signal may be stronger than the signal reflected by the target. There are also clutters that interfere with the serious situation. Especially in the target signal front-end part, this clutter is mainly brought by equipment noise, transmission cable loss, and environmental scattering. To minimize the degradation of imaging quality caused by this interference, we have implemented isolation baffle measures and added windows. By calibrating the distance between the antenna and the target, as well as optimized window processing, we have enhanced the prominence of the target signal response in the received signal. This lays a solid foundation for achieving high-quality imaging in the final output.
As indicated from the resolution formula in Section 3.2, the fewer data points collected, the less time it will take for sampling. However, this reduction in sampling time may lead to a decrease in imaging quality. Therefore, it is important to select a parameter that allows for as large data points as possible under the sampling criterion. The effect of height and scanning aperture on imaging resolution and stepping is shown in Figure 10. The curves show the step and resolution at 18–40 GHz, which can be analyzed due to the limitation of the target area selection.
The experimental height z0 is identified as 0.20 m from Figure 10, and the scanning aperture is 0.2 m × 0.2 m, which is selected in two main ways: firstly, in the case of ideal resolution, and secondly, in consideration of the scanning range. The resolution affects the imaging accuracy, and the scanning situation affects the time consumption of captured data. The height and aperture range on the step as well as the resolution of the impact of the general trend are the same. The two have the opposite relationship; regarding the imaging resolution value, the smaller the better, to improve the quality of imaging. On the other hand, regarding the step value, the larger the better, so that in a certain scanning range, it reduces the number of scanning points and thus reduces the overall scanning time. For this reason, according to the size of the object to be measured (roughly within the range of 0.2 m × 0.2 m), the scanning aperture range is determined as 0.2 m × 0.2 m. The imaging height is set at 0.20 m.
The Copper Mountain VNA S5243, with a frequency range of 10 M–44 GHz, is used for signal transmission and data acquisition. The transmitting power of the VNA signal source is 0 dBm, and the IF bandwidth is 10 KHz. The specific experimental parameters are shown in Table 3.
In practical scenarios, an experimental scene, as shown in Figure 11, is used to verify the effectiveness of our proposed method. Blocks with different properties were placed at certain intervals and positions in the scene, as shown in Figure 11a. Subsequently, the increase in the covering thickness involves adding varying layers of cloth at different stages. The objective of this test is to evaluate the system’s capability to penetrate fabric-like coverings of varying thicknesses. The coverings were categorized into three classes: double layers, multilayer fabric (of varying thicknesses), and extra thick layers of fabric. In the experimental scenario, the test target is the English glyph “LF”, which consists of eight iron blocks of different sizes.
The effect of testing the double-layer fabric was first carried out. The imaging results, as shown in Figure 11f,i,l,o,r, can accurately reconstruct the target. The proposed method, compared with the other methods, marginally reduces the artifacts. Upon investigation, it was found that the protective capacity of the fabric against electromagnetic waves is limited, and any resulting discrepancy is not substantial. With the premise of basic methods, the imaging reconstruction can be effectively achieved. To further investigate the impact of covering materials on imaging results, we conducted experiments with multiple layers of fabric covering. The experimental setup is shown in Figure 11d. Multiple layers of fabric are made up of different materials, and the imaging results are shown in Figure 11g,j,m,p,s. A slight artifact can be seen in Figure 11g. The energy value of the target area is reduced, and the quality of the reconstructed target image is deteriorated. This indicates that the thickened cloth brings some attenuation to the wave propagation. The imaging results are not accurately obtained. However, the position and general shape of the target can still be observed. In Figure 11j, the artifacts can be reduced after the proposed method of enhanced focusing and denoising. The energy in the target area can be focused, and the imaging quality can be improved. Based on the second set of experiments, fabrics of different materials with roughly the same thickness were added. Among the four layers of fabric with uneven thickness, the total thickness was 2 cm, as shown in Figure 11e. Figure 11h,k,n,q,t represent the imaging results of RMA, BP, HIA, AC-RMA, and the proposed method, respectively. The results from the RMA method show that the extra thick layer of fabric has a significant impact on the imaging results. The imaging results are highly contaminated, resulting in particularly blurred targets. After the improvement of the proposed method, the shape of the target is accurately reconstructed.
The quantitative evaluation indexes are shown in Table 4. In the shallow coverings, all the methods obtained high PSNR and low IE. As the coverings thicken, the PSNR value decreases continuously. The IE value increases. This indicates that the coverings significantly deteriorate the imaging results. In terms of imaging quality, the results for RMA and BP are slightly worse due to the absence of additional compensation operations. For AC-RMA, after adding amplitude compensation, the imaging quality is more obviously improved. In terms of computational cost, HIA utilizes slice superposition to greatly reduce the computational complexity and consume the lowest time cost. BP utilizes pure complex multiplication and has the largest time cost. This is consistent with the analysis in Section 3.2.5. Overall, although the time cost of the proposed method is not as good as HIA, it is very close. And it is less time consuming than the other methods. The imaging quality is optimal in the method comparison.

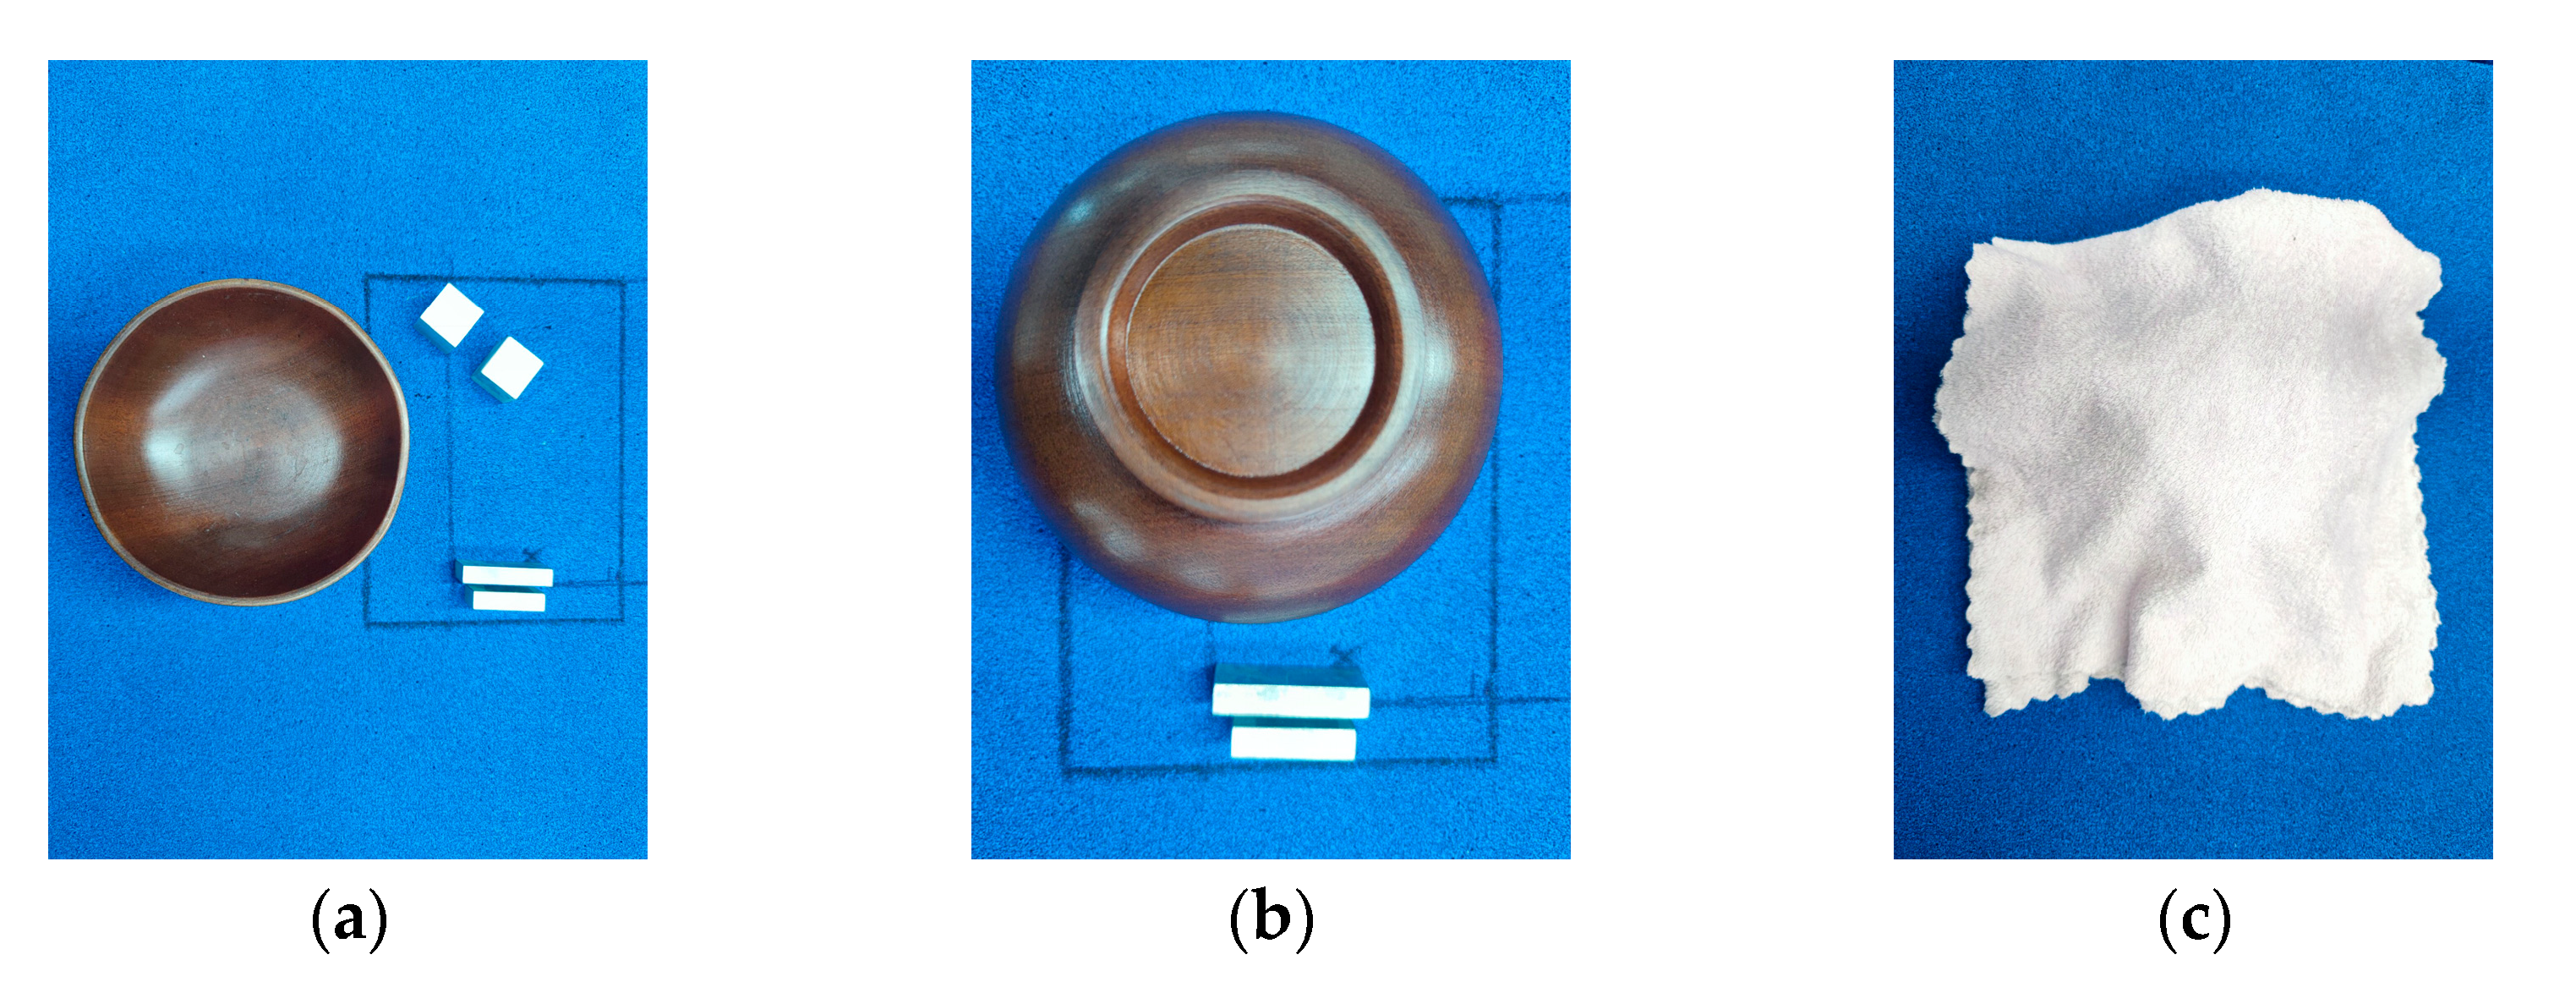
4.3. Experiments with Chunky Bowl Coverings

To further investigate the system’s penetration capability, we used coverings with stronger masking performance to cover the target. To obtain better imaging quality, the scanning area is 0.3 m × 0.3 m, with a height of 0.12 m. The step size of the scanning process is 2 mm with a frequency range of 18–40 GHz. The parameter settings are the same as those used in Experiment 4.2. The experiment has four targets, two of which are covered by a thick bowl-like target and the other two are placed outside the bowl as a reference. The one near the bowl side is a bit longer, and the two rectangular bars are spaced 6 mm apart. The exact position is shown in Figure 12a.
In the experiment, two more layers of fabric are placed over the target area to demonstrate the imaging capability with the previously mentioned coverings. The imaging obtained for the unprocessed data is shown in Figure 12d. Multiple artifacts appear between the rectangular bars. This may be due to the interference caused by the neighboring bowls that cover and scatter the signal from the targets. The targets covered by the bowl are not reconstructed and the image only shows the bowl area. It could be that the transmitted signal is severely attenuated by the bowl as well as interfered by the scattered signal from the uncovered targets outside the bowl. For this reason, we performed preprocessing to minimize the scattering effects. As shown in Figure 12e, the processed results will clearly reconstruct the overall target. However, the geometry of the covered targets is significantly distorted so that the rectangular shape is indistinguishable. BP and AC-RMA can present the scattering intensity of the target more accurately. However, BP is unable to discern the target geometry inside the bowl. Severe aliasing occurs between the rectangular bars outside the bowl. In contrast, AC-RMA better reconstructs the target inside the bowl, but the target inside the bowl also appears to be blurred to some extent. This indicates that AC-RMA has a better focusing effect on the target, but is less robust in compensating for the effect of the different materials of the coverings. HIA can render the metal bars more clearly, but some artifacts appear. More importantly, it fails to reconstruct the target in the bowl effectively. After IMRMA (Figure 12i) imaging, the geometry of the covered targets is recognizable and the two uncovered targets can be distinguished. This indicates that the proposed method has a good compensation capacity to achieve better reconstruction performance.
The designed system, as well as the proposed method, is examined by the above two sets of experiments. The PSNR and IE for these experiments are shown in Table 5. The chunky bowl has the higher PSNR, while the experiment with the extra thick layers of fabric materials achieves the lowest value and the worst imaging reconstruction. With the improvement of the proposed method, the PSNR of all targets is increased, which enhances the imaging quality. In this experiment, HIA has the lowest PSNR and the proposed method has the highest. RMA has the largest IE and the proposed method has the smallest. This indicates that the proposed method still reconstructs the target well, even in thicker coverings. Compared to experiment 4.2, the reconstruction quality of all methods is better. This is brought about by the finer division of the target scene and the larger scene scanned. Taking the traditional RMA as a benchmark, the PSNR increases in the fabric coverings after utilizing the proposed methods are all above 3 dB. This indicates that the fabric coverings have less influence on the imaging reconstruction and IMRMA has good robustness. The PSNR increase for the chunky bowl is the lowest at 2.1955 dB. This is because the increase in thickness creates a greater shielding effect on the signal, which interferes with the performance of the algorithm to a certain extent. In terms of time cost, the RMA method spends 4.3 s and the IMRMA method uses 2.2 s, with a saving of 2.1 s.
Based on the comparative analysis of the above data, it is evident that the proposed method has enhanced both imaging quality and computational efficiency. In the future, it will be detected in different media environments.

5. Conclusions

This paper presents a novel approach to a microwave imaging system design, integrating improvements to pretreatment techniques for data acquisition and imaging algorithms. To suppress clutter, absorbing materials and an optimized window are added. The improved interpolation is used to transform the non-uniformity along kz into a superposition of k in the wave number domain. This avoids the problem of insufficient accuracy associated with approximation methods, such as linear, cubic, and spline interpolation. It also reduces the time load associated with Stolt interpolation. In a single-station case, the fabric coverings experiment took only 0.6275 s. Even in the chunky bowl experiment, which has a large amount of data, it took only 2.2 s. Although the proposed IMRMA is higher than the HIA, the proposed method saves about half the time when compared to the traditional RMA method.
In the aspect of the distance information enhancement, phase correction and amplitude compensation are combined to obtain more accurate data. Based on scalar diffraction theory, the proposed method effectively focuses target information within the field of view. It reduces useless information in non-target areas. Through numerical simulation and experiments, the effectiveness of the system on coverings has been verified. Furthermore, the imaging effect on targets under different thicknesses of coverings is examined. For some shallow coverings, the PSNR can reach more than 14 dB. In traditional methods, the imaging effect becomes more and more blurred as the thickness of the coverings increases. This is due to the attenuation effect of the coverings on the electromagnetic wave propagation. Specifically, the target is heavily contaminated when the thickness of the fabric coverings reaches 2 cm. However, the proposed method, which compensates for target information with relatively high precision, still provides good imaging results. Additionally, a smaller IE means a higher focusing quality.
The proposed method not only has a good imaging effect on the target under shallow coverings but also can reconstruct the target under thicker coverings. At the same time, the proposed method has a relatively low computational complexity. Nevertheless, the imaging effect in more complex environments and inhomogeneous coverings is unknown. The time cost can be further reduced.

Author Contributions

Conceptualization, J.W. and Y.L.; methodology, Y.L. and Q.A.; software, J.X. and Y.L.; validation, H.C., Y.L., and J.X.; formal analysis, Y.L., H.C. and K.H.; resources, J.W.; data curation, J.W., Q.A. and H.C.; writing—original draft preparation, Y.L.; writing—review and editing, J.W. and H.X.; visualization, Y.L., K.H. and J.X.; supervision, J.W.; project administration, J.W. and H.X. All authors have read and agreed to the published version of the manuscript.

Funding

This research was supported by the National Natural Science Foundation of China (Grant No. 42271093).

Data Availability Statement

Data underlying the results presented in this paper are not publicly available at this time but may be obtained from the authors upon reasonable request.

Conflicts of Interest

The authors declare no conflicts of interest.

References

  1. Zhang, Q.; Xi, Q.; Zhu, C.; Zhang, B.; Wang, J.; Yu, H.; Li, Y.; Zhu, Z.; Li, X.; Ran, L. Microwave Imaging Enhanced by Duplexed Random Phase Modulations. IEEE Trans. Microw. Theory Tech. 2023, 71, 3144–3155. [Google Scholar] [CrossRef]
  2. Ahmed, S.S. Microwave Imaging in Security—Two Decades of Innovation. IEEE J. Microw. 2021, 1, 191–201. [Google Scholar] [CrossRef]
  3. Mirbeik-Sabzevari, A.; Oppelaar, E.; Ashinoff, R.; Tavassolian, N. High-Contrast, Low-Cost, 3-D Visualization of Skin Cancer Using Ultra-High-Resolution Millimeter-Wave Imaging. IEEE Trans. Med. Imaging 2019, 38, 2188–2197. [Google Scholar] [CrossRef] [PubMed]
  4. Wingren, N.; Sjoberg, D. Nondestructive Testing Using Mm-Wave Sparse Imaging Verified for Singly Curved Composite Panels. IEEE Trans. Antennas Propag. 2023, 71, 1185–1189. [Google Scholar] [CrossRef]
  5. Aljurbua, A.; Sarabandi, K. Detection and Localization of Buried Pipelines Using a 3-D Multistatic Imaging Radar. IEEE Trans. Geosci. Remote Sens. 2022, 60, 2003710. [Google Scholar] [CrossRef]
  6. Zhang, H.; Ouyang, S.; Wang, G.; Li, J.; Wu, S.; Zhang, F. Back-Projection Algorithm Based on Self-Correlation for Ground-Penetrating Radar Imaging. J. Appl. Remote Sens 2015, 9, 095059. [Google Scholar] [CrossRef]
  7. Lin, B.; Li, C.; Ji, Y.; Liu, X.; Fang, G. A Millimeter-Wave 3D Imaging Algorithm for MIMO Synthetic Aperture Radar. Sensors 2023, 23, 5979. [Google Scholar] [CrossRef]
  8. Peng, K.-C.; Lin, C.-C.; Li, C.-F.; Hung, C.-Y.; Hsieh, Y.-S. A Compact 9 GHz Microwave Imaging System. In Proceedings of the 2018 IEEE International Workshop on Electromagnetics:Applications and Student Innovation Competition (iWEM), Nagoya, Japan, 29–31 August 2018; p. 1. [Google Scholar]
  9. Fang, Y.; Bakian-Dogaheh, K.; Moghaddam, M. Real-Time 3D Microwave Medical Imaging with Enhanced Variational Born Iterative Method. IEEE Trans. Med. Imaging 2023, 42, 268–280. [Google Scholar] [CrossRef]
  10. Ren, K.; Wang, Q.; Burkholder, R.J. A Fast Back-Projection Approach to Diffraction Tomography for Near-Field Microwave Imaging. IEEE Antennas Wirel. Propag. Lett. 2019, 18, 2170–2174. [Google Scholar] [CrossRef]
  11. Xia, Y.; Song, Z.; Lu, Z.; Fu, Q. A Novel Range-Doppler Imaging Algorithm with OFDM Radar. Chin. J. Aeronaut. 2016, 29, 492–501. [Google Scholar] [CrossRef]
  12. An, D.; Huang, X.; Jin, T.; Zhou, Z. Extended Nonlinear Chirp Scaling Algorithm for High-Resolution Highly Squint SAR Data Focusing. IEEE Trans. Geosci. Remote Sens. 2012, 50, 3595–3609. [Google Scholar] [CrossRef]
  13. Cafforio, C.; Prati, C.; Rocca, F. SAR Data Focusing Using Seismic Migration Techniques. IEEE Trans. Aerosp. Electron. Syst. 1991, 27, 194–207. [Google Scholar] [CrossRef]
  14. Lopez-Sahcnez, J.M.; Fortuny-Guasch, J. 3-D Radar Imaging Using Range Migration Techniques. IEEE Trans. Antennas Propag. 2000, 48, 728–737. [Google Scholar] [CrossRef]
  15. Peng, K.-C.; Lin, C.-C.; Li, C.-F.; Hung, C.-Y.; Hsieh, Y.-S.; Chen, C.-C. A Compact X-Band Vector Network Analyzer for Microwave Image Sensing. IEEE Sens. J. 2019, 19, 3304–3313. [Google Scholar] [CrossRef]
  16. Shumakov, D.S.; Beaverstone, A.S.; Nikolova, N.K. De-Noising Algorithm for Enhancing Microwave Imaging. J. Eng. 2017, 2017, 72–76. [Google Scholar] [CrossRef]
  17. Chen, C.; He, Z.; Song, X.; Liu, T.; Su, Y. A Subspace Projection Approach for Clutter Mitigation in Holographic Subsurface Imaging. IEEE Geosci. Remote Sens. Lett. 2022, 19, 8013505. [Google Scholar] [CrossRef]
  18. Yu, J.; Ka, M.-H. Precision Near-Field Reconstruction in the Time Domain via Minimum Entropy for Ultra-High Resolution Radar Imaging. Remote Sens. 2017, 9, 449. [Google Scholar] [CrossRef]
  19. Wang, Z.; Guo, Q.; Tian, X.; Chang, T.; Cui, H.-L. Near-Field 3-D Millimeter-Wave Imaging Using MIMO RMA with Range Compensation. IEEE Trans. Microw. Theory Tech. 2019, 67, 1157–1166. [Google Scholar] [CrossRef]
  20. Wang, Z.; Tian, X.; Chang, T.; Cui, H.-L. Phase-Based Range-Enhanced Millimeter-Wave Imaging Technique for Multistatic Planar Array. IEEE Trans. Microw. Theory Tech. 2022, 70, 1882–1895. [Google Scholar] [CrossRef]
  21. Li, Y.; Zhang, D.; Geng, R.; Lu, Z.; Wu, Z.; Hu, Y.; Sun, Q.; Chen, Y. A High-Resolution Handheld Millimeter-Wave Imaging System with Phase Error Estimation and Compensation. Commun. Eng. 2024, 3, 4. [Google Scholar] [CrossRef]
  22. Fromenteze, T.; Yurduseven, O.; Berland, F.; Decroze, C.; Smith, D.R.; Yarovoy, A.G. A Transverse Spectrum Deconvolution Technique for MIMO Short-Range Fourier Imaging. IEEE Trans. Geosci. Remote Sens. 2019, 57, 6311–6324. [Google Scholar] [CrossRef]
  23. Guo, Q.; Liang, J.; Chang, T.; Cui, H.-L. Millimeter-Wave Imaging with Accelerated Super-Resolution Range Migration Algorithm. IEEE Trans. Microw. Theory Tech. 2019, 67, 4610–4621. [Google Scholar] [CrossRef]
  24. Meng, Y.; Lin, C.; Qing, A.; Nikolova, N.K. Accelerated Holographic Imaging With Range Stacking for Linear Frequency Modulation Radar. IEEE Trans. Microw. Theory Tech. 2022, 70, 1630–1638. [Google Scholar] [CrossRef]
  25. Abbasi, M.; Shayei, A.; Shabany, M.; Kavehvash, Z. Fast Fourier-Based Implementation of Synthetic Aperture Radar Algorithm for Multistatic Imaging System. IEEE Trans. Instrum. Meas. 2019, 68, 3339–3349. [Google Scholar] [CrossRef]
  26. Zamani, H.; Fakharzadeh, M. 1.5-D Sparse Array for Millimeter-Wave Imaging Based on Compressive Sensing Techniques. IEEE Trans. Antennas Propag. 2018, 66, 2008–2015. [Google Scholar] [CrossRef]
  27. Fan, B.; Gao, J.-K.; Li, H.-J.; Jiang, Z.-J.; He, Y. Near-Field 3D SAR Imaging Using a Scanning Linear MIMO Array with Arbitrary Topologies. IEEE Access 2020, 8, 6782–6791. [Google Scholar] [CrossRef]
  28. Smith, J.W.; Torlak, M. Efficient 3-D Near-Field MIMO-SAR Imaging for Irregular Scanning Geometries. IEEE Access 2022, 10, 10283–10294. [Google Scholar] [CrossRef]
  29. Pramudita, A.A.; Praktika, T.O.; Jannah, S. Radar Modeling Experiment Using Vector Network Analyzer. In Proceedings of the 2020 International Symposium on Antennas and Propagation (ISAP), Osaka, Japan, 25 January 2021; pp. 99–100. [Google Scholar]
  30. Burki, J.; Ali, T.; Arshad, S. Vector Network Analyzer (VNA) Based Synthetic Aperture Radar (SAR) Imaging. In Proceedings of the INMIC, Lahore, Pakistan, 19–20 December 2013; pp. 207–212. [Google Scholar]
  31. Hu, S.; Molaei, A.M.; Yurduseven, O.; Meng, H.; Nilavalan, R.; Gan, L.; Chen, X. Multistatic MIMO Sparse Imaging Based on FFT and Low-Rank Matrix Recovery Techniques. IEEE Trans. Microw. Theory Tech. 2023, 71, 1285–1295. [Google Scholar] [CrossRef]
  32. Bao, G.; Li, P. Inverse Medium Scattering Problems for Electromagnetic Waves. SIAM J. Appl. Math. 2005, 65, 2049–2066. [Google Scholar] [CrossRef]
  33. Fante, R. Transmission of Electromagnetic Waves into Time-Varying Media. IEEE Trans. Antennas Propag. 1971, 19, 417–424. [Google Scholar] [CrossRef]
  34. Zhu, R.; Zhou, J.; Jiang, G.; Fu, Q. Range Migration Algorithm for Near-Field MIMO-SAR Imaging. IEEE Geosci. Remote Sens. Lett. 2017, 14, 2280–2284. [Google Scholar] [CrossRef]
  35. Sheen, D.M.; McMakin, D.L.; Hall, T.E. Three-Dimensional Millimeter-Wave Imaging for Concealed Weapon Detection. IEEE Trans. Microw. Theory Tech. 2001, 49, 1581–1592. [Google Scholar] [CrossRef]
  36. Zhuge, X.; Yarovoy, A.G. Three-Dimensional Near-Field MIMO Array Imaging Using Range Migration Techniques. IEEE Trans. Image Process. 2012, 21, 3026–3033. [Google Scholar] [CrossRef] [PubMed]
  37. Wang, J.; Liu, X. SAR Minimum-Entropy Autofocus Using an Adaptive-Order Polynomial Model. IEEE Geosci. Remote Sens. Lett. 2006, 3, 512–516. [Google Scholar] [CrossRef]
  38. Papoulis, A. Systems and Transforms with Applications in Optics; McGraw-Hill series in systems science; McGraw-Hill: New York, NY, USA, 1968. [Google Scholar]
  39. Qiao, L.; Wang, Y.; Zhao, Z.; Chen, Z. Exact Reconstruction for Near-Field Three-Dimensional Planar Millimeter-Wave Holographic Imaging. J. Infrared Millim. Terahertz Waves 2015, 36, 1221–1236. [Google Scholar] [CrossRef]
  40. Owda, A.Y.; Owda, M.; Rezgui, N.-D. Synthetic Aperture Radar Imaging for Burn Wounds Diagnostics. Sensors 2020, 20, 847. [Google Scholar] [CrossRef]
  41. Yang, G.; Li, C.; Wu, S.; Liu, X.; Fang, G. MIMO-SAR 3-D Imaging Based on Range Wavenumber Decomposing. IEEE Sens. J. 2021, 21, 24309–24317. [Google Scholar] [CrossRef]
  42. Manzoor, Z.; Qaseer, M.T.A.; Donnell, K.M. A Comprehensive Bi-Static Amplitude Compensated Range Migration Algorithm (AC-RMA). IEEE Trans. Image Process. 2021, 30, 7038–7049. [Google Scholar] [CrossRef]
Figure 1. (a) Variation of 3 dB beamwidth with frequency; (b) variation of antenna gain with frequency.
Remotesensing 16 03342 g001
Figure 2. Schematic diagram of the imaging scene.
Remotesensing 16 03342 g002
Figure 3. Mechanism of wave interaction with objects.
Remotesensing 16 03342 g003
Figure 4. Hardware improvements and optimized window treatments.
Remotesensing 16 03342 g004
Figure 5. (a) Data reorganization; (b) data format.
Remotesensing 16 03342 g005
Figure 6. Overall data processing and IMRMA algorithm.
Remotesensing 16 03342 g006
Figure 7. The basic setup of the experimental scene. (a) Flat wave absorbing sponge; (b) antenna height from the object; (c) antenna and target location markers.
Remotesensing 16 03342 g007
Figure 8. Simulation results. (a) Simulation target ‘LF’; (b) simulation results by RMA; (c) simulation results by BP; (d) simulation results by HIA; (e) simulation results by AC-RMA; (f) simulation results by IMRMA.
Remotesensing 16 03342 g008
Figure 9. Processing state of the waveform signal. (a) Original signal waveform; (b) processed signal waveforms; (c) frequency domain signal phase.
Remotesensing 16 03342 g009
Figure 10. (a) Effect of aperture range and height on stepping; (b) effect of aperture range and height on resolution.
Remotesensing 16 03342 g010
Figure 11. Reconstructed image of a glyph with an overlay: (a) overall scenario; (b) imaging target “LF”; (c) double fabric; (d) multilayer fabric; (e) extra thick layers of fabric; (fh) double fabric, multilayer fabric, extra thick layers of fabric with RMA, respectively; (ik) double fabric, multilayer fabric, extra thick layers of fabric with BP, respectively; (ln) double fabric, multilayer fabric, extra thick layers of fabric with HIA, respectively; (oq) double fabric, multilayer fabric, extra thick layers of fabric with AC-RMA, respectively; (rt) double fabric, multilayer fabric, extra thick layers of fabric with IMRMA, respectively.
Remotesensing 16 03342 g011aRemotesensing 16 03342 g011b
Figure 12. Reconstructed image of multiple targets covered by a chunky bowl. (a,b) Represent the scenes before and after covering, respectively; (c) the scene in (b) with two more layers of fabric; (d) the reconstructed image by RMA; (e) the reconstructed image after preprocessing obtained by RMA; (f) the reconstructed image obtained by BP; (g) the reconstructed image obtained by HIA; (h) the reconstructed image obtained by AC-RMA; (i) the reconstructed image obtained by IMRMA.
Remotesensing 16 03342 g012aRemotesensing 16 03342 g012b
Table 1. Computational complexity in each step.
Processing StepsComputational Complexity
Data reorganizationNf Nmin
2D FFTO (Nx Ny Nf log2 (Nx Ny))
Interval non-uniform interpolationO (Nx Ny Nz)
3D IFFTO (Nx Ny Nz log2 (Nx Ny))
Summation along zNz
Table 2. Simulation parameters.
ParametersValue
Center frequency33 GHz
Frequency bandwidth14 GHz
X aperture length0.20 m
Y aperture length0.20 m
Frequency points201
Step size along X-axis3 mm
Step size along Y-axis3 mm
Number of transmitting antennas2
Number of receiving antennas4
Distance of the antenna from the target0.15 m
Table 3. Experimental parameters.
ParametersValue
Center frequency22 GHz
Frequency bandwidth8 GHz
X aperture length0.20 m
Y aperture length0.20 m
Frequency points101
Step size along X-axis5 mm
Step size along Y-axis5 mm
Target height 0.20 m
Table 4. Comparison of PSNR (dB), IE, and time (s) for different coverings in different algorithms.
Double Layer of Fabric Multilayer Fabric Extra Thick Layers of Fabric Time
PSNRIEPSNRIEPSNRIE
RMA10.74185.410910.32175.42639.86145.43751.1710
BP10.65815.389210.43625.412410.05375.45201762
HIA12.32044.423211.16584.462210.18254.54050.5864
AC-RMA12.86934.284113.68274.406410.24764.43021.4052
Proposed14.69573.249714.04063.331613.04773.39290.6275
Table 5. Comparison of PSNR (dB), IE, and time (s) for different algorithms.
PSNRIETime
RMA12.43083.44494.3000
BP12.03583.48072568
HIA11.58693.30322.0522
AC-RMA13.45723.36075.1600
Proposed14.62633.23202.2000
Disclaimer/Publisher’s Note: The statements, opinions and data contained in all publications are solely those of the individual author(s) and contributor(s) and not of MDPI and/or the editor(s). MDPI and/or the editor(s) disclaim responsibility for any injury to people or property resulting from any ideas, methods, instructions or products referred to in the content.

