Abstract
The Tian Shan is a typical active intracontinental orogenic belt that is driven by the ongoing indentation of India into Eurasia. However, the geological features of Quaternary deformation, especially in the easternmost sector near Harlik Mountain, remain elusive. Field observations, topographic analysis, and Electron Spin Resonance (ESR) dating were employed to comprehensively assess the deformation features and evaluate the deformation pattern for this region during the Quaternary period. The results disclose evidence of deformation in the northern and southern foreland basins of Harlik Mountain. In the Barkol Basin to the north, crustal shortening results in the formation of surface scarps and folds, indicating north-directed thrusting, with a shortening rate of ~0.15 mm/yr. In the Hami Basin, the north-directed thrust elevates the granites, which offset the alluvial fans, with a shortening rate of ~0.18 mm/yr. Together with the shortening along the boundary fault, the aggregated north–south shortening rate is approximately 0.69 mm/yr in the easternmost Tian Shan, corresponding with the differential motion rate between the north and south Harlik Mountain revealed by the GPS velocity. These findings imply that, distal to the collision zone, tectonic strain in the eastern Tian Shan is primarily accommodated through the reactivation of pre-existing strike–slip faults, with crustal shortening concentrated at the overlapping position of parallel northeast-trending left-lateral strike–slip faults.
1. Introduction
The Tian Shan (Figure 1) (“Shan” means mountain in Chinese) is a significant tectonic region in Central Asia that has experienced strong Cenozoic deformation due to the far-field effects of the India Asia collision [1,2,3,4,5,6]. This deformation is characterized by a series of faults with varying kinematics and orientations [1,2]. The widespread active faulting, folding, frequent high-magnitude earthquakes, and contemporary geodetic measurements all point to the considerable deformation that the Tian Shan underwent during the Late Cenozoic [7,8,9,10]. Therefore, understanding the spatiotemporal deformation patterns of the Tian Shan is essential for grasping the mechanisms of tectonic deformation in active orogenic belts in Asia, which are linked to the ongoing India Asia collision [10,11,12,13].
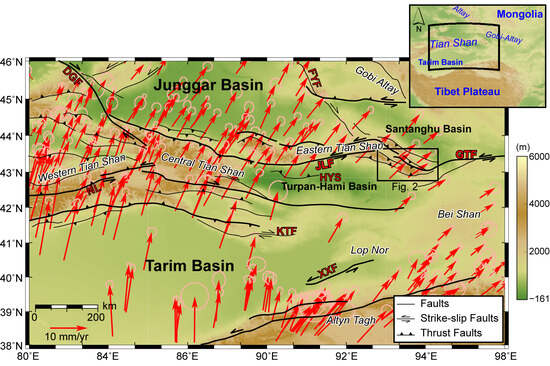
Figure 1.
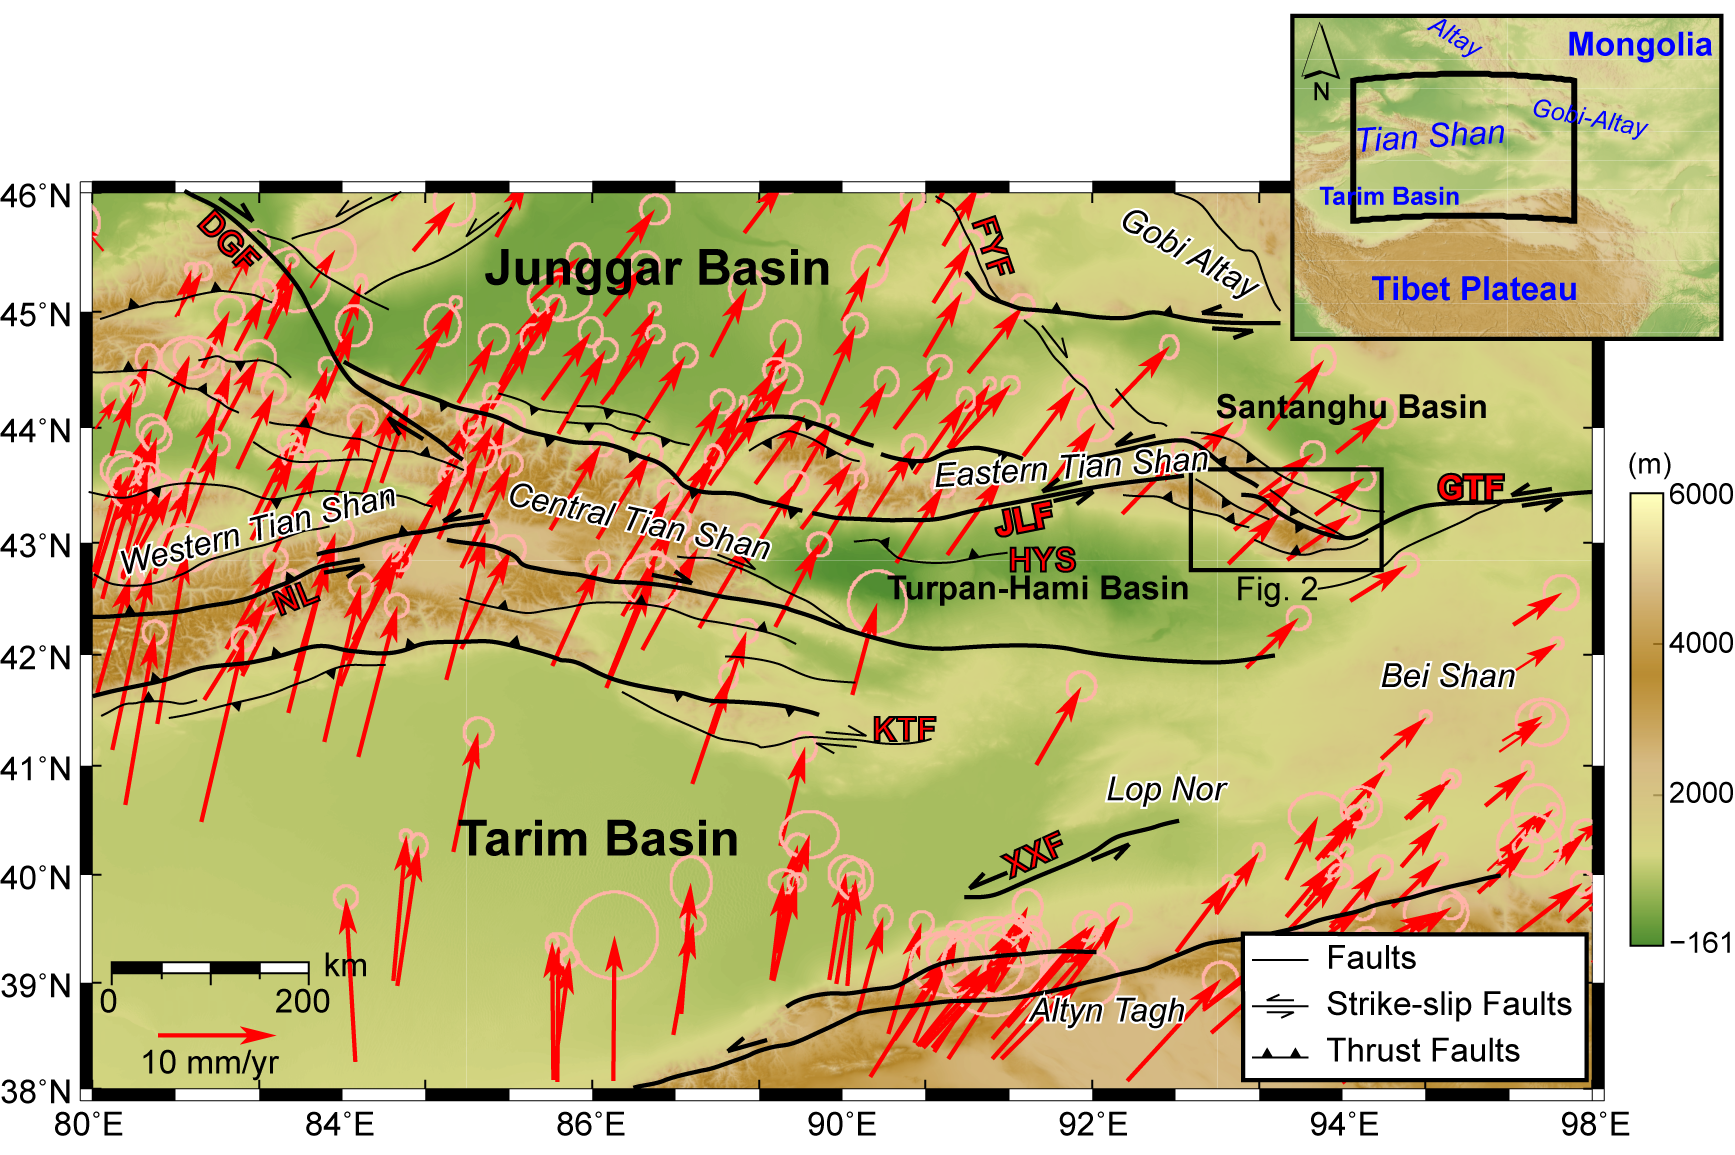
Active faults and GPS-derived horizontal velocity field in the Tian Shan region. The map showcases the distribution of active fault lines according to Cunningham et al. [14], Yin [6], and Wu et al. [15], overlaid with GPS horizontal velocity field data from Zhao et al. [16]. The arrows indicate GPS velocities and error ellipses represent 70% confidence. Key structural features include the Gobi–Tian Shan Fault (GTF), Jianquanzi–Luobaoquan Faults (JLF), Xingxingxia Fault (XXF), Kuruk Tagh Fault (KTF), Nikolaev Line (NL, also known as the Nalati Fault), and Huoyanshan thrust belt (HYS).
In the Tian Shan orogenic belt, three distinct sets of structures, northwest-striking faults, east–west-striking faults, and east–northeast-striking faults, display varying orientations and kinematics, exerting control over present-day crustal deformation [1,2,15] (Figure 1). In the northwest region, a series of right-slip fault strikes are oriented northwest, such as the Talas–Fergana and Dzhungarian faults [2,6,17]. The east–west-striking faults primarily consist of foreland thrust systems, which represent the most recently active components of the Tian Shan [18]. These systems are characterized by a series of folds and thrust faults [7,9,10,11,19,20,21]. They propagate continuously from the mountain front toward the foreland basin. Within this range, oblique convergence between the Tarim Basin and Tian Shan leads to left-lateral shear motion along several major east–northeast-striking faults [15,22,23,24,25]. Modern Global Positioning System (GPS) measurements illustrate this left-lateral shear motion, signifying pronounced activity in the Late Cenozoic and suggesting a maximum sinistral slip rate of approximately 6 mm/yr in the western Tian Shan, which sharply decreases to only about 1–2 mm/yr in the central and eastern Tian Shan [15,26]. These faults accommodate long-term left-lateral offsets through intermittent large earthquake ruptures, underscoring the localization of most strike–slip faulting on these basement structures [27].
Previous research has predominantly focused on the north–south convergence within the Tian Shan region [10,28,29]. This convergence is manifested through thrust faulting and crustal shortening not only in hinterland areas but also in foreland areas [1,2,7,11,17,28,30]. For example, crustal shortening of up to ~30 km in the western Kunlun Range and ~36 km in the southwest Tian Shan is accommodated in the foreland area [18]. The Late Quaternary rate of shortening across the Tian Shan range, including in the southern Chinese Tian Shan foreland and the intermontane basins in the hinterland, amounts to ~9.0 ± 1.0 mm/yr, approximately matching the modern shortening rate of ~8 mm/yr derived from GPS measurements [9]. In the eastern part, the shortening rate along the Huoyanshan fold-and-thrust belts in the western area of Turpan–Hami Basin is 1.6 ± 0.2 mm/yr [31]. Such analysis provides important insights into the pattern and dynamics of the deformation of an active orogenic belt, as well as how deformation propagates basinward. In the easternmost Tian Shan, both foreland and intermontane basins are developed [32], dominated by the Gobi–Tian Shan Fault (GTF). This fault, which links the Tian Shan with the Gobi Altai in Mongolia (Figure 1), underwent pronounced ductile shear deformation during the latest Permian–Triassic and brittle reactivation in the Late Cenozoic [14,33]. Past studies have postulated a kinematic transition from a thrust-dominated deformation in the central Tian Shan to a left-lateral transpressional deformation in the extreme east [14,33,34]. However, previous studies regarding the Late Quaternary deformation here mainly focused on the boundary faults [14,35], and little is known about the deformation in the basin. Such a lack of information has limited our understanding of the pattern and dynamics of deformation in the easternmost Tian Shan.
In response to this research gap, the present study was designed to examine the structural patterns, fault activity rates, and kinematics in the surrounding basins of the easternmost Tian Shan during the Quaternary period. Our methodology encompassed detailed interpretations of high-resolution topographic profiles, thorough investigations into surface deformation, and the application of Electron Spin Resonance (ESR) dating techniques to Late Quaternary sediments. Through this multi-faceted approach, we aim to provide a comprehensive and nuanced understanding of the complex deformation processes occurring in the easternmost Tian Shan during the Quaternary. This research endeavor is not only critical for elucidating the deformation mechanisms within this specific region but also for illuminating the broader implications of the far-field effects of the India Asia collision, particularly in the transitional zone between the Tian Shan and Mongolia [33].
2. Geological Background
2.1. Tectonic Setting of the Easternmost Tian Shan
The Tian Shan is an extensive mountain range, spanning approximately 2500 km in length (Figure 1). It is characterized by a series of elongated mountains running in an east–west orientation. The easternmost portion of the Tian Shan is geographically separated from its surroundings by various basins and adjacent mountain ranges [32]. To the north, the Harlik Mountains are separated from the Gobi Altay by the Santanghu Basin; to the south, the Turpan–Hami Basin, western Bei Shan, and Lop Nor serve as the geographical dividers between the Harlik Mountains and the Altyn Tagh (Figure 1). A relatively small basin known as the Barkol Basin acts as a partition, splitting the easternmost Tian Shan. To the north of this basin lies Moqinwula Mountain, while to the south lies the highly elevated Harlik Mountain. It soars to an elevation of approximately 4900 m relative to the Hami Basin and distinctly marks the eastern boundary of the Tian Shan.
The geological composition of Harlik Mountain is complex (Figure 2), consisting primarily of Ordovician basement rocks, including schists and phyllites, as well as Devonian sedimentary and volcanic formations [36]. This region also encompasses extensive Carboniferous volcanic and sedimentary rocks, intersected by a multitude of intrusions that range in composition from acidic to basic [37]. The mountain is notably characterized by thrust faulting along both its southern and northern flanks [14,33]. The principal thrust fault on the northern side exhibits a remarkable directional shift, transitioning from a northwest strike in the northwest to a northeast–east strike in the northeast [14]. This fault seamlessly connects to the left-lateral strike–slip GTF to the east and the Jianquanzi–Luobaoquan Fault to the west (Figure 1). Cunningham [34] postulated that this geological structure is a regional-scale restraining bend at the southwest terminus of the sinistral GTF system, marking it as a crucial intracontinental orogenic termination zone.
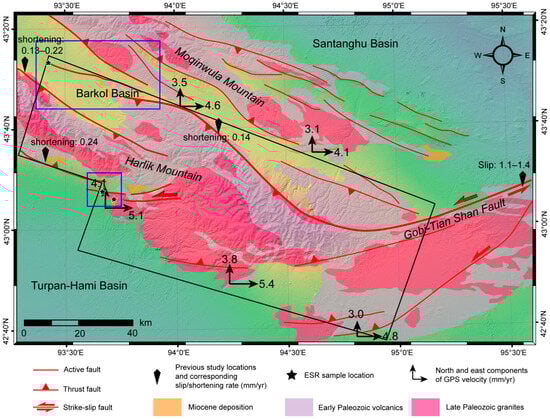
Figure 2.
Active faults and main geological rock distribution around Harlik Mountain. This topographical map illustrates the active faults in the vicinity of Harlik Mountain, with fault lines adapted from Cunningham et al. [14] and Wu et al. [15]. It also presents shortening and slip rates from previous studies by Xu [38] and Ren [39], alongside GPS velocity data from Wang and Shen [40]. Insets blue boxes highlight detailed areas of specific interest, shown in subsequent figures. The black box illustrates the area of the tectonic model.
2.2. Quaternary Tectonics
The southern and northern flanks of Harlik Mountain in the easternmost Tian Shan are notably marked by extensive alluvial–fan complexes, indicative of significant geological activity in the region [14,33,38,39,41,42,43,44]. Over the past century, several earthquakes with magnitudes exceeding 4.0 have been recorded in and around the Harlik Mountains. The frequency and magnitude of these seismic events point to ongoing fault activities [15]. A key aspect of the Quaternary activity is the deformation of originally horizontal sedimentary layers and geomorphic surfaces, found in the adjacent basins [42,43,45]. These layers, which were once flat, have been transformed into folds or inclined strata in proximity to the mountain, providing clear evidence for Late Cenozoic tectonic activity.
Across Harlik Mountain, the current GPS velocity data show that the north velocity components decrease from 4.1–3.8 mm/yr in the south to 3.5–3.1 mm/yr in the north (Figure 2). The east velocity components decrease from 5.4–4.8 mm/yr in the south to 4.6–4.1 mm/yr in the north [40]. This gradient in shortening rate probably reflects the strain distribution and how it is accommodated [40].
The Quaternary deformation surrounding Harlik Mountain is controlled by the GTF system [14,33]. At the eastern end of the mountain, surface deformation clearly exhibits left-lateral slip along the main fault. Geodetic results and GPS velocity data reveal a slip rate of ~1.2 mm/yr along this fault in Mongolia [15,26]. Utilizing a displaced terrace surface of about ~200 m and a 10Be exposure age of ~140–180 ka for an abandoned terrace, Ren [39] estimated a slip rate of 1.1–1.4 mm/yr at the eastern end of the mountain (Figure 2). The fault extends westward along the northern boundary of Harlik Mountain, acting as a thrust fault with a north–south shortening rate of 0.14 mm/yr [39], and continues into the Barkol Basin (Figure 2). In the western part of Harlik Mountain, also known as Barkol Mountain, deformation associated with thrusting primarily occurs along its northern and southern boundaries, with shortening rates of 0.13–0.22 mm/yr in the north and 0.24 mm/yr in the south [44]. Further west, Harlik Mountain is bounded by the sinistral Jianquanzi–Luobaoquan Fault, with a slip rate of 0.9–1.1 mm/yr [15].
3. Methods
3.1. Quaternary Surface Deformation Analysis
The examination of deformation patterns at various locations is important for an in-depth understanding of fault kinematics and strain accommodation along the GTF, particularly at its terminal restraining bend. The fault system exhibits a range of deformation styles, each contributing to unique geomorphological features. To effectively quantify these features, we employed a multifaceted approach combining satellite image interpretation with the visual analysis of geomorphological markers. The field analysis was conducted during the years 2021 and 2022.
The methodology of this study involved measuring certain key geomorphological features indicative of surface deformation at different locations, such as fault scarps and folds. These measurements were conducted using an integrated approach of remote-sensing image analysis and differential Global Positioning System (dGPS) and unmanned aerial vehicle (UAV) measurements. The remote-sensing image analysis was based on Google Earth and high-resolution Gaofen-7 data. The dGPS technology allowed for the precise tracking and recording of smaller fault scarp and river terrace features. We obtained topographic profiles perpendicular to these features on the designated reference surface, ensuring an accurate representation of variations in the vertical dimension. For this purpose, we utilized TruPulse 200 and Garmin GPS devices, providing a vertical uncertainty of less than 10 cm.
In cases of larger geomorphic features, such as prominent folds and high fault scarps, the use of UAVs was deemed more appropriate. UAVs facilitated the acquisition of high-resolution digital elevation models (DEMs) via a DJI Phantom 4 Pro drone with a 1″ complementary metal-oxide-semiconductor sensor with 20 million effective pixels and a lens with an 84° field of view and autofocus of 1 m–∞ [46]. The selected images were imported into Agisoft PhotoScan Pro to generate DEMs with centimeter resolution.
The Gaofen-7 satellite employs a laser altimeter to provide global measurements of ground elevation. It can effectively acquire 20 km wide front-view panchromatic stereoscopic images with a 0.8 m resolution, rear-view panchromatic stereoscopic images with a 0.65 m resolution, and multi-spectral images with a 2.6 m resolution. In this study, one set of Gaofen-7 stereo images captured in March 2024 with less cloud and snow, a clear texture, and geometric structures were provided by the High-resolution Remote Sensing Data Center, China Earthquake Administration. The extraction of DEMs from the Gaofen-7 stereo images followed the method proposed by Zhu et al. [47]. All topographic profiles were extracted from the DEMs using ArcGIS Pro 3.0.
3.2. Late Quaternary Sediment Dating
The study of Quaternary sediments, particularly those displaced by fault movements, found in fluvial terraces, and forming folds, provides a valuable opportunity for dating the timing of deformation. Accurately dating these sediments is essential for constraining the slip rate of the fault and understanding the temporal dynamics of tectonic activity in the region. Prior research has indicated that the exposure ages of several geomorphological surfaces at several locations are approximately 200–100 ka [39,44]. However, there are still some sites where surface deformation lacks age constraints. To complement the age control for these geomorphic units, ESR dating was conducted in this study. ESR dating is a powerful technique for determining the age of mineral grains, such as quartz, within sediment layers [48,49,50,51].
For the ESR dating process, we targeted uniform fluvial sediments predominantly consisting of medium- to fine-grained sands [50]. These sediments were ideal candidates for ESR dating due to their abundance of quartz with grain sizes of 100–200 μm. During field collection, a 20 cm long, 5 cm diameter steel pipe, with one end covered by opaque materials to prevent light exposure, was carefully driven into the sediment layer using a plastic hammer. This method ensured minimal disturbance of the sediment’s natural state.
To maximize the accuracy of our ESR measurements, only the central portion of each sample was analyzed. This approach was crucial as it minimized potential contamination or alteration of the sample due to external factors. The dating process was conducted following the established procedures outlined by Liu et al. [52] at the State Key Laboratory of Earthquake Dynamics, Institute of Geology, China Earthquake Administration. Through this meticulous process, we aimed to derive robust and reliable ESR dates that could provide a clearer understanding of the chronological framework of the tectonic events that have shaped the landscape in this region.
3.3. Shortening Amount Calculation
The area conservation method, a well-established tool for quantifying horizontal crustal shortening within anticlines [53], was utilized to calculate the crustal shortening amount accommodated by folding related to thrusting. This method operates on the principle that the excess area (A) formed during the folding of an anticline is conserved and can be quantified by comparing the original flat topographic surface with the folded terrace. By dividing this excess area by the depth of the detachment layer (Z), the horizontal crustal shortening (S) can be calculated (S = A/Z).
4. Results
4.1. Quaternary Surface Deformations
4.1.1. Barkol Basin
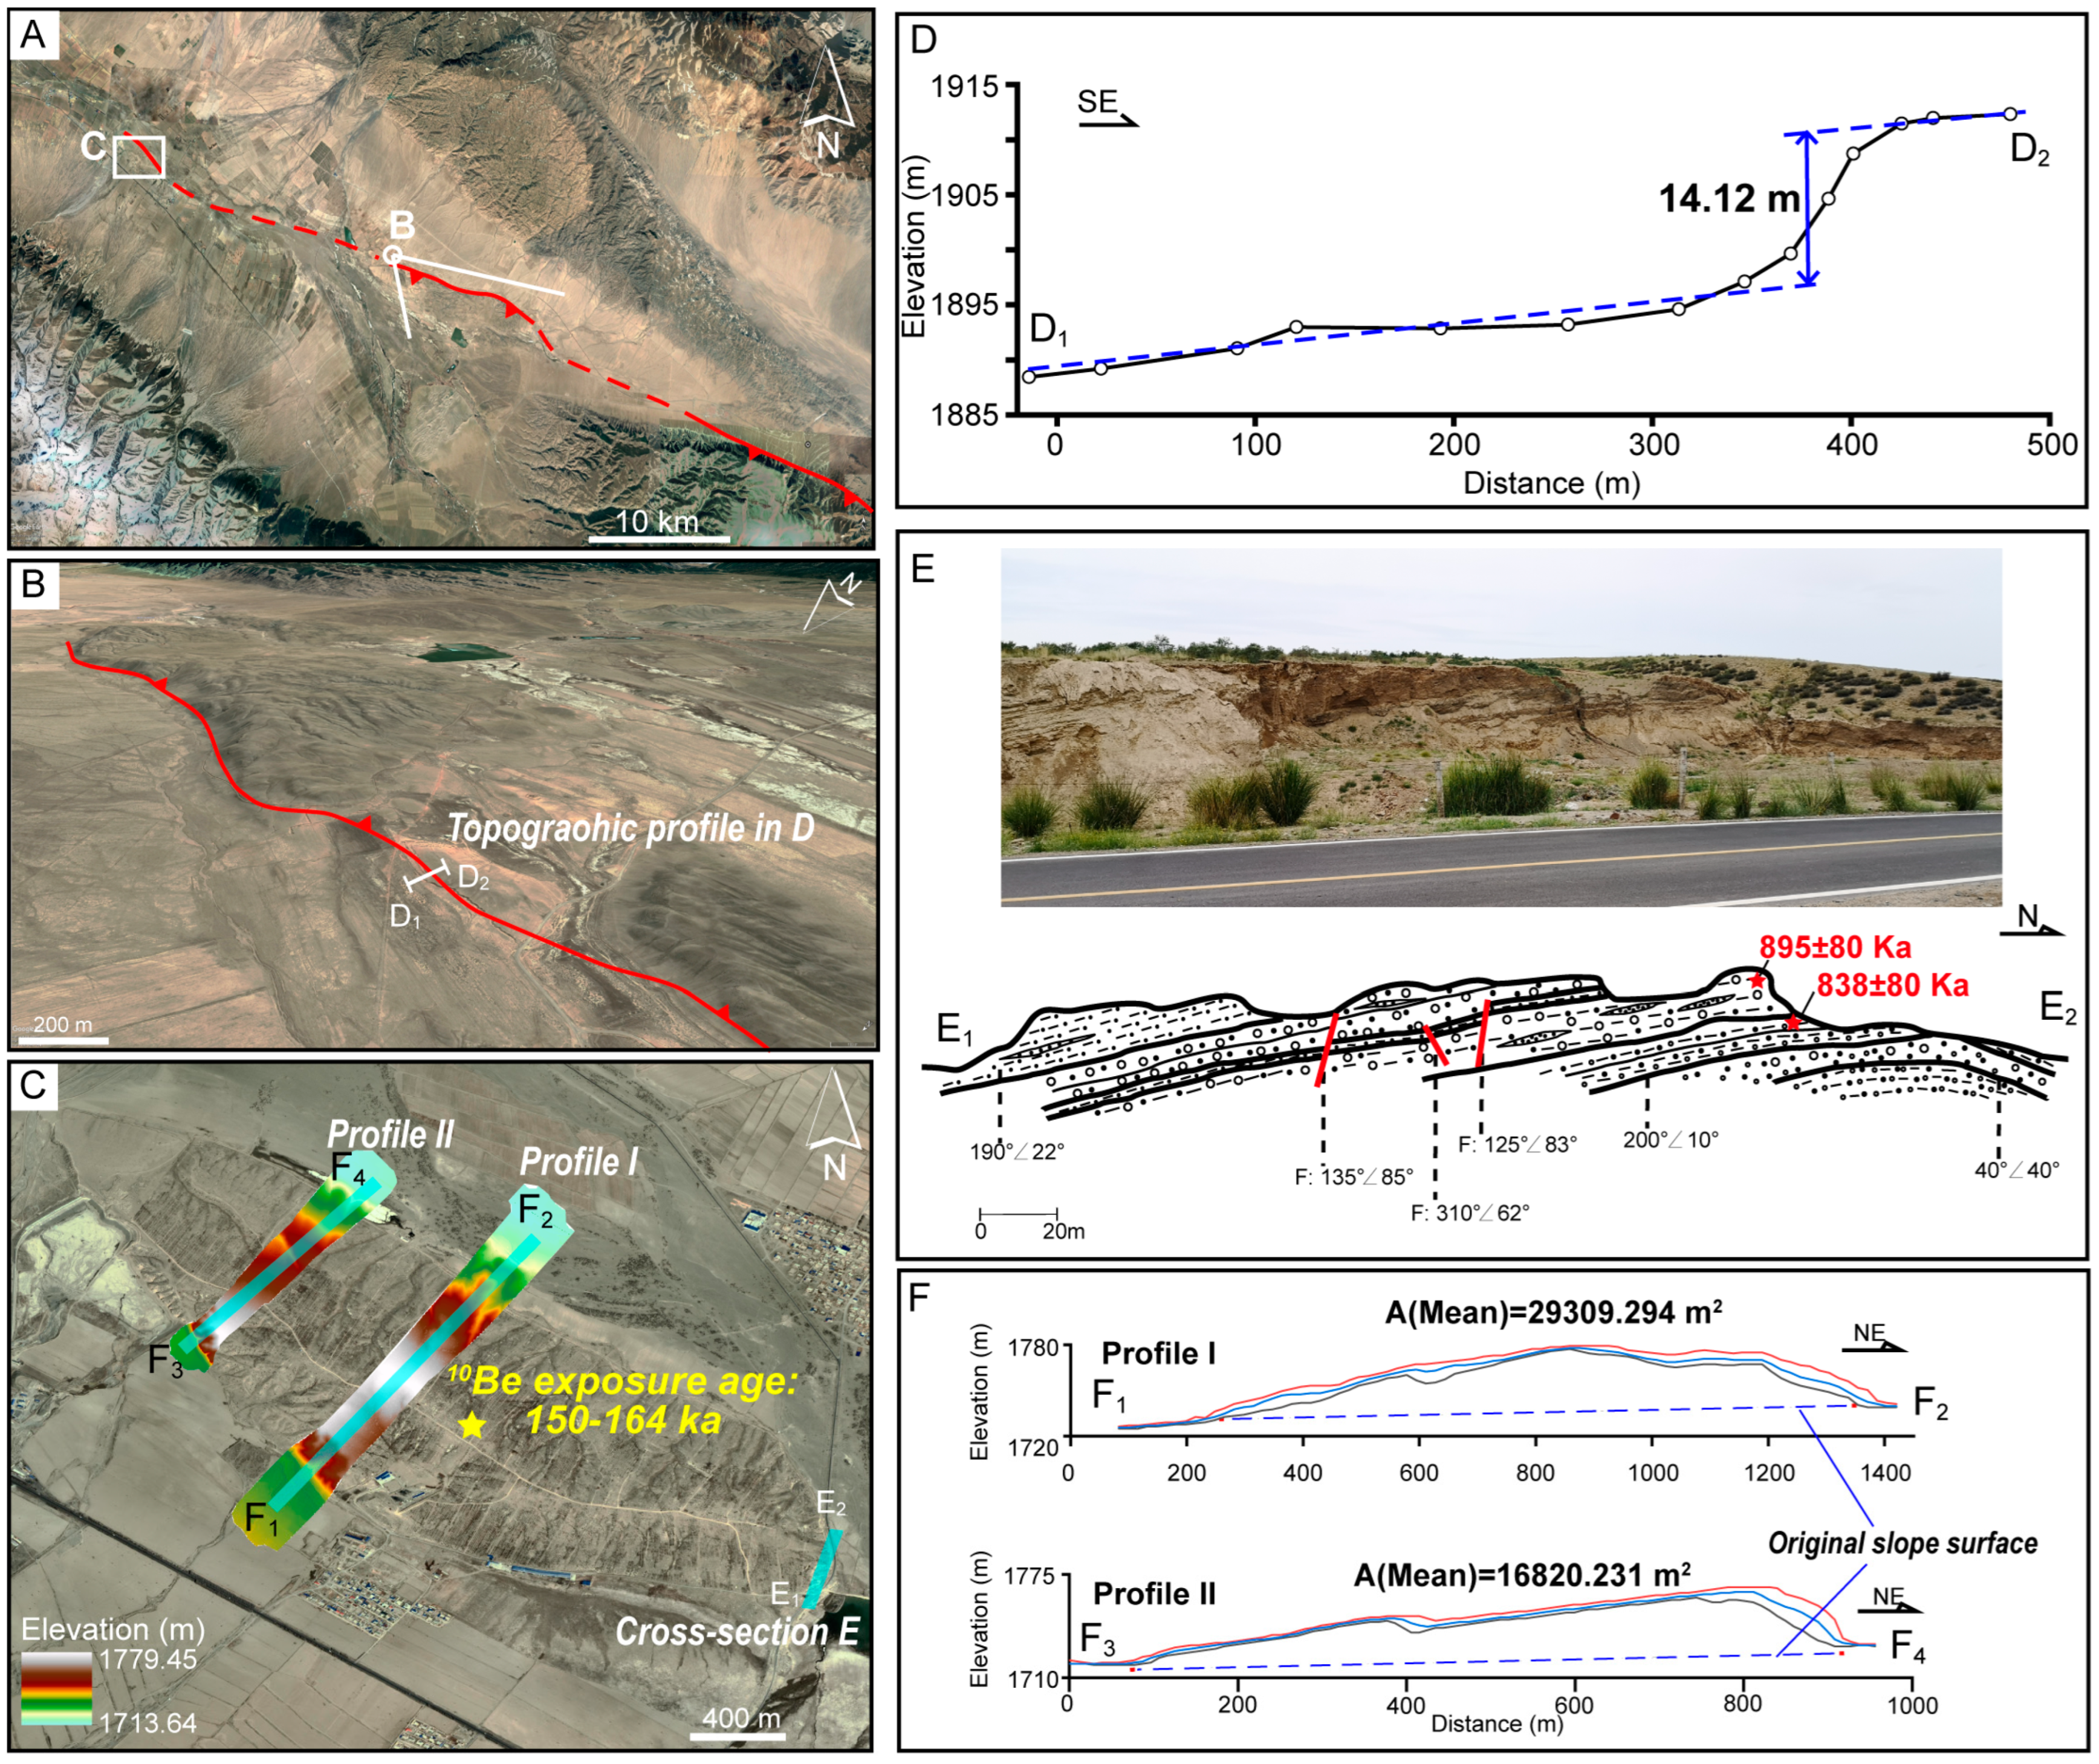
To the northwest, the GTF extends into the Barkol Basin along the northern boundary of Harlik Mountain (Figure 3A), resulting in the formation of surface scarps (Figure 3B) and folds (Figure 3C) within the basin. At the eastern part of the basin, the surface is interrupted by a north-facing scarp, likely indicative of a fault scarp (Figure 3B). This fault, trending at approximately 105°, stretches for about 10 km at the surface. The height of the scarp was measured using dGPS, revealing a height of approximately 14.12 m (Figure 3D).
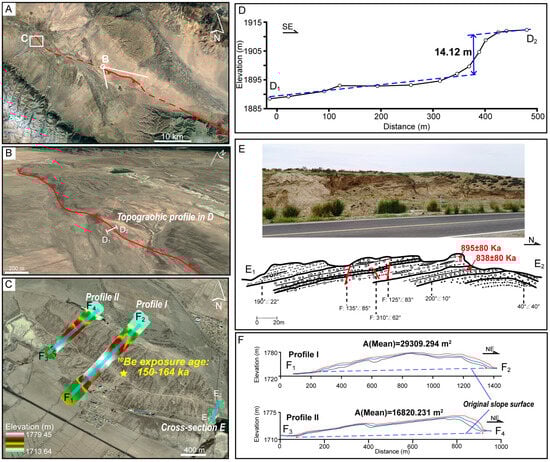
Figure 3.
Deformation features in the Barkol Basin. (A) Satellite image from Google Earth delineating the fault trace (red lines) within the basin. (B) Oblique aerial view from Google Earth showing the fault scarps (red lines), with the topographic profile detailed in (D). (C) Depiction of fold geometry in the Barkol Basin, with locations for the geological cross-section (E) and two UAV-derived topographic profiles (F) indicated. The 10Be exposure age of exposed quartz boulder, based on Xu [38] and Ren [39], is noted. (D) dGPS-measured topographic profile across the fault, showing an elevation difference of ~14.12 m. (E) Field photo (top) and geological cross-section (bottom) of the fold at its eastern extremity, highlighting the folded sedimentary layers with ESR-dated ages of 838 and 895 ka. (F) UAV-derived topographic profiles of the fold, including the calculated area of horizontal crustal shortening (A), which provided quantitative insights into the geological deformation.
In the central part of the Barkol Basin, located north of Harlik Mountain, the field survey revealed a long ridge elevated about 20 to 40 m above the surrounding ground surface. This ridge extends in an east–southeast direction, trending approximately 120° (Figure 3C). At the eastern end of this ridge, exposed cross-sectional sediment layers form a broad anticlinal structure (Figure 3E). This structural formation is in alignment with the topography of the ridge itself. The south limb of the fold was found to dip toward 190° and 200°, with a dip angle ranging from 10° to 22°. Conversely, the north limb of the fold is somewhat steeper, dipping toward 40° with a dip angle of 40° (Figure 3E). This suggests a blind thrust rooted to the south, with a north-verging fault-propagation fold forming at the surface.
Satellite imagery showed that the anticline stretches ~1500 m from west to east, with a width of ~500 m. To further investigate the geomorphic characteristics of this area, we generated two high-resolution DEM profiles using UAVs (Figure 3F). These topographic profiles revealed a notable asymmetry in the fold, characterized by a gentle, elongated slope on the southern side and a significantly steeper slope on the northern side (Figure 3F). This asymmetry in the topography directly correlates with the dip angles of the sedimentary layers, suggesting that the topographic shape is predominantly influenced by the underlying fold structure.
4.1.2. Southern Foreland of Harlik Mountain
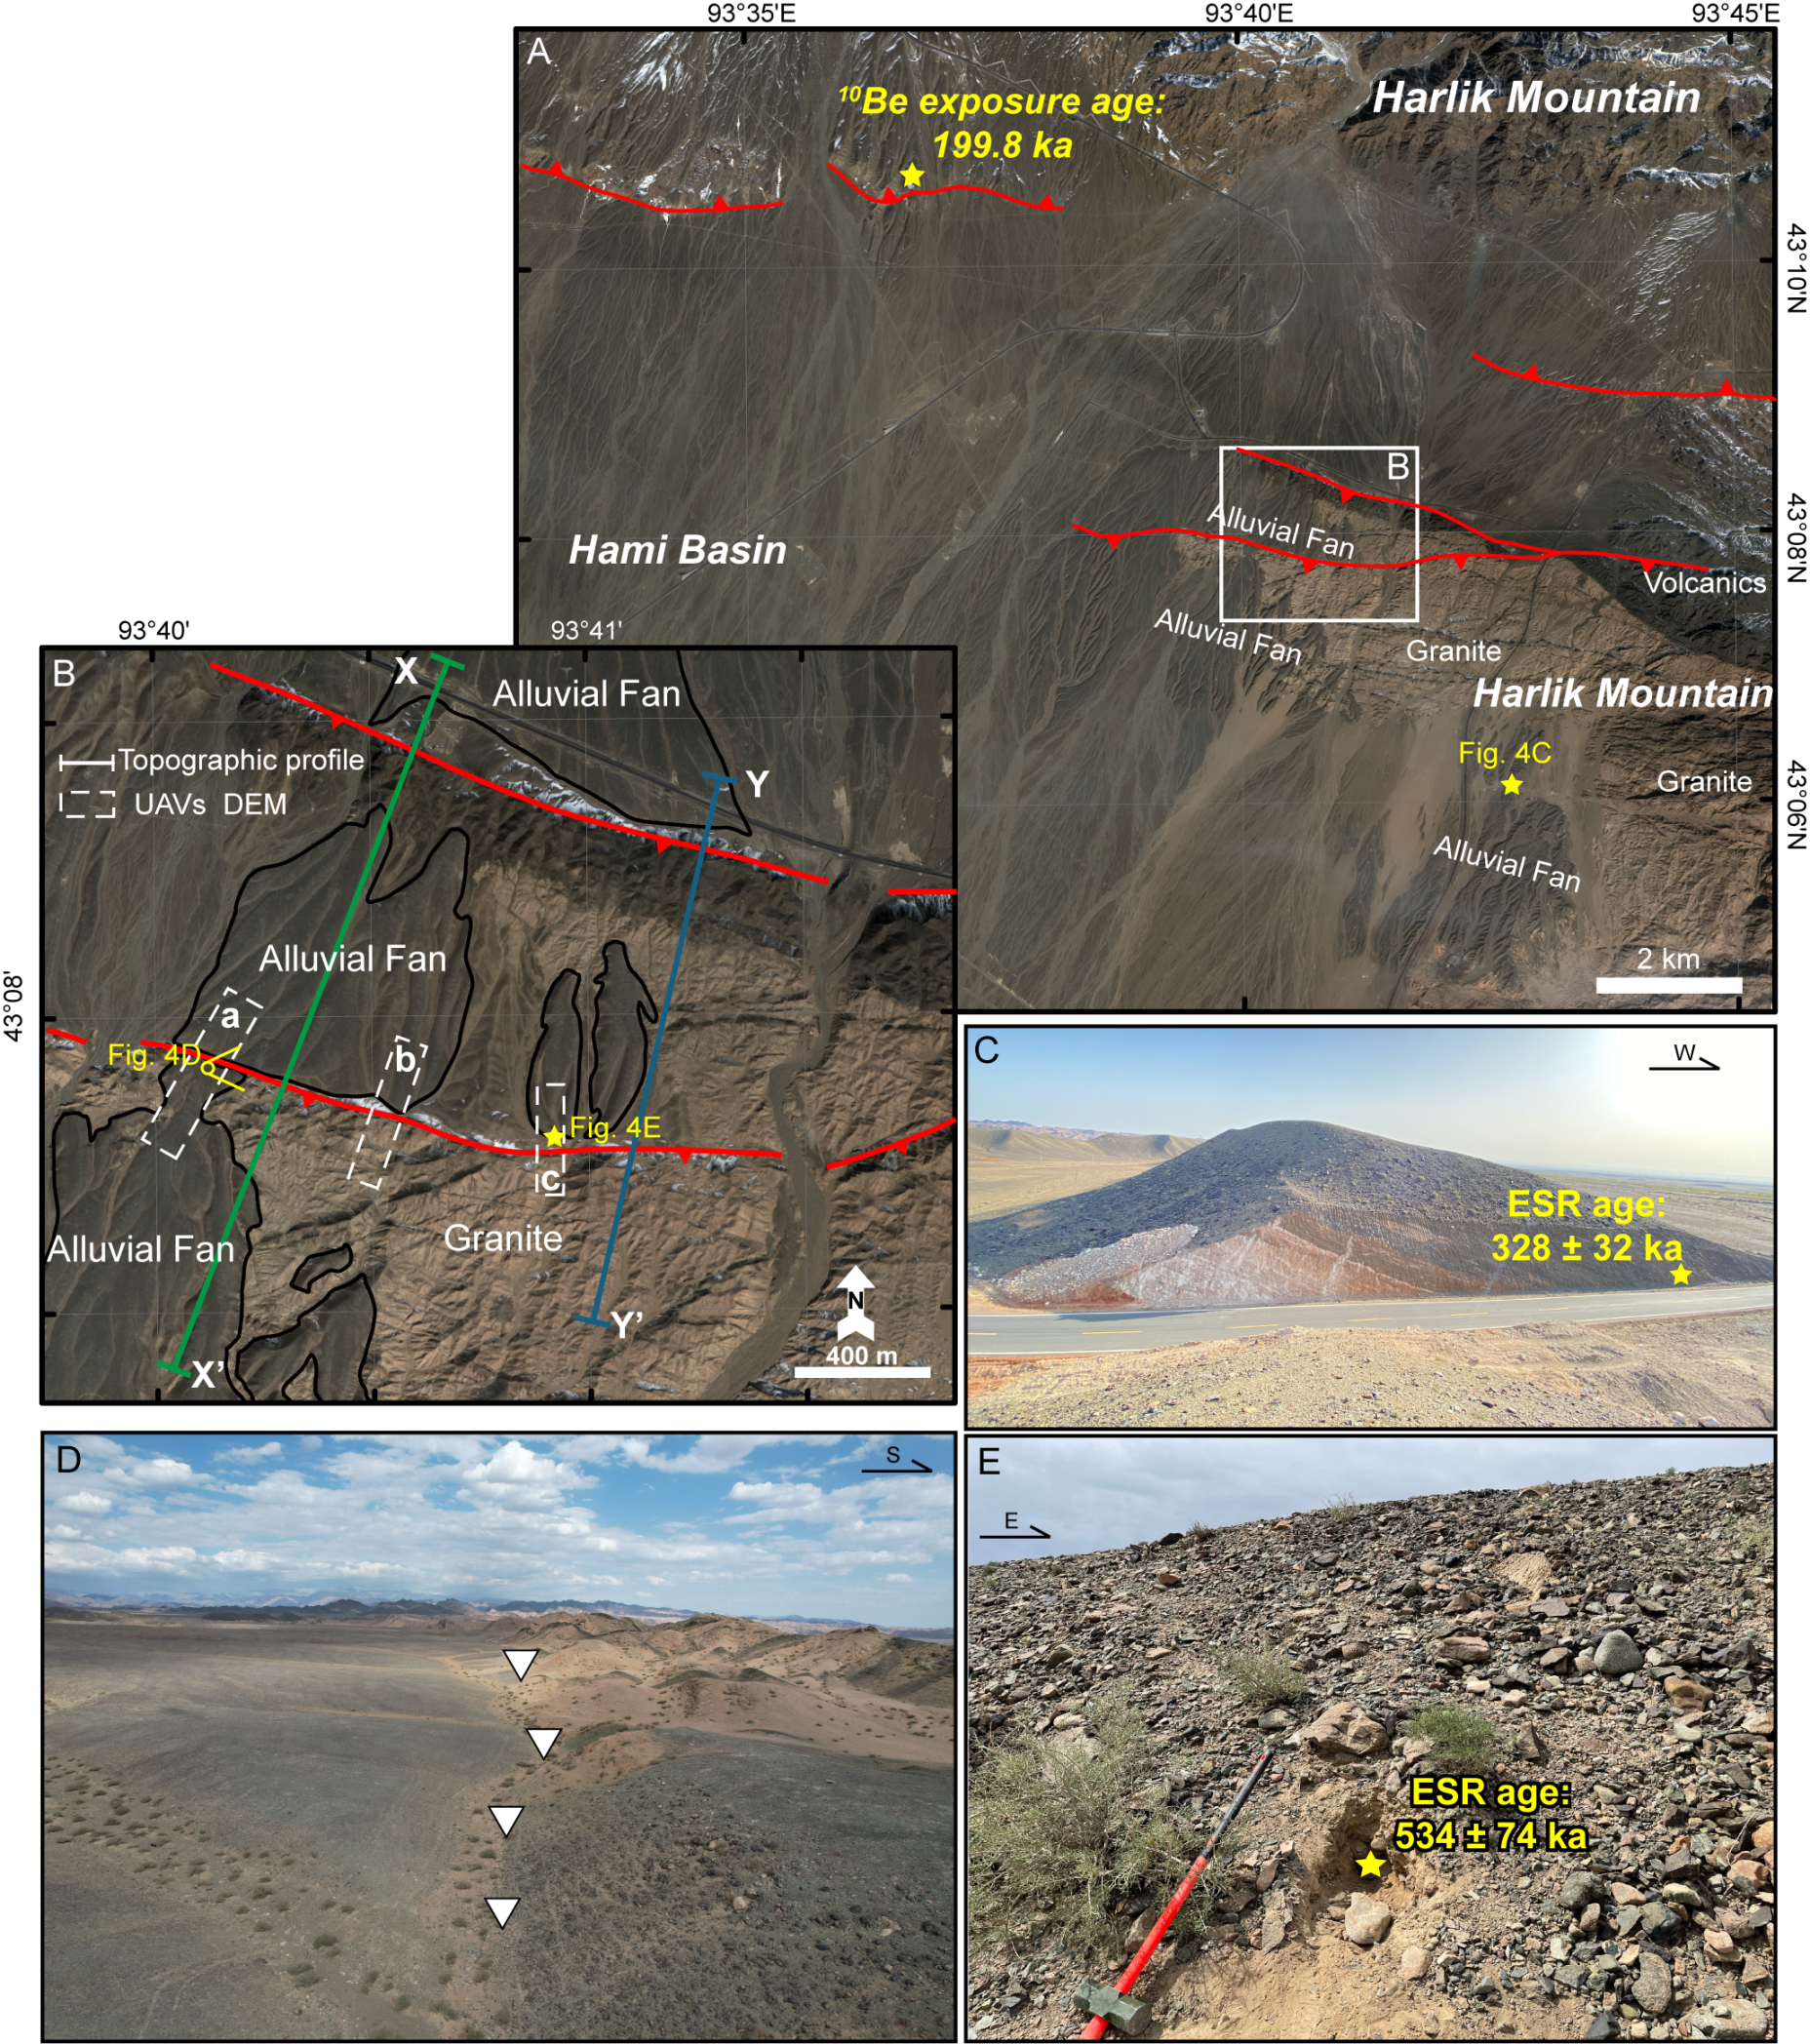
Previous studies identified that an active fault offset the alluvial fans at the southern boundary of the mountain [39,44]. Further south, the granites and volcanic rocks on the southern slope of Harlik Mountain extend westward into the basin (Figure 4A). In the western and southern parts, these rocks are partially covered by the Quaternary alluvial fans. Notably, in the westernmost part of the granites and volcanics, some alluvial fans are offset by two linear structures and are elevated to higher positions (Figure 4B). Under natural conditions, alluvial fans cannot flow upward, so the presence of alluvial fans on top of the granites indicates that the granite was uplifted after their deposition.
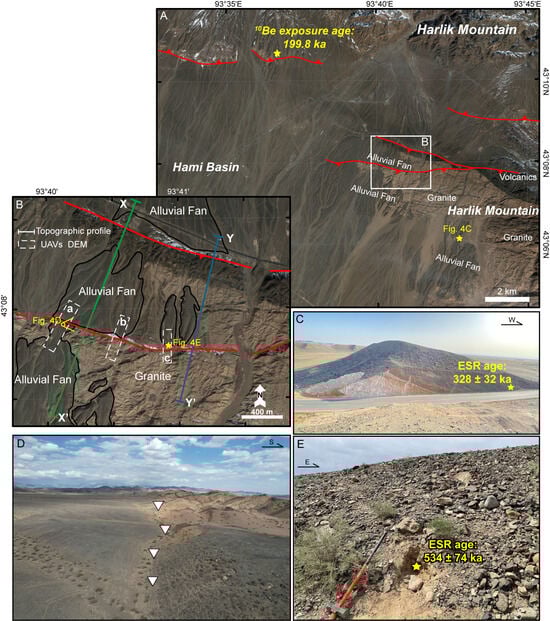
Figure 4.
Surface deformation features at the southern Harlik Mountain. (A) Gaofen-7 satellite imagery provides an overview of the main active faults near the southern side of Harlik Mountain, with the 10Be exposure age of an exposed quartz boulder from Ren [39] annotated. (B) A detailed view illustrates the juxtaposition of granite against Quaternary alluvial fans. The boxes of a, b and c show the location of UAV surveys. Red lines are the faults. (C) A photograph displaying the tilted sedimentary layers of the alluvial fan overlying the granite, with the location of the ESR sample and its age marked. (D) A drone-captured image of the western part of the southern branch fault. The triangles illustrate the topographic boundary. (E) The site and age of the ESR-dated alluvial fan sediment north of the southern branch fault.
The offset alluvial fans strongly suggest the presence of two branch faults: one north of the volcanic rocks and the other north of the granite. Tectonic activities associated with these faults have uplifted the volcanic rock and granite on the southern side. This uplift has consequently led to the erosion of what were once overlaying Quaternary deposits, exposing the older rocks beneath. Additionally, in the southeastern part of the study area, there is also a large alluvial fan covering the granite. Although satellite images do not show evidence of disruption, field investigations have revealed that the alluvial fan has been tilted, dipping westward (Figure 4C).
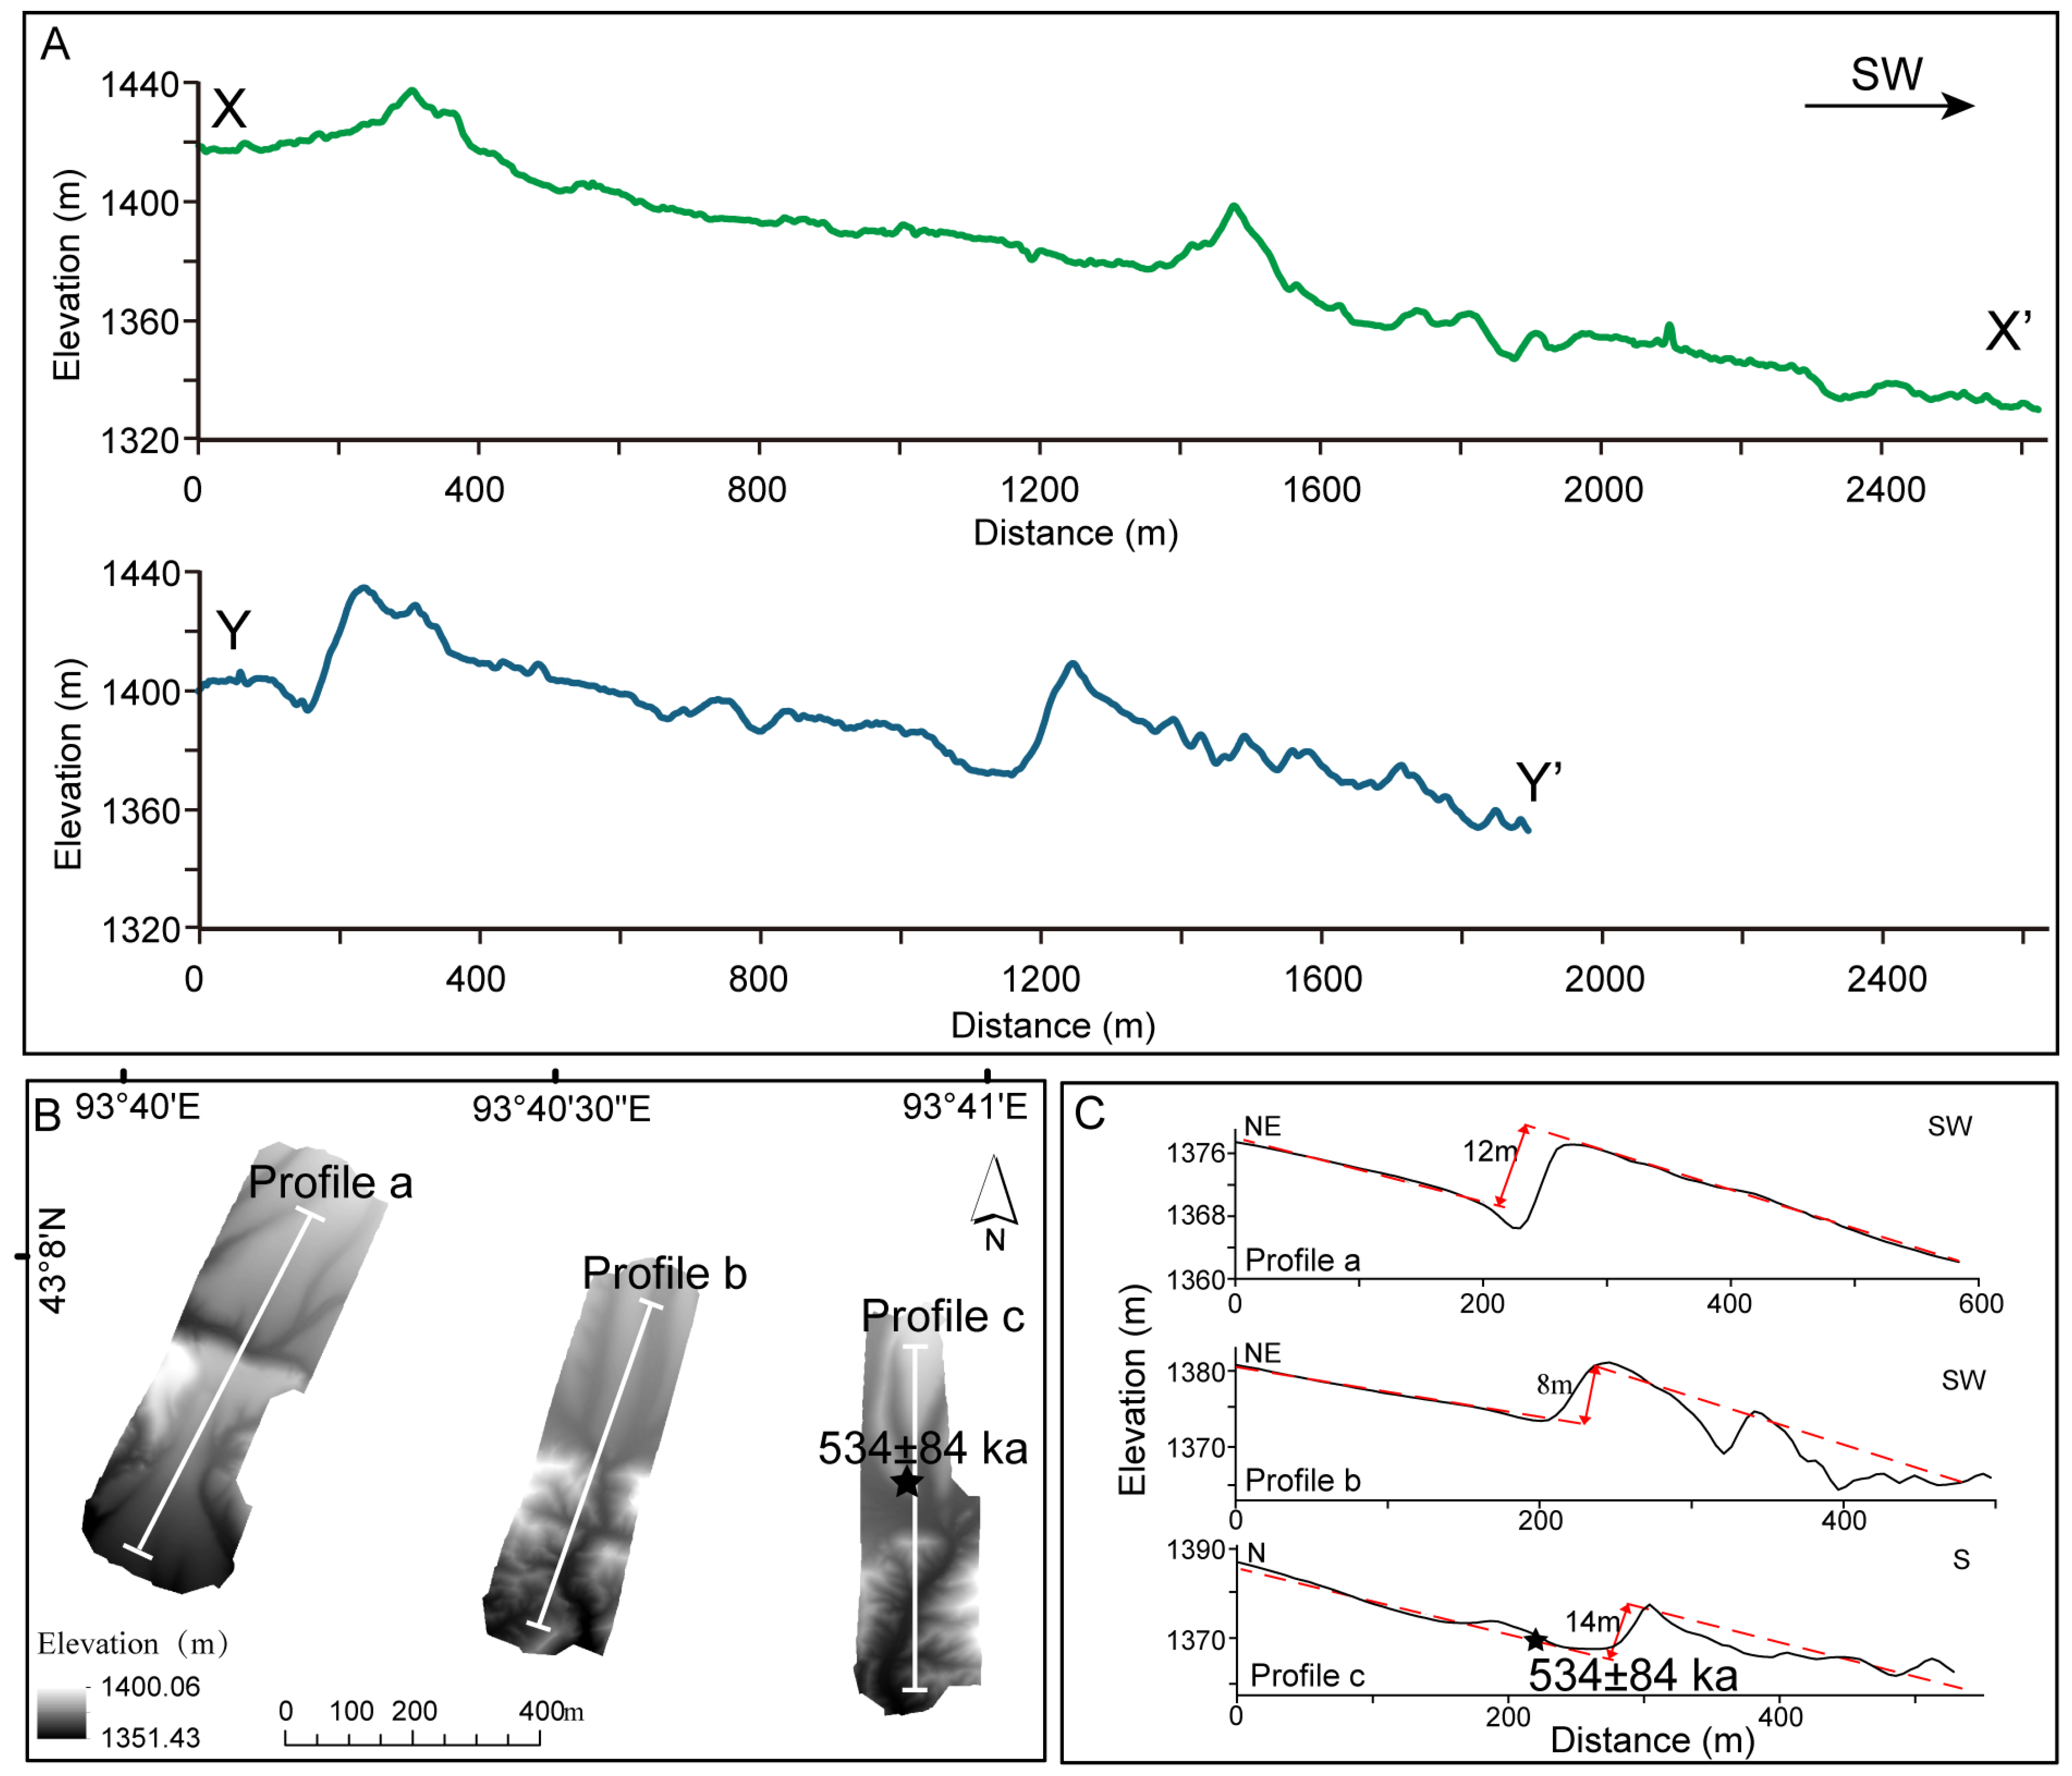
We conducted a detailed topographic analysis of the two branch faults, using high-resolution DEM data from the Gaofen-7 satellite (Figure 5A) and UAV-based DEM profiles (Figure 5B). These profiles indicated that the vertical offset is higher in the eastern part than in the western part (Figure 4D) for both branches, suggesting a westward weakening of fault activity. Moreover, the longer westward extension of the southern branch fault may indicate a longer duration or later period of activity. The topographic measurements revealed that the vertical offsets are mostly around 12 m (Figure 5C), with the highest value reaching ~40 m (Figure 5A).
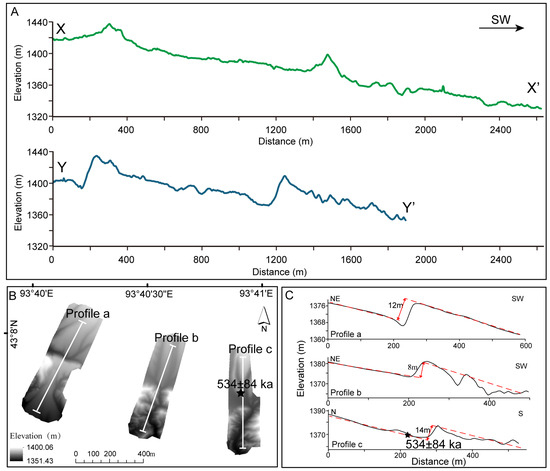
Figure 5.
Vertical offset analysis of branch faults near Harlik Mountain. (A) Topographic profiles displaying vertical offsets across the branch faults, with elevations obtained from Gaofen-7 satellite data. (B) DEMs from UAV surveys illustrating the landscape and fault lines, with profiles marked as a, b, and c. (C) Detailed topographic profiles from UAV-derived DEMs showcasing the vertical offsets along the southern fault, with annotations of displacement measurements and the ESR age of sediment displacement.
4.2. ESR Dating Results
The ESR dating method was applied to a total of five samples collected from various key locations across the study area. The results are summarized in Table 1.

Table 1.
ESR dating results.
In the Barkol Basin, two samples, PM107-4 and PM107-5, were collected from folded sedimentary deposits (Figure 3). These samples yielded ages of 895 ± 80 and 838 ± 80 ka, respectively. These ages are significantly older than the abandonment age of the fold surface obtained in a previous study, which was approximately 164 ka [38].
Lastly, in the southern foreland region of the mountain, two sand samples were submitted for ESR dating (Figure 4). One of the samples (21PM03-1) was taken from the lower part of an alluvial fan in the north of the southern branch fault, about 5 m below the alluvial fan surface (Figure 4E). The other sample (20HLK6-1) came from the alluvial fan in the southeast, situated in the upper layer of the tilted rock (Figure 4C). Both alluvial fans directly overlap the granite, suggesting that they were deposited contemporaneously. The dating results were 534 ± 74 and 328 ± 32 ka, respectively (Table 1), indicating that the alluvial fans were deposited between ~600 and 300 ka.
4.3. Crustal Shortening Amount Calculation
In the Barkol Basin, crustal shortening is accommodated by folding related to thrusting. The area conservation method, a well-established tool for quantifying horizontal crustal shortening within anticlines [53], was utilized. This method operates on the principle that the excess area (A) formed during the folding of an anticline is conserved and can be quantified by comparing the original flat topographic surface with the folded terrace. By dividing this excess area by the depth of the detachment layer (Z), the horizontal crustal shortening (S) can be calculated (S = A/Z). Based on UAV-measured topographic profiles, the cross-sectional area of the studied fold was estimated at approximately 29,309.20 m2 at the center of the fold (Figure 3F). In the Barkol Basin, the Neogene sediments, consisting of siltstone and mudstone, are directly overlayed on the Paleozoic layers, with a maximum depth of ~1326 m [32]. Considering that mudstone and siltstone have low friction coefficients and are relatively susceptible to downward sliding, it is hypothesized that the detachment surface beneath the fold may be the base of the Cenozoic strata (Figure 3F). Accordingly, the total crustal shortening in the Barkol Basin was calculated to be approximately 22.1 m.
5. Discussion
5.1. Quaternary Surface Deformation Patterns around Harlik Mountain
Previous research proposed that Harlik Mountain functions as a restraining bend within the Gobi–Tian Shan left-lateral fault system. Existing studies, while valuable, have not fully captured the comprehensive deformation patterns in the eastern region of Harlik Mountain [38,39,44]. Our fieldwork, complemented by topographic analysis, has provided new insights into the deformation patterns in this eastern sector.
At the eastern end of the mountain, the principal GTF exhibits a more pronounced left-lateral horizontal displacement compared to its vertical offset. A previous study revealed that the fault crosscut a river terrace with a horizontal displacement of ~200 m (Figure S1), while the vertical movement was negligible [39]. This pattern suggests that crustal shortening in the eastern Tian Shan is predominantly accommodated by strike–slip faulting.
In contrast to the deformation patterns observed at the eastern end of Harlik Mountain, the Barkol Basin presents a different geological scenario. Here, an asymmetric fold characterized by a gentle, elongated slope on the southern side and a steeper slope on the northern side is evident (Figure 3). This morphological asymmetry correlates with the presence of a blind, north-directed thrust fault in the foreland region. Similar foreland fold-and-thrust belts have been extensively documented in both the northern and southern foreland basins of the western Tian Shan [7,9,10,29].
To the south of Harlik Mountain, the exposed area of granite in the foreland and the offset and titled alluvial fans indicate significant tectonic uplift. The granite rock does not show a clear fault plane, indicating that it is uplifted by a blind fault. The juxtaposition of ancient granite against younger Quaternary alluvial fans could be the result of either a north-dipping normal fault or a south-dipping thrust fault. However, given the regional context of north–south crustal shortening, the scenario involving a north-dipping normal fault cannot account for the uplift of the basin relative to the mountain belt. Therefore, it is more plausible that the uplift is driven by north-directed thrusting, which is similar to the Huoyanshan thrust [31] at the western part of the basin (Figure 1).
5.2. Slip and Shortening Rates around Harlik Mountain
Previous research, utilizing GPS velocity measurements, has indicated a general decrease in the overall shortening rate to around 0.3 mm/year near the eastern end of the Tian Shan [35]. However, due to the sparse distribution of GPS stations, there remain uncertainties concerning the precise constraints on deformation in the vicinity of Harlik Mountain. Several studies have employed 14C dating and cosmogenic nuclide exposure ages to estimate the Quaternary strike–slip and crustal shortening rates of the mountain–basin boundary faults [38,39,44]. Our research, incorporating new ESR dating and topographic measurements, offers an opportunity to enhance the understanding of slip and shortening rates in the foreland basins. It should be noted that ESR dating only provides the depositional age of the alluvial fan; therefore, the calculated shortening or slip rates represent minimum values.
In the Barkol Basin, crustal shortening is accommodated by folding related to thrusting. According to the area conservation method (Figure 3), the total crustal shortening in the Barkol Basin was calculated to be approximately 22.1 m. As ESR dating only yields the depositional age, the abandoned age of the topographic surface at ~164 ka could be a more reasonable age constraint for the initial time of the fault movement [38]. Therefore, the estimated shortening rate in the northern foreland of Harlik Mountain is approximately 0.14 mm/year. For the fault scarp in the basin, assuming a ~30° dip angle [39], the 14.12 m uplift corresponds to ~25 m horizontal shortening. Using the same age for the initial time along the fault, the crustal shortening rate would be ~0.15 mm/yr, similar to the value calculated for the fold. This rate is also consistent with the shortening rate of the same fault at the northern edge of Harlik Mountain in the west [39].
South of the mountain, the elevated granite intersects the alluvial fans, resulting in a maximum vertical offset of ~40 m. Field investigations could not determine the dip of the fault planes. Seismic profiles and trench studies reveal that the dip angle of active faults in other parts of the northern Turpan–Hami Basin is about 55° [31], so we assumed a similar angle for the faults at this location. Therefore, the estimated horizontal shortening along each branch fault was ~28.0 m. The topographic analysis and ESR dating suggested that the activity of the faults is no earlier than 328 ka. Therefore, the minimum shortening rate of a single fault is 0.09 mm/yr, and the total shortening rate of the region is 0.18 mm/yr. Ren [39] estimated the age of the oldest alluvial fan surface at the mountain front, about 6.5 km northwest of our study area, to be 199.8 ka. If these two branch faults became active after this time, then the total shortening rate of the faults would be about 0.28 mm/yr.
5.3. Quaternary Deformation of the Easternmost Tian Shan
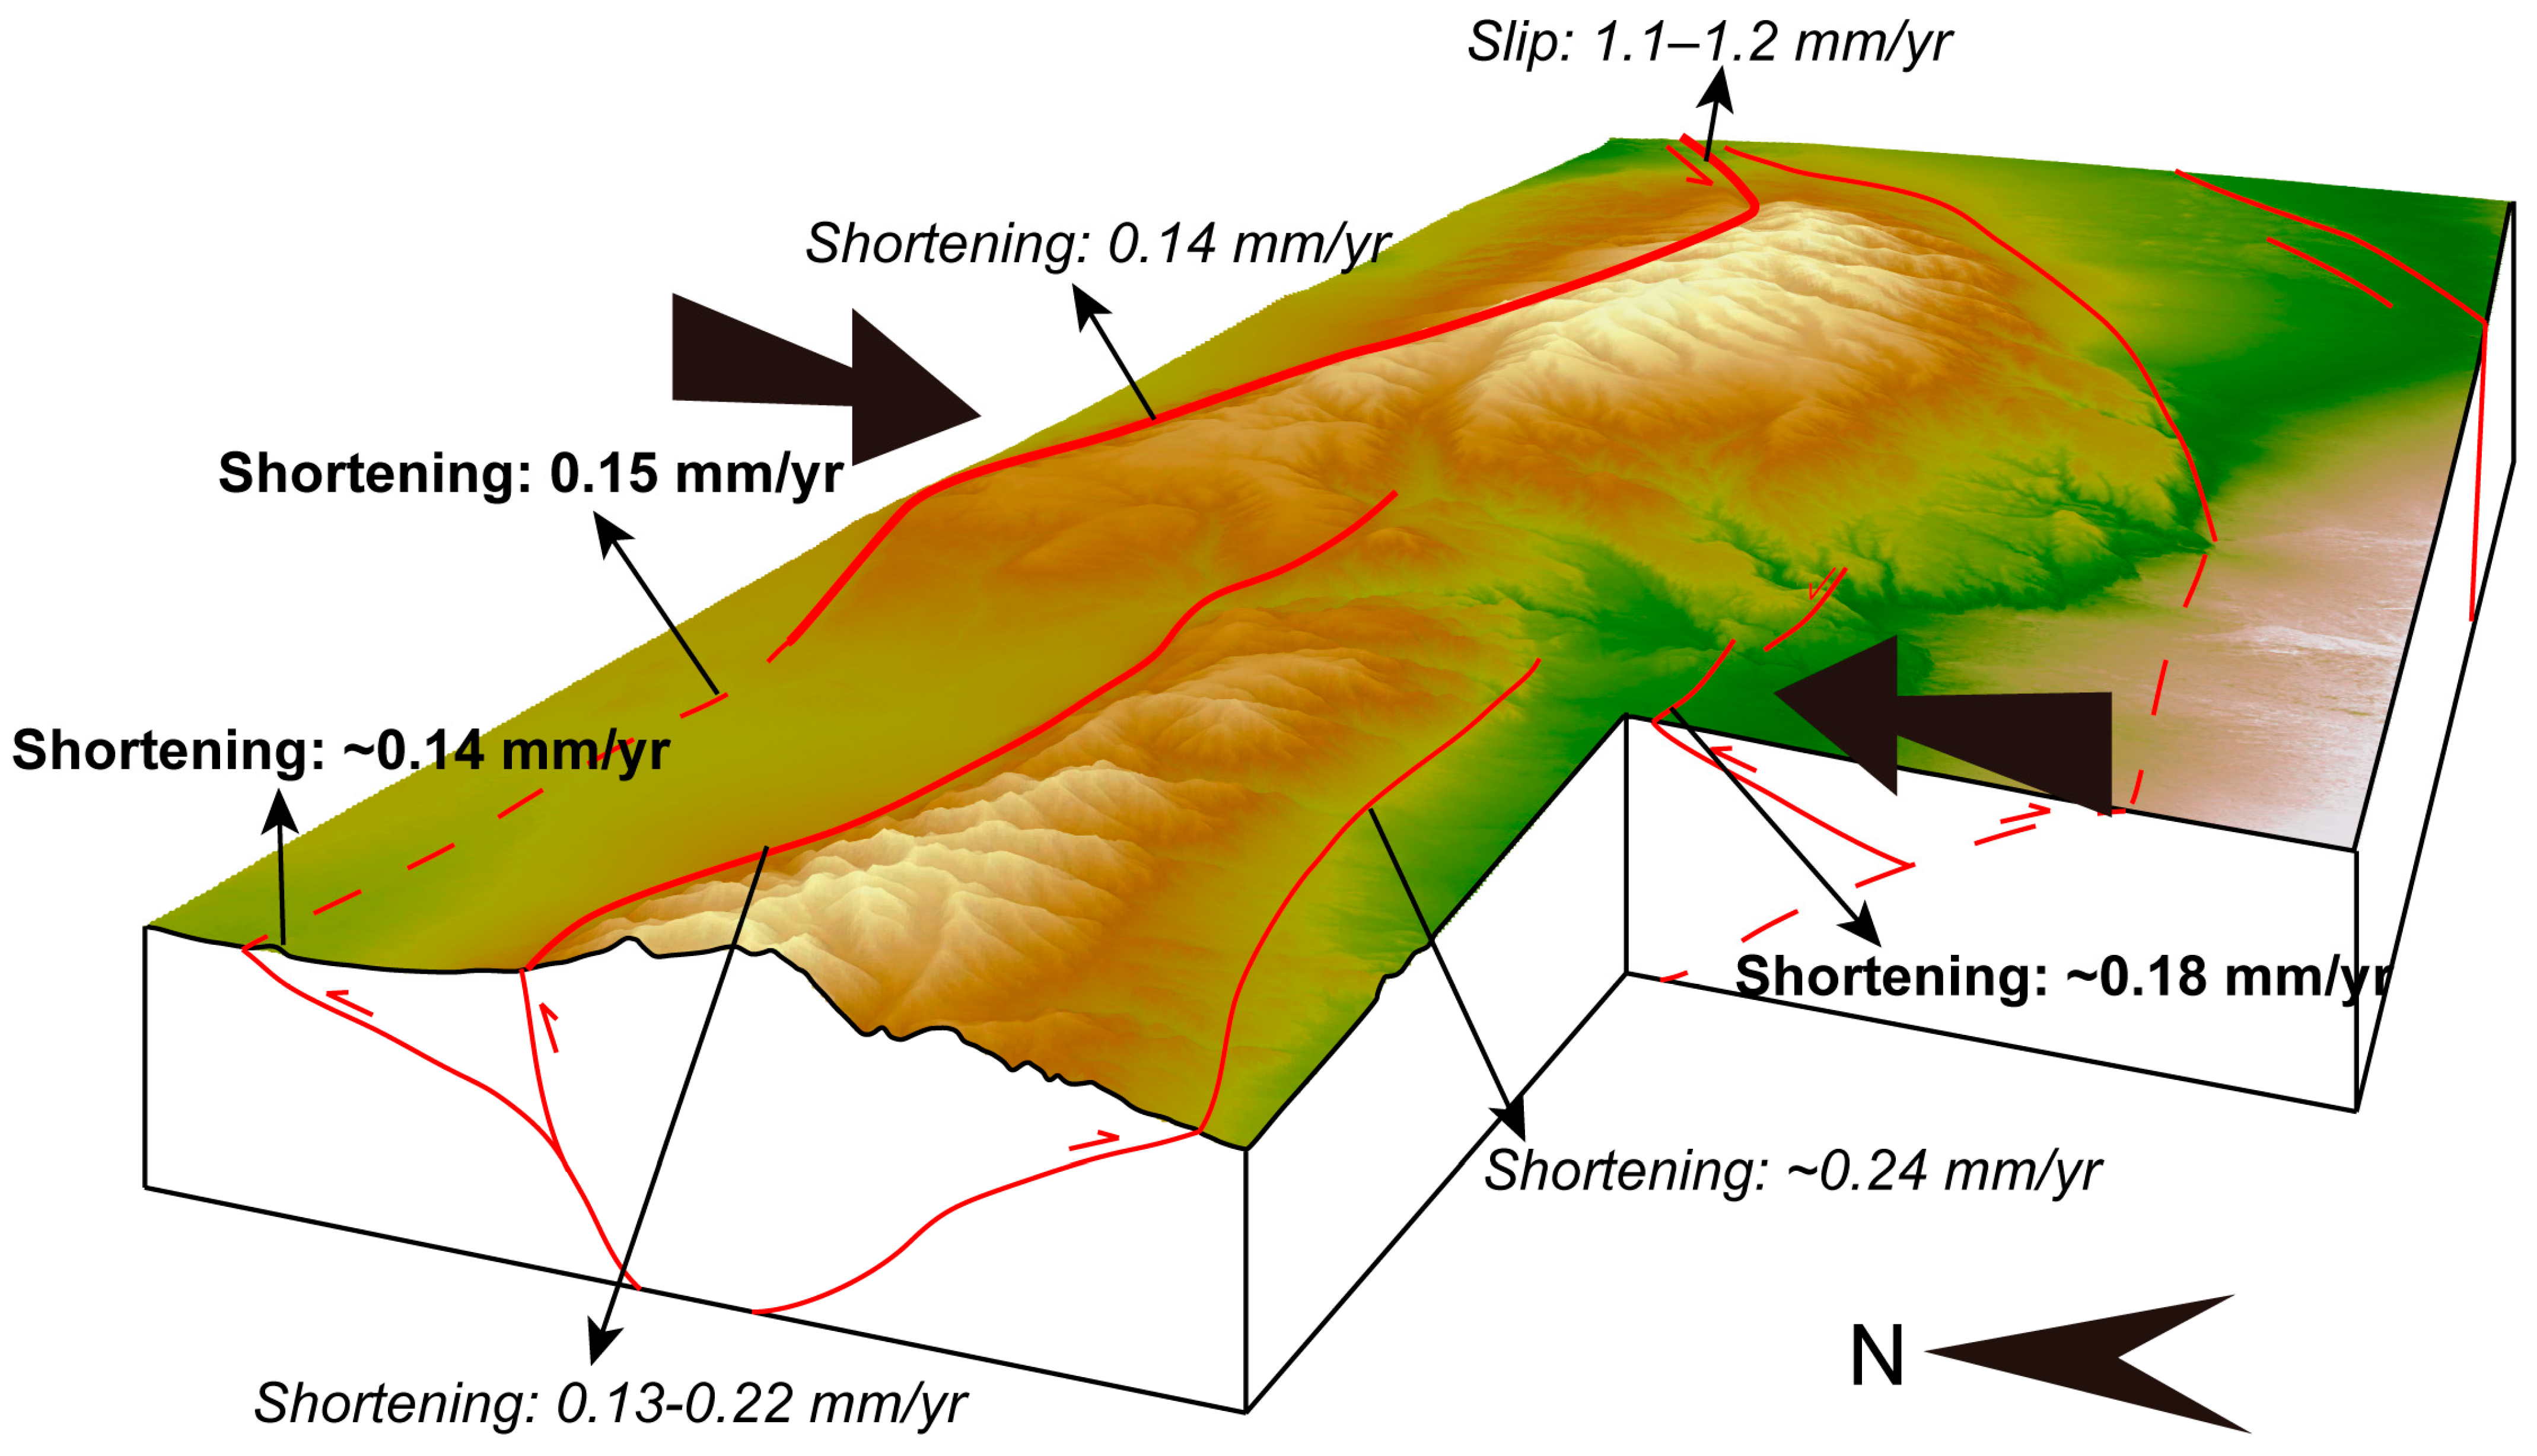
Consistent with the transpressional regime [14,33], our observations indicate active thrusting along northwest-striking faults on both flanks of Harlik Mountain. Concurrently, left-lateral strike–slip motion is prevalent on east- and northeast-striking faults of the GTF system at the eastern end of Harlik Mountain, with a measured strike–slip rate of 1.1–1.4 mm/yr [39]. However, when the faults turn to the northwest strike in the western part of Harlik Mountain, northeast–southwest shortening dominates the deformation. Previous studies revealed that the north–south shortening rates along the north and south boundaries of western Harlik Mountain are 0.13–0.22 and 0.24 mm/yr, respectively [44]. Our study indicates that the shortening rates in the Barkol Basin and Hami Basin are 0.14 and 0.18 mm/yr, respectively (Figure 6). Therefore, the total north–south shortening rate has exceeded 0.69 mm/year since the Late Pleistocene. Such data also suggest that the crustal shortening in the foreland basin on both sides of Harlik Mountain is nearly equal to the boundary faults of the basins and ranges (Figure 6).
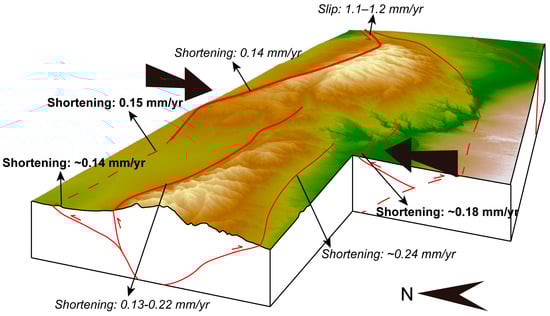
Figure 6.
Crustal deformation rates in the easternmost Tian Shan. This three-dimensional structural model integrates fault interpretations from our current field observations with data from previous research [39,44]. It displays the various rates of crustal shortening and horizontal slip identified in this study (indicated in regular font) alongside those from prior studies (shown in italics). The black arrows indicate the crustal shortening direction according to the GPS velocity.
Current GPS velocities at the eastern end of the Tian Shan indicate a crustal shortening rate of approximately 6.6 mm/yr south of Harlik Mountain and 5.14 mm/yr to the north [16,40]. More specifically, between the southern and northern parts of Harlik Mountain, the northward component of the GPS velocity field decreased by about 0.7 mm/yr, while the eastward component decreased by 0.7–1.3 mm/yr (Figure 2). These changes should be accommodated by the shortening and strike–slip motion of the faults around Harlik Mountain. In detail, at the eastern end of the mountain, the left-lateral strike-slip rate of 1.1–1.4 mm/yr corresponds well to the eastward component’s decrease in GPS velocity. In the western part, the ~0.69 mm/yr north–south shortening rate corresponds well to the 0.7 mm/yr GPS velocity decrease along the north–south direction. Therefore, the overall shortening and strike–slip rates we obtained are basically consistent with the above values, indicating that the current surface deformation in the Harlik Mountain area is concentrated at the edges of the mountain range and within the basins on both sides. Such a deformation pattern confirms that Harlik Mountain is a restraining bend of the GTF [14], which forms as positive flower structures at the north and south Harlik Mountain areas (Figure 6).
Left-lateral strike–slip faulting remains a significant deformation feature in the Tian Shan region [1,2]. In the western Tian Shan, various faults exhibit left-lateral slip rates, including the Maidan Fault (1.4 mm/year), the Nalati Fault (1.7 mm/yr), and the Zhaosu Fault (1.9 mm/yr) [15,54]. In the central Tian Shan, active river channels show left-lateral displacement at a rate of approximately 1.3 mm/year [24]. The Jianquanzi–Luobaoquan Fault, located in the western part of the eastern Tian Shan, demonstrates a prominent left-lateral strike–slip motion of about 1.2 mm/yr [44]. The slip rate of up to 1.2 mm/year along the GTF at the eastern end is comparable to rates in the western segment, suggesting uniform left-lateral strike–slip rates across the entire Tian Shan belt. This uniformity results from a common geodynamic mechanism associated with the oblique underthrusting or clockwise rotation of the Tarim Basin [18,23,28,55,56].
In contrast to the relatively consistent pattern of left-lateral strike–slip faulting, the north–south crustal shortening in the Tian Shan exhibits a significant decrease from west to east [15]. The foreland fold-and-thrust fault zone in the western Tian Shan accounts for a substantial shortening deformation of approximately 6.5 mm/year [57]. However, as one moves toward the eastern regions, this shortening rate notably diminishes to less than 1 mm/year. A previous study suggested that this gradient in shortening rates can be attributed to the varying proximity of the Indian continental plate across the Tian Shan, with closer proximity in the west resulting in higher northward strain rates [15]. It could also explain why the western Tian Shan experienced rapid rock exhumation during the Cenozoic [58,59], while the easternmost Tian Shan was relatively stable during this period [41,60,61,62].
Previous studies suggest that the oblique underthrusting of the Tarim Basin has caused a reactivation of the Tian Shan and that tectonic deformation is most likely to occur along preexisting fault zones [18,63]. In the western Tian Shan, three inherited structures, including the Maidan Fault, Nikolave Line, and Kemin–Chilik Fault, exhibited both reverse and sinistral strike–slip movements during the Cenozoic [54]. In the easternmost Tian Shan, the GTF was active during the Late Permian to Triassic and reactive during the Late Cenozoic [14]. Therefore, the oblique convergence between the Tarim Basin and the Tian Shan could also trigger the rejuvenation of the GTF, as well as other left-lateral strike–slip faults to the east and south of the Tian Shan, such as the Ruoqiang–Xingxingxia Fault and Kuruk Tagh Fault [18,64]. The sinistral faults in basement rocks and their surrounding thrust faults can be viewed as positive flower structures, which ultimately contribute to range growth and crustal shortening [54]. Consequently, foreland fold-and-thrust deformation, a result of north–south shortening, predominantly occurs at the conjugate position of parallel northeast left-lateral strike–slip faults. As Harlik Mountain is strategically located between the left-lateral Jianquanzi–Luobaoquan Fault to the west and the GTF to the east (Figure 1), the crustal shortening is primarily due to the compressive stress exerted between these two faults, mainly in the Barkol and Hami Basins and along their boundaries.
6. Conclusions
Harlik Mountain, situated at the easternmost Tian Shan, acts as a restraining bend between the left-lateral strike–slip faults of the Jianquanzi–Luobaoquan Fault and the Gobi–Tian Shan Fault.
In-depth interpretations of large-scale topographic profiles, field observations, and high-resolution remote sensing images disclose robust sinistral movement at the eastern end of the Tian Shan and the presence of a fold-and-thrust belt in the north and south foreland of Harlik Mountain. Through precise measurements of deformed geomorphic surfaces using dGPS and UAVs, along with geochronological dating using the ESR method, we calculate that there is approximately 0.69 mm/yr of north–south crustal shortening across Harlik Mountain. Together with previous studies, the results show that the Late Quaternary deformation of the easternmost Tian Shan has developed into the foreland basins. This is similar to the current deformation pattern in the western Tian Shan; however, the crustal shortening rate is significantly slower to the east. On the other hand, the left-lateral slip rate along the GTF at the eastern end of the Tian Shan is comparable to that in the western part, suggesting uniformity in the sinistral strike–slip faults across the Tian Shan. This uniformity results from the same geodynamic mechanisms, with the oblique convergence between the Tarim Basin and the Tian Shan being the primary driving force. This process drives the rejuvenation of pre-existing strike–slip faults, and crustal shortening primarily occurs at the conjugate position of parallel northeast left-lateral strike–slip faults.
Supplementary Materials
The following supporting information can be downloaded at https://www.mdpi.com/article/10.3390/rs16173343/s1.
Author Contributions
Conceptualization, T.S. and G.W.; methodology, T.S.; software, T.S. and Y.D.; validation, T.S., Y.D., G.W. and Z.Z.; formal analysis, T.S., G.W. and D.Z.; investigation, T.S., Y.D., G.W., D.Z. and Z.Z.; writing—original draft preparation, T.S. and Y.D.; writing—review and editing, T.S., G.W. and D.Z.; visualization, Y.D. and T.S.; supervision, G.W.; funding acquisition, G.W. All authors have read and agreed to the published version of the manuscript.
Funding
This research was funded by National Natural Science Foundation of China, grant numbers 42172251 and 41972208.
Data Availability Statement
The original contributions presented in the study are included in the article/Supplementary Materials, further inquiries can be directed to the corresponding author.
Acknowledgments
We extend our gratitude to Jiang Wang of the China University of Geosciences (Wuhan) for his invaluable assistance in conducting UAV surveys and analyzing the resulting DEM data. We are also grateful to Rumeng Guo from the Chinese Academy of Sciences for his expertise and support in analyzing GPS velocity data. Gaofen-7 data for this study were provided by the High-resolution Remote Sensing Data Center, China Earthquake Administration. The authors thank the editor and three anonymous reviewers for their constructive comments, which enabled our manuscript to improve considerably.
Conflicts of Interest
The authors declare no conflicts of interest.
References
- Molnar, P.; Tapponnier, P. Cenozoic Tectonics of Asia: Effects of a Continental Collision. Science 1975, 189, 419–426. [Google Scholar] [CrossRef]
- Tapponnier, P.; Molnar, P. Active faulting and cenozoic tectonics of the Tien Shan, Mongolia, and Baykal Regions. J. Geophys. Res.-Solid Earth 1979, 84, 3425–3459. [Google Scholar] [CrossRef]
- Hendrix, M.S.; Dumitru, T.A.; Graham, S.A. Late Oligocene-early Miocene unroofing in the Chinese Tian Shan: An early effect of the India-Asia collision. Geology 1994, 22, 487–490. [Google Scholar] [CrossRef]
- Neil, E.A.; Houseman, G.A. Geodynamics of the Tarim Basin and the Tian Shan in central Asia. Tectonics 1997, 16, 571–584. [Google Scholar] [CrossRef]
- Cunningham, D. Active intracontinental transpressional mountain building in the Mongolian Altai: Defining a new class of orogen. Earth Planet. Sci. Lett. 2005, 240, 436–444. [Google Scholar] [CrossRef]
- Yin, A. Cenozoic tectonic evolution of Asia: A preliminary synthesis. Tectonophysics 2010, 488, 293–325. [Google Scholar] [CrossRef]
- Avouac, J.P.; Tapponnier, P.; Bai, M.; You, H.; Wang, G. Active thrusting and folding along the northern Tien-Sshan and late Cenozoic rotation of the Tarim relative to Dzungaria and Kazakhstan. J. Geophys. Res.-Solid Earth 1993, 98, 6755–6804. [Google Scholar] [CrossRef]
- Jolivet, M.; Dominguez, S.; Charreau, J.; Chen, Y.; Li, Y.; Wang, Q. Mesozoic and Cenozoic tectonic history of the central Chinese Tian Shan: Reactivated tectonic structures and active deformation. Tectonics 2010, 29, TC6019. [Google Scholar] [CrossRef]
- Lu, H.H.; Li, B.J.; Wu, D.Y.; Zhao, J.X.; Zheng, X.M.; Xiong, J.G.; Li, Y.L. Spatiotemporal patterns of the Late Quaternary deformation across the northern Chinese Tian Shan foreland. Earth-Sci. Rev. 2019, 194, 19–37. [Google Scholar] [CrossRef]
- Yin, A.; Nie, S.; Craig, P.; Harrison, T.M.; Ryerson, F.J.; Qian, X.L.; Yang, G. Late Cenozoic tectonic evolution of the southern Chinese Tian Shan. Tectonics 1998, 17, 1–27. [Google Scholar] [CrossRef]
- Burchfiel, B.C.; Brown, E.T.; Deng, Q.D.; Feng, X.Y.; Li, J.; Molnar, P.; Shi, J.B.; Wu, Z.M.; You, H.C. Crustal shortening on the margins of the Tien Shan, Xinjiang, China. Int. Geol. Rev. 1999, 41, 665–700. [Google Scholar] [CrossRef]
- Thompson, S.C.; Weldon, R.J.; Rubin, C.M.; Abdrakhmatov, K.; Molnar, P.; Berger, G.W. Late Quaternary slip rates across the central Tien Shan, Kyrgyzstan, central Asia. J. Geophys. Res.-Solid Earth 2002, 107, 2203. [Google Scholar] [CrossRef]
- Zhang, P.; Deng, Q.; Yang, X.; Peng, S.; Xu, X.; Feng, X.Y. Late Cenozoic tectonic deformation and mechanism along the Tianshan Mountain, northwestern China. Earthq. Res. China 1996, 12, 127–140. [Google Scholar]
- Cunningham, D.; Owen, L.A.; Snee, L.W.; Li, J.L. Structural framework of a major intracontinental orogenic termination zone: The easternmost Tien Shan, China. J. Geol. Soc. 2003, 160, 575–590. [Google Scholar] [CrossRef]
- Wu, C.Y.; Zhang, P.Z.; Zhang, Z.Q.; Zheng, W.J.; Xu, B.B.; Wang, W.T.; Yu, Z.Y.; Dai, X.Y.; Zhang, B.X.; Zang, K.Z. Slip partitioning and crustal deformation patterns in the Tianshan orogenic belt derived from GPS measurements and their tectonic implications. Earth-Sci. Rev. 2023, 238, 104362. [Google Scholar] [CrossRef]
- Zhao, Q.; Chen, Q.; van Dam, T.; She, Y.W.; Wu, W.W. The vertical velocity field of the Tibetan Plateau and its surrounding areas derived from GPS and surface mass loading models. Earth Planet. Sci. Lett. 2023, 609, 118107. [Google Scholar] [CrossRef]
- Rizza, M.; Abdrakhmatov, K.; Walker, R.; Braucher, R.; Guillou, V.; Carr, A.S.; Campbell, G.; McKenzie, D.; Jackson, J.; Aumaître, G.; et al. Rate of Slip from Multiple Quaternary Dating Methods and Paleoseismic Investigations along the Talas-Fergana Fault: Tectonic Implications for the Tien Shan Range. Tectonics 2019, 38, 2477–2505. [Google Scholar] [CrossRef]
- Laborde, A.; Barrier, L.; Simoes, M.; Li, H.; Coudroy, T.; van Der Woerd, J.; Tapponnier, P.J.E.-S.R. Cenozoic deformation of the Tarim Basin and surrounding ranges (Xinjiang, China): A regional overview. Earth-Sci. Rev. 2019, 197, 102891. [Google Scholar] [CrossRef]
- Li, F.; Cheng, X.; Chen, H.; Shi, X.; Li, Y.; Charreau, J.; Weldon, R. Cenozoic Shortening and Propagation in the Eastern Kuqa Fold-And-Thrust Belt, South Tian Shan, NW China. Tectonics 2023, 42, e2022TC007447. [Google Scholar] [CrossRef]
- Chen, J.; Burbank, D.W.; Scharer, K.M.; Sobel, E.; Yin, J.; Rubin, C.; Zhao, R. Magnetochronology of the Upper Cenozoic strata in the Southwestern Chinese Tian Shan: Rates of Pleistocene folding and thrusting. Earth Planet. Sci. Lett. 2002, 195, 113–130. [Google Scholar] [CrossRef]
- Chang, J.; Li, D.; Min, K.; Qiu, N.; Xiao, Y.; Wu, H.; Liu, N. Cenozoic deformation of the Kalpin fold-and-thrust belt, southern Chinese Tian Shan: New insights from low-T thermochronology and sandbox modeling. Tectonophysics 2019, 766, 416–432. [Google Scholar] [CrossRef]
- England, P.; Molnar, P. Rheology of the lithosphere beneath the central and western Tien Shan. J. Geophys. Res.-Solid Earth 2015, 120, 3803–3823. [Google Scholar] [CrossRef]
- Shen, Z.-K.; Wang, M.; Li, Y.; Jackson, D.D.; Yin, A.; Dong, D.; Fang, P. Crustal deformation along the Altyn Tagh fault system, western China, from GPS. J. Geophys. Res. Solid Earth 2001, 106, 30607–30621. [Google Scholar] [CrossRef]
- Wu, C.Y.; Ren, G.X.; Wang, S.Y.; Yang, X.; Chen, G.; Duan, L.; Zhang, Z.Q.; Zheng, W.J.; Li, C.Y.; Ren, Z.K.; et al. Late Quaternary active faulting on the inherited Baoertu basement fault within the eastern Tian Shan orogenic belt: Implications for regional tectonic deformation and slip partitioning, NW China. Geol. Soc. Am. Bull. 2022, 134, 2085–2096. [Google Scholar] [CrossRef]
- Zubovich, A.V.; Wang, X.Q.; Scherba, Y.G.; Schelochkov, G.G.; Reilinger, R.; Reigber, C.; Mosienko, O.I.; Molnar, P.; Michajljow, W.; Makarov, V.I.; et al. GPS velocity field for the Tien Shan and surrounding regions. Tectonics 2010, 29, 6014. [Google Scholar] [CrossRef]
- Calais, E.; Vergnolle, M.; San’kov, V.; Lukhnev, A.; Miroshnitchenko, A.; Amarjargal, S.; Déverchère, J. GPS measurements of crustal deformation in the Baikal-Mongolia area (1994–2002): Implications for current kinematics of Asia. J. Geophys. Res.-Solid Earth 2003, 108, 2501. [Google Scholar] [CrossRef]
- Delvaux, D.; Abdrakhmatov, K.E.; Lemzin, I.N.; Strom, A.L. Landslides and surface breaks of the 1911 8.2 Kemin earthquake, Kyrgyzstan. Russ. Geol. Geophys. 2001, 42, 1667–1677. [Google Scholar]
- Avouac, J.P.; Tapponnier, P. Kinematic Model of Active Deformation in Central-Asia. Geophys. Res. Lett. 1993, 20, 895–898. [Google Scholar] [CrossRef]
- Windley, B.F.; Allen, M.B.; Zhang, C.; Zhao, Z.Y.; Wang, G.R. Paleozoic Accretion and Cenozoic Redeformation of the Chinese Tien-Shan-Range, Central-Asia. Geology 1990, 18, 128–131. [Google Scholar] [CrossRef]
- Campbell, G.E.; Walker, R.T.; Abdrakhmatov, K.; Carolin, S.; Carr, A.S.; Elliott, J.R.; Jackson, J.; Mackenzie, D.; Rizza, M.; Rodes, A. Rapid Late Quaternary Slip, Repeated Prehistoric Earthquake Rupture, and Widespread Landsliding Associated With the Karakudzhur Thrust, Central Kyrgyz Tien Shan. Tectonics 2019, 38, 3740–3764. [Google Scholar] [CrossRef]
- Yang, X.; Li, Z.G.; Wang, W.T.; Zhang, P.Z.; Wu, C.Y.; Chen, G.; Duan, L.; Wu, X.C.; Liu, K. Quaternary Crustal Shortening of the Houyanshan Structure in the Eastern Chinese Tian Shan: Constrained from Geological and Geomorphological Analyses. Remote Sens. 2023, 15, 1603. [Google Scholar] [CrossRef]
- Chen, Y.; Wang, G.C.; Zhao, X.; Wang, Y.B.; Ji, J.L.; Cao, K.; Shen, T.Y.; Zhang, P.; Wang, A. Evolution of the Barkol Basin, eastern Tian Shan, and its geodynamic background. Int. J. Earth Sci. 2019, 108, 1253–1271. [Google Scholar] [CrossRef]
- Cunningham, W.D.; Windley, B.F.; Dorjnamjaa, D.; Badamgarov, J.; Saandar, M. Late Cenozoic transpression in southwestern Mongolia and the Gobi Altai-Tien Shan connection. Earth Planet. Sci. Lett. 1996, 140, 67–81. [Google Scholar] [CrossRef]
- Cunningham, D. Structural and topographic characteristics of restraining bend mountain ranges of the Altai, Gobi Altai and easternmost Tien Shan. Geol. Soc. Lond. Spec. Publ. 2007, 290, 219–237. [Google Scholar] [CrossRef]
- Zhang, P.-Z.; Wang, M.; Gan, W.-J. Slip rates along major active faults from GPS measurements and constraints on contemporary continental tectonics. Earth Sci. Front. 2003, 10, 81–92. [Google Scholar]
- Xiao, W.J.; Zhang, L.C.; Qin, K.Z.; Sun, S.; Li, J.L. Paleozoic accretionary and collisional tectonics of the Eastern Tianshan (China): Implications for the continental growth of Central Asia. Am. J. Sci. 2004, 304, 370–395. [Google Scholar] [CrossRef]
- Greene, T.J.; Carroll, A.R.; Wartes, M.; Graham, S.A.; Wooden, J.L. Integrated provenance analysis of a complex orogenic terrane: Mesozoic uplift of the Bogda Shan and inception of the Turpan-Hami Basin, NW China. J. Sediment. Res. 2005, 75, 251–267. [Google Scholar] [CrossRef]
- Xu, L.X. Response of Piedmont Landforms to Tectonic Activity and Climatic Transitions Since the Late Pleistocene. Ph.D. Thesis, Institute of Geology, China Earthquake Administration, Beijing, China, 2020. [Google Scholar]
- Ren, G.X. Late Quaternary Activity and Tectonic Transition of the Sinistral Slip Faults, Eastern Tian Shan. Ph.D. Thesis, Institute of Geology, China Earthquake Administration, Beijing, China, 2021. [Google Scholar]
- Wang, M.; Shen, Z.K. Present-Day Crustal Deformation of Continental China Derived From GPS and Its Tectonic Implications. J. Geophys. Res.-Solid Earth 2020, 125, e2019JB018774. [Google Scholar] [CrossRef]
- Chen, Y.; Wang, G.C.; Shen, T.Y.; Zhang, P.; Sotiriou, P.; Zhu, C.Y. Tectono-geomorphic evolution of Harlik Mountain in the Eastern Tian Shan, insight from thermochronological data and geomorphic analysis. Geol. J. 2020, 55, 7322–7334. [Google Scholar] [CrossRef]
- Pullen, A.; Kapp, P.; Chen, N. Development of stratigraphically controlled, eolian-modified unconsolidated gravel surfaces and yardang fields in the wind-eroded Hami Basin, northwestern China. Geol. Soc. Am. Bull. 2018, 130, 630–648. [Google Scholar] [CrossRef]
- Zhang, D.H.; Wang, G.C.; Pullen, A.; Abell, J.T.; Ji, J.L.; Shen, T.Y. Landscape evolution and development of eolian-modified unconsolidated gravel surfaces and yardangs in the Hami Basin, China. Geomorphology 2020, 368, 21. [Google Scholar] [CrossRef]
- Wu, F.Y.; Ran, Y.K.; Xu, L.X.; Cao, J.; Li, A. Paleoseismological Study of the Late Quaternary Slip-rate along the South Barkol Basin Fault and Its Tectonic Implications, Eastern Tian Shan, Xinjiang. Acta Geol. Sin.-Engl. Ed. 2017, 91, 429–442. [Google Scholar] [CrossRef]
- Abell, J.T.; Rahimi, S.R.; Pullen, A.; Lebo, Z.J.; Zhang, D.; Kapp, P.; Gloege, L.; Ridge, S.; Nie, J.; Winckler, G. A Quantitative Model-Based Assessment of Stony Desert Landscape Evolution in the Hami Basin, China: Implications for Plio-Pleistocene Dust Production in Eastern Asia. Geophys. Res. Lett. 2020, 47, e2020GL090064. [Google Scholar] [CrossRef]
- Xiao, X.; Wang, J.; Huang, J.; Ye, B. A new approach to study terrestrial yardang geomorphology based on high-resolution data acquired by unmanned aerial vehicles(UAVs): A showcase of whaleback yardangs in Qaidam Basin, NW China. Earth Planet. Phys. 2018, 2, 398–405. [Google Scholar] [CrossRef]
- Zhu, X.; Ren, Z.; Nie, S.; Bao, G.; Ha, G.; Bai, M.; Liang, P. DEM Generation from GF-7 Satellite Stereo Imagery Assisted by Space-Borne LiDAR and Its Application to Active Tectonics. Remote Sens. 2023, 15, 1480. [Google Scholar] [CrossRef]
- Beerten, K.; Pierreux, D.; Stesmans, A. Towards single grain ESR dating of sedimentary quartz: First results. Quat. Sci. Rev. 2003, 22, 1329–1334. [Google Scholar] [CrossRef]
- Beerten, K.; Stesmans, A. ESR dating of sedimentary quartz: Possibilities and limitations of the single-grain approach. Quat. Geochronol. 2007, 2, 373–380. [Google Scholar] [CrossRef]
- Moreno, D.; Richard, M.; Bahain, J.J.; Duval, M.; Falguères, C.; Tissoux, H.; Voinchet, P. Esr Dating of Sedimentary Quartz Grains: Some Basic Guidelines to Ensure Optimal Sampling Conditions. Quaternaire 2017, 28, 161–166. [Google Scholar] [CrossRef]
- Rink, W.J.; Bartoll, J.; Schwarcz, H.P.; Shane, P.; Bar-Yosef, O. Testing the reliability of ESR dating of optically exposed buried quartz sediments. Radiat. Meas. 2007, 42, 1618–1626. [Google Scholar] [CrossRef]
- Liu, C.R.; Yin, G.M.; Gao, L.; Bahain, J.J.; Li, J.P.; Lin, M.; Chen, S.M. ESR dating of Pleistocene archaeological localities of the Nihewan Basin, North China—Preliminary results. Quat. Geochronol. 2010, 5, 385–390. [Google Scholar] [CrossRef]
- Gibbs, A.D. Balanced Cross-Section Construction from Seismic Sections in Areas of Extensional Tectonics. J. Struct. Geol. 1983, 5, 153–160. [Google Scholar] [CrossRef]
- Wu, C.; Zheng, W.; Zhang, P.; Zhang, Z.; Jia, Q.; Yu, J.; Zhang, H.; Yao, Y.; Liu, J.; Han, G.; et al. Oblique Thrust of the Maidan Fault and Late Quaternary Tectonic Deformation in the Southwestern Tian Shan, Northwestern China. Tectonics 2019, 38, 2625–2645. [Google Scholar] [CrossRef]
- Webb, L.; Johnson, C.L. Tertiary strike-slip faulting in southeastern Mongolia and implications for Asian tectonics. Earth Planet. Sci. Lett. 2006, 241, 323–335. [Google Scholar] [CrossRef]
- Yao, Y.; Wen, S.Y.; Yang, L.; Wu, C.Y.; Sun, X.L.; Wang, L.L.; Zhang, Z.B. A Shallow and Left-Lateral Rupture Event of the 2021 Mw 5.3 Baicheng Earthquake: Implications for the Diffuse Deformation of Southern Tianshan. Earth Space Sci. 2022, 9, e2021EA001995. [Google Scholar] [CrossRef]
- Hubert-Ferrari, A.; Suppe, J.; Gonzalez-Mieres, R.; Wang, X. Mechanisms of active folding of the landscape (southern Tian Shan, China). J. Geophys. Res.-Solid Earth 2007, 112, B03s09. [Google Scholar] [CrossRef]
- Wang, Y.; Zhang, J.; Huang, X.; Wang, Z. Cenozoic exhumation of the Tianshan as constrained by regional low-temperature thermochronology. Earth-Sci. Rev. 2023, 237, 104325. [Google Scholar] [CrossRef]
- Jiang, Y.; Lu, H.; Yang, R.; Pang, L.; Jiao, R.; Wang, Y.; Pang, J.; Li, Y. Two-stage exhumation, uplift, and basinward propagation of the Tian Shan during the late Cenozoic. Earth-Sci. Rev. 2024, 256, 104868. [Google Scholar] [CrossRef]
- Gillespie, J.; Glorie, S.; Jepson, G.; Zhang, Z.Y.; Xiao, W.J.; Danisik, M.; Collins, A.S. Differential Exhumation and Crustal Tilting in the Easternmost Tianshan (Xinjiang, China), Revealed by Low-Temperature Thermochronology. Tectonics 2017, 36, 2142–2158. [Google Scholar] [CrossRef]
- Chen, Y.; Wang, G.C.; Kapp, P.; Shen, T.Y.; Zhang, P.; Zhu, C.Y.; Cao, K. Episodic exhumation and related tectonic controlling during Mesozoic in the Eastern Tian Shan, Xinjiang, northwestern China. Tectonophysics 2020, 796, 21. [Google Scholar] [CrossRef]
- He, Z.Y.; Wang, B.; Glorie, S.; Su, W.B.; Ni, X.H.; Jepson, G.; Liu, J.S.; Zhong, L.L.; Gillespie, J.; De Grave, J. Mesozoic building of the Eastern Tianshan and East Junggar (NW China) revealed by low-temperature thermochronology. Gondwana Res. 2022, 103, 37–53. [Google Scholar] [CrossRef]
- Webb, A.A.G.; Guo, H.; Clift, P.D.; Husson, L.; Mueller, T.; Costantino, D.; Yin, A.; Xu, Z.; Cao, H.; Wang, Q. The Himalaya in 3D: Slab dynamics controlled mountain building and monsoon intensification. Lithosphere 2017, 9, 637–651. [Google Scholar] [CrossRef]
- Tian, H.; Chen, H.; Cheng, X.; Wu, L.; Lin, X.; Gao, S.; Li, F.; Xu, X.; Yin, Q. Limited northward expansion of the Tibetan Plateau in the Late Cenozoic: Insights from the cherchen fault in the Southeastern Tarim Basin. Tectonics 2023, 42, e2022TC007694. [Google Scholar] [CrossRef]

Disclaimer/Publisher’s Note: The statements, opinions and data contained in all publications are solely those of the individual author(s) and contributor(s) and not of MDPI and/or the editor(s). MDPI and/or the editor(s) disclaim responsibility for any injury to people or property resulting from any ideas, methods, instructions or products referred to in the content. |
© 2024 by the authors. Licensee MDPI, Basel, Switzerland. This article is an open access article distributed under the terms and conditions of the Creative Commons Attribution (CC BY) license (https://creativecommons.org/licenses/by/4.0/).