Article

Contribution of Climatic Change and Human Activities to Vegetation Dynamics over Southwest China during 2000–2020

1
Key Lab of Land Resources Evaluation and Monitoring in Southwest China, Ministry of Education, Sichuan Normal University, Chengdu 610066, China
2
School of Geography and Resources Sciences, Sichuan Normal University, Chengdu 610066, China
3
CAS Key Laboratory of Ecosystem Network Observation and Modeling, Lhasa Plateau Ecosystem Research Station, Institute of Geographic Sciences and Natural Resources Research, Chinese Academy of Sciences, Beijing 100101, China
*
Author to whom correspondence should be addressed.
Remote Sens. 2024, 16(18), 3361; https://doi.org/10.3390/rs16183361
Submission received: 8 August 2024 / Revised: 6 September 2024 / Accepted: 9 September 2024 / Published: 10 September 2024

Abstract

:
Southwest China is an important carbon sink area in China. It is critical to track and assess how human activity (HA) and climate change (CC) affect plant alterations in order to create effective and sustainable vegetation restoration techniques. This study used MODIS NDVI data, vegetation type data, and meteorological data to examine the regional and temporal variations in the normalized difference vegetation index (NDVI) in Southwest China from 2000 to 2020. Using trend analysis, the study looks at the temporal and geographical variability in the NDVI. Partial correlation analysis was also used to assess the effects of precipitation, extreme climate indicators, and mean temperature on the dynamics of the vegetation. A new residual analysis technique was created to categorize the effects of CC and HA on NDVI changes while taking extreme climate into consideration. The findings showed that the NDVI in Southwest China grew at a rate of 0.02 per decade between 2000 and 2020. According to the annual NDVI, there was a regional rise in around 85.59% of the vegetative areas, with notable increases in 36.34% of these regions. Temperature had a major influence on the northern half of the research region, but precipitation and extreme climate had a notable effect on the southern half. The rates at which climatic variables and human activity contributed to changes in the NDVI were 0.0008/10a and 0.0034/10a, respectively. These rates accounted for 19.1% and 80.9% of the variances, respectively. The findings demonstrate that most areas displayed greater HA-induced NDVI increases, with the exception of the western Sichuan Plateau. This result suggests that when formulating vegetation restoration and conservation strategies, special attention should be paid to the impact of human activities on vegetation to ensure the sustainable development of ecosystems.

1. Introduction

Global ecosystems depend heavily on vegetation, which also helps to maintain climatic stability and regulate the global carbon balance [1,2,3]. Over the past 20 years, vegetation increases have led to multiple environmental consequences, such as increased evapotranspiration, reduced runoff, and changes in regional albedo and surface temperature [2,4,5,6]. The combined impacts of climate change (CC) and human activities (HA) lead to changes in vegetation [7]. Because of temperature rises and changes in precipitation, global warming has a substantial impact on the dynamics and patterns of vegetation [4,8]. Global warming is expected to reduce water supplies, increase evapotranspiration and temperature, and increase the frequency and intensity of extreme weather events [9]. But man-made elements, such the execution of ecological restoration initiatives, land management techniques, grazing, and urbanization, also have a big impact on vegetation [10]. Creating practical ecological restoration plans requires an understanding of the interactions among ecosystems, the atmosphere, and human society. Quantitative research on how CC and HA affect plant dynamics may help accomplish this.
The impacts of CC on vegetation have been one of the primary concerns in studies on global change [2,11]. Previous research has demonstrated that rising temperatures lengthen the growth season of vegetation, consequently improving its productivity [8,12]. Furthermore, extreme climate events affect vegetation by reducing primary production and plant cover, as shown by the significant decline in springtime net primary productivity (NPP) and NDVI that occurred during the extreme drought event of 2009 [13]. Thus, identifying the regional variability in climatic determinants’ influence on vegetation dynamics in Southwest China is vital for tackling future climate change.
Another important factor contributing to vegetation changes is human activity [14,15,16]. Ecosystems in China have suffered significant damage due to overgrazing and land reclamation [17]. In an effort to preserve and mend the ecosystem, the Chinese government initiated the Grain for Green Project on a national scale in 1999 [12]. However, as the people and economy expand, there is less room for vegetation to flourish, which is leading to a deterioration in the vegetation around urban areas [18]. Therefore, quantitative research on how human activity affects vegetation changes is crucial for Southwest China’s vegetation management.
Satellite observations provide significant data sources for analyzing vegetation dynamics [7,19,20]. The normalized difference vegetation index (NDVI) is extensively employed in long-term research as a proxy for plant biomass, indicating vegetation dynamics [21,22]. The most researched climatic elements impacting vegetation dynamics are temperature and precipitation due to their significance in photosynthesis, respiration, and plant development [23,24]. Furthermore, plant changes are significantly impacted by solar radiation, wind speed, and vapor pressure deficit [6,25,26]. However, most research measuring the proportional contributions of CC and HA to vegetation changes seldom incorporates extreme climatic indices [27]. Because of this, pinpointing the exact climate factors and learning how they impact plant dynamics are crucial to understanding the reasons for the changes in Southwest China’s vegetation.
Building successful vegetation restoration projects requires a scientific foundation, which is provided by identifying the functions of CC and HA in plant modifications. As China’s largest carbon sink, Southwest China is vital to maintaining both national ecological security and biodiversity. Thus, it is vital to examine vegetation dynamics and attribution in Southwest China. In this work, we employed NDVI data to describe vegetation dynamics. The study’s primary goals were to (1) examine the spatiotemporal patterns of the NDVI in Southwest China between 2000 and 2020; (2) examine any connections that may exist between the NDVI and other climatic factors in the same region between 2000 and 2020; and (3) determine the relative contributions of climatic factors and human activities to the variations in Southwest China’s NDVI between 2000 and 2020.

2. Materials and Methods
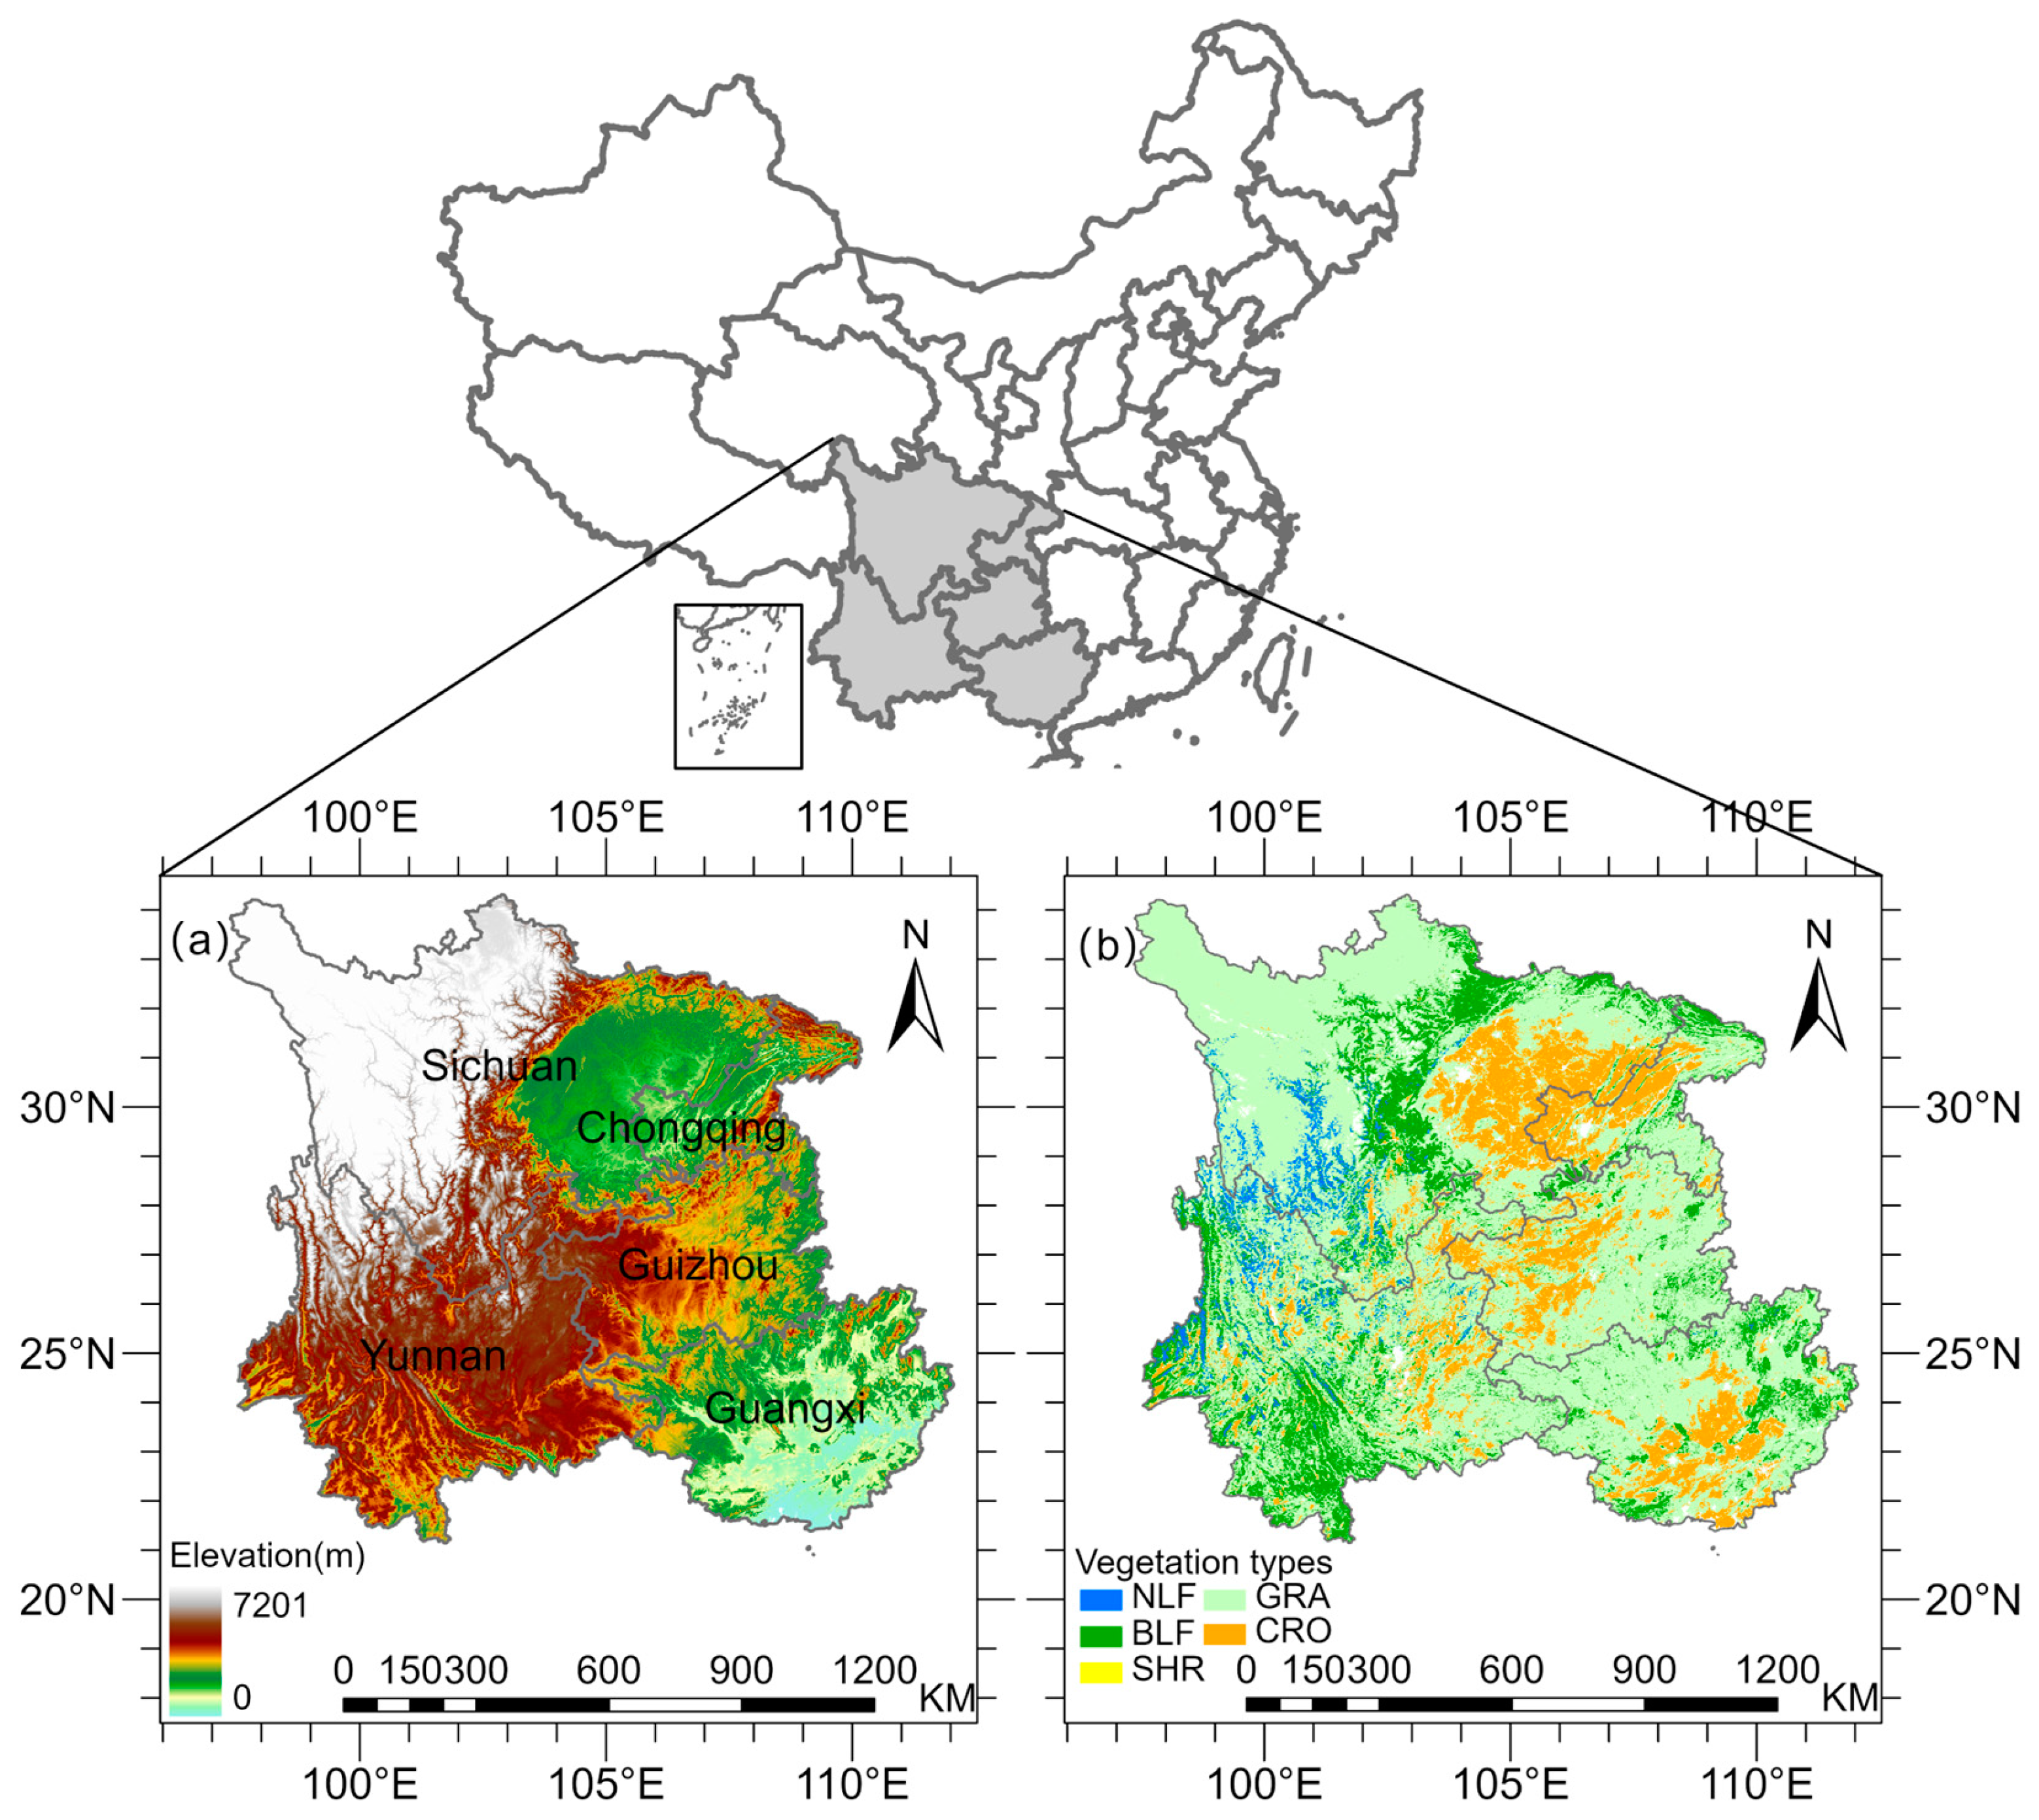
2.1. Study Area

Situated between 21°08′–34°19′N and 97°21′–112°04′E, Southwest China includes the provinces of Sichuan, Chongqing, Yunnan, Guizhou, and Guangxi. It covers an area of around 1.38 × 10⁶ km2, or 14.34% of China’s total land area. There are many different types of valleys and rivers across the landscape [28]. Broadleaf forest, needleleaf forest, grassland, shrubland, and farmland are the main forms of vegetation (Figure 1a). As one of the world’s major karst zones, Southwest China has a vulnerable natural environment [29]. From northwest to southeast, the elevation drops significantly. The Heng-duan Mountains above 3000 m, the Yunnan–Guizhou Plateau between 1000 and 3000 m, and the Sichuan Basin and Guangxi Basin below 1000 m are the three main geomorphological units (Figure 1b).

2.2. Data Sets

2.2.1. NDVI Data

Moderate-resolution Imaging Spectroradiometer (MODIS) NDVI data were collected from the Land Processes Distributed Active Archive Center (LP DAAC, https://ladsweb.modaps.eosdis.nasa.gov/, accessed on 5 February 2024) through the MOD13A2 vegetation index product, with a spatial resolution of 1000 m and a temporal resolution of 16 days [30]. This high-quality data set, preprocessed for radiometric calibration, geometric correction, and de-striping, has been widely used in studies at various scales. Throughout the growth season (April to October), monthly NDVI images were created using the maximum value composite technique, and the administrative boundaries of Southwest China were used to divide the NDVI data set from 2000 to 2020. In this study, NDVI data from April to October each year were used to analyze vegetation change at a monthly scale.

2.2.2. Meteorological Data

The National Tibetan Plateau Data Center provided meteorological data (https://data.tpdc.ac.cn/, accessed on 6 February 2024) using the CMFD1.7 meteorological data set [31]. Using Python 3.8 software, we processed, calculated, and spatially interpolated the data to obtain daily minimum and maximum temperatures as well as precipitation data for Southwest China from 2000 to 2020. The data collection has a geographic resolution of one kilometer.

2.2.3. Vegetation Cover Data

With a 500 m spatial resolution and a 1 year temporal resolution, vegetation-type data were collected from the MODIS MCD12Q1 remote sensing data collection (LP DAAC, https://ladsweb.modaps.eosdis.nasa.gov/, accessed on 8 February 2024) [32]. The pattern extraction method of the Google Earth Engine (GEE) was used to extract the annual vegetation type from 2000 to 2020; the pixel mode of the period was selected as the vegetation type of the pixel; and the vegetation type was divided into 5 categories: coniferous forest, broadleaf forest, shrub, grassland, and cropland. For ease of calculation and for the data to match the pixel sizes of other datasets, they are resampled to a resolution of one kilometer.

2.3. Methods

2.3.1. Theil–Sen Median Trend Analysis and Mann–Kendall (M-K) Test

By comparison, the Theil–Sen median is more resilient to anomalies and outliers than the least squares approach. To depict the trend, it computes the slope between each pair of data points and determines their median [33]. The following is the calculating formula:
β = median N D V I j N D V I i j i
where NDVIi and NDVIj are the normalized difference vegetation indices at periods i and j, respectively, and median is the median function. A trend that is upward is shown by a positive slope (β > 0), and downward by a negative slope (β < 0).
A non-parametric test that does not need the assumption of data distribution is the Mann–Kendall (MK) test [34] as well as the standardized statistic. The time series’ trend and significance were primarily tested using Z, and it is commonly accepted that if |Z| ≥ 1.96, the significance test is passed. The formula for the statistic S is as follows:
S = t t 1 i j = i + 1 t sign ( N D V I i N D V I j )
sign ( N D V I i N D V I j ) = 1 if   ( N D V I i N D V I j ) < 0 0 if   ( N D V I i N D V I j ) = 0 1 if   ( N D V I i N D V I j ) > 0
The variance of the S-statistic is as follows:
var ( S ) = t ( t 1 ) ( 2 t + 5 ) 18
The standard normal statistic Z, where n > 10, is as follows:
Z = S 1 var ( S ) if   S > 0 0 if   S = 0 S + 1 var ( S ) if   S < 0
The trend and significance of the NDVI at the picture element scale were evaluated in this study using the Mann–Kendall (M-K) test and Theil–Sen slope analysis. We used these methods to study the spatio-temporal distribution of vegetation change in Southwest China from 2000 to 2020.

2.3.2. Selection of Extreme Climate Indices

We computed 24 extreme climatic indices (11 based on precipitation and 13 based on temperature) using daily meteorological data for Southwest China with Python 3.8.6 [35]. Extreme climate indices were utilized to measure the influence of extreme climates on NDVI. We calculated the correlation coefficients (R) between the NDVI and a number of extreme climate indicators for each pixel. The index with the greatest correlation coefficient was selected as the ideal extreme climatic index for that pixel [36,37]. The calculating formula is as follows:
R final = R i ,   when   R i 2 = Maximum { R 0 2 , R 1 2 , , R 24 2 }

2.3.3. Partial Correlation Analysis

A multi-order partial correlation analysis was conducted between 2000 and 2020 to ascertain the link between the plant cover and climate of Southwest China [38,39]. Here is the formula for the partial correlation coefficient:
r 12 , 34 p 2 = R 1 ( 2 , 34 p ) 2 R 1 ( 34 p ) 2 1 R 1 ( 34 p ) 2
where r 12 , 34 p 2 is the partial correlation coefficient between variables 1 and 2; R 1 ( 2 , 34 p ) 2 is the coefficient of determination for the regression analysis of variable 1 and (2~p); and similarly, R 1 ( 34 p ) 2 is the coefficient of determination for the regression analysis of variable 1 and (3~p). The t-test was used to determine the significance of the partial correlation coefficient, with p < 0.05 being regarded as statistically significant.

2.3.4. Residual Analysis

The residual trend analysis (RESTREND) method, as developed by Evans and Geerken, was applied to evaluate the impacts of climate change and human activities on NDVI dynamics. This method allows for the separation of the effects of climate variability from human-induced changes by analyzing residuals between observed and predicted NDVI values [40]. The following are the calculation formulas: for each pixel, a multivariate linear regression model was first built using the NDVI as the dependent variable and the following variables as independents: mean temperature (T), cumulative precipitation (P), and extreme climatic indicators (E). The basic information of extreme climate indicators is shown in Table 1. NDVI predictions were produced when the regression parameters were established. The residuals between the anticipated and observed NDVIs were then computed:
N D V I C C = a × T + b × P + c × E + d
N D V I H A = N D V I O B S N D V I C C
where NDVICC and NDVIOBS are the predicted and observed NDVI values, respectively; a, b, c, and d are model parameters; and NDVIHA is the residual NDVI.
In the study, the extreme climate index with the greatest correlation was selected as the calculation index of each pixel (Table 1).

2.3.5. The Driving Factors of NDVI Changes

By calculating the slopes of the linear trends of NDVICC, NDVIHA, and NDVIOBS, the corresponding (NDVICC) slope, (NDVIHA) slope, and (NDVIOBS) slope were obtained. Furthermore, Table 2 calculated the proportional contributions of human activity and climate change to the NDVI changes throughout the growth season and discriminated between the main drivers of the changes in the southwest region during the growing season [41].

3. Results

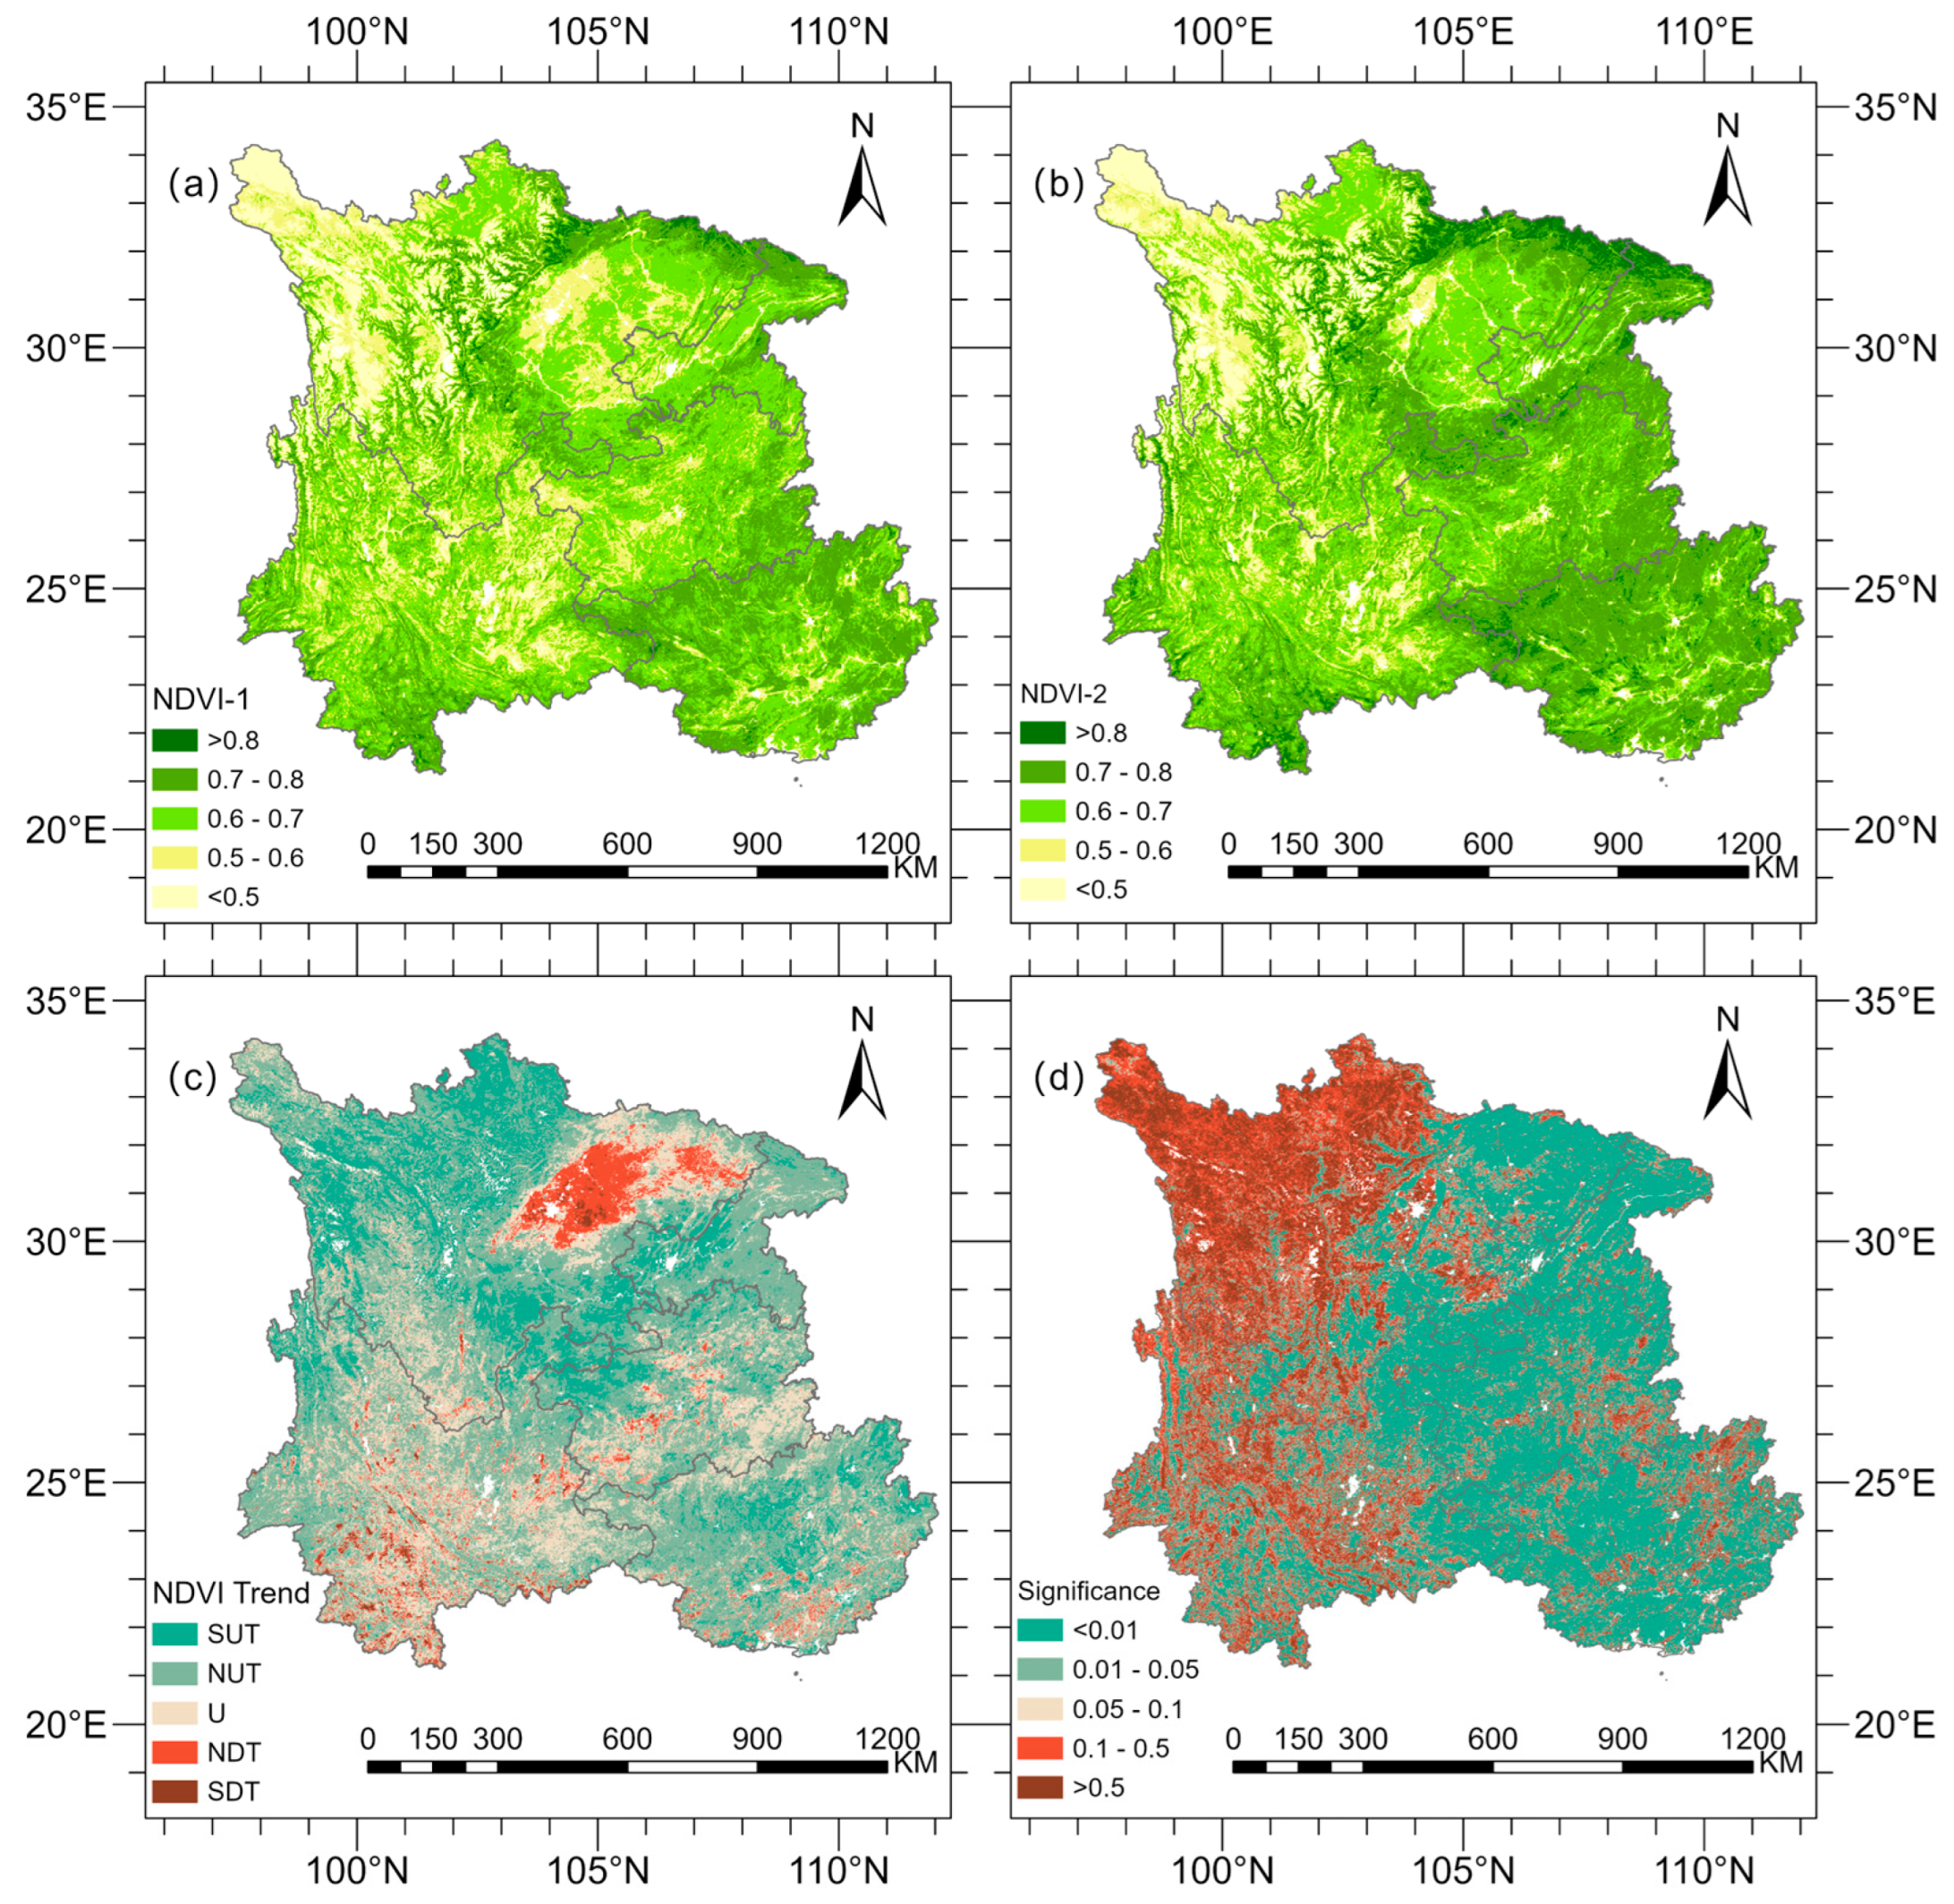
3.1. Spatiotemporal Characteristics of Vegetation Dynamics

In Southwest China, Figure 2 shows the geographical distribution of the multi-year average NDVI from 2000 to 2020. The southern Yunnan–Guizhou Plateau, the Sichuan Basin’s border, and the southwest section of the research region are all characterized by broadleaf forests and grasslands, and they all have high NDVI values. Due mostly to croplands and grasslands, the Sichuan Basin, the western Yunnan–Guizhou Plateau, the northern Heng-duan Mountains, and the southeast portion of the research region have low NDVI values (Figure 2a,b). To investigate the geographic variability of NDVI, linear slope calculations and M-K trend tests were carried out for all vegetation grids in Southwest China. As indicated in Figure 2c, around 68.14% of the vegetative regions in Southwest China demonstrated a positive NDVI trend. The fractions of vegetation area with significant increase, insignificant rise, no significant change, insignificant drop, and significant reduction were 17.33%, 50.81%, 25.07%, 5.97%, and 0.82%, respectively, demonstrating vegetation restoration in Southwest China. Overall, Southwest China has gotten greener than previously.

3.2. Relationship between Climate Factors and Vegetation Dynamics

The relationship between climatic factors (temperature, precipitation, and extreme climate) and NDVI for several plant species in Southwest China throughout the growing season was investigated using partial correlation analysis (Figure 3). Temperature and NDVI revealed a positive association in 86.50% of the research area, notably in the eastern region and western Sichuan Plateau, indicating that temperature supports an NDVI rise in these locations. Furthermore, significant positive partial correlation coefficients were found in the Sichuan Basin and western Sichuan Plateau, which together comprise 24.56% of the area. Certain results suggest that in certain areas, warmth significantly promotes plant development. Conversely, as shown in Figure 3a, negative partial correlation values were concentrated in the Yunnan highlands, showing an inhibitory influence of temperature on plant development in this location.
As demonstrated in Figure 3b, precipitation and NDVI exhibited a positive connection in 61.31% of the research region, largely dispersed in the western Sichuan Plateau, Sichuan Basin, and Yunnan mountains. The considerable positive connection between precipitation and NDVI in the low-altitude sections of the Yunnan mountains suggests that increasing precipitation encourages an NDVI rise in these areas, accounting for 4.74% of the research area. Conversely, the substantial negative connection between precipitation and NDVI implies that greater precipitation hinders NDVI growth, accounting for 0.09%. The eastern and southern boundaries of the study area are mostly where plant growth is impacted by precipitation.
In around 57.25% of the research region, extreme climate and NDVI showed a negative connection (Figure 3c), showing that increasing extreme climate events are detrimental to vegetation development in most sections of the study area. Additionally, a strong positive connection between NDVI and extreme climate was identified in select locations of the western Sichuan Plateau, accounting for 1.02% of the research area, showing that extreme climatic events encourage plant development in these highland areas. However, the negative correlation between NDVI and extreme climate seen in other research areas suggests that the occurrence of more extreme weather events limits the establishment of vegetation.

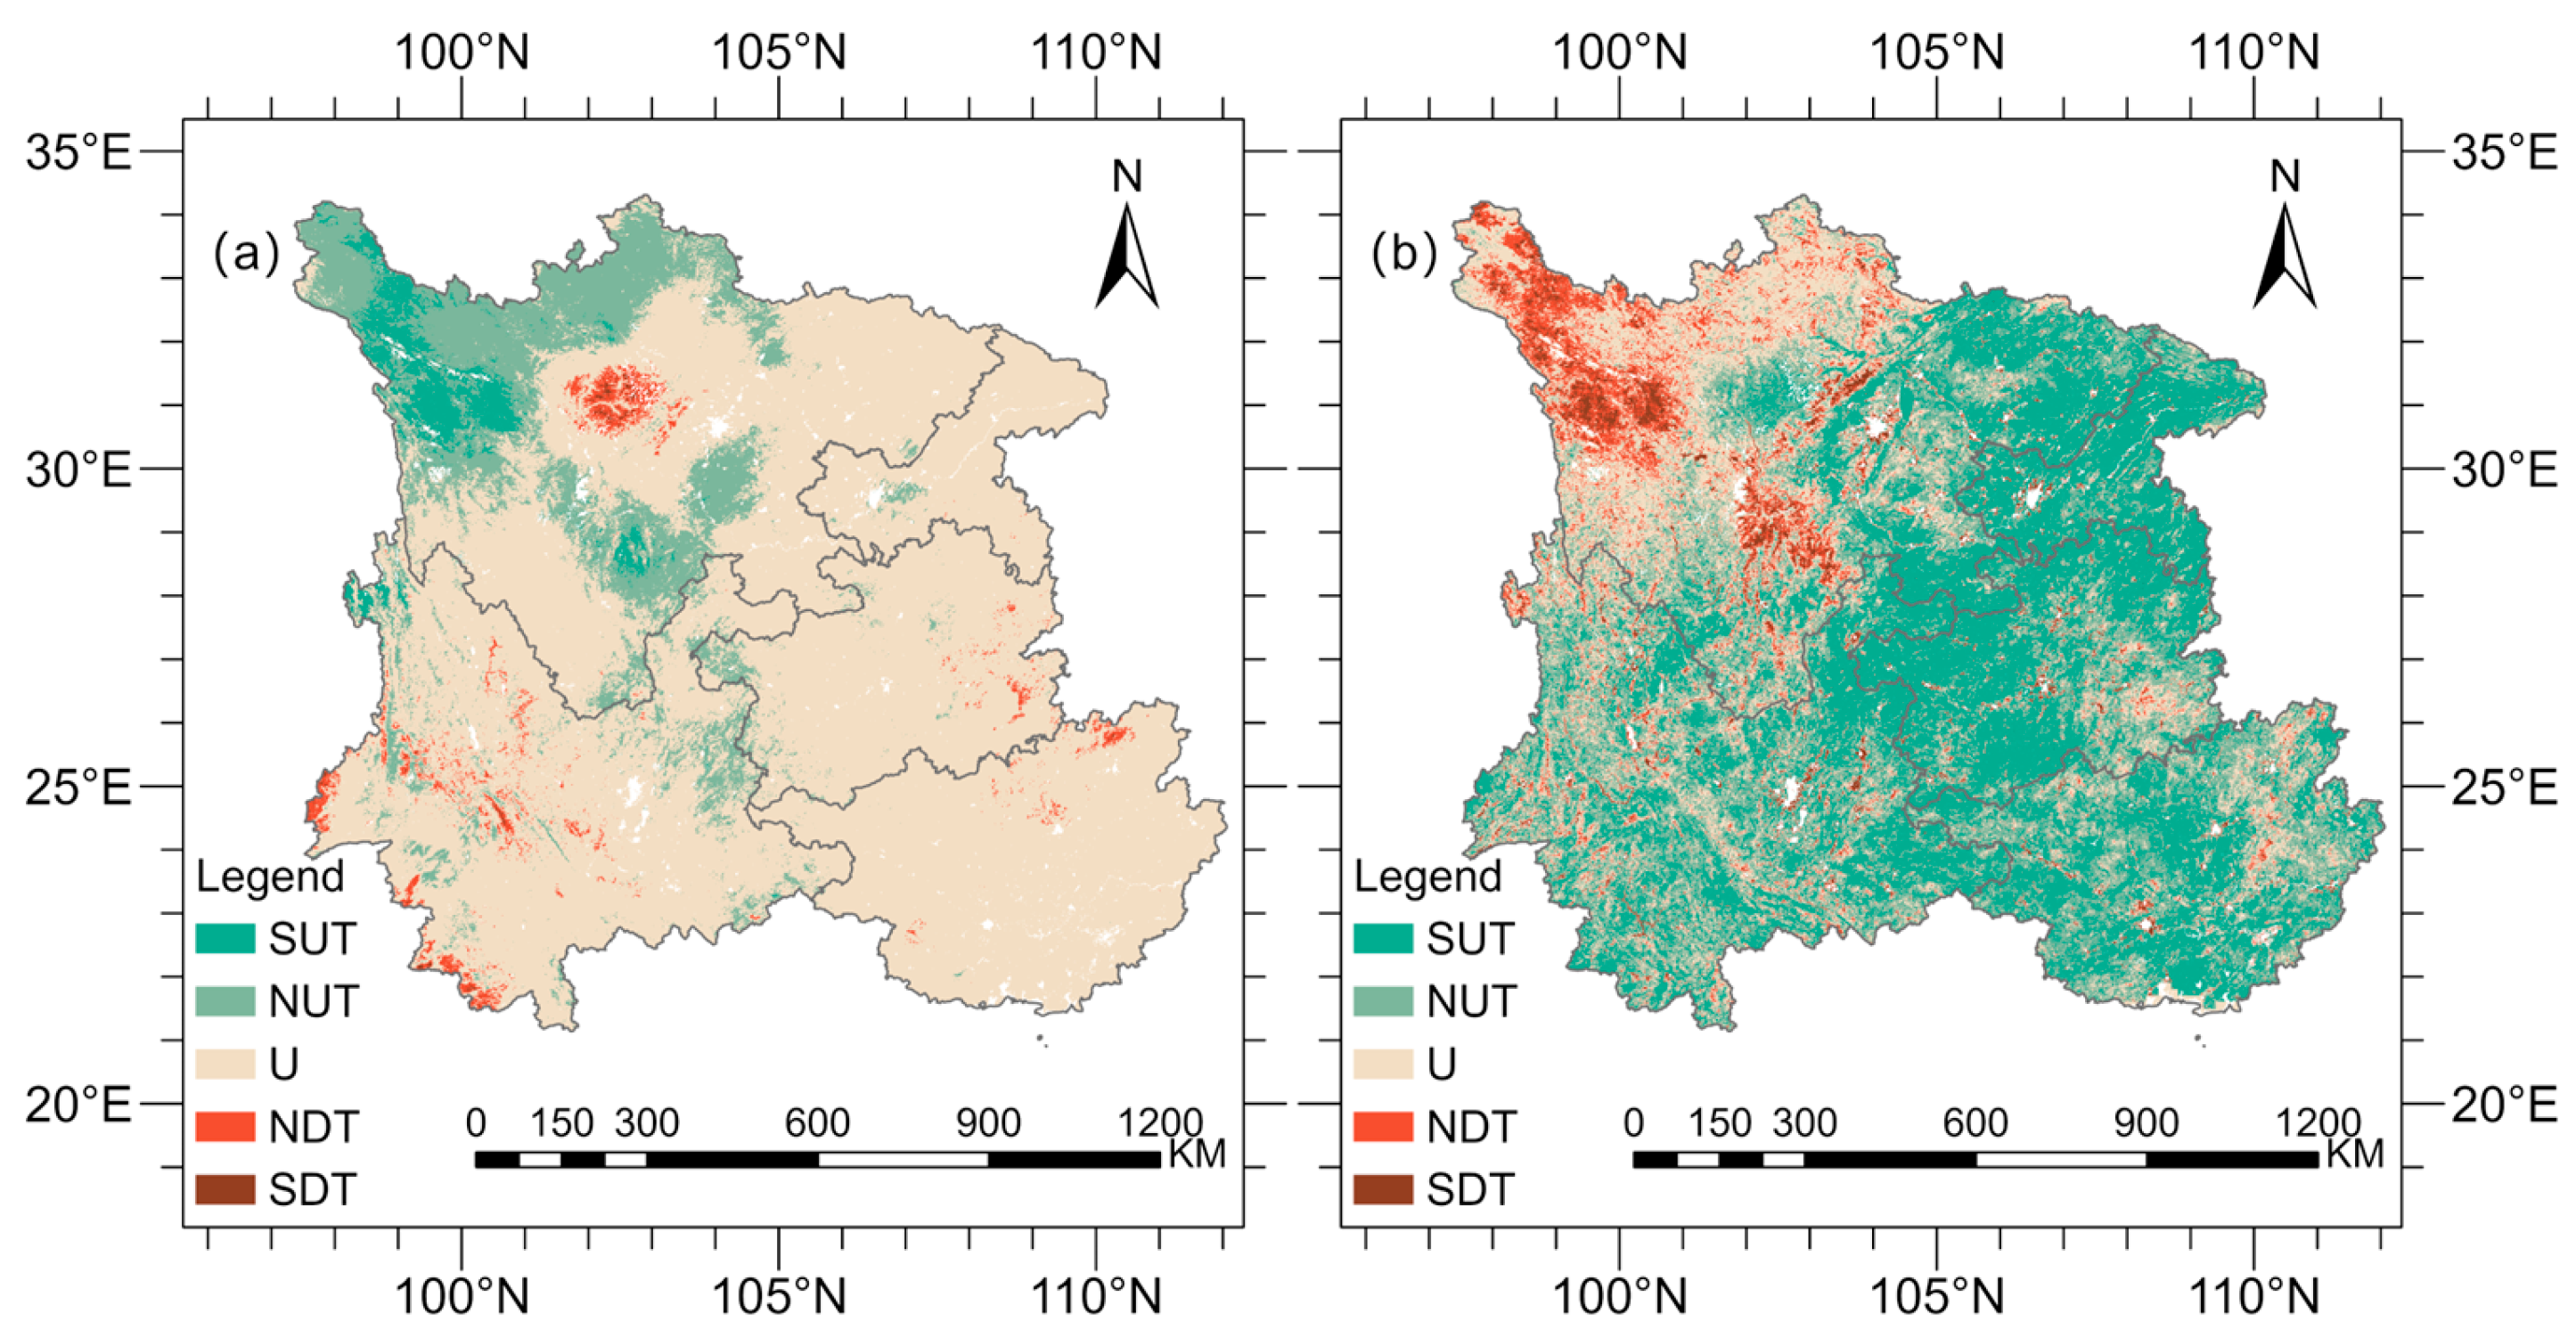
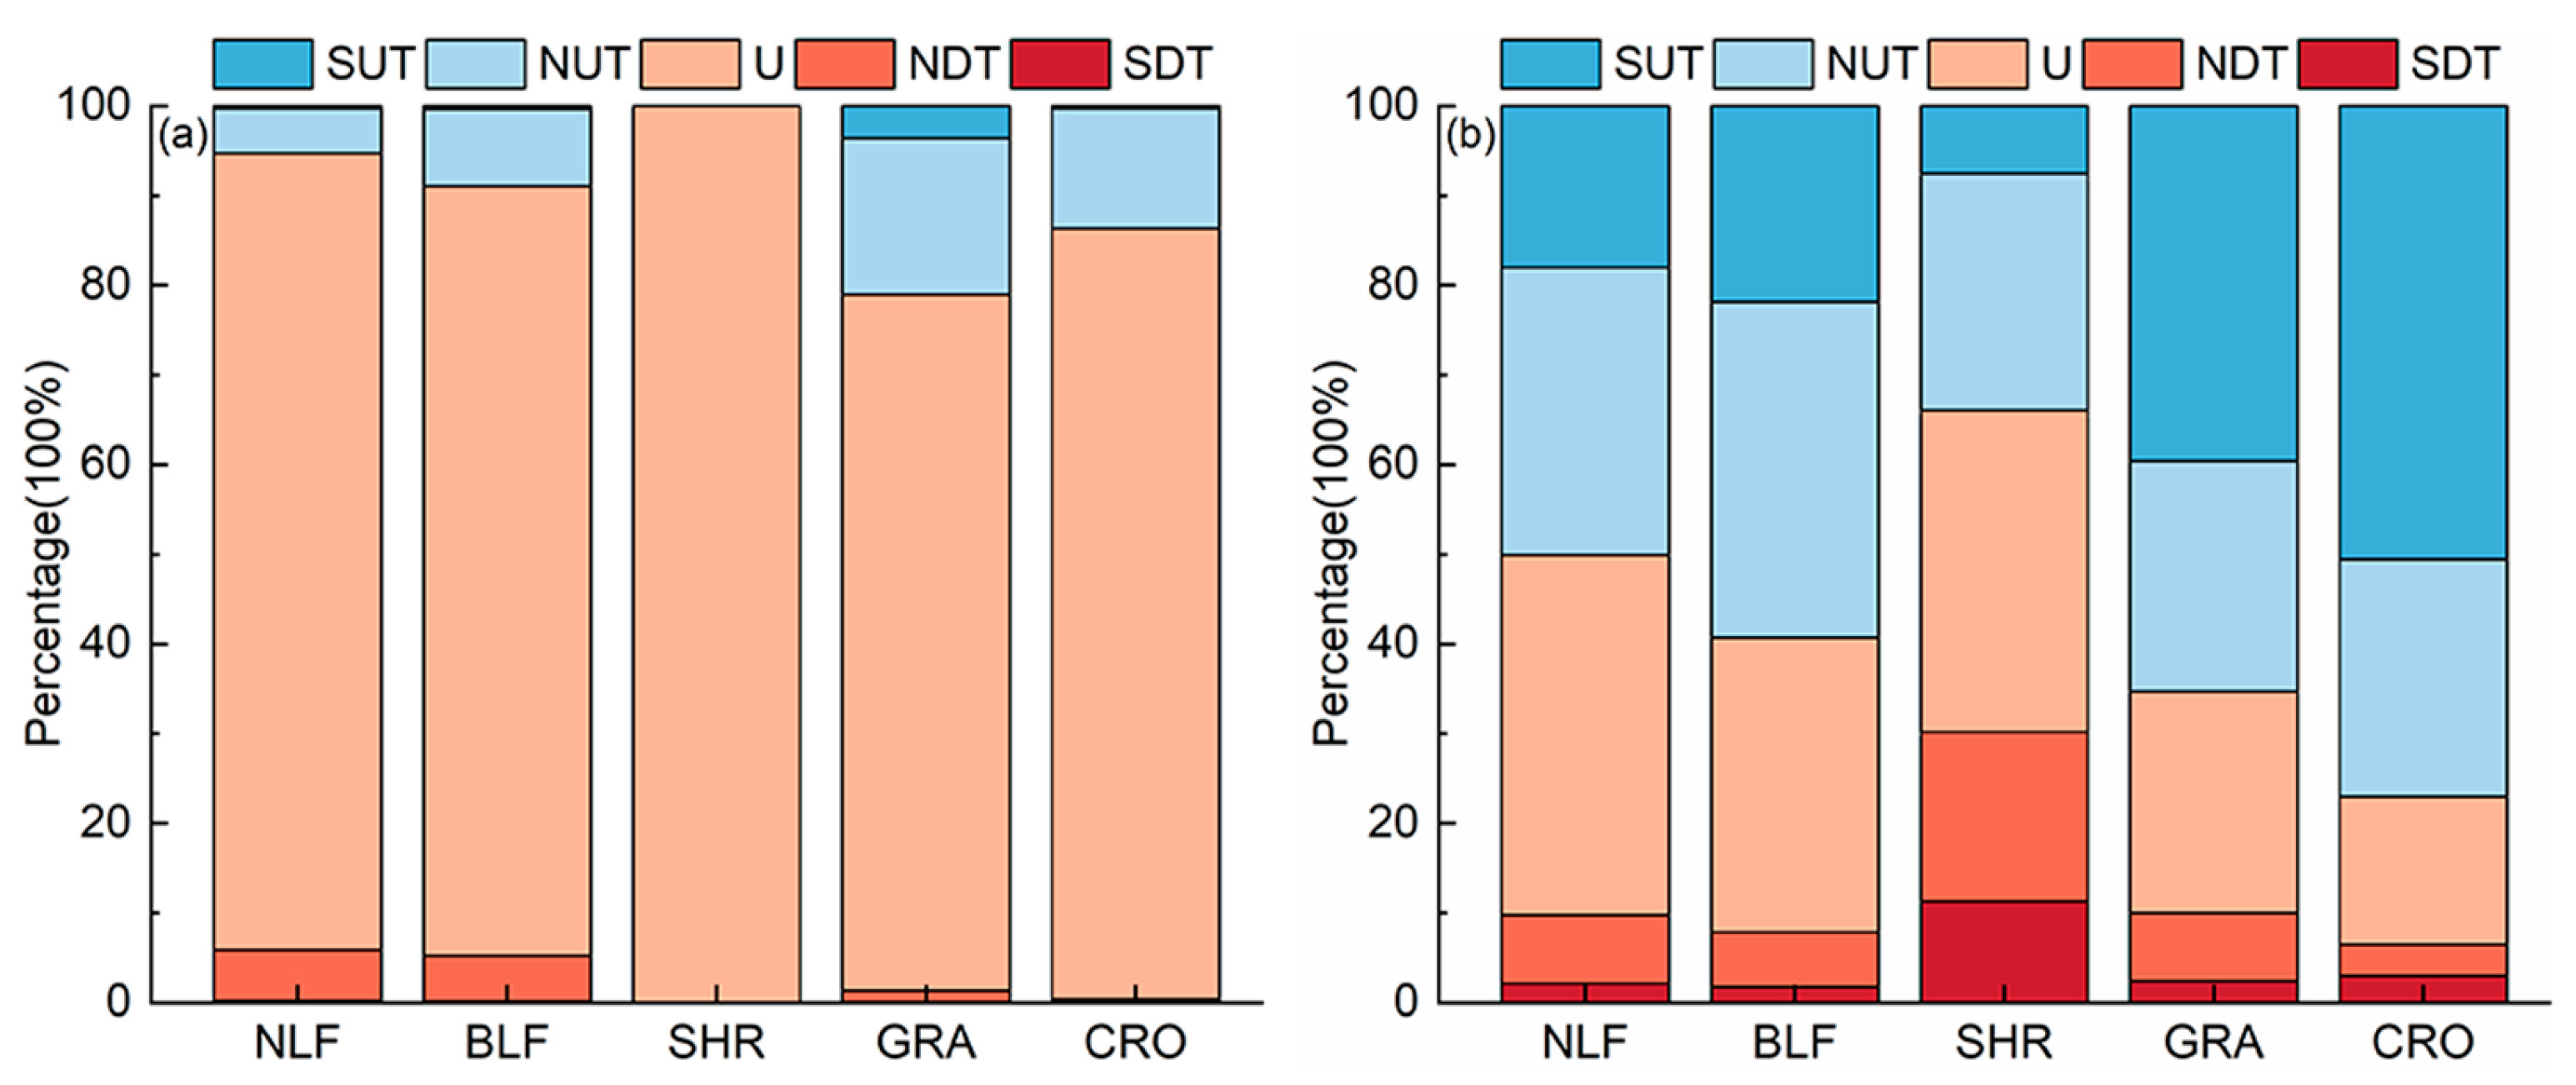
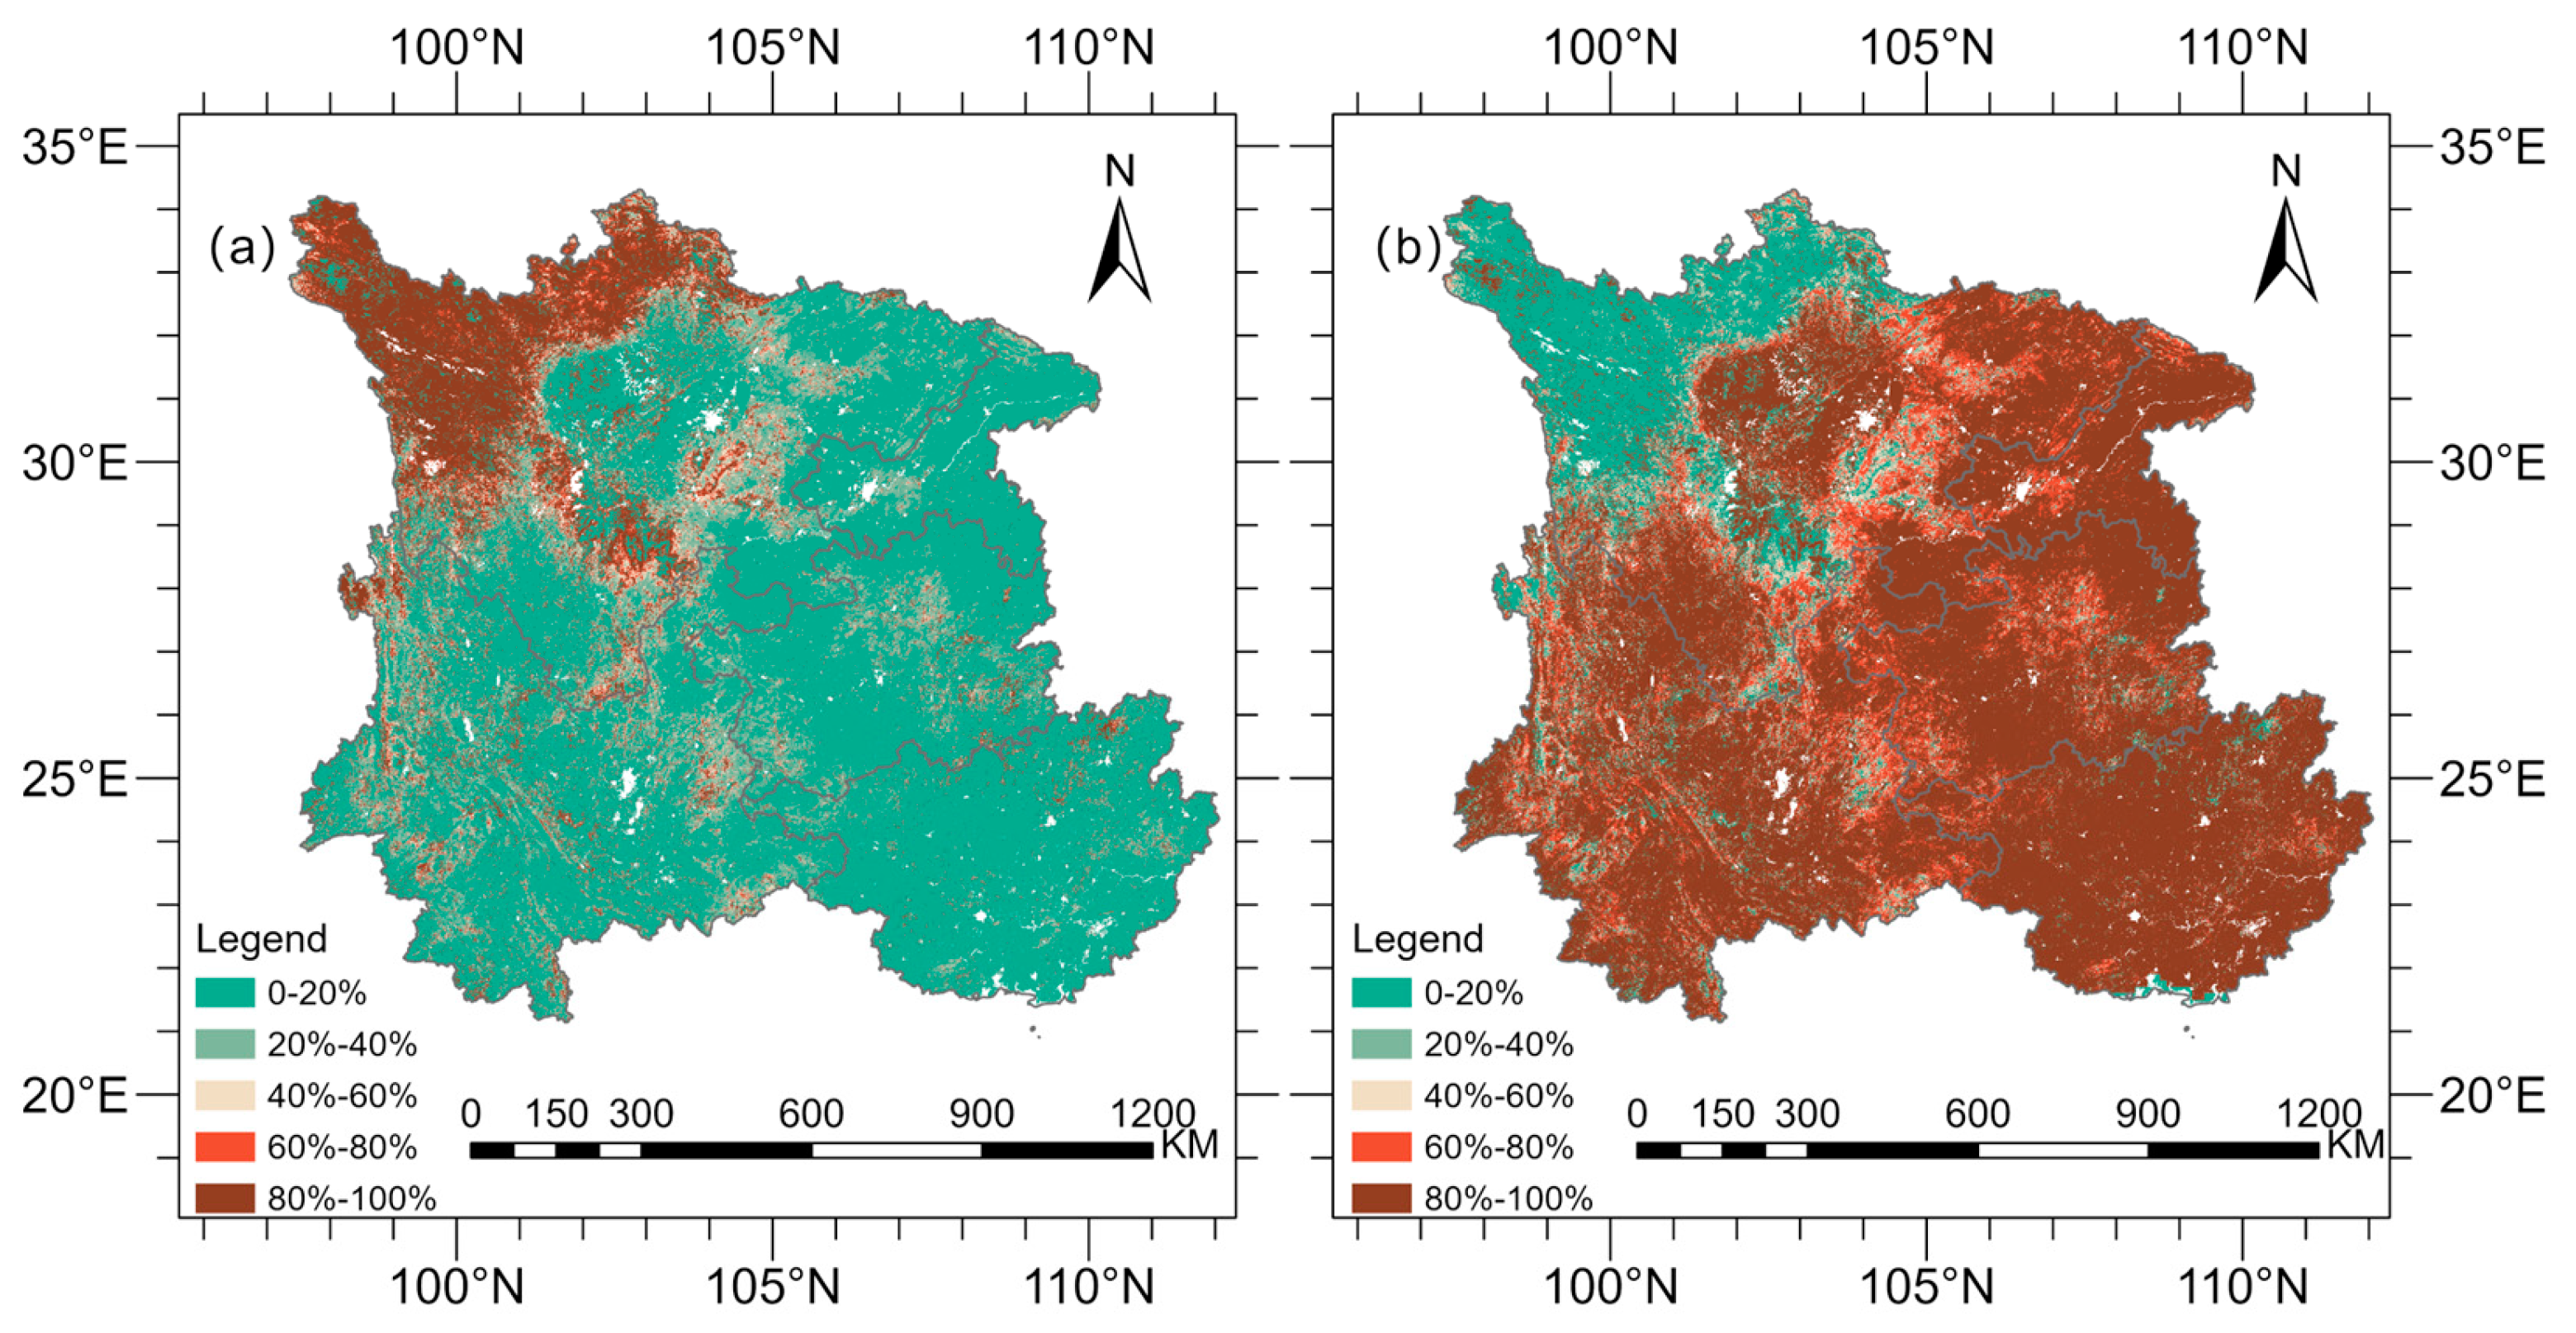
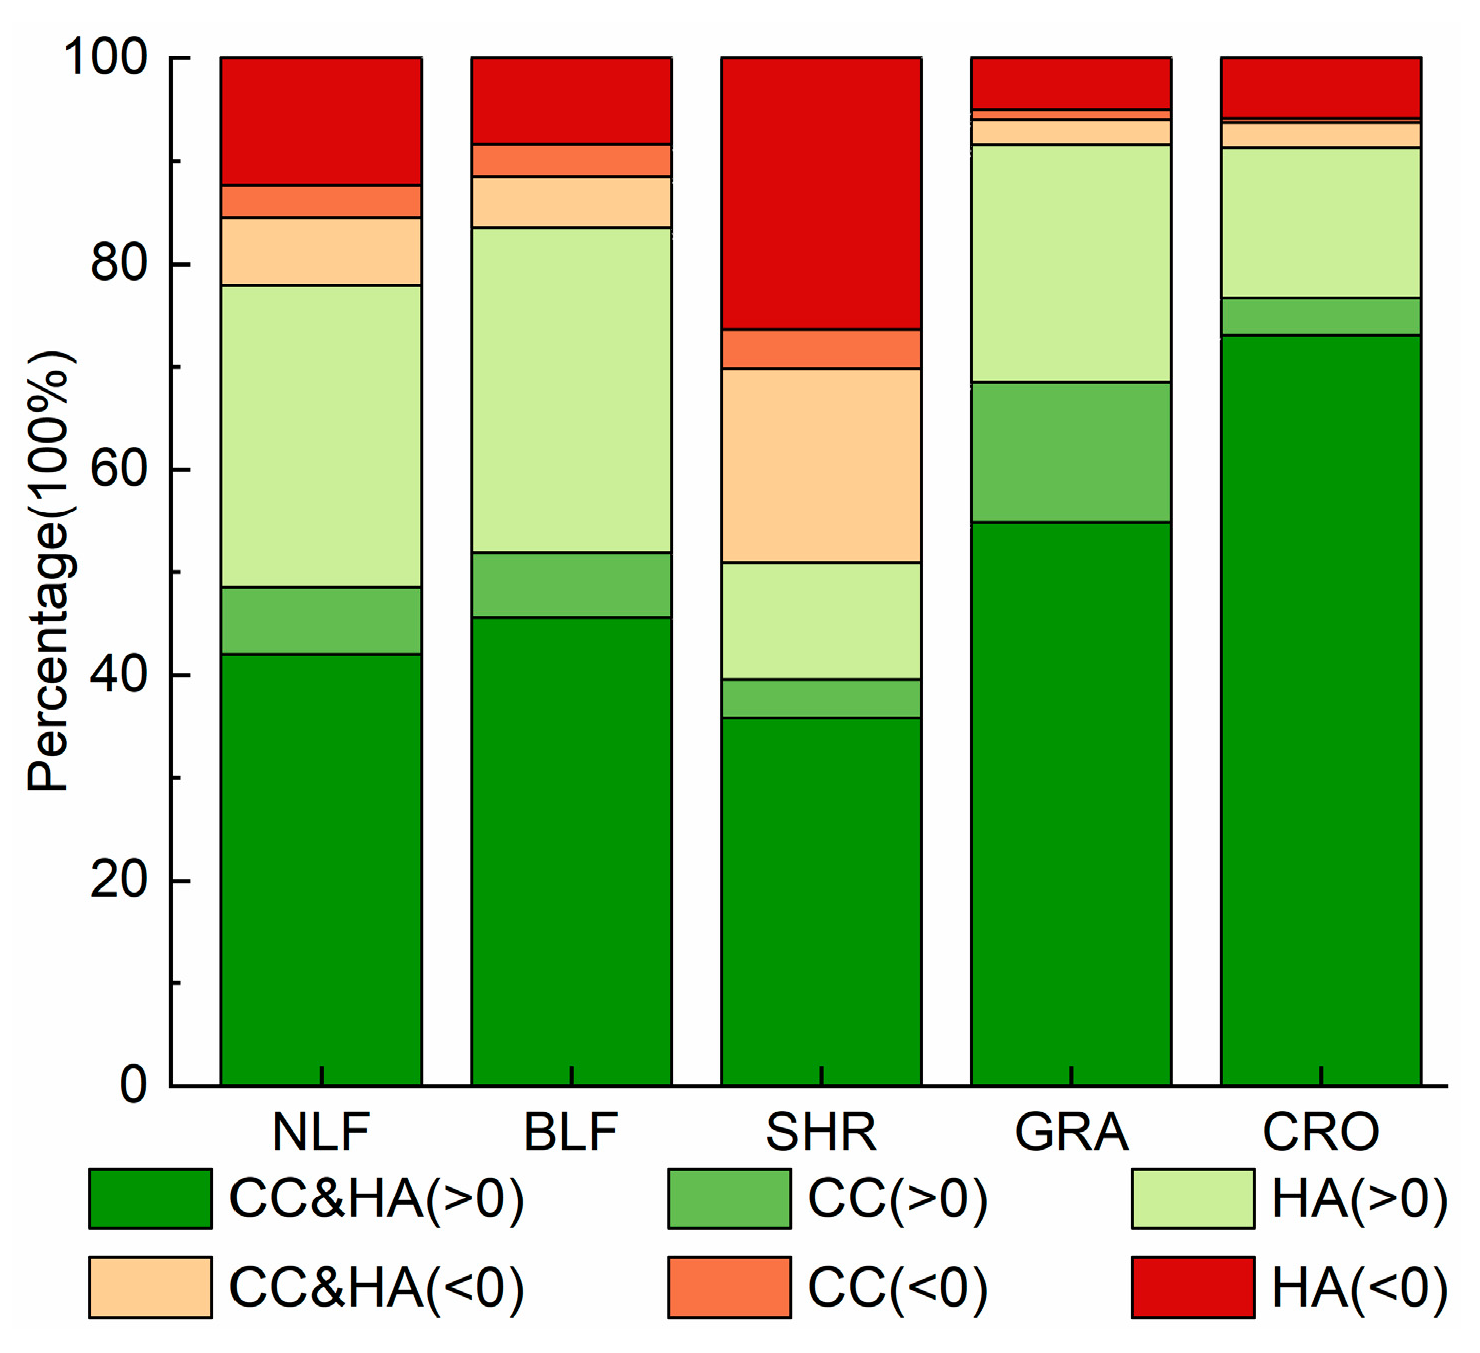
3.3. Contributions of CC and HA to Vegetation Dynamics

Using the residual trend analysis approach, the relative contributions of human activity and climate variables to NDVI fluctuations in Southwest China between 2000 and 2020 were evaluated (Figure 4). In Southwest China, plant growth has generally been promoted by human activities and climatic change.
Spatially, climatic variables contributed insignificantly to NDVI changes in most parts (80.29%) of the research area, but significantly favorably in the grasslands of the northern Sichuan Plateau and the evergreen broadleaf forests on the western side of the Sichuan Basin. Conversely, climatic variables had a large negative effect on NDVI changes in grasslands bordering urban areas on the western side of the Sichuan Basin (Figure 4a). In contrast, with a contribution rate of 0.0035/10a, HA positively contributed to NDVI changes throughout the majority of the studied region (90.23%). Areas where human activities contributed more than 0.002/10a accounted for 61.90%, while those contributing more than 0.005/10a accounted for 37.30%, particularly in the eastern croplands and grasslands (Figure 4b).
Based on data on the contributions of HA and CC to NDVI fluctuations under different plant types in the study area, climatic causes have little effect on Southwest China’s vegetation. The fraction of pixels where climatic variables positively contribute to grassland NDVI is rather large (Figure 5a). Human activities considerably affect NDVI changes under diverse plant types in Southwest China, with a greater proportion of pixels where human activities positively contribute to cropland and grassland NDVI.
According to Figure 6a, which shows the proportional contributions of CC and HA to changes in the NDVI of the vegetation in Southwest China, the region that accounts for 64.84% of the study area and has a climate change contribution rate of less than 20% is the largest. About 14.45% of the total is made up of the region where the contribution rate is more than 80%, and it is mostly located in the northern Sichuan Plateau. The greatest region in the research area is that where the rate of contribution from human activity is more than 80%, as shown in Figure 6b. This region is mostly found in the eastern and southern areas, making approximately 64.75% of the whole area.
The results of the spatial distribution of the driving factors of vegetation cover change in Southwest China showed that about 55.48% of the study area showed that the combined effect of climate change and human activities was the driving factor for the increase in NDVI in the growing season. The area of NDVI increase in the growing season caused by climate change alone accounted for about 10.78%, mainly distributed in the northwest of the western Sichuan Plateau. The area of the growing season NDVI increase caused by human activities alone accounted for about 23.29%, mainly distributed in the western side of the Guangxi Basin and the Sichuan Basin. Furthermore, around 3.05% of the study area, mostly on the western side of the Sichuan Basin, indicates that the drop in growing season NDVI is mostly caused by the combined effects of CC and HA. With a scattered distribution, the places where growing season NDVI decreased due to both CC and HA alone account for 1.27% and 6.12%, respectively (Figure 7). All things considered, the primary causes of the NDVI fluctuations in Southwest China between 2000 and 2020 are the combined impacts of CC and HA.
The statistical results of the driving factors of vegetation cover change in Southwest China for the different vegetation types showed that the combined effect of climate change and human activities in the study area accounted for the highest proportion of driving factors for the increase in NDVI in the growing season in all vegetation types, and the proportion of NDVI increase in agricultural land due to the combined effect of climate factors and human activities was the most obvious. In comparison to other plant species, there is a higher proportion of pixels in broadleaf and needleleaf forests where human activity alone increased the NDVI (Figure 8).

4. Discussion

4.1. Impact of Climate Change on Vegetation Dynamics

CC is a key element impacting vegetation dynamics [42]. Overall, many climatic conditions led to the development of NDVI in Southwest China from 2000 to 2020. However, the influence of climatic conditions on NDVI demonstrates geographical variation (Figure 3). In the western part of the study area, the vegetation changed significantly due to climate change. An analysis of the spatial distribution of climate variables’ impacts on Southwest China indicated that rising temperatures positively affect vegetation growth in high-altitude regions such as the western Sichuan Plateau by extending the growing season and increasing vegetation greenness and productivity [43]. Studies reveal that rising temperatures not only lengthen the growing season in high-altitude places, boosting vegetation growth in plateau climatic zones, but also improve plant production and greenness. Additionally, precipitation is a crucial component fostering plant development in low-altitude places, notably in the southern Heng-duan Mountains [44]. Adequate precipitation is necessary for vegetation development in low-altitude locations. However, harsh climatic conditions, especially extended low temperatures or extreme drought, have a deleterious influence on vegetation in Southwest China, reducing plant growth [45,46]. Luo et al. discovered that vegetation displayed a negative link with extreme climatic factors, with temperature having a detrimental influence on vegetation changes [47]. Moreover, climate change shows a higher proportion of pixels with an insignificant positive effect on grassland and cropland NDVI in Southwest China, indicating that climate warming promotes vegetation growth in these areas. The increasing temperature extended the growing season, and the increasing soil temperature was conducive to the slight growth of grassland and cropland [48]. Among different plant types, grasslands exhibit the largest proportion of pixels where climate change alone stimulates vegetation development, demonstrating that climate change strongly impacts the spatiotemporal variability of evapotranspiration in grasslands [49]. Figure 4a illustrates how climate change is trending in its contributions to vegetation changes in Southwest China, with notable positive contributions in the northwest plateau grasslands. This suggests that vegetation growth is primarily driven by CC in China’s sparsely inhabited regions [14]. Figure 5a indicates that climate change, including extreme climate, has an insignificant inhibitory effect on forests but a significant promoting effect on grasslands, possibly due to accelerated decomposition processes in grasslands, enhancing their productivity. In contrast, climatic change has a lesser influence on soil organic matter stability in forests, resulting in a more strong inhibitory effect [50]. Therefore, more studies on the combined consequences of diverse climatic conditions on regional vegetation are important to design appropriate ecological protection and restoration approaches.

4.2. Impact of Human Activities on Vegetation Dynamics

The findings show that between 2000 and 2020, HA—primarily the implementation of ecological projects—was the main cause of NDVI rises in Southwest China’s central, northeastern, and southern regions. In much of Southwest China, plant growth was fostered by human activity, with the exception of city areas. Research has shown that vegetation dynamics are significantly impacted by human activity [51,52,53]. Accurately calculating the contributions of HA to vegetation changes is also essential [54,55]. According to Lai et al., climatic change and human activity have contributed 51.75% and 48.25%, respectively, to the growth of vegetation in China [56]. Additionally, Zhang et al. observed that places in Southwest China where vegetation dynamics were largely impacted by human activities during different seasons and growth periods accounted for 57.75% to 69.09% [57]. Previous studies generally indicate that vegetation changes in the east are more significantly influenced by human activity, promoting vegetation restoration, while the central and western areas are negatively impacted [58,59,60]. Human activities are expressed in numerous ways, such as urban growth, agricultural management, overgrazing, and ecological initiatives. Human activities contribute favorably to NDVI changes in most vegetation-covered areas of Southwest China, while having a negative influence in most parts of the northwest. The major plant type in the northwest is grassland, indicating that overgrazing severely effects vegetation growth [61]. Climate change dominates NDVI changes in a few locations relative to human activity. In most locations, the overall pace at which human activity contributes to NDVI changes is higher than the rate at which climate change occurs. Figure 7 demonstrates that human activities considerably dominate NDVI variations in the southeastern, southwestern, and western Sichuan Basin. Due to significant agricultural abandonment in karst regions, population decline, and policy impacts, HA had a positive impact on vegetation changes in the southern half of the study area [62]. In the southern karst mountainous areas, ecological restoration efforts considerably enhanced the local ecological environment. Farmers’ willingness to and activities that participate in ecological initiatives significantly effect soil conservation, water production, and carbon sequestration, boosting NDVI values [63]. In the western Sichuan Basin, NDVI variations are predominantly impacted by natural forces and human activity, with ecological restoration initiatives considerably boosting NDVI values [64]. According to this study, human activities contributed 87.8% to the NDVI increase in Southwest China, demonstrating that human activities considerably enhanced the natural environment.

4.3. Limitations and Prospects

Current large-scale investigations relying on spatial data, such as remote sensing imaging, are still hampered by poor spatial and temporal resolution and the limited number of meteorological stations [65,66]. The intrinsic delay in portraying plant development using MODIS data, due to its poor resolution, may impair the evaluation of the delayed effects of extreme climates on vegetation [43]. The sensor type, spectral response function, data processing and correction techniques, composite time, and spatial and temporal resolution of different NDVI products vary [67]. Furthermore, human activity may modify climate observation data [68], linking human activity-induced fires and urban heat island impacts to climatic factors that affect NDVI changes. Using extreme climatic data, this research refined the impact of CC on plants. Residual trend analysis may have simplified or underestimated the impact of climate change on vegetation, as the selected indicators do not fully represent all climatic factors. Additionally, fires or pest outbreaks unrelated to human activities may also be attributed to the residuals [58]. Additionally, this study may have failed to capture the nonlinear relationships between vegetation dynamics and influencing factors into linear relationships [55,69,70]. Therefore, in order to determine the underlying influences of human activity on vegetation and more precisely quantify the contributions of influencing factors to vegetation changes based on residual trend analysis, more precise geographic data and trustworthy models or techniques are required [71].

5. Conclusions

This study examined the NDVI of the vegetation in Southwest China from 2000 to 2020 using MODIS NDVI data and daily meteorological data. It also created a time series of changes in the vegetation and climate factors and quantified the contributions of both CC and HA to changes in the vegetation in Southwest China. The following are the main conclusions:
(1)
NDVI trends varied across different time frames, demonstrating an overall rising trend. Annually, the regional average NDVI considerably rose at a rate of 0.02/10a, with a considerable rise in 36.34% of the area.
(2)
Temperature considerably influenced the northern section of the research region, whereas precipitation and extreme climate greatly impacted the southern part.
(3)
In Southwest China, climate change and human activities contributed 0.0008/10a and 0.0034/10a, or 19.1% and 80.9%, respectively, to the proportionate contributions of CC and HA to vegetation changes. HA dominated most places geographically, with the exception of the western Sichuan Plateau.

Author Contributions

Conceptualization, N.C. and J.X.; methodology, G.Q., N.C. and J.X.; formal analysis, G.Q., M.L., T.Q. and L.R.; investigation, G.Q., M.L., T.Q. and L.R.; resources, N.C. and J.X.; writing—original draft preparation, G.Q.; writing—review and editing, N.C., P.R. and J.X.; project administration, G.Q. and J.X.; funding acquisition, P.R. and J.X. All authors have read and agreed to the published version of the manuscript.

Funding

This research was funded by the National Natural Science Foundation of China (41801185), and the Sichuan Science and Technology Program (2023NSFSC0191, 2023NSFSC1979).

Data Availability Statement

All data can be accessed through the website provided in the article.

Acknowledgments

We would like to thank to the editors and reviewers, who have put great effort into their comments on this manuscript. We would also thank the data publishers and funding agencies.

Conflicts of Interest

The authors declare no conflicts of interest.

References

  1. Jiang, L.L.; Jiapaer, G.; Bao, A.M.; Guo, H.; Ndayisaba, F. Vegetation dynamics and responses to climate change and human activities in Central Asia. Sci. Total Environ. 2017, 599, 967–980. [Google Scholar] [CrossRef] [PubMed]
  2. Li, L.; Zha, Y.; Zhang, J.H.; Li, Y.M.; Lyu, H. Effect of terrestrial vegetation growth on climate change in China. J. Environ. Manag. 2020, 262, 110321. [Google Scholar] [CrossRef] [PubMed]
  3. Peng, J.; Jiang, H.; Liu, Q.H.; Green, S.M.; Quine, T.A.; Liu, H.Y.; Qiu, S.J.; Liu, Y.X.; Meersmans, J. Human activity vs. climate change: Distinguishing dominant drivers on LAI dynamics in karst region of southwest China. Sci. Total Environ. 2021, 769, 144297. [Google Scholar] [CrossRef]
  4. Guan, Y.L.; Lu, H.W.; Yin, C.; Xue, Y.X.; Jiang, Y.L.; Kang, Y.; He, L.; Heiskanen, J. Vegetation response to climate zone dynamics and its impacts on surface soil water content and albedo in China. Sci. Total Environ. 2020, 747, 141537. [Google Scholar] [CrossRef]
  5. Wang, H.; Liu, G.H.; Li, Z.S.; Wang, P.T.; Wang, Z.Z. Comparative Assessment of Vegetation Dynamics under the Influence of Climate Change and Human Activities in Five Ecologically Vulnerable Regions of China from 2000 to 2015. Forests 2019, 10, 317. [Google Scholar] [CrossRef]
  6. Zhang, Y.; Zhang, C.B.; Wang, Z.Q.; Chen, Y.Z.; Gang, C.C.; An, R.; Li, J.L. Vegetation dynamics and its driving forces from climate change and human activities in the Three-River Source Region, China from 1982 to 2012. Sci. Total Environ. 2016, 563, 210–220. [Google Scholar] [CrossRef]
  7. Wen, Z.F.; Wu, S.J.; Chen, J.L.; Lü, M.Q. NDVI indicated long-term interannual changes in vegetation activities and their responses to climatic and anthropogenic factors in the Three Gorges Reservoir Region, China. Sci. Total Environ. 2017, 574, 947–959. [Google Scholar] [CrossRef] [PubMed]
  8. Meng, M.; Ni, J.; Zong, M.J. Impacts of changes in climate variability on regional vegetation in China: NDVI-based analysis from 1982 to 2000. Ecol. Res. 2011, 26, 421–428. [Google Scholar] [CrossRef]
  9. He, Y.L.; Yan, W.B.; Cai, Y.; Deng, F.Y.; Qu, X.X.; Cui, X.L. How does the Net primary productivity respond to the extreme climate under elevation constraints in mountainous areas of Yunnan, China? Ecol. Indic. 2022, 138, 108817. [Google Scholar] [CrossRef]
  10. Shi, Y.; Jin, N.; Ma, X.L.; Wu, B.Y.; He, Q.S.; Yue, C.; Yu, Q. Attribution of climate and human activities to vegetation change in China using machine learning techniques. Agric. For. Meteorol. 2020, 294, 108146. [Google Scholar] [CrossRef]
  11. Chu, H.S.; Venevsky, S.; Wu, C.; Wang, M.H. NDVI-based vegetation dynamics and its response to climate changes at Amur-Heilongjiang River Basin from 1982 to 2015. Sci. Total Environ. 2019, 650, 2051–2062. [Google Scholar] [CrossRef] [PubMed]
  12. Li, S.S.; Yang, S.N.; Liu, X.F.; Liu, Y.X.; Shi, M.M. NDVI-Based Analysis on the Influence of Climate Change and Human Activities on Vegetation Restoration in the Shaanxi-Gansu-Ningxia Region, Central China. Remote Sens. 2015, 7, 11163–11182. [Google Scholar] [CrossRef]
  13. Liu, L.L.; Jiang, Y.; Gao, J.B.; Feng, A.Q.; Jiao, K.W.; Wu, S.H.; Zuo, L.Y.; Li, Y.Q.; Yan, R. Concurrent Climate Extremes and Impacts on Ecosystems in Southwest China. Remote Sens. 2022, 14, 1678. [Google Scholar] [CrossRef]
  14. Ge, W.Y.; Deng, L.Q.; Wang, F.; Han, J.Q. Quantifying the contributions of human activities and climate change to vegetation net primary productivity dynamics in China from 2001 to 2016. Sci. Total Environ. 2021, 773, 145648. [Google Scholar] [CrossRef] [PubMed]
  15. Jiang, M.C.; Tian, S.F.; Zheng, Z.J.; Zhan, Q.; He, Y.X. Human Activity Influences on Vegetation Cover Changes in Beijing, China, from 2000 to 2015. Remote Sens. 2017, 9, 271. [Google Scholar] [CrossRef]
  16. Tang, X.Y.; Cui, Y.P.; Li, N.; Fu, Y.M.; Liu, X.Y.; Run, Y.D.; Li, M.D.; Zhao, G.S.; Dong, J.W. Human Activities Enhance Radiation Forcing through Surface Albedo Associated with Vegetation in Beijing. Remote Sens. 2020, 12, 837. [Google Scholar] [CrossRef]
  17. Liu, J.J.; Coomes, D.A.; Gibson, L.; Hu, G.; Liu, J.L.; Luo, Y.Q.; Wu, C.P.; Yu, M.J. Forest fragmentation in China and its effect on biodiversity. Biol. Rev. 2019, 94, 1636–1657. [Google Scholar] [CrossRef]
  18. Xu, D.; Cheng, J.; Xu, S.; Geng, J.; Yang, F.; Fang, H.; Xu, J.F.; Wang, S.; Wang, Y.B.; Huang, J.C.; et al. Understanding the Relationship between China’s Eco-Environmental Quality and Urbanization Using Multisource Remote Sensing Data. Remote Sens. 2022, 14, 198. [Google Scholar] [CrossRef]
  19. Andrzej, W.; Jakub, W.; Mariusz, S.; Devendra, A.; Dariusz, M.; Sudhanshu, P.; Peter, C. Exploiting satellite data for total direct runoff prediction using CN-based MSME model. Sci. Total Environ. 2023, 908, 168391. [Google Scholar]
  20. Eisfelder, C.; Asam, S.; Hirner, A.; Reiners, P.; Holzwarth, S.; Bachmann, M.; Gessner, U.; Dietz, A.; Huth, J.; Bachofer, F.; et al. Seasonal Vegetation Trends for Europe over 30 Years from a Novel Normalised Difference Vegetation Index (NDVI) Time-Series—The TIMELINE NDVI Product. Remote Sens. 2023, 15, 3616. [Google Scholar] [CrossRef]
  21. Lin, X.N.; Niu, J.Z.; Berndtsson, R.; Yu, X.X.; Zhang, L.; Chen, X.W. NDVI Dynamics and Its Response to Climate Change and Reforestation in Northern China. Remote Sens. 2020, 12, 4138. [Google Scholar] [CrossRef]
  22. Liu, Y.; Tian, J.Y.; Liu, R.H.; Ding, L.Q. Influences of Climate Change and Human Activities on NDVI Changes in China. Remote Sens. 2021, 13, 4326. [Google Scholar] [CrossRef]
  23. Song, Y.; Ma, M.G. A statistical analysis of the relationship between climatic factors and the Normalized Difference Vegetation Index in China. Int. J. Remote Sens. 2011, 32, 3947–3965. [Google Scholar] [CrossRef]
  24. Xu, Y.F.; Yang, J.; Chen, Y.N. NDVI-based vegetation responses to climate change in an arid area of China. Theor. Appl. Climatol. 2016, 126, 213–222. [Google Scholar] [CrossRef]
  25. Goyal, R.K. Sensitivity of evapotranspiration to global warming: A case study of arid zone of Rajasthan (India). Agric. Water Manag. 2004, 69, 1–11. [Google Scholar] [CrossRef]
  26. King, D.A.; Bachelet, D.M.; Symstad, A.J.; Ferschweiler, K.; Hobbins, M. Estimation of potential evapotranspiration from extraterrestrial radiation, air temperature and humidity to assess future climate change effects on the vegetation of the Northern Great Plains, USA. Ecol. Model. 2015, 297, 86–97. [Google Scholar] [CrossRef]
  27. Li, C.L.; Wang, J.; Hu, R.C.; Yin, S.; Bao, Y.H.; Ayal, D.Y. Relationship between vegetation change and extreme climate indices on the Inner Mongolia Plateau, China, from 1982 to 2013. Ecol. Indic. 2018, 89, 101–109. [Google Scholar] [CrossRef]
  28. Dong, B.G.; Yu, Y.; Pereira, P. Non-growing season drought legacy effects on vegetation growth in southwestern China. Sci. Total Environ. 2022, 846, 157334. [Google Scholar] [CrossRef]
  29. Li, X.Y.; Li, Y.; Chen, A.P.; Gao, M.D.; Slette, I.J.; Piao, S.L. The impact of the 2009/2010 drought on vegetation growth and terrestrial carbon balance in Southwest China. Agric. For. Meteorol. 2019, 269, 239–248. [Google Scholar] [CrossRef]
  30. Jiang, W.G.; Yuan, L.H.; Wang, W.J.; Cao, R.; Zhang, Y.F.; Shen, W.M. Spatio-temporal analysis of vegetation variation in the Yellow River Basin. Ecol. Indic. 2015, 51, 117–126. [Google Scholar] [CrossRef]
  31. He, J.; Yang, K.; Tang, W.J.; Lu, H.; Qin, J.; Chen, Y.Y.; Li, X. The first high-resolution meteorological forcing dataset for land process studies over China. Sci. Data 2020, 7, 25. [Google Scholar] [CrossRef] [PubMed]
  32. Broxton, P.D.; Zeng, X.B.; Sulla-Menashe, D.; Troch, P.A. A Global Land Cover Climatology Using MODIS Data. J. Appl. Meteorol. Climatol. 2014, 53, 1593–1605. [Google Scholar] [CrossRef]
  33. Blewitt, G.; Kreemer, C.; Hammond, W.C.; Gazeaux, J. MIDAS robust trend estimator for accurate GPS station velocities without step detection. J. Geophys. Res.-Solid Earth 2016, 121, 2054–2068. [Google Scholar] [CrossRef] [PubMed]
  34. Lunetta, R.S.; Knight, J.F.; Ediriwickrema, J.; Lyon, J.G.; Worthy, L.D. Land-cover change detection using multi-temporal MODIS NDVI data. Remote Sens. Environ. 2006, 105, 142–154. [Google Scholar] [CrossRef]
  35. Rojas, O.; Vrieling, A.; Rembold, F. Assessing drought probability for agricultural areas in Africa with coarse resolution remote sensing imagery. Remote Sens. Environ. 2011, 115, 343–352. [Google Scholar] [CrossRef]
  36. Ji, L.Q.; Fan, K. Climate Prediction of Satellite-Based Spring Eurasian Vegetation Index (NDVI) using Coupled Singular Value Decomposition (SVD) Patterns. Remote Sens. 2019, 11, 2123. [Google Scholar] [CrossRef]
  37. Kang, J.; Jin, R.; Li, X.; Zhang, Y.; Zhu, Z.L. Spatial Upscaling of Sparse Soil Moisture Observations Based on Ridge Regression. Remote Sens. 2018, 10, 192. [Google Scholar] [CrossRef]
  38. Beer, C.; Reichstein, M.; Tomelleri, E.; Ciais, P.; Jung, M.; Carvalhais, N.; Rödenbeck, C.; Arain, M.A.; Baldocchi, D.; Bonan, G.B.; et al. Terrestrial Gross Carbon Dioxide Uptake: Global Distribution and Covariation with Climate. Science 2010, 329, 834–838. [Google Scholar] [CrossRef]
  39. Gu, Z.J.; Duan, X.W.; Shi, Y.D.; Li, Y.; Pan, X. Spatiotemporal variation in vegetation coverage and its response to climatic factors in the Red River Basin, China. Ecol. Indic. 2018, 93, 54–64. [Google Scholar] [CrossRef]
  40. Evans, J.; Geerken, R. Discrimination between climate and human-induced dryland degradation. J. Arid. Environ. 2004, 57, 535–554. [Google Scholar] [CrossRef]
  41. Sun, W.Y.; Song, X.Y.; Mu, X.M.; Gao, P.; Wang, F.; Zhao, G.J. Spatiotemporal vegetation cover variations associated with climate change and ecological restoration in the Loess Plateau. Agric. For. Meteorol. 2015, 209, 87–99. [Google Scholar] [CrossRef]
  42. Shen, X.J.; Xue, Z.S.; Jiang, M.; Lu, X.G. Spatiotemporal Change of Vegetation Coverage and its Relationship with Climate Change in Freshwater Marshes of Northeast China. Wetlands 2019, 39, 429–439. [Google Scholar] [CrossRef]
  43. Wang, H.; Liu, H.Y.; Huang, N.; Bi, J.; Ma, X.L.; Ma, Z.Y.; Shangguan, Z.J.; Zhao, H.F.; Feng, Q.S.; Liang, T.G.; et al. Satellite-derived NDVI underestimates the advancement of alpine vegetation growth over the past three decades. Ecology 2021, 102, e03518. [Google Scholar] [CrossRef]
  44. Sun, L.; Cai, Y.P.; Zhou, Y.; Shi, S.Y.; Zhao, Y.S.; Gunnarson, B.E.; Jaramillo, F. Radial Growth Responses to Climate of Pinus yunnanensis at Low Elevations of the Hengduan Mountains, China. Forests 2020, 11, 1066. [Google Scholar] [CrossRef]
  45. Xing, H.; Fang, K.Y.; Yao, Q.C.; Zhou, F.F.; Ou, T.H.; Liu, J.E.; Zhou, S.F.; Jiang, S.X.; Chen, Y.; Bai, M.W.; et al. Impacts of changes in climate extremes on wildfire occurrences in China. Ecol. Indic. 2023, 157, 111288. [Google Scholar] [CrossRef]
  46. Zhao, X.; Wei, H.; Liang, S.L.; Zhou, T.; He, B.; Tang, B.J.; Wu, D.H. Responses of Natural Vegetation to Different Stages of Extreme Drought during 2009-2010 in Southwestern China. Remote Sens. 2015, 7, 14039–14054. [Google Scholar] [CrossRef]
  47. Luo, M.; Sa, C.L.; Meng, F.H.; Duan, Y.C.; Liu, T.; Bao, Y.H. Assessing extreme climatic changes on a monthly scale and their implications for vegetation in Central Asia. J. Clean. Prod. 2020, 271, 122396. [Google Scholar] [CrossRef]
  48. Lin, M.; Hou, L.Z.; Qi, Z.M.; Wan, L. Impacts of climate change and human activities on vegetation NDVI in China’s Mu Us Sandy Land during 2000–2019. Ecol. Indic. 2022, 142, 109164. [Google Scholar] [CrossRef]
  49. Wang, W.; Teng, H.F.; Zhao, L.; Han, L.Y. Long-Term Changes in Water Body Area Dynamic and Driving Factors in the Middle-Lower Yangtze Plain Based on Multi-Source Remote Sensing Data. Remote Sens. 2023, 15, 1816. [Google Scholar] [CrossRef]
  50. Qiu, L.B.; Xiao, T.Q.; Bai, T.J.; Mo, X.Y.; Huang, J.H.; Deng, W.P.; Liu, Y.Q. Seasonal Dynamics and Influencing Factors of Litterfall Production and Carbon Input in Typical Forest Community Types in Lushan Mountain, China. Forests 2023, 14, 341. [Google Scholar] [CrossRef]
  51. Chen, S.; Ma, C.M.; Zhu, C.; Meadows, M.; Zhang, J.H.; Lu, H.Y. Climate remained a major driving factor of vegetation dynamics over the past 600 years in Huangshan Mountain, Southeast China. Quat. Sci. Rev. 2023, 321, 108389. [Google Scholar] [CrossRef]
  52. Guo, P.; Wang, Y.J.; Yan, Y.L.; Wang, F.; Lyu, J.Q.; Ge, W.Y.; Chen, H.; Jiao, J.Y. Assessing the Spatiotemporal Variations in the Hydrological Response of the Qin River Basin in Loess Plateau, China. Remote Sens. 2024, 16, 1603. [Google Scholar] [CrossRef]
  53. Naeem, S.; Zhang, Y.Q.; Tian, J.; Qamer, F.M.; Latif, A.; Paul, P.K. Quantifying the Impacts of Anthropogenic Activities and Climate Variations on Vegetation Productivity Changes in China from 1985 to 2015. Remote Sens. 2020, 12, 1113. [Google Scholar] [CrossRef]
  54. Qi, S.Y.; Zhang, H.Q.; Zhang, M. Evolutionary characteristics of carbon sources/sinks in Chinese terrestrial ecosystems regarding to temporal effects and geographical partitioning. Ecol. Indic. 2024, 160, 111923. [Google Scholar] [CrossRef]
  55. Shi, S.Y.; Yu, J.J.; Wang, F.; Wang, P.; Zhang, Y.C.; Jin, K. Quantitative contributions of climate change and human activities to vegetation changes over multiple time scales on the Loess Plateau. Sci. Total Environ. 2021, 755, 142419. [Google Scholar] [CrossRef]
  56. Lai, W.L.; Wang, M.M.; Wei, J.; Zhang, J.; Song, J.Y.; Zhou, H.Y.; Chou, S.R.; Wang, Y.P. Separating the Impact of Climate Changes and Human Activities on Vegetation Growth Based on the NDVI in China. Adv. Meteorol. 2022, 2022, 6294029. [Google Scholar] [CrossRef]
  57. Zhang, Y.X.; Liu, Q.; Wang, Y.K.; Huang, J.H. Assessing the impacts of climate change and anthropogenic activities on vegetation in southwest China. J. Mt. Sci. 2022, 19, 2678–2692. [Google Scholar] [CrossRef]
  58. Deng, Y.; Wu, D.H.; Wang, X.H.; Xie, Z.Q. Responding time scales of vegetation production to extreme droughts over China. Ecol. Indic. 2022, 136, 108630. [Google Scholar] [CrossRef]
  59. Ge, W.Y.; Han, J.Q.; Zhang, D.J.; Wang, F. Divergent impacts of droughts on vegetation phenology and productivity in the Yungui Plateau, southwest China. Ecol. Indic. 2021, 127, 107743. [Google Scholar] [CrossRef]
  60. Wu, R.A.; Wang, Y.; Liu, B.Y.; Li, X.M. Spatial-temporal changes of NDVI in the three northeast provinces and its dual response to climate change and human activities. Front. Environ. Sci. 2022, 10, 974988. [Google Scholar] [CrossRef]
  61. Xiong, Q.L.; Xiao, Y.; Halmy, M.W.A.; Dakhil, M.A.; Liang, P.H.; Liu, C.G.; Zhang, L.; Pandey, B.; Pan, K.W.; El Kafraway, S.B.; et al. Monitoring the impact of climate change and human activities on grassland vegetation dynamics in the northeastern Qinghai-Tibet Plateau of China during 2000–2015. J. Arid. Land 2019, 11, 637–651. [Google Scholar] [CrossRef]
  62. Wang, L.D.; Hu, F.; Miao, Y.C.; Zhang, C.Y.; Zhang, L.; Luo, M.Z. Changes in Vegetation Dynamics and Relations with Extreme Climate on Multiple Time Scales in Guangxi, China. Remote Sens. 2022, 14, 2013. [Google Scholar] [CrossRef]
  63. Miao, P.P.; Zhao, X.Q.; Pu, J.W.; Huang, P.; Shi, X.Q.; Gu, Z.X. Study on the Evolution Mechanism of Ecosystem Services in Karst Mountainous Areas from the Perspective of Humanities. Int. J. Environ. Res. Public Health 2022, 19, 13628. [Google Scholar] [CrossRef] [PubMed]
  64. Peng, W.F.; Kuang, T.T.; Tao, S. Quantifying influences of natural factors on vegetation NDVI changes based on geographical detector in Sichuan, western China. J. Clean. Prod. 2019, 233, 353–367. [Google Scholar] [CrossRef]
  65. Huang, C.Y.; Anderegg, W.R.L.; Asner, G.P. Remote sensing of forest die-off in the Anthropocene: From plant ecophysiology to canopy structure. Remote Sens. Environ. 2019, 231, 111233. [Google Scholar] [CrossRef]
  66. Smith, A.M.S.; Kolden, C.A.; Tinkham, W.T.; Talhelm, A.F.; Marshall, J.D.; Hudak, A.T.; Boschetti, L.; Falkowski, M.J.; Greenberg, J.A.; Anderson, J.W.; et al. Remote sensing the vulnerability of vegetation in natural terrestrial ecosystems. Remote Sens. Environ. 2014, 154, 322–337. [Google Scholar] [CrossRef]
  67. Ma, M.Y.; Wang, Q.M.; Liu, R.; Zhao, Y.; Zhang, D.Q. Effects of climate change and human activities on vegetation coverage change in northern China considering extreme climate and time-lag and -accumulation effects. Sci. Total Environ. 2023, 860, 160527. [Google Scholar] [CrossRef]
  68. Zhao, N.; Jiao, Y.M.; Ma, T.; Zhao, M.M.; Fan, Z.M.; Yin, X.Z.; Liu, Y.; Yue, T.X. Estimating the effect of urbanization on extreme climate events in the Beijing-Tianjin-Hebei region, China. Sci. Total Environ. 2019, 688, 1005–1015. [Google Scholar] [CrossRef]
  69. Song, Y.; Jin, L.; Wang, H.B. Vegetation Changes along the Qinghai-Tibet Plateau Engineering Corridor Since 2000 Induced by Climate Change and Human Activities. Remote Sens. 2018, 10, 95. [Google Scholar] [CrossRef]
  70. Sun, R.; Chen, S.H.; Su, H.B. Trend Analysis and Driving Factors of Vegetation Dynamics in Northern China from 1982 to 2015. Remote Sens. 2022, 14, 6163. [Google Scholar] [CrossRef]
  71. Jiang, H.L.; Xu, X.; Zhang, T.; Xia, H.Y.; Huang, Y.Q.; Qiao, S.R. The Relative Roles of Climate Variation and Human Activities in Vegetation Dynamics in Coastal China from 2000 to 2019. Remote Sens. 2022, 14, 2485. [Google Scholar] [CrossRef]
Figure 1. The elevation map (a) and vegetation type map (b) of Southwest China. The terms “Needleleaf Forest (NLF)”, “Broadleaf Forest (BLF)”, “Shrublands (SHR)”, “Grasslands (GRA)”, and “Croplands (CRO)” refer to different kinds of vegetation.
Remotesensing 16 03361 g001
Figure 2. The spatial distribution of the multi-year average NDVI from 2000 to 2010 (a), the multi-year average NDVI from 2010 to 2020 (b), the annual trends in the NDVI for the years 2000–2020 (c), and the associated significances (d).
Remotesensing 16 03361 g002
Figure 3. Partial correlation coefficients’ spatial distributions from 2000 to 2020 between the NDVI of Southwest China and (a) temperature, (b) precipitation, (c) extreme climate, and (d) spatial distribution of the largest correlation factor. Correlation coefficients with significant values of 5% and 1% are represented by values of 0.46 (–0.46) and 0.53 (–0.53). The unit is the correlation coefficient.
Remotesensing 16 03361 g003
Figure 4. HA and CC’s contributions to NDVI variations in the study area. The spatial distribution of two contributions: (a) those resulting from CC, and (b) those resulting from HA. Significant upward trend, non-significant upward trend, unrelated trend, non-significant downward trend, and significant downward trend are denoted by the letters SUT, NUT, U, UNT, and SDT, respectively.
Remotesensing 16 03361 g004
Figure 5. Contributions of CC and HA to NDVI fluctuations under various vegetation types in the studied area. (a) Data about the impact of CC; (b) data regarding the impact of HA. Significant upward trend, non-significant upward trend, unrelated trend, non-significant downward trend, and significant downward trend are denoted by the letters SUT, NUT, U, UNT, and SDT, respectively. “Needleleaf Forest”, “Broadleaf Forest”, “Shrublands”, “Grasslands”, and “Croplands” are represented by the acronyms NLF, BLF, SHR, GRA, and CRO, in that order.
Remotesensing 16 03361 g005
Figure 6. Proportional contributions of HA and CC to NDVI fluctuations in the studied area. (a) The relative impact of climate change; (b) the relative impact of human activity.
Remotesensing 16 03361 g006
Figure 7. Spatial distribution of driving variables for plant cover changes in Southwest China from 2000 to 2020 (CC and HA denote climate change and human activities, respectively).
Remotesensing 16 03361 g007
Figure 8. Percentage of pixels under various plant species in Southwest China, where variations in vegetation cover are mostly caused by human activity and climate change. The symbols CC, HA, NDF, BDF, SHR, GRA, and CRO stand for “climate change”, “human activity”, “needleleaf forest”, “broadleaf forest”, “shrublands”, “grasslands”, and “croplands”, respectively.
Remotesensing 16 03361 g008
Table 1. Extreme climate indicators.
Indicator NameDefinitionUnit
Maximum five-day precipitationHighest precipitation amount in five-day periodmm
Number of heavy
precipitation days
Annul count of days when PRCP ≥ 25 mmdays
Extremely wet daysAnnual total PRCP when RR > 99th percentiledays
Consecutive dry daysMaximum number of consecutive days with RR < 1 mmdays
Consecutive wet daysMaximum number of consecutive days with RR ≥ 1 mmdays
Warm spell duration indexAnnual count of days with at least 6 consecutive days
when TX > 90th percentile
days
Cold spell duration indexAnnual count of days with at least 6 consecutive days
when TN < 10th percentile
days
Frost daysAnnual count when TN (daily minimum) < 0 °Cdays
Ice daysAnnual count when TX (daily maximum) < 0 °Cdays
Table 2. The determination of CC and HA’s respective rates of contribution to the change in NDVI.
Slope(NDVOBS)DriversRelative Contribution Rate (%)
Slope(NDVICC)Slope(NDVIHA)CCHA
>0>0>0 slope ( N D V I C C ) slope ( N D V I O B S ) × 100 slope ( N D V I H A ) slope ( N D V I O B S ) × 100
>0<01000
<0>00100
<0<0<0 slope ( N D V I C C ) slope ( N D V I O B S ) × 100 slope ( N D V I H A ) slope ( N D V I O B S ) × 100
<0>01000
>0<00100
Disclaimer/Publisher’s Note: The statements, opinions and data contained in all publications are solely those of the individual author(s) and contributor(s) and not of MDPI and/or the editor(s). MDPI and/or the editor(s) disclaim responsibility for any injury to people or property resulting from any ideas, methods, instructions or products referred to in the content.

