Abstract
The eastern slope of Gongga Mountain is located in the mountainous region of Southwestern China, which has strong geologic tectonics that leads to frequent landslide hazards. A large number of such landslides were induced by the 2022 Luding Ms 6.8 earthquake. Therefore, it is necessary to identify the spatial distribution of landslides in the region. In this paper, the Google Earth platform and GF-1 and GF-6 satellite imagery were used to construct new pre-earthquake and co-seismic landslides. Then, we analyzed the relationship between the conditioning factors of the pre-earthquake and co-seismic landslide inventories and the spatial distribution of landslides, as well as the main controlling factors of landslide development. The main conclusions are as follows: (i) Through remote-sensing interpretation and field investigation, 1198 and 4284 landslides were recognized before and after the earthquake, respectively, and the scale was mainly small- and medium-sized. (ii) In two kinds of inventories, landslides are primarily distributed along the banks of the Dadu River basin, within elevations of 1200–1400 m and slopes of 30–50°. (iii) The distribution of pre-earthquake and co-seismic landslides was influenced by engineering geological layer combinations and earthquake intensity, with these two factors being the most significant. This paper plays an important role in hazard prevention and reconstruction planning in the Gongga Mountains.
1. Introduction
Landslides are one of the major geological disasters in mountainous areas, often causing casualties and economic losses. Landslides induced by earthquakes cause even more severe damage to natural resources and the ecological environment [1,2]. In recent years, economic development has intensified land-use activities in mountainous areas. Therefore, identifying the spatial distribution patterns of geologic hazards in these areas and understanding their causative mechanism is crucial for ensuring the geological safety of local towns and cities, as well as for national spatial planning [3].
Landslide inventories form the foundation of landslide research. Researchers use these inventories to analyze the distribution characteristics of landslides, assess landslide stability, evaluate hazards, and identify the main controlling factors of co-seismic landslides from multiple perspectives [4,5,6,7]. Common methods for constructing landslide inventories include field surveys, visual interpretation, automatic extraction of high-resolution remote-sensing images, and space–air–ground investigation systems [7,8,9,10]. However, automatic interpretation faces challenges such as complexity, high technical requirements, and poor accuracy. Visual interpretation, on the other hand, offers high accuracy, effective interpretation of small- and medium-sized landslides, and low cost. The accuracy of landslide interpretation is influenced by the resolution of remote-sensing images and cloud coverage. Therefore, high-resolution, cloud-free remote-sensing images with optimal shooting angles are essential for accurate landslide interpretation. Additionally, the comprehensive analysis of temporal–spatial evolution laws is crucial for accurate landslide early warning and prediction [11].
At 12:00 on 5 September 2022, an Ms 6.8 earthquake occurred in Luding County, Ganzi Prefecture, Sichuan Province, with a focal depth of 16 km. The epicenter was located near the Moxi Fault in the southeastern segment of the Xianshui River Fault within the township of Moxi (N 29.59°, E 102.08°). The seismic intensity peaked at IX. Following the event, numerous scholars, both domestically and internationally, conducted research on co-seismic landslides, compiling inventories and characterizing their morphology in the affected region. For instance, Xiong Jiang et al. examined the seismic impact on landslide occurrence and debris flow dynamics, estimating the landslide accumulation volume at the epicenter to be 333.31 × 10⁶ m3, predominantly concentrated downstream [12]. Wang Xin et al. enhanced the predictive accuracy of the earthquake-induced geological hazard model by integrating remotely sensed landslide data from the Luding earthquake [13]. Their optimization resulted in broader seismic area coverage and improved predictive precision for co-seismic landslides. Fan Xuanmei et al. employed a real-time predictive model for co-seismic landslides, utilizing UAV imagery and high-resolution satellite images for intelligent identification, manual interpretation, and on-site investigation [14]. Their findings provided crucial assistance for co-seismic emergency response efforts. Zhang Jiaqiang et al. identified a total of 8685 co-seismic landslides covering an area of 30.7 km2 using high-resolution aerial photographs, satellite imagery, and extensive field surveys [15]. Their analysis revealed that most landslide areas are small-to-medium-sized and are distributed in relation to ground deformation induced by the Xianshui River Fault, the Dadu River, road infrastructure, and seismic activity. The study by Siyuan indicated that most landslides were concentrated in areas experiencing the seismic intensity of IX, with Wandong and Xingfu villages having the highest incidence within the affected regions [16]. In the event of strong aftershocks or heavy rainfall, loose sediments in earthquake-affected areas may undergo further sliding, leading to new landslides or mudslides. Establishing co-seismic landslide inventories is a foundational step for seismic landslide investigations [17,18,19,20,21]. However, current research in the study area predominantly focuses on the distribution of co-seismic landslides [7,15,16,22,23,24,25,26,27,28], with limited attention provided to pre-earthquake landslide inventories. This oversight complicates the examination of regional landslide distribution, evolution, and the identification of primary controlling factors. Hence, it is imperative to establish an inventory encompassing both pre-earthquake and co-seismic landslides to discern changes in their developmental patterns. Such efforts are essential for understanding the distribution and evolutionary mechanisms of regional landslides.
In this study, we selected the eastern slope of Gongga Mountain as the research area. Through field surveys of landslides triggered by the 2022 Ms 6.8 Luding earthquake in Sichuan, China, we interpreted pre-earthquake and co-seismic landslides in this region. This interpretation involved integrating Google Earth images with 2-m GF-6 and GF-2 images, resulting in the creation of pre-earthquake and co-seismic landslide inventories. The pre-earthquake landslide inventory was supplemented with data on co-seismic landslides that had been previously obscured by cloud cover in earlier studies. Utilizing this database, we analyzed topographic, geological, and seismic factors in conjunction with landslide area density (LAD), landslide point density (LND), and the frequency ratio model (FR) to compare the evolutionary characteristics of pre-earthquake and co-seismic landslide distributions. Finally, we analyzed and discussed the primary controlling factors influencing landslide distribution in various basins using the entropy weighting method.
2. Materials and Methods
2.1. Study Area
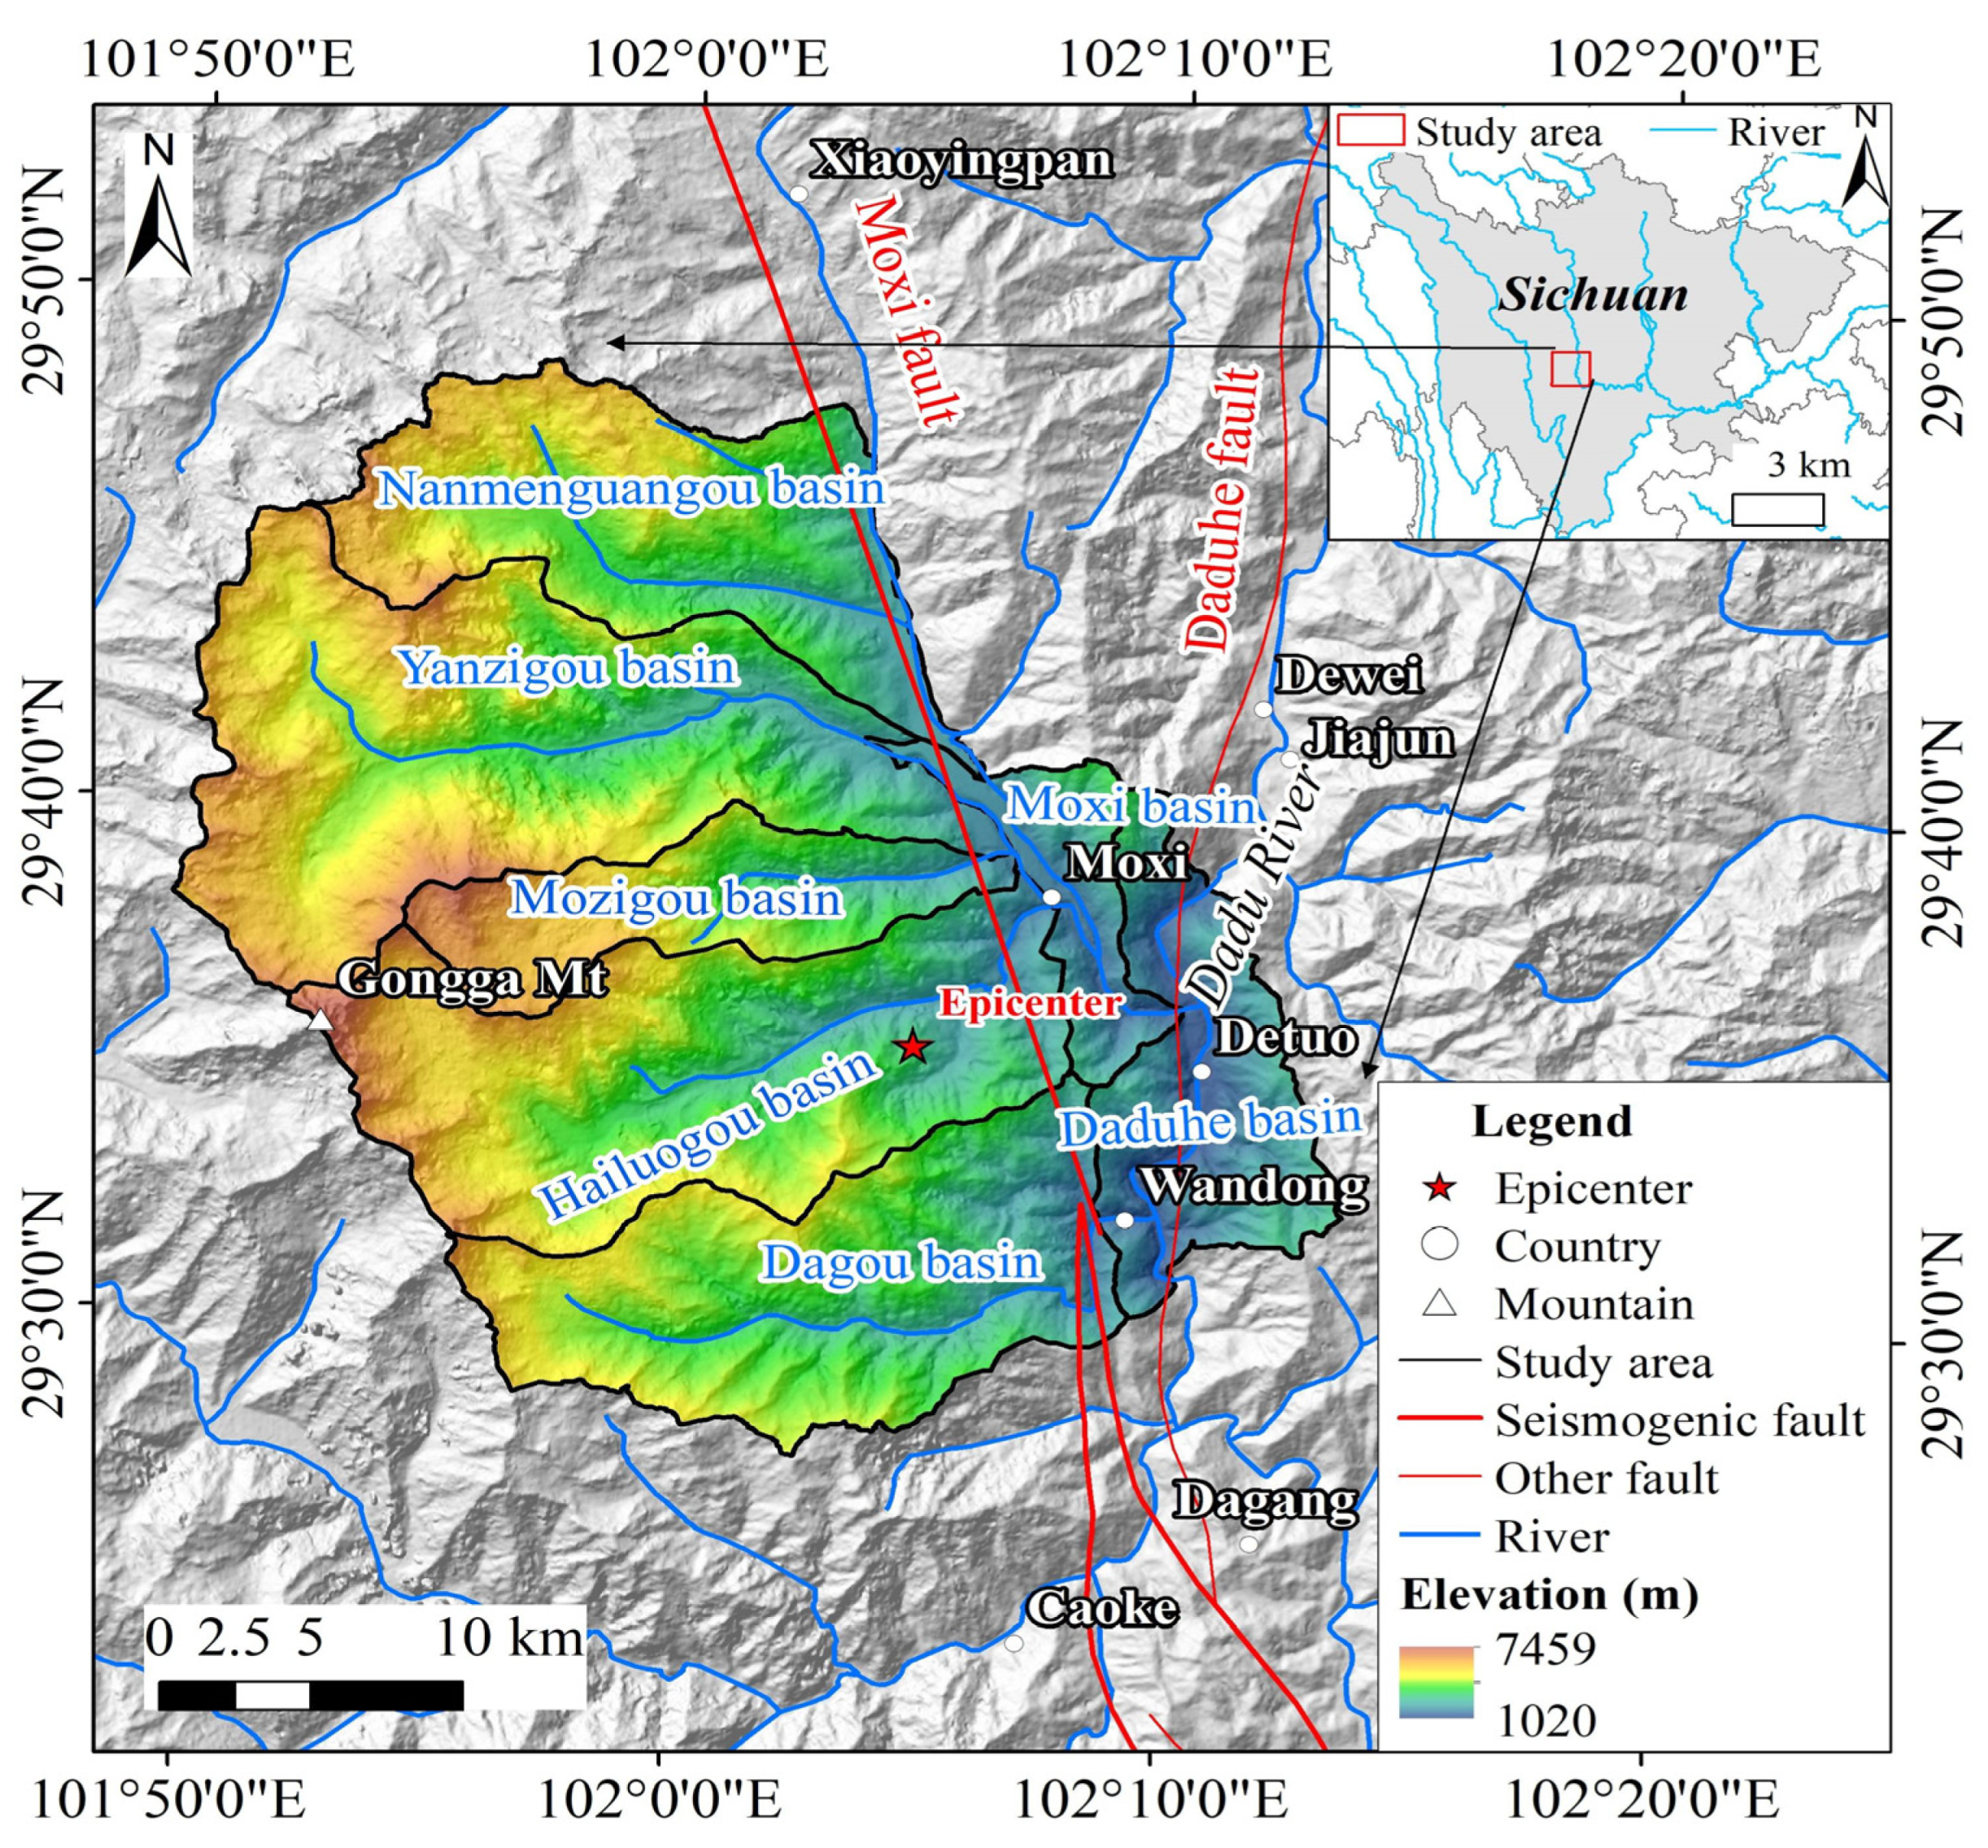
The study area is situated in the central part of the Hengduan mountain range, in the middle–southern section between the Dadu River and the Yalong River (Figure 1). It predominantly features alpine canyon geomorphology, spanning geographic coordinates from 102°2′32″ to 101°57′11″N and 29°24′17″ to 29°48′40″E, with the highest peak reaching 7508.9 m above sea level. The total area encompasses approximately 945.10 km2. The eastern side of Gongga Mountain includes distinct basin areas such as Dagou, Hailougou, Mozigou, Yanzigou, and Nanmenguangou. This region falls within the subtropical warm and humid monsoon belt, characterized by extensive and dynamic glacier formations and pronounced inter-seasonal glacier ablation [29,30].
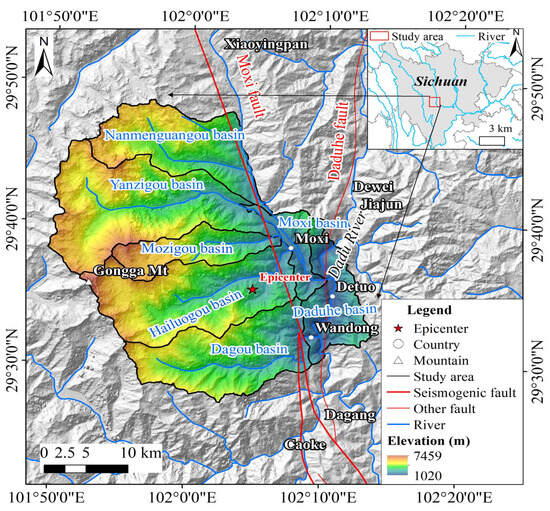
Figure 1.
Overview of the study area.
The horizontal distance from the Dadu River on the eastern slope of Gongga Mountain to the summit of the main peak is 29 km, with a vertical height difference of 6400 m. Climatic conditions vary significantly with elevation. For instance, the average annual temperature is 12.5 °C at the Moxi basin at 1600 m elevation, 3.8 °C at the Hailougou Weather Station at 3000 m elevation, and −9.0 °C at 6000 m elevation, with an average temperature decrease of 0.43 °C per 100 m increase in elevation [31]. The predominant lithologies in the area include basal ultramafic rock, syenite, and granite, while the Quaternary sediments encompass Holocene and Pleistocene alluvial deposits, gravelly soils, and clay deposits. The vertical distribution of vegetation zones includes arid valley scrub, evergreen broad-leaved forest, mountain evergreen deciduous broad-leaved mixed forest, mountain coniferous mixed forest, subalpine dark coniferous forest, subalpine scrub, alpine meadow, and sparse vegetation zones on alpine rhyolite slopes, from lower to higher elevations [32]. This constitutes a rare subtropical alpine ecological landscape globally.
The epicenter of the Luding earthquake was situated in the Hailuogou basin, with the seismic fault identified as the Moxi Fault, located southeast of the Xianshui River Fault. This fault is characterized as a large-scale strike-slip fault, spanning approximately 350 km in length. It originates from the northern region of the Northwestern Donggu and extends southward to the Moxi basin [33]. The Xianshui River Fault demonstrates a displacement of 9 mm/year and a positive sliding of 1–3 mm/year [34]. Moreover, the average sliding rate has progressively increased from the northwestern to the southeastern part of the Ganzi Fault since the Late Quaternary period [35]. Due to persistent tectonic activity and weathering over time, the rock and soil formations in the research area have become fragmented, creating conducive conditions for the occurrence of geological hazards [36].
2.2. Data
In this study, we focus on the eastern slope section of Gongga Mountain. We employ a combination of visual interpretation and field investigation to compile landslide inventories, ensuring the accuracy of the landslide data. Landslide analysis, both pre-earthquake and co-seismic, was conducted utilizing 2 m-resolution GF-6 and GF-1 satellite imagery, co-seismic remote-sensing data, historical images from Google Earth spanning January 2010 to September 2022. GF-1 were taken on 28 January 2023, and GF-6 was taken on 22 December 2021.
Three categories of factors (topographic and geomorphic, geological and tectonic, and seismic) were chosen to analyze the primary controlling factors influencing landslide distribution in the study area and different basins. Specifically, topographic factors include elevation, slope, aspect, and relief; geological factors encompass engineering geological layer combinations and fractures; and seismic factors involve seismic intensity and epicenter distance. The topographic and geomorphic data were primarily derived from a 5 m-resolution digital elevation model (DEM). Geological data were sourced from 1:50,000 digital geological maps. Based on the physical and mechanical properties of lithology, engineering geological layer combinations in the study area were categorized into six groups, as depicted in Table 1. For clarity, symbols representing engineering geological layer combinations were utilized instead of textual descriptions in the following sections of this paper. Earthquake intensity and epicenter information were sourced from the China Earthquake Network Center (https://www.ceic.ac.cn/, last access: 23 December 2023), while seismic data and PGA distribution maps were acquired from the USGS website (https://earthquake.usgs.gov/, last access: 23 December 2023).

Table 1.
Symbols and descriptions of engineering geological layer combination.
2.3. Methods
Visual interpretation offers the benefits of high accuracy, adeptness in interpreting small- and medium-sized landslides, and cost-effectiveness. Hence, this study utilized Google Earth images and GF-1 and GF-6 satellite images to create two new inventories of landslides in Sichuan, China, before and after the “9.5” Ms 6.8 Luding earthquake in 2022. The visual interpretation method of landslides in this study primarily relies on discerning the discrepancies in tone and texture between remote-sensing images and their surrounding environment, enabling the accurate delineation of landslide boundaries. This approach represents a pre-earthquake interpretation methodology for landslides. The interpretation of co-seismic landslides is based on pre-earthquake and co-seismic remote-sensing images, as well as the following criteria: (1) The image shows a pre-earthquake landslide, but the morphology of the landslide undergoes changes following the earthquake. (2) The image does not show any evidence of a landslide prior to the earthquake. However, it exhibits a distinct pattern indicative of landslides post-earthquake.
Initially, Google Earth images were used to refine and update the co-seismic landslide inventory established by previous researchers [7], and to conduct a detailed interpretation of pre-earthquake landslides. Subsequently, the interpretation results from Google Earth images were enhanced with 2 m-resolution GF-6 satellite images. Moreover, landslide data within cloud-shaded regions in historical images were supplemented, with the cloud-shaded area covering 165.20 km2, representing 17.48% of the total area. During the interpretation process, both pre-earthquake and co-seismic images were used to confirm that all co-seismic landslides were induced by the Luding earthquake. Landslides were interpreted as both polygons and points, with polygon mapping along the landslide boundaries and points located at the back edge of the landslide.
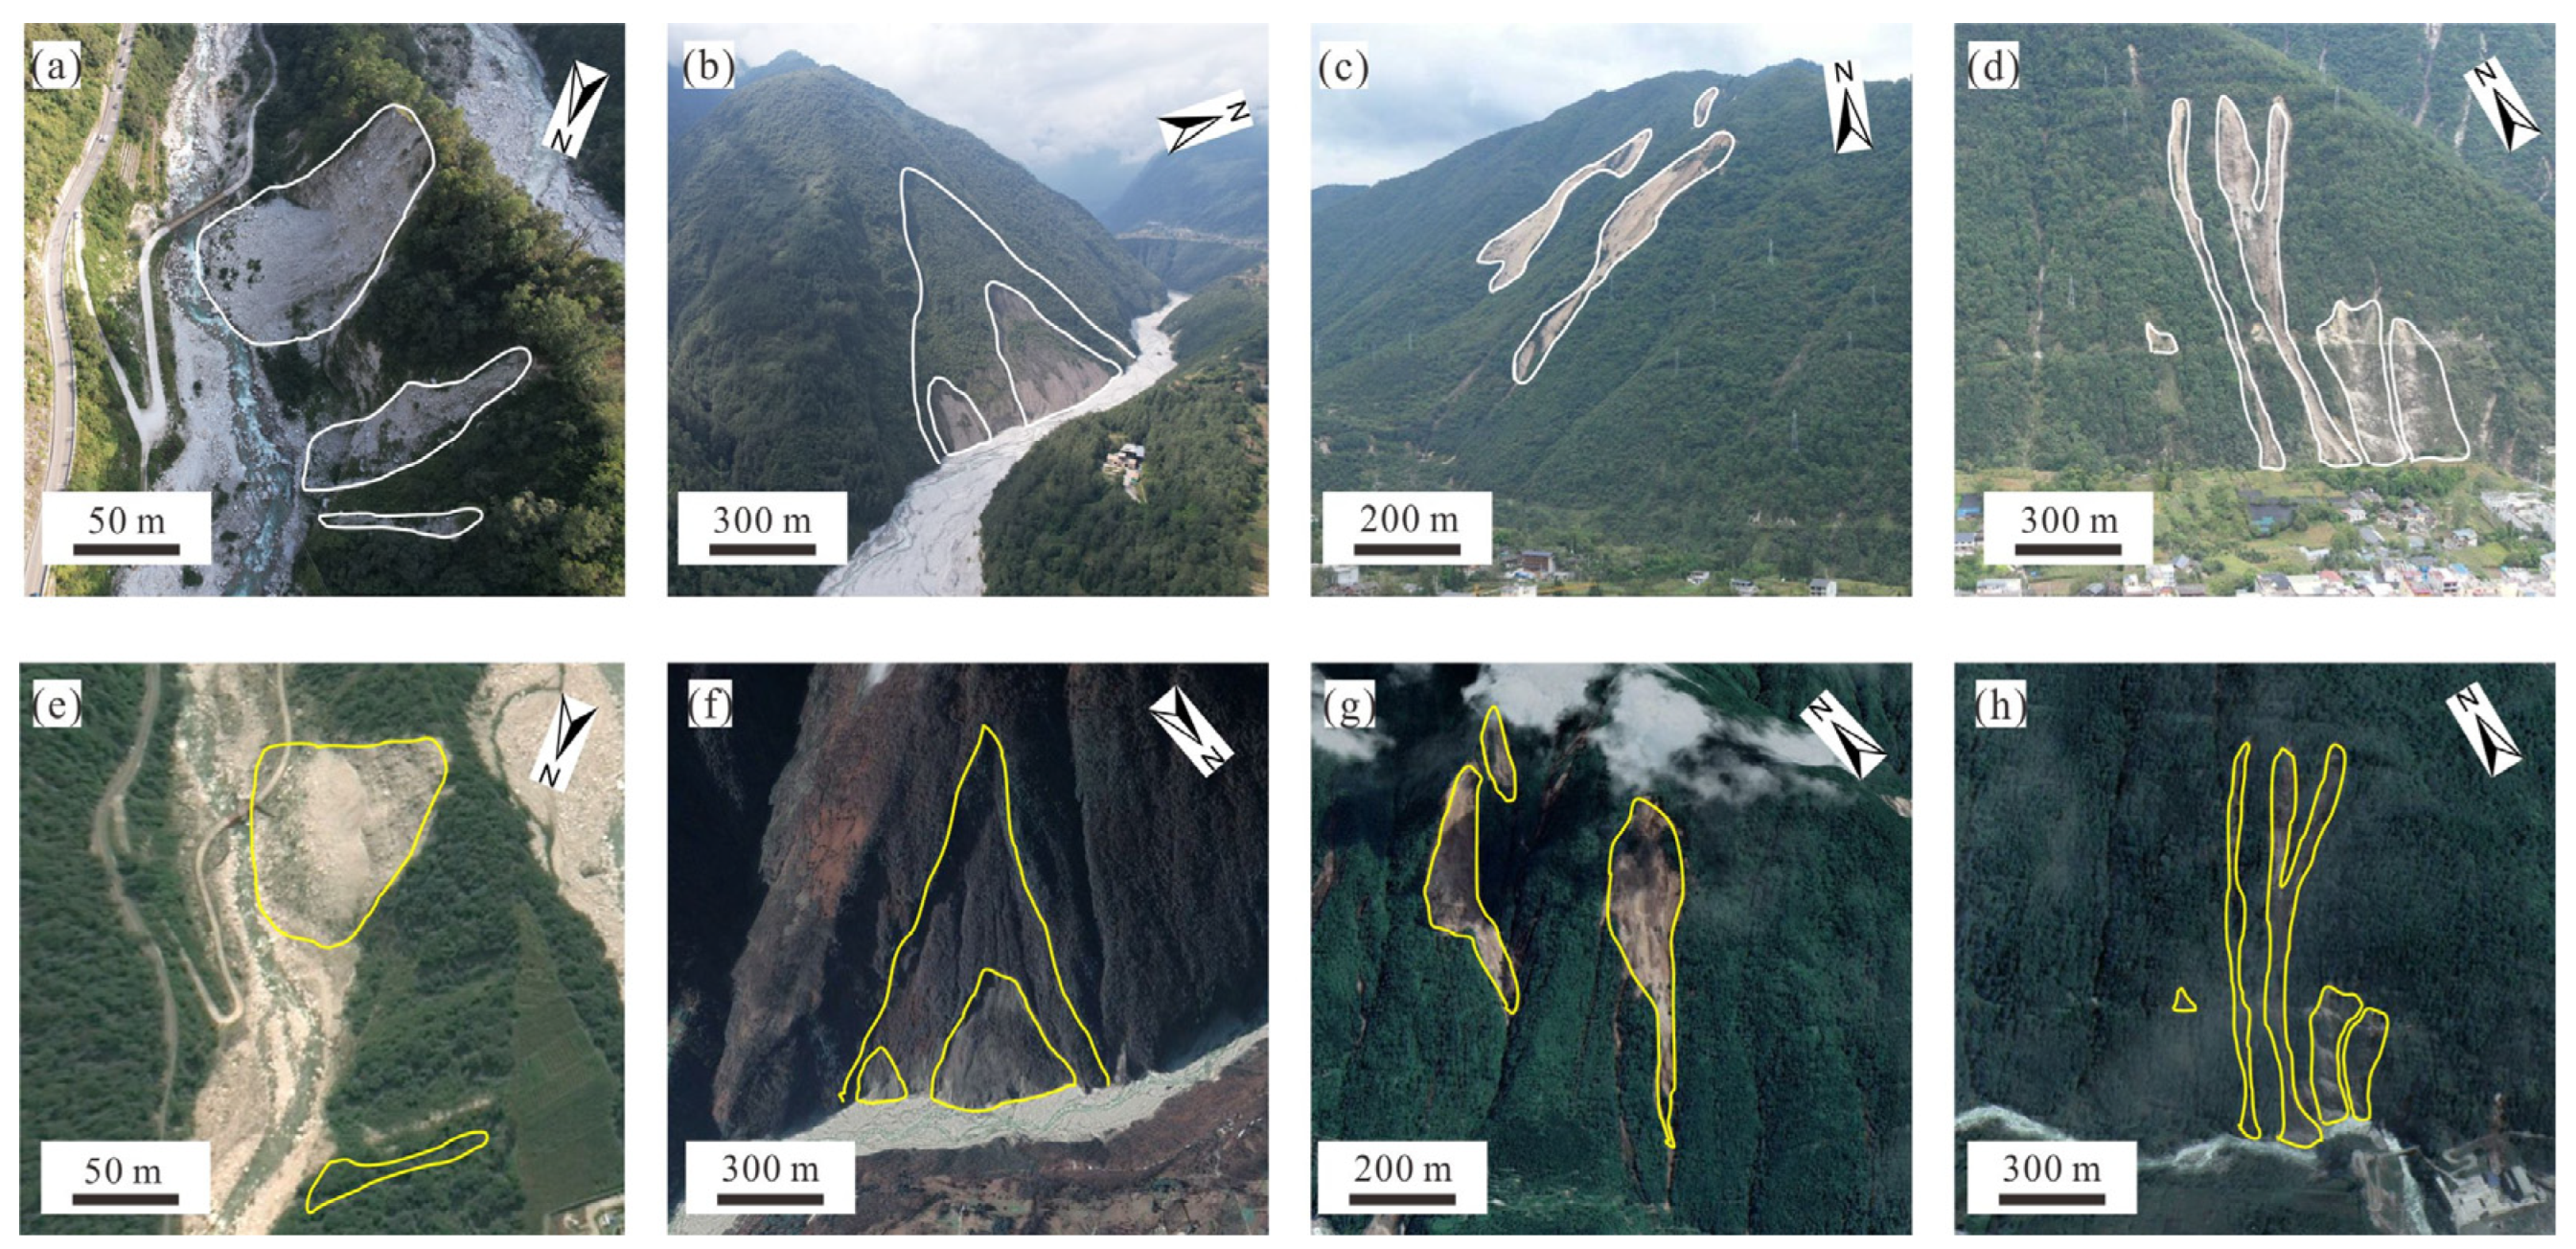
The interpretation results were then reviewed and validated through field surveys (Figure 2) and compared and refined using aerial photographs captured by field drones. Finally, four landslide inventories were compiled, including pre-earthquake and co-seismic landslide polygons and points. In total, 1198 pre-earthquake landslides and 4284 co-seismic landslides were recorded. The landslide distribution was overlaid with the engineering geological layer combination map and geological map in GIS. Landslides on the eastern slope of Gongga Mountain were classified into two primary types based on the characteristics of the geological formations: loosely stacked layer landslides and rocky landslides.
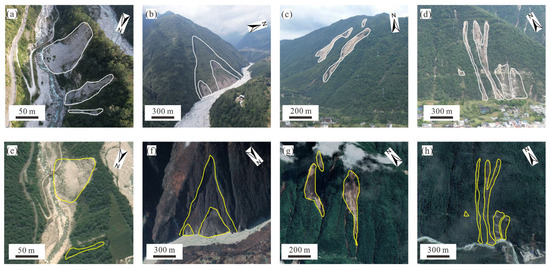
Figure 2.
Comparison between unmanned aerial photos and remote-sensing interpretation results. (a–d) are aerial photographs; (e–h) are interpretation results.
The frequency ratio (FR) model is a prediction method based on mathematical statistics that effectively expresses the relationship between landslide information and related influencing factors [37]. The magnitude of the FR value characterizes the importance of each factor in the occurrence of landslide hazards. FR > 1 indicates that the factor level is favorable for landslide occurrence, and FR < 1 indicates that it is unfavorable. The FR formula is as follows:
where Ni is the area/number of landslides in each classification interval, N is the total area/number of landslides in the study area, Si is the categorized area, and S is the total area of the study area.
Landslide mobility is a key factor in assessing landslide hazards and risks due to its direct connection to potential societal impacts. As the sliding distance increases, landslides are more likely to impact population centers, infrastructure, dams, and rivers [38,39]. The mobility index model (H/L) is used to analyze the mobility characteristics of typical basin landslides in the study area, where H is the vertical height and L is the horizontal length of the entire landslide [40,41].
We also used landslide area density (LAD) and landslide point density (LND) to characterize the spatial distribution of landslides [42]. LAD and LND are defined as the number of landslides per square kilometer and the proportion of the area where landslides have occurred (%), respectively. The specific calculation formulas are as follows:
LAD = 100 × landslide area of the class/total landslide area
LND = landslide number of the class/total landslide area
To determine the main control factors of landslides before and after earthquakes on the eastern slope of Gongga Mountain and in different typical watersheds, the entropy weighting method was used to calculate the weights of landslide influence factors and to rank these factors from the largest to the smallest [43]. The entropy weighting method is calculated as follows:
Standardization of indicators.
where is the first-level classification of the impact factor, is the second-level classification of each factor; Fij is the initial indicator value, Pij is the standardized indicator value, ADF is the area of landslide development under the second-level classification of the impact factor, and AT is the area of the second-level classification of the impact factor.
Information entropy and weight calculation.
where Ej is the information entropy of the jth influence factor, and Wj is the weight of the jth influence factor in the range [0, 1].
3. Results
3.1. Landslide Inventory and Spatial Distribution
Based on the visual interpretation principles introduced by Xu et al. [44], two sets of landslide inventories were compiled using high-resolution remote-sensing images captured before and after the earthquake (Figure 3). Before the earthquake, 1198 landslides were identified, consisting of 364 loose accumulation layer landslides and 834 rocky landslides, covering a total area of 5.30 km2. The landslides observed varied in size, with the largest area measuring 142,611 m2 and the smallest 30 m2. The average area of these landslides was approximately 4421 m2, with a Landslide Number Density (LND) of 1.27 and a Landslide Area Density (LAD) of 0.56%.
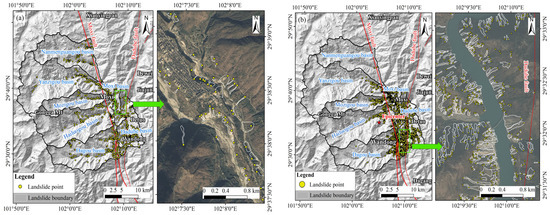
Figure 3.
Landslide distribution before and after the earthquake. (a) Pre-earthquake landslide location distribution; (b) Co-seismic landslide location distribution.
The co-seismic data revealed a total of 4284 landslides, comprising 950 loose accumulation layer landslides and 3334 rocky landslides, with a collective area of 15.22 km2. The landslides ranged from the largest area of 224,917 m2 to the smallest area of 26 m2, with an average area of approximately 3552 m2. The LND was calculated at 4.53, with an LAD of 1.61%. High-density landslide areas were predominantly concentrated in regions categorized as IX intensity levels and on the eastern side of the seismic fault. Additionally, 1009 landslides with an area of approximately 7.54 km2 were added from previous studies where cloud cover hindered identification [7].
Comparing the two inventories, the number of co-seismic landslides increased by 3086, with the total area expanding by 9.92 km2 compared to the pre-earthquake dataset. Notably, the Luding Ms 6.8 earthquake reactivated 550 pre-earthquake landslides, increasing the total landslide area from 2.76 km2 to 5.41 km2.
Due to the large number of landslides in the study area, it was difficult to determine the thickness of each landslide through field investigation, so only the area of landslides was recorded, as detailed in Table 2. There were 1088 pre-earthquake landslides with areas < 104 m2, 106 with areas between 104 and 105 m2, and 4 with areas between 105 and 106 m2. In the co-seismic inventory, there were 3977 landslides with areas < 104 m2, 298 with areas between 104 and 105 m2, and 9 with areas between 105 and 106 m2. Although the number of co-seismic landslides is large, their scale is small, mainly small- and medium-sized, consistent with the scale of landslides before the earthquake.
Table 2.
Landslide disaster area-distribution statistics.
To understand the impact of different basins on the eastern slope of Gongga Mountain, the study area was divided into seven regions: the Dagou basin, Hailougou basin, Mozigou basin, Yanzigou basin, Nanmenguangou basin, Moxi basin, and Dadu River basin. Statistical results showed that before the Luding earthquake, the Dadu River basin had the highest number of landslides and the largest area (299 landslides, 1.187 km2), while the Mozi basin had the lowest number of landslides and the smallest area (49 landslides, 0.154 km2). In the pre-earthquake landslide inventory, the largest landslide area was in the Yanzigou basin, while the smallest was in the Dadu River basin. Following the Luding Earthquake, the Dadu River basin recorded the highest number of landslides (1964), with the largest area observed in the Dagou basin (6.009 km2). In contrast, the Nanmenguan basin registered the lowest number of landslides with the smallest area (40.004 km2). In the co-seismic inventory, the largest landslide area was found in the Hailougou basin, while the smallest area was in the Dadu River basin. For detailed information on landslides in other subareas, please refer to Table 3.
Table 3.
Characteristics of typical basin landslide development on the eastern slope of Gongga Mountain before and after the earthquake.
3.2. Temporal Distribution
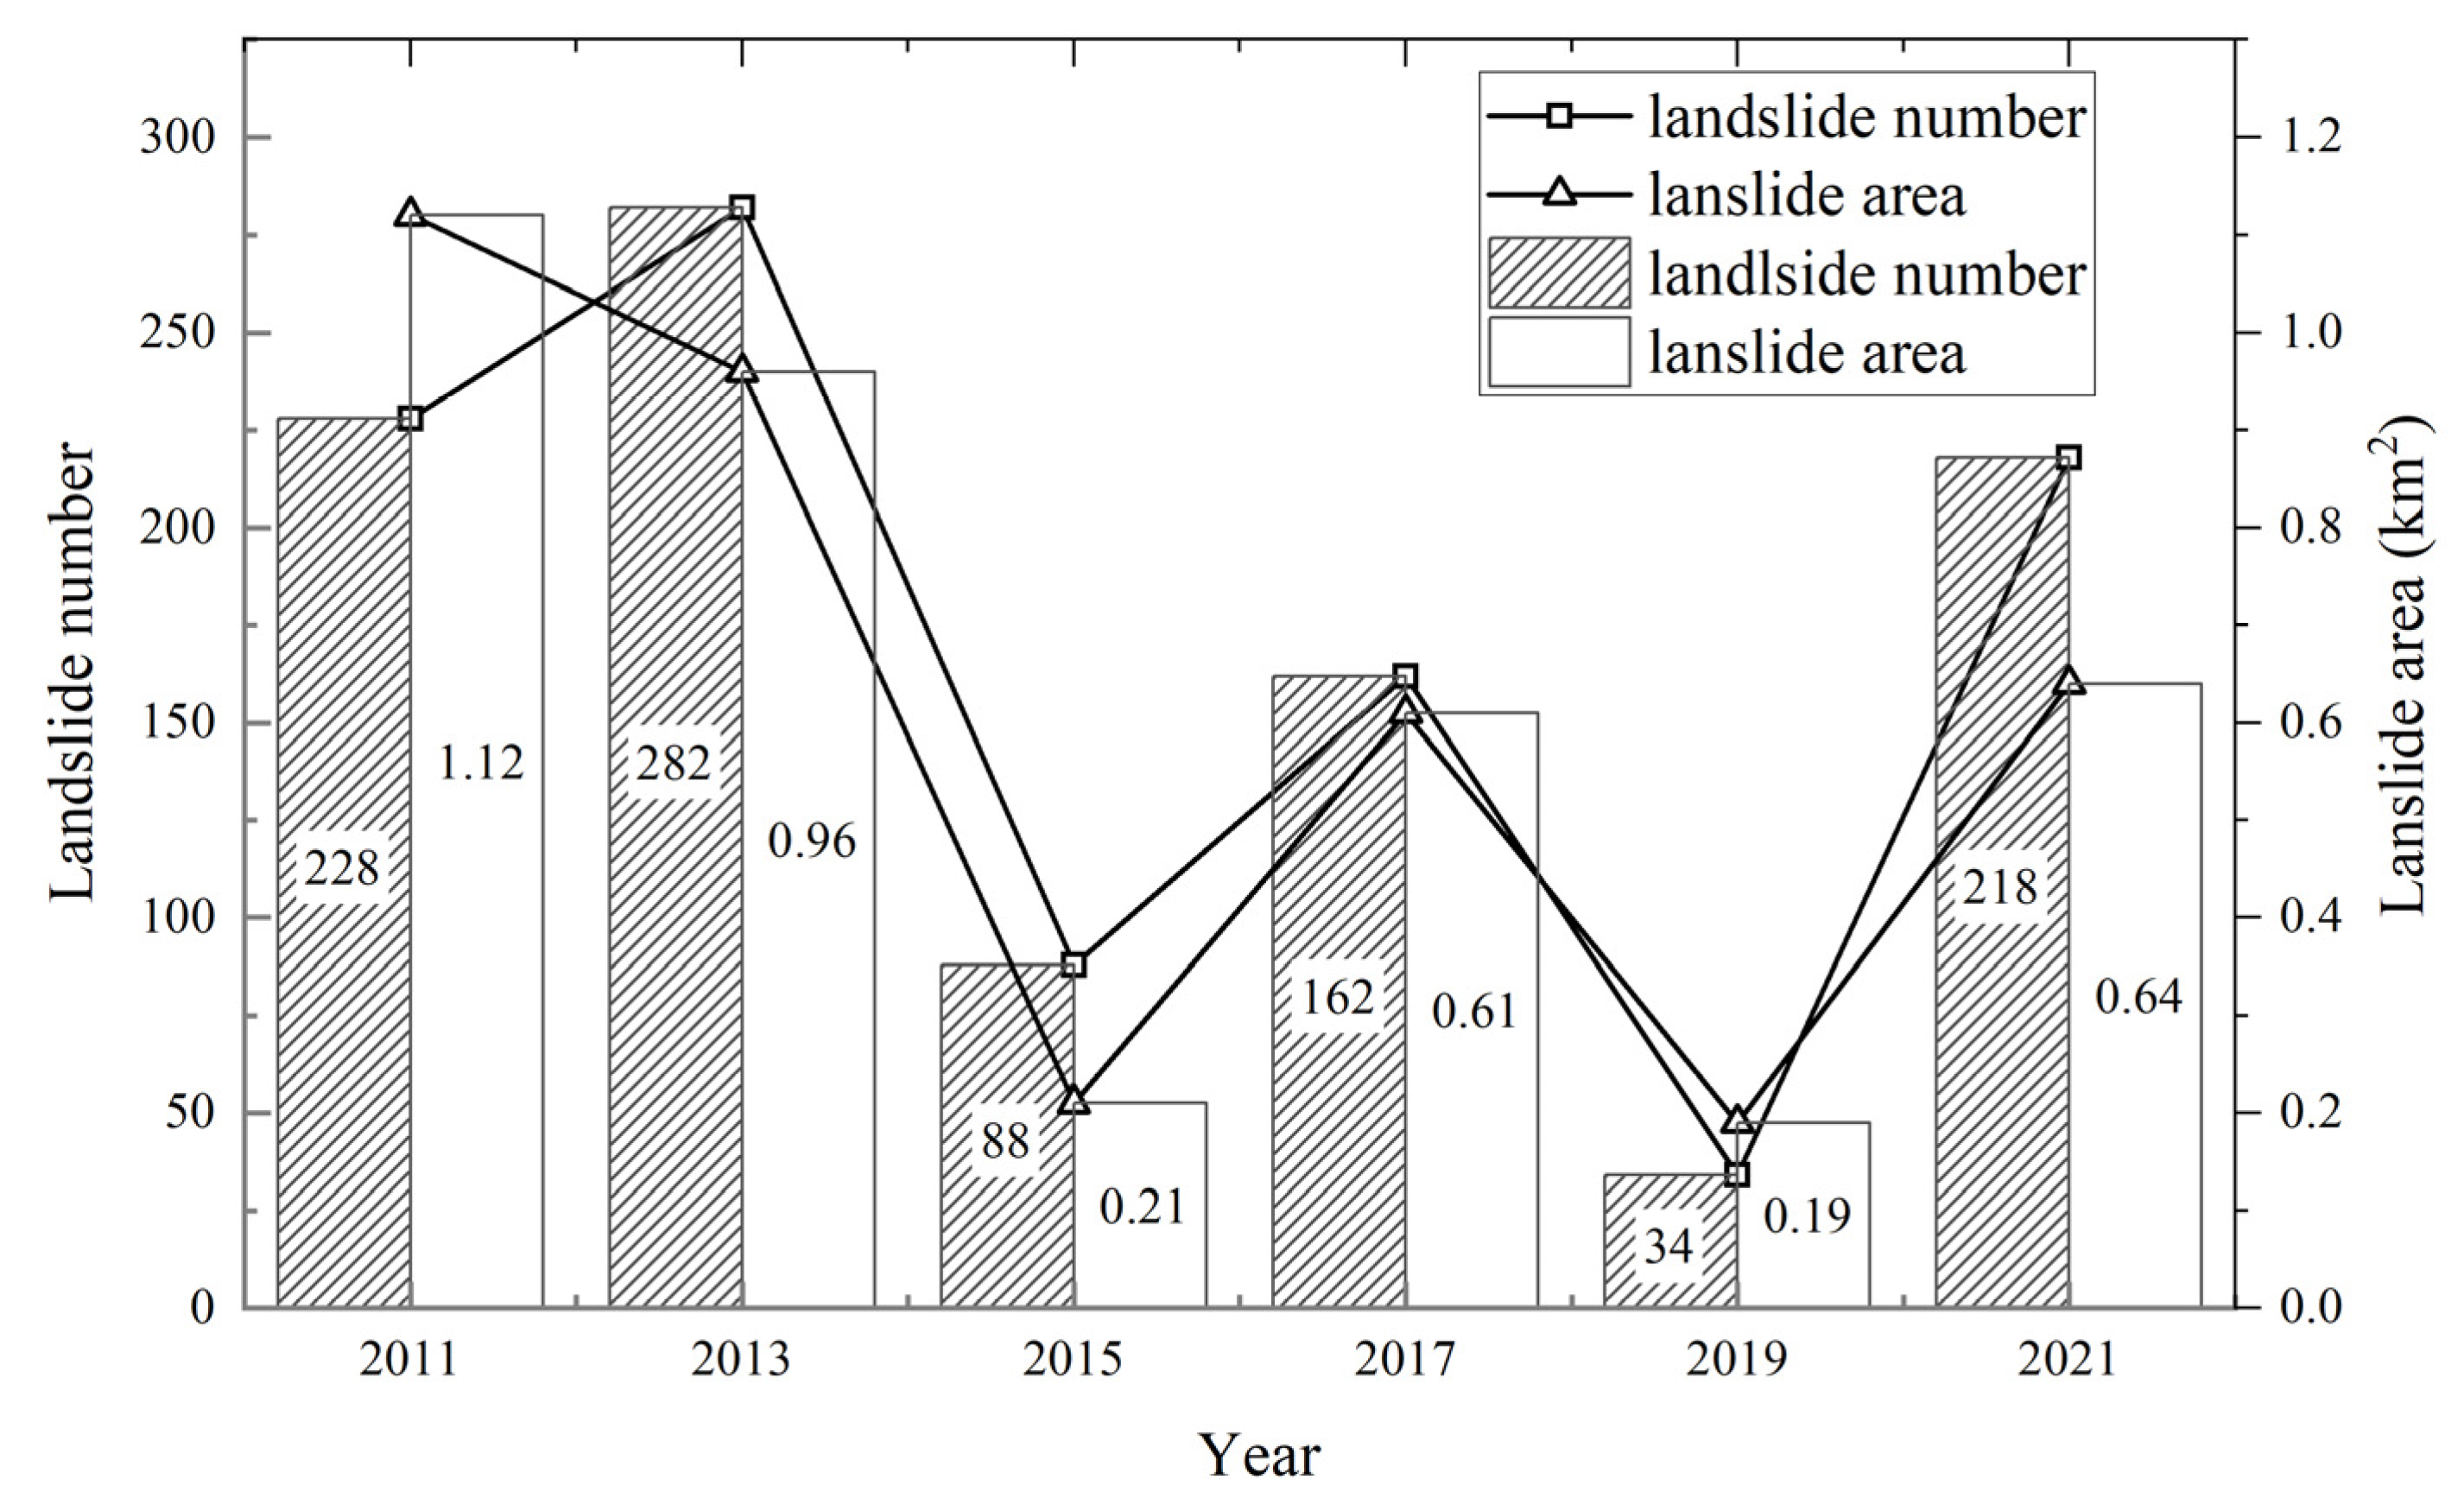
The remote-sensing data used for our analysis were obtained from Google Earth and covered the period from 2010 to 2022. To address gaps in image coverage for certain years, we grouped the imagery into biennial intervals and documented landslide occurrences within each timeframe. Considering that the 2010 imagery includes landslides from that year and previous years within the study area, and considering that the Luding Ms 6.8 earthquake occurred in 2022, the number of landslides observed has significantly increased. Therefore, landslides identified in the 2010 (186) and 2022 (4298) images have been excluded from our analysis. The results are presented in Figure 4.
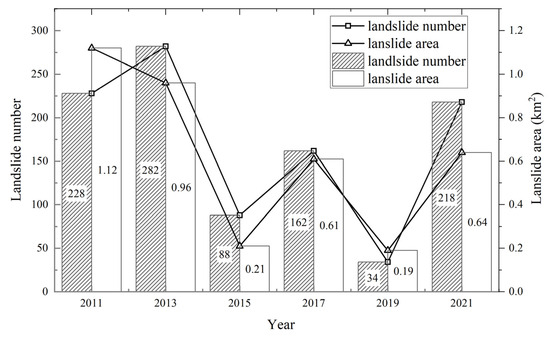
Figure 4.
Statistics on the number of landslides developed, 2011–2021.
The highest number of newly detected landslides occurred in 2012–2013, totaling 282, while the lowest number was recorded in 2018–2019, with 34 landslides. Before the Luding earthquake in September 2022, a fluctuating trend in landslide occurrence over time was observed in the study area. Field surveys of documented disaster sites indicated that landslides in the region primarily belonged to the rainfall-seismic category. Additionally, there was a notable rise in landslides around 2013 due to activities such as road construction and slope cutting. It is postulated that the interplay of rainfall, seismic events, and human alterations to the terrain contributed to this phenomenon.
3.3. Topographic Factors
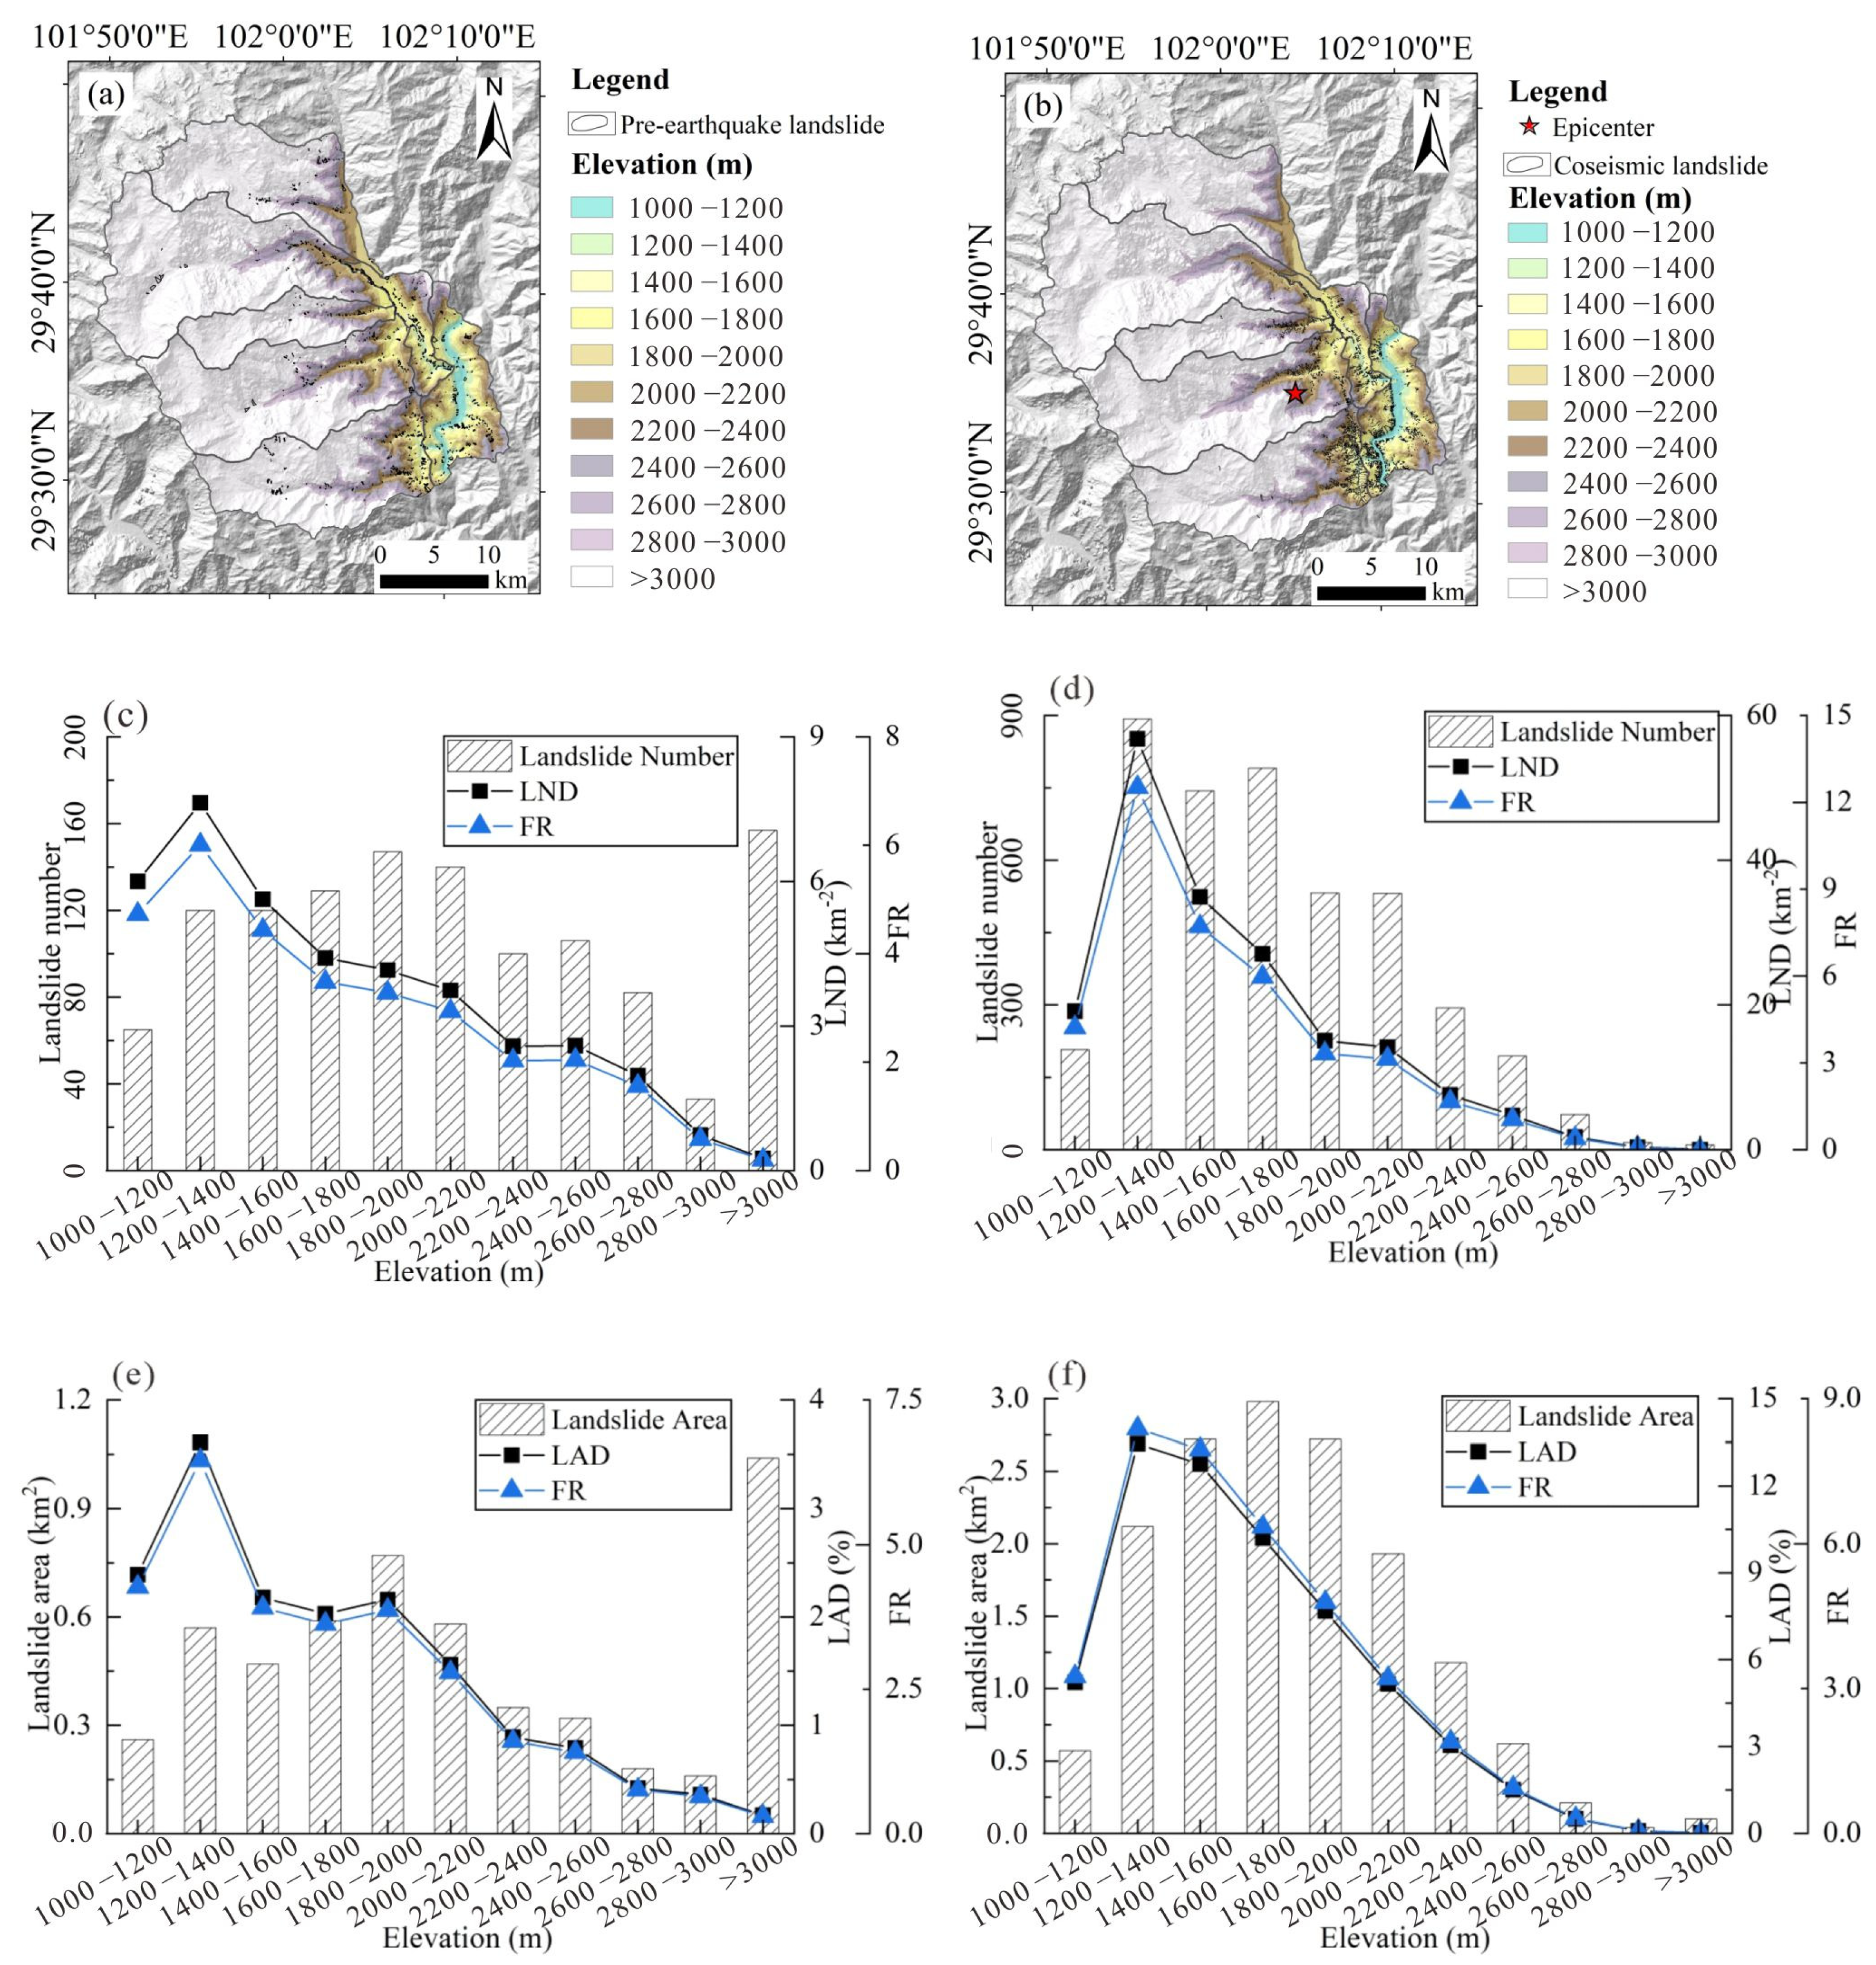
We classified the elevations within the study area, ranging from 1020 to 7464 m, into 11 intervals at 200 m increments. The intervals above 3000 m were not further refined due to the limited occurrence of landslides in these higher elevation zones. The number and extent of landslides within each elevation interval prior to the earthquake were documented, and factors such as LAD, LND, and FR were calculated accordingly. The results of these calculations are depicted in Figure 5. For the pre-earthquake landslide inventory, the number and area of landslides in the >3000 m range reached the maximum value (157 landslides, 1.04 km2), while LAD and LND reached their maximum values in the 1200–1400 m range (7.63, 3.61%), and FR also reached its maximum value in the 1200–1400 m range (6.01, 6.46) based on landslide points and landslide areas. These results indicate that before the Luding earthquake, although the number and area of landslides were larger in the >3000 m interval, the 1200–1400 m interval was the most prone to landslides on the eastern slope of Gongga Mountain.
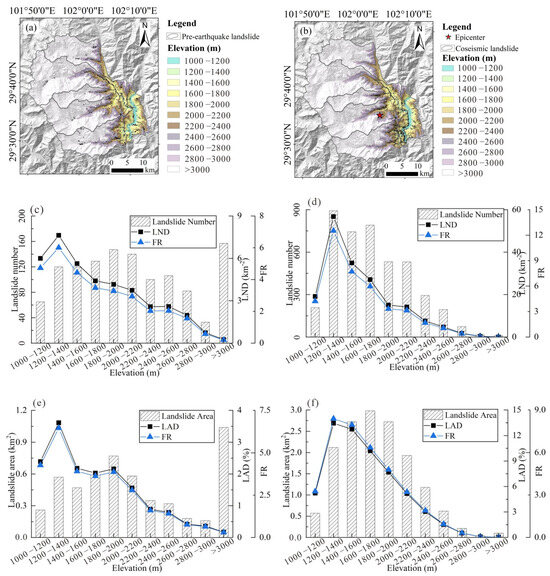
Figure 5.
Relationship between elevation and FR, LND, and LAD. (a,b) are elevation factor partitions; (c,e) are results of pre-earthquake data analysis; (d,f) are results of co-seismic data analysis.
In the co-seismic landslide inventory, the maximum values for LND and LAD were also observed between 1200 and 1400 m, with 893 landslides (56.77% and 13.45%, respectively). The findings regarding the frequency ratio (FR) were consistent with the pre-earthquake analyses, with FR values for landslide points and areas also reaching their maximum in the 1200–1400 m range (12.52, 8.38). Therefore, comprehensive analyses concluded that, for both the pre-earthquake and co-seismic events, the LAD, LND, and FR in the 1200–1400 m elevation range reached their maximum value, indicating this interval as a high-incidence area for landslides on the eastern slope of Gongga Mountain.
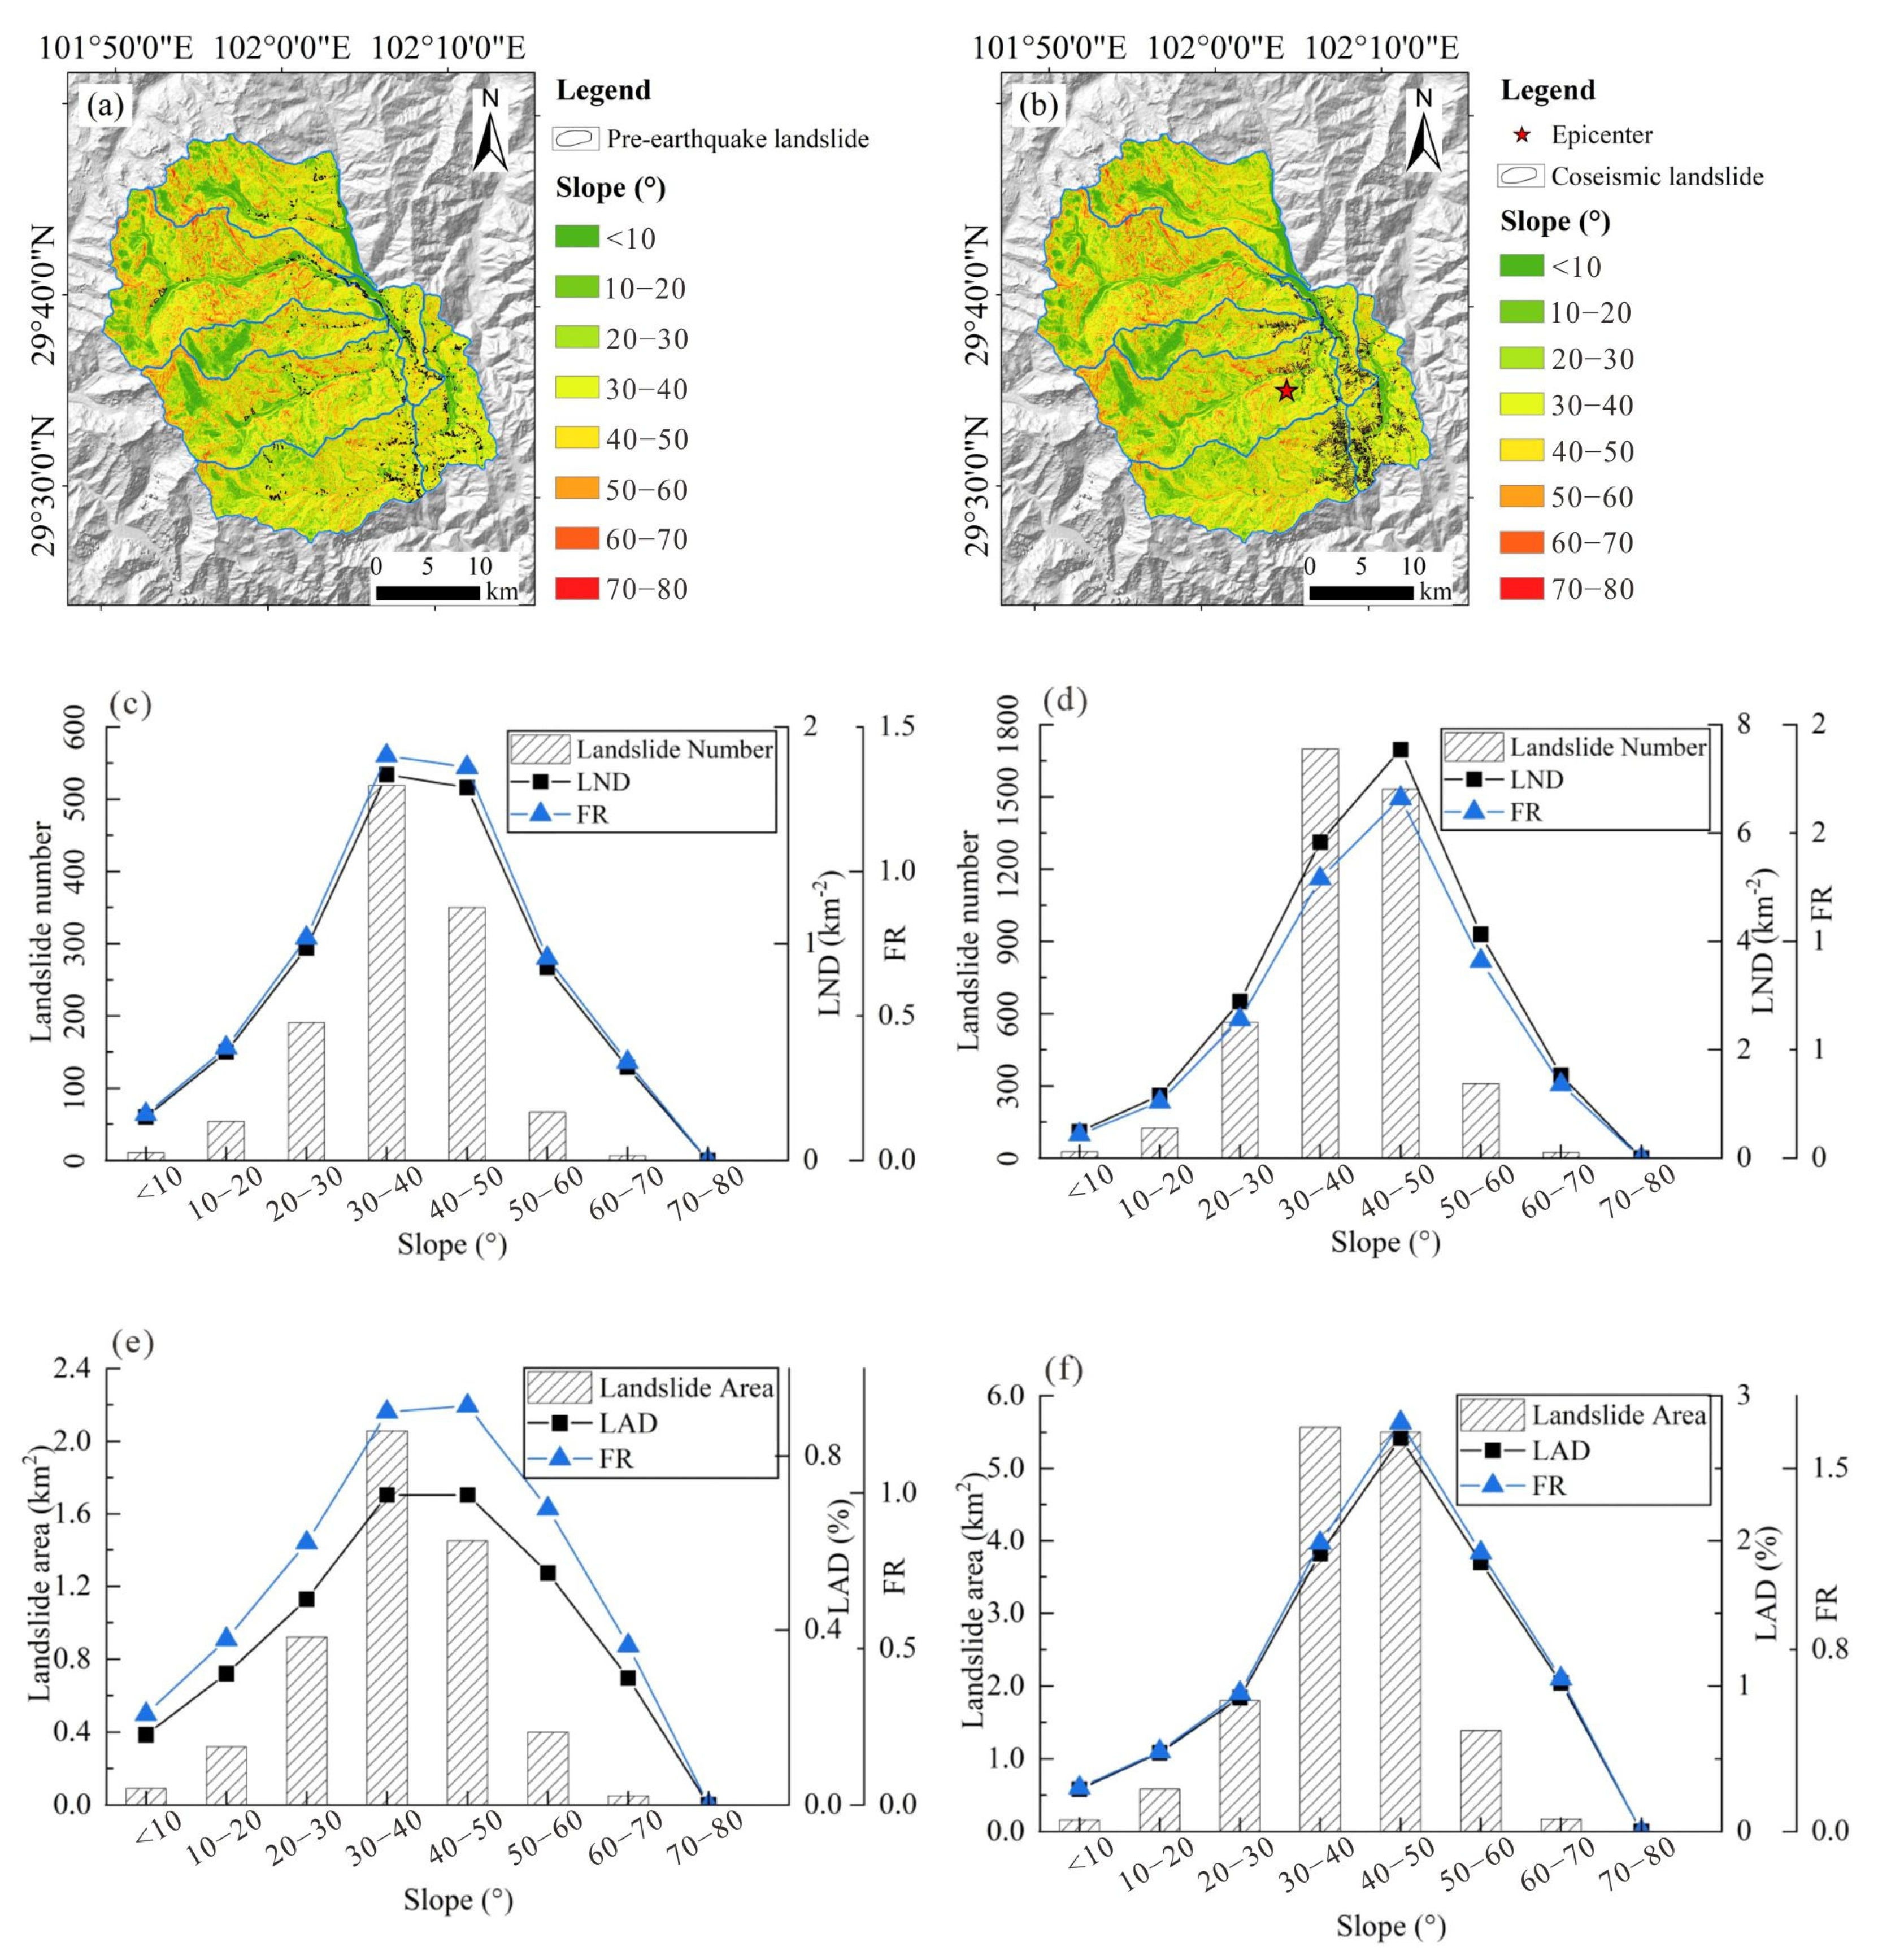
The study area is an alpine valley geomorphological area where crustal uplift and river erosion have resulted in steep slopes, with slopes on the eastern slope of Gongga Mountain reaching up to 80°. We divided the slopes in the study area into eight intervals at 10° increments and calculated LAD, LND, and FR for the pre-earthquake and co-seismic landslides, as shown in Figure 6. The pre-earthquake landslide inventory results indicate that slope has a controlling effect on landslide development. As the slope increases, LAD, LND, and FR exhibit an “increasing then decreasing” trend, reaching their maximum values in the 30–50° interval. Only the 30–40° and 40–50° sections had FR > 1, indicating that slopes of 30–50° are the most prone to landslides. The co-seismic landslide inventory results were consistent with the pre-earthquake analyses. As the slope increased, the number and area of co-seismic landslides, LAD, LND, and FR followed a similar “increasing then decreasing” trend, with maximum values in the 30–50° interval. This suggests that the 30–50° interval is also prone to co-seismic landslides. By superimposing the spatial distribution of 30–50° slopes with remote-sensing images, it was found that this slope range is mainly located on both sides of the Dadu River basin and in the high mountainous area. These areas are affected by river erosion, resulting in steeper slopes and significant rock body unloading, making landslides more likely in this slope interval.
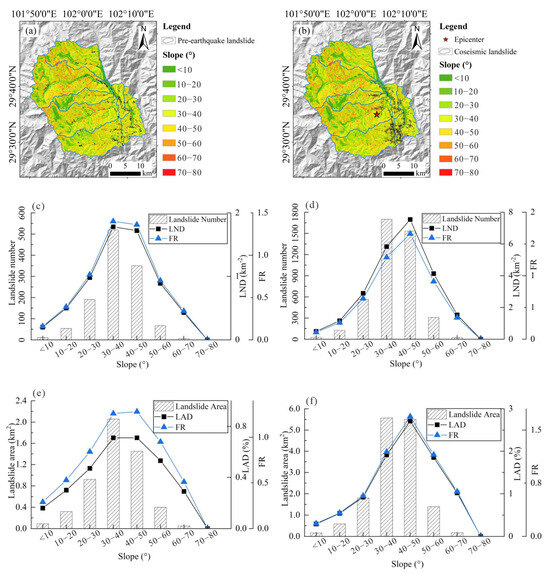
Figure 6.
Relationship between slope and FR, LND, and LAD. (a,b) are slope factor partitions; (c,e) are results of pre-earthquake data analysis; (d,f) are results of co-seismic data analysis.
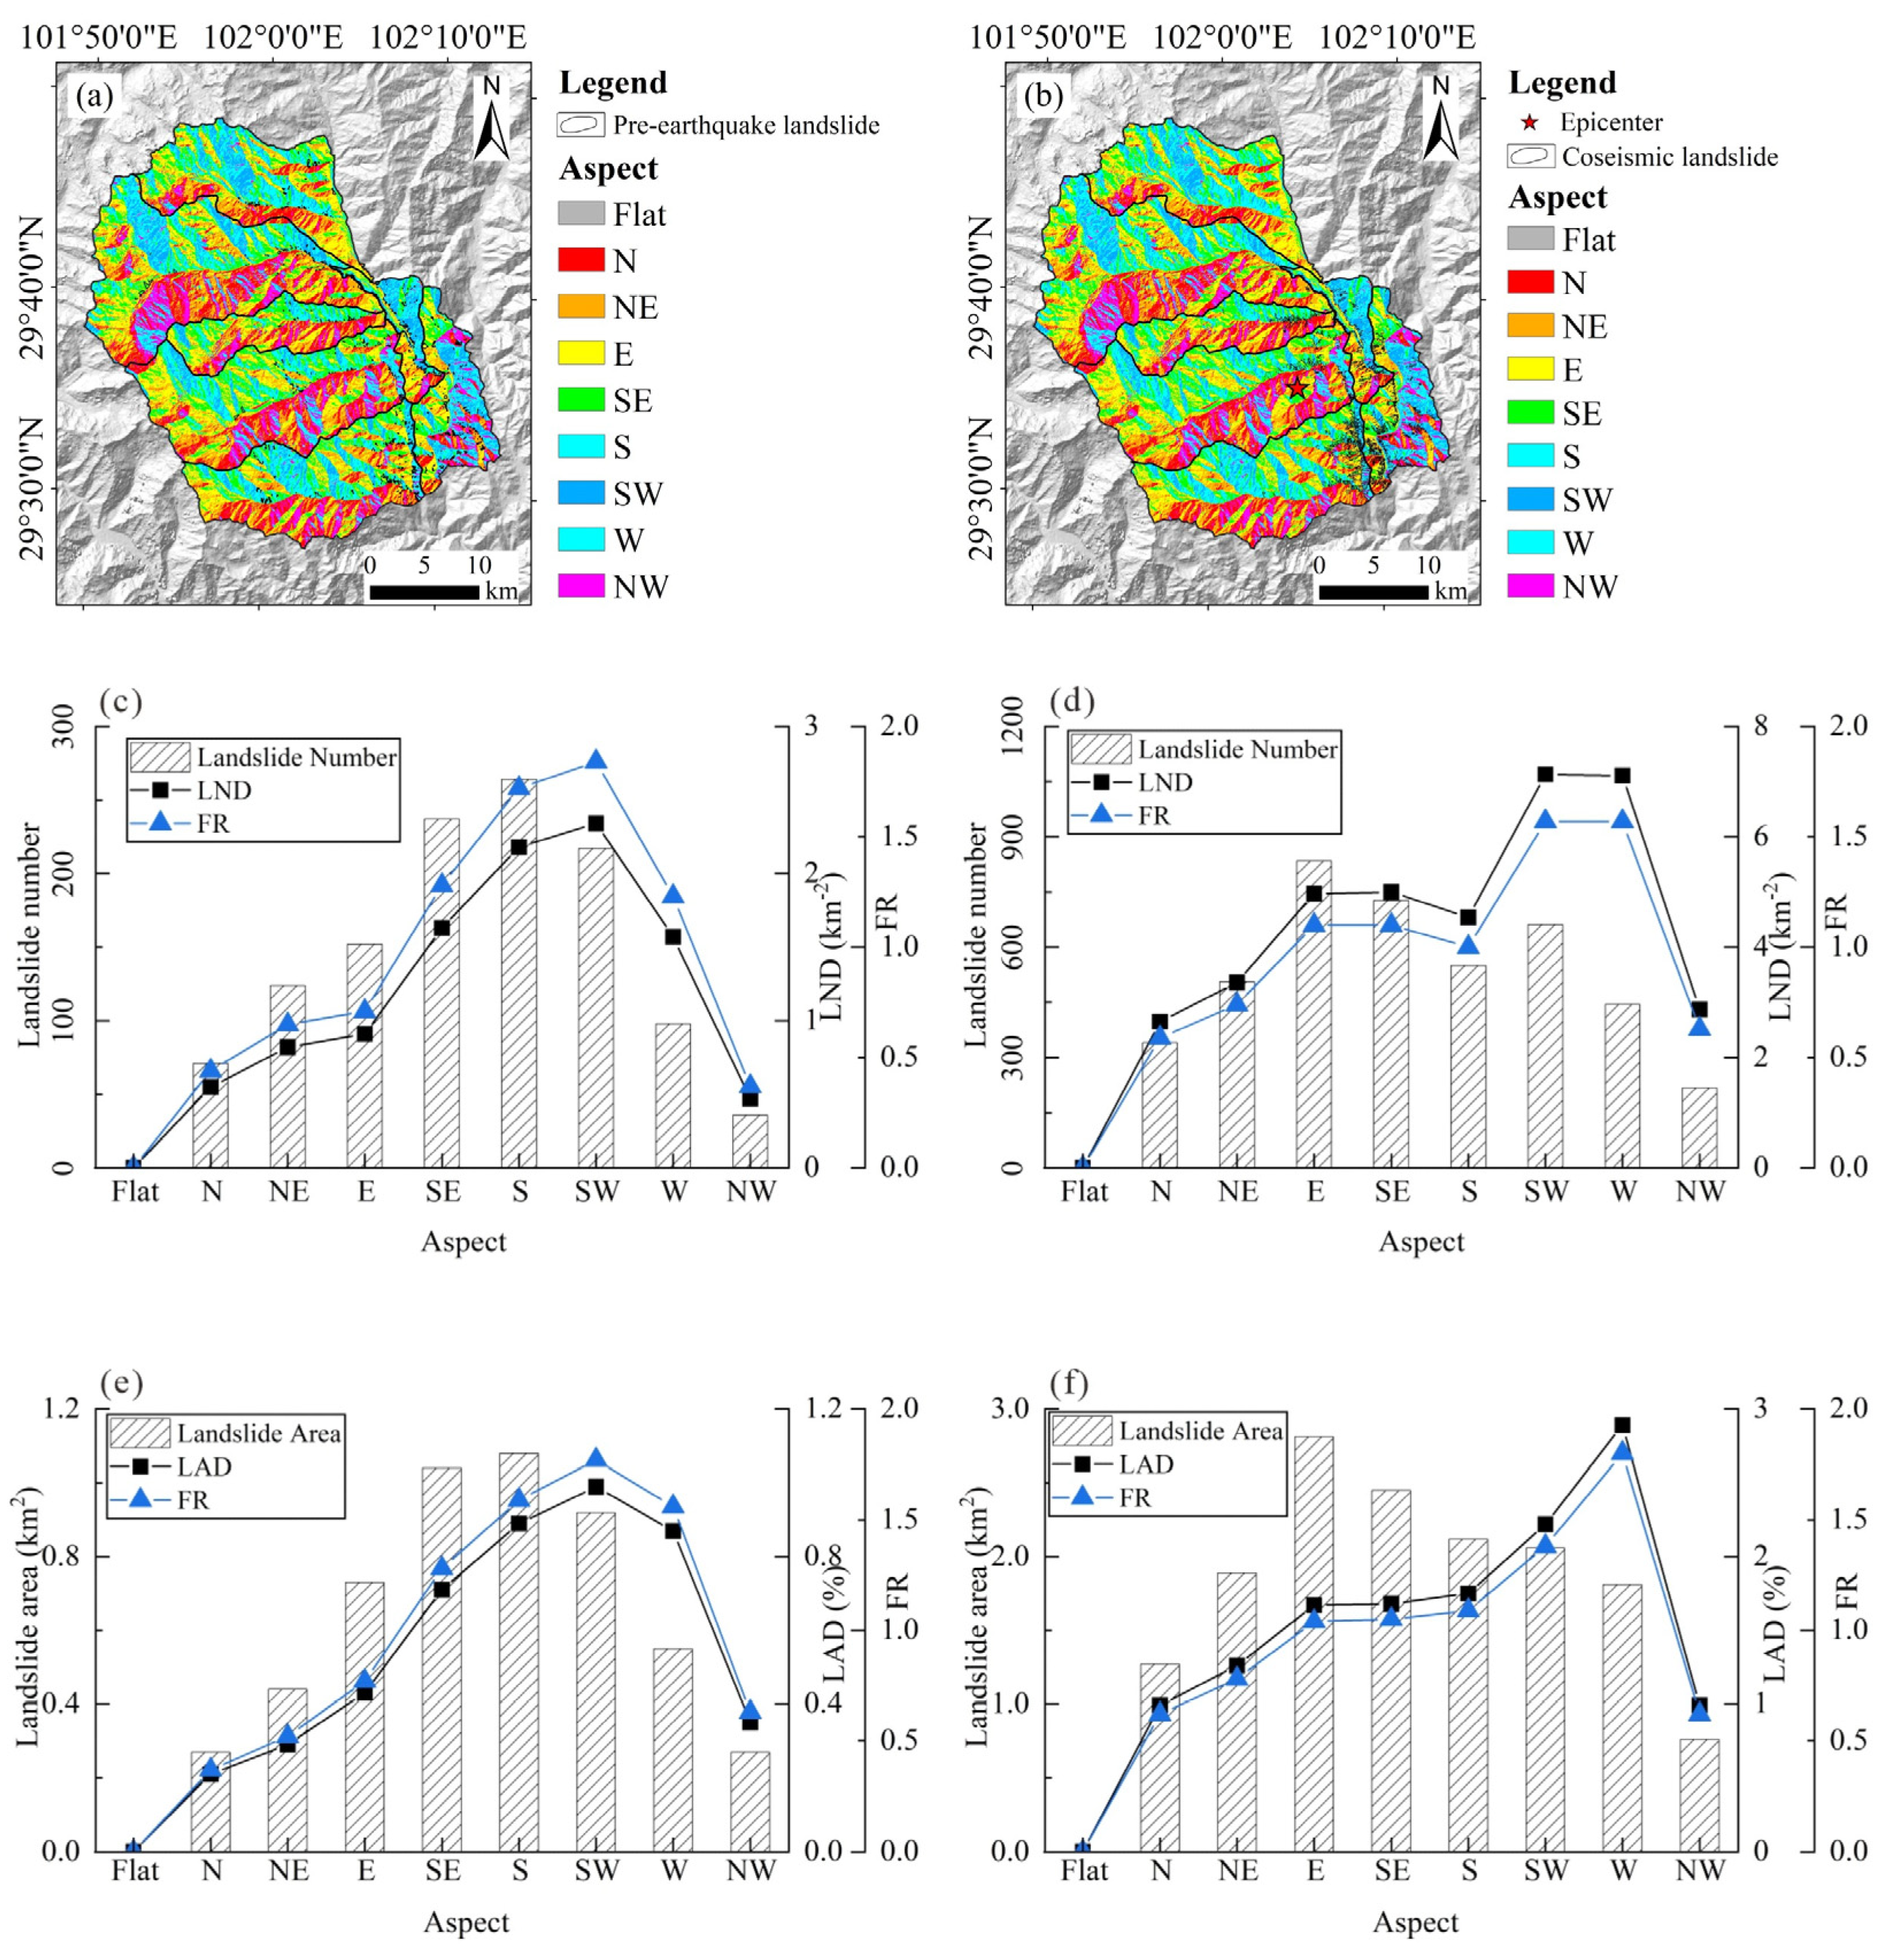
The intensity of solar radiation contributes to the formation of local microclimates and can induce landslides. To statistically relate the aspect to landslides, the study area was divided into nine categories based on the GIS platform: flat, north (N), northeast (NE), east (E), southeast (SE), south (S), southwest (SW), west (W), and northwest (NW). Figure 7 shows the LAD, LND, and FR of each aspect classification before the earthquake. It was found that landslides before the earthquake were most prominent in the SW direction, with a maximum LND of 2.34, a maximum LAD of 0.99%, and FR of 1.84 and 1.77, respectively.
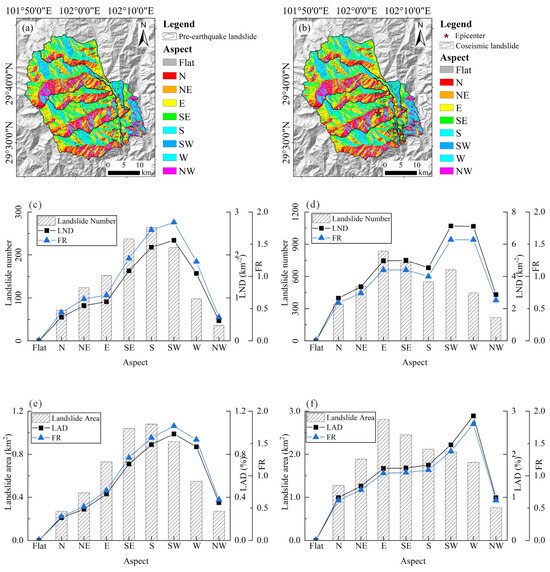
Figure 7.
Relationship between aspect and FR, LND, and LAD. (a,b) are slope orientation factor partitions; (c,e) are results of pre-earthquake data analysis; (d,f) are results of co-seismic data analysis.
For co-seismic landslides, the maximum LND value appeared in the SW direction (7.13) with a frequency ratio of 1.57, while the maximum LAD value appeared in the W direction (2.89%) with a frequency ratio of 1.80. The comprehensive analysis indicates that the slope direction of new landslides with large areas was predominantly in the W direction during the earthquake, closely related to the seismic faults and seismic mechanisms of this event.
Topographic relief, also known as relative relief or relative height, reflects the complexity of slope microtopography. The more complex the slope’s microtopography, the more it affects the propagation of seismic waves, thereby influencing the development of landslides. We divided the topographic relief of the study area into seven intervals, <50 m, 50–100 m, 100–150 m, 150–200 m, 200–250 m, 250–300 m, and >300 m, at intervals of 50 m. We then analyzed the development of pre-earthquake and co-seismic landslides, with results shown in Figure 8.
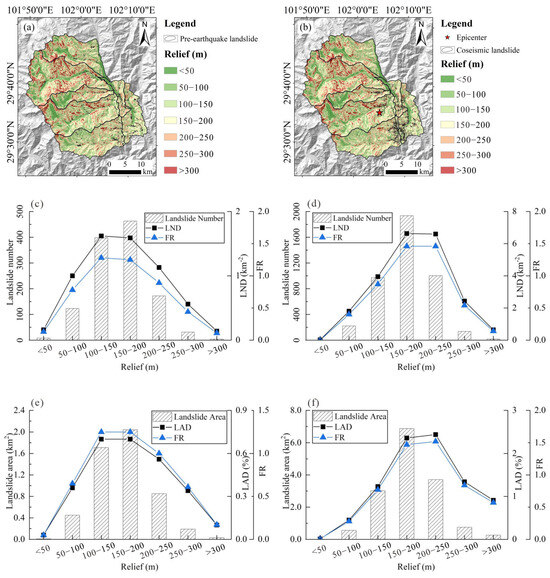
Figure 8.
Relationship between relief and FR, LND, and LAD. (a,b) are the topographic relief factor zones; (c,e) are the results of pre-earthquake data analysis; (d,f) are the results of co-seismic data analysis.
For the pre-earthquake landslide inventory, the number and area of landslides, LAD, LND, and FR increased and then decreased. Specifically, 398 landslides with a total area of approximately 1.71 km2 occurred in the 100–150 m interval, with FR values based on landslide points and areas reaching maximum values (1.28, 1.25), indicating this interval as the dominant interval for landslide development. The co-seismic results show a similar trend, but with the 150–200 m interval as the dominant interval for landslide development. In this interval, 1935 landslides developed, covering an area of about 6.88 km2. The LND was 6.63, the LAD was 2.36%, and the FR values based on points and areas were 1.46 and 1.47, respectively.
Comprehensive analysis shows that topographic relief has a controlling effect on landslide development in the study area, with 100–150 m being the dominant interval before the earthquake and 150–200 m being the dominant interval for co-seismic landslides. The development of landslides increases with the degree of topographic relief, both before and during the co-seismic events. Notably, the statistical results of the co-seismic landslides illustrate the amplification effect of seismic waves, where sudden changes in micro-geomorphology lead to an increase in the number and area of co-seismic landslides.
3.4. Geological Factors
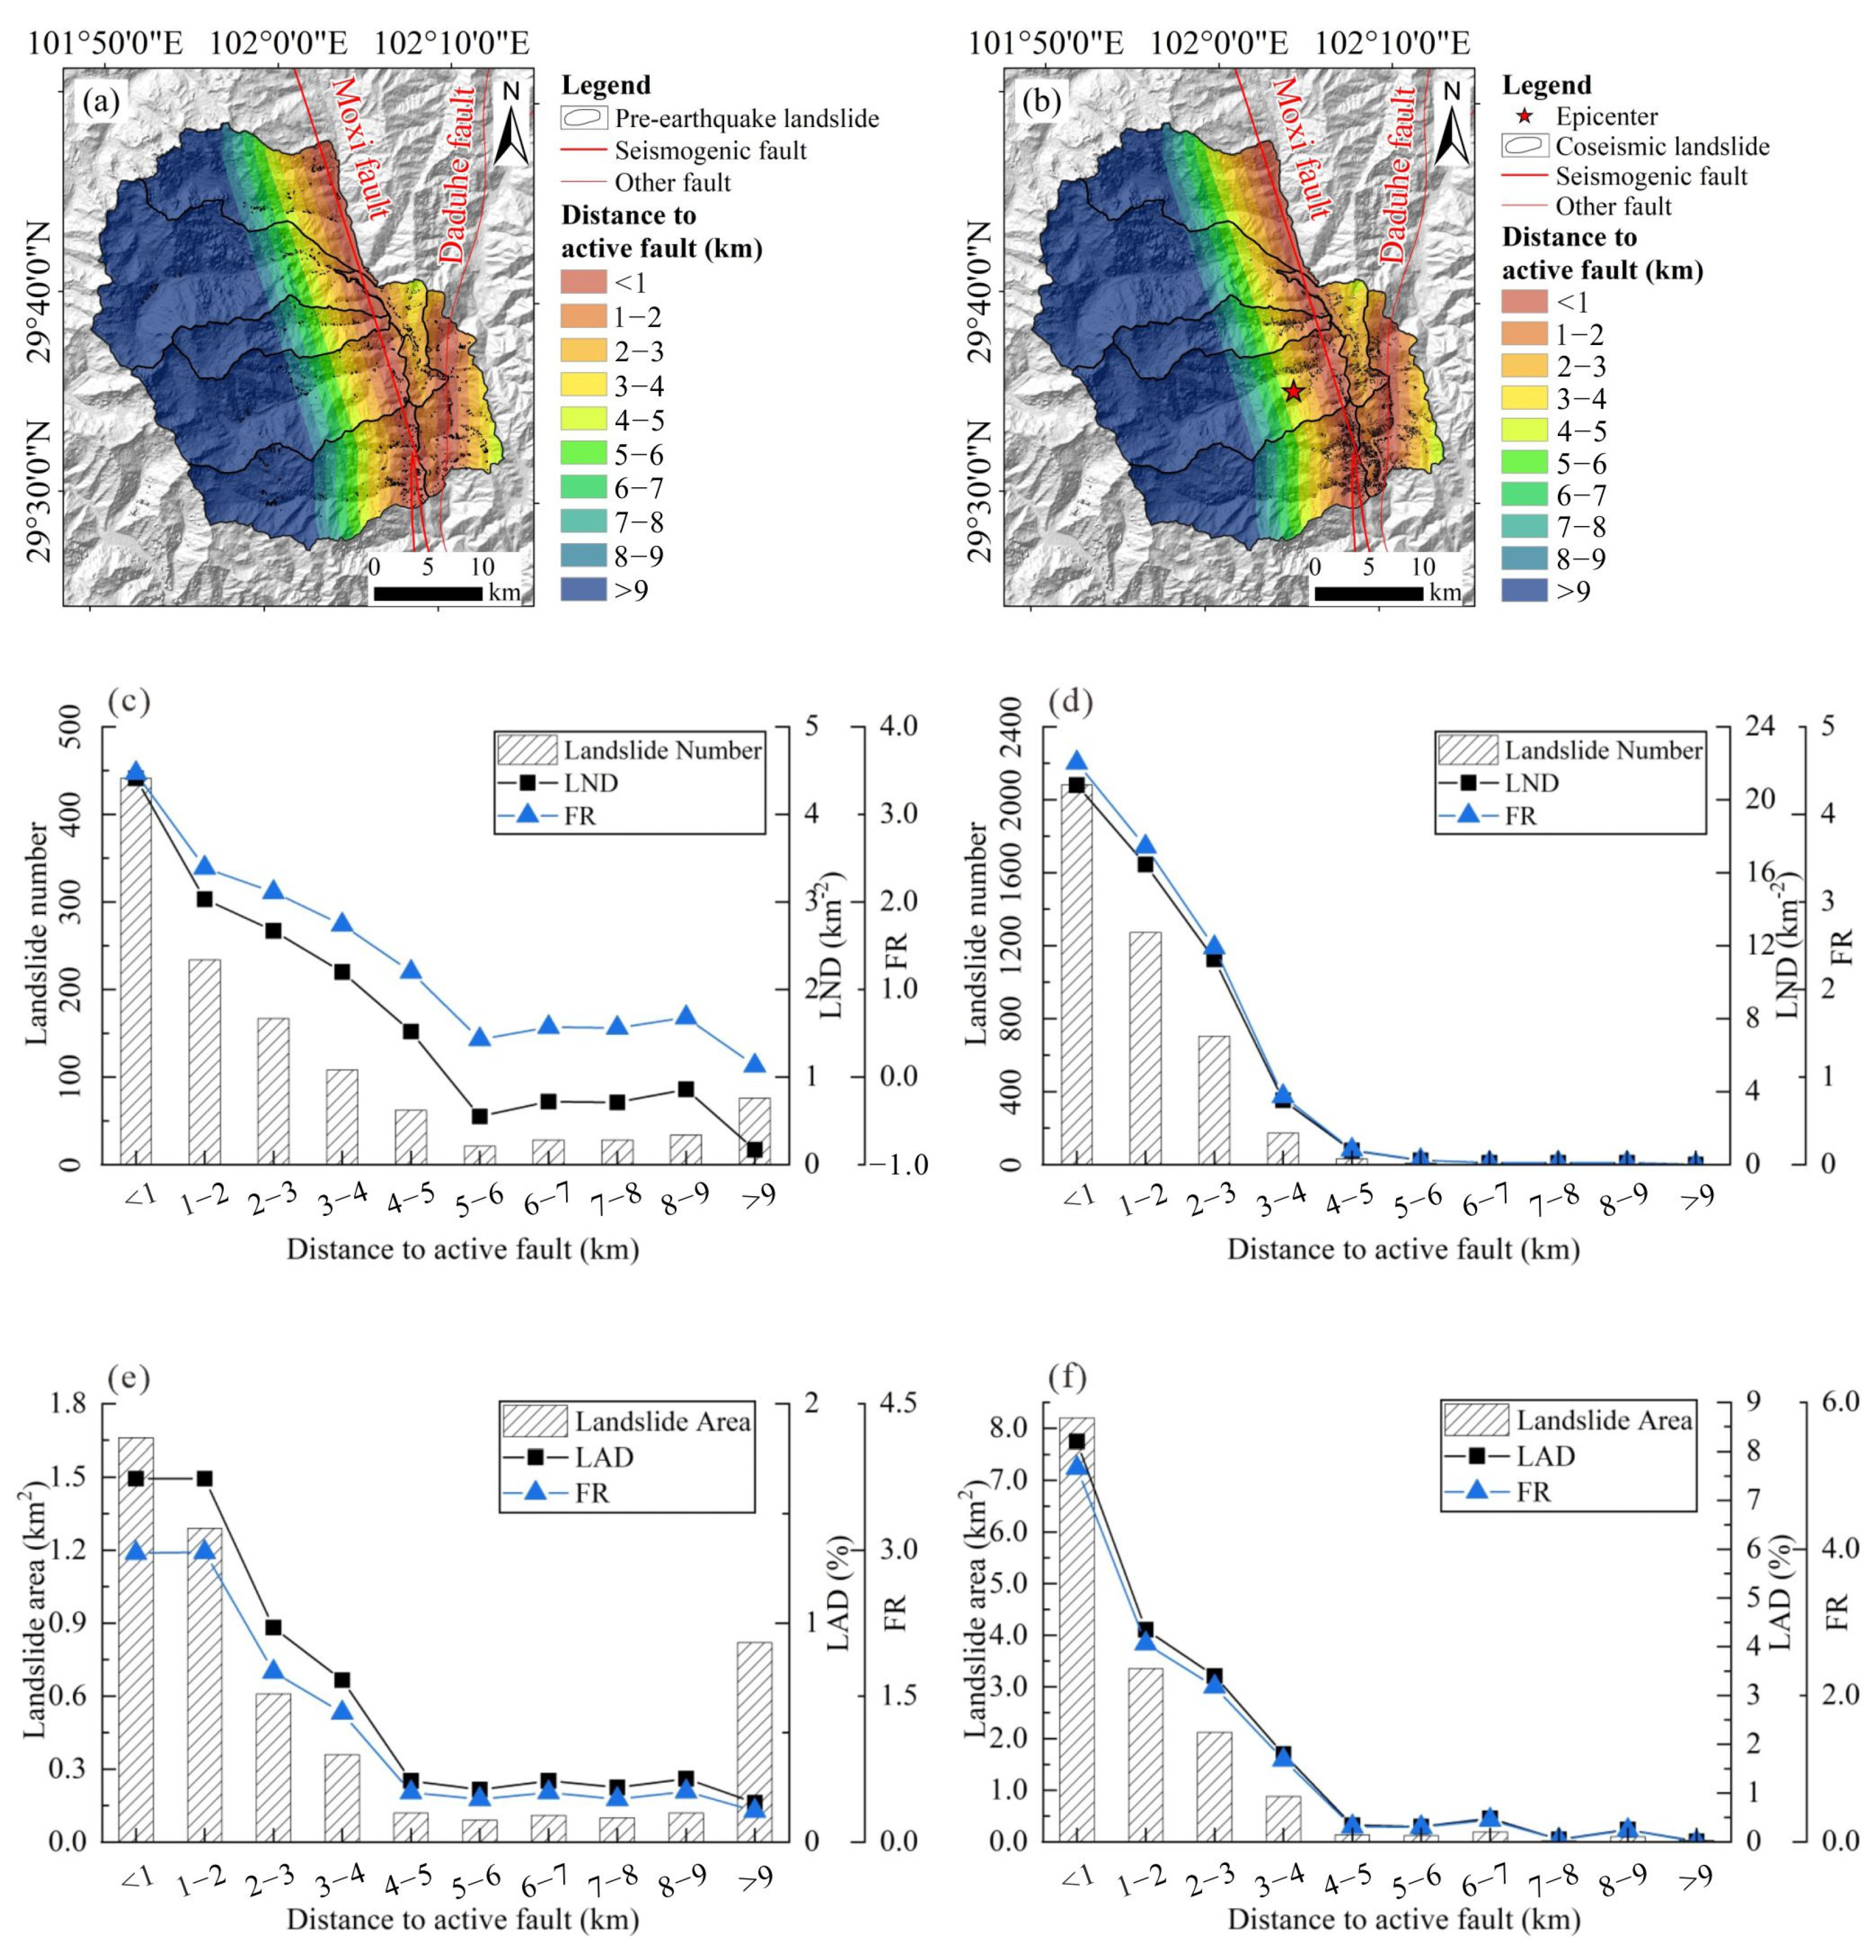
The Moxi Fault is the seismic fault associated with this earthquake. In addition, the Dadu River Fault also passes through the study area. Using ArcGIS 10.2 software, multiple buffers of active faults were established at 1 km intervals. Since the number of landslides beyond 9 km from the fault zone is relatively small, distances > 9 km were grouped together, resulting in a total of 10 buffer zones. The development of pre-earthquake and co-seismic landslides in each buffer zone was then analyzed, as shown in Figure 9.
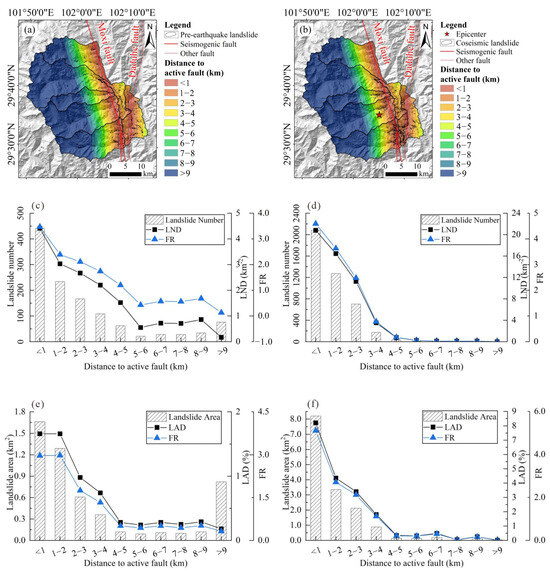
Figure 9.
Distance from active fault versus FR, LND, and LAD. (a,b) are the zoning of the distance from the active fault factor; (c,e) are the results of pre-earthquake data analysis; (d,f) are the results of co-seismic data analysis.
For the pre-earthquake inventory, landslide development in the study area shows a strong correlation with proximity to the fault. The closer the distance from the fault zone, the more landslides develop. Within 1 km of the fault, the number and area of landslides, LAD, and LND reached maximum values of 441, 1.66 km2, 4.41, and 1.66%, respectively. The FR also generally decreased with increasing distance from the fault zone, indicating that the fault zone has a controlling effect on landslide development. The rock mass near the fault zone is fractured and more prone to landslides due to external triggering factors.
For the co-seismic inventory, the controlling effect of the fracture is even more pronounced. As distance from the fault increases, LND, LAD, and FR show a strictly decreasing trend. The FR values for the co-seismic data are larger than those for the pre-earthquake data, indicating that fracturing activity readily induces landslides, and that the closer the fault zone, the higher the degree of landslide development.
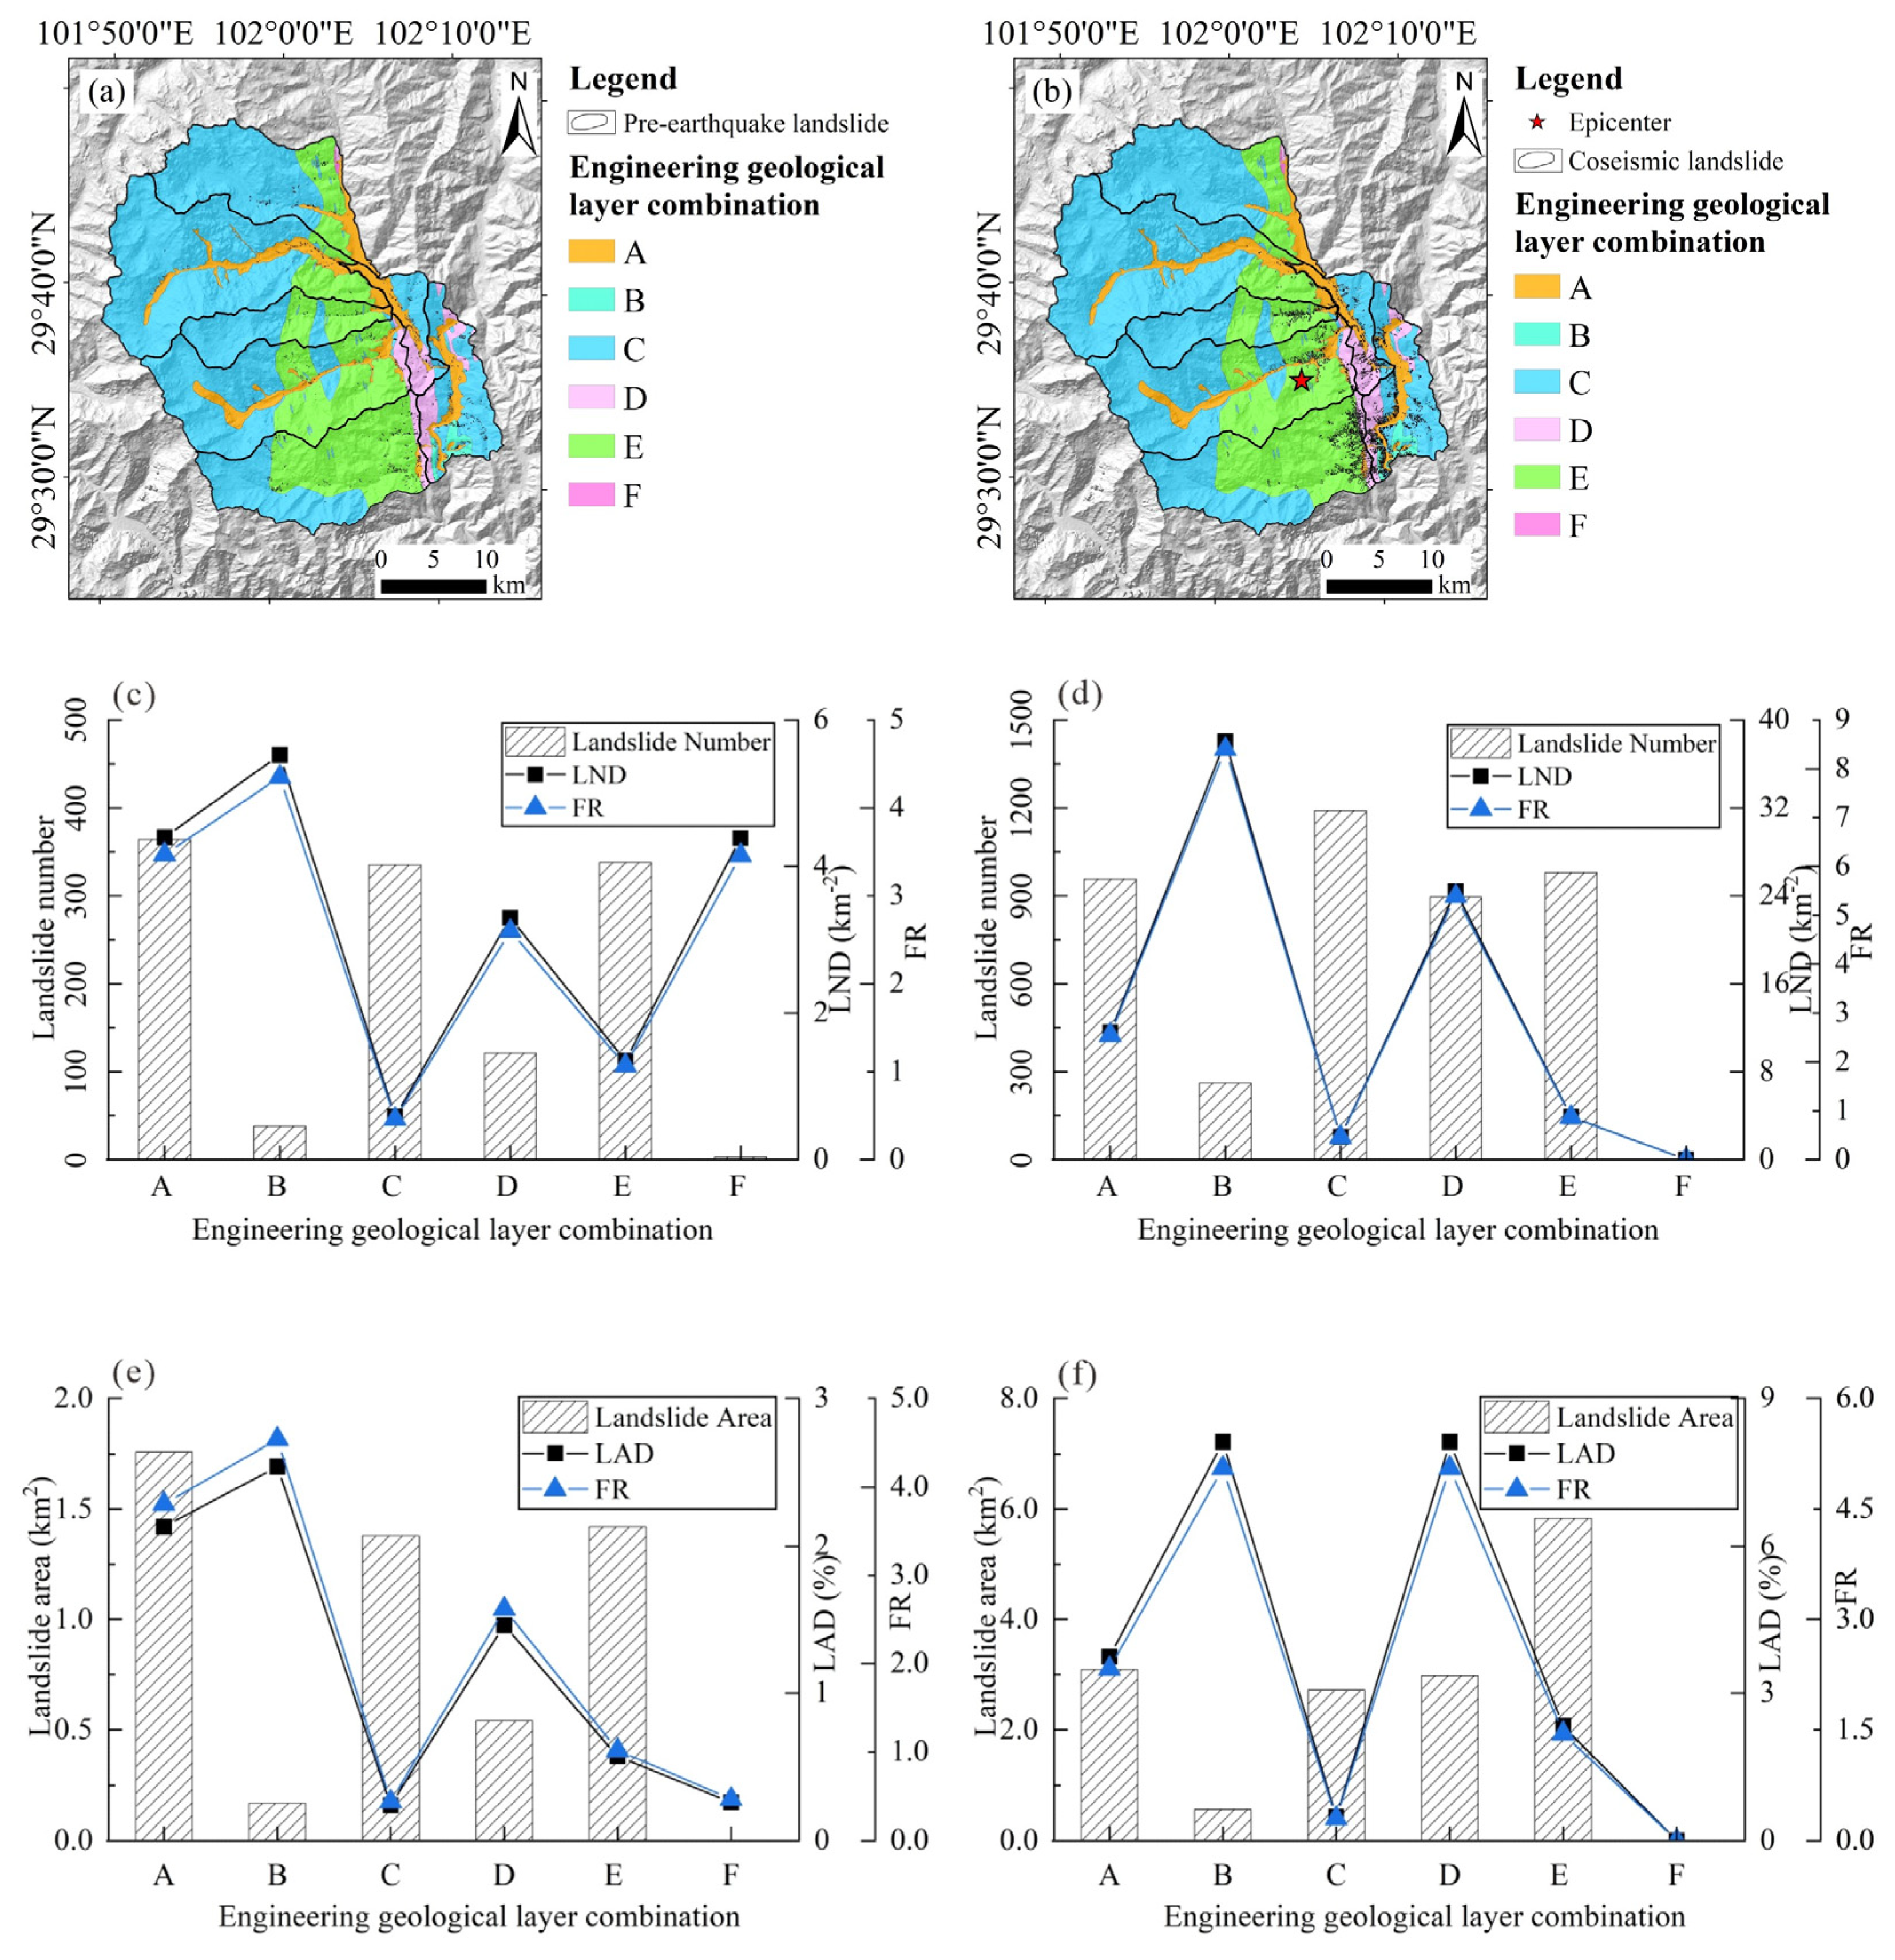
According to Table 1, engineering geological layer combinations in the study area were divided into six categories: A, B, C, D, E, and F. The basic conditions of landslide development, LAD, LND, and FR, were calculated for each engineering geological rock group, and the results are shown in Figure 10. For the pre-earthquake landslide inventory, landslides mainly occurred in Category A, with a total of 364 landslides and an area of about 1.76 km2. However, the maximum values of LAD, LND, and FR appeared in Category B, with LAD and LND values of 2.54% and 5.52, respectively, and FR values of 4.35 and 4.54 based on points and surfaces.
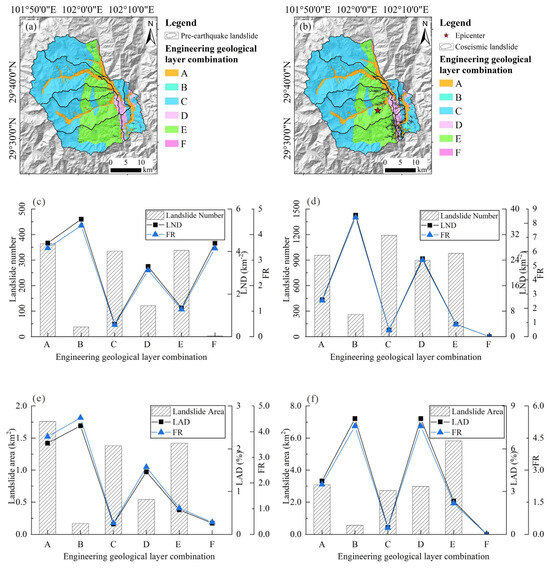
Figure 10.
Relationship between engineering geological rock group and FR, LND and LAD. (a,b) are engineering geological layer combination zones; (c,e) are the results of pre-earthquake data analysis; (d,f) are the results of co-seismic data analysis.
Co-seismic landslide distribution exhibited significant changes. Category C experienced the highest landslide frequency (1191 events), while Category D encompassed the largest landslide area (5.83 km2). However, the maximum LAD, LND, and FR were observed in Category B, with values of 8.12% and 38.06%, respectively, based on point and surface analysis. This suggests that Category B, characterized by engineering the geological rock group, is most susceptible to co-seismic landslides. Notably, a substantial number of landslides also occurred in Categories A and E, totaling 957 and 979, respectively.
By superimposing the distribution of engineering geological rock groups with the distribution of fractures, we find that the lithology near the Moxi Fracture and the Dadu River Fracture is mainly granite, syenite, and sandy slate. These rocks are generally hard, with block structures and high compressive strength. However, due to fracturing, they often exhibit mosaic or fracture structures, making landslides more likely in Category E. Category A, primarily composed of Quaternary loose accumulation layers, is mainly distributed along riverbanks. These loose rock bodies are more susceptible to destabilization and damage from seismic action.
3.5. Earthquake Factors
In examining the influencing factors on the co-seismic landslide inventory, we focused on two parameters that directly illustrate the impact of earthquakes on landslide distribution: distance to the epicenter and earthquake intensity. When investigating the correlation between epicenter distance and landslide distribution, we observed that the closest landslide clusters were within a radius of <2 km from the epicenter, while the farthest clusters extended beyond a radius of >16 km from the epicenter. Therefore, we set 2 km intervals for zone grouping and divided the study area into nine intervals (Figure 11). The results show that the values of FR, LAD, and LND tend to increase and then decrease with increasing distance from the epicenter. LAD reaches a maximum value of 4.71% in the 6–8 km interval, with an FR of 2.94 in this interval. LND reaches a maximum value of 13.09 in the 8–10 km interval, with an FR of 2.89. This result reflects the conduction effect of the earthquakes, indicating that landslides are not most developed in areas closest or farthest from the epicenter but within a specified distance threshold interval.
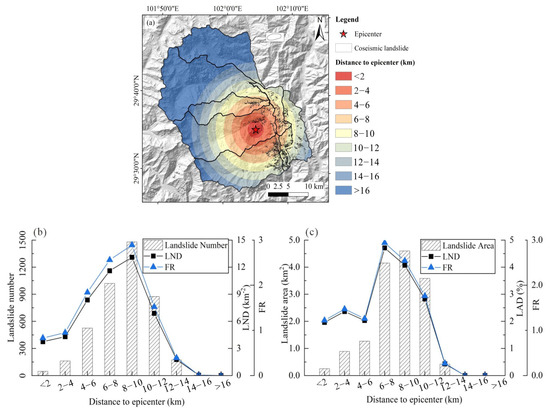
Figure 11.
Distance from epicenter versus FR, LND, and LAD. (a) Distance from epicenter factor partitioning; (b,c) results of co-seismic data analysis.
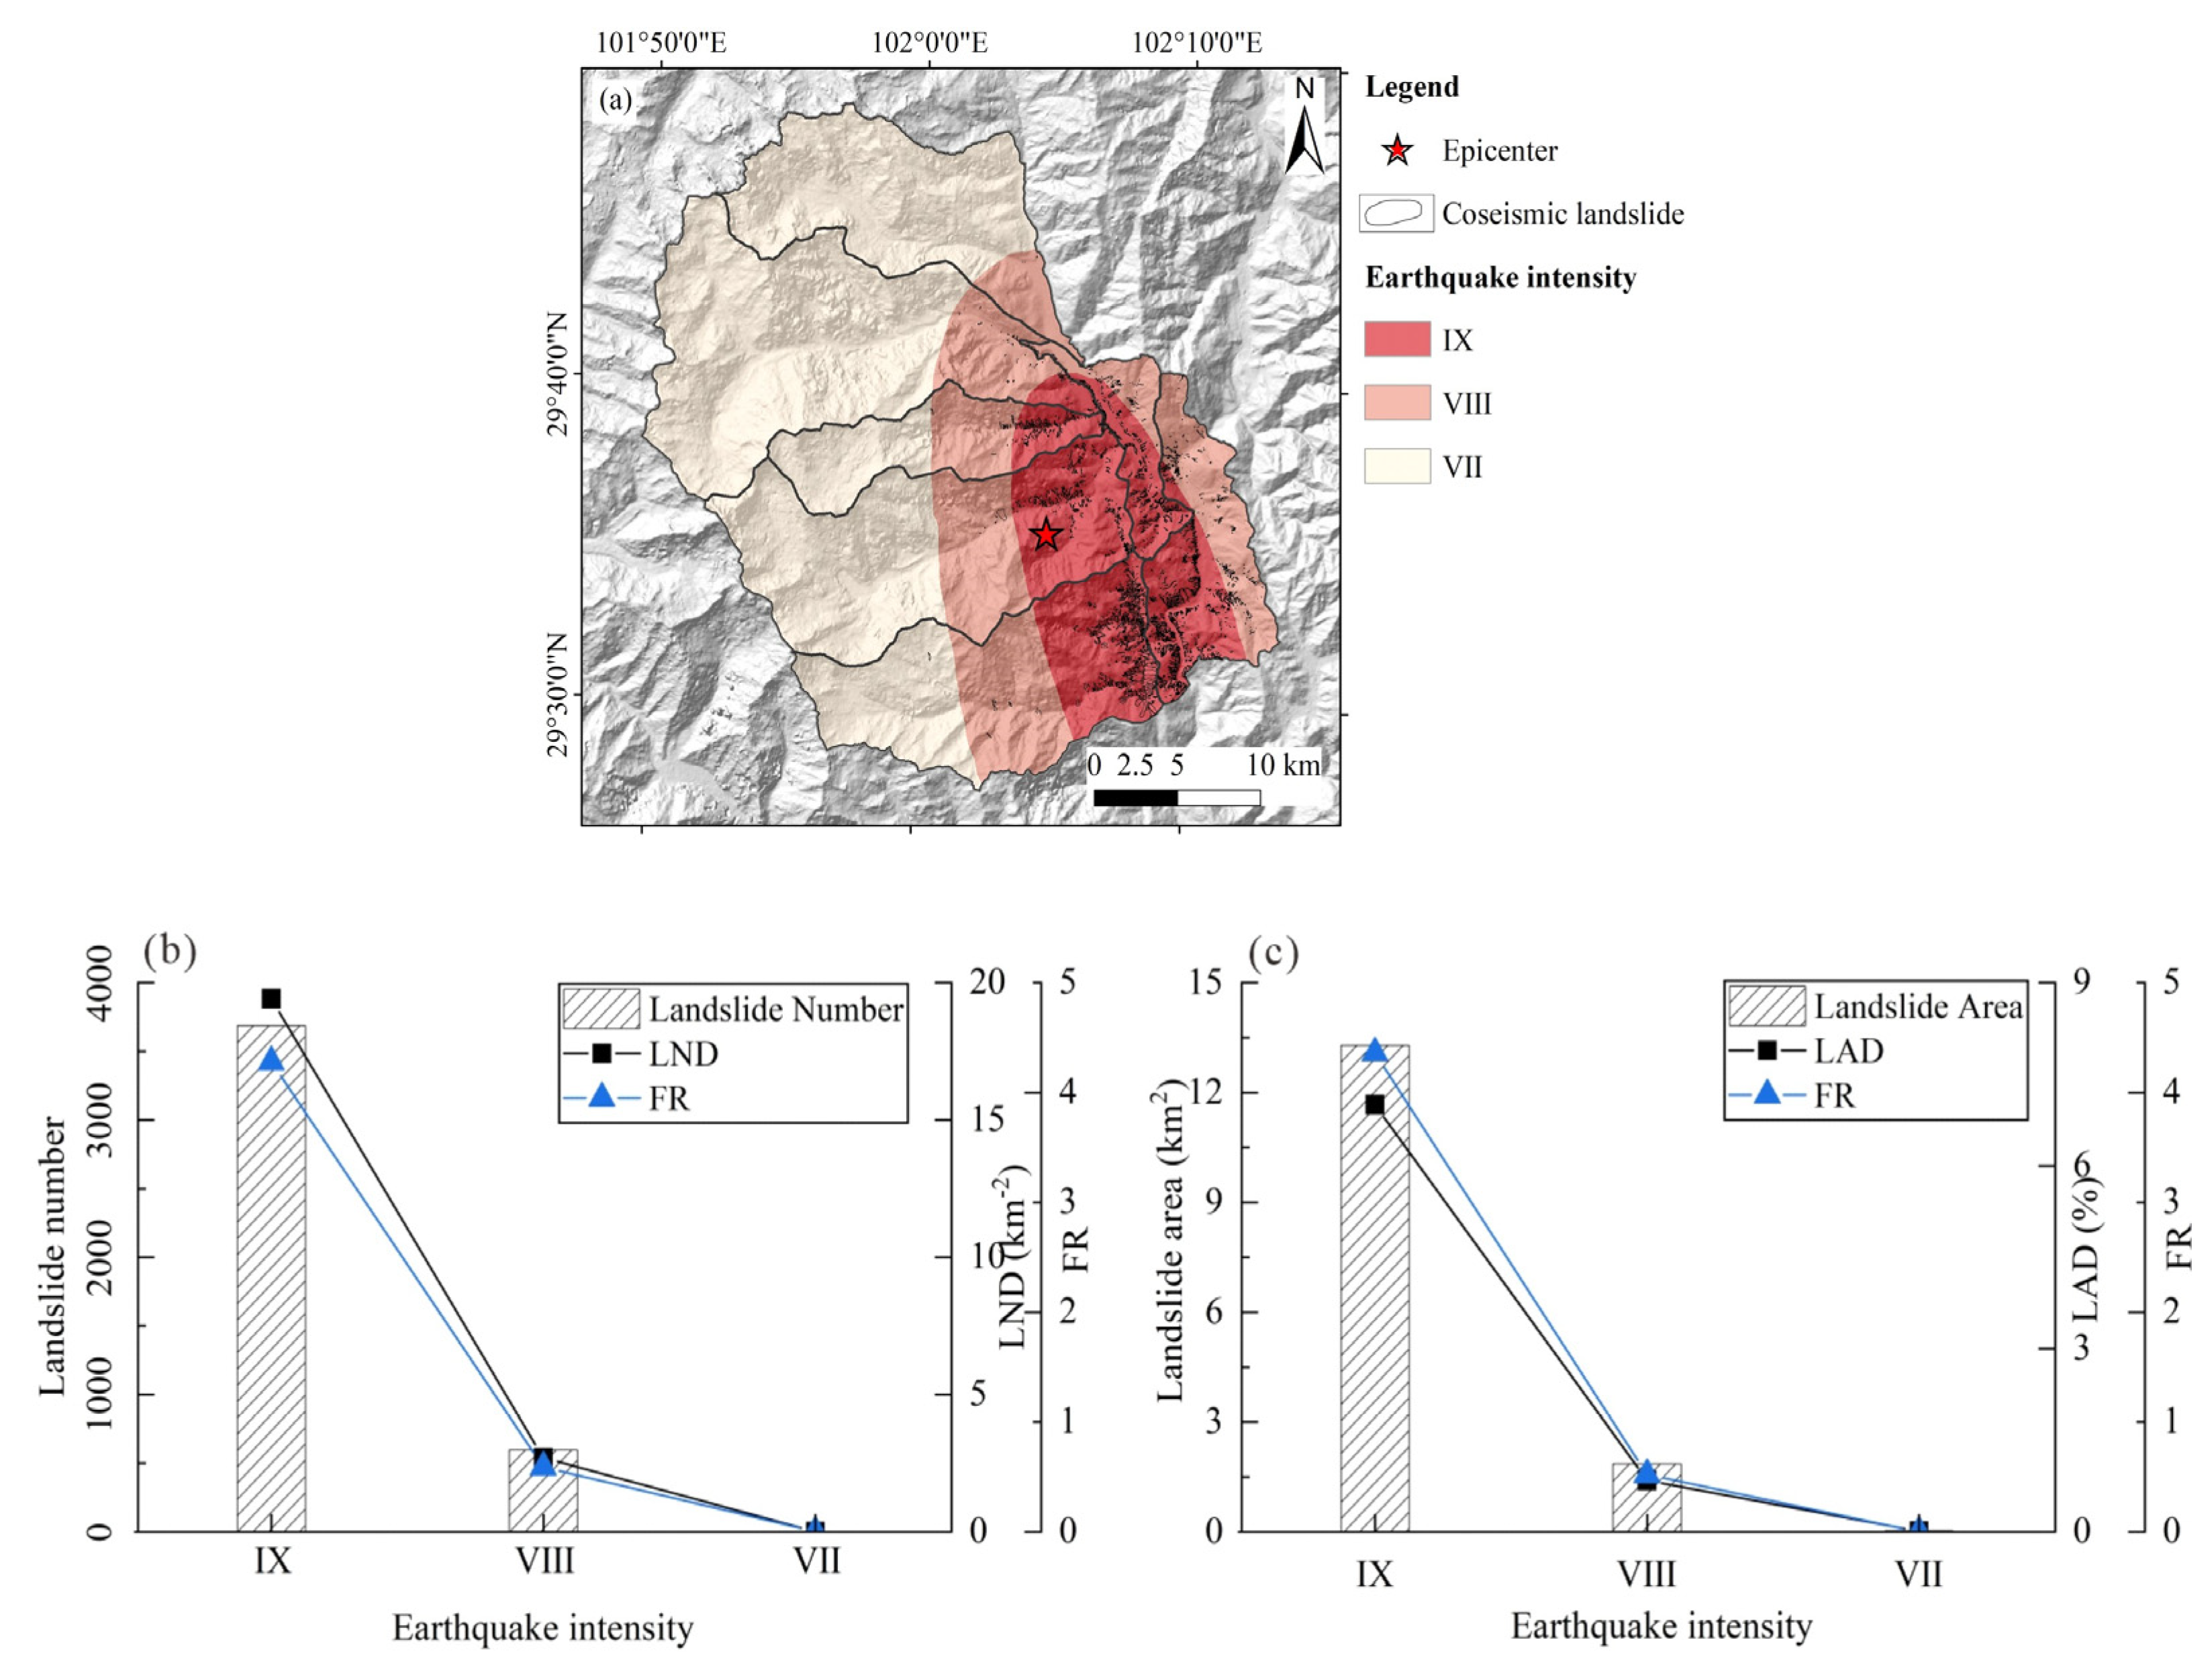
Based on the intensity map of the 6.8-magnitude Sichuan Luding earthquake released by the Ministry of Emergency Management on 11 September 2022, the study area falls within the zone of highest intensity (IX degree) of the earthquake. Additionally, the VI intensity zone primarily encompasses 32 townships (streets) in Ganzi Tibetan Autonomous Prefecture, 35 townships (streets) in Ya’an City, and 9 townships in Liangshan Yi Autonomous Prefecture, which are outside the study area. Therefore, we analyzed the IX-degree to VII-degree intensity zones (Figure 12). The results show that seismic intensity corresponds well with the development of co-seismic landslides. The greater the intensity, the more landslides develop. LAD, LND, and FR, based on landslide points and areas, reached their maximum values in the IX-degree zone, which are 19.42, 4.28, 7.00%, and 4.36, respectively. As the seismic intensity decreases, there is a corresponding decrease in landslide development. The total number of landslides developed in the IX zone is 3686, covering an area of about 13.29 km2.

Figure 12.
Earthquake intensity versus FR, LND, and LAD. (a) Seismic intensity factor zoning; (b,c) results of co-seismic data analysis.
3.6. Mobility Indices
The parameter H/L is used to denote the mobility traits of landslides, where a smaller value indicates higher mobility. A landslide with a smaller H/L value can travel a greater distance under the same elevation difference, thus posing a higher risk of disaster. To calculate the vertical height difference (H) between the pre-earthquake and co-seismic landslides, we used the GIS platform and 5 m resolution DEM data. The tool “Tabular Display of Partition Statistics” was used to statistically calculate the difference between the maximum and minimum values of the DEM for each landslide, representing H. Due to the small area of some landslides, the 5 m × 5 m raster could not completely portray the segmentation of these landslides, resulting in a calculated value of 0 for H. We excluded the data with H = 0, leaving a total of 1185 pre-earthquake landslides and 4258 co-seismic landslides for the H/L calculation, which covers more than 95% of the available data and is used in this paper to describe the H/L distribution law.
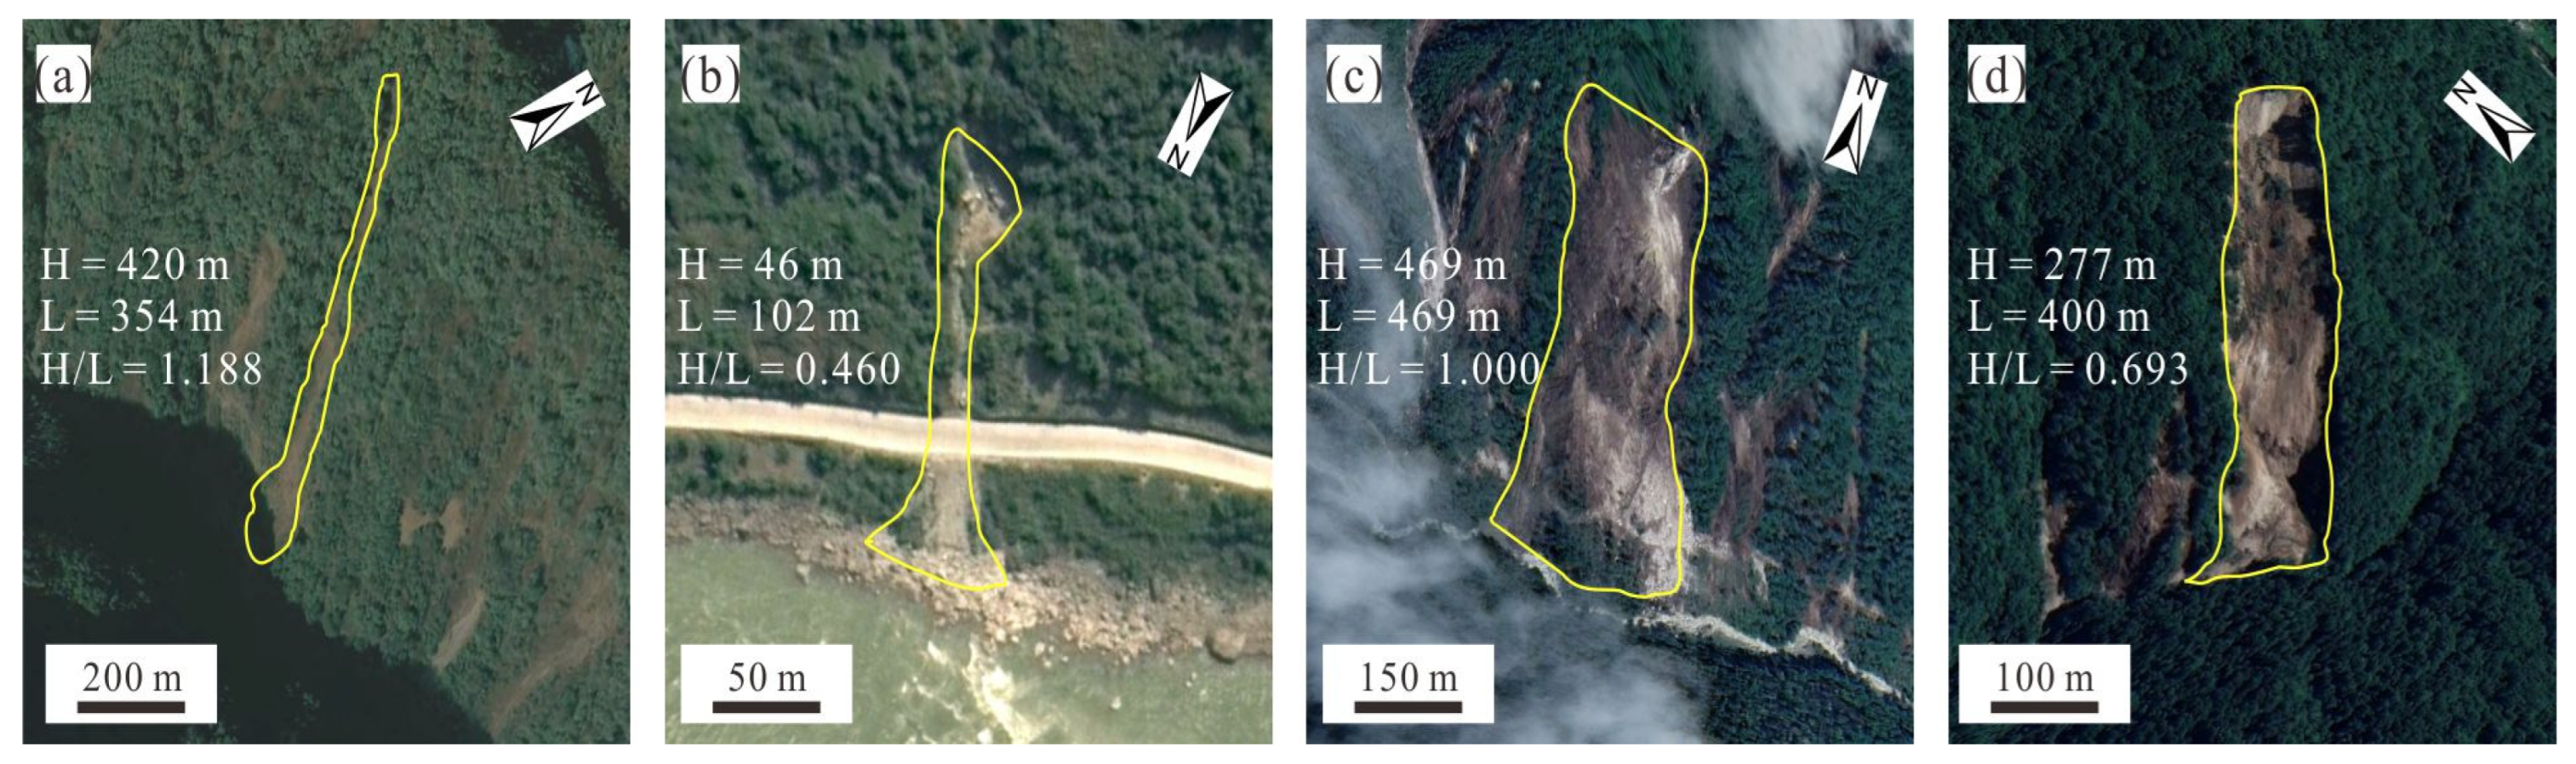
Figure 13 shows histograms of the H/L distribution for the pre-earthquake and co-seismic landslide inventories. For the pre-earthquake landslide data, the minimum value of H/L is 0.005, the maximum value is 1.376, and the mean value is 0.567. The landslide with the minimum H/L value is located in the Hailuogou basin, and the landslide with the maximum H/L value is located in the Yanzigou basin. Photographs of landslides with larger and smaller H/L values in the pre-earthquake landslide inventory are shown in Figure 14a,b. For the co-seismic landslide data, the minimum value of H/L is 0.003, the maximum value is 1.692, and the mean value is 0.663. The landslide with the minimum H/L value is located in the Moxi basin, and the landslide with the maximum H/L value is located in the Dadu River watershed. Photographs of landslides with larger and smaller H/L values in the co-seismic landslide inventory are shown in Figure 14c,d.
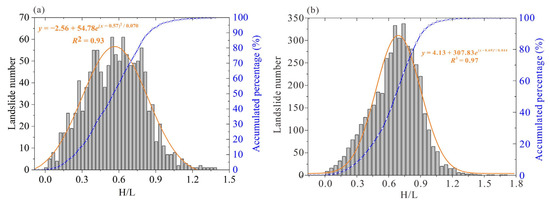
Figure 13.
Distribution of mobility characteristics in the study area. (a) Results of pre-earthquake analyses; (b) results of co-seismic analyses.

Figure 14.
Schematic illustration of landslide mobility on the eastern slope of Gunga Mountain: (a,b) pre-earthquake landslides; (c,d) co-seismic landslides.
4. Discussion
4.1. Comparison of Landslide Inventories
In this study, we analyzed pre-earthquake and co-seismic landslide inventories on the eastern slope of Gongga Mountain to identify variations in landslide distribution patterns between the two phases. Our findings indicate distinct differences in the dominant intervals of landslide development between pre-earthquake and co-seismic events, suggesting that the conditions conducive to landslide disasters changed before and after the earthquake.
For the elevation factor, the dominant interval for landslide development remains consistent before and after the earthquake, occurring primarily between 1200–1400 m. Overlaying this elevation range with remote-sensing imagery revealed that landslides are concentrated near the banks of the Dadu River. The valleys along these banks exhibit steep, “V”-shaped slopes with significant unloading, creating favorable conditions for landslide occurrences.
Regarding the slope, the 30–50° interval is dominant for both pre-earthquake and co-seismic landslides. This indicates that as the slope gradient increases, the downward sliding force exceeds the slip resistance, making the slopes prone to destabilization. Overlaying the 30–50° slope distribution with remote-sensing images shows that this interval is mainly located on the two banks of the Dadu River, high mountainous areas, and the Moxi Terrace. These areas, characterized by steep slopes, provide a favorable environment for landslide development.
For aspect, the dominant slope directions for landslide development before the earthquake were SW and S, while during the earthquake, they were SW and W. Prior to the Luding earthquake, the SW and S slopes of Gongga Mountain were sunny slopes, receiving strong solar radiation, which increased the weathering of rock and soil, thereby promoting landslide development. The variation in landslide slope directions during the earthquake event may be influenced by the Moxi Fault, with SW and W directions being perpendicular to the fault’s active trace.
Considering the impact of active faults, we observed that the number of landslides decreases as the distance from the fault increases in both pre-earthquake and co-seismic inventories. However, this distribution pattern is more pronounced in co-seismic landslides. This observation suggests that proximity to fractures results in the loosening of rock and soil, leading to decreased physico–mechanical strength and increased susceptibility to landslides.
Pre-earthquake landslides were predominantly concentrated in Quaternary loose clastic deposits (A), characterized by gravel, pebbles, and crushed stone. Semi-hard sedimentary rocks (B), interbedded with mudstone, shale, and sandstone, exhibited the highest susceptibility to landslides. In contrast, co-seismic landslides were primarily distributed within acidic magmatic rocks (C), with a notable concentration in the aforementioned semi-hard sedimentary rocks (B).
4.2. Distribution Characteristics and Main Control Factors of Landslides in Different Valleys
To investigate whether the earthquake led to changes in the main controlling factors of landslide distribution before and after the earthquake in the study area, we used the entropy weighting method to calculate the weights of the landslide influencing factors for both periods across the eastern slopes of Gongga Mountain. The results are shown in Figure 15. The main controlling factor affecting the distribution of pre-earthquake landslides is the engineering–geological layer combination, with the distance to active faults being less significant. For co-seismic landslides, earthquake intensity is the main controlling factor, and the weights of the engineering geological layer combination and distance to active faults are similar. These results indicate that the spatial distribution of landslides in the study area is primarily controlled by the engineering geological layer combination, but for co-seismic landslides, there is a high correlation with earthquake intensity.
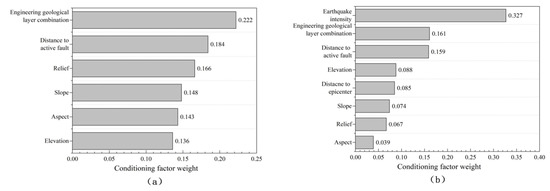
Figure 15.
Weighting of factors affecting landslide development in the study area. (a) Results of pre-earthquake analyses; (b) results of co-seismic analyses.
To account for variations in landslide distribution across different basins, a downscaling analysis was employed to determine the weights of landslide impact factors on the eastern slopes of Gongga Mountain. This aimed to identify the key factors influencing landslide distribution in the pre-earthquake and co-seismic periods within different basins. Due to the limited number of co-seismic landslides (only four) observed in the Nanmenguangou basin, it was challenging to ascertain the main controlling factors for co-seismic events in this basin. Therefore, Table 4 presents only the results for pre-earthquake landslides.
Table 4.
Main controlling factors of landslides in typical valley areas on the eastern slope of Gongga Mountain.
Regarding co-seismic landslide findings, a strong correlation exists between the distribution of co-seismic landslides and earthquake intensity across all basins, except for the Moxi basin. This indicates that seismic activity significantly influences the distribution of co-seismic landslides. To isolate the influence of seismic factors (earthquake intensity and distance to the epicenter), we conducted a comparative analysis between pre-earthquake and co-seismic results. The findings reveal distinct characteristics across different basins, indicating that the primary controlling factors for landslide distribution within individual basins vary from those identified in the overall area analysis.
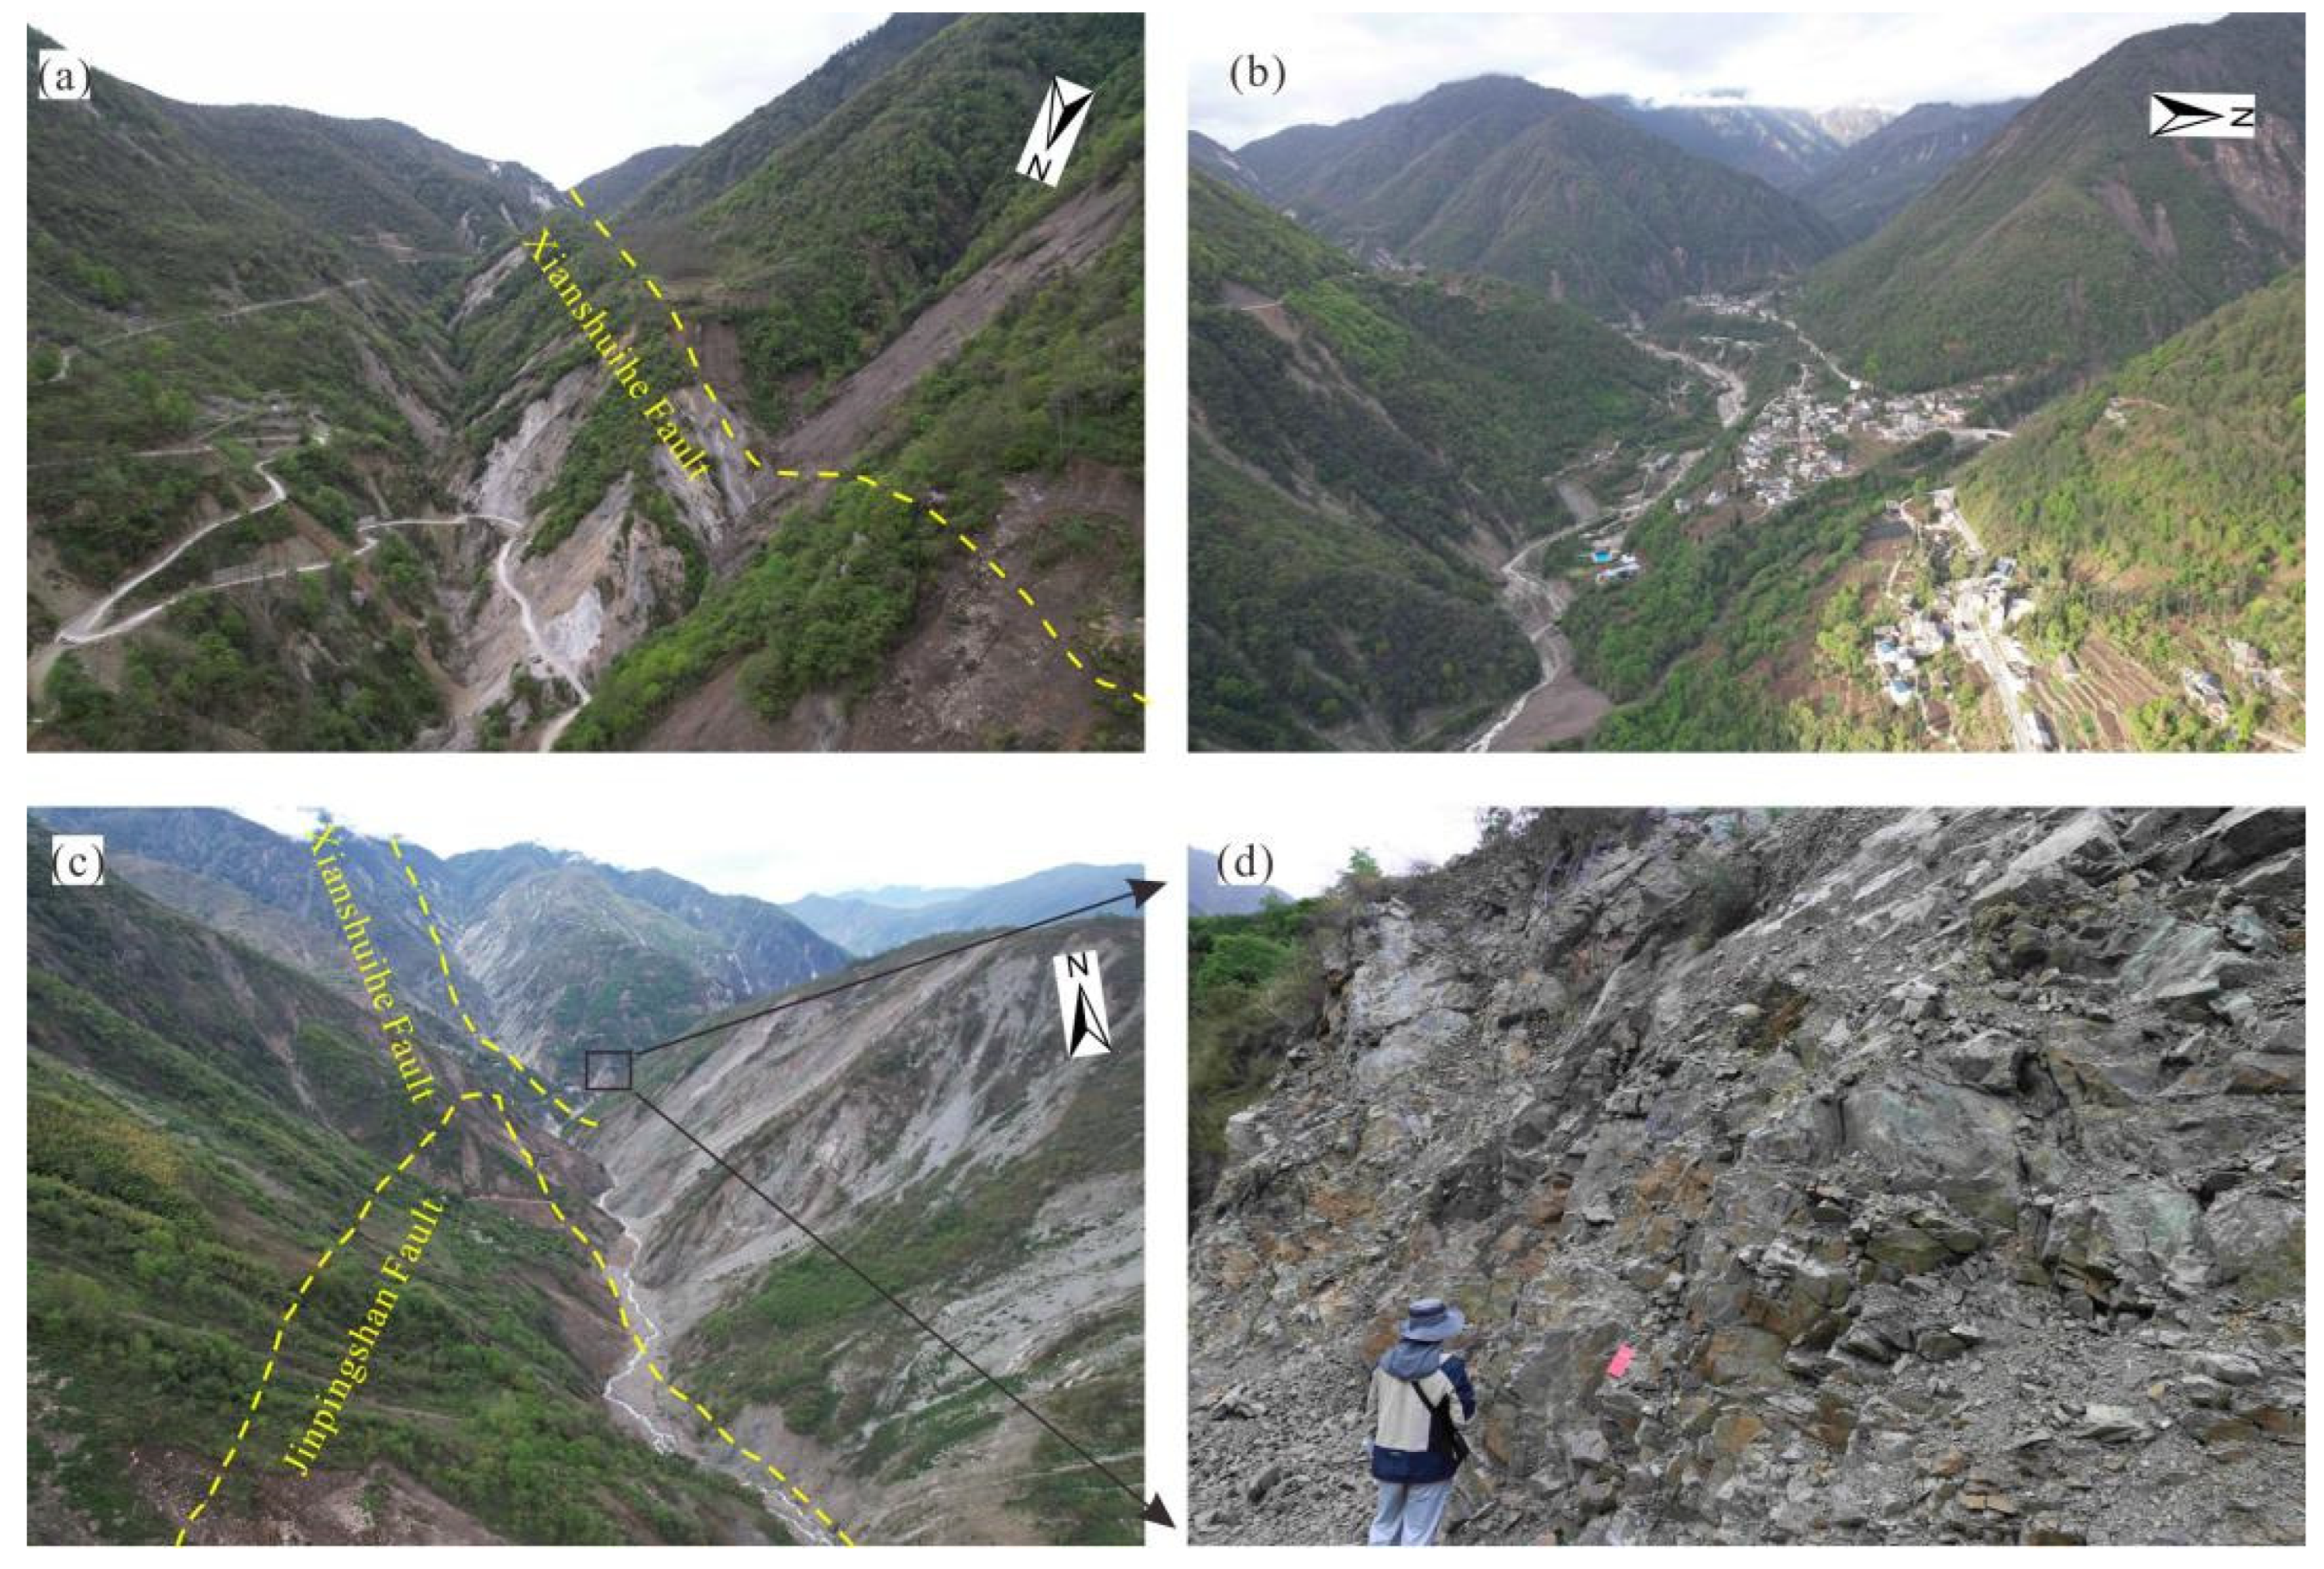
The main controlling factors for the distribution of landslides in the Hailuogou basin are the engineering geological layer combination and topographic relief. The Xianshuihe Fault, which runs through the eastern branch of the Hailuogou basin, significantly influences landslide development due to fault activity (Figure 16a). The Hailuogou basin has significant topographical relief, and landslides are influenced by glacier movement and river erosion (Figure 16b). In the Dagou basin, located south of the Hailuogou basin, the main control factor for landslide distribution is the distance to active faults, particularly the Xianshuihe Fault and the Jinpingshan Fault (Figure 16c). This region is in the earthquake intensity IX zone and is one of the most severely affected areas of the Luding earthquake. Fault activity has led to multiple joint sets in granite outcrops, fragmenting the rock and creating favorable conditions for landslides (Figure 16d).
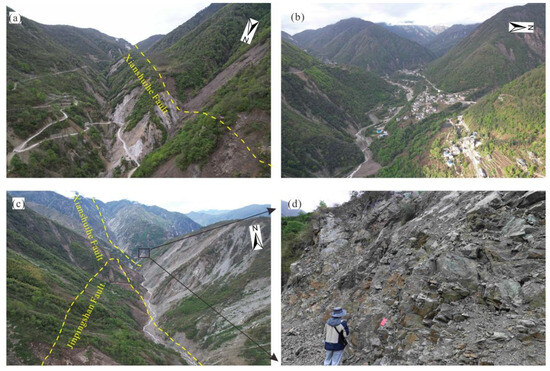
Figure 16.
Distribution of landslides in the study area. (a,b) show the geological environment of the Hailuogou basin; (c,d) show the location of the fault and rock fragmentation.
In the Daduhe basin, located on the east side of the study area, the main controlling factors for landslide distribution are distance to active faults, elevation, and slope. The low elevation on both sides of the Dadu River is an area of intense human activity. Construction activities such as building houses and roads have altered the original topographic conditions, reducing slope stability (Figure 17a). The slopes on both sides of the river are steep due to crustal uplift and the erosion by the Dadu River, and the unloading of slopes coupled with the effect of the Daduhe Fault makes this area prone to landslides (Figure 17b). The Moxi basin includes the Moxi Platform and the branch gullies on the north side of the platform. The main controlling factors are elevation, engineering geological layer combinations, and slope. The Moxi Platform is composed of ice-water deposits, which are relatively loose, with steep slopes (70–80°) on both sides. River erosion and earthquakes have led to extensive landslide development on these slopes (Figure 17c). Additionally, high-elevation gullies on the north side of the Moxi basin are prone to high-level collapses (Figure 17d), showing a strong correlation between landslide distribution and elevation, concentrated in the low-elevation Moxi Platform.
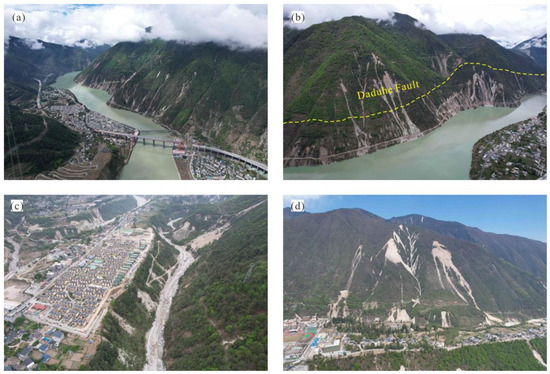
Figure 17.
Distribution of landslides in typical basins. (a,b) are on both sides of the Dadu River basin; (c,d) are located in the Moxi River basin.
The Mozigou basin is situated on the northern side of Hailuogou, with the basin mouth located at the Moxi River. The primary factor influencing landslide distribution in this area is the aspect. The findings differ significantly from those of other basins due to the unique topographic and geomorphological attributes of the Mozigou basin. Characterized by narrow channels, steep banks, dense vegetation cover, and an east–west ridgeline, the Moxi River and ridgeline roughly partition the Mozigou basin into northern and southern segments. The northern part comprises sunlit slopes, while the southern part consists of shaded slopes (Figure 18). Consequently, there is a disparity in solar radiation intensity between the northern and southern sectors, resulting in fewer landslides on the shaded slopes before the earthquake (Figure 18a). This underscores why the aspect serves as the principal determinant in the Mozigou basin. However, following the Luding earthquake, a significant increase in landslides was observed on the previously low-prone, shady slopes, as seen through remote-sensing interpretation and field investigations (Figure 18b). The observed increase in landslide activity within the Mozigou basin can be attributed to the “backslope surface effect”. Seismic waves originating from the Luding earthquake propagated northward, inducing a pronounced seismic response on the shaded slopes due to their orientation.
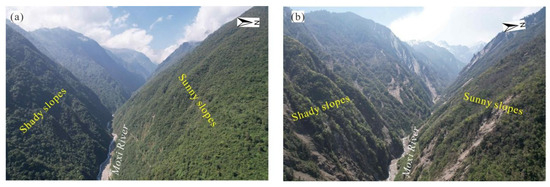
Figure 18.
Topography of the Mozigou basin ((a) Pre-earthquake; (b) co-seismic).
5. Conclusions
Employing a rigorous visual interpretation approach, we have compiled a novel and objective landslide inventory using pre- and co-seismic imagery from Google Earth, 2-m resolution GF-1, and GF-6 satellite data, focusing on the eastern slope of Gongga Mountain, Southwestern China. The landslides are primarily small-to-medium-sized and predominantly occur in the Dadu River basin (41.3% of the total). The closer to the fault, the more concentrated the landslide distribution. We identified 1198 pre-earthquake landslides, including 360 loose accumulations and 838 rocky landslides, with a total area of 5.30 km2. The maximum landslide area is 142,611 m2, and the minimum is 30 m2. We identified 4284 co-seismic landslides, including 950 loose accumulations and 3334 rocky landslides, with a total area of 15.22 km2. The maximum landslide area is 224,917 m2, and the minimum is 26 m2. The number of newly occurring landslides was highest in 2012–2013 and lowest in 2018–2019, showing significant volatility every 2 years before the earthquake. Based on the field hazard site survey, we surmise that this is due to a combination of rainfall, earthquakes, and engineering activities.
We used topographic, geological, and seismic factors, along with landslide area density (LAD), landslide point density (LND), and frequency ratio model (FR), to compare the evolutionary characteristics of pre-earthquake and co-seismic landslide distributions. The results indicate controlling thresholds for landslide distribution, with most landslides located at elevations of 1200–1400 m and slopes of 30–50°. After the Luding earthquake, the aspect of widespread landslides shifted from SW to W, and the relief dominance interval increased by 50 m. The number of landslides in the semi-firm rock group exceeded those in the loose rock group, caused by the earthquake energy acting on the loose gravel layer. The average value of the mobility indices (H/L) increased from 0.567 (pre-earthquake) to 0.663 (co-seismic), indicating that the Luding earthquake had a relatively larger ability to trigger landslides.
In this study, the entropy weighting method was used to establish the weight of condition factors influencing landslide distribution, revealing differences between sub-basins and the overall basin. The distribution of pre-earthquake and co-seismic landslides was affected by the engineering geological layer combination and earthquake intensity. However, the main conditioning factors for pre-earthquake landslides were the distance to active faults, engineering geological layer combination, and slope in the Dagou and Dadu River basins. In the Moxi basin, the distribution of landslides was governed by elevation and aspect, whereas in the Mozigou basin, it showed a notable correlation with aspects. Based on the field survey, we assume that this is due to differences in topography and geological background. Our future research plans involve a series of field campaigns to provide a better characterization of this complex system.
Author Contributions
R.G. designed the article and prepared original draft. J.C. supervised the data processing. S.M. and H.T. processed the satellite products. All authors have read and agreed to the published version of the manuscript.
Funding
This study was supported by the National Key Research and Development Program of China (Grant No. 2023YFC3007101) and the National Science and Technology Infrastructure Center of China (Grant No. 2019FY101605).
Data Availability Statement
The inventories generated and analyzed during the current study are available from the corresponding author upon reasonable request.
Acknowledgments
We thank Google Earth for the free access to satellite images in this study.
Conflicts of Interest
The authors declare no competing interests.
References
- Valagussa, A.; Marc, O.; Frattini, P.; Crosta, G.B. Seismic and geological controls on earthquake-induced landslide size. Earth Planet. Sci. Lett. 2019, 506, 268–281. [Google Scholar] [CrossRef]
- Aditian, A.; Kubota, T.; Shinohara, Y. Comparison of GIS-based landslide susceptibility models using frequency ratio, logistic regression, and artificial neural network in a tertiary region of Ambon, Indonesia. Geomorphology 2018, 318, 101–111. [Google Scholar] [CrossRef]
- Zhang, D.; Wu, Z.; Li, J.; Jiang, Y. An Overview on Earthquake-Induced Landslide Research. J. Geomech. 2013, 19, 225–241. [Google Scholar]
- Cui, Y.; Bao, P.; Xu, C.; Ma, S.; Zheng, J.; Fu, G. Landslides triggered by the 6 September 2018 Mw 6.6 Hokkaido, Japan: An updated inventory and retrospective hazard assessment. Earth Sci. Inform. 2021, 14, 247–258. [Google Scholar] [CrossRef]
- Tanyas, H.; Hill, K.; Mahoney, L.; Fadel, I.; Lombardo, L. The world’s second-largest, recorded landslide event: Lessons learnt from the landslides triggered during and after the 2018 Mw 7.5 Papua New Guinea earthquake. Eng. Geol. 2022, 297, 106504. [Google Scholar] [CrossRef]
- Zhao, B. Landslides triggered by the 2018 Mw 7.5 Palu supershear earthquake in Indonesia. Eng. Geol. 2021, 294, 106406. [Google Scholar] [CrossRef]
- Huang, Y.; Xie, C.; Li, T.; Xu, C.; He, X.; Shao, X.; Xu, X.; Zhan, T.; Chen, Z. An open-accessed inventory of landslides triggered by the MS 6.8 Luding earthquake, China on September 5, 2022. Earthq. Res. Adv. 2023, 3, 100181. [Google Scholar] [CrossRef]
- Guzzetti, F.; Mondini, A.C.; Cardinali, M.; Fiorucci, F.; Santangelo, M.; Chang, K. Landslide inventory maps: New tools for an old problem. Earth-Sci. Rev. 2012, 112, 42–66. [Google Scholar] [CrossRef]
- Xu, Q.; Dong, X.; Li, W. Integrated Space-Air-Ground Early Detection, Monitoring and Warning System for Potential Catastrophic Geohazards. Geomat. Inf. Sci. Wuhan Univ. 2019, 44, 957–966. [Google Scholar]
- Zhao, C.; Lu, Z. Remote Sensing of Landslides—A Review. Remote Sens. 2018, 10, 279. [Google Scholar] [CrossRef]
- Xu, Q.; Tang, M.; Xu, K.; Huang, X. Research on Space-Time Evolution Laws and Early Warning-Prediction of Landslides. Chin. J. Rock Mech. Eng. 2008, 27, 1104–1112. [Google Scholar]
- Xiong, J.; Chen, H.; Zeng, L.; Su, F.; Gong, L.; Tang, C. Coseismic landslide sediment increased by the “9.5” Luding earthquake, Sichuan, China. J. Mt. Sci. 2023, 20, 624–636. [Google Scholar] [CrossRef]
- Wang, X.; Fang, C.; Tang, X.; Dai, L.; Fan, X.; Xu, Q. Research on Emergency Evaluation of Landslides Induced by the Luding Ms 6.8 Earthquake. Geomat. Inf. Sci. Wuhan Univ. 2023, 48, 25–35. [Google Scholar]
- Fan, X.; Wang, X.; Dai, L.; Fang, C.; Deng, Y.; Zou, C.; Tang, M.; Wei, Z.; Dou, X.; Zhang, J.; et al. Characteristics and spatial distribution pattern of Ms 6.8 Luding earthquake occurred on September 5, 2022. J. Eng. Geol. 2022, 30, 1504–1516, (In Chinese with English Abstract). [Google Scholar] [CrossRef]
- Zhang, J.; Yang, Z.; Meng, Q.; Wang, J.; Hu, K.; Ge, Y.; Su, F.; Zhao, B.; Zhang, B.; Jiang, N.; et al. Distribution patterns of landslides triggered by the 2022 MS 6.8 Luding earthquake, Sichuan, China. J. Mt. Sci. 2023, 20, 607–623. [Google Scholar] [CrossRef]
- Ma, S.; Lu, Y.; Xia, C.; Liu, X.; Qi, W.; Yuan, R. Brief report of landslides triggered by the 2022 Ms 6.8 Luding earthquake, Sichuan, China. Landslides 2023, 20, 2695–2707. [Google Scholar] [CrossRef]
- Kamp, U.; Growley, B.J.; Khattak, G.A.; Owen, L.A. GIS-based landslide susceptibility mapping for the 2005 Kashmir earthquake region. Geomorphology 2008, 101, 631–642. [Google Scholar] [CrossRef]
- Dai, F.; Xu, C.; Yao, X.; Xu, L.; Tu, X.; Gong, Q. Spatial distribution of landslides triggered by the 2008 Ms 8.0 Wenchuan earthquake, China. J. Asian Earth Sci. 2011, 40, 883–895. [Google Scholar] [CrossRef]
- Xu, C.; Xu, X.; Shyu, J.B.H. Database and spatial distribution of landslides triggered by the Lushan, China Mw 6.6 earthquake of 20 April 2013. Geomorphology 2015, 248, 77–92. [Google Scholar] [CrossRef]
- Sepúlveda, S.A.; Serey, A.; Lara, M.; Pavez, A.; Rebolledo, S. Landslides induced by the April 2007 Aysén Fjord earthquake, Chilean Patagonia. Landslides 2010, 7, 483–492. [Google Scholar] [CrossRef]
- Kargel, J.S.; Leonard, G.J.; Shugar, D.H.; Haritashya, U.K.; Bevington, A.; Fielding, E.J.; Fujita, K.; Geertsema, M.; Miles, E.S.; Steiner, J.; et al. Geomorphic and geologic controls of geohazards induced by Nepal’s 2015 Gorkha earthquake. Science 2016, 351, 147. [Google Scholar] [CrossRef]
- Zhang, J.; Chen, L.; Li, Y.; Liu, M.; Shi, S.; Yi, J.; Zhang, W.; Zhang, S.; Sun, J.; Yang, D.; et al. Development characteristics and controlling factors of coseismic geohazards triggered by the Luding Ms 6.8 earthquake occurred on September 5, 2022. Acta Seismol. Sin. 2023, 45, 167–178, (In Chinese with English Abstract). [Google Scholar]
- Guo, C.; Li, C.; Yang, Z.; Ni, J.; Zhong, N.; Wang, M.; Yan, Y.; Song, D.; Zhang, Y.; Zhang, X.; et al. Characterization and spatial analysis of coseismic landslides triggered by the Luding Ms 6.8 earthquake in the Xianshuihe fault zone, Southwest China. J. Mt. Sci. 2024, 21, 160–181. [Google Scholar] [CrossRef]
- Zhao, B.; Hu, K.; Yang, Z.; Liu, Q.; Zou, Q.; Chen, H.; Zhang, B.; Zhang, W.; Zhu, L.; Su, L. Geomorphic and tectonic controls of landslides induced by the 2022 Luding earthquake. J. Mt. Sci. 2022, 19, 3323–3345. [Google Scholar] [CrossRef]
- Liu, X.; Su, P.; Li, Y.; Xia, Z.; Ma, S.; Xu, R.; Lu, Y.; Li, D.; Lu, H.; Yuan, R. Spatial distribution of landslide shape induced by Luding Ms 6.8 earthquake, Sichuan, China: Case study of the Moxi Town. Landslides 2023, 20, 1667–1678. [Google Scholar] [CrossRef]
- An, Y.; Wang, D.; Ma, Q.; Xu, Y.; Li, Y.; Zhang, Y.; Liu, Z.; Huang, C.; Su, J.; Li, J.; et al. Preliminary report of the September 5, 2022 MS 6.8 Luding earthquake, Sichuan, China. Earthq. Res. Adv. 2023, 3, 100184. [Google Scholar] [CrossRef]
- Tie, Y.; Zhang, X.; Lu, J.; Liang, J.; Wang, D.; Ma, Z.; Li, Z.; Lu, T.; Shi, S.; Liu, M.; et al. Characteristics of geological hazards and it’s mitigations of the Ms 6.8 earthquake in Luding County, Sichuan Province. Hydrogeol. Eng. Geol. 2022, 49, 1–12. [Google Scholar]
- Zhao, B.; Li, W.; Su, L.; Wang, Y.; Wu, H. Insights into the Landslides Triggered by the 2022 Lushan Ms 6.1 Earthquake: Spatial Distribution and Controls. Remote Sens. 2022, 14, 4365. [Google Scholar] [CrossRef]
- Thomas, A. The climate of the Gongga Shan range, Sichuan Province, PR China. Arct. Alp. Res. 1997, 29, 226–232. [Google Scholar] [CrossRef]
- Cao, Z. The characteristics of glacier hydrology in the area of the Gongga Mountains. J. Glaciol. Geocryol. 1995, 17, 73–83. [Google Scholar]
- Su, Z.; Liang, D.; Hong, M. Developing conditions, amounts and distributions of glaciers in Gongga Mountains. J. Glaciol. Geocryol. 1993, 4, 551–558, (In Chinese with English Abstract). [Google Scholar]
- Shen, Z.; Liu, Z.; Wu, J. Altitudinal pattern of flora on the eastern slope of Mt. Gongga. Chin. Biodivers. 2004, 12, 89–98. [Google Scholar]
- Wu, P.; Wang, Y.; Zhu, J. The characteristics of seismic activity on Xianshuihe fault since 1970 and the preliminary study on seismogenesis of the Kangding MS 6.3 earthquake. Earthq. Res. China 2016, 32, 776–786. [Google Scholar]
- Zheng, G.; Wang, H.; Wright, T.J.; Lou, Y.; Zhang, R.; Zhang, W.; Shi, C.; Huang, J.; Wei, N. Crustal Deformation in the India-Eurasia Collision Zone from 25 Years of GPS Measurements. J. Geophys. Res. Solid Earth 2017, 122, 9290–9312. [Google Scholar] [CrossRef]
- Bai, M.; Chevalier, M.; Li, H.; Pan, J.; Wu, Q.; Wang, S.; Liu, F.; Jiao, L.; Zhang, J.; Zhang, L.; et al. Late Quaternary slip rate and earthquake hazard along the Qianning segment, Xianshuihe fault. Acta Geol. Sin. 2022, 96, 2312–2332. [Google Scholar]
- Li, W.; Chen, J.; Lu, H.; Shan, Y.; Li, Z.; Chen, B.; Wu, L.; Xu, Z.; Li, W.; Zhang, P.; et al. Emergency Analysis of the Impact of the Luding Ms 6.8 Earthquake on Hailuogou Glacier. Geomat. Inf. Sci. Wuhan Univ. 2023, 48, 47–57. [Google Scholar]
- Chen, M.; Li, H.; Liu, C.; Pan, F.; Li, X.; Tu, J.; Wang, Y.; He, R.; Wang, H. Comprehensive evaluation of large-scale geological disaster susceptibility based on frequency ratio-hierarchical analysis model: Taking Yuyang River basin as an example. Resour. Environ. Eng. 2024, 38, 63–72, (In Chinese with English Abstract). [Google Scholar] [CrossRef]
- Iverson, R.M.; George, D.L.; Allstadt, K.; Reid, M.E.; Collins, B.D.; Vallance, J.W.; Schilling, S.P.; Godt, J.W.; Cannon, C.M.; Magirl, C.S.; et al. Landslide mobility and hazards: Implications of the 2014 Oso disaster. Earth Planet. Sci. Lett. 2015, 412, 197–208. [Google Scholar] [CrossRef]
- Roback, K.; Clark, M.K.; West, A.J.; Zekkos, D.; Li, G.; Gallen, S.F.; Chamlagain, D.; Godt, J.W. The size, distribution, and mobility of landslides caused by the 2015 Mw 7.8 Gorkha earthquake, Nepal. Geomorphology 2018, 301, 121–138. [Google Scholar] [CrossRef]
- Staron, L. Mobility of long-runout rock flows: A discrete numerical investigation. Geophys. J. Int. 2008, 172, 455–463. [Google Scholar] [CrossRef]
- Aaron, J.; McDougall, S. Rock avalanche mobility: The role of path material. Eng. Geol. 2019, 257, 105126. [Google Scholar] [CrossRef]
- Keefer, D.K. Statistical analysis of an earthquake-induced landslide distribution—The 1989 Loma Prieta, California event. Eng. Geol. 2000, 58, 231–249. [Google Scholar] [CrossRef]
- Wu, S.; Chen, J.; Xu, C.; Zhou, W.; Yao, L.; Yue, W.; Cui, Z. Susceptibility Assessments and Validations of Debris-Flow Events in Meizoseismal Areas: Case Study in China’s Longxi River Watershed. Nat. Hazards Rev. 2020, 21, 05019005. [Google Scholar] [CrossRef]
- Xu, C. Preparation of earthquake-triggered landslide inventory maps using remote sensing and GIS technologies: Principles and case studies. Geosci. Front. 2015, 6, 825–836. [Google Scholar] [CrossRef]
Disclaimer/Publisher’s Note: The statements, opinions, and data contained in all publications are solely those of the individual author(s) and contributor(s) and not of MDPI and/or the editor(s). MDPI and/or the editor(s) disclaim responsibility for any injury to people or property resulting from any ideas, methods, instructions, or products referred to in the content. |


Disclaimer/Publisher’s Note: The statements, opinions and data contained in all publications are solely those of the individual author(s) and contributor(s) and not of MDPI and/or the editor(s). MDPI and/or the editor(s) disclaim responsibility for any injury to people or property resulting from any ideas, methods, instructions or products referred to in the content. |
© 2024 by the authors. Licensee MDPI, Basel, Switzerland. This article is an open access article distributed under the terms and conditions of the Creative Commons Attribution (CC BY) license (https://creativecommons.org/licenses/by/4.0/).