Article

Interannual Glacial Mass Changes in High Mountain Asia and Connections to Climate Variability

by
Yifan Wang
1,2,
Jingang Zhan
1,
Hongling Shi
1,* and
Jianli Chen
3,4,5
1
Innovation Academy for Precision Measurement Science and Technology, Chinese Academy of Sciences, Wuhan 430077, China
2
College of Earth and Planetary Sciences, University of Chinese Academy of Sciences, Beijing 100049, China
3
Department of Land Surveying and Geo-Informatics, The Hong Kong Polytechnic University, Hong Kong 100872, China
4
Research Institute for Land and Space, The Hong Kong Polytechnic University, Hong Kong 100872, China
5
The Hong Kong Polytechnic University Shenzhen Research Institute, Shenzhen 518000, China
*
Author to whom correspondence should be addressed.
Remote Sens. 2024, 16(18), 3426; https://doi.org/10.3390/rs16183426
Submission received: 29 July 2024 / Revised: 11 September 2024 / Accepted: 13 September 2024 / Published: 15 September 2024

Abstract

:
We use data from the Gravity Recovery and Climate Experiment and its Follow-On mission (GRACE/GRACE-FO) from April 2002 to December 2022 to analyze interannual glacial mass changes in High Mountain Asia (HMA) and its subregions and their driving factors. Glacial mass changes in the HMA subregions show clear regional characteristics. Interannual glacial mass changes in the HMA region are closely related to interannual oscillations of precipitation and temperature, and are also correlated with El Niño–Southern Oscillation (ENSO). Glacial mass changes in the regions (R1–R6) are dominated by precipitation, and ENSO affects interannual glacial mass changes mainly by affecting precipitation. In region (R7) and region (R8), the glacial mass changes are mainly controlled by temperature. ENSO also affects the interannual glacial mass changes by affecting interannual changes in temperature. The interannual glacial mass changes in regions (R9–R11) are jointly dominated by temperature and precipitation, and also related to ENSO. Another interesting finding of this study is that glacial mass changes in the western part of HMA (R1–R6) show a clear 6–7-year oscillation, strongly correlated with a similar oscillation in precipitation, while in the eastern part (R9–R11), a 2–3-year oscillation was found in both glacial mass change and precipitation, as well as temperature. These results verify the response of interannual HMA glacial mass changes to climate processes, crucial for understanding regional climate dynamics and sustainable water resource management.

1. Introduction

High Mountain Asia (HMA) is a high-altitude region in central Asia centered on the Tibetan Plateau. It covers an area of approximately 250 km2 with an average altitude of more than 4000 m. The region boasts a distinctive plateau climate. Notably, it represents the largest concentration of modern glaciers in middle and low latitudes globally, earning it the moniker “Asian water tower”. HMA holds immense significance as the source of major rivers like the Yangtze River, the Yellow River, and numerous other key waterways across Asia. Furthermore, HMA serves as a sensitive barometer of global climate change [1]. Given the pivotal role of glaciers within HMA, it has become imperative to quantify their mass change balances and investigate how they respond to ongoing climate variations.
Previously, due to technological and methodological constraints, researchers could only establish a limited number of monitoring points at some selected glaciers to track glacier position changes periodically [2,3]. However, this approach faced challenges such as a restricted number of observation points, intermittent observation periods, and an uneven distribution of observation points across the glacier landscape. The sparse spatiotemporal coverages of the data were proved inadequate for accurately quantifying abnormal disturbances and fluctuations of varying magnitudes in glacial mass changes across different time intervals [4,5].
With the advent of the gravity satellites like the CHAMP (Challenging Minisatellite Payload), GRACE/GRACE-FO, and GOCE (Gravity Field and Steady-State Ocean Circulation Explorer) in this century, satellite gravimetry technology has entered an important period of development. The GRACE twin satellites system measures distance changes between satellites to derive the Earth’s gravity field, offering continuous observation capabilities crucial for studying and monitoring glacial mass changes [6,7,8]. On the one hand, in studying glacial mass changes in HMA, researchers widely use GRACE satellite gravity data to monitor its spatiotemporal changes. For instance, Moiwo et al. [9] inferred that the surface water thickness of the Tibetan Plateau decreased by −0.36 ± 0.03 mm/month on average during 2003–2008. Song et al. [10] utilized hydrological data and GRACE gravity satellite data to estimate an annual mass loss rate of terrestrial water storage in the southeastern Tibetan Plateau, reporting −5.99 ± 2.78 Gt/yr from 2003 to 2009. On the other hand, in the study of the mass change mechanism of HMA glaciers, previous studies mainly used GRACE and hydrological data sets (GLDAS, etc.). For example, Jiao et al. [11] studied the spatiotemporal changes in land water storage in the northern Tibetan Plateau and discussed influencing factors such as precipitation and temperature. Some recent studies attributed changes in terrestrial water storage across the Tibetan Plateau to precipitation and evapotranspiration variations from 2003 to 2014 [12]. Liu et al. [13] utilized field observations from seven significant glaciers and meteorological data from the GLDAS CLSM data set to reconstruct the Tibetan Plateau’s long-term glacial mass balance from 1975 to 2013, highlighting the distinct impacts of moisture and heat factors on glacier mass balance changes across the region. Wang et al. [14] employed a weighting method to evaluate the intra-year and interannual changes in TWSA (Terrestrial Water Storage Anomaly) on the Tibetan Plateau by combining TWSA data based on GRACE and GRACE-FO with other meteorological and hydrological data.
Undoubtedly, previous studies of glacier mass changes and associated mechanisms in HMA have significantly advanced our knowledge of this ecologically critical region. Researchers have extensively used GRACE satellite gravity data, hydrological datasets like GLDAS, and meteorological variables to comprehensively explore the spatiotemporal dynamics of surface water thickness, terrestrial water storage, and glacial mass balance. However, much of this research has predominantly centered on either the entire HMA [10,15] or individual subregions [16], overlooking the diverse spatial heterogeneity in glacier mass changes across subregions [9]. Climate change in recent years has caused the glaciers in HMA to continue melting. Distinct basins exhibit varied topographies and localized climate environments, contributing to considerable disparities in glacier changes across different periods and regions [17]. Hence, it is imperative to delve into detailed exploration and research concerning HMA glacial mass changes and change mechanisms within different subregions.
Moreover, previous studies have given relatively less attention to the influence of atmospheric circulation (such as ENSO) on glacial mass changes in HMA, especially at the interannual scale. Anomalies in atmospheric circulation significantly impact temperature, precipitation, and evaporation patterns on a large scale, consequently affecting surface water storage and glacier mass changes [18,19,20]. Although current research has initially revealed the impact of different climate indices on the HMA glacial mass changes, most studies have primarily connected glacier mass changes with short-term extreme climate anomaly events, lacking broader coverage across longer time scales. Interannual signals capture the relatively low-frequency changes in glaciers and their dynamic responses to climate changes, constituting a crucial aspect of understanding the interaction between glaciers and diverse climate-influencing factors. Therefore, it is crucial to study the response mechanism between interannual glacial mass changes and atmospheric circulation changes in the HMA region.
We studied the impact of atmospheric circulation on interannual glacial mass changes in the overall HMA and its subregions based on a longer period (2002–2022) rather than on isolated climate events. Effective spatiotemporal filtering methods were employed for data analysis to ensure accuracy and reliability. This study delves into the regional response relationship between HMA interannual glacial mass changes and variations in temperature and precipitation over the past two decades. Furthermore, the study investigates how these glacial mass changes correlate with atmospheric circulation patterns, providing valuable insights into the complex interplay between glaciers and climatic factors over time.

2. Studied Area

The HMA region is recognized as the central hub of glaciers within the mid-to-lower latitudes. It has the largest glacier area outside the polar regions. According to the division of glacier areas by Miles et al. [21], the glacier area of HMA and the surrounding areas is approximately 5.9 × 10⁴ km2. Among them, the Kunlun Mountains hold the largest glacier area, trailed by the Nyainqentanglha Mountains and Tianshan Mountains. This study based on RGI6.0 divided the HMA glacier area into 1–11 (Figure 1), with a total of 11 subregions for detailed study (R1–R11).

3. Data and Methods

3.1. Data

3.1.1. GRACE Mascon Products

Time-variable gravity field models are routinely produced from GRACE/GRACE-FO gravity satellites data. Monthly gravity field solutions are provided in the form of fully normalized spherical harmonics (SH), also called Stokes coefficients. CSR mascon products are solved based on spherical harmonic coefficients, and they do not rely on any prior information other than these coefficients. Compared to spherical harmonic methods, the GRACE mascon solution applies constraints or regularization, which is a more optimized estimation method that minimizes signal attenuation to the greatest extent [22]. A key feature of mascon products, compared to traditional spherical harmonics, is that they require no additional post-processing. Mascon products provide grid products directly, having undergone post-processing including GIA correction before release, making them ready for immediate use by users [23,24,25].
The GRACE/GRACE-FO satellites measure total mass variations, including contributions from glacier mass changes, permafrost variations, and other factors. In our study, we specifically focused on glacier mass changes. It is important to note that frozen soil changes are predominantly distributed within the interior of HMA, while our research area is primarily centered on glacier regions. Studies indicate that the influence of frozen soil changes on total mass variations in glacier-dominated areas is relatively minor compared to the impact of glacier mass changes [26]. Although contributions from terrestrial water storage (TWS) changes and permafrost variations cannot be entirely dismissed, their impact on the estimated glacier mass changes is believed to be relatively small. Given that our study focuses on correlation analysis, which is qualitative rather than quantitative in nature, the TWS impact may not significantly affect our main conclusions. This study uses the CSR RL06 mascon solutions for a total of 249 months, covering the period from April 2002 to December 2022. During this period, there were a total of 33 months of data gaps due to satellite maintenance, instrument failures, communication, and other issues. For the missing data, the singular spectral analysis (SSA) method is used to interpolate and supplement the original time series [27]. The CSR RL06 mascon data are provided on 0.25° latitude–longitude global grids in terms of equivalent water height (EWH).

3.1.2. Meteorological Data

Meteorological changes have a direct impact on glacial mass changes in HMA, and temperature and precipitation are two important meteorological variables that affect glacial mass changes. Currently, one of the most widely used meteorological data sets is provided by the Climatic Research Unit (CRU) of the University of East Anglia in the United Kingdom. The data set includes 10 data sets based on near-surface measurements, including temperature, precipitation, humidity, etc.
This study uses monthly precipitation and temperature data from CRU TS 4.07 from April 2002 to December 2022 [28]. Its horizontal spatial resolution is 0.5° × 0.5°. The data are downloaded from the CRU website (https://crudata.uea.ac.uk/cru/data/hrg/cru_ts_4.07/, accessed on 31 August 2023).

3.1.3. ENSO

El Niño–Southern Oscillation (ENSO) is a climate pattern characterized by periodic fluctuations in sea surface temperatures and atmospheric pressure in the equatorial Pacific Ocean, influencing global weather and climate. The ENSO Index is calculated by monitoring ocean surface temperature anomalies to reflect these climate change processes. HMA glacier mass changes and global climate change are always in a process of constant interaction, and the climate change process can be described by climate indices. Therefore, by analyzing the relationship between climate indices and glacial mass changes in HMA, it is helpful to better understand the complex interplay between glacier dynamics and broader climate changes. The data for ENSO indices can be sourced from platforms like (cpc.ncep.noaa.gov/data/indices/sstoi.indices, accessed on 16 March 2023).

3.2. Methods

3.2.1. Empirical Orthogonal Function

Temporal gravity change reflects the sum of all contributions from the Earth’s mass change over time [29]. There are multiple factors influencing the Earth’s gravity anomalies. Our goal is to isolate and analyze each variable associated with HMA glacial mass changes in space and time and analyze them. The Empirical Orthogonal Function (EOF) is a statistical analysis method for extracting the primary features of data to achieve dimensionality reduction [30]. The basic concept is to identify the most significant components within the data, eliminating weak signals and noise, thereby achieving the purpose of dimensionality reduction for the original data set. EOF can separate the space and time of the variable field through the characteristic statistics of the variables. That is to say, the variable is decomposed into two parts: one part is the space function part that does not change with time, and the other part is the time function part that only depends on the time change. This method was originally proposed by Pearson [30], and later introduced and widely applied in the field of Earth sciences by Lorenz [31], including atmospheric and climate research [32].
The core formula of EOF analysis can be briefly stated as follows:
X = E C
where X is the m × n data matrix (m samples, n variables); E is the m × p EOF matrix (principal component eigenvectors, p is the number of principal components); and C is the p × n time coefficient matrix.

3.2.2. Wavelet Amplitude–Period Spectrum Analysis

The mass balance of HMA varies over time due to the combined influence of various climatic factors, mostly exhibiting non-stationary characteristics. These sequences not only display trends and periodicity but also feature randomness, abrupt changes, and a “multi-time scale” structure, indicating complex evolutionary patterns [33]. Studying such non-stationary time series typically requires time-domain information corresponding to a specific frequency band or frequency-domain information over a certain period. Therefore, after obtaining the principal components’ time series for the region, we analyze their time-frequency characteristics using wavelet amplitude periodic spectra. This method clearly reveals multiple changing cycles hidden within the time series, reflecting the temporal variations in amplitude and period of each cyclic component. The wavelet amplitude–period spectrum of a time series f ( t ) is defined as follows:
W ψ f a , b = 1 a C ψ f t ψ t b a d t
where a , b R , a 0 ; ψ ( t ) = e t 2 2 δ 2 cos ( 2 π ω 0 t ) , δ , ω 0 R , 2 π δ ω 0 1 ;   C ψ = ψ ( t ) cos ( 2 π ω 0 t ) d t ; the kernel function is the real part of the Morlet wavelet; t is time; δ is a constant; ω 0 is the frequency parameter; C ψ is a constant; and a and b are scaling factors for period and time, respectively.

3.2.3. Singular Spectral Analysis

Given that the time series of glacier mass change, precipitation change, and temperature change exhibit multiple periodic signals simultaneously, it is necessary to extract the interannual signals in order to facilitate further analysis of the interannual signals of the time series. Singular Spectrum Analysis (SSA) was first discussed by Broomhead and King in their 1986 article [34]. SSA is a method that is particularly well suited to the analysis of nonlinear time series data. It is capable of effectively processing and analyzing data exhibiting periodic oscillations, trends, and noise. Currently, SSA is employed in a variety of fields, including meteorology [35], oceanography [36], and geodesy [37]. SSA does not require a priori mathematical models or function information, and it is not constrained by assumptions of sinusoidal periodicity. It involves lag-embedding the time series data to construct a trajectory matrix, performing singular value decomposition (SVD) on this matrix, recombining different components, and ultimately reconstructing the time series data. This process facilitates the separation of signals, such as interannual and periodic signals, from the data. This study employs SSA to separate interannual signals in the time series for subsequent analysis and comparison.

4. Results

4.1. Spatial Trends and Time Series of Glacier Mass Changes in HMA

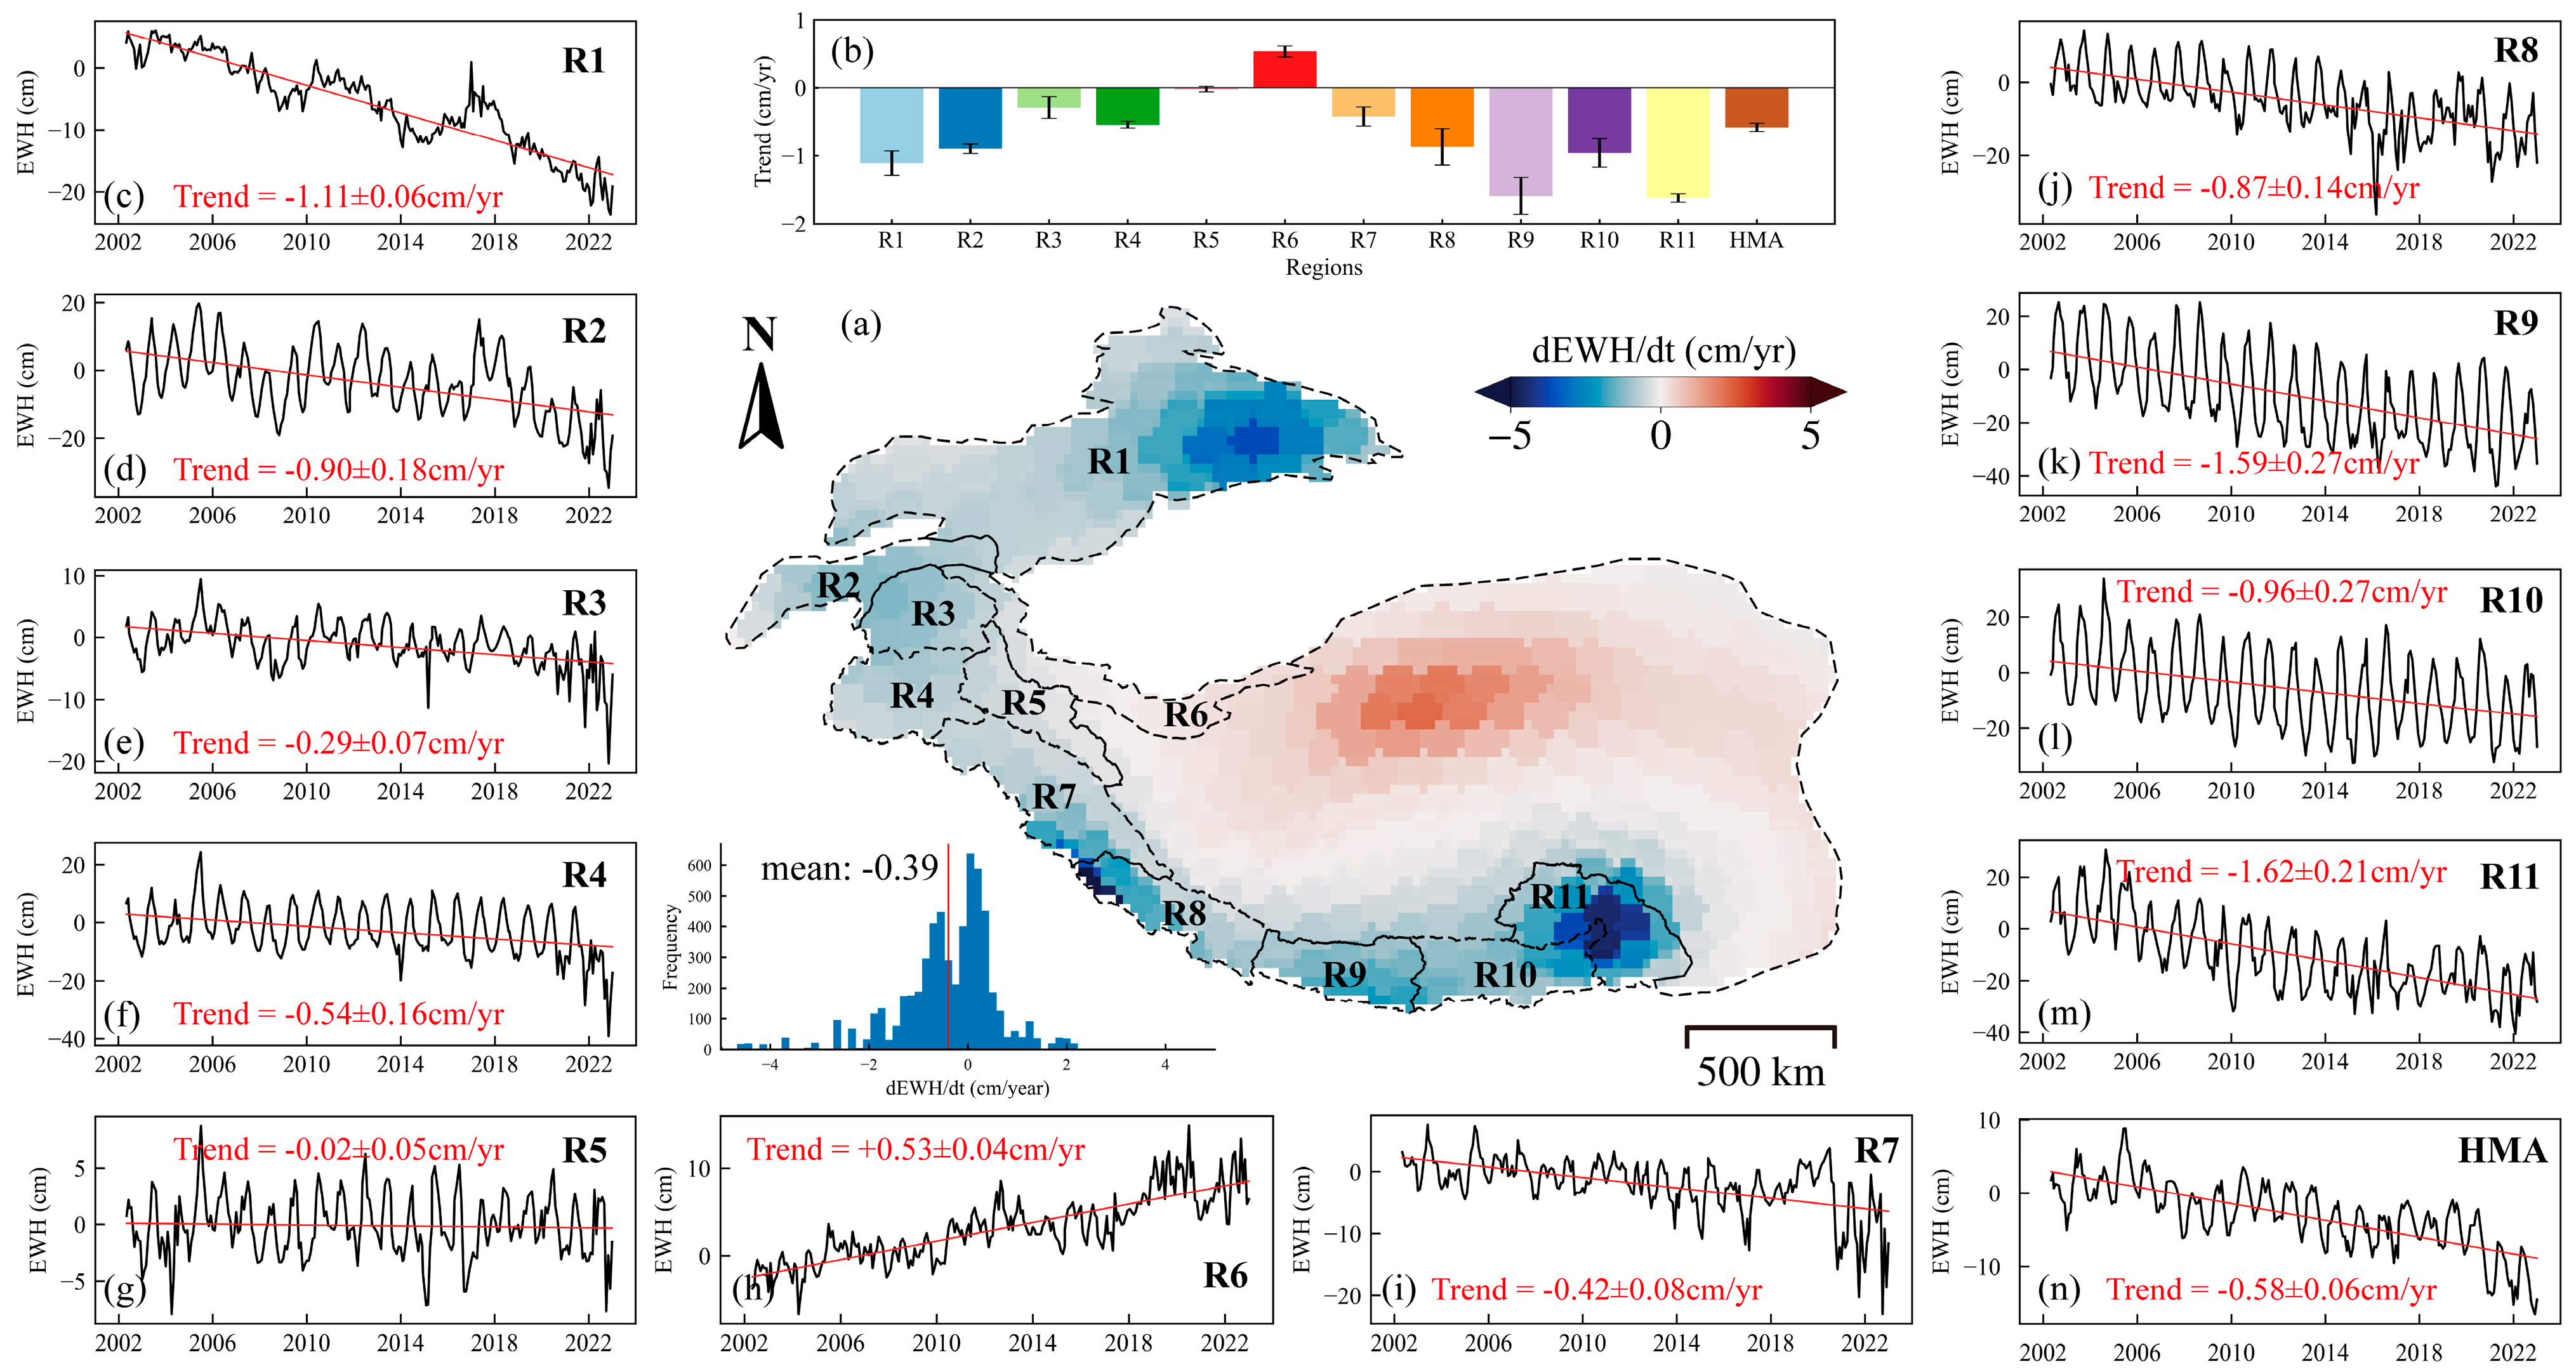
Figure 2 illustrates the time series and spatial trend diagrams of the glacial mass changes in HMA and its subregions, calculated based on 249 months of mascon data from April 2002 to December 2022. In the entire HMA region (Figure 2a), the inversion results indicate the presence of positive signals traversing the interior of HMA, with an average change rate of approximately 1.5–2 cm/yr. The glacier mass change signals in the Tianshan, Pamir, Himalayas, and Nyainqentanglha Mountains all exhibit negative signals. The results of this study are largely consistent with those of Jing et al. and Zhan et al. [38,39]. In general, the glacial mass changes in HMA exhibit spatial heterogeneity.
Since the glacier change trends in the subregions are different, in order to facilitate a more comprehensive analysis of glacier changes in the subregions, the trend values for each region are shown in Figure 2b. The glacier melting trend from R1 to R9 generally exhibits an initial decrease followed by an increase. Figure 2c–m gives the time series of glacier mass changes in 11 subregions of HMA. It is evident from Figure 2h that the Kunlun region (R6) exhibits an increasing trend, with a mass gain rate of approximately 0.53 cm/yr (Figure 2h). The remaining glacier regions all exhibit a melting trend, with the fastest melting rates observed in R9 and R11, with mass loss rates of approximately 1.59 cm/yr and 1.62 cm/yr, respectively. Following them are R1, R2, R8, and R10 with mass loss rates around 1 cm/yr. R4 and R7 exhibit comparable mass loss rates, with an average of approximately 0.5 cm/yr. The R3 region exhibits a comparatively lower glacial mass loss rate of 0.29 cm/yr, while the R5 region shows minimal changes with a nearly 0 change rate. Figure 2n depicts the time series of mass changes across the entire HMA region, showing a downward trend with an overall rate of −0.58 cm/yr. Furthermore, we observed a pronounced decline in glacier mass change in R2, R3, R4, R5, and R7 (Figure 2d–g,i) in 2020. These glacial areas are all areas where westerly winds prevail. It is hypothesized that this phenomenon is a consequence of the influence of the westerly wind belt. The glacial mass changes observed in the HMA region exhibit regional characteristics. The southern Himalayan region exhibits significant seasonal fluctuations, whereas the northwestern Pamir and Tianshan regions display comparatively minor seasonal fluctuations.

4.2. EOF of Glacial Change

The climate in HMA is highly complex, influenced not only by precipitation and temperature but also by various atmospheric circulations [40,41]. GRACE observations reflect the combined effects of multiple climate factors on glacier mass changes in the HMA region. The interactions among these climate factors make it challenging to discern the glacier’s response to individual climate influences. EOF analysis can take a complex change field and express it mathematically according to the principle of maximum signal variance, and represent the complex change field as several main change components. In this section, EOF analysis was used for mascon data from April 2002 to December 2022, with the annual cycle removed. Additionally, a wavelet analysis of temporal mode was conducted in order to analyze the main components of glacier mass change and what periodic signals are contained in those main components, with a view to determining the potential main factors driving glacier mass change.
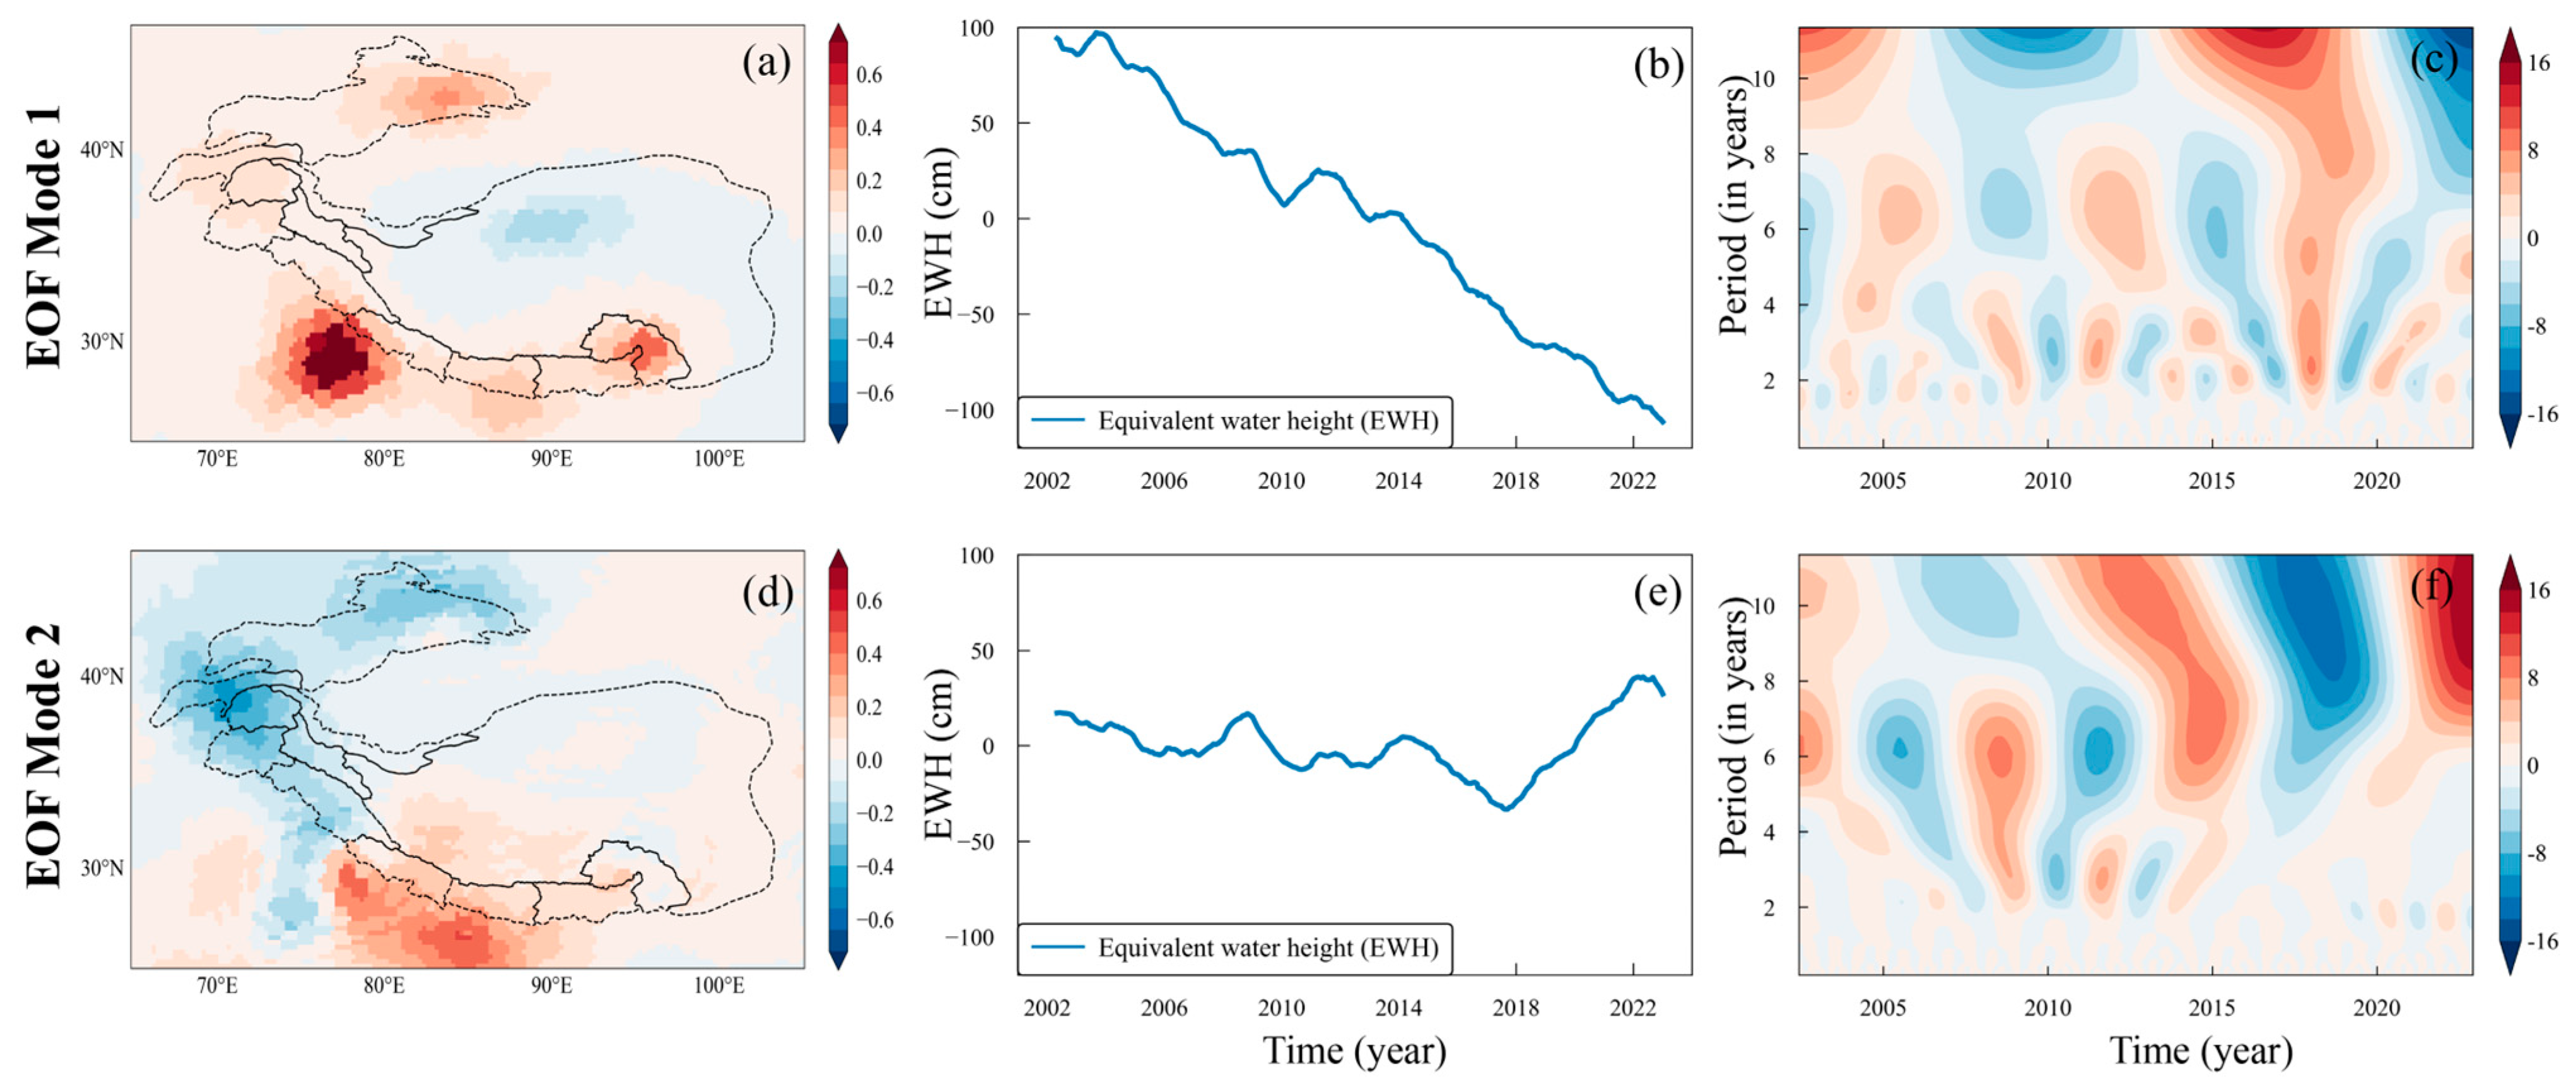
Figure 3a illustrates the spatial variation characteristics of the first mode of EOF. It reflects that the positive signal is strong in the southern HMA region, especially in the Himalayan, Nyainqentanglha, and Tianshan regions. Figure 3b illustrates the temporal distribution characteristics of the first mode, which primarily reflect the trend features of glacier mass changes in the HMA region. Combined with the first spatial mode (Figure 3a), it becomes evident that the mass changes in the Himalayan, Nyainqentanglha, and Tianshan regions exhibits a downward trend. In the inland area of the HMA region, the first mode spatial change shows a large negative value in this area, indicating that the inland changes in the HMA region are primarily rising. These findings align with those presented in Figure 2a. Figure 3d,e are the second mode results of the EOF of the HMA regional mass change. It mainly reflects the changes in the glacial areas of HMA.
Figure 3c,f illustrate the wavelet analysis of the EOF temporal modes. It is evident that both the first and second modes exhibit periodic signals in the range of 2–7 years, with opposite phases. This indicates that the driving mechanisms of these two modes are opposite. Combined with the spatial modes, these interannual fluctuations are more pronounced in the HMA glacier region. Further investigation is required to ascertain whether these interannual fluctuations are associated with specific climatic variables, such as ENSO.

4.3. SSA

The preliminary results from EOF and wavelet analysis indicated the presence of interannual signals in the range of 2–7 years in the HMA region. These findings offer valuable clues for a deeper understanding of climate change in HMA. In order to gain a comprehensive understanding of the fundamental mechanisms driving glacier mass change in the HMA region, further exploration is required to uncover the potential drivers of these interannual signals. Glacier and climate data contain multiple periodic signals, which makes it challenging to discern the connections between them. SSA is an effective tool for analyzing non-periodic signals and complex interannual changes in spatiotemporal data, with high signal-noise separation capabilities. Consequently, this section will employ the SSA method to decompose the time series of glacial mass, precipitation, temperature, and ENSO events in the HMA region and extract their interannual variation signals to reveal the interrelationship between them.

4.3.1. Correlation Analysis between Precipitation, Temperature and Mass on Interannual Scale

We will investigate the relationship between glacier mass and temperature, as well as precipitation. Precipitation and temperature are considered the primary drivers of glacier mass changes. Through a thorough analysis of the relationship between temperature, precipitation, and glacier mass changes, we can gain a better understanding of the direct impact of climate change on glaciers.
The time series of mass, precipitation, and temperature changes were computed for the 11 subregions. Then, linear trends were removed from the original time series. Subsequently, the SSA method was employed to decompose the time series, selecting components with time scales exceeding 3 years for reconstructing the interannual signals, as these components contain crucial information about interannual variations.
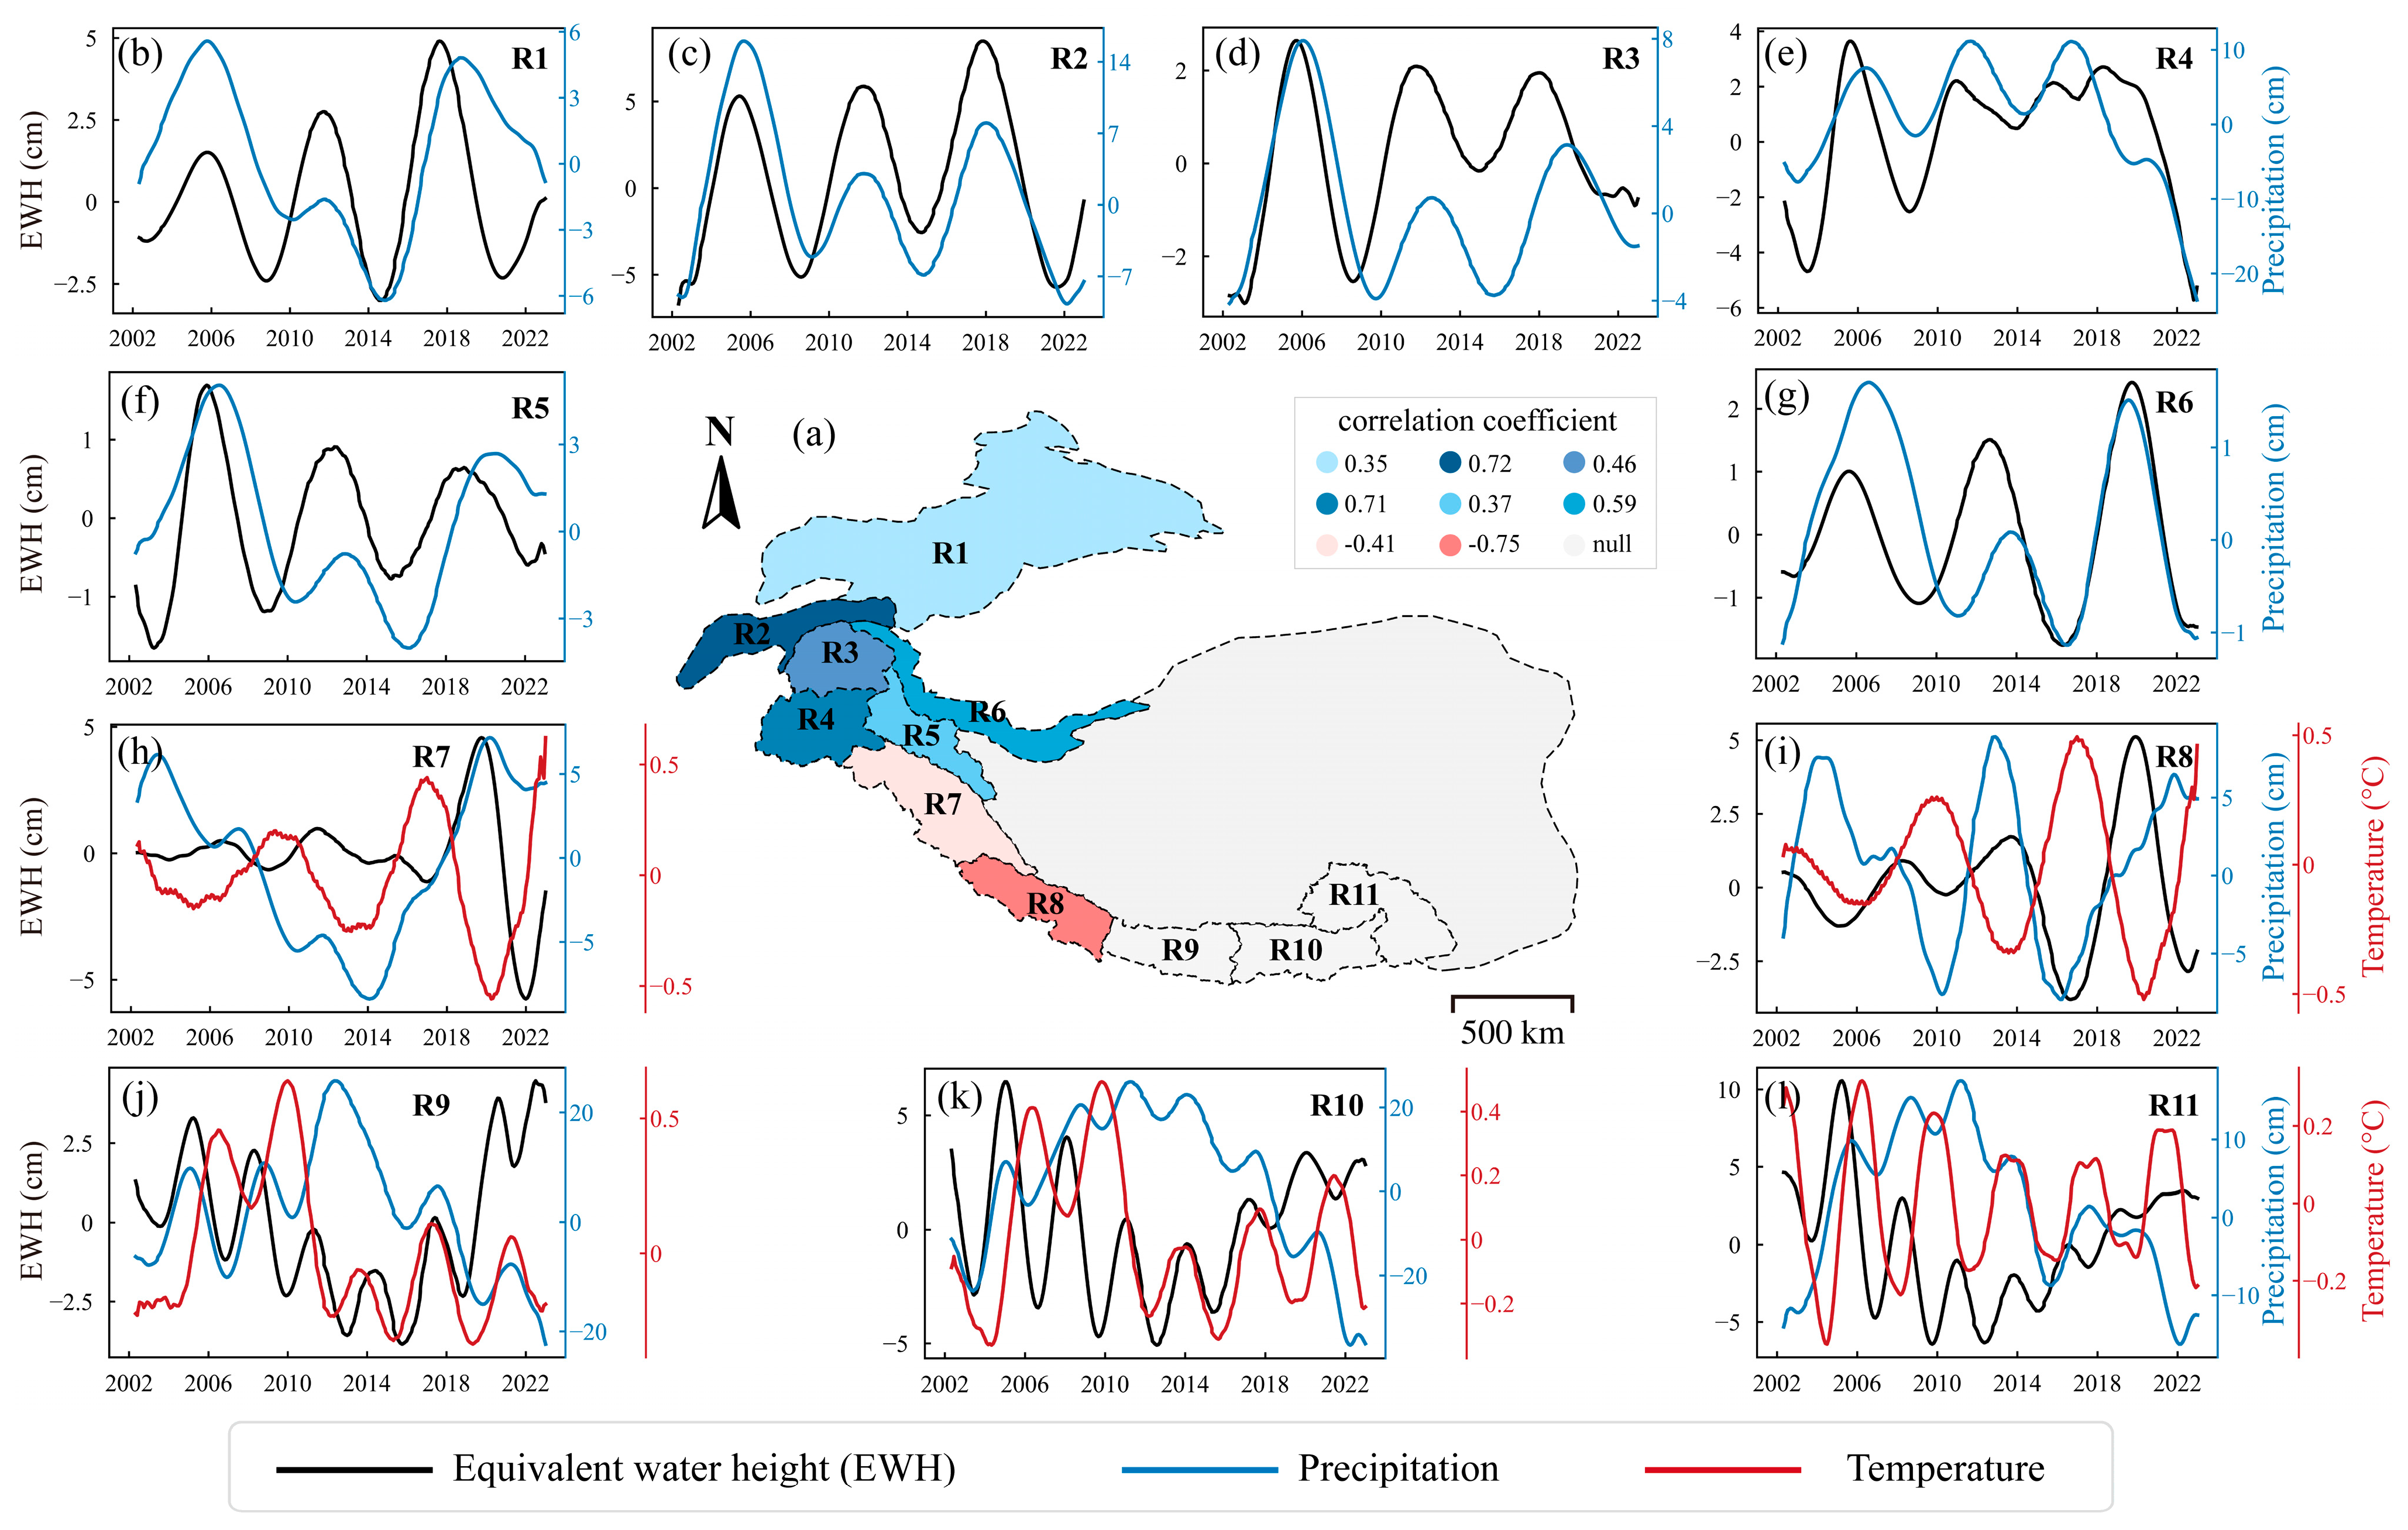
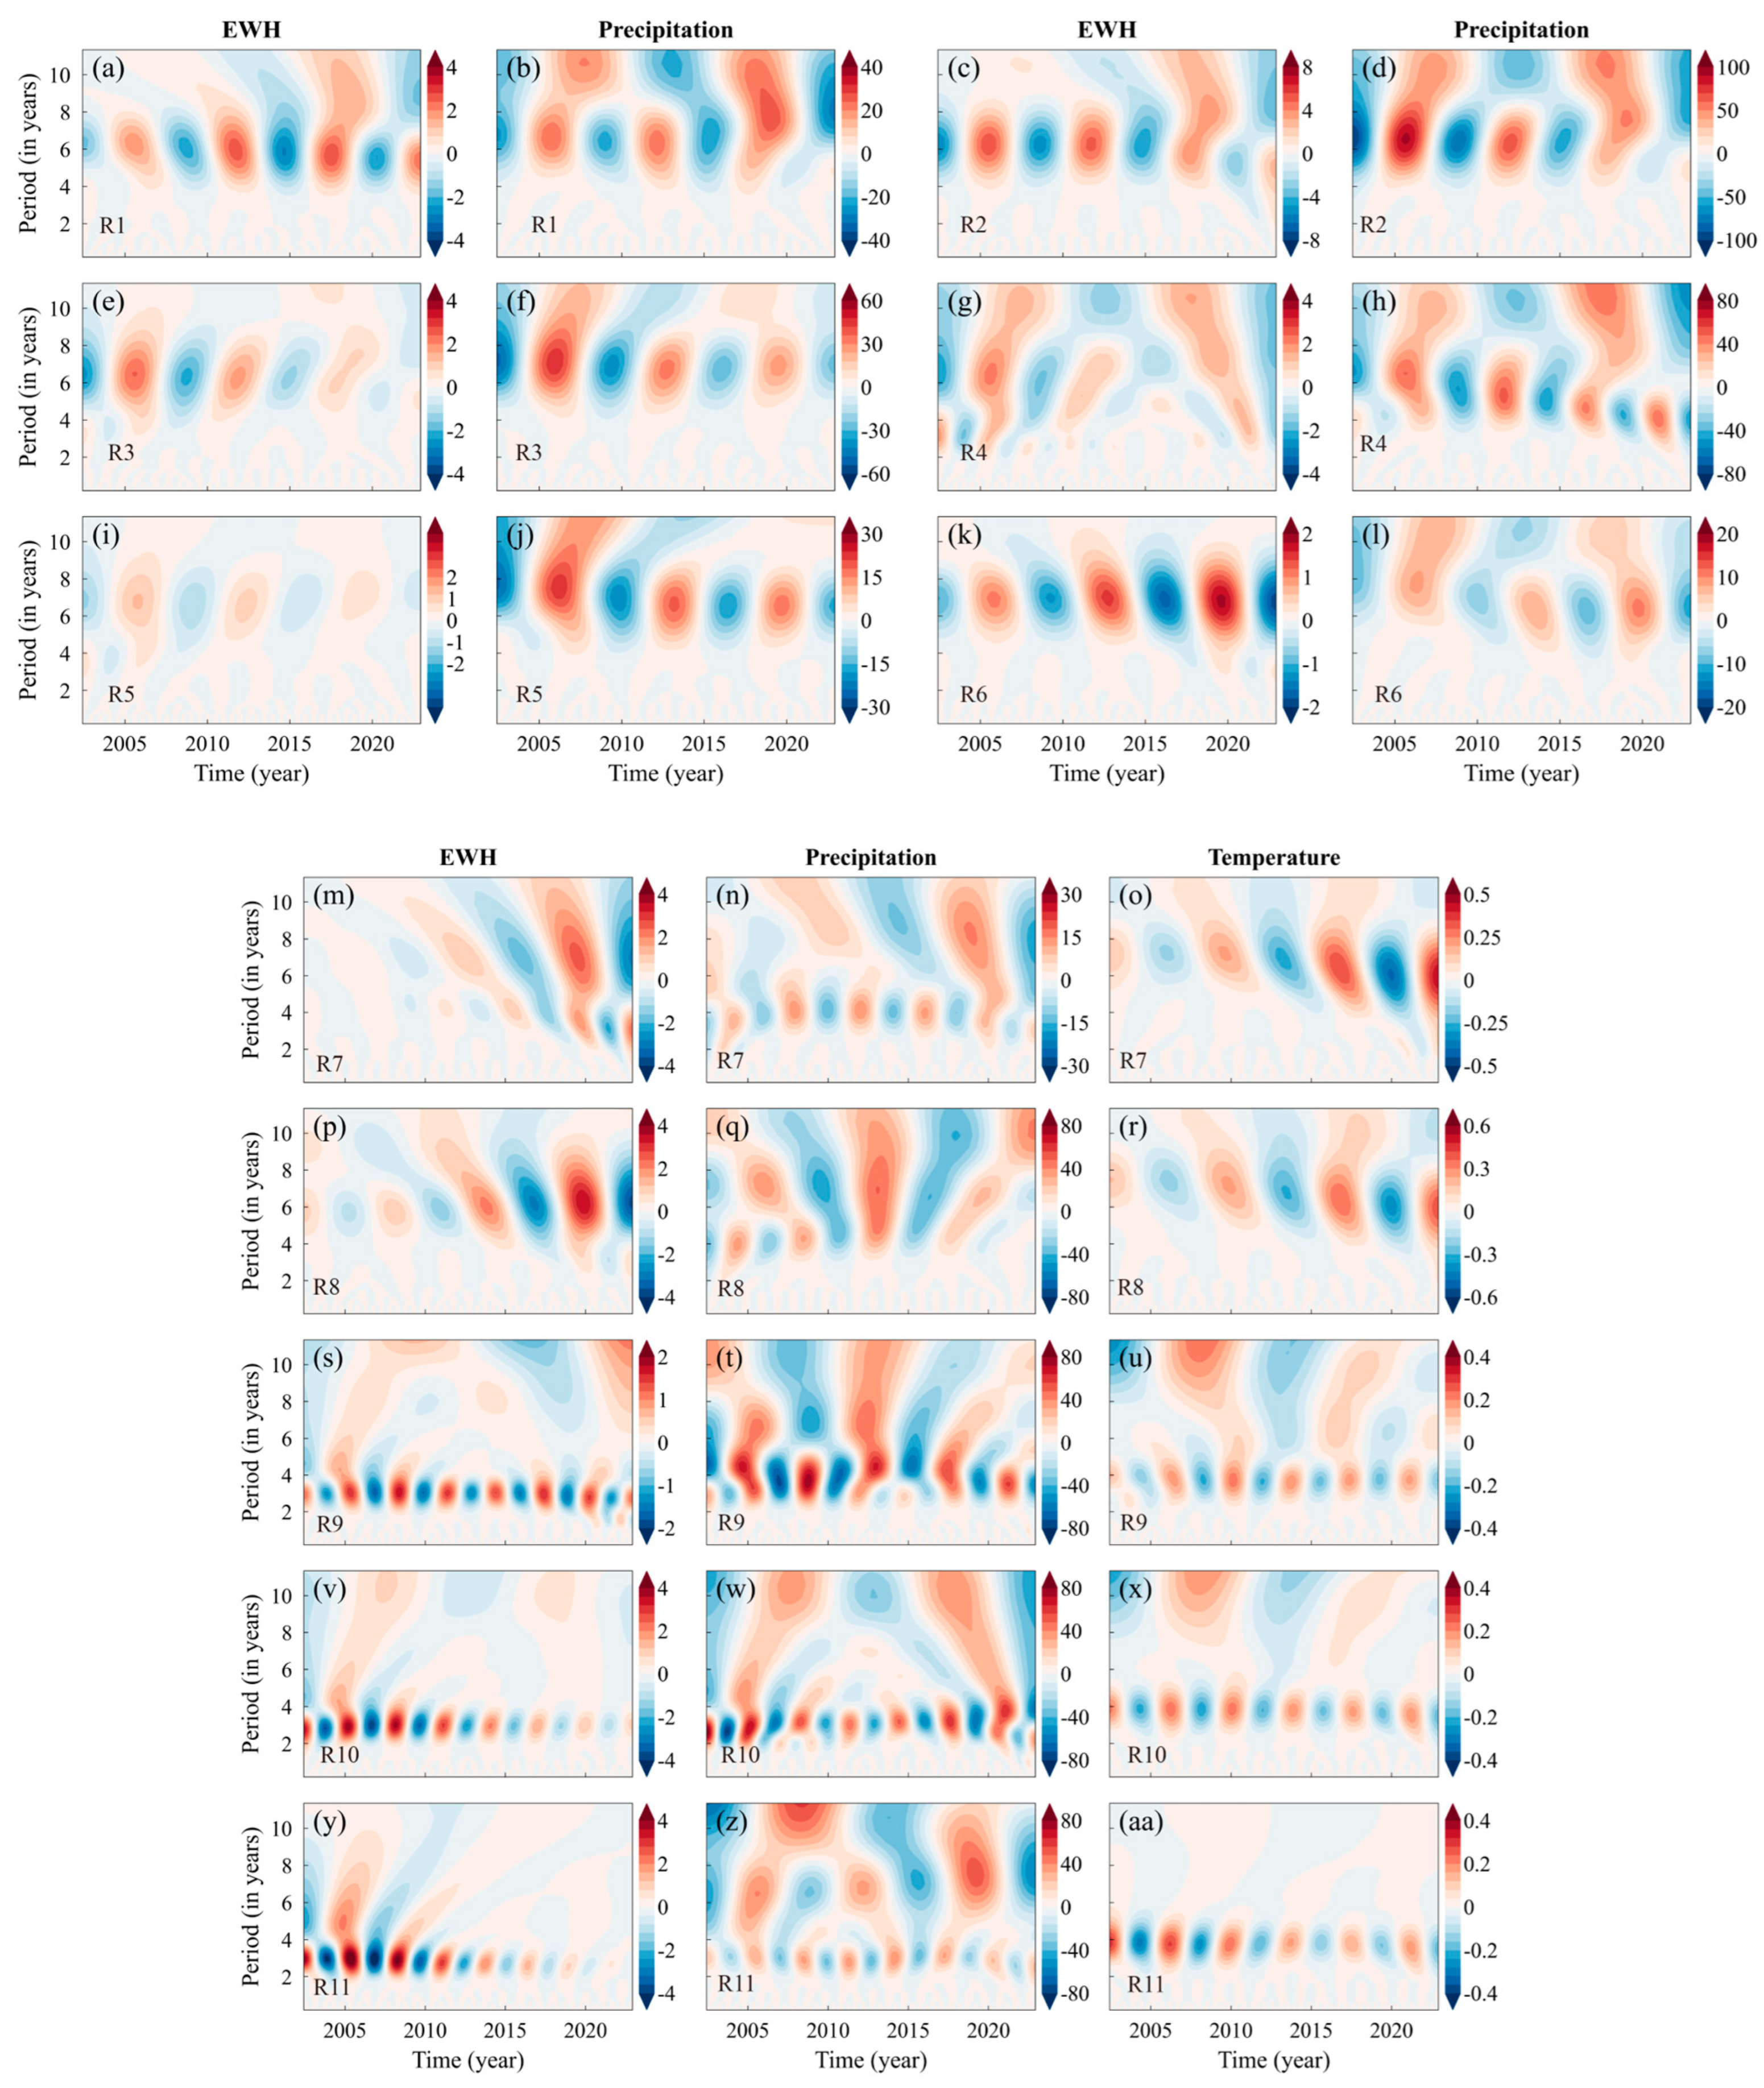
Following the SSA of the data for the six regions (R1–R6), it was observed that there were no discernible interannual signals in temperature change in these regions. Consequently, we focused on the correlation analysis between glacial mass changes and precipitation in these regions. Figure 4b–g illustrate the interannual fluctuations in glacier mass and precipitation for the regions (R1–R6). The results indicate a significant interannual fluctuation in both precipitation and glacier mass for the six glacier regions. The interannual variations in glacier mass (in black) and precipitation (in blue) exhibit similar time patterns with peaks and valleys aligning closely. Correlation analysis revealed correlations of 0.35, 0.72, 0.46, 0.71, 0.37, and 0.59 between glacier mass and precipitation for regions (R1–R6), respectively. All correlations are above the 99% confidence level. Furthermore, in order to analyze the driving mechanism behind these interannual signals, we employed wavelet analysis to obtain their period information, and the results are presented in Figure 5a–l. It is evident that significant 6–7-year periodic signals exist in the time series of both precipitation and glacier mass interannual variations for all six regions ((a,b) R1, (c,d) R2, (e,f) R3, (g,h) R4, (i,j) R5, and (k,l) R6). Additionally, the phases of precipitation and mass changes are consistent for each glacier. This also indicates that the interannual variations in glacier mass in these regions are primarily influenced by interannual variations in precipitation. Wang et al. indicated a significant correlation between interannual changes in glacier thickness and annual precipitation in the Pamir and Hindu Kush glaciers during the period of 2003–2008 [42], which is consistent with the results of our study. Moreover, our study provides evidence over a longer time scale (2002–2022), demonstrating that the interannual variations in glacier mass in the Pamir and Hindu Kush regions are primarily influenced by interannual variations in precipitation.
In the regions of the (R7–R11) regions, after SSA of the temperature time series, interannual variation signals were identified. Therefore, we analyzed the correlation between glacier mass changes and temperature and precipitation in these regions. Figure 4h–l illustrate the time series of the interannual signals of mass changes (in black), precipitation changes (in blue), and temperature changes (in red) for the five regions.
The correlation between interannual glacier mass changes and interannual precipitation changes in the region (R7) is 0.01 (p > 0.05), which is not statistically significant. However, the correlation with temperature is −0.41 (p < 0.05), and it is significant. Compared with precipitation, temperature exerts a more pronounced influence on interannual fluctuations of glaciers. This aligns with the results of Mandal et al. [43]. Mandal et al. conducted a study on the Chhota Shigri and Hamtah Glaciers in the Lahaul and Spiti regions. Their findings indicated that the sensitivity test of the annual mass balance of glaciers based on simulations (temperature index) showed that the effect of temperature change on the glacier surface was particularly prominent compared to precipitation. The correlation between interannual mass changes and interannual precipitation changes in the n (R8) region is 0.26 (p < 0.05). And the correlation with temperature is −0.75 (p < 0.05). This indicates that glacier mass changes in the (R8) region are influenced by both precipitation and temperature, with temperature having a stronger impact than precipitation. Additionally, the wavelet analysis of glacier mass changes and temperature changes in region (R7) and region (R8) show similar signals with the same periodicity (6–7 years) (Figure 5m–o for region (R7) and Figure 5p–r for region (R8)). This indicates that the interannual signals in glacier mass changes in the (R7) and (R8) regions are primarily influenced by interannual variations in temperature. However, in the regions of (R9–R11), the situation is more complex, with no clear correlation between mass changes and precipitation or temperature. This lack of correlation may be attributed to the interaction of multiple factors. The analysis results indicate that glacier mass changes in different HMA regions are influenced by a variety of climatic factors. The interannual variation of glacier mass in the western region is mainly affected by precipitation, while the interannual variation of glaciers in the eastern region is affected by temperature. This indicates that the response of glacier mass change to climate in the HMA is spatiotemporally heterogeneous.

4.3.2. Correlation Analysis with ENSO

El Niño–Southern Oscillation (ENSO) is a climate pattern characterized by periodic fluctuations in sea surface temperatures and atmospheric pressure in the equatorial Pacific Ocean, with a period of approximately 2–7 years. The anomalous variations of ENSO may have a significant impact on the temperature and precipitation patterns in the HMA region [44,45,46]. By analyzing the relationship between temperature, precipitation, and ENSO, the degree and manner of impact of ENSO events on the meteorology of the HMA region can be identified. This will provide a better understanding of how ENSO events are transmitted to glacier mass changes and a deeper understanding of the glacier mass change mechanism.
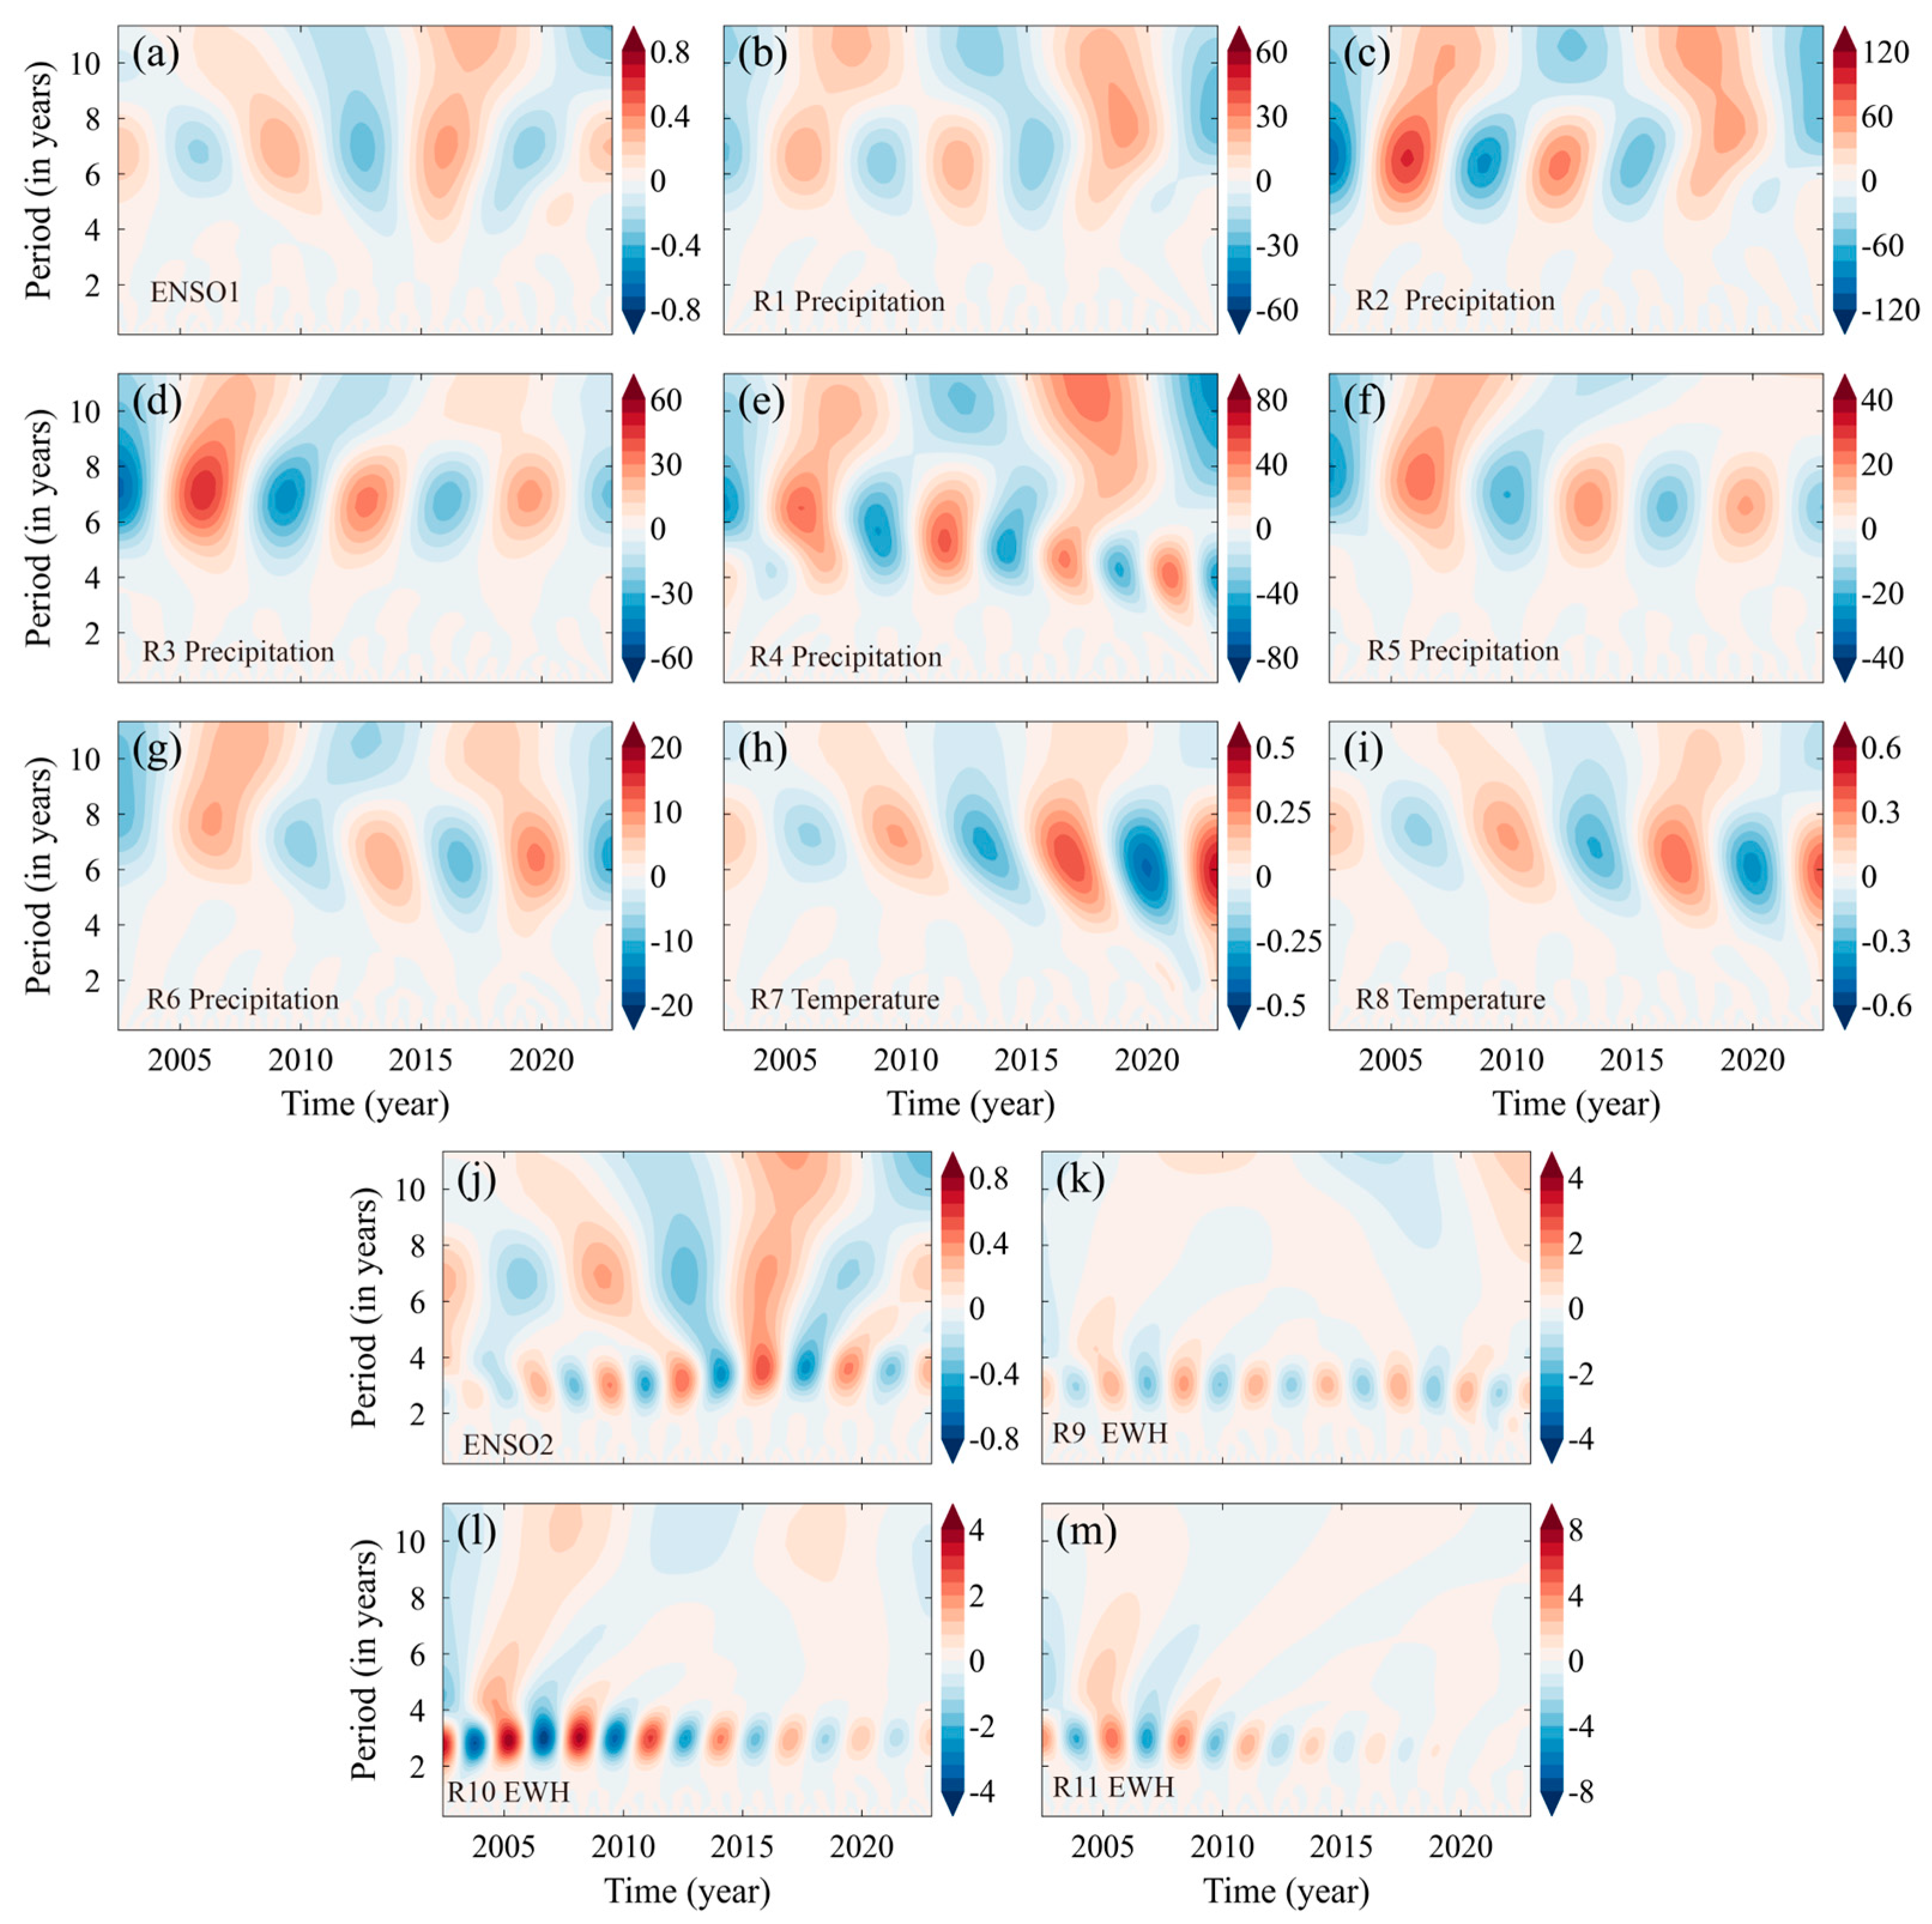
We used SSA to separate the interannual signals of ENSO, and performed wavelet analysis of the interannual signals. Figure 6b–g shows the interannual precipitation signals (in gray) and the interannual ENSO signals (in black) in regions (R1–R6). The results show that ENSO and precipitation in each region have opposite peaks and troughs. The correlation coefficient between the interannual ENSO signal and the (R1) Tianshan interannual precipitation signal is −0.45 (p < 0.01) (Figure 6b). Similarly, the correlation coefficient with the (R2) Pamir Alay interannual precipitation signal is −0.19 (p < 0.01) (Figure 6c) (with a significant correlation for the period from April 2002 to 2018 at −0.45). The correlation coefficient with the (R3) Pamir precipitation interannual signal is −0.55 (p < 0.01) (Figure 6d). Although the correlation between the interannual precipitation variability and ENSO of the (R4) Hindu Kush is not significant over the entire study period, during the period from 2002 to 2014, there is a significant correlation between the interannual ENSO signal and precipitation signals in the (R4) Hindu Kush, with a correlation coefficient of −0.59 (Figure 6e). The correlation coefficient between the interannual ENSO and region the (R5) Karakoram precipitation signals is −0.66 (p < 0.01) (Figure 6f). Similarly, the correlation coefficient with the (R6) Kunlun interannual precipitation signal is −0.37 (p < 0.01) (Figure 6g). Additionally, based on the wavelet analysis shown in Figure 7a–i, it can be observed that the interannual variability in precipitation and ENSO in all six regions exhibits clear 6–7-year periodic signals with opposite phases. In the R2 and R4 regions, the correlations with ENSO during the entire study period are low and may be affected by other interannual signals [47]. Overall, ENSO plays a dominant role in the interannual variability of precipitation in these six regions, thereby impacting the interannual variability of glacier mass.
As mentioned above in Section 4.3.1, the interannual variability of glacier mass in the regions (R7) and (R8) is primarily influenced by temperature. Therefore, in regions (R7) and (R8), we studied the relationship between the interannual variation of temperature and ENSO. Figure 6h,i show the interannual variability of temperature (in red) and ENSO (in black) in the regions (R7) and (R8). It demonstrates that the ENSO and temperature time series exhibit similar peaks and troughs. The results of the correlation analysis indicate that there are significant correlations between the two variables, with correlation coefficients of 0.53 and 0.56 (p < 0.01). Moreover, based on the wavelet analysis, it can be observed that the interannual variability of temperature in these two regions (region (R7) (Figure 7h), and region (R8) (Figure 7i)) and ENSO (Figure 7a) also exhibits strong 6–7-year periodic signals with consistent phases. Overall, ENSO plays a dominant role in the interannual variability of temperature in these two regions, thereby influencing the interannual variability of glacier mass.
The interannual variabilities of glacier mass in the (R9), (R10) and (R11) regions are influenced by both temperature and precipitation, with neither factor dominating. Therefore, we studied the correlation between ENSO and the interannual glacier mass variability in these three regions. The interannual glacier mass variability in these three regions primarily exhibits a periodic signal of 2–4 years. Therefore, we extracted signals from ENSO with periods of more than 2 years, which differs significantly from other regions. We attribute this difference to the interaction of multiple climatic phenomena. The correlation coefficient between ENSO and glacial mass change in region (R9) is −0.58, while the correlation with glacial mass change in region (R10) is −0.46, both exceeding the 99% confidence interval. Wavelet analysis reveals that the interannual variability of glacier mass in both regions (region (R9) (Figure 7k), and region (R10) (Figure 7l)) and the ENSO (Figure 7j) exhibit strong 2–4 years periodic signals with opposite phases. This indicates that ENSO plays an important role in the interannual variability of glaciers in the two regions. The correlation between ENSO and glacier mass variability in region (R11) Nyainqentanglha is relatively weak at −0.36 but still significant. This suggests that other meteorological factors may influence glacial mass change in region (R11) Nyainqentanglha, and the impact of ENSO is relatively small here [48]. This is consistent with the conclusion of Figure 3d, which indicates that the second spatial mode signal in region (R11) Nyainqentanglha is weak. The wavelet analysis diagram of the second temporal mode shows that the second mode has a signal of 2–7 years. This illustrates that the 2–7 years signal in the region (R11) Nyainqentanglha area is weak, and combined with the analysis in this section, it further shows that the influence of ENSO is weak.
The differences in the interannual anomaly changes in glacier mass among these subregions are mainly due to their distinct spatial distributions and geographical environments, highlighting the spatiotemporal heterogeneity in the regulatory mechanisms of glacier mass changes in response to climate.

5. Discussion

5.1. HMA and Climate Indices

ENSO has a significant impact on the climate of most monsoon regions in Asia. During ENSO events, these areas often exhibit dry climatic conditions [49,50,51]. In this study, we found a strong correlation between glacier mass in the HMA region and ENSO (Figure 7). Zhu et al. also indicated that ENSO has a certain impact on changes in underground water storage in the southeastern part of the Tibetan Plateau, with a relatively stronger influence on areas experiencing significant water storage losses [52]. Xu et al. [53] found an ENSO correlation in a 1000-year major ion record from a 108.83 m ice core at East Rongbuk Glacier on Mount Everest’s northeastern slope. The results of our study indicate a negative correlation between ENSO and precipitation in the western part of the HMA region. This is because ENSO indirectly influences the climatic variability of HMA by modulating the South Asian monsoon [54,55]. During winter, ENSO typically leads to increased sea surface temperatures in the Pacific, while in spring and summer, it triggers abnormal temperature patterns in the South Asian monsoon [56,57,58]. These abnormal patterns propagate westward to the Tibetan Plateau, potentially causing reduced precipitation and exacerbating glacier mass loss [56,57,58]. Simultaneously, during the development of El Niño events in summer, the Indo-Burma Trench becomes stronger, preventing moisture from entering the southwestern plateau and causing insufficient summer precipitation in that region [59]. Additionally, El Niño events can enhance or weaken the winter monsoon circulation, thereby regulating the intensity of cold air invasions from Siberia, influencing temperatures and snowfall [60].
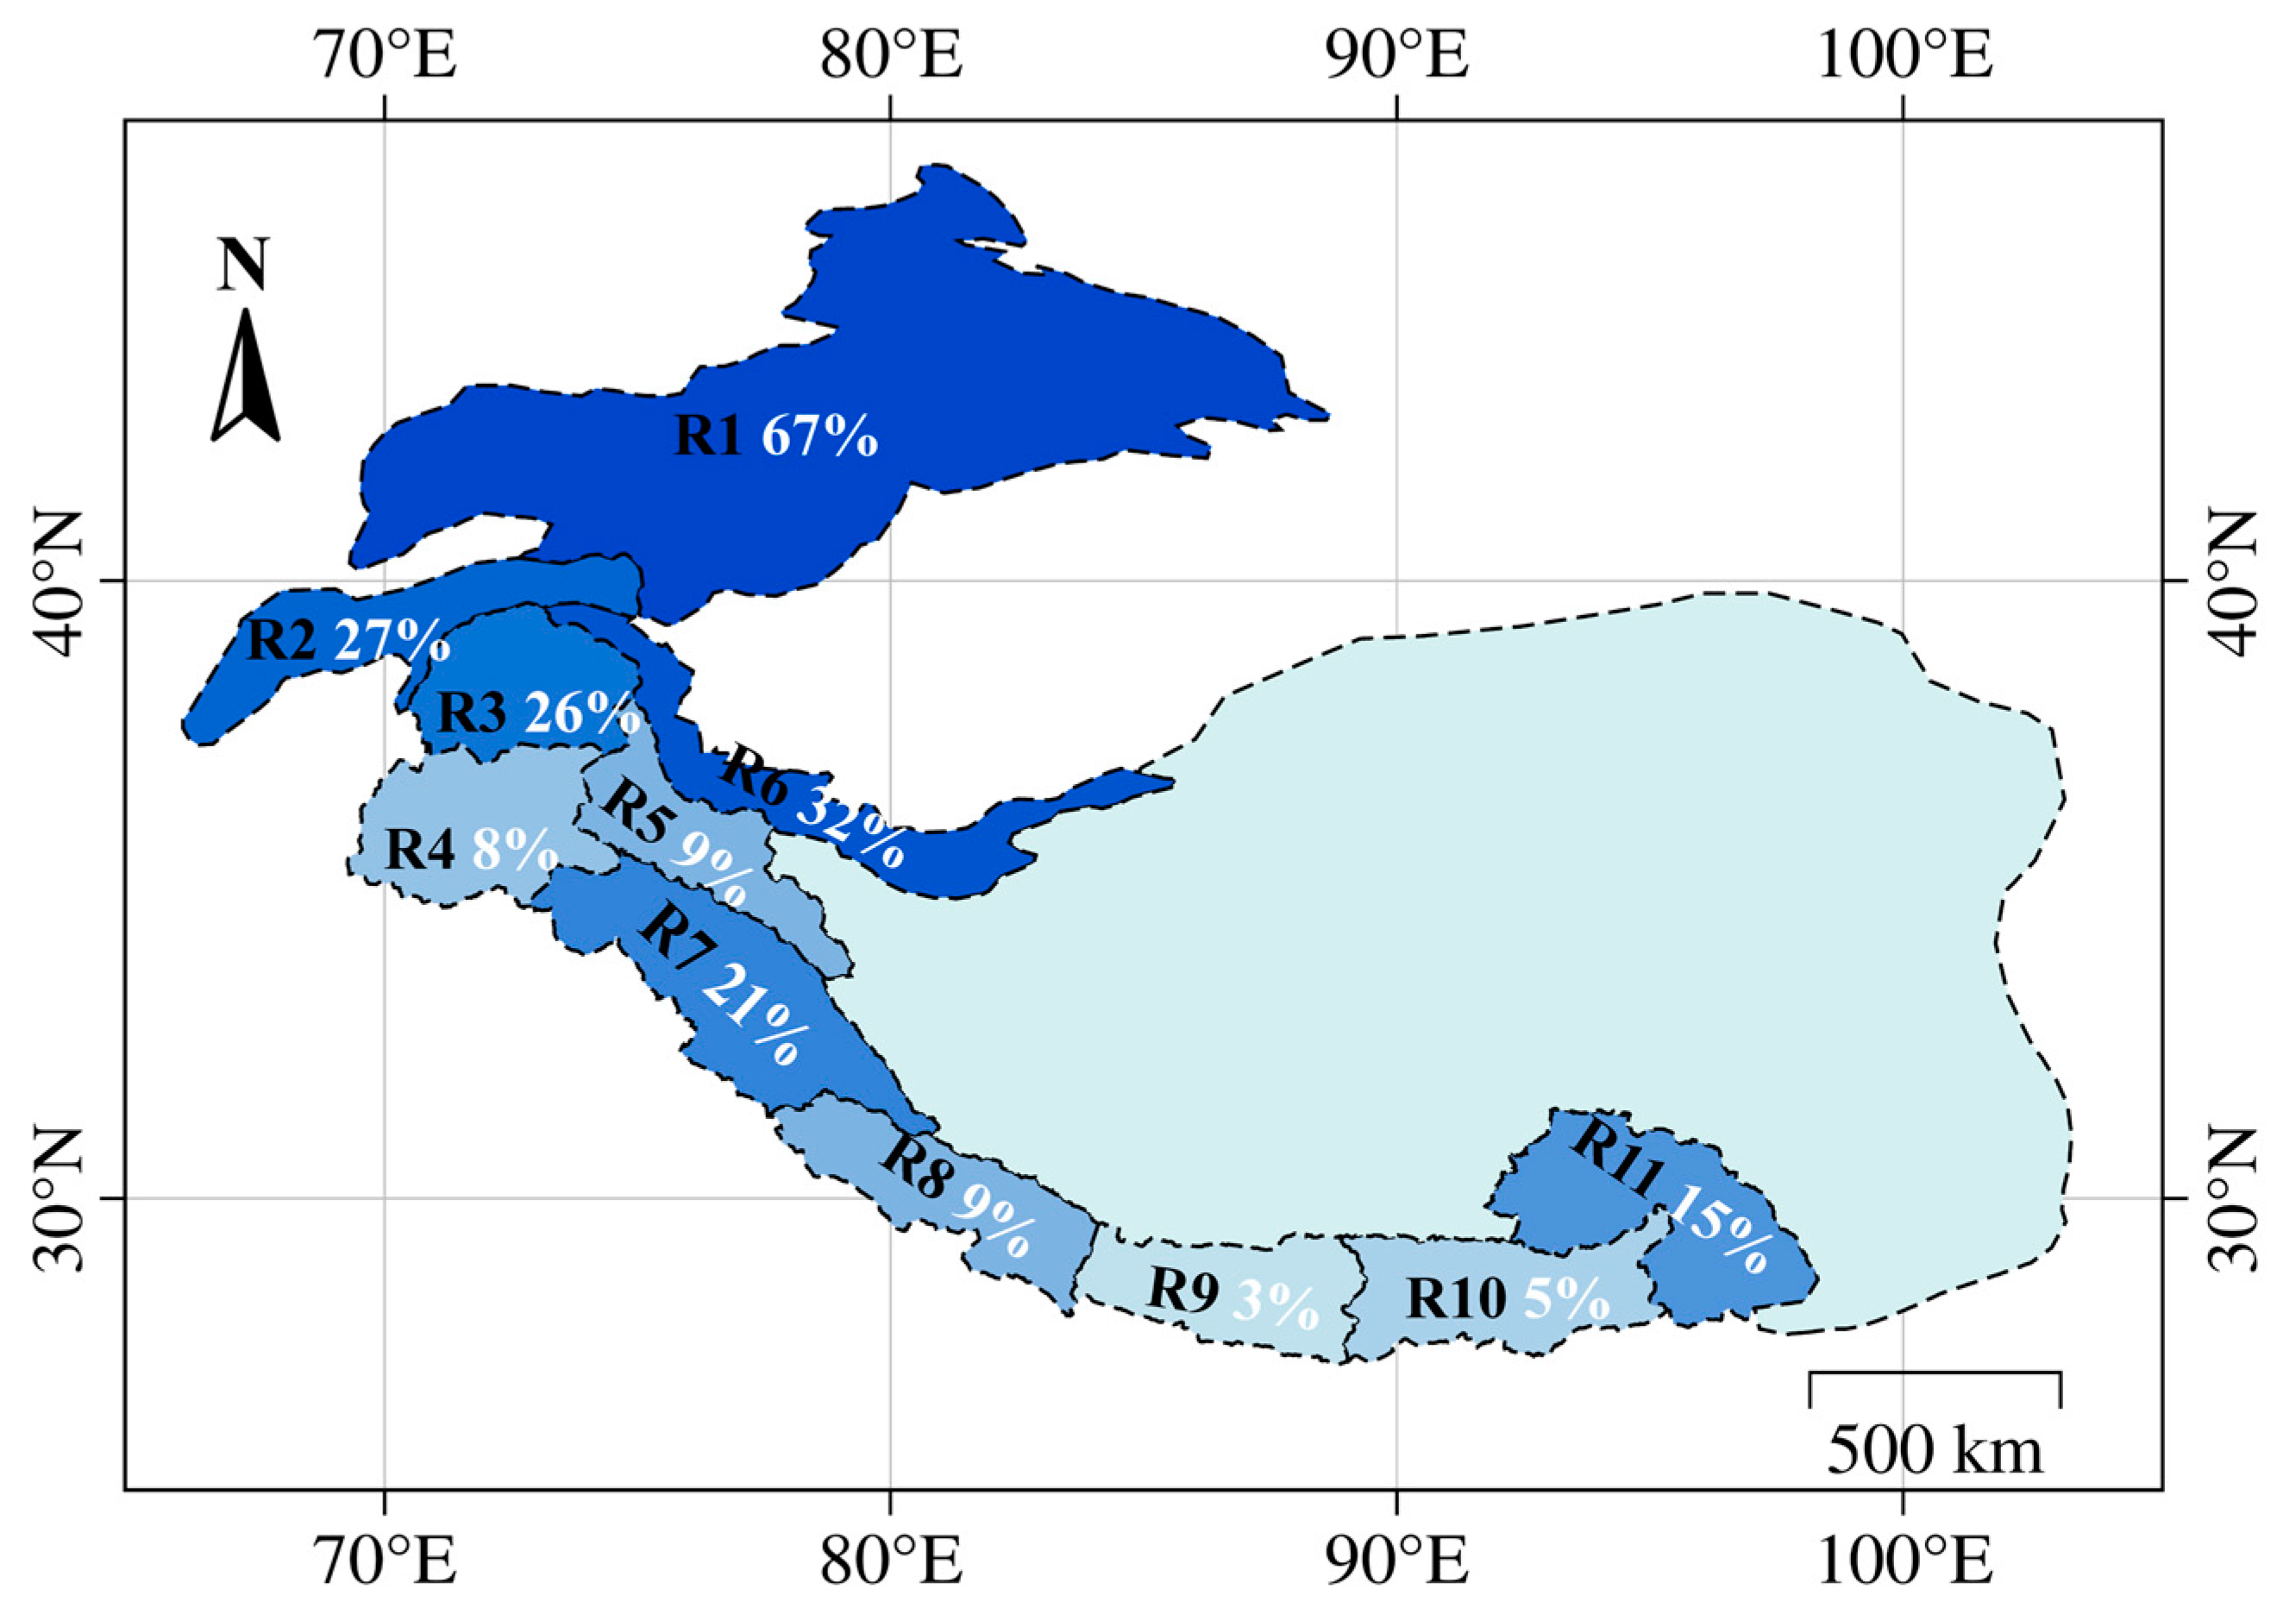
Through SSA of the glacier mass change time series in various HMA regions, we found that the proportion of interannual signals of glacier mass change differs between different regions. The proportion of interannual glacier mass changes in each region is shown in Figure 8. It can be observed that the proportions of the interannual signals in regions (R4), (R5), (R9), and (R10) are all relatively small, less than 10%. This indicates that interannual glacier variations in these regions are relatively weak. The proportion of interannual signals gradually decreases from region (R1) to (R4) and (R5), while it increases first and then decreases from regions (R4) and (R5) to regions (R9) and (R10). This is because different subregions have different climatic and hydrogeological conditions, with the western, eastern, and southern parts of HMA being mainly influenced by the westerlies, East Asian monsoon, and Indian monsoon, respectively [61]. The Himalayan region experiences a strong Indian monsoon [39]. The Hindu Kush and Karakoram regions are influenced by strong westerlies [62]. Both the Indian monsoon and the westerly wind are significant annual signals, indicating that the Himalayan and Hindu Kush regions are strongly affected by the annual signals. This is consistent with the results of this study, where the interannual signal is weak in the Himalayan and Hindu Kush regions. But this does not mean that the westerlies only affect Hindu Kush and Karakoram. Yi and Sun’s research shows that the Pamirs and Tianshan Mountains are also affected by the westerly winds [63]. In summary, our study indicates the influence of El Niño events on glaciers in the HMA. This impact is complex and influenced by the geographic location and interactions of atmospheric circulations.
Furthermore, we find that both glacier mass and precipitation changes in the western part of HMA (R1–R6) contain significant 6–7-year oscillation, while glacier mass and precipitation, as well as temperature, show 2–3-year oscillation in the eastern part (R9–R11).
These findings are consistent with the correlation of cyclic oscillations in the Earth system [64,65,66,67,68]. Several studies have reported that the 6-year oscillation in Earth Orientation Parameters (EOPs) and climate parameters be related to the deep Earth’s structure and the interaction between the Earth’s core and mantle [67,68,69]. The exact driving force of the 6–7 years signal observed in the western part of the HMA is still unclear and further investigations are needed.
Chen et al. [67] also found oscillations over a 2–6-year period in geodetic observations of Earth Orientation Parameters (EOPs) (polar motion and length-of-day), and showed that oscillations on seasonal and shorter time scales are dominated by mass redistribution of the Earth’s climate system including oceans, atmosphere, and hydrosphere, with the remaining long term oscillations attributed to the Earth’s depths. The 2–3-year oscillations that were found in regions (R9–R11) belong to shorter time scales and are consistent with similar cyclic oscillations in the global climate system, which may be due to specific climatic and geologic features of the region. Such cyclic variations may reflect climatic and environmental influences specific to the Tibetan Plateau, such as seasonal variations and topographic features specific to the alpine region.

5.2. Spatial Heterogeneity in the HMA

Glacier mass balance varies significantly across different regions. At the interannual scale, the glacier mass changes in the eastern HMA region, including region (R1–R6): Tianshan, Pamir Alay, Pamir, Hindu Kush, Karakoram, and Kunlun, are mainly driven by precipitation. In contrast, the interannual variation of glaciers in the remaining five regions (R7–R11) are closely related to temperature.
Deng et al. [70] conducted an analysis of the degree-day factors for 24 glaciers on the Tibetan Plateau and found that the southeastern part of the Tibetan Plateau is more temperature sensitive than the northwestern part, aligning with the findings of our study. The study by Zhu et al. [71] on the Muji Glacier in the northeastern part of the Pamir Plateau employed sensitivity analysis to investigate the impact of precipitation, especially during the melting season, and temperature on its mass balance changes. The results indicated that precipitation had a significant influence on the interannual variations in the mass balance of the Pamir Glacier, particularly concerning factors such as albedo, meltwater capacity, and snow accumulation. This finding aligns with the conclusions of our study, supporting that the interannual glacier mass changes in the Pamir region are predominantly driven by precipitation. Additionally, our study establishes a strong relationship between the interannual temperature changes in the southeastern HMA and ENSO.
In general, glacial mass balance responds differently to water factors (precipitation) and heat factors (temperature, net radiation). Specifically, between April 2004 and December 2022, glaciers in the western region exhibit a stronger response to changes in water factors, while glaciers in the eastern region show a stronger response to heat factors [40,72,73]. The reason is that the glaciers in regions (R1–R6) belong to continental glaciers, the main characteristic of which is that the temperature of the perennially frozen layer of the glacier is in a negative temperature state. This negative temperature state makes them less sensitive to temperature fluctuations. However, if future temperature increases lead to prolonged periods above freezing, these glaciers could become much more sensitive to temperature changes. On the other hand, the glaciers in regions (R7–R11) belong to maritime glaciers, which are characterized by the temperature of the glacier’s perennially frozen layer being close to zero degrees or the pressure melting point. Maritime glaciers are highly sensitive to climate change and have a weaker response to changes in precipitation [72].
The warming of HMA is primarily driven by increased greenhouse gas emissions [74]. Additionally, changes in cloud cover [75], snow and ice albedo feedback [76], the Asian Brown Cloud [77], and anthropogenic land-use changes [78] also contribute to the region’s climate warming. The rise in greenhouse gas concentrations directly leads to an increase in regional temperatures, while changes in cloud cover and albedo feedback mechanisms further amplify this warming effect. Specifically, as temperatures rise, accelerated melting of snow and ice decreases the surface albedo, resulting in more solar radiation being absorbed, which further increases temperatures. The formation and spread of the Asian Brown Cloud also affect regional climate patterns by altering the radiative balance in the atmosphere. Moreover, anthropogenic land-use changes, such as agricultural expansion and urbanization, may contribute to warming by altering surface characteristics and local climate conditions. These factors collectively contribute to the complex background of climate warming in HMA.
Although our study primarily focuses on the relationship between ENSO and glacier mass balance, acknowledging these additional factors is essential for a comprehensive understanding of glacier dynamics. Future research should consider these confounding influences to better assess the full range of factors affecting glacier mass balance and climate change impacts on high mountain regions.

6. Conclusions

In this study, we used data from the GRACE/GRACE-FO satellite gravimetry in the past two decades to study interannual variations of glacier mass in HMA and its subregions. In addition, this study explores the impact of ENSO on interannual glacier mass change in the HMA subregions by analyzing data from 2002 to 2022, rather than focusing on isolated climate events.
(1) It was observed that the overall glacier mass in the HMA region exhibited a decreasing trend over the past two decades. The overall melting rate is ~ −0.58 cm/yr. Glaciers with significant mass loss are concentrated in the peripheral areas of HMA, such as the Himalayan, Tianshan, and Pamir regions, while glaciers in the Kunlun region show a trend of mass gain. We found 6–7-year oscillations in the western part of HMA (R1–R6) and 2–3-year oscillations in the eastern part (R9–R11).
(2) At the interannual scale, glacier mass variations in the eastern Tibetan region, including Tianshan, Pamir Alay, Pamir, Hindu Kush, Karakoram, and Kunlun, are primarily dominated by precipitation. ENSO mainly influences interannual variations of glacier mass by affecting precipitation. On the other hand, in the Himalaya region, especially in Spiti Lahaul and West Nepal, the mass variations are primarily dominated by temperature. ENSO affects the interannual glacier mass changes by influencing temperature. In the eastern Himalaya region, including East Nepal, Bhutan, and Nyainqentanglha, glacier mass changes are jointly dominated by temperature and precipitation. The interannual glacier mass changes are also related to ENSO.
In summary, this study not only reveals the regional differences and interannual variation patterns of glacier quality in the HMA area, but also clarifies the mechanism of ENSO affecting glacier quality through different climate factors in different subregions, which is of great significance for improving climate models, predicting future glacier behavior, and formulating climate change adaptation and mitigation strategies.
In addition, due to the low spatial resolution of GRACE/GRACE-FO observations, our estimated HMA glacier mass changes may include contributions from snow–water changes in the surrounding regions [79], which is difficult to accurately quantify and separate from GRACE/GRACE-FO estimates. This may affect our estimated glacier mass changes, but will not change our main conclusions, which are based on correlation and wavelet analyses. For similar reasons, the impact from groundwater depletion in northern India on our R7 and R8 GRACE/GRACE-FO estimates mostly manifests itself on long-term time scales and would not significantly affect our main conclusions which focus on interannual time scales. In order to study HMA glacier mass changes more accurately, future studies are needed to integrate GRACE/GRACE-FO observations, available in situ measurements, climate model predictions, and other remote sensing data to improve the quantification of glacier mass changes in HMA and its subregions and to better understand the connections between glacier mass change and environmental factors.

Author Contributions

Conceptualization, J.Z. and H.S.; methodology, Y.W., J.Z., and H.S.; software, Y.W.; validation, J.Z; writing—original draft preparation, Y.W.; writing—review and editing, J.Z., H.S., and J.C.; visualization, Y.W.; supervision, J.C.; funding acquisition, H.S. and J.C. All authors have read and agreed to the published version of the manuscript.

Funding

This research was funded by the National Natural Science Foundation of China (grant No. 42074094), Natural Science Foundation of Hubei Province of China (grant No. 2023AFB948), NSFC National Key Project (42394132), Hong Kong RGC Collaborative Research Fund (C5013-23G), and National Natural Science Foundation of China (grant No. 41874093).

Data Availability Statement

We thank the GRACE Project team, particularly CSR, for providing monthly gravity solutions, and we also thank CUR for providing precipitation and temperature data. The GRACE data were downloaded from https://www2.csr.utexas.edu/grace/RL06_mascons.html (accessed on 28 July 2023). The precipitation and temperature data are available at https://crudata.uea.ac.uk/cru/data/hrg/cru_ts_4.07/ (accessed on 31 August 2023).

Conflicts of Interest

The authors declare no conflicts of interest.

References

  1. Immerzeel, W.W.; van Beek, L.P.H.; Bierkens, M.F.P. Climate Change Will Affect the Asian Water Towers. Science 2010, 328, 1382–1385. [Google Scholar] [CrossRef] [PubMed]
  2. Zemp, M.; Hoelzle, M.; Haeberli, W. Six decades of glacier mass-balance observations: A review of the worldwide monitoring network. Ann. Glaciol. 2009, 50, 101–111. [Google Scholar] [CrossRef]
  3. Haeberli, W.; Cihlar, J.; Barry, R.G. Glacier monitoring within the Global Climate Observing System. Ann. Glaciol. 2000, 31, 241–246. [Google Scholar] [CrossRef]
  4. Azam, M.F.; Ramanathan, A.; Wagnon, P.; Vincent, C.; Linda, A.; Berthier, E.; Sharma, P.; Mandal, A.; Angchuk, T.; Singh, V.B.; et al. Meteorological conditions, seasonal and annual mass balances of Chhota Shigri Glacier, western Himalaya, India. Ann. Glaciol. 2016, 57, 328–338. [Google Scholar] [CrossRef]
  5. Kumar, P.; Saharwardi, M.S.; Banerjee, A.; Azam, M.F.A.; Dubey, A.K.; Murtugudde, R. Snowfall Variability Dictates Glacier Mass Balance Variability in Himalaya-Karakoram. Sci. Rep. 2019, 9, 18192. [Google Scholar] [CrossRef]
  6. Luthcke, S.B.; Arendt, A.A.; Rowlands, D.D.; McCarthy, J.J.; Larsen, C.F. Recent glacier mass changes in the Gulf of Alaska region from GRACE mascon solutions. J. Glaciol. 2008, 54, 767–777. [Google Scholar] [CrossRef]
  7. Chen, J.L.; Wilson, C.R.; Tapley, B.D.; Blankenship, D.D.; Ivins, E.R. Patagonia icefield melting observed by gravity recovery and climate experiment (GRACE). Geophys. Res. Lett. 2007, 34, L22501. [Google Scholar] [CrossRef]
  8. Velicogna, I.; Mohajerani, Y.; Geruo, A.; Landerer, F.; Mouginot, J.; Noel, B.; Rignot, E.; Sutterley, T.; van den Broeke, M.; van Wessem, M.; et al. Continuity of Ice Sheet Mass Loss in Greenland and Antarctica From the GRACE and GRACE Follow-On Missions. Geophys. Res. Lett. 2020, 47, e2020GL087291. [Google Scholar] [CrossRef]
  9. Moiwo, J.P.; Yang, Y.H.; Tao, F.L.; Lu, W.X.; Han, S.M. Water storage change in the Himalayas from the Gravity Recovery and Climate Experiment (GRACE) and an empirical climate model. Water Resour. Res. 2011, 47, W07521. [Google Scholar] [CrossRef]
  10. Song, C.; Ke, L.; Huang, B.; Richards, K.S. Can mountain glacier melting explains the GRACE-observed mass loss in the southeast Tibetan Plateau: From a climate perspective? Glob. Planet. Chang. 2015, 124, 1–9. [Google Scholar] [CrossRef]
  11. Jiao, J.J.; Zhang, X.T.; Liu, Y.; Kuang, X.X. Increased Water Storage in the Qaidam Basin, the North Tibet Plateau from GRACE Gravity Data. PLoS ONE 2015, 10, e0141442. [Google Scholar] [CrossRef] [PubMed]
  12. Meng, F.; Su, F.; Li, Y.; Tong, K. Changes in Terrestrial Water Storage During 2003–2014 and Possible Causes in Tibetan Plateau. J. Geophys. Res.-Atmos. 2019, 124, 2909–2931. [Google Scholar] [CrossRef]
  13. Liu, X.; Xu, Z.; Yang, H.; Vaghefi, S.A. Responses of the Glacier Mass Balance to Climate Change in the Tibetan Plateau During 1975–2013. J. Geophys. Res.-Atmos. 2021, 126, e2019JD032132. [Google Scholar] [CrossRef]
  14. Wang, L.M.; Wang, J.X.; Wang, L.C.; Zhu, L.P.; Li, X.O. Terrestrial water storage regime and its change in the endorheic Tibetan Plateau. Sci. Total Environ. 2022, 815, 152729. [Google Scholar] [CrossRef] [PubMed]
  15. Gao, G.L.; Zhao, J.; Wang, J.X.; Zhao, G.Z.; Chen, J.Y.; Li, Z.P. Spatiotemporal Variation and Driving Analysis of Groundwater in the Tibetan Plateau Based on GRACE Downscaling Data. Water 2022, 14, 3302. [Google Scholar] [CrossRef]
  16. Xu, M.; Ye, B.S.; Zhao, Q.D.; Zhang, S.Q.; Wang, J. Estimation of water balance in the source region of the Yellow River based on GRACE satellite data. J. Arid Land 2013, 5, 384–395. [Google Scholar] [CrossRef]
  17. Li, X.Y.; Long, D.; Scanlon, B.R.; Mann, M.E.; Li, X.D.; Tian, F.Q.; Sun, Z.L.; Wang, G.Q. Climate change threatens terrestrial water storage over the Tibetan Plateau. Nat. Clim. Chang. 2022, 12, 801–807. [Google Scholar] [CrossRef]
  18. Becker, M.; Llovel, W.; Cazenave, A.; Guentner, A.; Cretaux, J.F. Recent hydrological behavior of the East African great lakes region inferred from GRACE, satellite altimetry and rainfall observations. C. R. Geosci. 2010, 342, 223–233. [Google Scholar] [CrossRef]
  19. Anyah, R.O.; Forootan, E.; Awange, J.; Khaki, M. Understanding linkages between global climate indices and terrestrial water storage changes over Africa using GRACE products. Sci. Total Environ. 2018, 635, 1405–1416. [Google Scholar] [CrossRef]
  20. Yao, C.L.; Luo, Z.C.; Wang, H.H.; Li, Q.; Zhou, H. GRACE-Derived Terrestrial Water Storage Changes in the Inter-Basin Region and Its Possible Influencing Factors: A Case Study of the Sichuan Basin, China. Remote Sens. 2016, 8, 444. [Google Scholar] [CrossRef]
  21. Miles, E.; McCarthy, M.; Dehecq, A.; Kneib, M.; Fugger, S.; Pellicciotti, F. Health and sustainability of glaciers in High Mountain Asia. Nat. Commun. 2021, 12, 2868. [Google Scholar] [CrossRef] [PubMed]
  22. Save, H.; Bettadpur, S.; Tapley, B.D. High-resolution CSR GRACE RL05 mascons. J. Geophys. Res.-Solid Earth 2016, 121, 7547–7569. [Google Scholar] [CrossRef]
  23. Sun, Y.; Riva, R.; Ditmar, P. Optimizing estimates of annual variations and trends in geocenter motion and J2 from a combination of GRACE data and geophysical models. J. Geophys. Res.-Solid Earth 2016, 121, 8352–8370. [Google Scholar] [CrossRef]
  24. Swenson, S.; Chambers, D.; Wahr, J. Estimating geocenter variations from a combination of GRACE and ocean model output. J. Geophys. Res.-Solid Earth 2008, 113, B08410. [Google Scholar] [CrossRef]
  25. Dobslaw, H.; Bergmann-Wolf, I.; Dill, R.; Poropat, L.; Thomas, M.; Dahle, C.; Esselborn, S.; König, R.; Flechtner, F. A new high-resolution model of non-tidal atmosphere and ocean mass variability for de-aliasing of satellite gravity observations: AOD1B RL06. Geophys. J. Int. 2017, 211, 263–269. [Google Scholar] [CrossRef]
  26. Zou, Y.; Kuang, X.; Feng, Y.; Jiao, J.J.; Liu, J.; Wang, C.; Fan, L.; Wang, Q.; Chen, J.; Ji, F.; et al. Solid Water Melt Dominates the Increase of Total Groundwater Storage in the Tibetan Plateau. Geophys. Res. Lett. 2022, 49, e2022GL100092. [Google Scholar] [CrossRef]
  27. Yi, S.; Sneeuw, N. Filling the Data Gaps Within GRACE Missions Using Singular Spectrum Analysis. J. Geophys. Res.-Solid Earth 2021, 126, e2020JB021227. [Google Scholar] [CrossRef]
  28. Harris, I.; Osborn, T.J.; Jones, P.; Lister, D. Version 4 of the CRU TS monthly high-resolution gridded multivariate climate dataset. Sci. Data 2020, 7, 109. [Google Scholar] [CrossRef]
  29. Wahr, J.; Molenaar, M.; Bryan, F. Time variability of the Earth’s gravity field: Hydrological and oceanic effects and their possible detection using GRACE. J. Geophys. Res.-Solid Earth 1998, 103, 30205–30229. [Google Scholar] [CrossRef]
  30. Pearson, K. On lines and planes of closest fit to systems of points in space. Philos. Mag. 1901, 2, 559–572. [Google Scholar] [CrossRef]
  31. Lorenz, E. Empirical Orthogonal Functions and Statistical Weather Prediction. Stat. Forecast. 1956, 1, 52. [Google Scholar]
  32. Hannachi, A.; Jolliffe, I.T.; Stephenson, D.B. Empirical orthogonal functions and related techniques in atmospheric science: A review. Int. J. Climatol. 2007, 27, 1119–1152. [Google Scholar] [CrossRef]
  33. Bhattacharya, A.; Bolch, T.; Mukherjee, K.; King, O.; Menounos, B.; Kapitsa, V.; Neckel, N.; Yang, W.; Yao, T.D. High Mountain Asian glacier response to climate revealed by multi-temporal satellite observations since the 1960s. Nat. Commun. 2021, 12, 4133. [Google Scholar] [CrossRef]
  34. Broomhead, D.S.; King, G.P. Extracting Qualitative Dynamics from Experimental-Data. Physica D 1986, 20, 217–236. [Google Scholar] [CrossRef]
  35. Wyatt, M.G.; Kravtsov, S.; Tsonis, A.A. Atlantic Multidecadal Oscillation and Northern Hemisphere’s climate variability. Clim. Dyn. 2012, 38, 929–949. [Google Scholar] [CrossRef]
  36. Kondrashov, D.; Berloff, P. Stochastic modeling of decadal variability in ocean gyres. Geophys. Res. Lett. 2015, 42, 1543–1553. [Google Scholar] [CrossRef]
  37. Chen, Q.; van Dam, T.; Sneeuw, N.; Collilieux, X.; Weigelt, M.; Rebischung, P. Singular spectrum analysis for modeling seasonal signals from GPS time series. J. Geodyn. 2013, 72, 25–35. [Google Scholar] [CrossRef]
  38. Jing, W.; Zhang, P.; Zhao, X. A comparison of different GRACE solutions in terrestrial water storage trend estimation over Tibetan Plateau. Sci. Rep. 2019, 9, 1765. [Google Scholar] [CrossRef]
  39. Zhan, J.G.; Shi, H.L.; Wang, Y.; Yao, Y.X. Complex principal component analysis of mass balance changes on the Qinghai-Tibetan Plateau. Cryosphere 2017, 11, 1487–1499. [Google Scholar] [CrossRef]
  40. Yang, W.; Guo, X.F.; Yao, T.D.; Zhu, M.L.; Wang, Y.J. Recent accelerating mass loss of southeast Tibetan glaciers and the relationship with changes in macroscale atmospheric circulations. Clim. Dyn. 2016, 47, 805–815. [Google Scholar] [CrossRef]
  41. Wang, Z.B.; Wu, R.G.; Yang, S.; Lu, M.M. An Interdecadal Change in the Influence of ENSO on the Spring Tibetan Plateau Snow-Cover Variability in the Early 2000s. J. Clim. 2022, 35, 725–743. [Google Scholar] [CrossRef]
  42. Wang, Q.Y.; Yi, S.; Sun, W.K. Precipitation-driven glacier changes in the Pamir and Hindu Kush mountains. Geophys. Res. Lett. 2017, 44, 2817–2824. [Google Scholar] [CrossRef]
  43. Mandal, A.; Ramanathan, A.L.; Angchuk, T.; Soheb, M.; Singh, V.B. Unsteady state of glaciers (Chhota Shigri and Hamtah) and climate in Lahaul and Spiti region, western Himalayas: A review of recent mass loss. Environ. Earth Sci. 2016, 75, 1233. [Google Scholar] [CrossRef]
  44. Hu, S.; Wu, B.; Zhou, T.J.; Yu, Y.Q. Dominant Anomalous Circulation Patterns of Tibetan Plateau Summer Climate Generated by ENSO-Forced and ENSO-Independent Teleconnections. J. Clim. 2022, 35, 1679–1694. [Google Scholar] [CrossRef]
  45. Wang, C.X.; Ma, Z.F. Quasi-3-yr Cycle of Rainy Season Precipitation in Tibet Related to Different Types of ENSO during 1981-2015. J. Meteorol. Res. 2018, 32, 181–190. [Google Scholar] [CrossRef]
  46. Yang, X.X.; Yao, T.D.; Deji; Zhao, H.B.; Xu, B.Q. Possible ENSO Influences on the Northwestern Tibetan Plateau Revealed by Annually Resolved Ice Core Records. J. Geophys. Res.-Atmos. 2018, 123, 3857–3870. [Google Scholar] [CrossRef]
  47. Wu, J.; Wu, Z. Inter-decadal change of the spring North Atlantic Oscillation impact on the summer Pamir–Tienshan snow cover. Int. J. Climatol. 2019, 39, 629–642. [Google Scholar] [CrossRef]
  48. Kang, S.; Qin, D.; Ren, J.; Zhang, Y.; Kaspari, S.; Mayewski, P.A.; Hou, S. Annual accumulation in the Mt. nyainqentanglha ice core, southern Tibetan plateau, China: Relationships to atmospheric circulation over Asia. Arct. Antarct. Alp. Res. 2007, 39, 663–670. [Google Scholar] [CrossRef]
  49. Xu, H.; Hong, Y.T.; Hong, B.; Zhu, Y.X.; Wang, Y. Influence of ENSO on multi-annual temperature variations at Hongyuan, NE Qinghai-Tibet plateau: Evidence from δ13 C of spruce tree rings. Int. J. Climatol. 2010, 30, 120–126. [Google Scholar] [CrossRef]
  50. Wang, S.S.; Huang, J.P.; He, Y.L.; Guan, Y.P. Combined effects of the Pacific Decadal Oscillation and El Nino-Southern Oscillation on Global Land Dry-Wet Changes. Sci. Rep. 2014, 4, 6651. [Google Scholar] [CrossRef]
  51. Thirumalai, K.; DiNezio, P.N.; Okumura, Y.; Deser, C. Extreme temperatures in Southeast Asia caused by El Nino and worsened by global warming. Nat. Commun. 2017, 8, 15531. [Google Scholar] [CrossRef] [PubMed]
  52. Zhu, Y.; Liu, S.; Yi, Y.; Li, W.; Zhang, S. Spatiotemporal Changes of Terrestrial Water Storage in Three Parallel River Basins and Its Response to ENSO. Mt. Res. 2020, 38, 165–179. [Google Scholar] [CrossRef]
  53. Xu, H.; Hou, S.G.; Pang, H.X.; Wang, C.M. Effects of ENSO on the major ion record of a Qomolangma (Mount Everest) ice core. Ann. Glaciol. 2016, 57, 282–288. [Google Scholar] [CrossRef]
  54. Li, J.P.; Feng, J.; Li, Y. A possible cause of decreasing summer rainfall in northeast Australia. Int. J. Climatol. 2012, 32, 995–1005. [Google Scholar] [CrossRef]
  55. Zhang, Q.B.; Evans, M.N.; Lyu, L. Moisture dipole over the Tibetan Plateau during the past five and a half centuries. Nat. Commun. 2015, 6, 8062. [Google Scholar] [CrossRef]
  56. Wu, G.; Zhang, Y. Tibetan Plateau Forcing and the Timing of the Monsoon Onset over South Asia and the South China Sea. Mon. Weather Rev. 1998, 126, 913–927. [Google Scholar] [CrossRef]
  57. Zhao, Z.Z.; Cao, J.J.; Shen, Z.X.; Xu, B.Q.; Zhu, C.S.; Chen, L.W.A.; Su, X.L.; Liu, S.X.; Han, Y.M.; Wang, G.H. Aerosol particles at a high-altitude site on the Southeast Tibetan Plateau, China: Implications for pollution transport from South Asia. J. Geophys. Res.-Atmos. 2013, 118, 11360–11375. [Google Scholar] [CrossRef]
  58. Li, G.P.; Yu, Z.B.; Wang, W.G.; Ju, Q.; Chen, X. Analysis of the spatial Distribution of precipitation and topography with GPM data in the Tibetan Plateau. Atmos. Res. 2021, 247, 105259. [Google Scholar] [CrossRef]
  59. Hu, S.; Zhou, T.J.; Wu, B. Impact of Developing ENSO on Tibetan Plateau Summer Rainfall. J. Clim. 2021, 34, 3385–3400. [Google Scholar] [CrossRef]
  60. He, S.P.; Wang, H.J. Oscillating Relationship between the East Asian Winter Monsoon and ENSO. J. Clim. 2013, 26, 9819–9838. [Google Scholar] [CrossRef]
  61. Yao, T.; Bolch, T.; Chen, D.; Gao, J.; Immerzeel, W.; Piao, S.; Su, F.; Thompson, L.; Wada, Y.; Wang, L.; et al. The imbalance of the Asian water tower. Nat. Rev. Earth Environ. 2022, 3, 618–632. [Google Scholar] [CrossRef]
  62. Anjum, M.N.; Ding, Y.J.; Shangguan, D.H. Simulation of the projected climate change impacts on the river flow regimes under CMIP5 RCP scenarios in the westerlies dominated belt, northern Pakistan. Atmos. Res. 2019, 227, 233–248. [Google Scholar] [CrossRef]
  63. Yi, S.; Sun, W. Evaluation of glacier changes in high-mountain Asia based on 10 year GRACE RL05 models. J. Geophys. Res. Solid Earth 2014, 119, 2504–2517. [Google Scholar] [CrossRef]
  64. Rekier, J.; Chao, B.F.; Chen, J.L.; Dehant, V.; Rosat, S.; Zhu, P. Earth’s Rotation: Observations and Relation to Deep Interior. Surv. Geophys. 2022, 43, 149–175. [Google Scholar] [CrossRef]
  65. Cazenave, A.; Pfeffer, J.; Mandea, M.; Dehant, V. ESD Ideas: A 6-year oscillation in the whole Earth system? Earth Syst. Dynam. 2023, 14, 733–735. [Google Scholar] [CrossRef]
  66. Pan, Y.J.; Jiang, W.P.; Ding, H.; Shum, C.K.; Jiao, J.S.; Xiao, Y.X.; Wu, Q.W. Interannual variability of vertical land motion over High Mountain Central Asia from GPS and GRACE/GRACE-FO observations. GPS Solut. 2023, 27, 168. [Google Scholar] [CrossRef]
  67. Chen, J.L.; Wilson, C.R.; Kuang, W.J.; Chao, B.F. Interannual Oscillations in Earth Rotation. J. Geophys. Res.-Solid Earth 2019, 124, 13404–13414. [Google Scholar] [CrossRef]
  68. Pfeffer, J.; Cazenave, A.; Rosat, S.; Moreira, L.; Mandea, M.; Dehant, V.; Coupry, B. A 6-year cycle in the Earth system. Glob. Planet. Chang. 2023, 229, 104245. [Google Scholar] [CrossRef]
  69. Chao, B.F.; Yu, Y. Variation of the equatorial moments of inertia associated with a 6-year westward rotary motion in the Earth. Earth Planet. Sci. Lett. 2020, 542, 116316. [Google Scholar] [CrossRef]
  70. Deng, C.; Zhang, W. Spatial distribution pattern of degree–day factors of glaciers on the Qinghai–Tibetan Plateau. Environ. Monit. Assess. 2018, 190, 475. [Google Scholar] [CrossRef]
  71. Zhu, M.; Yao, T.; Xie, Y.; Xu, B.; Yang, W.; Yang, S. Mass balance of Muji Glacier, northeastern Pamir, and its controlling climate factors. J. Hydrol. 2020, 590, 125447. [Google Scholar] [CrossRef]
  72. Shi, Y.F.; Liu, S.Y. Estimation on the response of glaciers in China to the global warming in the 21st century. Chin. Sci. Bull. 2000, 45, 668–672. [Google Scholar] [CrossRef]
  73. Zhang, Y.; Hirabayashi, Y.; Liu, S.Y. Catchment-scale reconstruction of glacier mass balance using observations and global climate data: Case study of the Hailuogou catchment, south-eastern Tibetan Plateau. J. Hydrol. 2012, 444, 146–160. [Google Scholar] [CrossRef]
  74. Duan, A.; Wu, G.; Zhang, Q.; Liu, Y. New proofs of the recent climate warming over the Tibetan Plateau as a result of the increasing greenhouse gases emissions. Chin. Sci. Bull. 2006, 51, 1396–1400. [Google Scholar] [CrossRef]
  75. Duan, A.; Wu, G. Change of cloud amount and the climate warming on the Tibetan Plateau. Geophys. Res. Lett. 2006, 33, L22704. [Google Scholar] [CrossRef]
  76. Gao, K.; Duan, A.; Chen, D.; Wu, G. Surface energy budget diagnosis reveals possible mechanism for the different warming rate among Earth’s three poles in recent decades. Sci. Bull. 2019, 64, 1140–1143. [Google Scholar] [CrossRef] [PubMed]
  77. Lüthi, Z.L.; Škerlak, B.; Kim, S.W.; Lauer, A.; Mues, A.; Rupakheti, M.; Kang, S. Atmospheric brown clouds reach the Tibetan Plateau by crossing the Himalayas. Atmos. Chem. Phys. 2015, 15, 6007–6021. [Google Scholar] [CrossRef]
  78. Cui, X.; Graf, H.-F. Recent land cover changes on the Tibetan Plateau: A review. Clim. Chang. 2009, 94, 47–61. [Google Scholar] [CrossRef]
  79. Wen, Z.; Yi, S.; Sun, W. Significant contribution of the Tianshan lakes to their water storage and water resources. J. Hydrol. Reg. Stud. 2024, 53, 101813. [Google Scholar] [CrossRef]
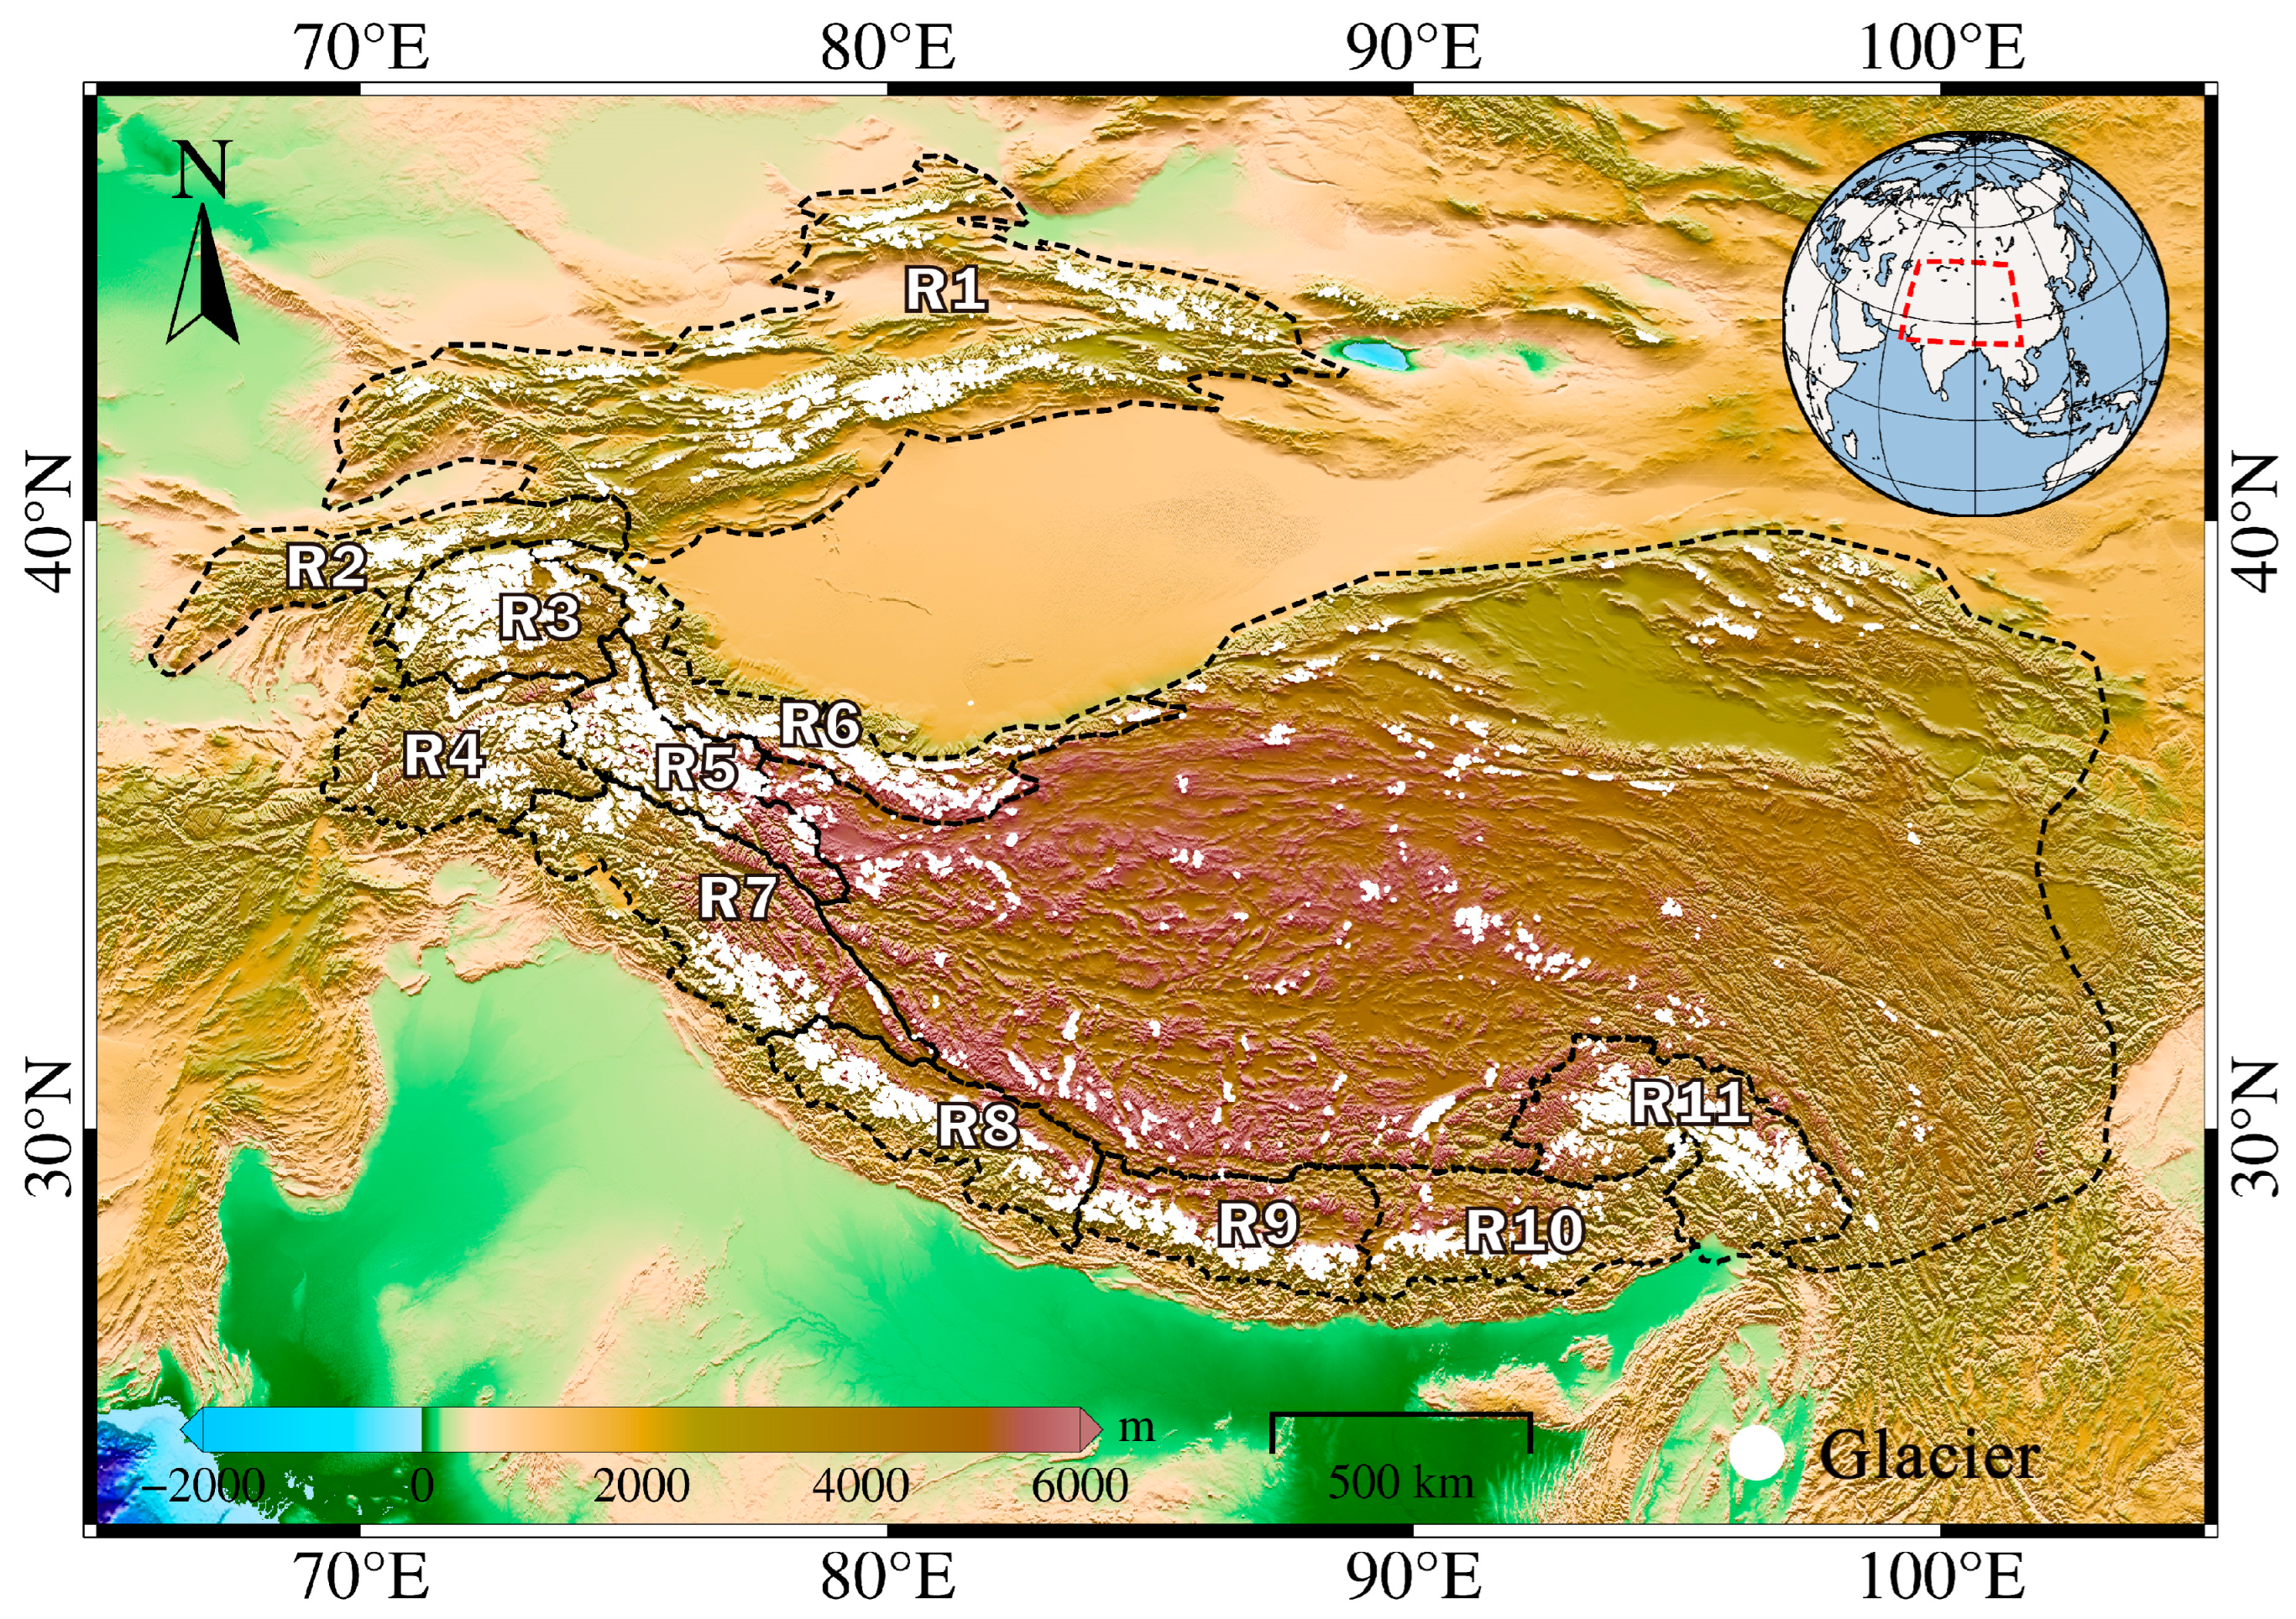
Figure 1. Glacier distribution range and subregion divisions of HMA: R1 Tianshan, R2 Pamir Alay, R3 Pamir, R4 Hindu Kush, R5 Karakoram, R6 Kunlun, R7 Himalaya (Spiti Lahaul), R8 Himalaya (West Nepal), R9 Himalaya (East Nepal), R10 Himalaya (Bhutan), and R11 Nyainqentanglhas. “R” stands for region.
Remotesensing 16 03426 g001
Figure 2. The spatial and temporal variations in glacier mass change in HMA and its subbasins. (a) The spatial trend in mass changes (cm/yr) in HMA and its subregions. (b) The glacier mass change trends in HMA and its subbasins during 2002–2022. (Error bars represent the corresponding uncertainty of the glacier mass change trends.) Time series of glacier mass changes in HMA (n) and HMA subregions (cm).
Remotesensing 16 03426 g002
Figure 3. EOF analysis of interannual mass changes in HMA and wavelet analysis of temporal modes. (a) is first spatial mode. (b) is first temporal mode. (c) is wavelet analysis of the first temporal mode). Similarly, (df) are the second mode results.
Remotesensing 16 03426 g003
Figure 4. Interannual signals of mass, precipitation, and temperature changes in the HMA subregions. (a) Blue refers to the correlation between EWH and precipitation, and red refers to the correlation between EWH and temperature. (bg) are the interannual variation diagrams of EWH and precipitation in the R1–R6 region. (hl) are the interannual variation diagrams of EWH, precipitation, and temperature in the R7–R11 region.
Remotesensing 16 03426 g004
Figure 5. Interannual signal wavelet analysis diagram of mass, precipitation, and temperature changes in the HMA subregions. (a,b) are wavelet analysis of EWH and interannual precipitation variation in R1. Similarly, (cl) are for R2–R6. (mo) is the wavelet analysis of the interannual variation of EWH, precipitation, and temperature in the R7 region. Similarly, (paa) are for R8–R11.
Remotesensing 16 03426 g005
Figure 6. Comparison of interannual signals of glacier mass, precipitation, and temperature changes in the HMA subregions with ENSO interannual signals. (a) Correlation with ENSO interannual variation. The ENSO signal in (bi) includes periods longer than 3 years, while in (jl) includes periods longer than 2 years.
Remotesensing 16 03426 g006
Figure 7. Interannual signals of mass changes, precipitation changes, temperature changes in the HMA subregion and ENSO wavelet analysis. (a) wavelet analysis of ENSO interannual signal over 3 years. (bi) interannual variation of precipitation or temperature in R1–R8. (j) wavelet analysis of ENSO interannual signal over 2 years. (km) interannual variation of EWH in R9–R11.
Remotesensing 16 03426 g007
Figure 8. Proportion of interannual signals of glacier mass change in each region.
Remotesensing 16 03426 g008
Disclaimer/Publisher’s Note: The statements, opinions and data contained in all publications are solely those of the individual author(s) and contributor(s) and not of MDPI and/or the editor(s). MDPI and/or the editor(s) disclaim responsibility for any injury to people or property resulting from any ideas, methods, instructions or products referred to in the content.