Article

Mini-Satellite Fucheng 1 SAR: Interferometry to Monitor Mining-Induced Subsidence and Comparative Analysis with Sentinel-1

1
State Key Laboratory of Geological Disaster Prevention and Geological Environmental Protection, Chengdu University of Technology, Chengdu 610059, China
2
College of Geography and Planning, Chengdu University of Technology, Chengdu 610059, China
3
Sichuan Branch of China National Geological Exploration Center of Building Materials Industry, Chengdu 610052, China
4
College of Earth and Planetary Sciences, Chengdu University of Technology, Chengdu 610059, China
5
College of Geophysics, Chengdu University of Technology, Chengdu 610059, China
6
Spacety Co., Ltd. (Changsha), 25th Floor, A1, Innovation Enterprise Park, West Lugu Avenue, Yuelu District, Changsha 410205, China
*
Author to whom correspondence should be addressed.
Remote Sens. 2024, 16(18), 3457; https://doi.org/10.3390/rs16183457
Submission received: 2 August 2024 / Revised: 4 September 2024 / Accepted: 14 September 2024 / Published: 18 September 2024
(This article belongs to the Special Issue Advanced Satellite Remote Sensing for Geohazards)

Abstract

:
Mining-induced subsidence poses a serious hazard to the surrounding environment and infrastructure, necessitating the detection of such subsidence for effective disaster mitigation and the safeguarding of local residents. Fucheng 1 is the first high-resolution mini-satellite interferometric Synthetic Aperture Radar (SAR) launched by China in June 2023. In this study, we used Fucheng 1 SAR images to analyze mining-induced subsidence in Karamay by InSAR Stacking and D-InSAR. The findings were compared with Sentinel-1A imagery to evaluate the effectiveness of Fucheng 1 in monitoring subsidence and its interferometric performance. Analysis revealed significant mining-induced subsidence in Karamay, and the results from Fucheng 1 closely corresponded with those from Sentinel-1A, particularly regarding the extent of the subsidence. It is indicated that the precision of Fucheng 1 SAR imagery has reached leading standards. In addition, due to its higher resolution, the maximum detectable deformation gradient (MDDG) of Fucheng 1 is 2.15 times higher than that of Sentinel images. This study provides data support for the monitoring of mining-induced subsidence in the Karamay and give a theoretical basis for the application of Fucheng 1 in the field of Geohazard monitoring.

1. Introduction

Mining activities perturb the inherent stress equilibrium within the strata of overlying rock, triggering a spectrum of geological and environmental maladies [1]. These effects include the depletion of aquifers, the collapse of ground structures, and the occurrence of landslides [2], all of which contribute to the broader phenomenon of mining-induced subsidence [3]. This issue is not confined to specific regions; it is a widespread challenge affecting over 150 countries and territories, posing a significant threat to human livelihoods and economic activities worldwide [4]. Significant incidents underscore the urgent need to closely monitor mining-induced subsidence in mining regions, including the gypsum mine collapse in Pingyi County, Shandong Province, on 25 December 2015, which trapped 29 workers underground for 33 days [5]; the catastrophic mine collapse in the Alashan region of Inner Mongolia on 22 February 2023, which claimed 53 lives, left six injured, and resulted in direct economic losses of 204,325,000 yuan [6]; and the collapse of a gold mine in Tanzania on 13 January 2024, which killed at least 21 people [7].
In recent years, InSAR has garnered significant interest due to its high spatial coverage [8], precision [9], efficiency [10], and its operational capability under various weather conditions [11,12,13,14,15,16,17,18,19]. The Stacking-InSAR technique, in particular, has been lauded for its computational efficiency and robustness against coherence issues, making it a preferred method for monitoring large-scale subsidence [20,21,22,23,24,25,26,27,28,29]. Scholars have increasingly integrated multi-source satellite data with Stacking-InSAR to study mining-induced subsidence. For instance, Yang et al. employed Stacking-InSAR analysis using Sentinel-1A SAR imagery to investigate subsidence at the Jianxin coal mine [30]; Li et al. utilized ALOS PALSAR and Sentinel-1A data to detect extensive subsidence in mining areas over specified periods [31]; Chang et al. applied Stacking-InSAR to Envisat-1 ASAR images to measure subsidence in Beijing’s Chaoyang and Tongzhou districts between January 2009 and January 2010 [32]; and Zhang et al. monitored significant deformation gradients in the Peibei mining area using Envisat ASAR and ALOS PALSAR data via Stacking-InSAR [33,34,35]. Despite these advancements, research on time-series InSAR for mining-induced subsidence monitoring using the Fucheng 1 SAR images is scarce, warranting further investigation into its deformation detection capabilities.
This study employs D-InSAR and Stacking-InSAR to ascertain the mining-induced subsidence rate in Karamay, comparing these findings with Sentinel-1A results to evaluate the effectiveness and suitability of Fucheng 1 for mining-induced subsidence detection. The study aims to strengthen local geohazard prevention and mitigation strategies and to provide data support for the practical application of Fucheng 1 imagery.

2. Study Area and Datasets

2.1. Study Area

Karamay District is located in the Karamay City of Xinjiang Uygur Autonomous Region, which is situated on the northwestern edge of the Junggar Basin, between the southern foothills of the Ghajar Mountains, and is characterized by a varied topography. The landscape rises to higher elevations in the northwest and descends towards the southeast, while the central and eastern zones are marked by expansive flatlands typically enveloped by desert and Gobi. Situated at an average elevation of 265 m above sea level, with an annual precipitation averaging a mere 108.9 mm [36], the northeastern sector of Karamay is a hub of mining activity, endowed with an abundance of natural resources, predominantly natural gas, oil, and coal. This concentration of mineral wealth includes over 30 oil and gas fields, such as the renowned Karamay and Baikouquan oil fields. These fields comprise a fracture-sheltered monoclinal reservoir with a lithology of interbedded conglomerate, sandstone, and mudstone, characterized by low permeability, low porosity, coarse grain textures, and a high degree of heterogeneity [37], and they have collectively contributed more than 400 million tons of crude oil and over 97 billion m3 of natural gas to the nation’s reserves, solidifying Karamay’s status as a pivotal base for China’s petroleum and chemical industries [38]. However, the extraction of these valuable resources often comes with the risk of mining-induced subsidence. This area began water injection development in 1985 [39] and has complex reservoir stress changes that may induce complex surface deformation. Historically, the area has experienced pronounced subsidence, with significant large-scale subsidence observed from 1990 to 2000, reaching a maximum of 200 mm, which underscores the necessity for vigilant monitoring and proactive measures to mitigate the impact of such subsidence on the environment and local communities [40]. The overview map of the study area is shown in Figure 1.

2.2. Datasets

Fucheng 1, the first C-band SAR mini-satellite and a pioneer of the Mianyang Constellation, was launched on 7 June 2023. Weighing just 300 kg, it is equipped with an all-weather interferometric imaging capability, enabling millimeter-level subsidence monitoring, and has achieved the highest resolution among commercial SAR satellites in China. This high level of accuracy is crucial for monitoring mining-induced subsidence and is essential for assessing environmental impacts and ensuring the safety of infrastructure [41]. The Sentinel-1 image has wide coverage and full range of applications, and it is the mainstream InSAR data source at present, so we chose Sentinel-1A data to compare with Fucheng-1 data. We have meticulously selected a set of five Fucheng 1 and five Sentinel-1A images, and all the images were taken during the same time period spanning 19 September 2023 to 2 November 2023 in the eastern mining area of the Karamay in Xinjiang. These images were utilized to perform a comprehensive time-series analysis of the region, allowing for a detailed examination of mining-induced subsidence patterns and dynamics.
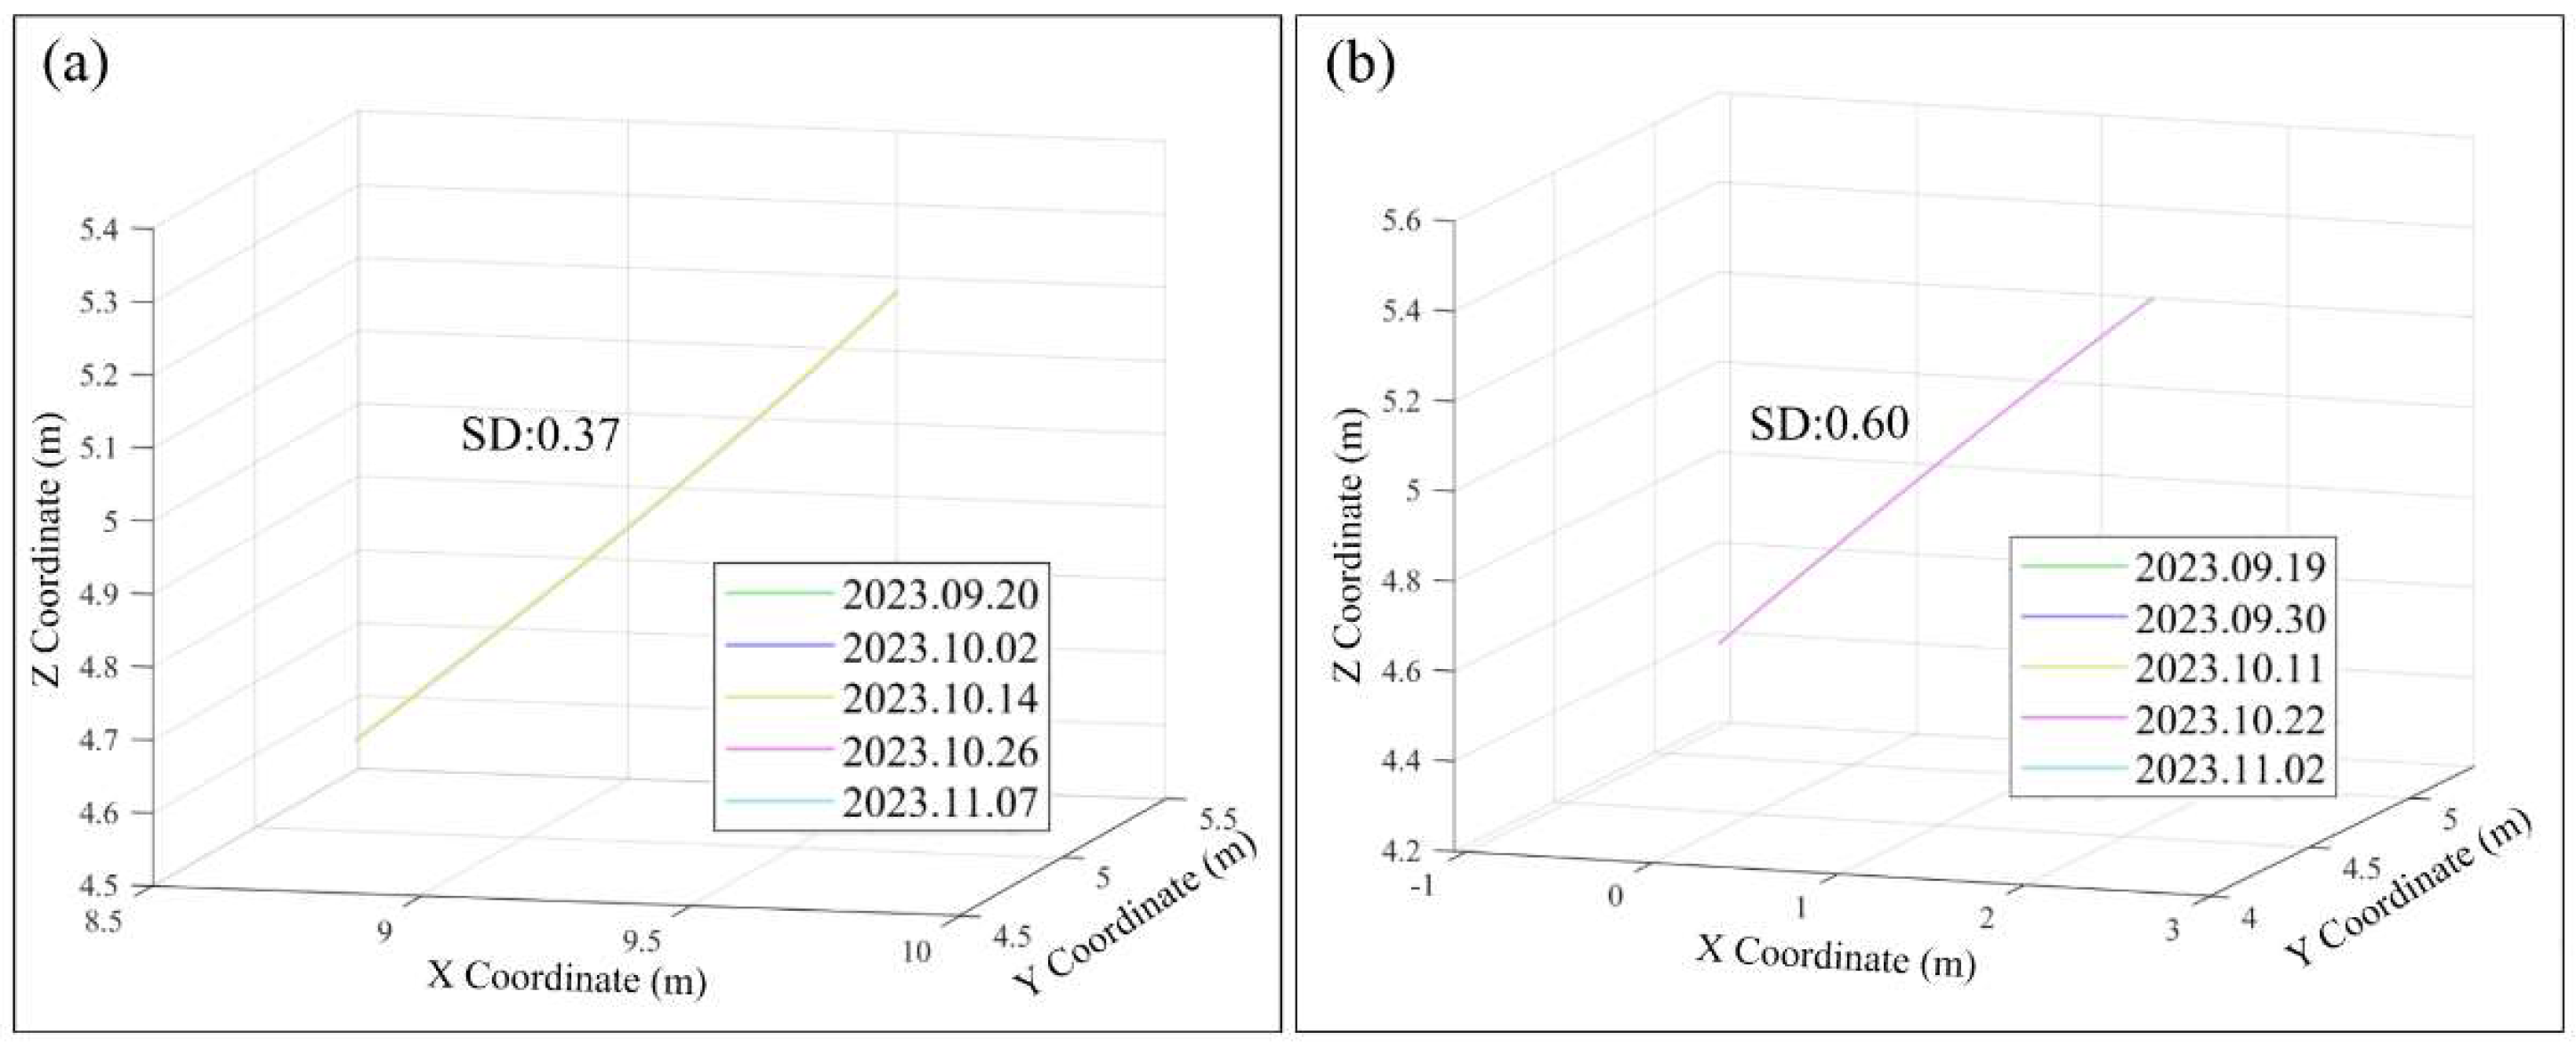
Figure 2 shows the satellite trajectories of 5 Sentinel-1A images and Fucheng 1 images, respectively. By comparing their orbital precision, it can be found that the orbiting precision of Sentinel-1A data includes auxiliary orbital details better than 5 cm [42], and the standard deviation (SD) reaches 0.37 while, with the Fucheng data using GPS and BDS Global Navigation Satellite System (GNSS) receivers, the orbiting precision is better than 10 cm [43], and the SD is 0.6, therefore the two satellites both demonstrate high orbit precision.
The comparative analysis between Fucheng 1 and Sentinel-1A data serves to evaluate the efficacy and reliability of Fucheng 1 in the context of mining-induced subsidence monitoring, providing valuable insights that can inform future applications and enhance our understanding of this important field of study (Table 1).
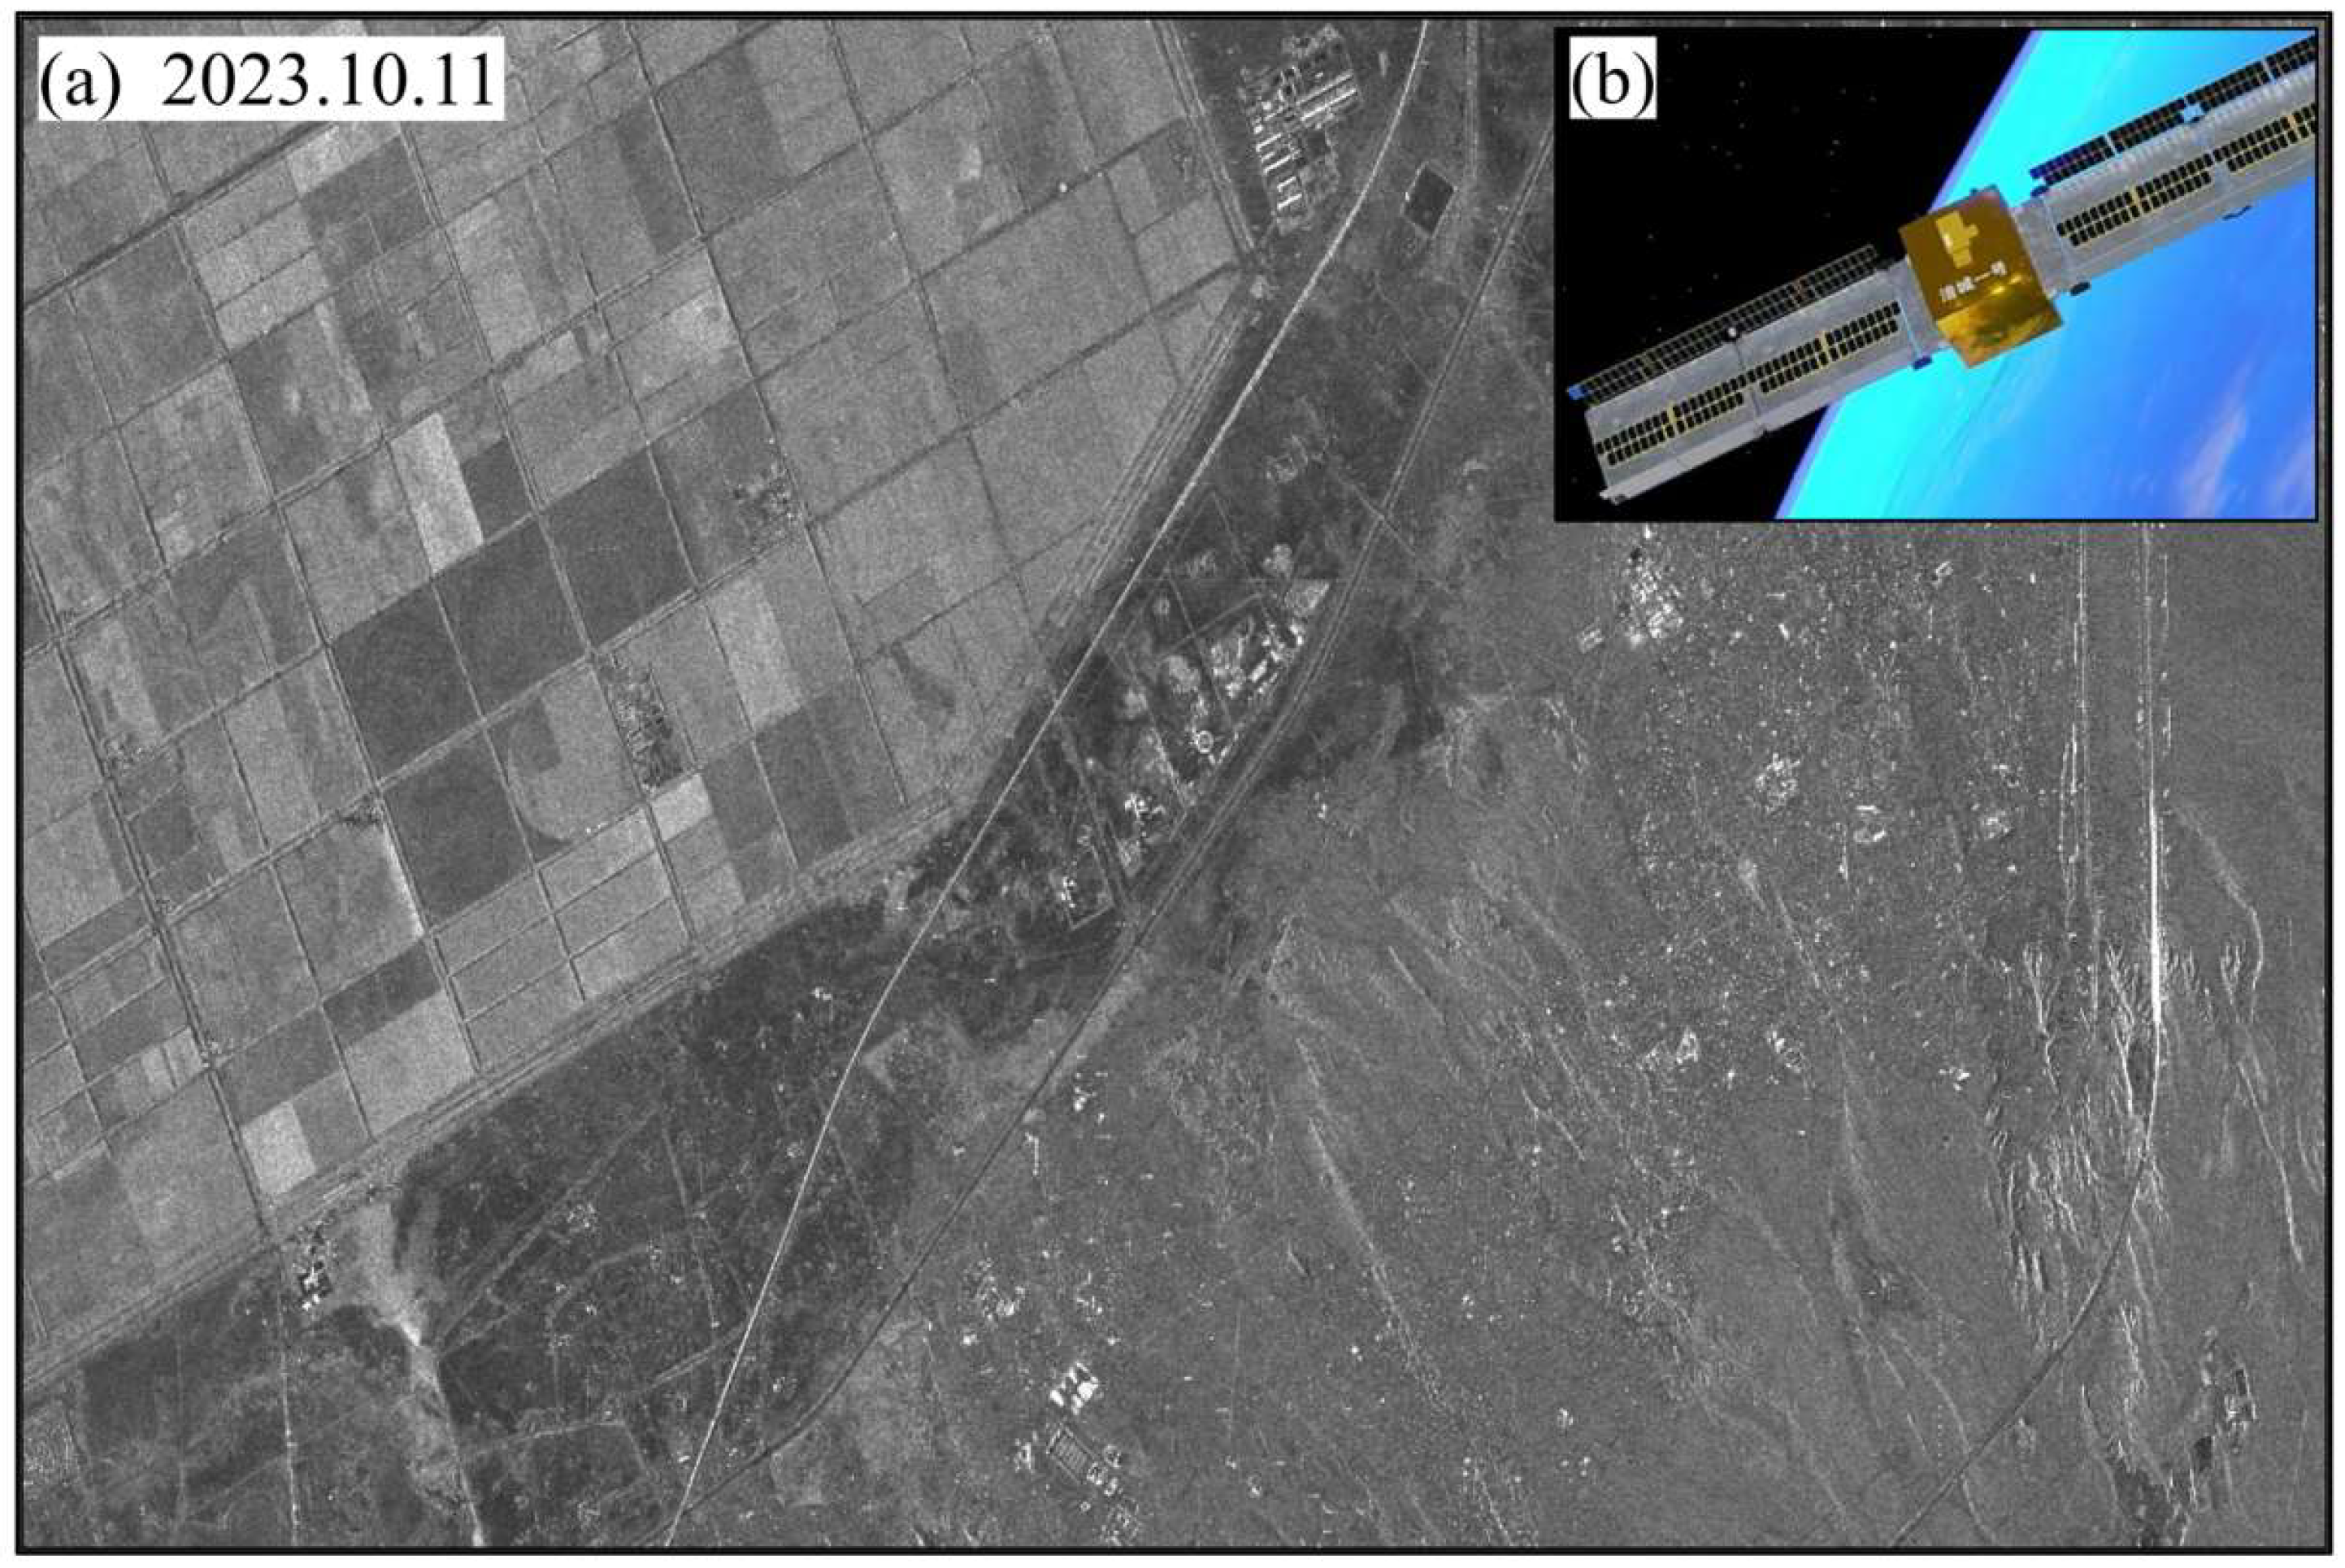
Figure 3 shows the intensity image of the Fucheng data and the photo of the satellite. Fucheng 1 operates on an 11-day revisit period, offering extensive coverage and frequent revisits to the same location, capturing imagery with a swath width of 25 km and a resolution refined to 1.25 × 1.67 m. The Fucheng 1 SAR imagery in this study is sourced from the Spacety and, currently, SAR images from 63 cities, including Beijing, Xinjiang, New York, and Magdeburg, are open for application. In parallel, the Sentinel-1A SAR imagery is sourced from the European Space Agency (ESA), which has equipped its satellite with a C-band SAR system. The satellite boasts a revisit interval of 12 days, which is a prominent data source for InSAR analysis [44,45]. To enhance the precision of our analysis, we have selected the Shuttle Radar Topography Mission (SRTM) 30m Digital Elevation Model (DEM) as supplementary data to remove the Flat-earth Effect and geocode [46].

3. Methods

The principle of the Differential Interferometric Synthetic Aperture Radar (D-InSAR) is to generate interferograms using two or more SAR images of the same geographic area, and the interferometric phases within the deformed area can be calculated by complex conjugate multiplication of the images [47]. The basic formula for this process can be expressed as follows:
Δ φ = φ t o p o + φ d e f + φ f l a t + φ a t m + φ n o i s e
where Δ φ represents the interferometric phase; φ t o p o is the topographic phase; φ d e f is the deformation phase; φ f l a t is the flat phase; φ a t m denotes the atmospheric phase; and φ n o i s e is the noise phase. The Line-of-sight (LOS) deformation d is further obtained from the interferometric phase Δ φ and the radar wavelength λ , and Π is a mathematical constant, as shown in Equation (2).
d = λ Δ φ / 4 Π
Stacking was first introduced by Sandwell in 1998 [48], This technique facilitates the high-precision registration of master and slave images, thereby minimizing errors inherent, and enhancing the accuracy and reliability of the phase velocity estimation [49]. The estimation formula is expressed as Equation (3):
p h _ r a t e = i = 1 N t j φ j / i = 1 N t j 2
where p h _ r a t e denotes the linear phase rate; t j represents the time baseline of the j -th set of interferograms; and φ j is the differential interference phase of the j -th set of phase unwrapping.
Coherence is one of the key factors in measuring the quality of SAR interferograms, and describes the degree of phase coherence between two or more SAR images at corresponding points in the spatial location, reflecting the stability of the surface scattering properties of the imaged region [50]. The value of coherence is between 0 and 1. The higher the coherence, the better the phase coherence between images and the more stable the surface scattering characteristics. The out-of-phase coherence of the images is affected by a number of factors, including thermal noise, temporal baseline, spatial baseline, wavelength of the radar waves and polarization mode; the formula is shown as Equation (4):
γ = γ t h e r m a l γ b a s e l i n e γ v o l u m e γ r o t a t i o n γ t e m p o r a l γ o t h e r
The thermal correlation is caused by the thermal noise ( γ t h e r m a l ) due to the SNR (Signal-to-Noise Ratio) characteristics of the radar system.
γ t h e r m a l = 1 / 1 + S N R 1
S N R = 10 l o g P s / P n
SNR is the signal-to-noise ratio of the radar system; P s is the average power of the received signal; P n is the thermal noise power in the receiver system. The baseline incoherence can be simply expressed as follows:
γ b a s e l i n e = 1 B / B c               B < B c 0                   B > B c
B c = R B w t a n ( θ i n c α ) / f
where B represents the vertical baseline; B c represents the critical baseline; f is the radar frequency; B w denotes the bandwidth; R represents the distance from satellite to ground; θ i n c is the angle of incidence; and α denotes the terrain slope.
The sequence of processing steps is delineated in Figure 4. Initially, images were georeferenced using SRTM 30 m data. Subsequently, differential interferograms were crafted. Then, interferometric processing is performed with established spatial and temporal baseline thresholds, including interferogram generation, removal of the Flat-earth Effect, interferometric filtering, coherence computation, and phase unwrapping. All interferometric data pairs are registered to the primary images, with local pixel offsets of less than 0.02 pixels in both azimuth and range, well above the standard requirement of 0.1 pixels. The final stages of processing involved the removal of atmospheric phase distortions and the application of Singular Value Decomposition (SVD) to extract the temporal subsidence rates for the Karamay mining area.
To assess the capabilities of the Fucheng 1 satellite, its results were compared with those obtained from Sentinel-1A images. This comparison was conducted across several dimensions, including interferometric performance, the magnitude of subsidence monitoring, the scale of subsidence detected, and the outcomes of time-series analyses. The combined results of the comparative analysis provide a comprehensive assessment of the utility of Fucheng 1 in the field of geological monitoring.

4. Results

4.1. Fucheng 1 D-InSAR Results

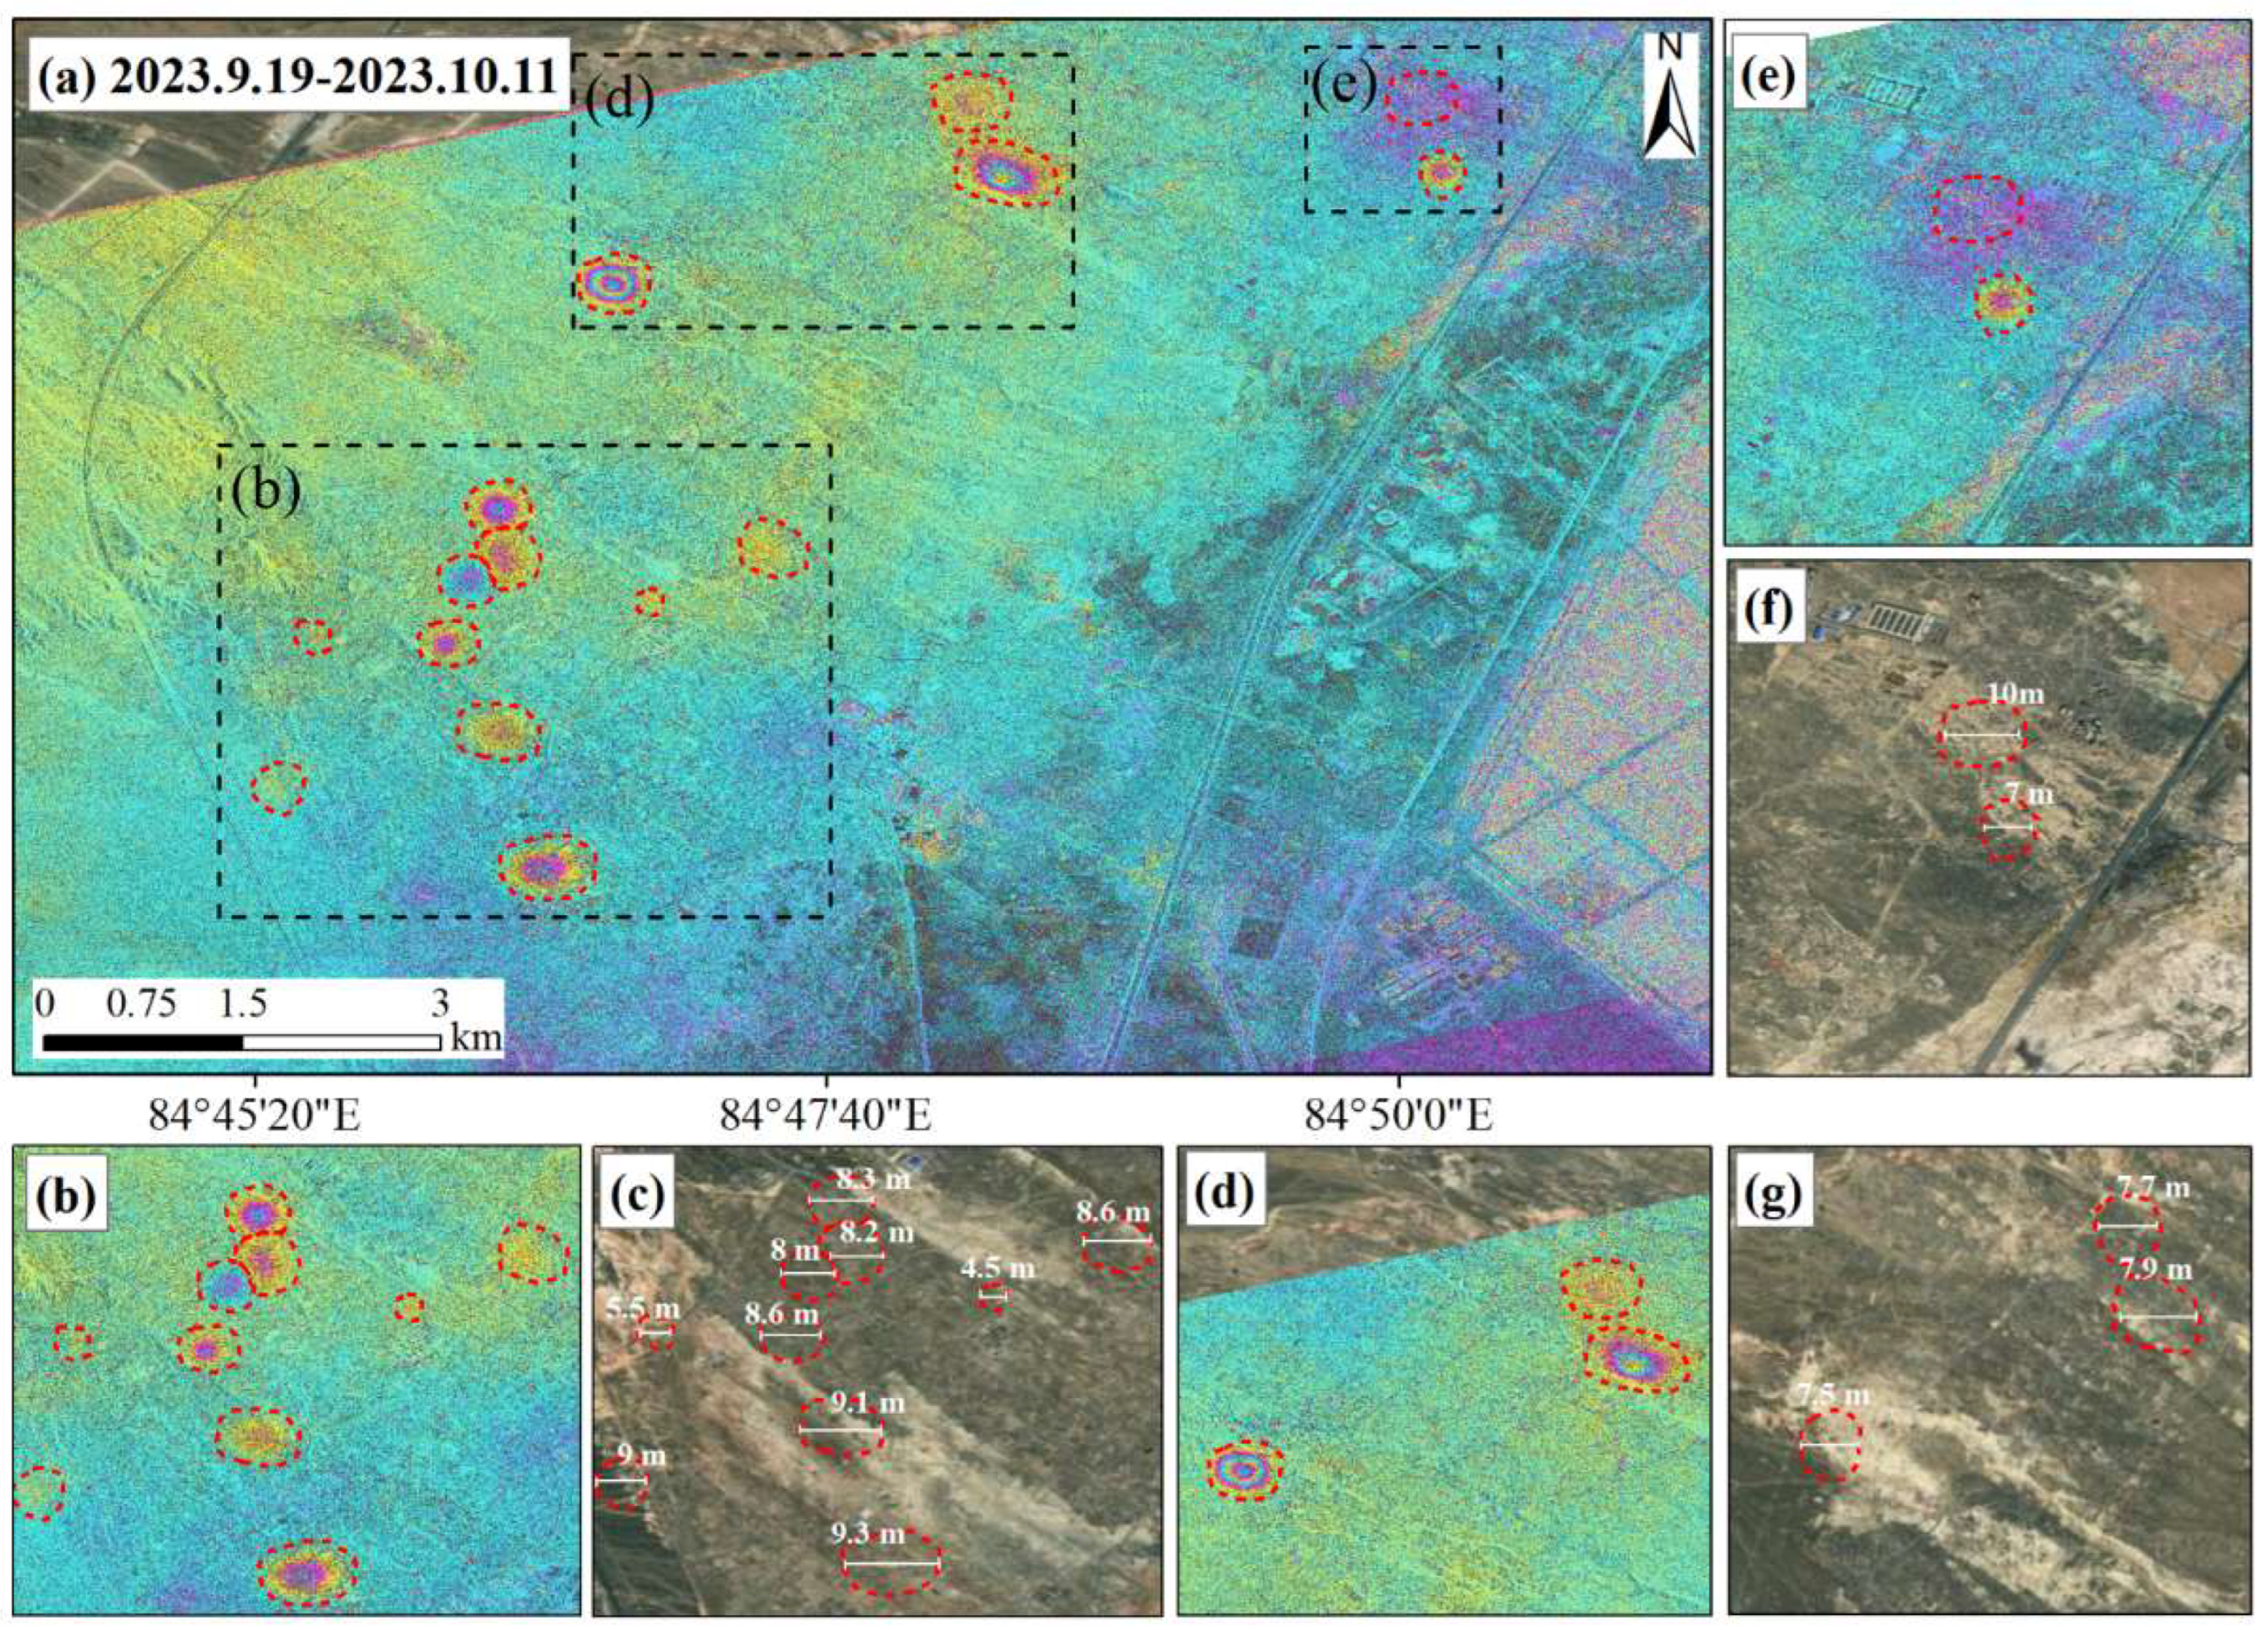
A significant challenge in employing D-InSAR technology for monitoring mining-induced subsidence is the managing of coherence issues. Given that coherence levels vary among different interferometric pairs during data processing, this study focuses on a selection of representative interference outcomes and examines their coherence. As depicted in Figure 5, the Fucheng 1 dataset is effective in detecting different subsidence zones within Karamay, identifying a total of 15 subsidence points. Notably, the most extensive subsidence zone observed measures a considerable width of 10 m. The excellent interferometric performance of the Fucheng 1 images underscores their robust interferometric capabilities within this particular region.

4.2. Fucheng 1 Stacking-InSAR Results

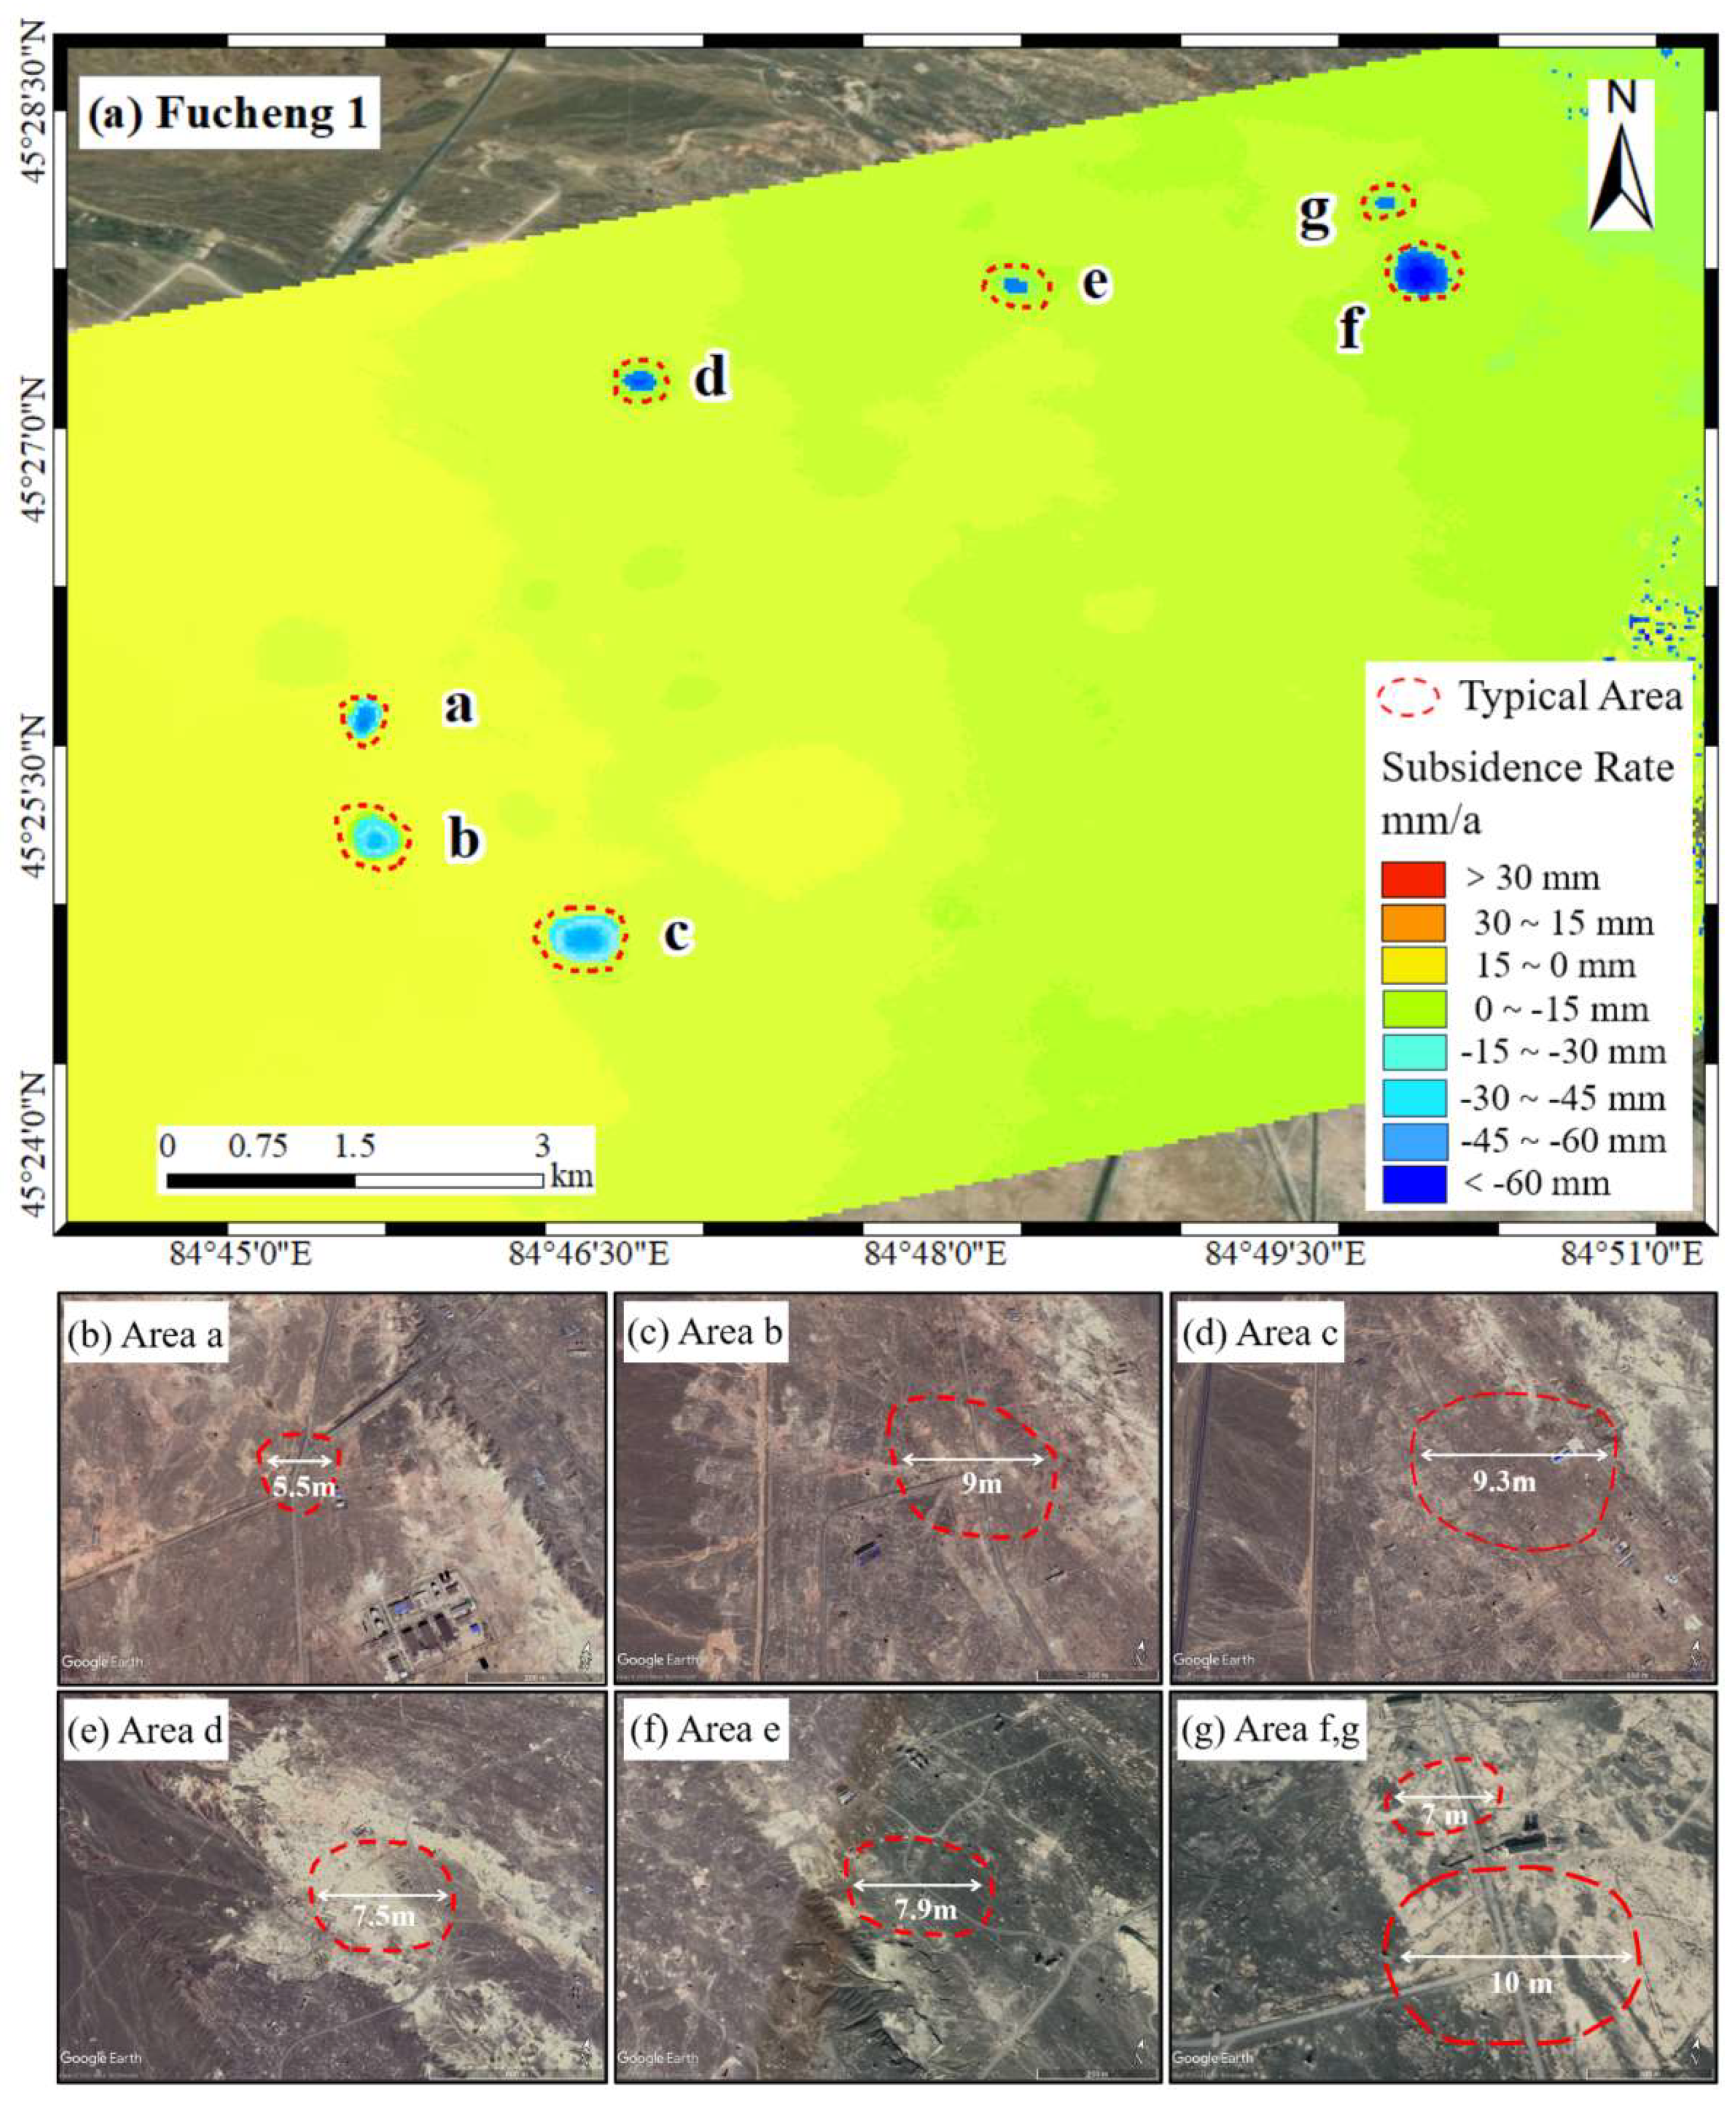
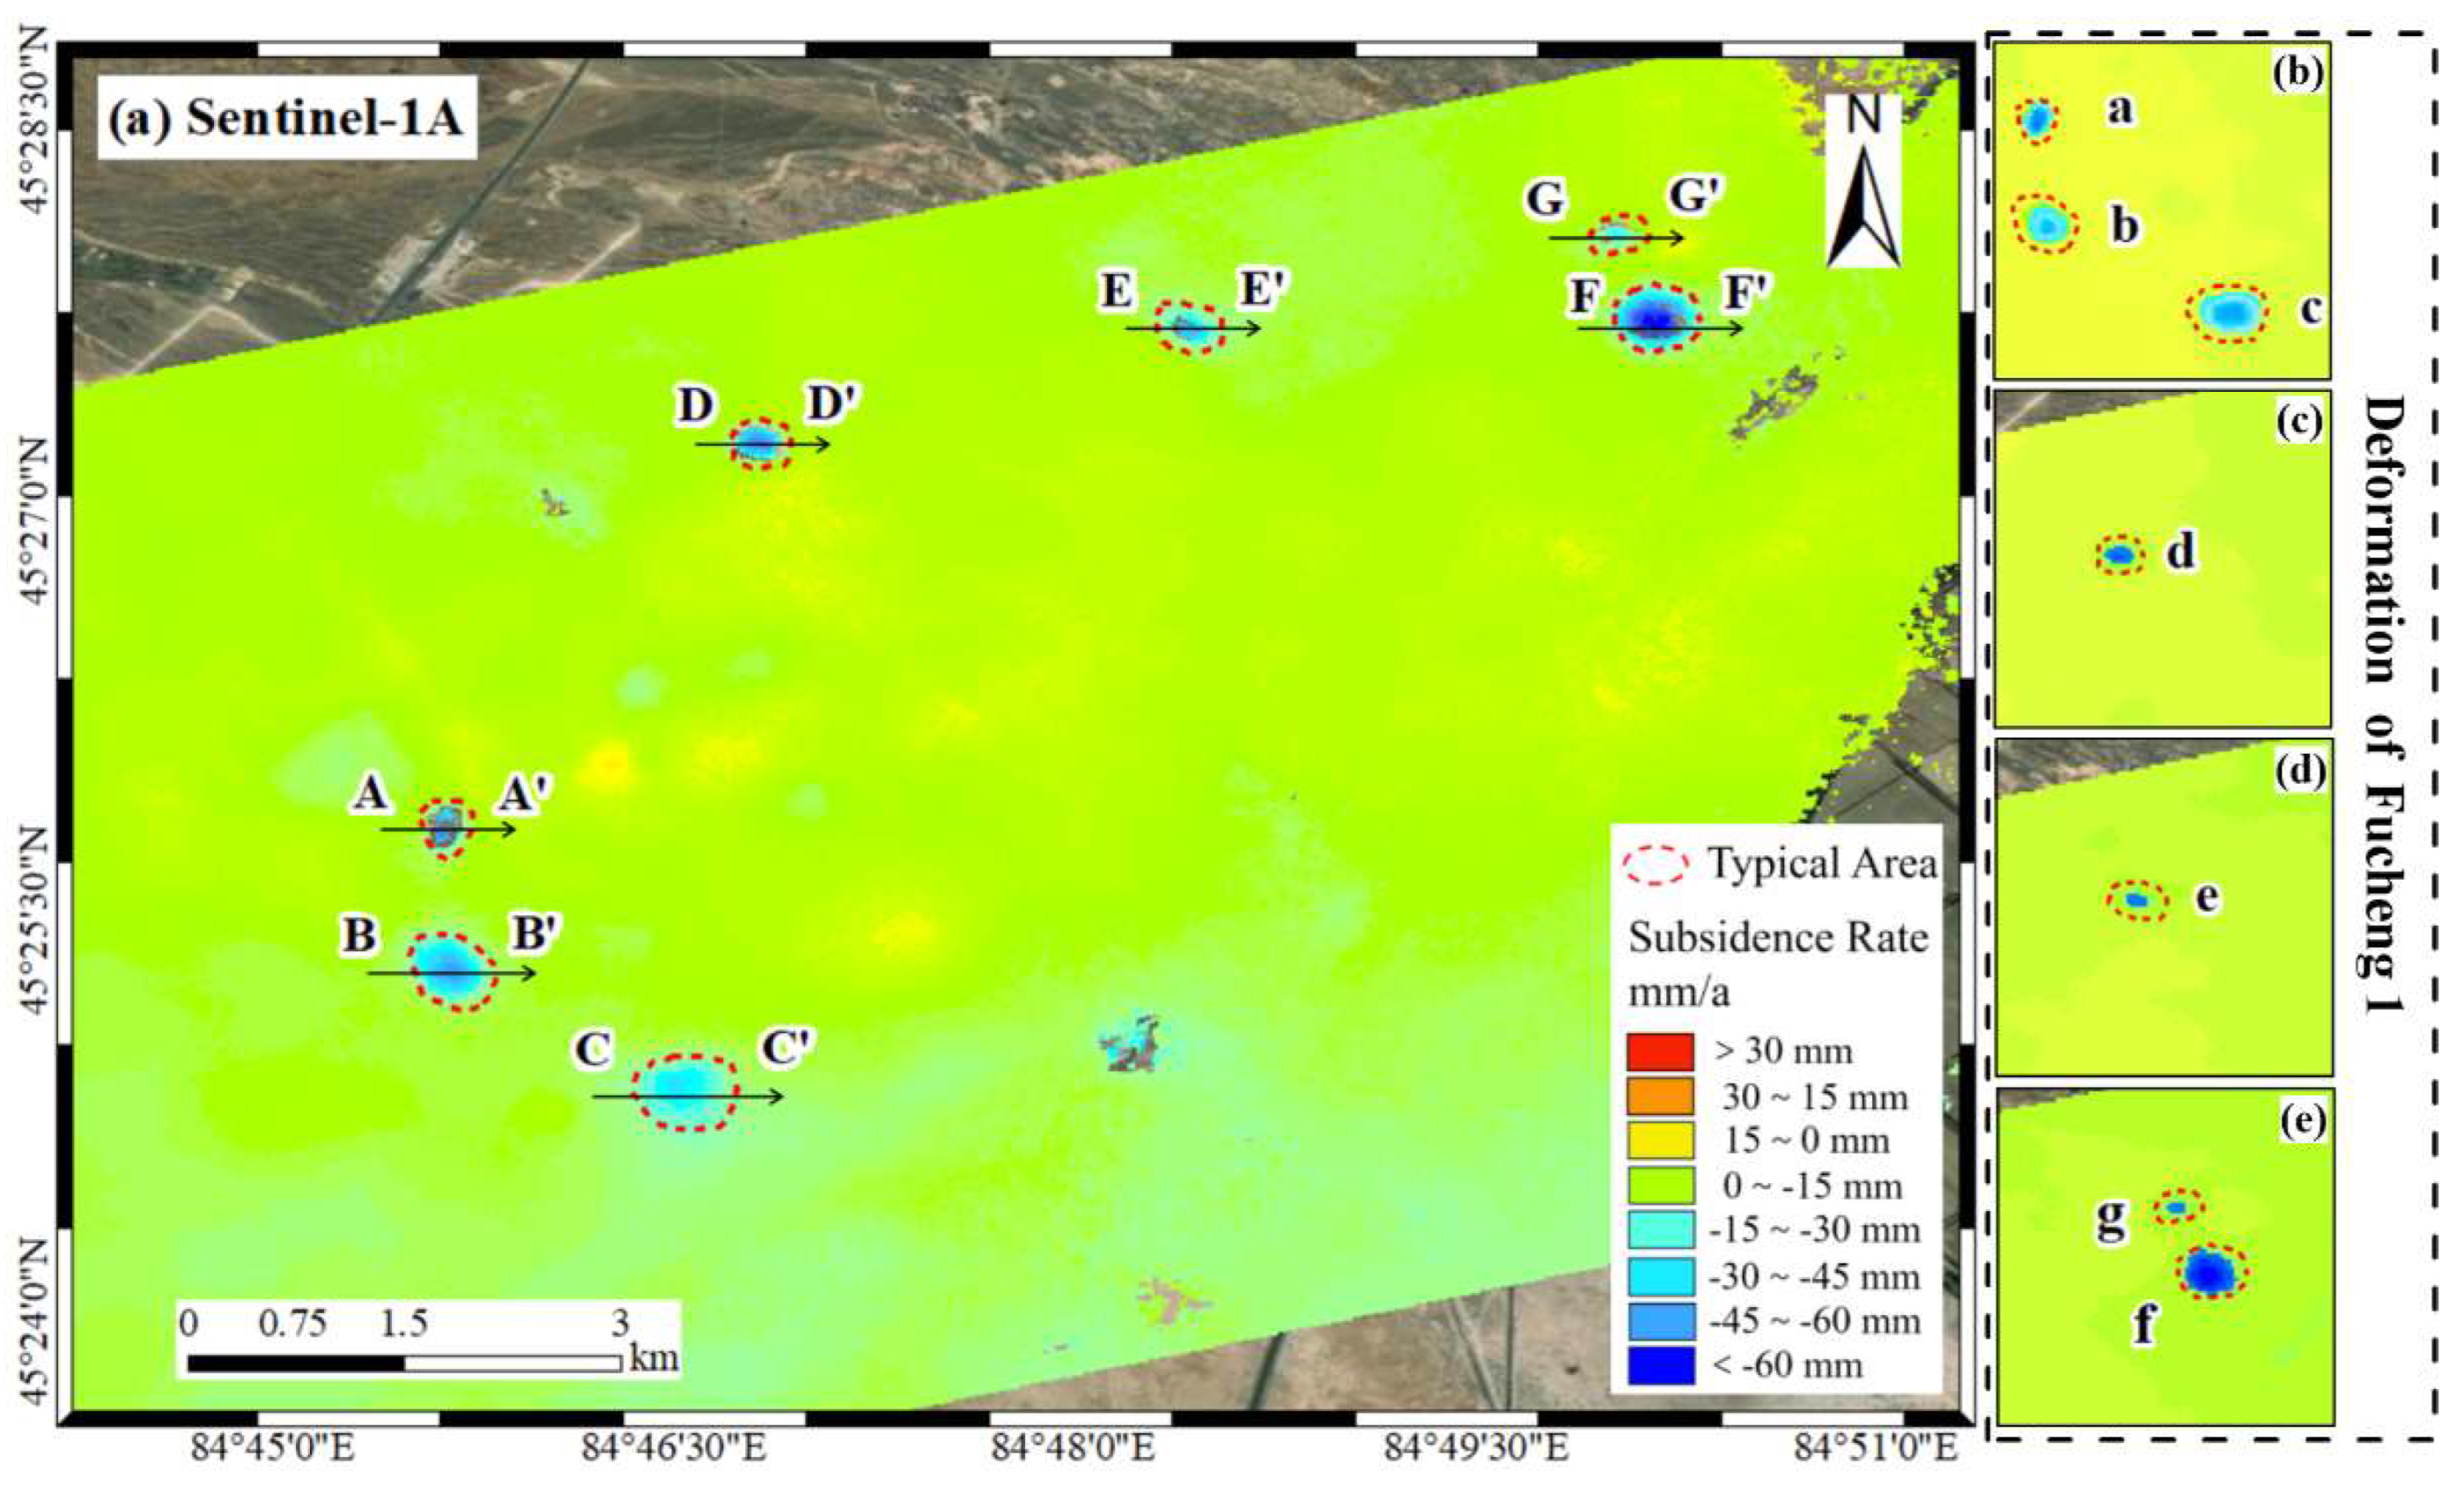
Figure 6 shows the average subsidence rate in the Karamay mine area from stacking calculations on 10 pairs of interferometric data, with negative values representing subsidence away from the satellite sensors (blue) and positive values representing uplift towards the sensors (red). Using a deformation rate of <−15 mm/year as the threshold, subsidence sites with high deformation rates (labeled as a–g areas) were identified at a total of seven locations in the study area, which are widely distributed and numerous. Among them, “area f”, located at the intersection of two unnamed roads in the mine area, had the highest and most extensive subsidence rate, with a subsidence rate of 62 mm/year in the center area, followed by “area d” with a subsidence rate of 43 mm/year. High-resolution optical imagery captured from September to November 2023 offers a detailed perspective on the temporal evolution of these subsidence events, with the width of each of the seven subsidence areas being greater than 5 m, so the extent of the subsidence is large. It is evident that all seven significant subsidence occurrences were around the unnamed highway servicing the mine or the adjacent houses, which poses a major threat to the safety of the mining operations and requires significant attention.

5. Discussion

5.1. Comparative Analysis of Multi-Platform SAR Images Interference

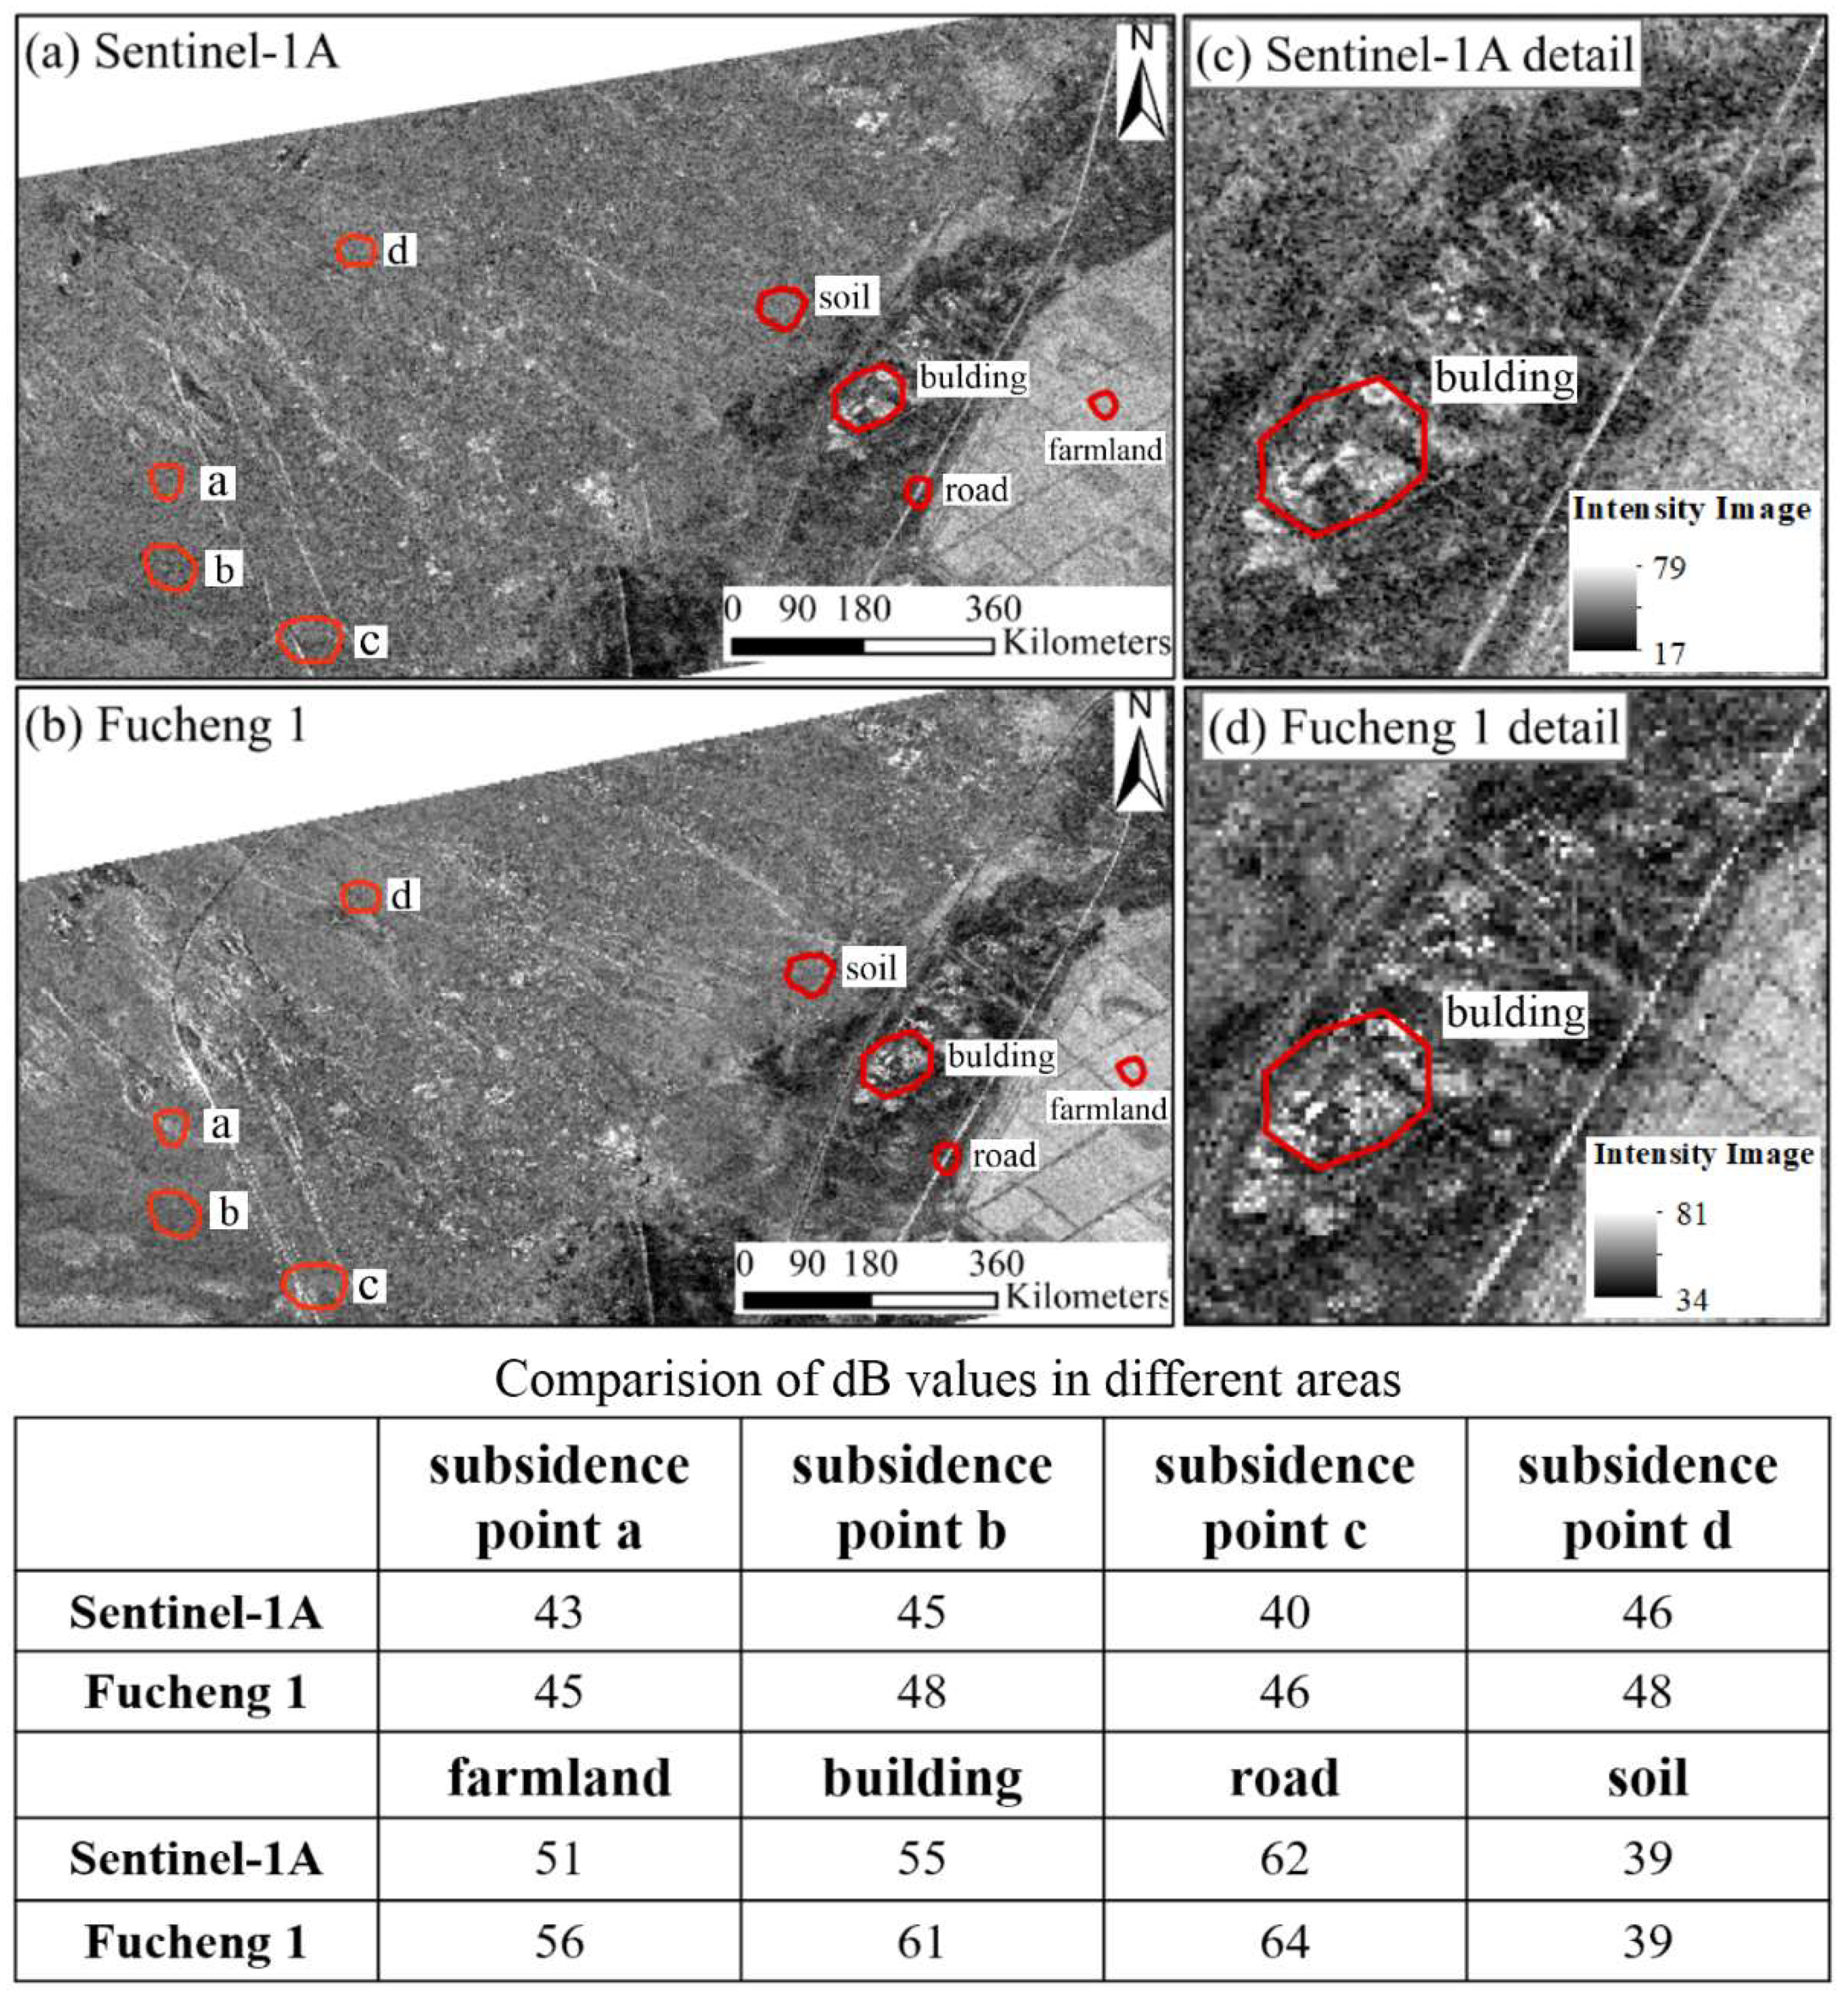
The dB value is used to measure the relative strength of radar echoes, thereby reflecting the quality of the radar images. Figure 7 shows the intensity images of the Sentinel-1A and the Fucheng 1, and four obvious subsidence areas and four different features (farmland, building, road and soil) are selected to calculate their dB value, respectively. It can be observed that the dB value range of Sentinel-1A in the study area is 17 to 79, while for Fucheng 1vis this is 34 to 81, and the overall intensity value range is consistent. Among these values, the dB value of Fucheng 1 is slightly higher than that of Sentinel-1A for all features, which provides better intensity information, and the feature with the strongest performance of intensity information is the road, with a dB value of 64.
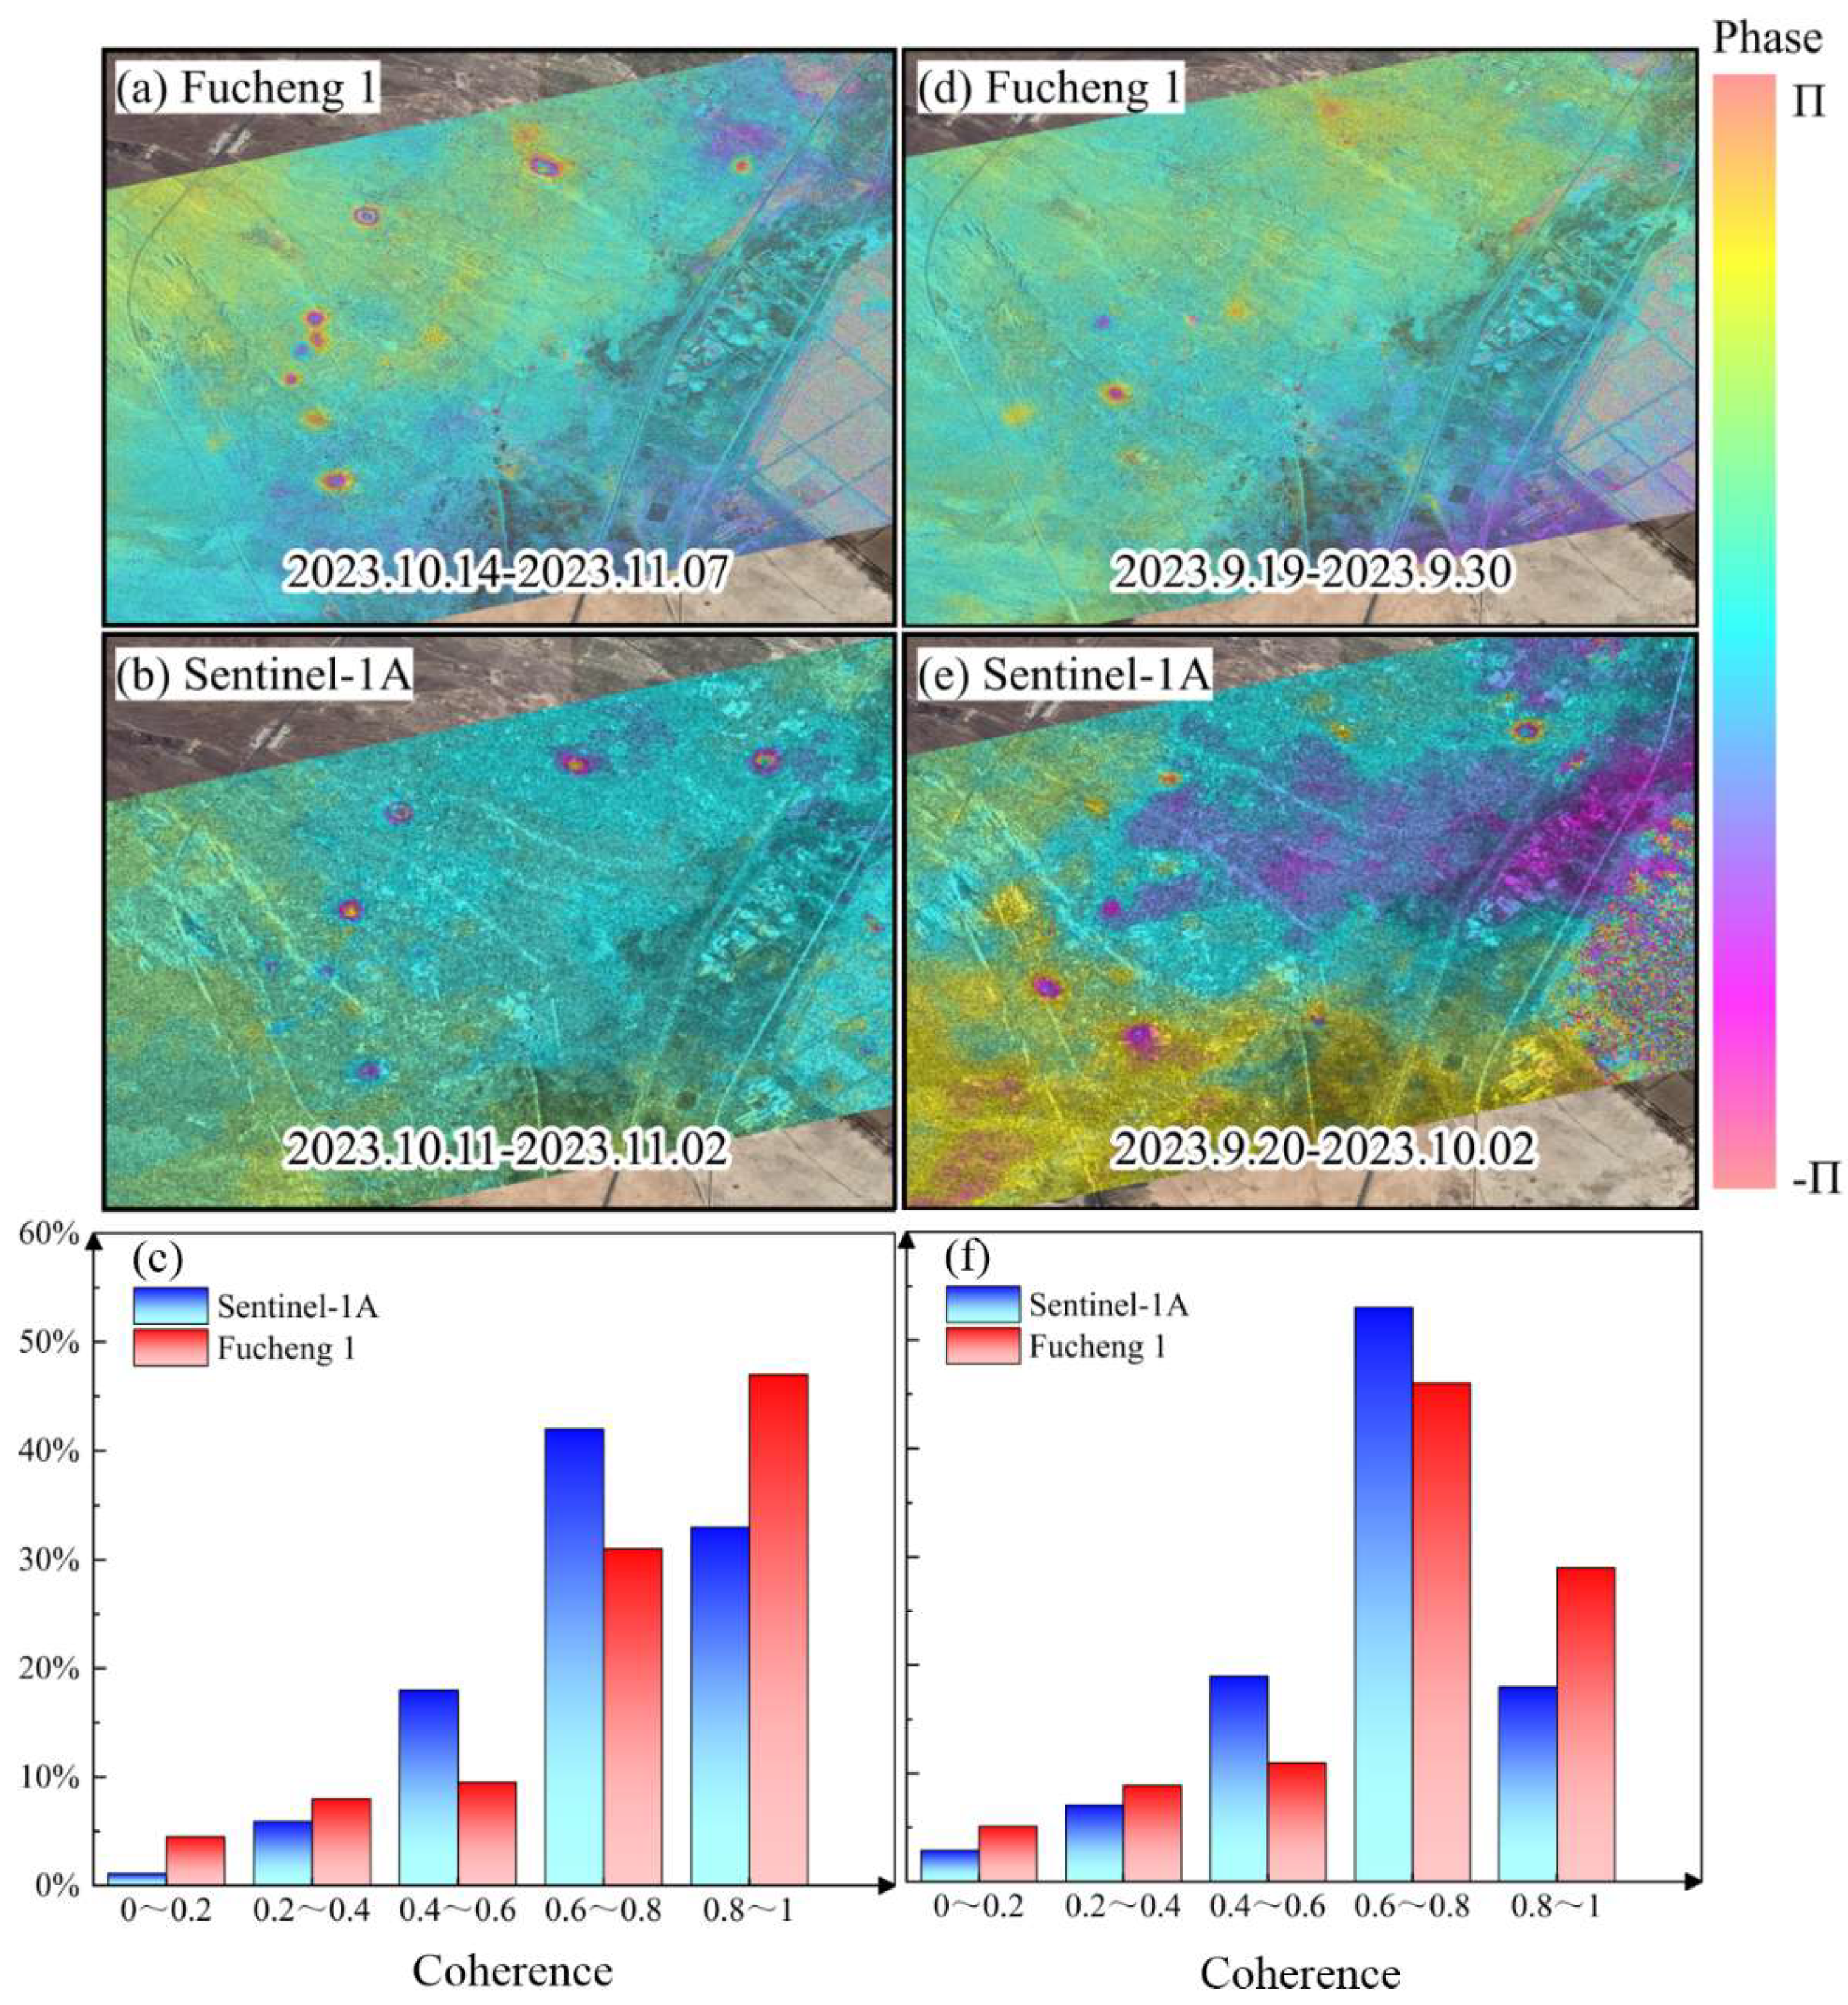
To further assess the interferometric performance of Fucheng 1 SAR imagery in the Karamay mining area, two sets of interferograms (11 October 2023–2 November 2023 and 19 September 2023–30 September 2023) were analyzed and compared with concurrent Sentinel-1A interferograms (14 October 2023–7 November 2023 and 20 September 2023–2 October 2023) (Figure 8). The comparison revealed that both satellites captured distinct interferometric fringes in areas of subsidence. However, the higher resolution of Fucheng 1 (six times that of Sentinel-1A) resulted in clearer fringes, enhancing the visibility of deformation, particularly in areas with subtle subsidence.
High coherence is defined as >0.6, and very high coherence as >0.8. Analysis showed that Sentinel-1A covered 75% and 71% of the area with high coherence, while Fucheng 1 achieved 75% and 78%, respectively. The proportion of pixels with very high coherence (>0.8) was 47% and 29% for Fucheng 1, surpassing Sentinel-1A. This indicates that, while both satellites demonstrated good coherence in the region, Fucheng 1 provided superior interferometric performance, offering a clearer depiction of the study area’s subsidence.
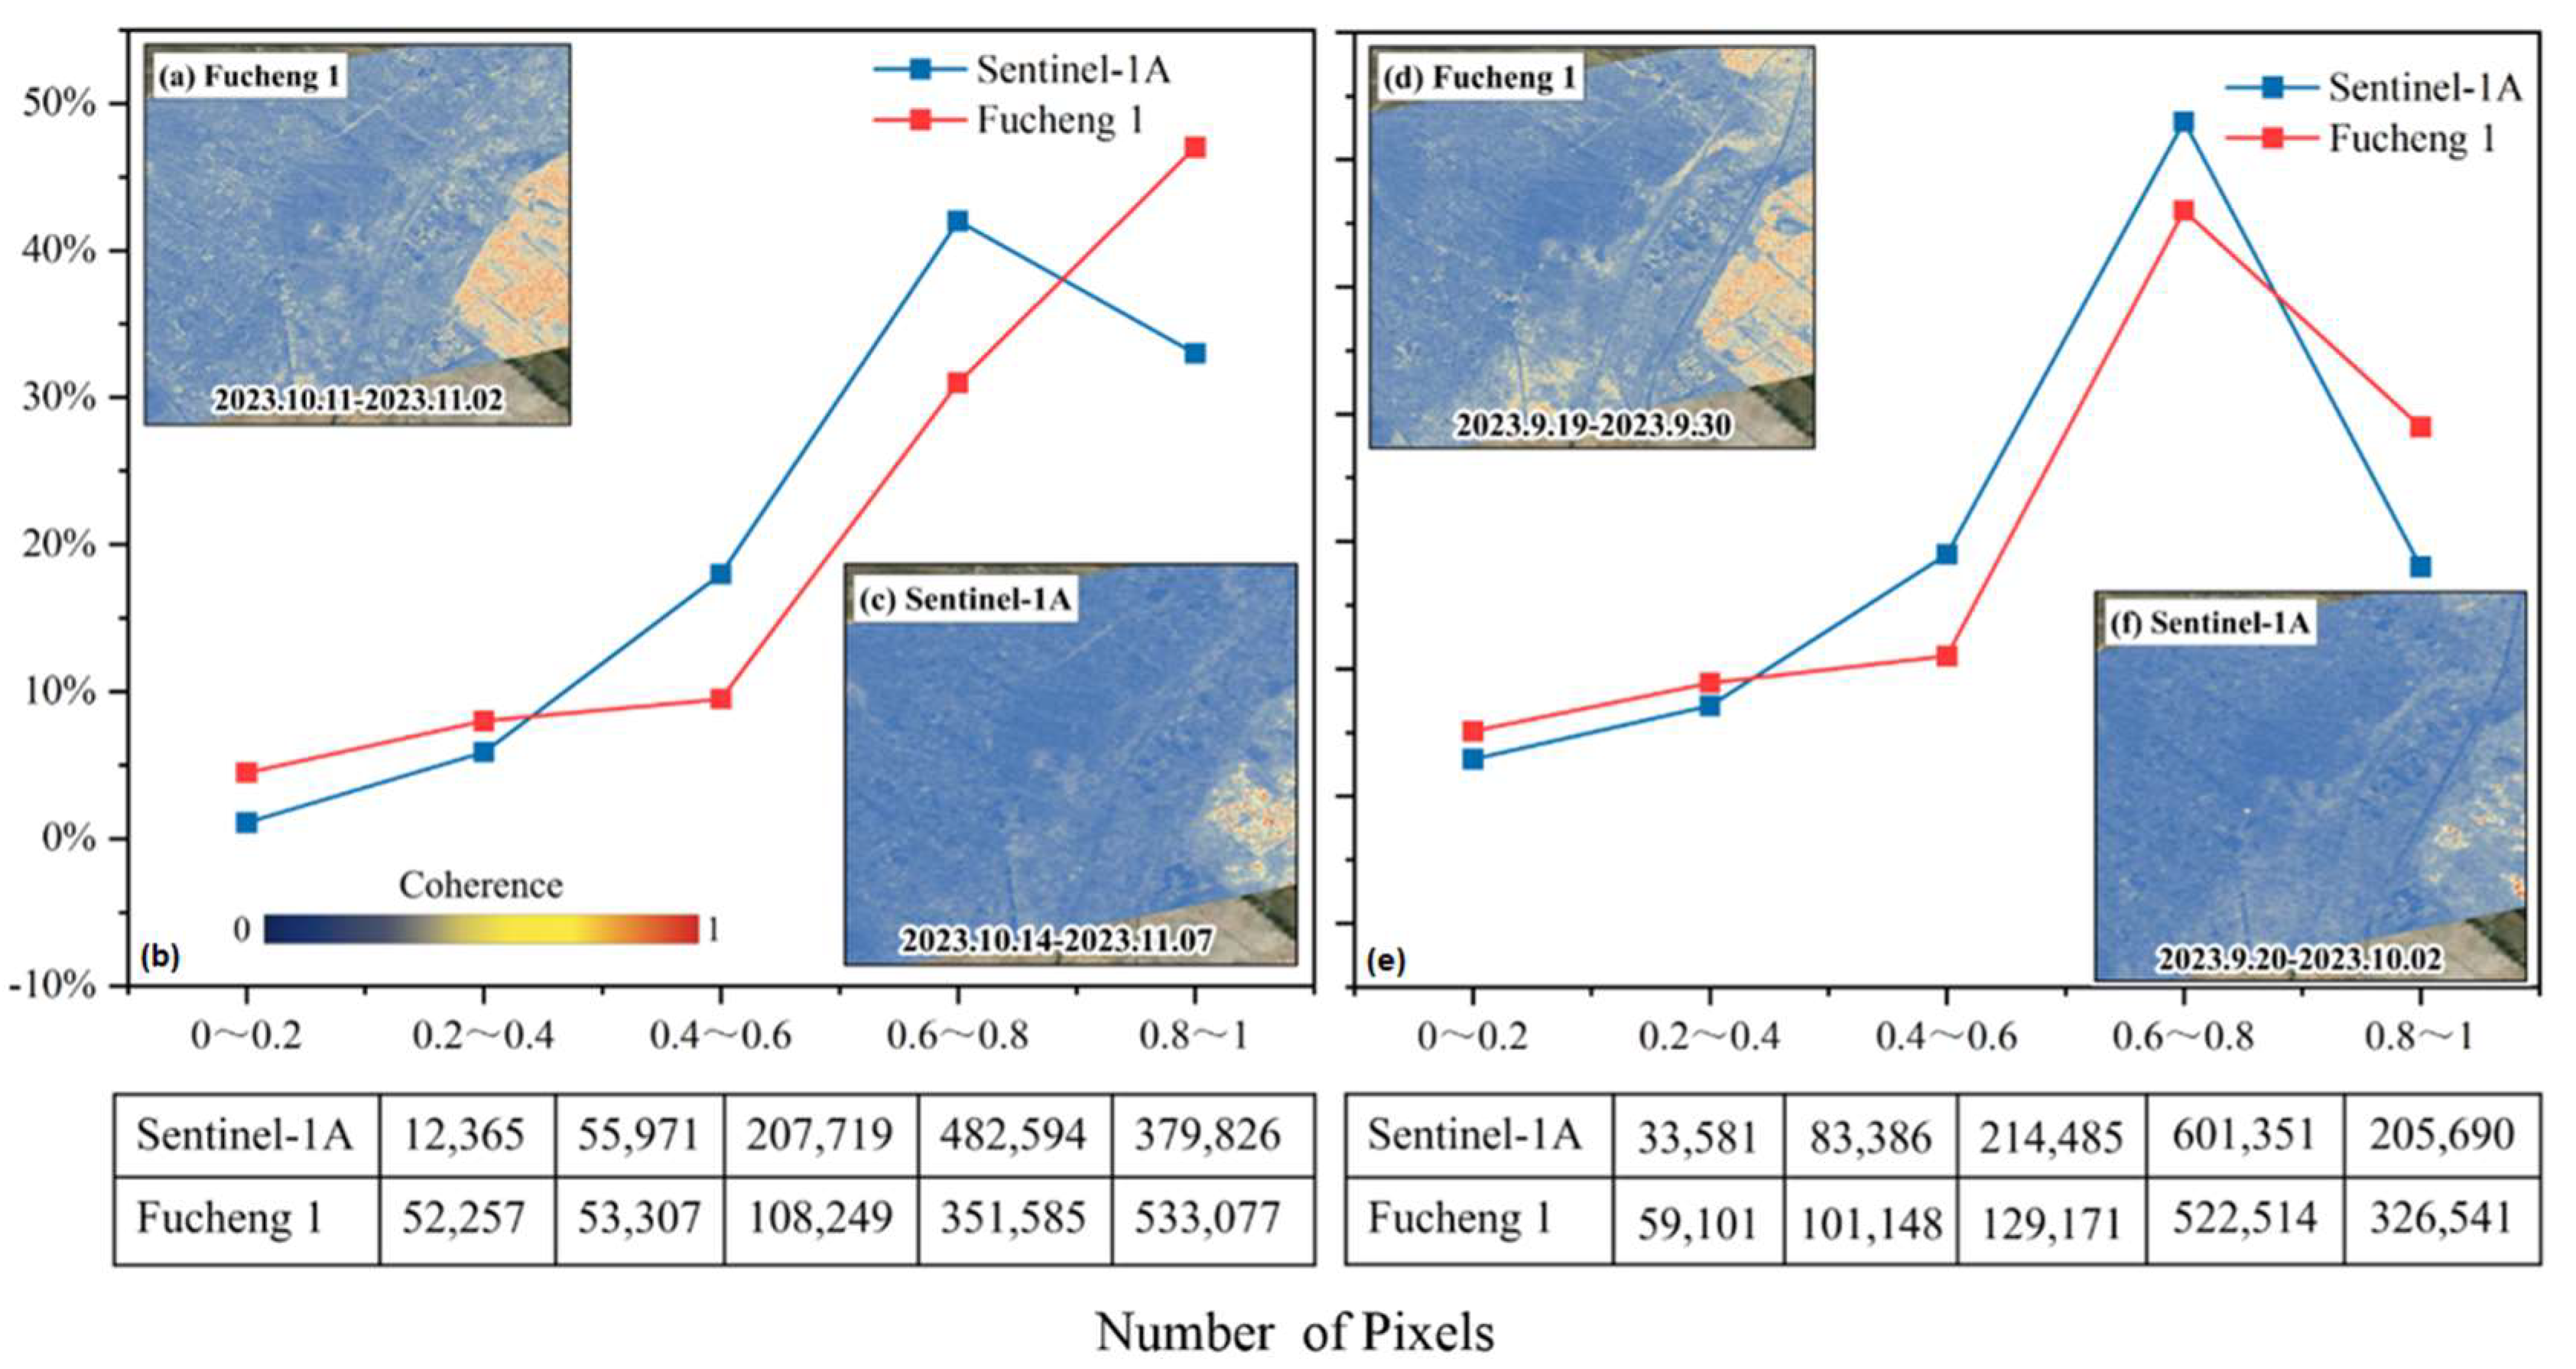
To facilitate a more precise comparison of the interferometric results between the two satellites, Figure 9 presents the coherence distributions for interferometric pairs from Sentinel-1A and Fucheng 1, which are represented by blue and red colors, respectively, with their corresponding coherence maps also provided for reference. In both sets of interferograms, the coherence values for the satellites are predominantly found within the range of 0.6 to 0.8. Specifically, for the first set of interferogram pairs, Sentinel-1A’s peak coherence values are observed between 0.6 and 0.8, whereas Fucheng 1 exhibits peak coherence values in the range of 0.8 to 1. In the second set of interferogram pairs, the peak coherence values for both satellites are noted within the 0.6 to 0.8 range. The imagery from both satellites in this region demonstrates strong interferometric performance, with a higher proportion of high coherence values observed in Fucheng 1 compared to Sentinel-1A.
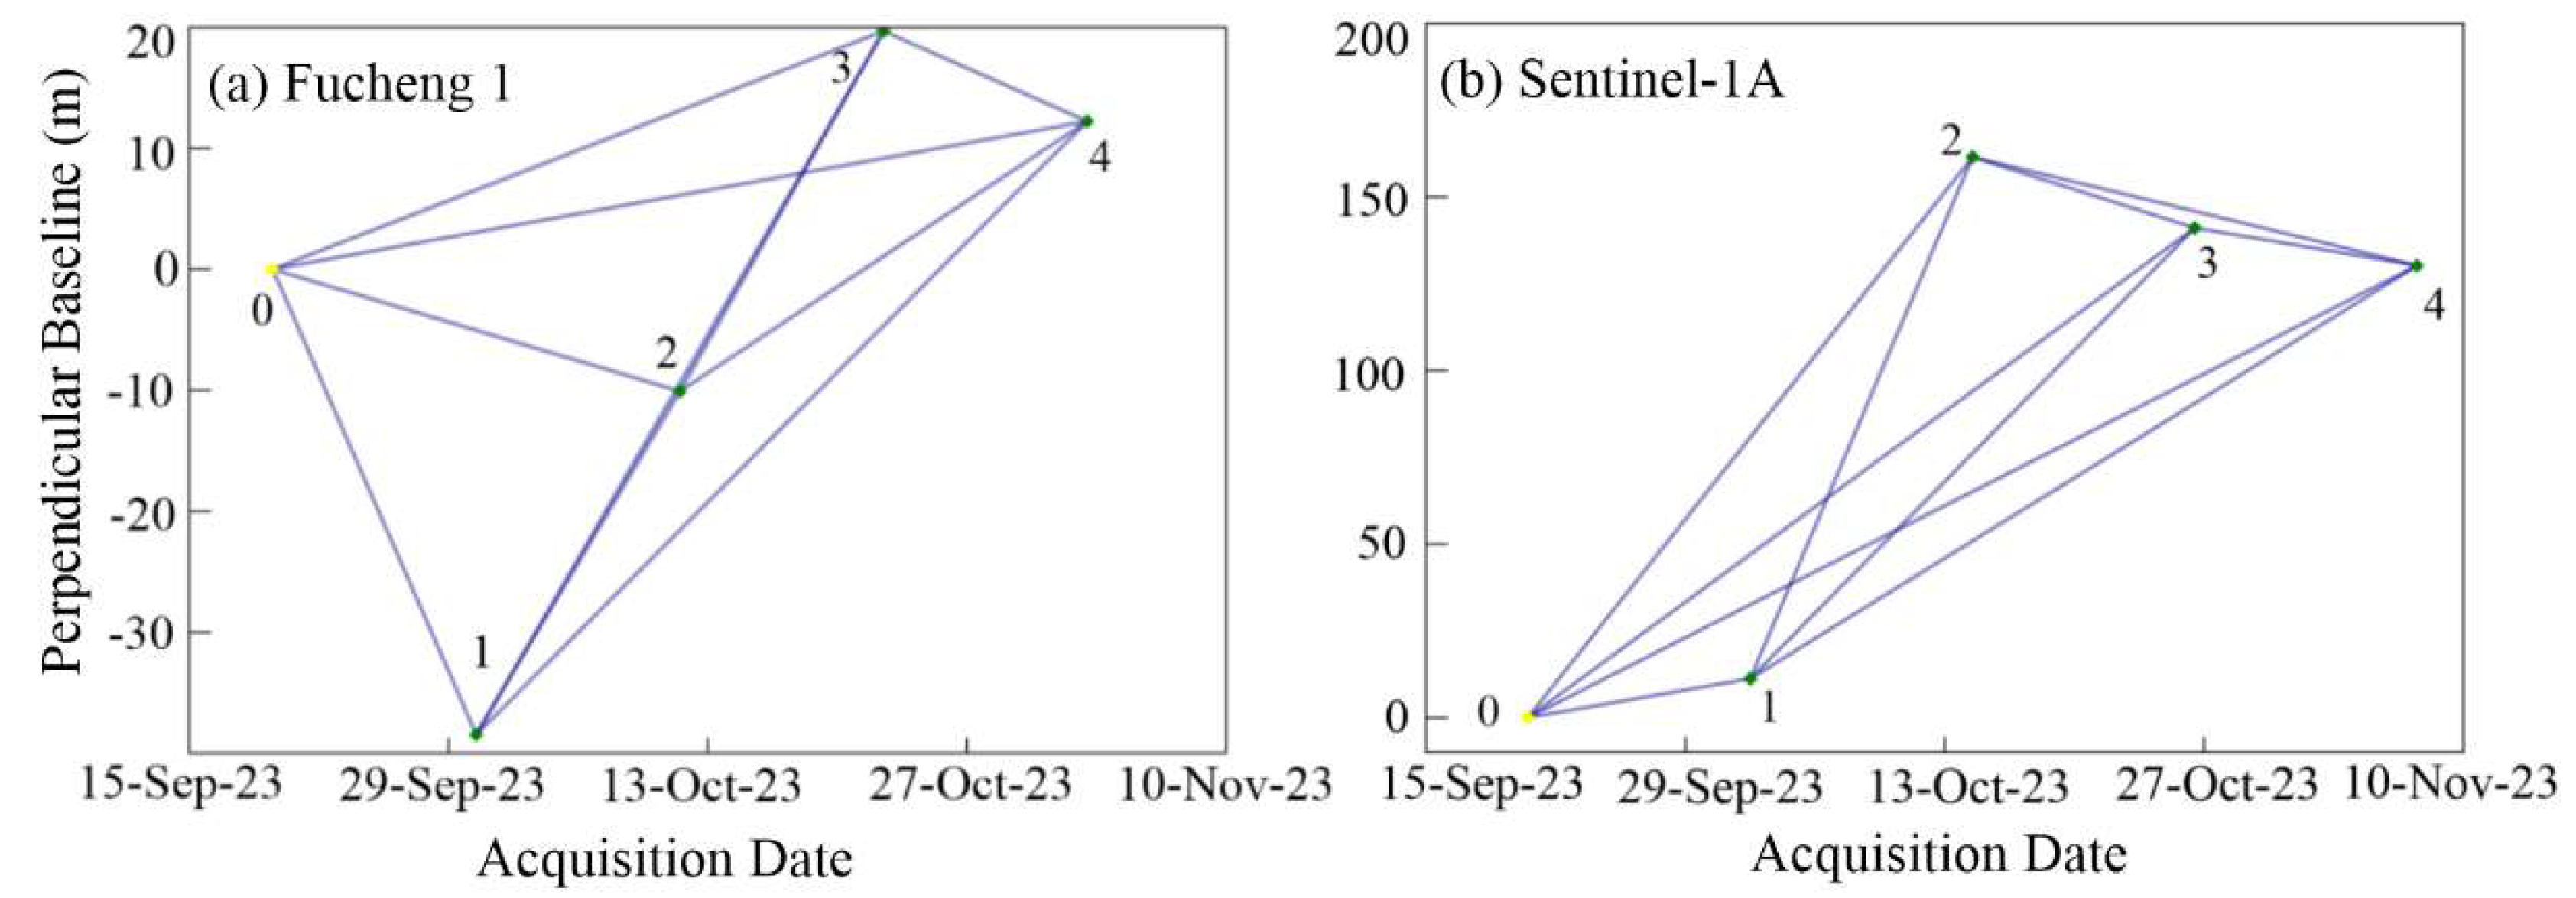
To further compare the interferometric capabilities of the two satellites in the same region, their spatial baseline distributions are illustrated in Figure 10. The spatial baselines of Sentinel-1A images range from 20 to 160 m, with most of them exceeding 100 m. In contrast, the spatial baselines of the Fucheng 1 images ranged from 8 to 30 m. During the observation period, the maximum spatial baseline of Sentinel-1A was almost eight times larger than the spatial baseline of Fucheng 1 SAR images. The superior interferometric capability of Fucheng 1 is attributed to its shorter baseline, which is less susceptible to coherence degradation. In contrast, the longer baseline of Sentinel-1A adversely impacts its coherence, thereby constraining its utility in monitoring mining-induced subsidence.

5.2. Comparative Analysis of Time-Series Results

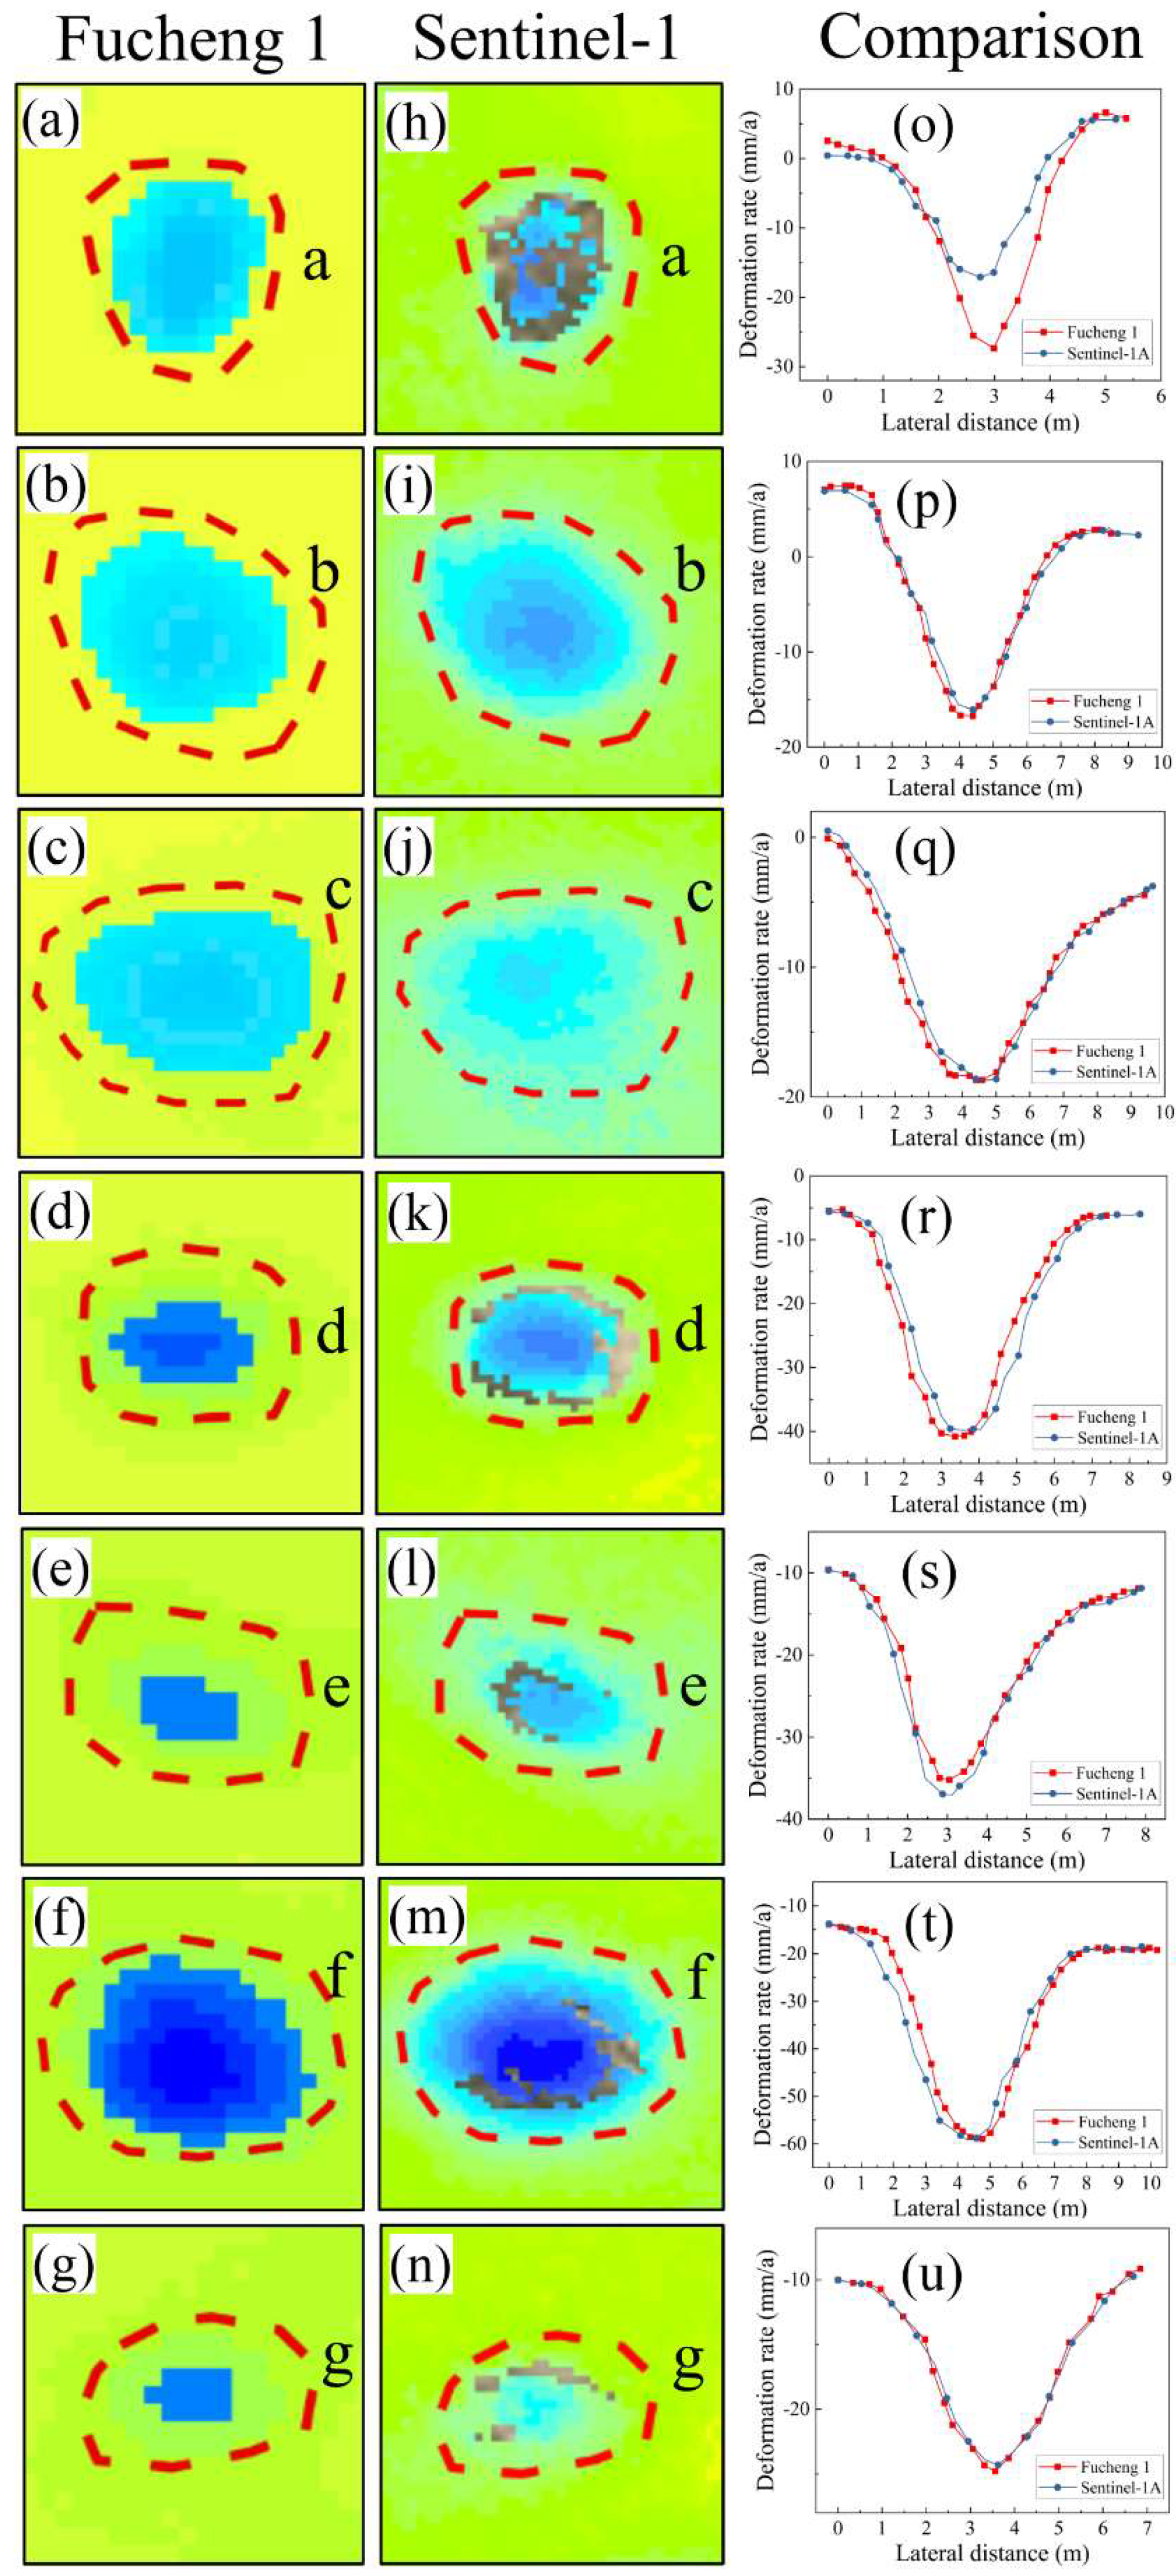
To evaluate the precision of the time-series deformation outcomes derived from the Fucheng 1 SAR imagery, this study incorporates subsidence rate data from Sentinel-1A for the identical period and region, ranging from September 2023 to November 2023, for comparative analysis. The results from the Sentinel-1A dataset serve as a benchmark to cross-validate the temporal deformation findings from the Fucheng 1 dataset. Figure 11 illustrate the subsidence rates within the study area for the specified timeframe, as calculated using SAR imagery from Fucheng 1 and Sentinel-1A, respectively (The subsidence rate of Fucheng 1 is shown in Figure 6). The spatial distribution of subsidence features extracted from both independent SAR sources are congruent, and the subsidence rate depicted by the Fucheng 1 imagery is largely consistent with Sentinel-1A observations (except area a), with a maximum discrepancy of less than 5 mm/year, suggesting a comparable deformation trend. The maximum deformation rate recorded in the Sentinel-1A imagery is −62 mm/year, which is situated in the “area f”, and the corresponding maximum rate in the Fucheng 1 imagery is also identified within this same locale.
As shown in Figure 12, a comparative analysis was performed on the deformation magnitudes of seven distinct subsidence areas (labeled a–g) monitored by the two satellites. With the exception of “area a”, the diameter and deformation magnitudes of the subsidence zones detected by the Fucheng-1 imagery were found to be essentially in agreement with those observed by the Sentinel-1A satellite. Given the substantial difference in the deformation magnitudes observed by the two satellites within “area a”, the study introduced the concept of the Maximum Detectable Deformation Gradient (MDDG) for analysis. The aim was to explore the relationship between the MDDG and factors such as the satellite’s wavelength and the azimuth resolution.
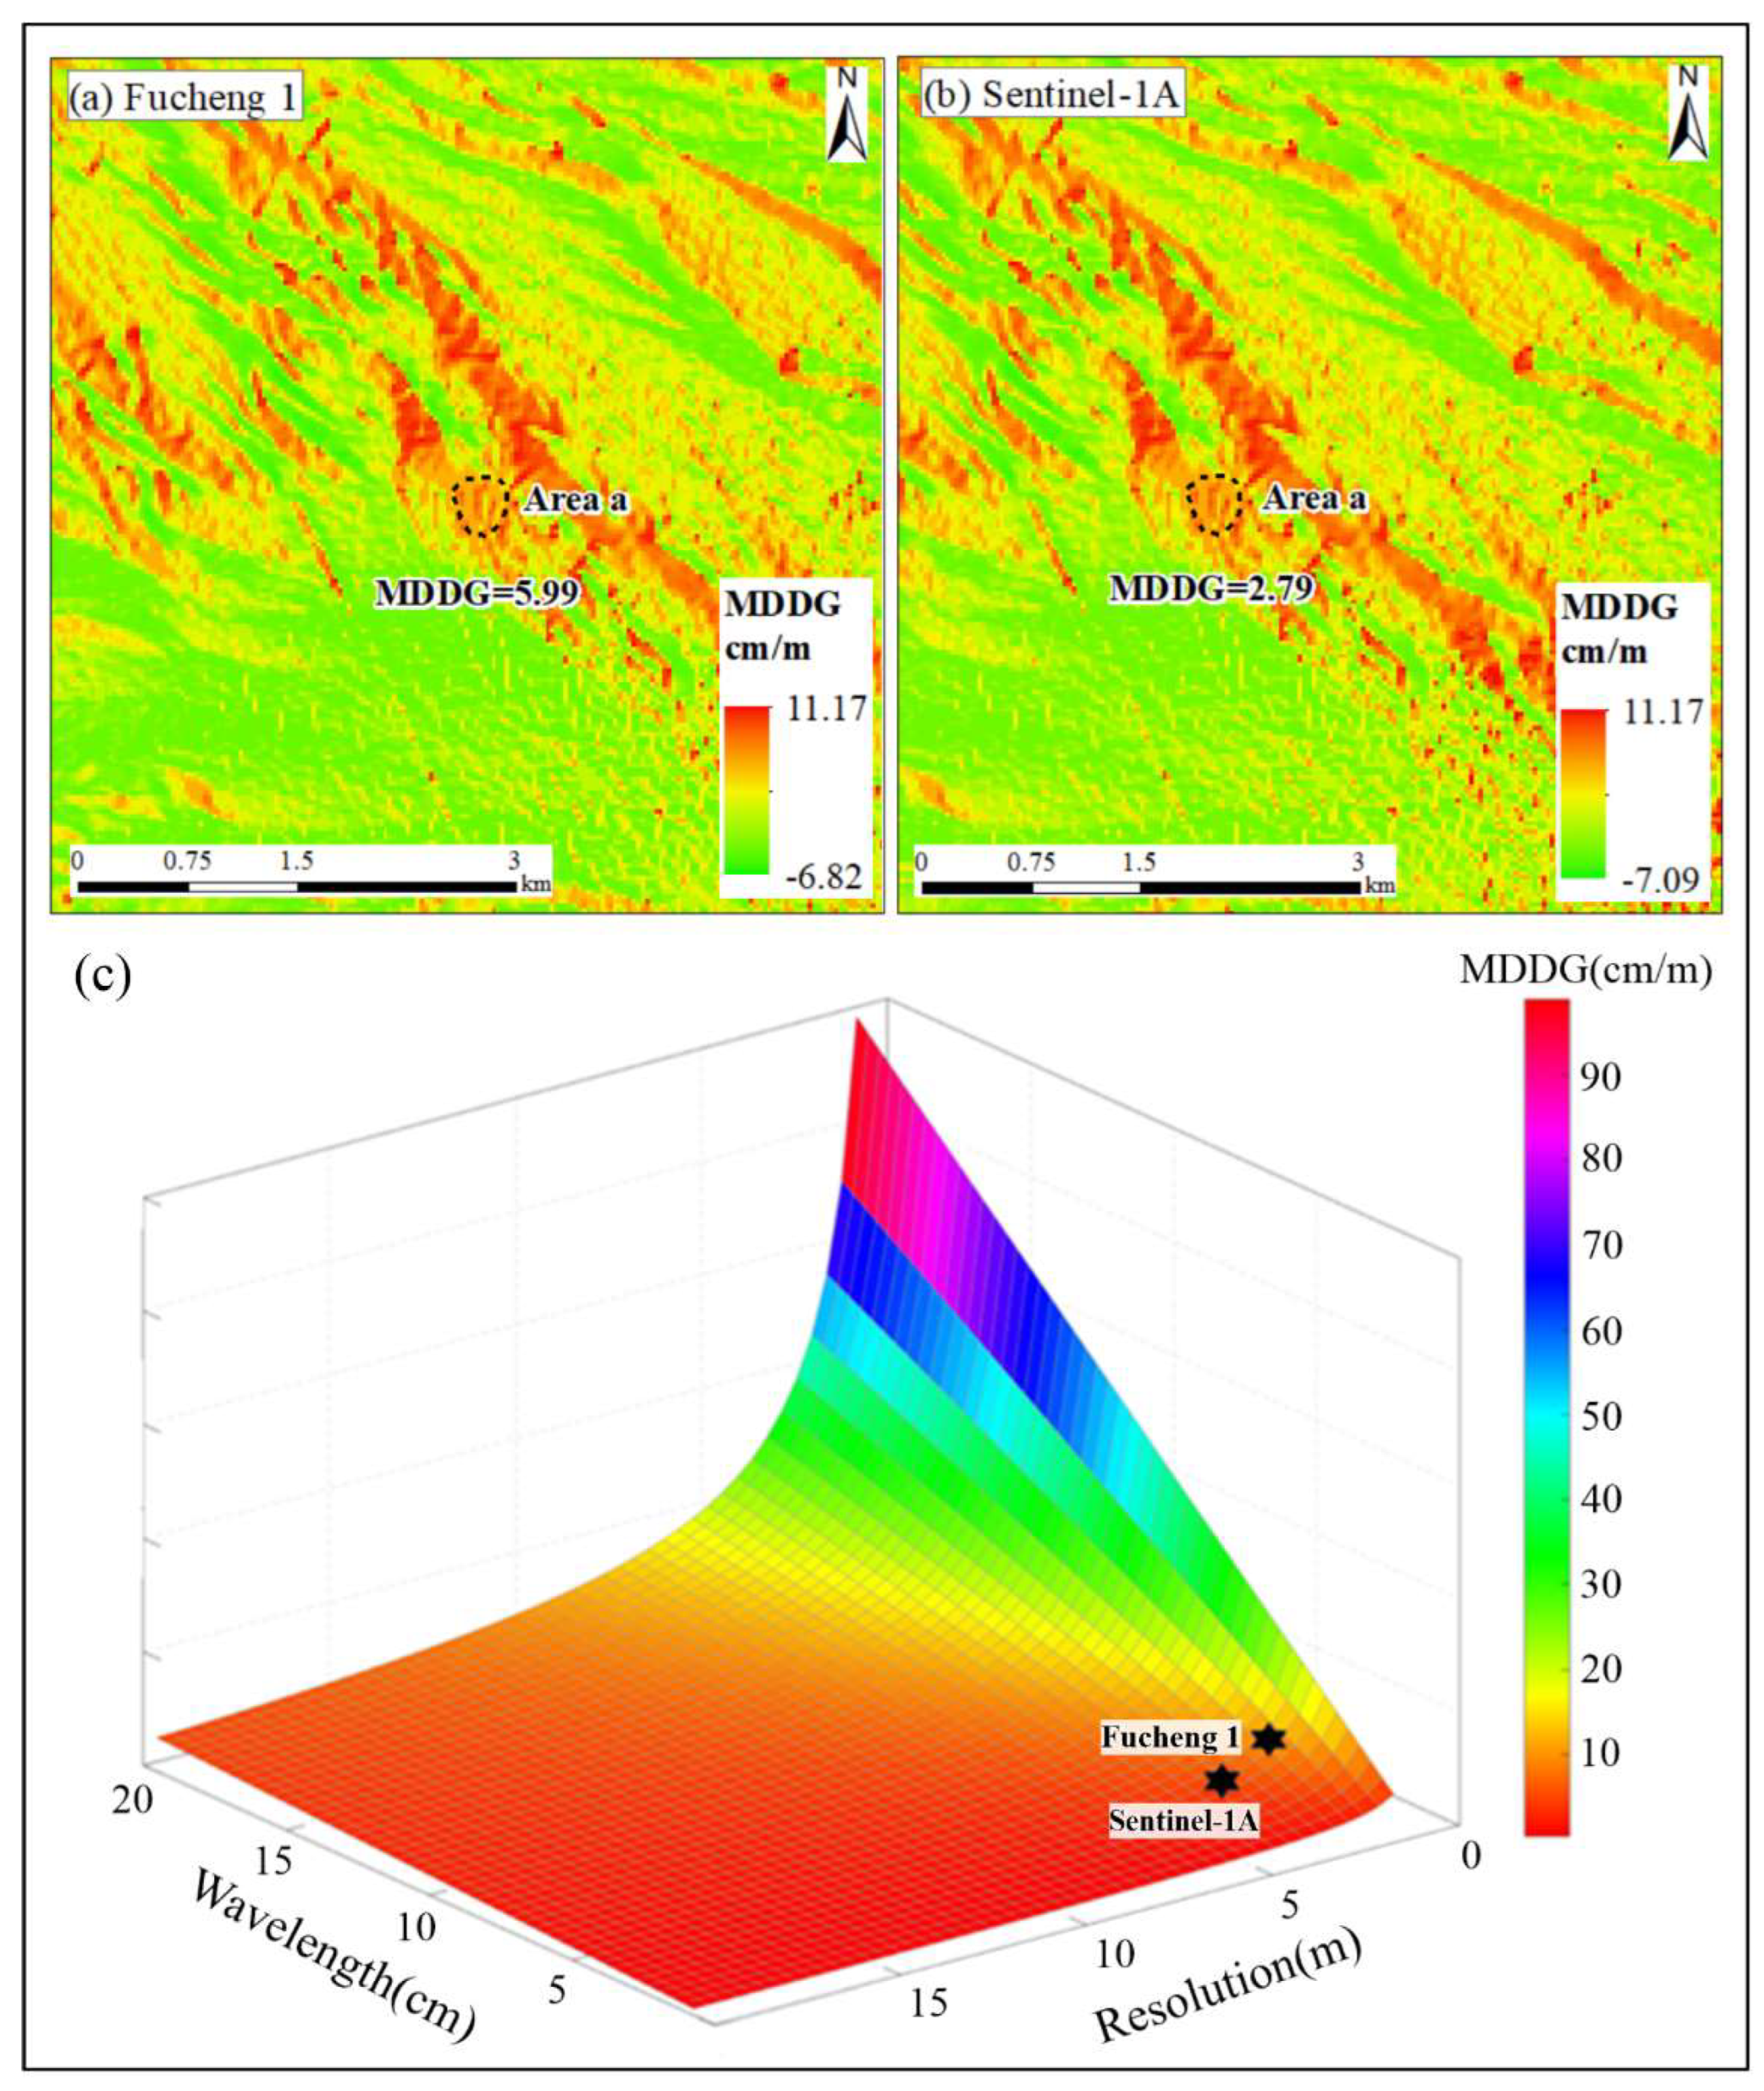
MDDG denotes the maximum displacement (cm/m) occurring at 1m ground distance [51], and its larger absolute value represents the better InSAR detection performance. Using the pixel spacing along the LOS direction and the wavelength of the corresponding SAR satellite, the MDDG can be derived as follows [52]:
M D D G = λ 2 η S T R × c o s γ
where λ represents the wavelength, η S T R is the pixel spacing of the resolution unit in the STR direction, and the γ represents the angular relationship between the displacement vector along the LOS direction and the displacement vector along the downslope direction of the slope.
By comparing and analyzing the MDDG values in area a, it can be found that the value of Sentinel-1A in this region is 2.79 and that of Fucheng 1 is 5.99 (Figure 13), and the maximum deformation gradient that can be monitored by Fucheng 1 is larger than that of the former in this area. Based on Figure 13 and in conjunction with related studies, it is concluded that the MDDG is affected by wavelength and tilt direction resolution. Both satellite data used in this study are from C-band and, with the same wavelength range, the MDDG increases gradually with the increase of tilt direction resolution. Among them, when the resolution increases from 20 m to 10 m, the effect on MDDG is relatively weak while, when the resolution is greater than 5 m, there is a significant increment in MDDG, and the overall MDDG of Fucheng 1 SAR images is greater than that of Sentinel-1A. This suggests that, under the influence of azimuth resolution, the MDDG capability of the Fucheng 1 satellite is enhanced by a factor of 2.15 in comparison to Sentinel-1A.

6. Conclusions

This study presents a comparative analysis of D-InSAR and Stacking-InSAR results between Fucheng 1 and Sentinel-1A images within the Karamay mine area. Fucheng 1 has just been officially launched. The comparison is of great significance for evaluating the performance of Fucheng 1 images concerning coherence and subsidence rate monitoring. The key findings from this analysis are as follows:
(1)
Fucheng 1 demonstrates superior visibility of subsidence within the study area, accompanied by a higher coherence. In comparison to Sentinel-1A, the shorter vertical baseline of Fucheng-1 enhances the interferometric quality of its interferograms. Consequently, the percentage of areas exhibiting good coherence within the two sets of typical interferometric pairs is higher for Fucheng 1 than for Sentinel-1A.
(2)
Utilizing a subsidence rate threshold of <−15 mm/year, a total of seven subsidence sites characterized by high regional deformation rates were identified within the study area. These sites are extensively distributed and numerous. The spatial distribution of the subsidence features, as inferred from the SAR imagery of both satellites, is found to be analogous. Furthermore, the monitored subsidence rates from the two satellites are largely consistent with one another, with a maximum monitoring discrepancy of less than 5 mm/year within the same area, barring any anomalies in “area a”.
(3)
Addressing the issue of significant discrepancies in the magnitude of deformation monitored by the two satellites within the a-region, this study introduces the concept of the MDDG. It is demonstrated that, as the tilt resolution improves, the MDDG capability of the Fucheng 1 satellite is enhanced by a factor of 2.15 relative to that of Sentinel-1A, which reveals the reasons for the differences in the subsidence values of the two satellites in “area a”.
The results show that the shorter vertical baseline and higher resolution of Fucheng 1 provide high interferometric analysis capability, which helps us to characterize and reveal the spatio-temporal subsidence pattern of the deformation area and provides support for high-precision ground deformation monitoring. Meanwhile, the high revisit period can provide timely response to sudden disasters. However, this study only analyzes the interferometric and subsidence monitoring capability of Fucheng 1. A more comprehensive evaluation of the SAR performance of Fucheng 1 itself will be carried out subsequently, so that it can be better applied in geologic disaster monitoring.

Author Contributions

Methodology, J.D.; Validation, J.D. and Y.H.; Investigation, T.S.; Data curation, G.T., W.R., X.S., C.Z. and H.W.; Writing—original draft, S.F.; Writing—review & editing, K.D.; Project administration, K.D. All authors have read and agreed to the published version of the manuscript.

Funding

This research was funded by the National Natural Science Foundation of China (42371462), Key research and development project of Guangxi Province (2021AB40118), Sichuan Province Science Fund for Distinguished Young Scholars (2023NSFSC1909), the fellowship of China Postdoctoral Science Foundation (2020M673322), National Key Research and Development Program of China (2021YFB3901403), and the State Key Laboratory of Geohazard Prevention and Geoenvironment Protection Independent Research Project (SKLGP2020012).

Data Availability Statement

Data is contained within the article.

Conflicts of Interest

Authors Weijia Ren, Xiaoru Sang, Chenwei Zhang, Hao Wang were employed by the company Spacety Company Limited. The remaining authors declare that the research was conducted in the absence of any commercial or financial relationships that could be construed as a potential conflict of interest.

References

  1. Zhang, Z.; Zeng, Q.; Yang, L. Monitoring of Surface Deformation in Mining Areas Using an Adaptive DS-InSAR Method Combined with Land Cover Types. J. Univ. Pekin. 2024, 60, 265–276. [Google Scholar] [CrossRef]
  2. Xiao, H.; Yin, M.; Jiang, Y.; Yang, J. Development, Current Status, and Prospects of China’s National Coal Standards. China Stand. 2004, 4, 24–26. [Google Scholar]
  3. Yang, X.; Niu, Y.; Zhang, Z.; Zhang, P.; Liu, K. Research on Mine Subsidence Monitoring using SBAS-InSAR Integrated with UAV-derived DEM: A Case Study in a Mining Area in Wu’an. Prog. Earth Planet. Sci. 2024, 39, 38–47. [Google Scholar]
  4. Przyłucka, M.; Kowalski, Z.; Perski, Z. Twenty years of coal mining-induced subsidence in the Upper Silesia in Poland identified using InSAR. Int. J. Coal Sci. Technol. 2024, 9, 86. [Google Scholar] [CrossRef]
  5. Chang, Y.; Xu, X.; Wang, Z.; Yang, P.; Liu, H.; Zhang, Y. Hydrogeological Support in the Disaster Relief of the “12·25” Gypsum Mine Collapse Accident in Pingyi, Shandong Province. Chin. J. Geol. Hazard Control. 2018, 29, 67–71. [Google Scholar]
  6. Feng, F.; Jing, P. Multi-stakeholder Emergency Collaborative Governance in the Context of Unexpected Events: Problems and Optimizations—A Case Study of the “2·22” Coal Mine Collapse Accident in Alashan, Inner Mongolia. City Disaster Reduct. 2024, 1, 54–59. [Google Scholar]
  7. Qian, J. Collapse of a Gold Mine in Tanzania Kills at Least 21 People and Leaves Many Missing. CCTV News. 2024. Available online: https://news.cctv.cn/2024/01/14/ARTICDXx1ybdMjLt6urU8Hg7240114.shtml (accessed on 20 March 2024).
  8. Xia, Y. CR-Based SAR-Interferometry for Landslide Monitoring. In Proceedings of the IGARSS 2008-2008 IEEE International Geoscience and Remote Sensing Symposium, Boston, MA, USA, 6–11 July 2008; Volume 2, p. II-1239. [Google Scholar]
  9. Wang, T. Time-Series InSAR Analysis over the Three Gorges Region: Techniques and Applications. Ph.D. Thesis, Wuhan University, Wuhan, China, 2010. [Google Scholar]
  10. Xu, Q.; Yuan, Y.; Zeng, Y.; Hack, R. Some New Pre-warning Criteria for Creep Slope Failure. Sci. China Technol. Sci. 2015, 54, 210–220. [Google Scholar] [CrossRef]
  11. Li, Z.; Song, C.; Yu, C.; Xiao, R.; Chen, L.; Luo, H.; Dai, K.; Ge, D.; Ding, Y.; Zhang, Y.; et al. Application and Challenges of Satellite Radar Remote Sensing in Landslide Detection and Monitoring. Geo. Inf. Sci. Wuhan Univ. 2019, 44, 967–979. [Google Scholar]
  12. Strozzi, T.; Klimeš, J.; Frey, H.; Caduff, R.; Huggel, C.; Wegmüller, U.; Rapre, A.C. Satellite SAR Interferometry for the Improved Assessment of the State of Activity of Landslides: A Case Study from the Cordilleras of Peru. Remote Sens. Environ. 2018, 217, 111–125. [Google Scholar] [CrossRef]
  13. Liu, P.; Li, Z.; Hoey, T.; Kincal, C.; Zhang, J.; Zeng, Q.; Muller, J.P. Using Advanced InSAR Time Series Techniques to Monitor Landslide Movements in Badong of the Three Gorges Region, China. Int. J. Appl. Earth Obs. Geoinf. 2013, 21, 253–264. [Google Scholar] [CrossRef]
  14. Dai, K.; Li, Z.; Xu, Q.; Bürgmann, R.; Milledge, D.G.; Tomas, R.; Fan, X.; Zhao, C.; Liu, X.; Peng, J.; et al. Entering the era of Earth-Observation Based Landslide Warning System. IEEE Geosci. Remote Sens. Mag. 2020, 8, 136–153. [Google Scholar] [CrossRef]
  15. Wang, G.; Li, P.; Li, Z.; Liu, J.; Zhang, Y.; Wang, H. InSAR and Machine Learning Reveal New Understanding of Coastal Subsidence Risk in the Yellow River Delta, China. Sci. Total Environ. 2024, 915, 170203. [Google Scholar] [CrossRef] [PubMed]
  16. Liang, R.; Dai, K.; Xu, Q.; Pirasteh, S.; Li, Z.; Li, T.; Wen, N.; Deng, J.; Fan, X. Utilizing Full Polarimetric SAR to Map Coseismic Landslides Inventory of the 2017 Mw 7.0 Jiuzhaigou Earthquake (China). Int. J. Appl. Earth Obs. Geoinf. 2024, 127, 103657. [Google Scholar]
  17. Liao, M.; Dong, J.; Li, M.; Ao, M.; Lu, Z.; Shi, X. Landslide Hazard Identification and Deformation Monitoring Using Radar Remote Sensing. J. Remote Sens. 2021, 25, 332–341. [Google Scholar]
  18. Zhou, H.; Dai, K.; Pirasteh, S.; Li, R.; Xiang, J.; Li, Z. InSAR Spatial-heterogeneity Tropospheric Delay Correction in Steep Mountainous Areas Based on Deep Learning for Landslides Monitoring. IEEE Trans. Geosci. Remote Sens. 2023, 61, 1–14. [Google Scholar] [CrossRef]
  19. Li, G.; Zhang, R.; Liu, G.; Yu, B.; Zhang, B.; Dai, K.; Bao, J.; Wei, B. Sentinel-1A TS-DInSAR Monitoring and Analysis of Subsidence in the Beijing-Tianjin-Hebei Region. J. Remote Sens. 2018, 22, 633–646. [Google Scholar]
  20. Qu, F.; Zhang, Q.; Lu, Z.; Zhao, C.; Yang, C.; Zhang, J. Land Subsidence and Ground Fissures in Xi’an, China 2005–2012 Revealed by Multi-Band InSAR Time-Series Analysis. Remote Sens. Environ. 2014, 155, 366–376. [Google Scholar] [CrossRef]
  21. Dai, K.; Chen, C.; Shi, X.; Wu, M.; Feng, W.; Xu, Q.; Liang, R.; Zhuo, G.; Li, Z. Dynamic Landslides Susceptibility Evaluation in Baihetan Dam area during extensive impoundment by integrating Static Geological Model and InSAR Observations. Int. J. Appl. Earth Obs. Geoinf. 2023, 116, 103157. [Google Scholar]
  22. Yang, C.S.; Dong, J.H.; Zhu, S.N.; Xiong, G.H. Detection, Identification, and Deformation Characteristics of Landslide Groups by InSAR in Batang Section of Jinsha River Convergence Zone, China. J. Earth Sci. Environ. 2021, 43, 398–408. [Google Scholar]
  23. Zhang, C.; Li, Z.; Yu, C.; Song, C.; Xiao, R.; Peng, J. Landslide Detection of the Jinsha River Region Using GACOS Assisted InSAR Stacking. Geosci. Inf. Sci. Wuhan Univ. 2021, 6, 1649–1655. [Google Scholar]
  24. Zhang, Z.; Feng, W.; Xu, X.; Samsonov, S. Performance of Common Scene Stacking Atmospheric Correction on Nonlinear InSAR Deformation Retrieval. Remote Sens. 2023, 15, 5399. [Google Scholar] [CrossRef]
  25. Chen, Y.; Dong, X.; Qi, Y.; Huang, P.; Sun, W.; Xu, W.; Tan, W.; Li, X.; Liu, X. Integration of D-InSAR-PS-Stacking and SBAS-PS-InSAR Methods to Monitor Mining-Related Surface Subsidence. Remote Sens. 2023, 15, 2691. [Google Scholar] [CrossRef]
  26. Zhang, L.; Dai, K.; Deng, J.; Ge, D.; Liang, R.; Li, W.; Xu, Q. Identifying potential landslides by stacking-InSAR in southwestern China and its performance comparison with SBAS-InSAR. Remote Sens. 2021, 13, 3662. [Google Scholar] [CrossRef]
  27. Wen, N.; Dai, K.; Deng, J.; Liu, C.; Liang, R.; Yu, B.; Feng, W. Periodic displacement accurate extraction of reservoir active slopes through InSAR observation and independent component analysis based wavelet transform. Int. J. Appl. Earth Obs. Geoinf. 2024, 130, 103919. [Google Scholar] [CrossRef]
  28. Dai, H.; Zhang, H.; Dai, H.; Wang, C.; Tang, W.; Zou, L.; Tang, Y. Landslide identification and gradation method based on statistical analysis and spatial cluster analysis. Remote Sens. 2022, 18, 4504. [Google Scholar] [CrossRef]
  29. Wang, L. Monitoring and Risk Assessment of Hazard Sources in Tailings Reservoirs Based on Multi-Source Data Coupling. Master’s Thesis, Chengdu University Technology, Chengdu, China, 2019. [Google Scholar]
  30. Yang, G.; Zhu, L.; Zhang, L. Application of Stacking-InSAR Technique in Surface Subsidence Monitoring of Mining Area. Mine Surv. 2021, 49, 98–102+119. [Google Scholar]
  31. Li, Q. Research on the Application of Time-Series InSAR Technology in Mining Subsidence Monitoring. Master’s Thesis, Xian University Science Technology, Xian, China, 2021. [Google Scholar]
  32. Chang, Z.; Liu, X.; Xue, T.; Yang, R. Investigating Ground Subsidence in Beijing by Using Interferogram Stacking InSAR. IEEE Int. Conf. Spat. Data Mining Geogr. Know. Serv. 2011, 3, 378–380. [Google Scholar]
  33. Zhang, Y. Research on InSAR Monitoring of Surface Subsidence in Peibei Mining Area. Master’s Thesis, China University Mining Technology, Beijing, China, 2016. [Google Scholar]
  34. Jin, B.; Zeng, T.; Wang, T.; Zhang, Z.; Gui, L.; Yin, K.; Zhao, B. Advanced risk assessment framework for land subsidence impacts on transmission towers in salt lake region. Environ. Model. Softw. 2024, 177, 106058. [Google Scholar] [CrossRef]
  35. Zeng, T.; Wu, L.; Hayakawa, Y.S.; Yin, K.; Gui, L.; Jin, B.; Guo, Z.; Peduto, D. Advanced integration of ensemble learning and MT-InSAR for enhanced slow-moving landslide susceptibility zoning. Eng. Geol. 2024, 331, 107436. [Google Scholar] [CrossRef]
  36. Yu, B.; Niu, T.; Zhao, J.; Ma, D.; Liu, G.; Wang, X.; Dai, K.; Gu, Y. Long-term Deformation Monitoring of Karamay Oilfield using SBAS-DInSAR. J. SW Petroleum Univ. 2022, 44, 23–34. [Google Scholar]
  37. Song, Z.; Tan, C.; Liu, S.; Wu, S.; Gao, X.; Tan, J.; Dai, C.; Luo, Z. Study on the Reserve Distribution and Extraction Degree of Non-homogeneous Conglomerate Reservoirs—A Case Study of Keshang Group Reservoirs in Karamay Oilfield. Xinjiang Pet. Geol. 2001, 22, 335–337. [Google Scholar] [CrossRef]
  38. Liu, H.; Li, X.; Gu, Y.; Zhang, Y. From ‘Oil-dominated’ to ‘Primary and Diversified’. Econ. Info. Daily 2023, 6. [Google Scholar]
  39. Li, X.; Li, W.; Gao, B.; Yang, D. Research on Karamay Oilfield Seven Central Carboniferous Reservoir Water Injection Development Characteristic. Xinjiang Oil Gas 2012, 8, 57–59. [Google Scholar]
  40. Zhang, J.; Tan, F.; Wang, X.; Qin, M.; Li, X. Mobilization Patterns of Crude Oil in Complex Pores under Different Displacement Modes: A Case Study of the Badaowang Formation Reservoir in Wellblock 530, Karamay Oilfield. J. Xian Petroleum Univ. 2022, 37, 58–65. [Google Scholar]
  41. Guo, R.; Yin, Q. Launching into Space! ‘Mianyang Constellation’ First Satellite ‘Fucheng-1’ is on Its Way. Mianyang Daily. 2024. Available online: https://www.thepaper.cn/newsDetail_forward_22684753 (accessed on 20 March 2024).
  42. Yu, H.; Li, B.; Xiao, Y.; Sun, J.; Chen, C.; Jin, G.; Liu, H. Surface Subsidence over a Coastal City Using SBAS-InSAR with Sentinel-1A Data: A Case of Nansha District, China. Remote Sens. 2023, 16, 1. [Google Scholar] [CrossRef]
  43. Wu, W.; Li, T.; Long, S.; Zhou, Z. Coregistration of Sentinel-1 TOPS Data for Interferometric Processing Using Real-Time Orbit. Geomat. Inf. Sci. Wuhan Univ. 2019, 44, 745–750. [Google Scholar]
  44. Yin, Y. Fucheng 1 Completed the Single-satellite Heavy Orbit Interferometry Test, and the Key Technical Indicators of the Satellite Have Reached the International Advanced Level. Changsha Evening News. 2024. Available online: https://hunan.voc.com.cn/article/202312/202312060920305798.html (accessed on 20 March 2024).
  45. Zhang, L.; Gao, P.; Gan, Z.; Wu, W.; Sun, Y.; Zhu, C.; Long, S.; Liu, M.; Peng, H. Surface Subsidence Monitoring of Mining Areas in Hunan Province Based on Sentinel-1A and DS-InSAR. Sensors 2023, 23, 19. [Google Scholar] [CrossRef]
  46. Farr, T.G.; Rosen, P.A.; Caro, E.; Crippen, R.; Duren, R.; Hensley, S.; Kobrick, M.; Paller, M.; Rodriguez, E.; Roth, L.; et al. The Shuttle Radar Topography Mission. Rev. Geophys. 2007, 45, RG2004. [Google Scholar] [CrossRef]
  47. Chen, B.; Deng, K.; Fan, H. Monitoring and Prediction of Mining Subsidence Based on D-InSAR Technology and SVR Algorithm. J. China Univ. Mining Tech. 2014, 43, 880–886. [Google Scholar]
  48. Deng, J.; Dai, K.; Liang, R.; Chen, L.; Wen, N.; Zheng, G.; Xu, H. Interferometric Synthetic Aperture Radar Applicability Analysis for Potential Landslide Identification in Steep Mountainous Areas with C/L Band Data. Remote Sens. 2023, 15, 4538. [Google Scholar] [CrossRef]
  49. Han, Y.; Li, T.; Dai, K.; Lu, Z.; Yuan, X.; Shi, X.; Liu, C.; Wen, N.; Zhang, X. Revealing the Land Subsidence Deceleration in Beijing (China) by Gaofen-3 Time Series Interferometry. Remote Sens. 2023, 15, 3665. [Google Scholar] [CrossRef]
  50. Ferretti, A. Satellite InSAR Data: Reservoir Monitoring from Space (EET 9). EAGE, 1 January 2014.
  51. Wang, Q.J.; Li, Z.W.; Du, Y.N.; Xie, R.A.; Zhang, X.Q.; Jiang, M.; Zhu, J.J. Generalized Functional Model of Maximum and Minimum Detectable Deformation Gradient for PALSAR Interferometry. Trans. Nonferrous Metals Soc. China 2014, 24, 824–832. [Google Scholar] [CrossRef]
  52. Dai, K.; Chen, Y.; Xu, Q.; Hancock, C.; Jiang, M.; Deng, J.; Zhuo, G. A Functional Model for Determining Maximum Detectable Deformation Gradients of InSAR Considering the Topography in Mountainous Areas. IEEE Trans. Geosci. Remote Sens. 2023, 61, 5211211. [Google Scholar] [CrossRef]
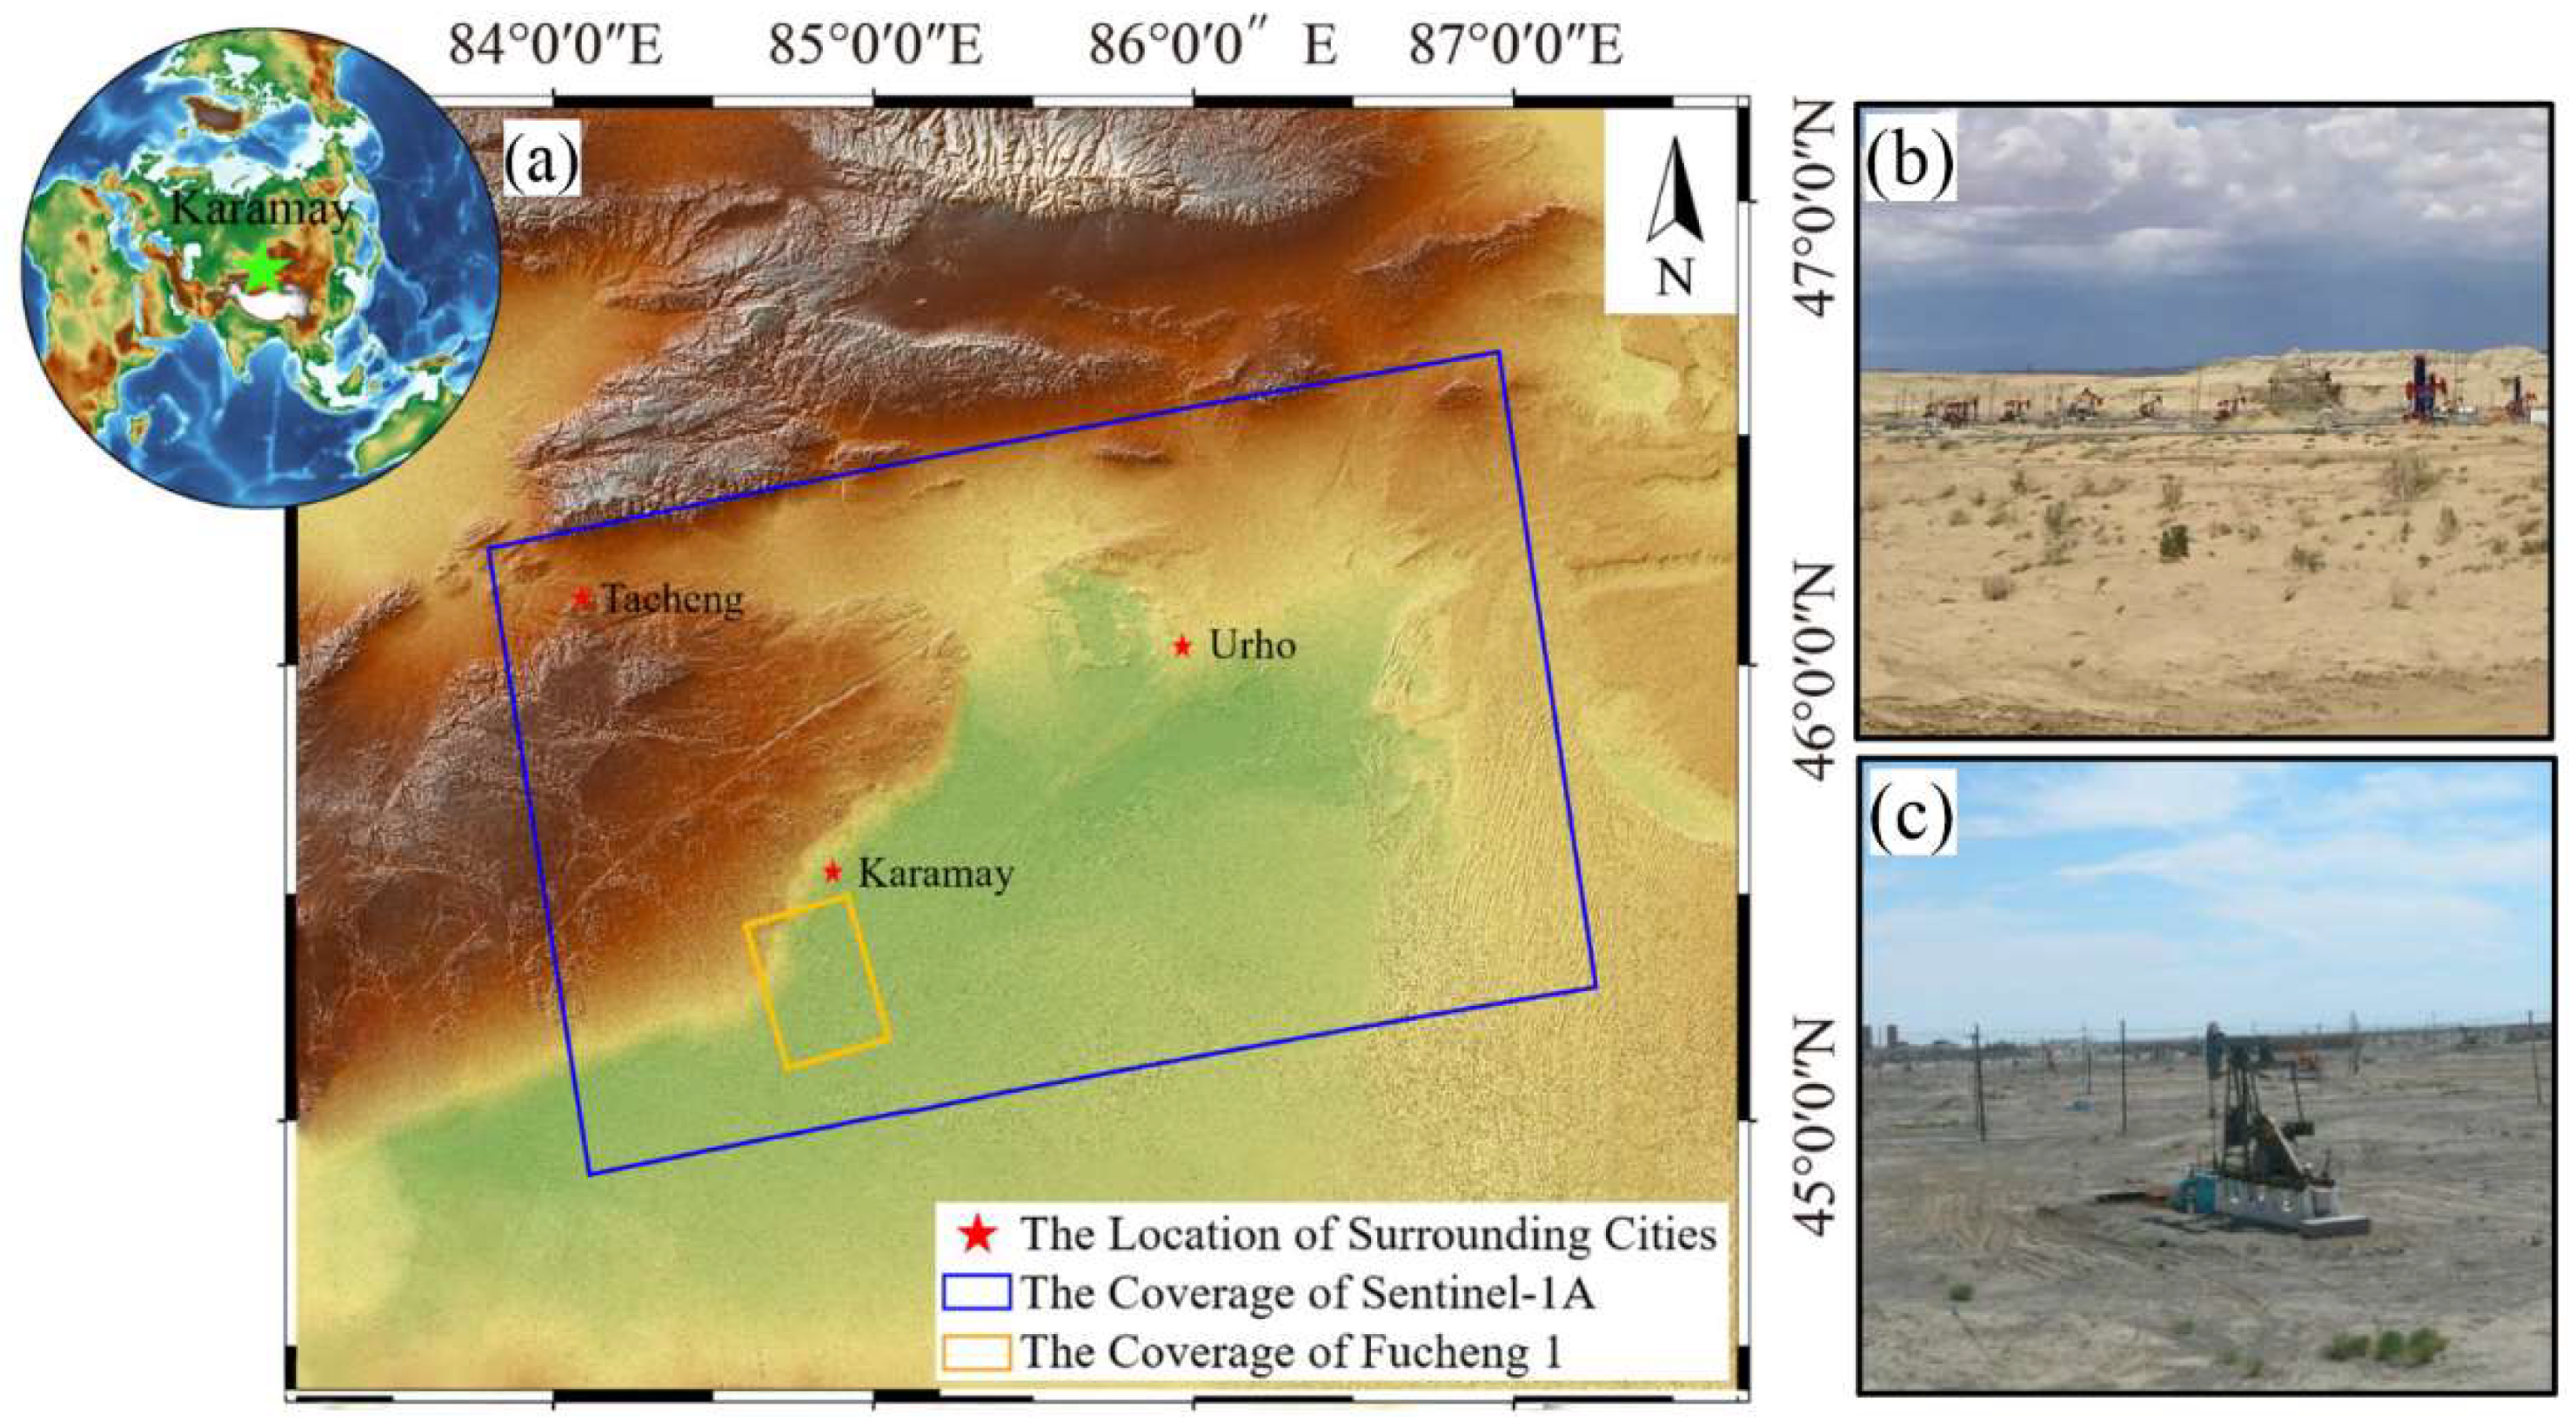
Figure 1. (a) Location of the Study Area; (b,c) Realistic Map of Mining Area.
Remotesensing 16 03457 g001
Figure 2. (a) Sentinel−1A Trajectory; (b) Fucheng 1 Trajectory.
Remotesensing 16 03457 g002
Figure 3. (a) Intensity Image of Fucheng 1 Acquisition; (b) Fucheng 1 Satellite.
Remotesensing 16 03457 g003
Figure 4. Technical Flow Chart.
Remotesensing 16 03457 g004
Figure 5. (a) Fucheng 1 Interference Pairs; (b,d,e) Detail of the Interference Effect at Each Settlement Point; (c,f,g) High−Resolution Optical Image.
Remotesensing 16 03457 g005
Figure 6. (a) Subsidence Rate of Fucheng 1; (bg) High−Resolution Optical Image of Areas a−g.
Remotesensing 16 03457 g006
Figure 7. (a,b) Intensity Images of Sentinel−1A and Fucheng 1; (c,d) Detail of Typical Feature in Intensity Map.
Remotesensing 16 03457 g007
Figure 8. (a,b,d,e) Four Sets of Interference Pairs of Fucheng 1 and Sentinel−1A; (c,f) Coherence Distribution of Two Satellites.
Remotesensing 16 03457 g008
Figure 9. (a,c,d,f) Fucheng 1 vs Sentinel−1A Coherence Chart; (b,e) Fucheng 1 and Sentinel−1A Coherence Line Graph.
Remotesensing 16 03457 g009
Figure 10. Perpendicular Baseline of Fucheng 1 and Sentinel−1A.
Remotesensing 16 03457 g010
Figure 11. (a) Deformation Velocity of Sentinel−1A; (be) Deformation Velocity of Fucheng 1 in Same Areas.
Remotesensing 16 03457 g011
Figure 12. Comparison of Deformation Areas and Deformation Rate Detected by the Two Satellites: (an) Deformation Areas; (ou) Deformation Rate.
Remotesensing 16 03457 g012
Figure 13. (a,b) MDDG Detail of Fucheng 1 and Sentinel−1A in Area a. (c) MDDG Distribution of Different SAR Satellites Under the Variations of Wavelength and Resolution.
Remotesensing 16 03457 g013
Table 1. Basic Information for Different Satellite Data.
Sentinel-1AFucheng 1
Satellite Mass Level2280 kg (Medium satellite)300 kg (Mini-satellite)
Satellite BandCC
Time Span20 September 2023–7 November 202319 September 2023–2 November 2023
Imaging ModeTOPSStripmap
Pixel Size in Azimuth13.94 m1.67 m
Pixel Size in Range9.32 m1.25 m
Swath Width250 km25 km
Spatial Baseline49~230 m8~30 m
Revisiting Period12 d11 d
Orbiting PrecisionBetter than 5 cmBetter than 10 cm
Orbit DirectionAscendingAscending
Number of Images55
Disclaimer/Publisher’s Note: The statements, opinions and data contained in all publications are solely those of the individual author(s) and contributor(s) and not of MDPI and/or the editor(s). MDPI and/or the editor(s) disclaim responsibility for any injury to people or property resulting from any ideas, methods, instructions or products referred to in the content.