Abstract
Temperature is a crucial indicator for studying climate, as well as the social and economic changes in a region. Temperature reanalysis products, such as ERA5-Land, have been widely used in studying temperature change. However, global-scale temperature reanalysis products have errors because they overlook the influence of multiple factors on temperature, and this issue is more obvious in smaller areas. During the cold months (January, February, March, November, and December) in the Yellow River Basin, ERA5-Land products exhibit significant errors compared to temperatures observed by meteorological stations, typically underestimating the temperature. This study proposes improving temperature reanalysis products using deep learning and multi-source remote sensing and geographic data fusion. Specifically, convolutional neural networks (CNN) and bidirectional long short-term memory networks (BiLSTM) capture the spatial and temporal relationships between temperature, DEM, land cover, and population density. A deep spatiotemporal model is established to enhance temperature reanalysis products, resulting in higher resolution and more accurate temperature data. A comparison with the measured temperatures at meteorological stations indicates that the accuracy of the improved ERA5-Land product has been significantly enhanced, with the mean absolute error (MAE) reduced by 28.7% and the root mean square error (RMSE) reduced by 25.8%. This method obtained a high-precision daily temperature dataset with a 0.05° resolution for cold months in the Yellow River Basin from 2015 to 2019. Based on this dataset, the annual trend of average temperature changes during the cold months in the Yellow River Basin was analyzed. This study provides a scientific basis for improving ERA5-Land temperature reanalysis products in the Yellow River Basin and offers theoretical support for climate change research in the region.
1. Introduction
Temperature, as an important indicator of atmospheric conditions, reflects the degree of thermal movement of molecules in the atmosphere and directly affects the research and prediction of climate, the distribution of surface ecosystems, the hydrological cycle, and the human society’s production and living activities. For example, a causal relationship exists between rising temperatures and violent conflicts and wars in human society [1,2]. Additionally, the acceleration of global warming and frequent extreme weather events pose serious challenges to ecosystems [3]. Therefore, quantitatively estimating temperature is of great significance for climate, geography, and ecosystems, as well as the humanities and economics. However, accurate temperature prediction remains a challenging and active research topic due to the complex nonlinear relationships between atmospheric movements and various geographical factors [4,5,6,7].
Temperature data from meteorological stations were collected using sensors placed in thermoscreens 1.5 to 2 m above the ground. However, due to the terrain and other factors, the distribution of meteorological stations is uneven, and their coverage is limited, complicating the monitoring and predicting of temperature changes. In China, meteorological stations are densely concentrated in the central and eastern regions but are sparse in the western and northwestern areas [8].
Atmospheric reanalysis data use numerical models to reanalyze historical meteorological observations and generate global and regional temperature data [9] with a consistent spatial and temporal resolution spanning decades or centuries. This approach addresses the uneven distribution of temperature observation stations and improves data quality, making it widely used in temperature change analysis. Current atmospheric reanalysis data products include the following: NCEP/NCAR Reanalysis [10] with a time scale covering 40 years, published by the National Centers for Environmental Prediction (NCEP) and the National Center for Atmospheric Research (NCAR); the atmospheric reanalysis product MERRA-2 [11] from 1980 to the present; ERA5 and ERA5-Land, two sets of atmospheric reanalysis products from 1940 and 1950 to the present, launched by the European Center for Medium-Range Weather Forecasts (ECMWF), which are currently the products with the widest range and highest accuracy [12]; and the atmospheric reanalysis product launched by the Japan Meteorological Agency (JMA) from 1958 to the present—JRA-55 [13]; and the CRA-40 atmospheric reanalysis product released by the China Meteorological Administration’s Data Service Center (CMDC), which provides three time scales [14], 6 h, daily, and monthly. While reanalysis data products address some limitations of meteorological observatories, they still exhibit certain errors compared to observed temperatures. For example, ERA5 temperature data for China have inaccuracies in extreme climate events and station data, including lower accuracy in large and high-altitude areas and in the winter and summer seasons [15].
With the advancement of research methods and the availability of multi-source data, more and more attempts have been made to obtain high-precision temperature products by integrating multi-source data and comprehensively considering the spatial correlation between factors such as temperature and terrain. These methods include using multi-source satellite or satellite–ground measurement data to reconstruct temperature, obtaining high temporal and spatial resolution datasets, and spatiotemporally continuous temperature models [16,17,18,19]. Quantitatively analyzing temperature and the spatial correlation of terrain is used to obtain high temporal and spatial resolution and high-precision temperature products suitable for complex terrain areas through downscaling processing [20,21,22]. In addition, land cover data have also become an important variable for studying temperature changes. Different land cover types have different influences on the reflection and absorption of thermal radiation. Temperature and land cover type have a close spatiotemporal relationship. For example, changes in the proportion of vegetation-covered land in cities will significantly affect urban temperature. By capturing this spatial relationship, it is possible to calibrate temperature products and establish corresponding temperature–land cover type spatiotemporal models [23,24]. Due to the advancement of computer technology and continuous research on neural networks, deep learning has demonstrated stronger learning and generalization capabilities than traditional regression analysis or spatial interpolation methods. For example, deep learning technology can process massive amounts of data with various types and complex features in image recognition and natural language processing, establish accurate models, and make accurate classifications and predictions [25,26]. In temperature prediction, deep learning can also be used to estimate the uncertainty of temperature predictions [27,28]. In deep learning, convolutional neural networks (CNN) have powerful feature extraction capabilities due to the special structure of convolution kernels, allowing CNN to accurately capture complex spatial relationships between multiple data sources. Temperature features can be extracted using the CNN to predict temperature and detect extreme weather [29]. With its special gating mechanism, the long short-term memory model (LSTM) addresses the problems of gradient explosion and gradient vanishing in recurrent neural networks (RNN), making it widely used for processing long-time series data. Bidirectional long short-term memory (BiLSTM) is an extension of LSTM that includes two independent LSTM layers and can capture bidirectional dependencies in data. LSTM and BiLSTM can be used to capture the time series characteristics of temperature data for more accurate temperature prediction [30,31,32,33], and CNN-LSTM neural networks can be used for temperature prediction [34].
Most existing studies on the relationship between temperature and other geographical elements consider only one factor, such as DEM or land cover. In contrast, this study comprehensively considers multiple factors, including DEM, population density, and land cover. We used deep learning neural networks to capture the complex spatiotemporal relationships and establish a corresponding model. Therefore, we propose a deep spatiotemporal model trained using multi-source fusion data to capture the spatial and time series characteristics between temperature and multiple geographical features. This approach corrects the ERA5-Land air temperature to obtain fused temperature data with higher accuracy and spatial resolution. Our research contents include the following: (1) combining convolutional neural networks (CNN) and bidirectional long short-term memory networks (BiLSTM) to propose a deep spatiotemporal model of fused temperature; (2) using the observed temperature at meteorological stations as a reference to test the accuracy of the model; (3) establishing a fused temperature dataset with higher spatial resolution and higher accuracy; (4) using this dataset to analyze temperature changes in the Yellow River Basin.
The results show that the deep spatiotemporal temperature model established in this study effectively improves the accuracy of the ERA5-Land temperature data, providing more accurate temperature data with higher spatial resolution. The results for the upper reaches of the Yellow River demonstrate that the model can still deliver high-precision temperature grid data in areas with fewer meteorological stations, addressing the issue of acquiring high-precision temperature datasets with continuous spatiotemporal distribution, despite insufficient meteorological stations. The improvements made to ERA5-Land in this study offer valuable guidance for future climate change research using this temperature reanalysis product. The model significantly aids in accurately analyzing temperature changes in the Yellow River Basin. However, the model’s accuracy still lags behind temperature-downscaling studies conducted in smaller regions, such as small mountain areas.
2. Study Area and Data Source
2.1. Study Area
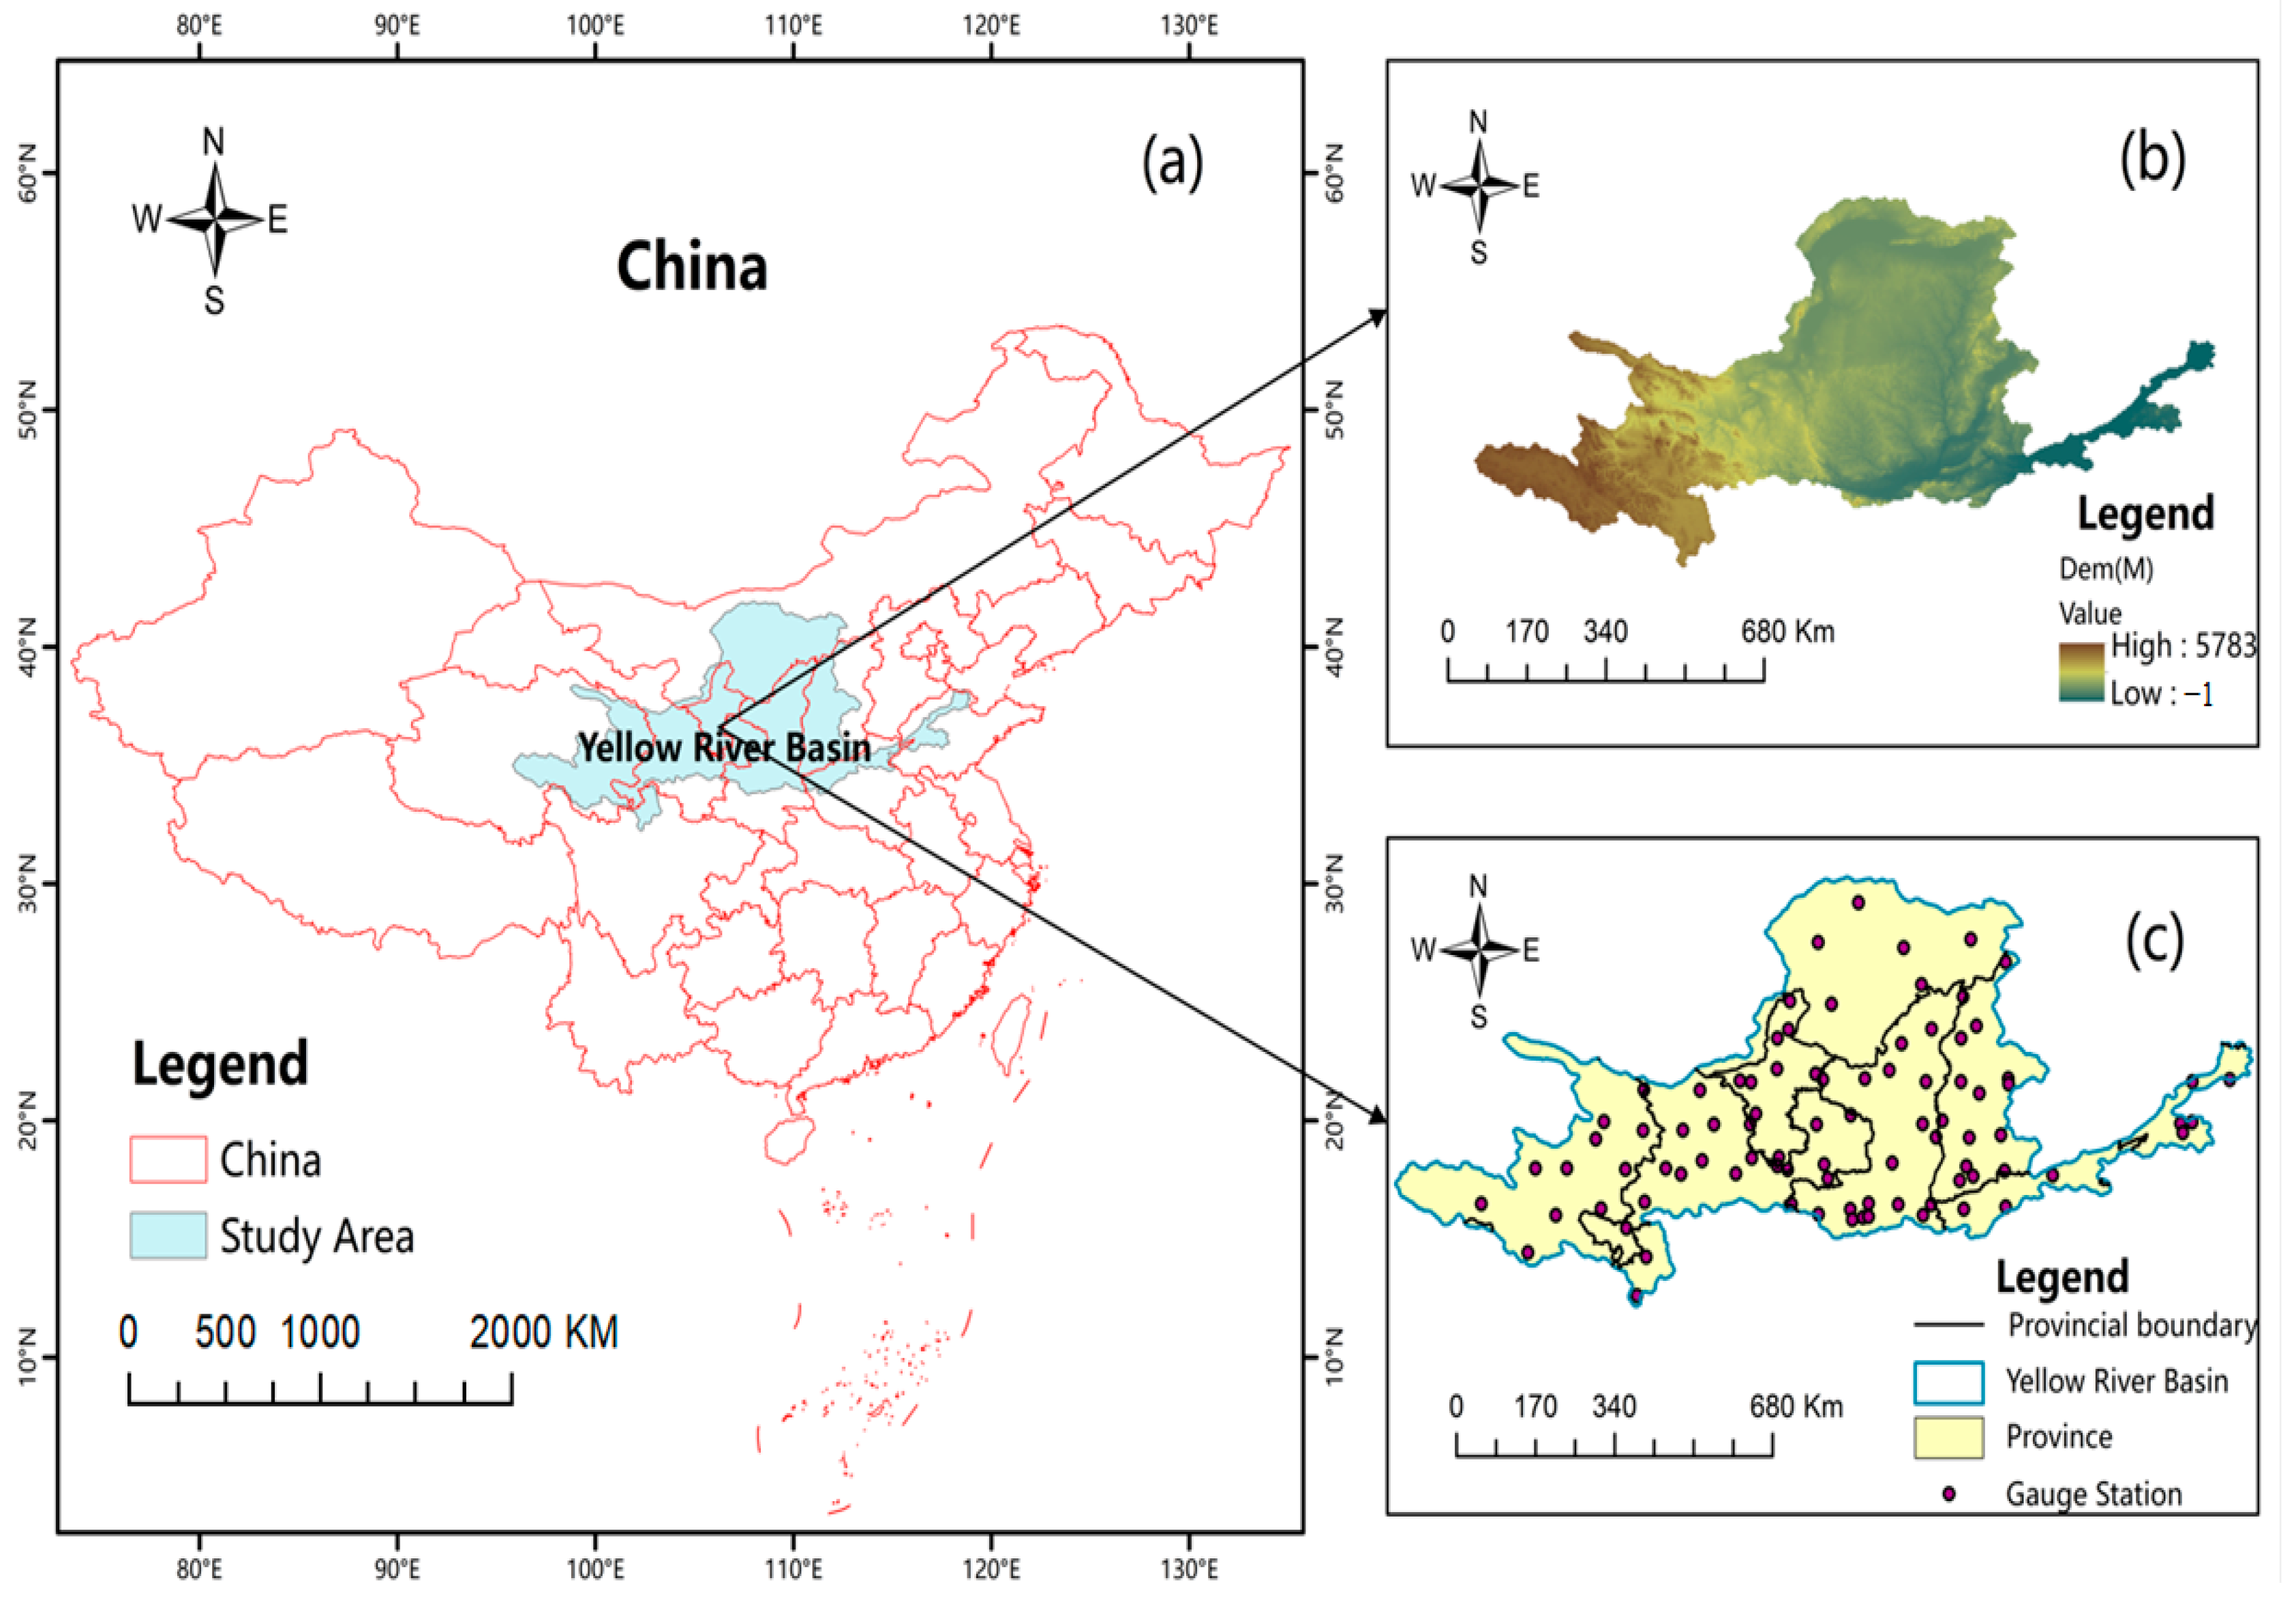
Situated between 96° and 119° east longitude and 32° and 42° north latitude, the Yellow River basin starts in the Bayan Har Mountains of Qinghai Province, China. It flows through the provinces of Qinghai, Sichuan, Gansu, Ningxia, Inner Mongolia, Shaanxi, Shanxi, Henan, and Shandong, discharging into the Bohai Sea at Dongying City in Shandong Province (see Figure 1). The terrain of the Yellow River Basin is complex and diverse, including mountain glaciers, loess landforms, and alluvial plains. Affected by terrain and climate, the population is unevenly distributed, with the majority located in the central and lower sections of the Yellow River. Land cover types include grassland, woodland, and dry land, etc. Influenced by complex atmospheric and monsoon circulation patterns, the climate in different basin regions varies significantly. The overall temperature in the Yellow River Basin exhibits an increasing trend, with the warming rate in the upper reaches being significantly higher than in other regions [35].
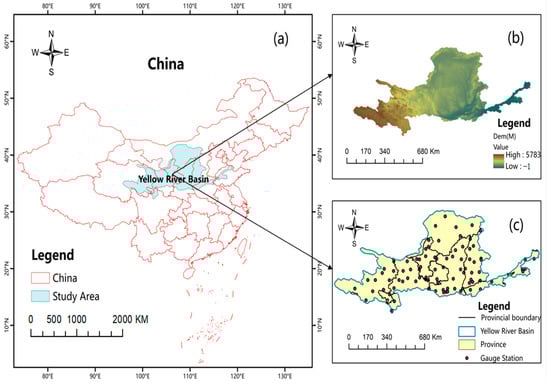
Figure 1.
(a) Geographical position of the Yellow River Basin; (b) DEM of the Yellow River Basin; (c) spatial distribution of meteorological stations in the Yellow River Basin.
2.2. Data Source
The data used in the research include ERA5-Land hourly data and Land cover classification gridded map, Land Scan Global population distribution data, SRTM 90M DEM, and the China daily surface climate data dataset (V3.0) (see Table 1).

Table 1.
Introduction to the dataset.
ERA5-Land is a fifth-generation atmospheric reanalysis product developed by ECMWF, covering global land from 1950 onward. Compared to ERA5, its resolution has increased from 0.25° to 0.1° [36]. ERA5-Land integrates various remote sensing and geographic information sources, with detailed preprocessing and corrections already applied. Thus, no further radiation correction or processing is required. The land cover classification map, launched by ECMWF in 2019, divides the land surface into 22 categories based on the UN FAO Land Cover Classification System (LCCS) [37]. ECMWF has verified the dataset’s accuracy using a confusion matrix, eliminating the need for further verification in this study.
The Shuttle Radar Topography Mission (SRTM) is a global digital elevation model (DEM) mission launched by NASA in 2000. It used a synthetic aperture radar on the Space Shuttle Endeavour to measure the Earth’s surface with a Single-Pass Interferometric Synthetic Aperture Radar (InSAR) system. The SRTM 90M DEM dataset is provided by the Geospatial Data Cloud Station of the Computer Network Information Center, Chinese Academy of Sciences (http://www.gscloud.cn, accessed on 23 April 2024).
To address the risks that large areas of the population face due to natural and man-made disasters, the Oak Ridge National Laboratory (ORNL) in the United States launched the Land Scan program in 1997. Land Scan Global population distribution data are based on remote sensing, geoinformation, and machine learning algorithms, covering the world, and the data are updated every year [38].
The temperature gauge station data come from the China daily surface climate dataset (V3.0) provided by the CMDC. After reducing errors and avoiding missing data, 87 meteorological stations within the Yellow River Basin were selected based on the time and space span of the study. Except for the slightly sparse measurement stations upstream of the Yellow River Basin, the overall distribution of the stations was evenly spread.
3. Research Method
This study extracts spatial relationships and time series features between multi-source fusion data based on deep learning and constructs a temperature spatiotemporal model. Figure 2 shows the research framework. It is mainly divided into the four following steps: (1) extract data within the research range and unify the spatial scale to 0.05°; (2) establish a sub-grid, extract and fuse the data within the sub-grid range; (3) establish the CNN-BILSTM deep learning model and train the model; (4) test the accuracy of the model, build a temperature spatiotemporal model that integrates multi-source data, and obtain the 2015–2019 cold month temperature dataset in the study area.
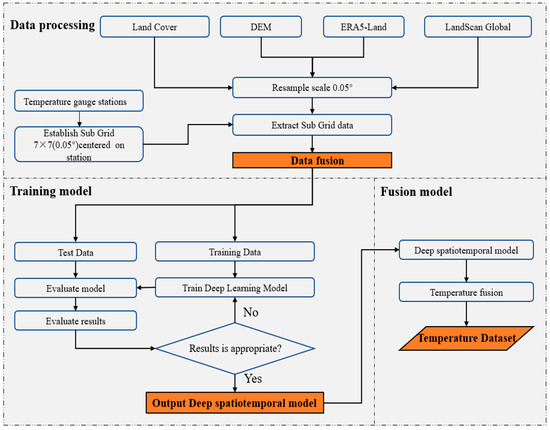
Figure 2.
Flowchart of multi-source data fusion temperature spatiotemporal model based on deep learning.
3.1. Data Processing
First, the stations within the study range in the daily climate dataset were extracted. To avoid errors caused by missing data, data errors, and other issues at some stations, 87 stations were selected after screening and extraction. These stations’ daily average temperature measurement data in the five cold months of January, February, March, November, and December are used as a label set.
The time frequency of the temperature data of ERA5-Land is hourly, and the unit is Kelvin. It is necessary to average the hourly temperature data to the weather temperature data and convert the Kelvin temperature into Celsius.
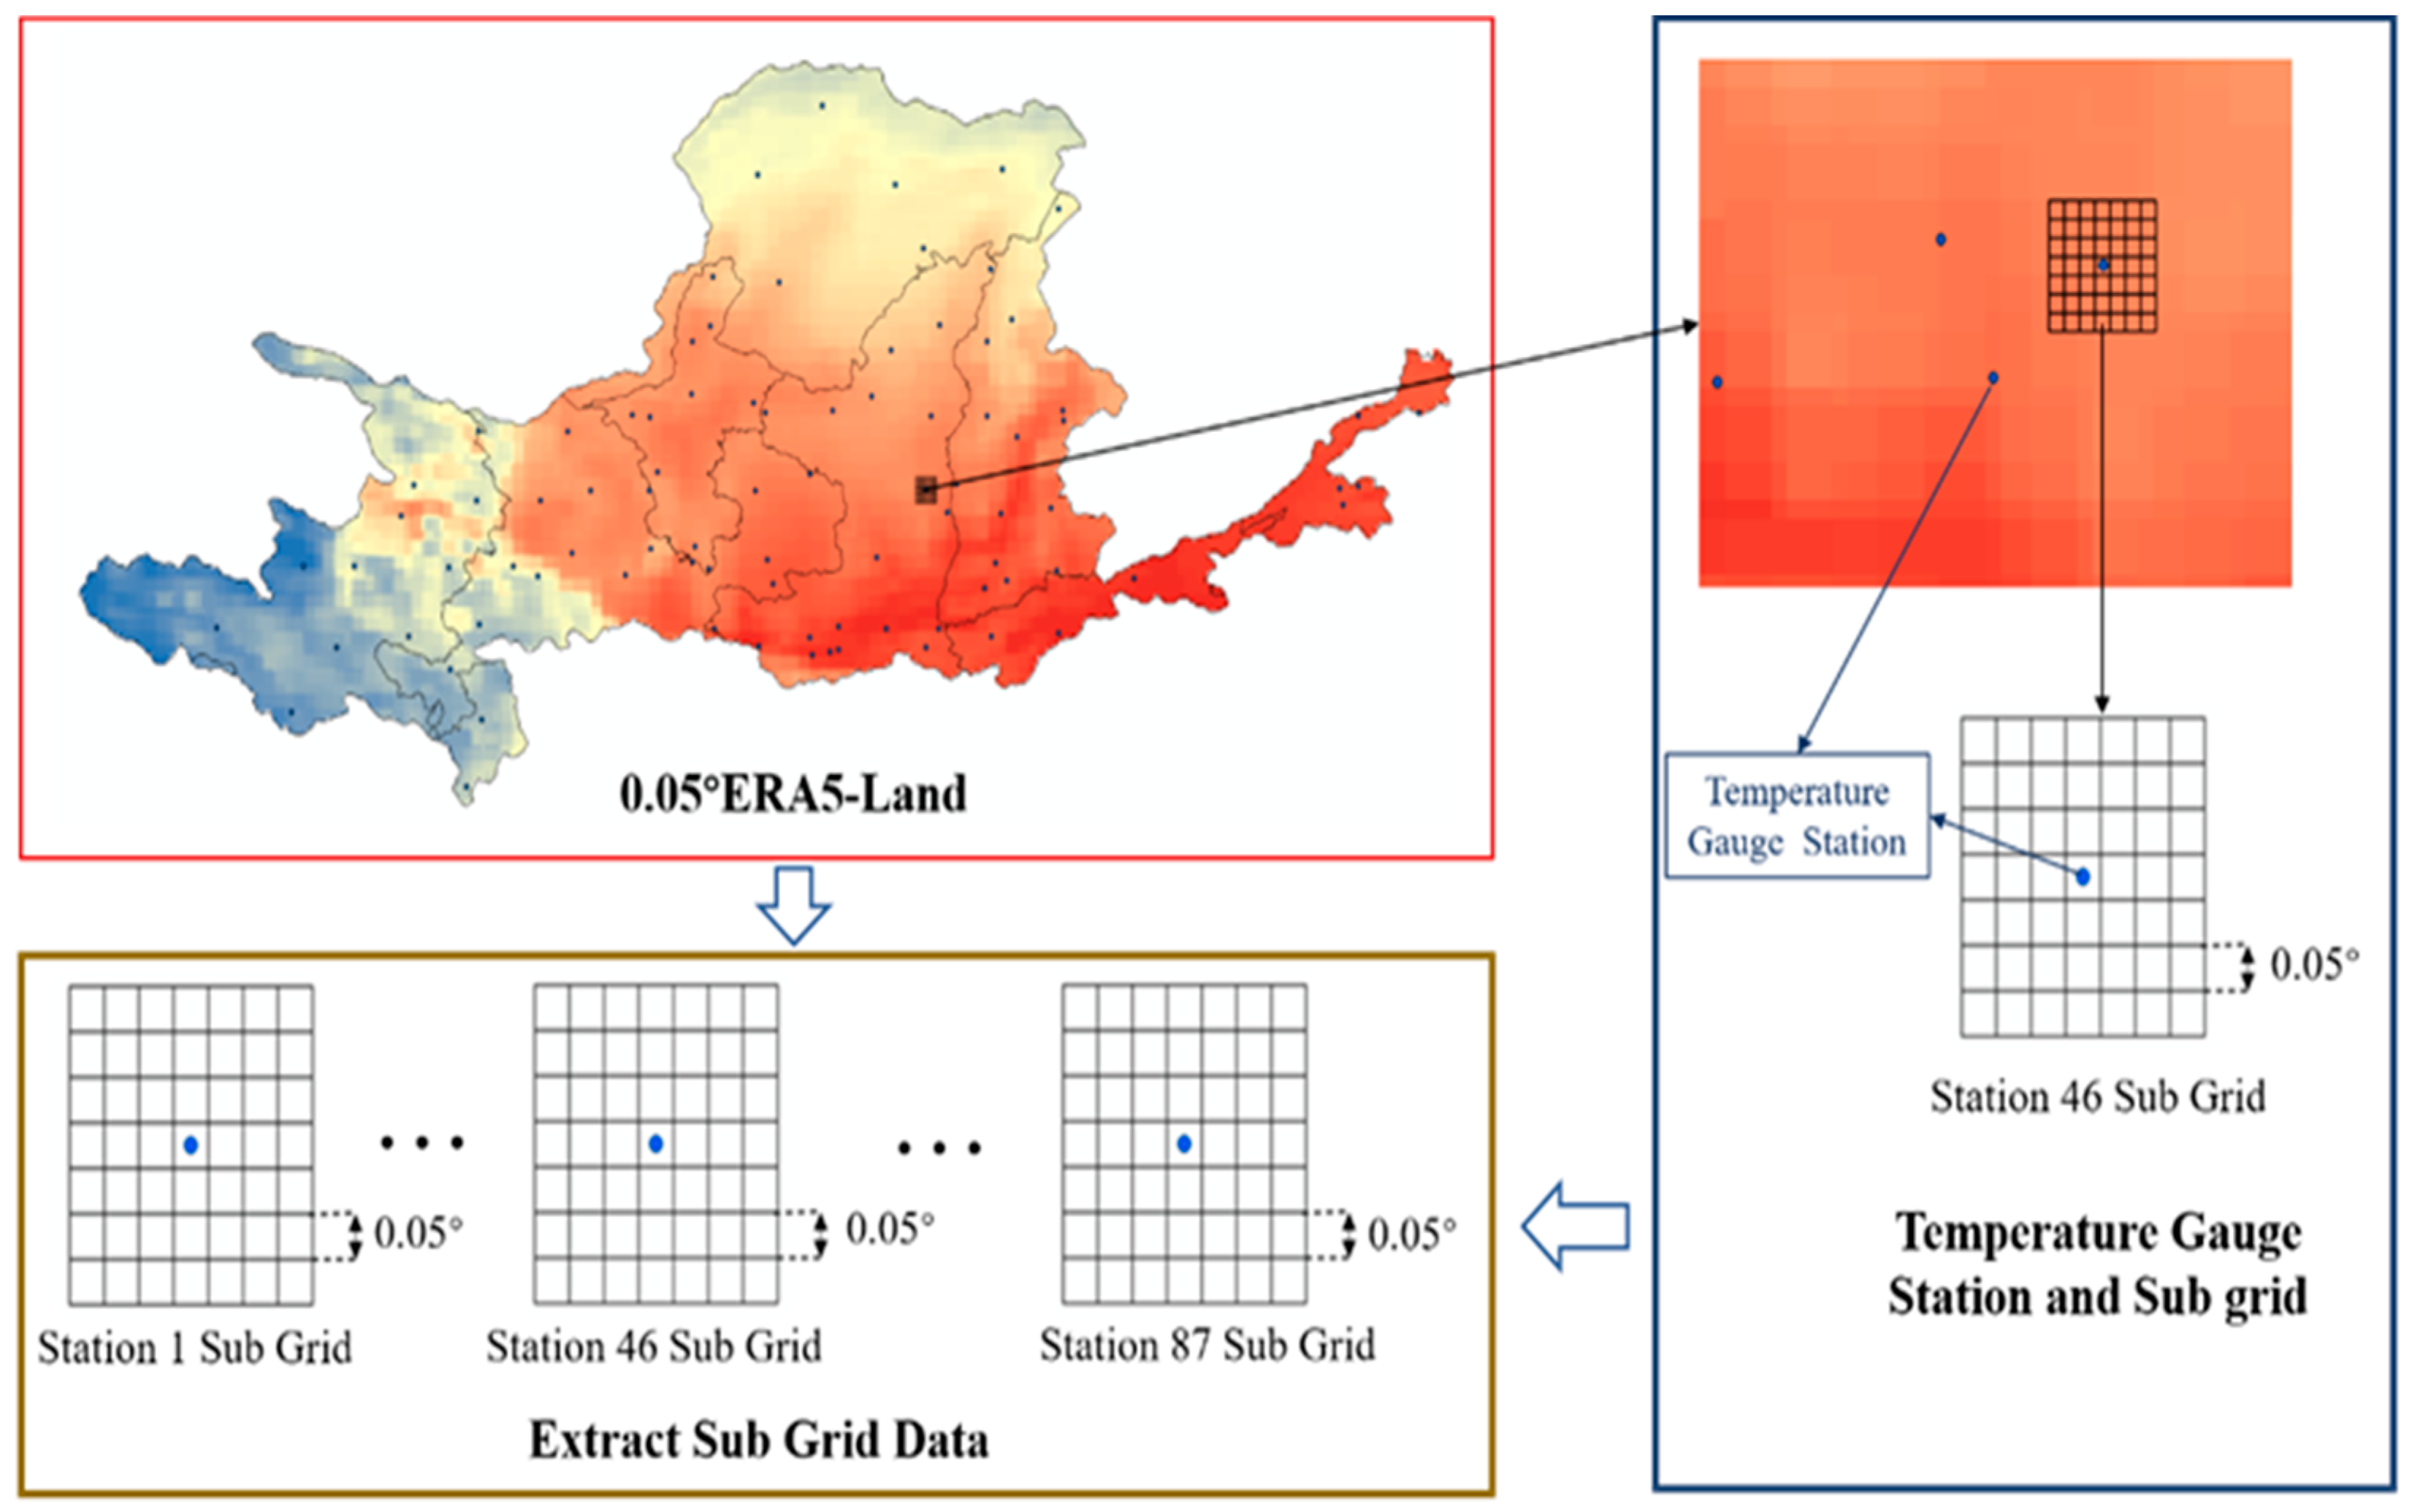
To obtain more detailed temperature data and eliminate errors caused by inconsistent spatial resolutions of multi-source data, nearest neighbor interpolation is used to resample the ERA5-Land data, Land cover data, and Land Scan Global data to 0.05°, and bilinear interpolation is used to resample the DEM data to 0.05°. Taking into account the actual measurement area of the meteorological station and the urban area of some representative cities (Lanzhou, Taiyuan, Zhengzhou, etc.) within the study area, a small grid was established with the meteorological station at the center, with the size of each small grid being 0.05° × 0.05°, forming a 7 × 7 sub-grid (see Figure 3).
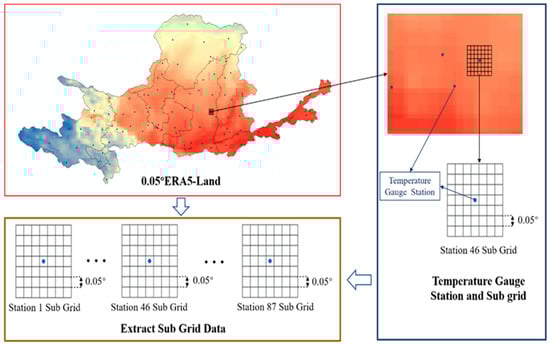
Figure 3.
Extracting sub-grid data (Take 0.05°ERA5-Land as an example).
Finally, the data within the sub-grid range are extracted, spatiotemporal matching of the grid data is performed, and year/month/day/-site-/DEM/population distribution/land cover data are established, with spatial resolution unified to 0.05° and time unified to daily. The fusion datasets serve as training and test data for deep learning neural networks.
3.2. Neural Network
Neural networks originate from the study of how neurons in the human brain transmit information. The simplest neural networks generally only include input and output layers, while a Multi-layer Perceptron (MLP) includes multiple links between the input and output layers [39]. Each layer is fully connected and includes weights, biases, and nonlinear activation functions, making MLP a powerful nonlinear processing system similar to the human brain.
Convolutional neural networks (CNN) are a variant of MLP with local link and weight-sharing features. Images can be directly used as an input to the neural network to extract corresponding features [40]. The temperature in each grid has a spatial relationship with various geographical elements around it. After fusing the temperature with various geographical elements, CNN can extract this spatial relationship through different receptive fields and multi-layer neural networks.
Recurrent neural networks (RNN) refer to a network processing sequence data. Sequence data can represent either time series data or a set of data, such as text sequences, where subsequent data are affected by previous data. Information can be passed within the RNN network, and parameters can be shared between different time steps. Each time step contains an input, output, and information saved by the processing sequence data. This information is updated at each time step and passed onto the next time step. When processing long sequence data, RNN can encounter problems with gradient disappearance and gradient explosion, making it difficult to capture long-range dependencies and train the model effectively. Long short-term memory networks (LSTM) address these issues by introducing a gating mechanism. LSTM uses input gates, forget gates, output gates, and cell states to avoid these problems [41]. The input gate determines what information will be updated in the cell state; the forget gate determines how much information from the previous cell state is discarded; the cell state transmits and stores information and is updated by the input and forget gates; and the output gate controls how much information the cell state outputs. Bidirectional long short-term memory (BiLSTM) is an extended architecture of the LSTM model. It uses bidirectional LSTM units to process forward and backward information at each time step. BiLSTM is generally more accurate in time series data than LSTM in predictions [42].
Commonly used software for building neural networks includes PyCharm 2024.2.1, MATLAB2024b, Visual Studio Code1.93, etc. This study uses PyCharm 2022.2.4. with the TensorFlow2.13.0 library to build the CNN-BiLSTM neural network model.
3.3. Deep Spatiotemporal Model
In multi-source data fusion, the spatial characteristics between temperature and geographical elements are merged into a multi-channel feature vector. This spatial dependence can be extracted through CNN, which provides a reference for correcting the ERA5-Land temperature data. The CNN neural network layer consists of multiple convolutional, maximum pooling, and flattening layers. The fused multi-source data are input into the CNN neural network to obtain feature vectors. These feature vectors are then input into BiLSTM. The BiLSTM model uses its front-end and back-end learning and gating mechanisms, along with the multi-layer fully connected layers, to obtain temperature time series characteristics and output the fused temperature predicted by the model.
The main steps of the spatiotemporal model fusion algorithm for multi-source data are the following: (1) Training the model. Using the CNN-BiLSTM model constructed with fused data, appropriate training methods and evaluation metrics are selected to obtain the optimal solution for the model. (2) Fusion temperature. The trained model is used to correct the temperature data of each grid point of ERA5-Land to obtain the integrated temperature for the entire study area.
The deep neural network model framework and internal structure are shown in Figure 4, reflecting the neural network training process for the input fusion data. Taking the first convolution layer of the CNN model’s internal structure as an example: Convolution2D represents two-dimensional convolution, eight represents the number of convolution kernels, 3 × 3 represents the size of the convolution kernel, and Elu is the activation function. Flatten expansion converts the feature vector into a one-dimensional vector. In the BiLSTM network architecture, BiLSTM (128) indicates that the number of neurons in the BiLSTM layer is 128. The Dense layer represents the fully connected layer, and L2 regularization is another method, different from Dropout, that prevents model overfitting.
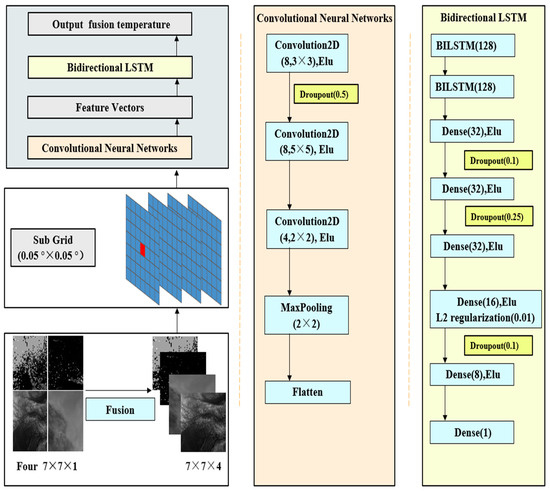
Figure 4.
Deep neural network model framework and internal structure.
3.4. Model Training
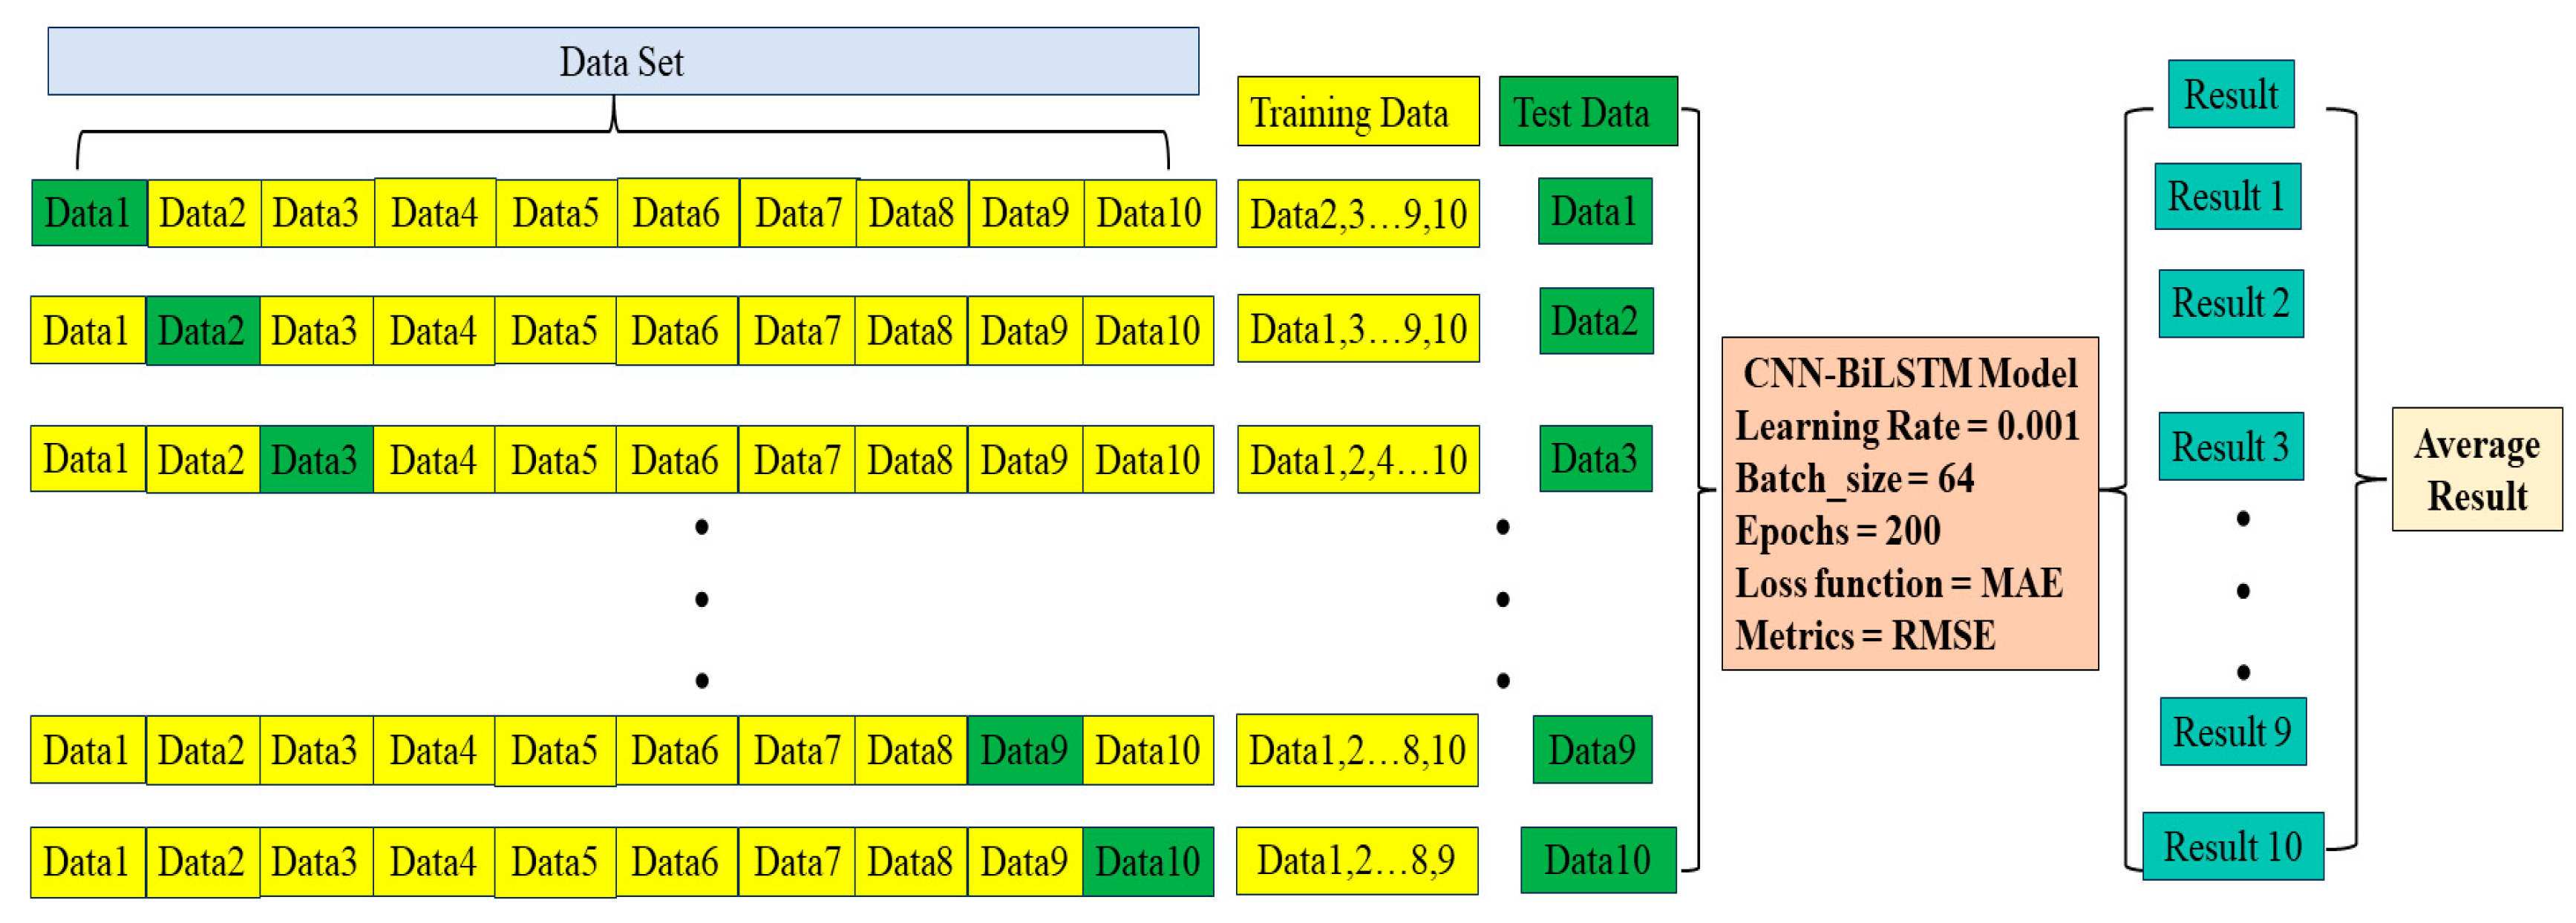
To quantitatively and comprehensively assess the accuracy of the deep spatiotemporal model, the data were split into a training set and a test set using a ten-fold cross-validation method. The average of the ten model training results was used to evaluate the model’s accuracy. The ten-fold cross-validation method divides the fused data into ten subsets. In each training process, nine subsets are used as training data, and the remaining subset is used as test data. The training and test sets are input into the model for training. This process is repeated ten times to ensure that each subset is used as a test set once, and the remaining nine subsets are used as training sets. This approach ensures that all features of the fused data are learned and helps avoid bias. The average of the results from these ten iterations is used to measure the final accuracy of the model.
For error analysis across the entire study area, the average error between the model’s predicted and actual temperature is used as the final evaluation metric. The mean absolute error (MAE) is selected as the loss function, and the mean square error (RMSE) is selected as the evaluation indicator for the model.
represents the number of samples; represents the model prediction value, represents the site measurement value.
The process of training the model using the ten-fold cross-validation method is shown in Figure 5. The model’s hyperparameters include a learning rate of 0.001, a batch size of 64, and 200 epochs. These hyperparameters were selected as the best choices after extensive experimentation.
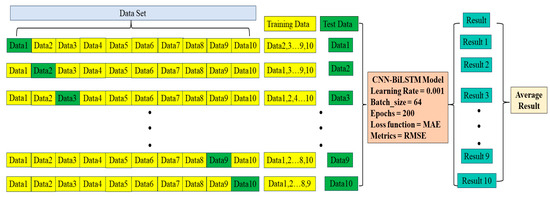
Figure 5.
The process of training the CNN-BiLSTM model using ten-fold cross-validation.
4. Results and Analysis
4.1. Temperature Deep Spatiotemporal Model Accuracy
The MAE and RMSE for each fold of the ten-fold cross-validation method and the comparison with ERA5-Land are shown in Figure 6 (drawn using Chiplot: https://www.chiplot.online/, accessed on 23 April 2024). By comparing the MAE and RMSE of each fold with those of ERA5-Land, it is evident that the CNN-BiLSTM model performs better than the ERA5-Land data in each fold, indicating good generalization ability. Furthermore, the MAE and RMSE do not fluctuate significantly across different folds, demonstrating that the CNN-BiLSTM model performs stably on all data subsets.
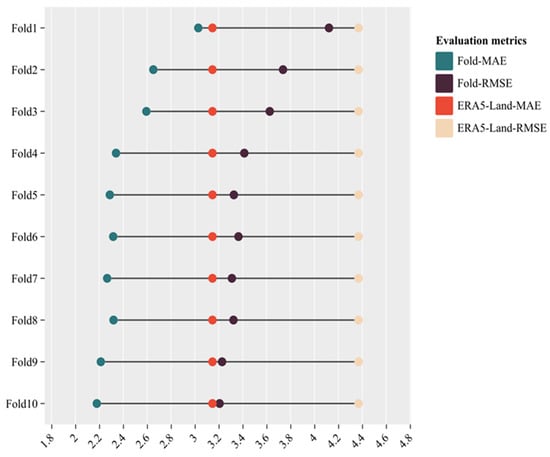
Figure 6.
Ten-fold cross-validation of each fold’s MAE, RMSE, and ERA5-Land-MAE, ERA5-Land-RMSE.
As the number of folds increases, the values of MAE, RMSE show an overall downward trend, indicating that the model gradually learns all the features of the fused data. The average of the ten results is taken as the final accuracy of the model and compared with the data accuracy of the ERA5-Land (See Table 2).
Table 2.
Average ten-fold cross-validation results for MAE, RMSE and ERA5-LandMAE, RMSE.
Compared with the 0.05° ERA5-Land data, the fused temperature predictions from the CNN-BiLSTM deep spatiotemporal model show significant improvement, with the MAE decreasing by 28.7% and the RMSE decreasing by 25.8%. The MAE and RMSE values for both ERA5-Land and the deep spatiotemporal model were interpolated to obtain the spatial distribution of temperature evaluation indicators in the study area (see Figure 7). Although both MAE and RMSE show significant reductions compared to the ERA5-Land data, the northern and northwestern regions of the study area, due to their complex terrain and sparse meteorological stations, still exhibit higher values. Nonetheless, the CNN-BiLSTM deep spatiotemporal model performs well in these challenging areas, demonstrating notable improvements in accuracy over the ERA5-Land data.
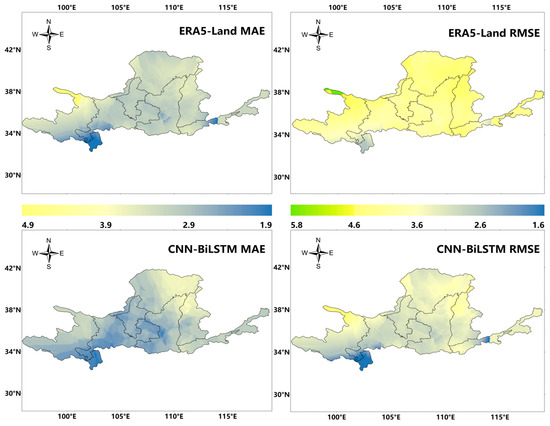
Figure 7.
ERA5-Land MAE; CNN-BiLSTM MAE; ERA5-Land RMSE; CNN-BiLSTM RMSE.
4.2. Temperature Deep Spatiotemporal Model Accuracy in Different Latitude
The solar radiation energy received by areas with different latitudes will differ, leading to corresponding changes in temperature. To quantitatively analyze the accuracy of the deep spatiotemporal model across different latitudes, the accuracy of the fused temperature dataset can be better evaluated by averaging the fused temperature data from meteorological stations within the same latitude. Figure 8 (created using Chiplot: https://www.chiplot.online/, accessed on 23 April 2024) displays the accuracy of the deep spatiotemporal model in different latitudes from 32°N to 41°N. The deep spatiotemporal model has shown promising results across different latitudes. The donut chart on the left displays the MAE and RMSE values of the model at different latitudes, with the model having the lowest MAE and RMSE at 32°N and the highest MAE and RMSE at 41°N. The donut chart on the right shows the percentage decrease in the MAE and RMSE of the model compared to the MAE and RMSE values of ERA5-Land. In the 32°N area, the MAE and RMSE values have reduced by 34.8% and 33.8%, respectively. In the 33°N area, they have reduced by 36.4% and 35.1%, respectively. However, in the higher latitude area of 41°N, the MAE and RMSE values only decrease by 23.5% and 22.9%, respectively, which might be due to the lower number of meteorological stations in this latitude area, which hinders the effective capture of the spatiotemporal temperature characteristics. Through accuracy analysis at different latitudes, it has been observed that the deep spatiotemporal model can enhance the accuracy of the ERA5-Land data across different latitudes.
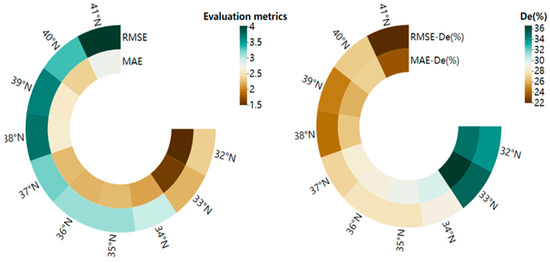
Figure 8.
(Left) CNN-BiLSTM MAE, RMSE; (Right) the percentage reduction in the MAE and RMSE of CNN-BiLSTM compared to the MAE and RMSE values of ERA5-Land; De (%): Decreased (%).
4.3. Temperature Spatial Distribution
Using multi-source fusion datasets and the CNN-BiLSTM deep spatiotemporal model, a daily temperature dataset of cold months in the Yellow River Basin with a spatial resolution of 0.05° from 2015 to 2019 was established.
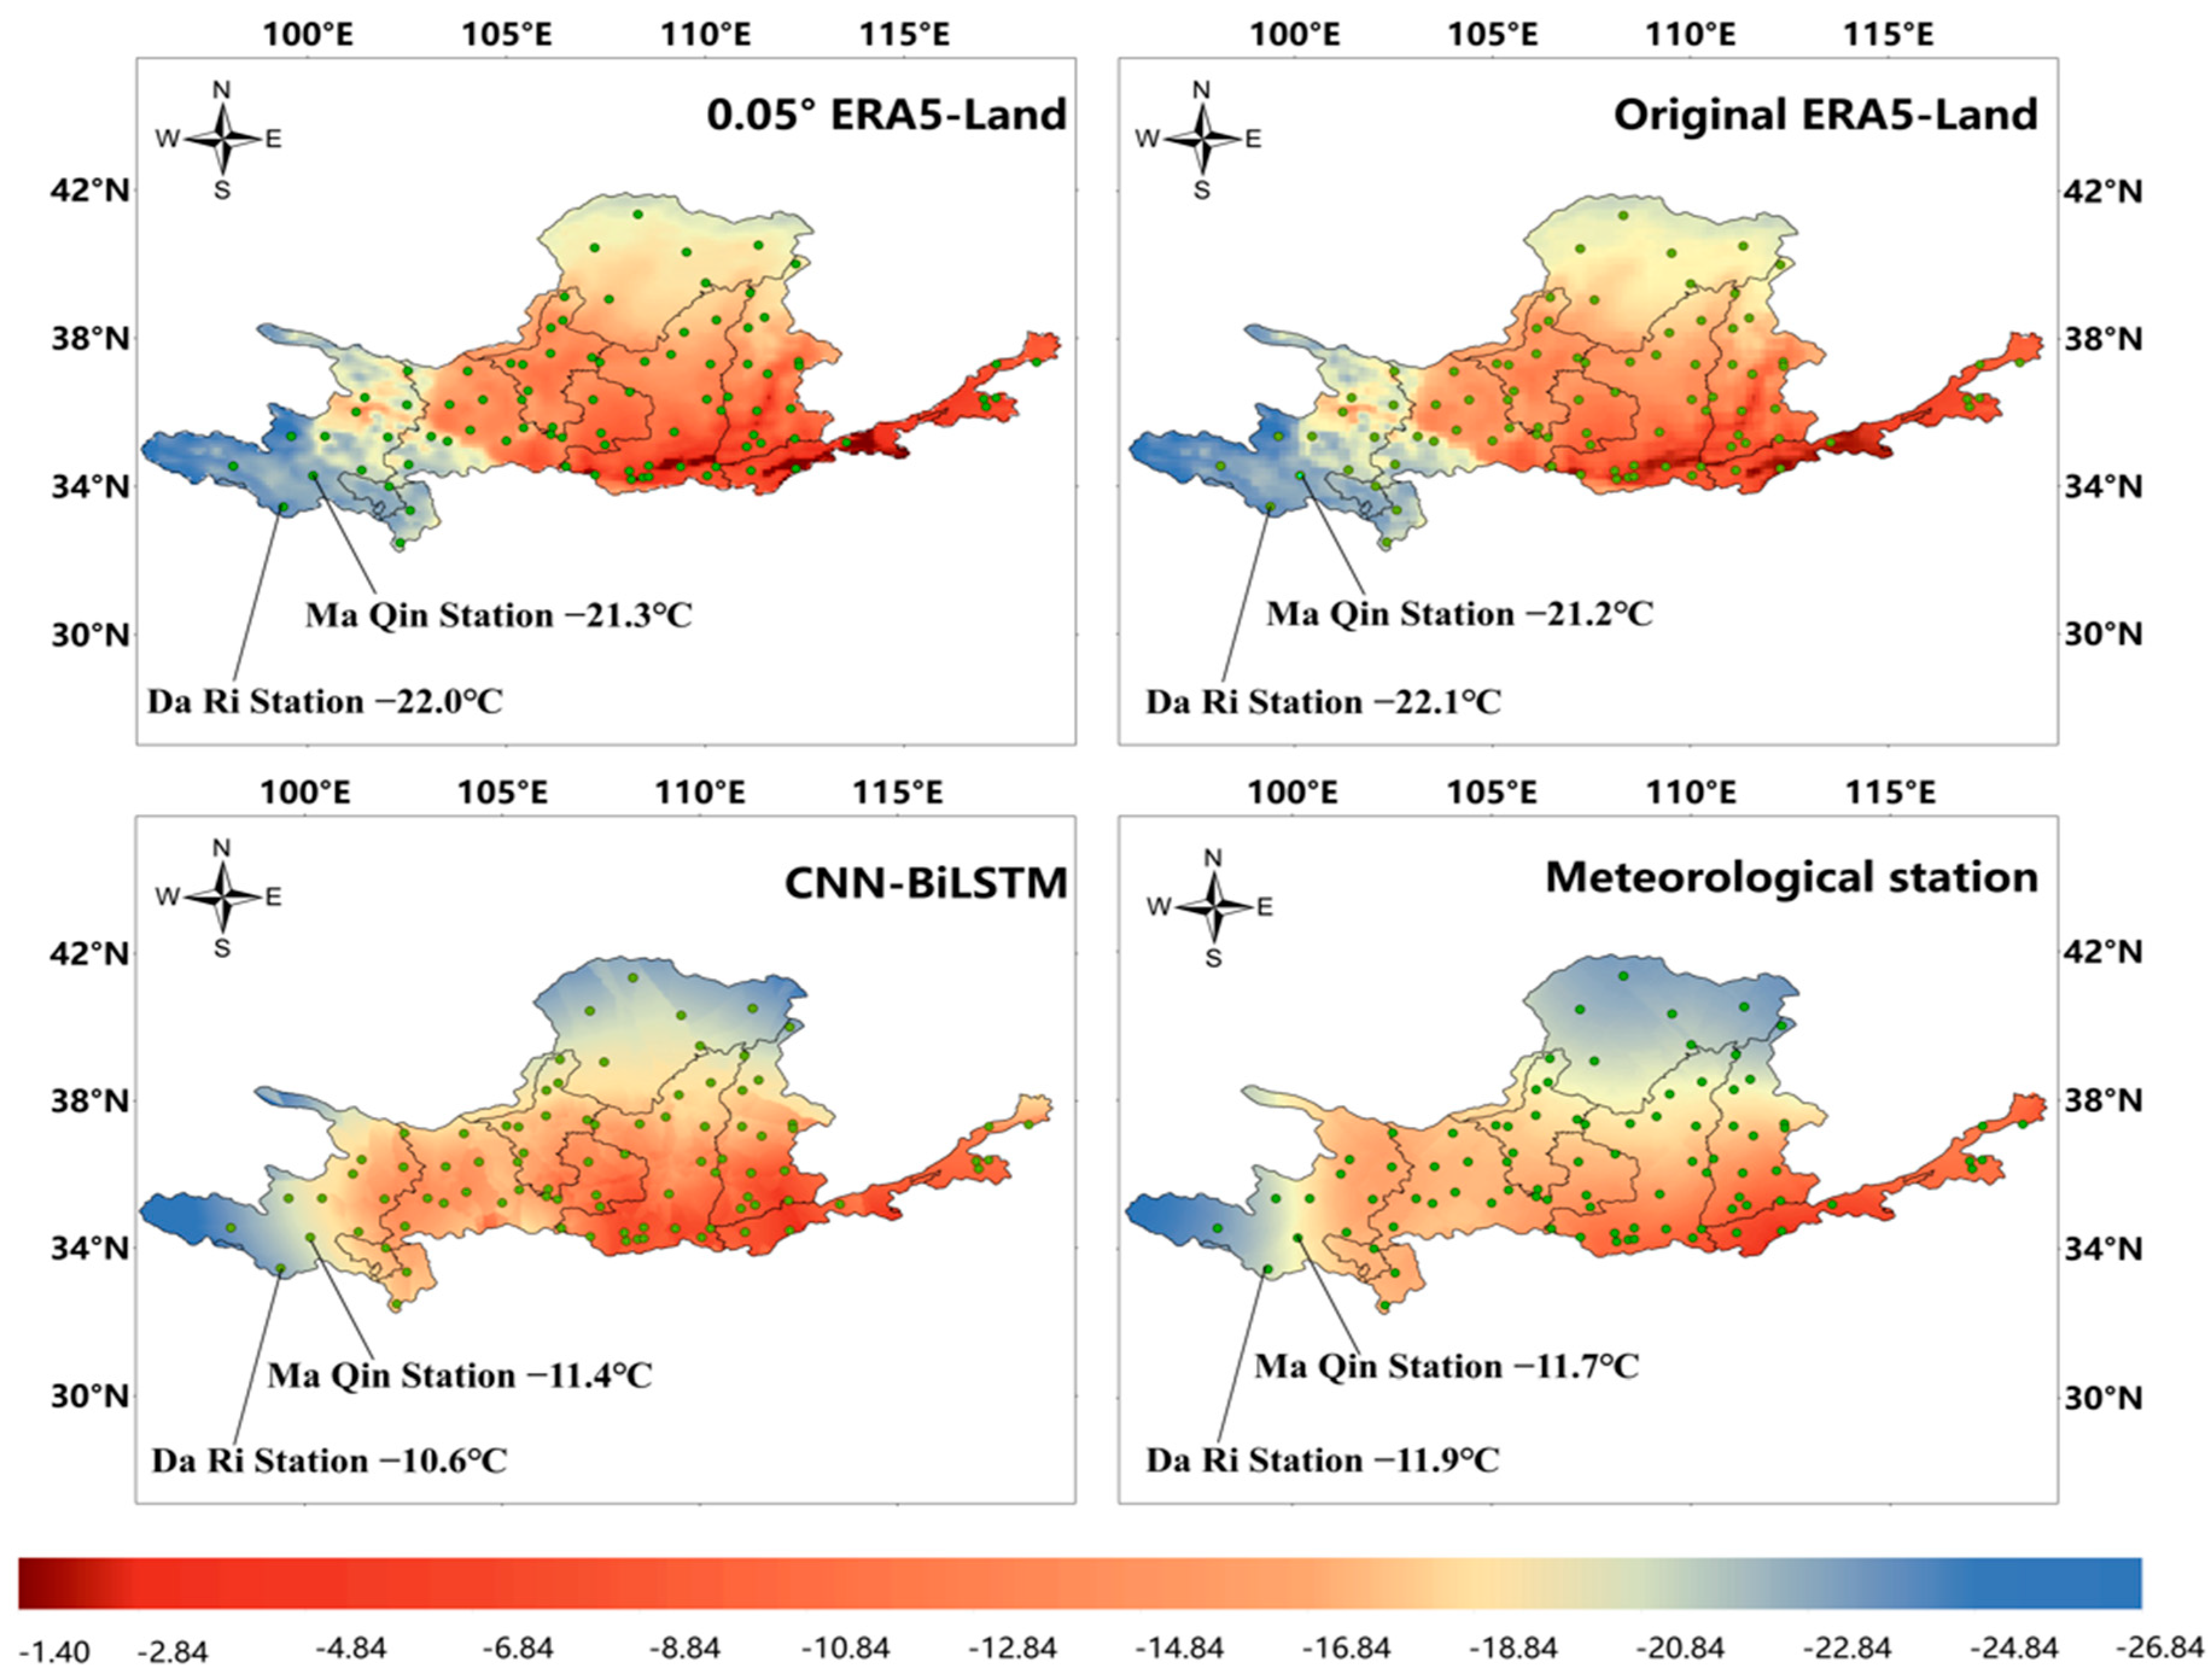
Figure 9 shows the 1 January 2019, a spatial distribution map of temperature generated by interpolating temperature from the 0.05° spatial resolution ERA5-Land temperature data, the original ERA5-Land temperature data, the CNN-BiLSTM deep spatiotemporal model, and meteorological station observations. Taking the Qinghai Da Ri meteorological observation station and the Qinghai Ma Qin meteorological observation station as examples, on 1 January 2019, the Da Ri Meteorological Station observed a temperature of −11.9 °C, and the Ma Qin Meteorological Observation Station observed a temperature of −11.7 °C. The CNN-BiLSTM deep spatiotemporal model predicted the temperatures at these two stations as −10.6 °C and −11.4 °C, which shows a small error compared to the observed temperatures. Meanwhile, the 0.05° ERA5-Land data for the same day at these two stations were −22.0 °C and −21.3 °C, and the original ERA5-Land for the same day at these two stations were −22.1 °C and −21.2 °C, significantly underestimating the temperature. It can be concluded that the deep spatiotemporal model proposed in this study better predicts temperature, whereas the ERA5-Land has lower accuracy in cold weather.
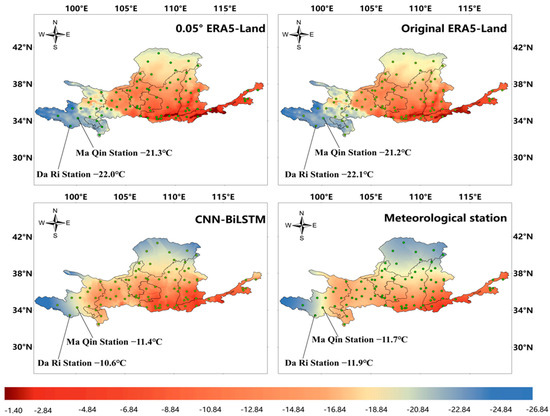
Figure 9.
Spatial distribution of temperature on 1 January 2019. The 0.05° ERA5-Land temperature; original ERA5-Land temperature; CNN-BiLSTM deep spatiotemporal model fusion temperature; meteorological station observation temperature.
In training the model, the spatiotemporal relationship between temperature and the sur-rounding geographical elements is comprehensively considered, reducing the error in comparison to the real temperature. It can be seen from Figure 9 that the spatial distribution of the deep spatiotemporal model’s fused temperature is generally consistent with the spatial distribution of temperature observed at meteorological stations. At the same time, the spatial distribution of the original ERA5-Land and the 0.05° spatial resolution ERA5-Land temperature is too low in the northern and northwest regions. In the western and northwestern regions, where meteorological station data are sparse, the temperature interpolation results from the CNN-BiLSTM model are also better than those from the 0.05° ERA5-Land and the original ERA5-Land data.
Thus, the CNN-BiLSTM deep spatiotemporal model can effectively improve the accuracy of temperature data in the study area.
4.4. Change Trend of Annual Cold Months Average Temperature in the Yellow River Basin
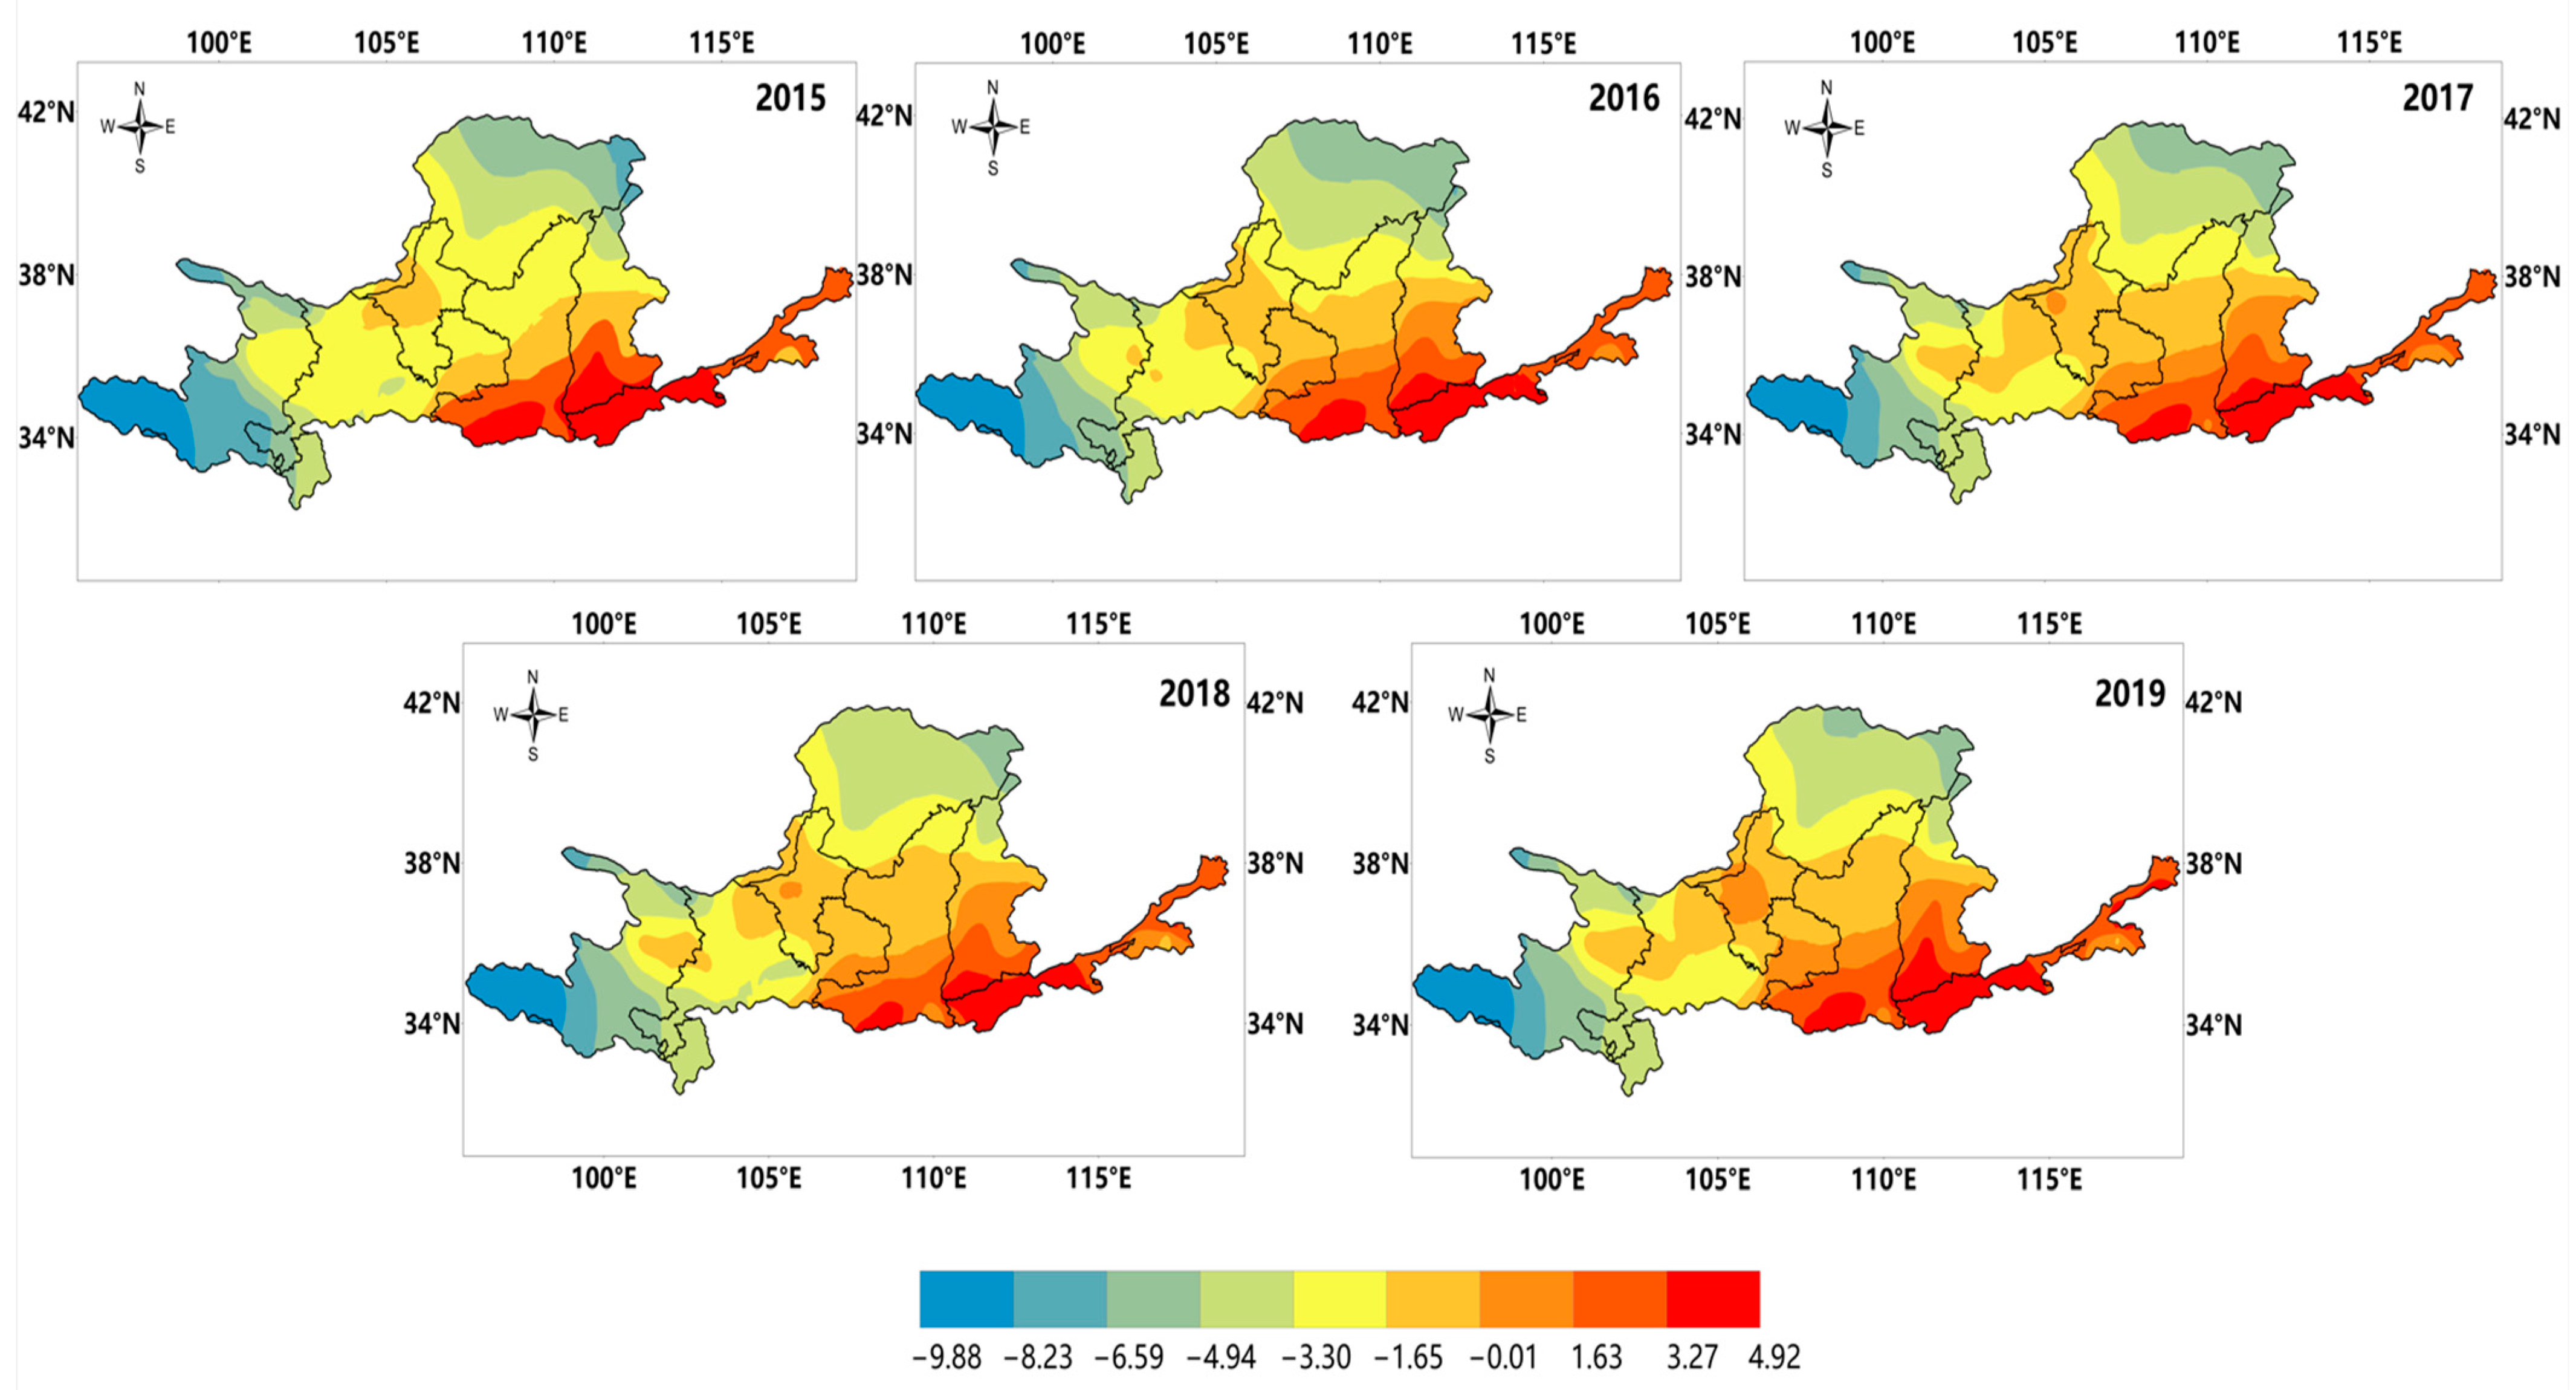
The 0.05° cold month daily temperature dataset established by the deep spatiotemporal model was used to analyze temperature changes in the Yellow River Basin. The interpolated cold month average temperatures from 2015 to 2019 are shown in Figure 10. The maximum temperature is 4.9 °C, and the minimum is −9.8 °C. An overall warming trend is observed from 2015 to 2019. This trend is most pronounced in the Gansu and Ningxia regions in the upstream and midstream areas of the Yellow River Basin, followed by the downstream regions, which is consistent with related research [43,44,45]. No significant temperature changes were identified in the westernmost and northwestern parts of the study area, which may be due to high altitude, complex terrain, few meteorological stations, and the alpine climate in these regions, which may not capture noticeable temperature changes over five years.

Figure 10.
Annual cold months average temperature in the Yellow River Basin from 2015 to 2019.
4.5. Compare with Existing Research Result
Compared with some current ERA5 and ERA5-Land small area temperature downscaling studies, the model accuracy in this study is still insufficient. The RMSE value in this study is 3.24. In the ERA5 temperature downscaling study conducted in Zhangjiakou, Hebei Province, China, the RMSE value was 2.0 [46]; in the ERA5-Land hourly temperature downscaling study conducted in the High Atlas Mountains of Morocco, the RMSE value was reduced to 1.61 [47].
Temperature changes have a more obvious impact on economic development, ecological protection, social stability, and natural disaster prevention in small areas. Therefore, compared with the large area of the Yellow River Basin, small areas such as small mountainous areas require higher accuracy of temperature spatiotemporal models. Expanding the deep spatiotemporal model from the Yellow River Basin to these small areas with higher-precision grid temperature data needs is also one of the prospects of this study.
5. Conclusions
This study combines ERA5-Land reanalysis data with multi-source data, such as DEM, population distribution, and land use types, through spatiotemporal matching combined with CNN and BiLSTM models and proposes a deep spatiotemporal model using multi-source data. The experimental results of this model show the following: (1) compared to ERA5-Land data, the mean absolute error (MAE) of this deep spatiotemporal model decreased by 0.92, improving accuracy by 28.7%; the root mean square error (RMSE) dropped by 1.13, improving accuracy by 25.8%; (2) this model can correct the ERA5-Land data in different latitude areas. Although the corrections are smaller in the northern and northwestern regions of the study area, significant accuracy improvements compared to ERA5-Land are still achieved; (3) the fusion temperature and the temperature observed by stations are more consistent in both spatial and temporal distribution. Using this model, a daily temperature dataset for the cold months in the Yellow River Basin from 2015 to 2019 was established with a spatial resolution of 0.05° and higher accuracy. (4) Based on the established dataset, the annual cold month average temperature trend in the Yellow River Basin from 2015 to 2019 was accurately analyzed. The results show that using this deep spatiotemporal model to correct reanalysis data provides more accurate predictions of temperature change trends. This study explores the feasibility of using multi-source remote sensing, geographical information fused with temperature data, and deep learning to establish a temperature spatiotemporal model, providing a tool to increase the precision of quantitative temperature evaluation and offering feasible ideas for temperature simulation, spatiotemporal change analysis, and disaster prevention. With further research on the spatial connection and time series characteristics of temperature and geographical factors, as well as wider application of multi-source data, the model introduced in this research can be employed in other environments or circumstances.
Due to the complex terrain and sparse population density in the high-latitude northwest of the Yellow River Basin, there are few climate stations in these areas, and the available data are insufficient to fully understand the complex spatial relationship between temperature and multi-source remote sensing data. This is why the MAE and RMSE values in these areas are higher than in other regions, and the improvements compared to the ERA5-Land data are less significant. Furthermore, due to the limited data on extreme temperature events and the poor performance of ERA5-Land data in such events, the model established in this study may not accurately analyze extreme weather events in the Yellow River Basin.
Author Contributions
Conceptualization, L.X. and J.D.; methodology, L.X. and J.D.; software, L.X. and J.R.; investigation, Q.H. and W.M.; writing—original draft preparation, L.X.; writing—review and editing, L.X., J.D. and J.H.; supervision, project administration, F.Q.; funding acquisition, J.H. All authors have read and agreed to the published version of the manuscript.
Funding
This research was supported by the High-Resolution Satellite Project of the State Administration of Science, Technology, and Industry for National Defense of the PRC (80Y50G19-9001-22/23); and the Major Research Projects of the Ministry of Education (16JJD770019); and the Henan Provincial Key R&D and Promotion Special Project (Science and Technology Research) (No. 242102321122); and the National Natural Science Foundation of China (U21A2014).
Data Availability Statement
The data presented in this study are available on request from the corresponding author. The data are not publicly available due to privacy.
Acknowledgments
We sincerely thank the European Center for Medium-Range Weather Forecasts (ECMWF), the China Meteorological Administration’s Data Service Center (CMDC), and the Oak Ridge National Laboratory, the Geospatial Data Cloud Station of the Computer Network Information Center, Chinese Academy of Sciences for their data support. We extend special thanks to Academician Jiayao Wang of the Chinese Academy of Engineering for his valuable feedback and financial support for this study.
Conflicts of Interest
The authors declare no conflicts of interest.
References
- Hsiang, S.M.; Burke, M.; Miguel, E. Quantifying the influence of climate on human conflict. Science 2013, 341, 1235367. [Google Scholar] [CrossRef] [PubMed]
- Regan, J.M.; Young, S.K. Climate change in the Horn of Africa: Causations for violent extremism. Behav. Sci. Terror. Political Aggress. 2024, 16, 185–211. [Google Scholar] [CrossRef]
- Muruganandam, M.; Rajamanickam, S.; Sivarethinamohan, S.; Reddy, M.K.; Velusamy, P.; Gomathi, R.; Ravindiran, G.; Gurugubelli, T.R.; Munisamy, S.K. Impact of climate change and anthropogenic activities on aquatic ecosystem—A review. Environ. Res. 2023, 238, 117233. [Google Scholar] [CrossRef]
- Zhao, L.; Li, T.; Przybysz, A.; Liu, H.; Zhang, B.; An, W.; Zhu, C. Effects of urban lakes and neighbouring green spaces on air temperature and humidity and seasonal variabilities. Sustain. Cities Soc. 2023, 91, 104438. [Google Scholar] [CrossRef]
- Peng, X.; Wu, W.; Zheng, Y.; Sun, J.; Hu, T.; Wang, P. Correlation analysis of land surface temperature and topographic elements in Hangzhou, China. Sci. Rep. 2020, 10, 10451. [Google Scholar] [CrossRef]
- Good, E.J.; Ghent, D.J.; Bulgin, C.E.; Remedios, J.J. A spatiotemporal analysis of the relationship between near-surface air temperature and satellite land surface temperatures using 17 years of data from the ATSR series. J. Geophys. Res. Atmos. 2017, 122, 9185–9210. [Google Scholar] [CrossRef]
- Tran, D.X.; Pla, F.; Latorre-Carmona, P.; Myint, S.W.; Caetano, M.; Kieu, H.V. Characterizing the relationship between land use land cover change and land surface temperature. ISPRS J. Photogramm. Remote Sens. 2017, 124, 119–132. [Google Scholar] [CrossRef]
- Liu, H.; Zhou, Q.; Zhang, S.; Deng, X. Estimation of Summer Air Temperature over China Using Himawari-8 AHI and Numerical Weather Prediction Data. Adv. Meteorol. 2019, 2019, 2385310. [Google Scholar] [CrossRef]
- Liu, Z.; Jiang, L.; Shi, C.; Zhang, T.; Zhou, Z.; Liao, J.; Yao, S.; Liu, J.; Wang, M.; Wang, H. CRA-40/atmosphere—The first-generation Chinese atmospheric reanalysis (1979–2018): System description and performance evaluation. J. Meteorol. Res. 2023, 37, 1–19. [Google Scholar] [CrossRef]
- Kalnay, E.; Kanamitsu, M.; Kistler, R.; Collins, W.; Deaven, D.; Gandin, L.; Iredell, M.; Saha, S.; White, G.; Woollen, J. The NCEP/NCAR 40-year reanalysis project. In Renewable Energy; Routledge: Abingdon, UK, 2018; pp. Vol1_146–Vol1_194. [Google Scholar]
- Gelaro, R.; McCarty, W.; Suárez, M.J.; Todling, R.; Molod, A.; Takacs, L.; Randles, C.A.; Darmenov, A.; Bosilovich, M.G.; Reichle, R. The modern-era retrospective analysis for research and applications, version 2 (MERRA-2). J. Clim. 2017, 30, 5419–5454. [Google Scholar] [CrossRef]
- Hersbach, H.; Bell, B.; Berrisford, P.; Hirahara, S.; Horányi, A.; Muñoz-Sabater, J.; Nicolas, J.; Peubey, C.; Radu, R.; Schepers, D. The ERA5 global reanalysis. Q. J. R. Meteorol. Soc. 2020, 146, 1999–2049. [Google Scholar] [CrossRef]
- Kobayashi, S.; Ota, Y.; Harada, Y.; Ebita, A.; Moriya, M.; Onoda, H.; Onogi, K.; Kamahori, H.; Kobayashi, C.; Endo, H. The JRA-55 reanalysis: General specifications and basic characteristics. J. Meteorol. Soc. Jpn. Ser. II 2015, 93, 5–48. [Google Scholar] [CrossRef]
- Liu, Z.; Shi, C.; Zhou, Z.; Jiang, L.; Liang, X.; Zhang, T.; Liao, J.; Liu, J.; Wang, M.; Yao, S. CMA global reanalysis (CRA-40): Status and plans. In Proceedings of the 5th International Conference on Reanalysis, Rome, Italy, 13–17 November 2017; pp. 13–17. [Google Scholar]
- Liu, T.; Zhu, X.; Guo, R.; Xu, K.; Zhang, S. Applicability of ERA5 reanalysis of precipitation data in China. Arid. Land Geogr. 2022, 45, 66–79. [Google Scholar] [CrossRef]
- Zhang, X.; Zhou, J.; Liang, S.; Wang, D. A practical reanalysis data and thermal infrared remote sensing data merging (RTM) method for reconstruction of a 1-km all-weather land surface temperature. Remote Sens. Environ. 2021, 260, 112437. [Google Scholar] [CrossRef]
- Ma, J.; Shen, H.; Wu, P.; Wu, J.; Gao, M.; Meng, C. Generating gapless land surface temperature with a high spatio-temporal resolution by fusing multi-source satellite-observed and model-simulated data. Remote Sens. Environ. 2022, 278, 113083. [Google Scholar] [CrossRef]
- Zhang, Z.; Du, Q. Hourly mapping of surface air temperature by blending geostationary datasets from the two-satellite system of GOES-R series. ISPRS J. Photogramm. Remote Sens. 2022, 183, 111–128. [Google Scholar] [CrossRef]
- Banzon, V.; Smith, T.M.; Chin, T.M.; Liu, C.; Hankins, W. A long-term record of blended satellite and in situ sea-surface temperature for climate monitoring, modeling and environmental studies. Earth Syst. Sci. Data 2016, 8, 165–176. [Google Scholar] [CrossRef]
- Pu, R. Assessing scaling effect in downscaling land surface temperature in a heterogenous urban environment. Int. J. Appl. Earth Obs. Geoinf. 2021, 96, 102256. [Google Scholar] [CrossRef]
- Liu, G.; Zhang, R.; Hang, R.; Ge, L.; Shi, C.; Liu, Q. Statistical downscaling of temperature distributions in southwest China by using terrain-guided attention network. IEEE J. Sel. Top. Appl. Earth Obs. Remote Sens. 2023, 16, 1678–1690. [Google Scholar] [CrossRef]
- Ding, L.; Zhou, J.; Zhang, X.; Liu, S.; Cao, R. Downscaling of surface air temperature over the Tibetan Plateau based on DEM. Int. J. Appl. Earth Obs. Geoinf. 2018, 73, 136–147. [Google Scholar] [CrossRef]
- Tsin, P.K.; Knudby, A.; Krayenhoff, E.S.; Brauer, M.; Henderson, S.B. Land use regression modeling of microscale urban air temperatures in greater Vancouver, Canada. Urban Clim. 2020, 32, 100636. [Google Scholar] [CrossRef]
- Shi, Y.; Katzschner, L.; Ng, E. Modelling the fine-scale spatiotemporal pattern of urban heat island effect using land use regression approach in a megacity. Sci. Total Environ. 2018, 618, 891–904. [Google Scholar] [CrossRef] [PubMed]
- Silver, D.; Schrittwieser, J.; Simonyan, K.; Antonoglou, I.; Huang, A.; Guez, A.; Hubert, T.; Baker, L.; Lai, M.; Bolton, A. Mastering the game of go without human knowledge. Nature 2017, 550, 354–359. [Google Scholar] [CrossRef] [PubMed]
- Willi, M.; Pitman, R.T.; Cardoso, A.W.; Locke, C.; Swanson, A.; Boyer, A.; Veldthuis, M.; Fortson, L. Identifying animal species in camera trap images using deep learning and citizen science. Methods Ecol. Evol. 2019, 10, 80–91. [Google Scholar] [CrossRef]
- Scher, S.; Messori, G. Predicting weather forecast uncertainty with machine learning. Q. J. R. Meteorol. Soc. 2018, 144, 2830–2841. [Google Scholar] [CrossRef]
- Malakouti, S.M. Utilizing time series data from 1961 to 2019 recorded around the world and machine learning to create a Global Temperature Change Prediction Model. Case Stud. Chem. Environ. Eng. 2023, 7, 100312. [Google Scholar] [CrossRef]
- Weyn, J.A.; Durran, D.R.; Caruana, R. Improving data-driven global weather prediction using deep convolutional neural networks on a cubed sphere. J. Adv. Model. Earth Syst. 2020, 12, e2020MS002109. [Google Scholar] [CrossRef]
- Karevan, Z.; Suykens, J.A. Transductive LSTM for time-series prediction: An application to weather forecasting. Neural Netw. 2020, 125, 1–9. [Google Scholar] [CrossRef]
- Salman, A.G.; Heryadi, Y.; Abdurahman, E.; Suparta, W. Single layer & multi-layer long short-term memory (LSTM) model with intermediate variables for weather forecasting. Procedia Comput. Sci. 2018, 135, 89–98. [Google Scholar] [CrossRef]
- Xiao, C.; Chen, N.; Hu, C.; Wang, K.; Gong, J.; Chen, Z. Short and mid-term sea surface temperature prediction using time-series satellite data and LSTM-AdaBoost combination approach. Remote Sens. Environ. 2019, 233, 111358. [Google Scholar] [CrossRef]
- Zrira, N.; Kamal-Idrissi, A.; Farssi, R.; Khan, H.A. Time series prediction of sea surface temperature based on BiLSTM model with attention mechanism. J. Sea Res. 2024, 198, 102472. [Google Scholar] [CrossRef]
- Elmaz, F.; Eyckerman, R.; Casteels, W.; Latré, S.; Hellinckx, P. CNN-LSTM architecture for predictive indoor temperature modeling. Build. Environ. 2021, 206, 108327. [Google Scholar] [CrossRef]
- Pang, G.; Wang, X.; Chen, D.; Yang, M.; Liu, L. Evaluation of a climate simulation over the Yellow River Basin based on a regional climate model (REMO) within the CORDEX. Atmos. Res. 2021, 254, 105522. [Google Scholar] [CrossRef]
- Muñoz-Sabater, J.; Dutra, E.; Agustí-Panareda, A.; Albergel, C.; Arduini, G.; Balsamo, G.; Boussetta, S.; Choulga, M.; Harrigan, S.; Hersbach, H. ERA5-Land: A state-of-the-art global reanalysis dataset for land applications. Earth Syst. Sci. Data 2021, 13, 4349–4383. [Google Scholar] [CrossRef]
- Store, C.C.D. Land cover classification gridded maps from 1992 to present derived from satellite observations. Copernic. Clim. Change Serv. 2019, 7–9. [Google Scholar] [CrossRef]
- Rose, A.; McKee, J.; Sims, K.; Bright, E.; Reith, A.; Urban, M. LandScan Global 2019; LandScan Global, Oak Ridge National Laboratory: Oak Ridge, TN, USA, 2020. [Google Scholar] [CrossRef]
- LeCun, Y.; Bengio, Y.; Hinton, G. Deep learning. Nature 2015, 521, 436–444. [Google Scholar] [CrossRef]
- LeCun, Y.; Bottou, L.; Bengio, Y.; Haffner, P. Gradient-based learning applied to document recognition. Proc. IEEE 1998, 86, 2278–2324. [Google Scholar] [CrossRef]
- Hochreiter, S.; Schmidhuber, J. Long short-term memory. Neural Comput. 1997, 9, 1735–1780. [Google Scholar] [CrossRef]
- Siami-Namini, S.; Tavakoli, N.; Namin, A.S. The Performance of LSTM and BiLSTM in Forecasting Time Series. In Proceedings of the 2019 IEEE International Conference on Big Data (Big Data), Los Angeles, CA, USA, 9–12 December 2019; pp. 3285–3292. [Google Scholar] [CrossRef]
- Wang, Y.; Tan, D.; Han, L.; Li, D. Review of climate change in the Yellow River Basin. J. Desert Res. 2021, 41, 235. [Google Scholar] [CrossRef]
- Huang, J.; Zhang, G.; Yu, H.; Wang, S.; Guan, X.; Ren, Y. Characteristics of climate change in the Yellow River basin during recent 40 years. J. Hydraul. Eng. 2020, 51, 1048–1058. [Google Scholar] [CrossRef]
- Zhu, X.; Ji, Z.; Wen, X.; Lee, S.Y.; Wei, Z.; Zheng, Z.; Dong, W. Historical and projected climate change over three major river basins in China from Fifth and Sixth Coupled Model Intercomparison Project models. Int. J. Climatol. 2021, 41, 6455–6473. [Google Scholar] [CrossRef]
- Yu, F.; Zhu, S.; Zhang, G.; Zhu, J.; Zhang, N.; Xu, Y. A downscaling method for land surface air temperature of ERA5 reanalysis dataset under complex terrain conditions in mountainous areas. J. Geo-Inf. Sci. 2022, 24, 750–765. [Google Scholar] [CrossRef]
- Sebbar, B.E.; Khabba, S.; Merlin, O.; Simonneaux, V.; Hachimi, C.E.; Kharrou, M.H.; Chehbouni, A. Machine-Learning-Based Downscaling of Hourly ERA5-Land Air Temperature over Mountainous Regions. Atmosphere 2023, 14, 610. [Google Scholar] [CrossRef]


Disclaimer/Publisher’s Note: The statements, opinions and data contained in all publications are solely those of the individual author(s) and contributor(s) and not of MDPI and/or the editor(s). MDPI and/or the editor(s) disclaim responsibility for any injury to people or property resulting from any ideas, methods, instructions or products referred to in the content. |
© 2024 by the authors. Licensee MDPI, Basel, Switzerland. This article is an open access article distributed under the terms and conditions of the Creative Commons Attribution (CC BY) license (https://creativecommons.org/licenses/by/4.0/).