Abstract
Robust and efficient multi-source image matching remains a challenging task due to nonlinear radiometric differences between image features. This paper proposes a pixel-level matching framework for multi-source images to overcome this issue. Firstly, a novel descriptor called channel features of phase congruency (CFPC) is first derived at each control point to create a pixelwise feature representation. The proposed CFPC is not only simple to construct but is also highly efficient and somewhat insensitive to noise and intensity changes. Then, a Fast Sequential Similarity Detection Algorithm (F-SSDA) is proposed to further improve the matching efficiency. Comparative experiments are conducted by matching different types of multi-source images (e.g., Visible–SAR; LiDAR–Visible; visible–infrared). The experimental results demonstrate that the proposed method can achieve pixel-level matching accuracy with high computational efficiency.
1. Introduction
With the widespread application of computer technology in geographic information science, image processing techniques have entered the era of multi-resolution [1], multi-source [2], and multi-spectral images [3]. Since the information contained in images is complementary, integrating the data collected by different sensors is necessary to improve the applicability of imagery for Earth observation. Image matching is the process of transforming a target image into the coordinate system of a reference image of the same scene by determining the pixel-based mapping relationship between them. Therefore, the performance of multi-source image matching is crucial for producing image mosaics [4] and for performing feature fusion [5] and change detection [6]. Especially, we can establish correspondence between multiple sensor images of drones, solving the limitation of sensing systems in scene understanding.
After decades of development, automatic image matching has made remarkable progress, and many methods now enable the direct georeferencing of multi-source data using navigation devices on platforms and physical sensor models. These techniques can achieve a matching accuracy of fewer than five pixels [7] and nearly eliminate all the geometric distortion caused by different scales and rotation angles between multi-source images.
In general, area-based methods extract matching information by finding the pixels in the target image that are most similar to the template image, such as mutual information (MI) [8] and Phase Correlation (PC) [9]. Area -based image matching methods obtain region description by calculating the response intensity between the region of interest and surrounding pixels. This type of method is generally applicable to the registration of images with prominent texture features. However, these matching methods usually experience heavy computational complexity and are easily affected by nonlinear radiometric differences in multi-source images [10]. The best-buddies similarity (BBS) theoretically analyzed the effect of cluttered backgrounds, and a patch-based texture was introduced to enhance robustness and accuracy. The caching scheme was optimized and a batch gradient descent algorithm was used to reduce the computational overhead and further speed up the method [11]. Feature-based methods construct an underlying spatial transformation and establish reliable correspondence between two sets of feature points. Considering the complexity of feature presentation, particularly for the radiation difference between multi-source images, it is simple to produce inaccurate or even incorrect matching. Although many excellent algorithms have recently been proposed in this field, it is still challenging to achieve robust and efficient image matching performance. Therefore, if the response intensity characteristics and texture feature can be fully utilized, the influence of complex environment and radiation difference can be effectively solved in multi-source image matching.
Therefore, the main challenge of multi-source image matching is the handling of radiometric differences between the target and reference images. Pixel-level matching has not been achieved to date for multi-source images due to significant radiometric differences. The first row in Figure 1 shows multi-source images with significant radiometric differences between objects, which make it more challenging to detect the same features in both images. However, despite these significant differences, the main structural features are similar. In the second row of Figure 1, although the reflectance values show substantial differences, the structural features extracted using phase congruency are almost the same, which can provide intrinsic structural information and invariant features for transformation estimation. However, the classical phase congruency method only provides the amplitude characteristics, and extending it to a directional representation in the presence of noise is not sufficient [11].
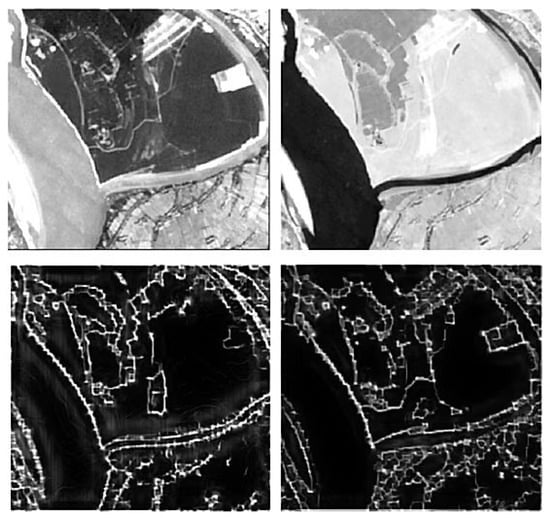
Figure 1.
Structural feature extraction for multi-source images.
Phase congruency is an indicator of feature significance, and it has been demonstrated that the phase congruency model conforms to the characteristics of human visual cognition [12], i.e., the model considers structural features. However, it was found that the response intensity of phase congruency is unstable, especially when dealing with multi-source images.
In this paper, a mixture model that combines the features of oriented gradient and response intensity of phase congruency to achieve robust feature description in multi-source image matching. The proposed descriptor, called channel features of phase congruency, enables efficient image matching by extending the classical phase congruency model and creating a pixel-level feature representation of local features. The CFPC descriptor captures the structural properties of an image and remains unaffected by radiometric variations across multiple sources. To reduce computational costs, the feature representation of descriptors is first converted into the frequency domain, followed by similarity measurement. As a result, the corresponding features can be readily detected in multi-source images. The primary contributions of this study are summarized follows:
- (1)
- An efficient and robust image matching framework is proposed based on phase congruency to achieve pixel-level matching. The proposed framework integrates different types of local features for similarity measurement.
- (2)
- A novel feature descriptor (CFPC) is constructed based on the oriented gradient and response intensity of phase congruency to capture structure information.
- (3)
- The proposed matching method uses pixel-level feature representation to evaluate the similarity between multi-source images, and also, a similarity measurement method (F-SSDA) is established to accelerate image matching. Therefore, the intrinsic geometry information is incorporated into the objective function formulation when computing similarity measurements between multi-source images to improve matching performance.
The remaining sections of this paper are structured as follows: Section 2 reviews related work, while Section 3 details the proposed multi-source image matching method, and Section 4 describes the comparative experiments and results. Finally, conclusions are drawn and recommendations are provided in Section 5.
2. Related Work
2.1. Area-Based Methods
Area-based methods perform similarity matching by searching for the most similar gradient or applying a transformation to spatial features in the target window. A relationship is established between the regions surrounding a spatial feature, or pixel-level matching is conducted between the reference image and target image. The normalized correlation coefficient [13] and gradient mutual information [14] are widely used to evaluate the match. Area-based methods are typically used for matching homologous points in images. However, area-based matching is easily affected by nonlinear radiometric differences in multi-source image matching. To address this issue, Shechtman et al. [15] designed a local self-similarity (LSS) descriptor based on texture and gradient information to minimize the radiometric differences. The LSS algorithm was later extended to multi-source image matching due to its excellent performance. Specifically, Liu et al. [16] developed the FLSS-C and LSS-C algorithms and achieved robust geometric invariance using a distribution-based representation. Subsequently, Sedaghat et al. [17] used the LSS for multi-sensor image matching and achieved good performance. Jenkinson et al. [18] constructed geometric structure information based on self-similarity. However, area-based methods typically calculate feature similarity by traversing local pixels, which undoubtedly greatly increases computational consumption. To improve efficiency, a template matching method has recently been proposed to calculate the number of nearest neighbors [19]. Ye et al. [20] converted the similarity measure into the frequency domain using SSD, greatly accelerating three-dimensional feature description. However, the template image did not consider image texture, which will greatly influence the regional representation. If the image window was in an area with low texture or there were no distinctive features, the matching results would be unsatisfactory.
2.2. Feature-Based Methods
Feature-based methods typically detect structural features in an image, such as corners, lines, or texture, rather than spectral information. The selected feature must be distinctive, robust, simple to detect, and must remain invariant for different radiometric values.
The scale-invariant feature transform (SIFT) [21] is a classical image matching algorithm. It is rotation- and scale-invariant, involving Gaussian pyramid and gradient histogram techniques. Rublee et al. [22] proposed the novel oriented fast and rotated (ORB) directional binary robust independent elementary features (BRIEF) for real-time applications. This algorithm has low time complexity and is scale-invariant. Morel et al. [23] simulated two camera orientation parameters and proposed the affine-invariant matching algorithm (Affine-SIFT), which is scale and rotation-invariant. Significant radiometric differences between input images prevent the SIFT algorithm from being used for multi-source image registration despite its strong affine invariance and benefits for processing images with different viewing angles. Dellinger et al. [24] proposed a novel gradient definition for multi-sensor images matching to enhance robustness against speckle noise. Additionally, Sedaghat et al. [25] devised an adaptive binning histogram strategy for characterizing local features, specifically tailored to address distortion in multi-source images. However, SIFT and its extensions lack the computational speed necessary for multi-source image matching in practical applications. Integral graph methods have been developed to improve the algorithm’s efficiency.
Generally, deep learning-based methods for multi-source image matching can yield excellent performance. For instance, Zhu et al. [26] proposed a two-stage generative adversarial network-based multi-modal brain image registration method. Fu et al. [27] introduced the texture adaptive observation approach for image depth estimation. Tang et al. utilized the Lovasz-Softmax loss and pre-trained segmentation model to guide the matching network, emphasizing semantic requirements in high-level vision tasks. Tang et al. [28] proposed a versatile image registration and fusion network with semantic awareness. Addressing scenario dependency, Yang et al. [29] proposed a knowledge transfer-based network for multi-source image matching. Sun et al. [30] suggested that the global receptive field provided by Transformer enables dense matches in low-texture areas, where traditional feature detectors often struggle to generate repeatable interest points. However, these methods are sensitive to background clutter and target rotation. They also exhibit high data dependency and often necessitate a large training dataset to achieve high matching accuracy.
The performance of multi-source image matching based solely on gradient features is typically poor because the gradient information of multi-source data is generally sensitive to nonlinear radiometric differences. It is advantageous to combine textural information with spectral information for feature extraction, like how people analyze images. Therefore, many scholars have proposed matching methods based on visual perception to deal with the significant radiometric differences between multi-source images [31]. Meng et al. [32] introduced a new descriptor for vein recognition called local directional code (LDC) based on rich orientation information. Aguilera et al. [33] proposed the edge-oriented histogram (EOH) to capture edge information surrounding key points. Wu et al. [34] proposed the histogram of point-edge orientation (HPEO), a simple and highly robust descriptor to extract structural features. Image matching based on phase congruency has been widely used for multi-source image registration recently. This method extracts structural information from images to obtain invariant features and has achieved better performance than classical matching methods. These methods assume that structural characteristics are consistent across multi-source images and are unaffected by intensity differences. Ye et al. [35] proposed HOPC to extract shape features from multi-source images. Wu et al. [36] extended the phase congruency feature to represent the orientation and constructed a mixed phase congruency descriptor based on gradient information and orientation. However, how to balance fusion features and computational efficiency is a problem that needs to be solved.
3. Methodology and Material
3.1. Basic Framework of the Proposed Matching Algorithm
The classical phase consistency model is extended to produce a pixel-wise feature representation based on the orientation and intensity of phase consistency, enabling robust mixed feature representation of phase consistency for image matching. To improve matching efficiency, the F-SSDA is applied to solve the sequential similarity objective function. Finally, the matching accuracy can be determined according to the affine transformation model.
3.2. Channel Features of Phase Consistency
The Fourier series expansion of a given signal can be given as follows:
where and indicate the phase at position x and the amplitude of the frequency component, respectively. Phase congruency can be defined as follows:
where indicates the weighted mean in the local region.
Since phase consistency models cannot detect blurred features, some improved methods that calculate phase congruency using the log-Gabor wavelets at multiple orientations and scales. This function is defined in the frequency domain as follows:
where and indicate the width parameter and central frequency, respectively. The filter of the log-Gabor wavelet can be obtained by an inverse Fourier transform. The “imaginary” and “real” components of the filter are denoted as the log-Gabor odd-symmetric and even-symmetric wavelets, respectively. The convolution results of the input image can be regarded as the response vector:
where and indicate the respective responses of the even-symmetric and odd-symmetric wavelets having o as orientation and n as scale. Moreover, the amplitude and phase are, respectively, given as follows:
Considering the blur and noise of multi-source images, the model is defined as follows [35]:
where represents the weighting factor for the given frequency spread, is a parameter for controlling noise, denotes the amplitude, and is a small constant that avoids division by zero. The symbol means that the closed quantity is equal to itself when the value inside the symbol is positive or zero, and is phase deviation and it is given as follows:
where
However, the phase congruency models given in Equation (7) can only detect response intensity but not the phase orientation. Therefore, it is not suitable to construct robust feature descriptors using solely the phase congruency response intensity. However, in addition to the response characteristic, oriented gradient information was significant for constructing local feature descriptors.
The log-Gabor odd-symmetric convolutions in multiple directions are employed to compute phase congruency. The resulting convolution can then be projected onto the horizontal and vertical axes, yielding the x-direction (horizontal) and y-direction (vertical) image derivatives.
The orientation and response intensity of the phase congruency, which are multi-directional projections, respectively, can be defined as:
The conventional approach, which builds features based on phase congruency, is efficient in capturing the complex texture structures of images and exhibits robust matching performance for multi-source image. However, using two-dimensional data to represent image information is still sensitive to noisy images and radiation changes, especially for multi-source images. Therefore, several feature vectors are constructed from the oriented gradient information at each pixel and in the Z-direction to construct a 3D pixel-level descriptor (). The feature representation is convolved with a Gaussian filter to obtain a robust local description. This 3D Gaussian model uses a 2D Gaussian filter in the horizontal and vertical directions and a [1, 2, 1] T kernel in the Z-direction. The convolution in the Z-direction smooths the orientated gradients and minimizes geometric distortion caused by local radiometric differences. The feature description is normalized using (15) to further reduce the nonlinear radiometric differences:
where the small constants avoid the zero denominator.
3.3. The Frequency Sequential Similarity Detection Algorithm
Multi-feature description has been proven to be effective in improving the matching accuracy and reducing the impact of radiation differences [10]. The constructed descriptor contains fused feature information and is represented in the form of 3D data, so the similarity measurement calculation is very expensive. Therefore, to improve matching efficiency, a new F-SSDA algorithm is proposed in calculating feature similarity. The proposed algorithm is used to evaluate the similarity between a pair of signals. Let and represent the corresponding feature representations of control candidate points calculated by Equation (15), respectively. The F-SSDA between the constructed feature presentation within window i is given as
where n denotes the coordinates of 3D feature representation, is the masking function over , where within the image window, and 0 otherwise. is the average value of feature representation within the template window. denotes the F-SSDA calculation between the 3D feature representations translated by vector v for template window i. Consequently, the match between and can be achieved by minimizing . Accordingly, the matching function is given as follows:
where indicates an offset vector while matching signals and .
The standard strategy is to calculate the F-SSDA of the feature description for the region around candidate key points. However, this approach substantially increases the computational cost as the feature description contains 3D information. Then, the spatial feature information is converted into the frequency domain to reduce the time consumption.
Herein, the algebraic transformation of similarity function Equation (16) can be present as follows:
Since the first term is a constant, similarity is measured through the minimization of the functions of the remaining two terms. The spatial domain convolution is equivalently represented by the dot product in the frequency domain. Therefore, the convolution operation of the last two terms of Equation (18) can be accelerated using FFT, and the offset vector is given as follows:
where , , and and indicate the FFTs and its inverse transform, respectively; moreover, is the complex conjugate of .
Through Equation (19), the computational efficiency can be significantly improved. For instance, given a fixed size of pixels, the corresponding search window is pixels. The SSD required operations, while the proposed approach needs operations. Hence, the computational efficiency can be significantly improved when applying Equation (19).
The curve of similarity and computational efficiency is evaluated, and the correct match ratio (CMR) is calculated. Some classical multi-source image data are used for performance analysis.
3.4. Description of Datasets
Several multi-source image data were selected to evaluate the matching performance. We evaluated the matching of (1) visible–SAR, (2) LiDAR–visible, (3) visible–infrared, and (4) visible–map. Various high-resolution and medium-resolution (30 m) images covering different terrains, including suburban and urban areas, were used. There were no differences in translation, rotation, and scale between image pairs. However, significant radiometric differences were unavoidable due to the different sensor wavelengths. Please refer to Table 1 for detailed data.

Table 1.
Description of test images.
- (a)
- Visible–SAR: Visible–SAR data 1 and 3 were acquired over urban areas with tall buildings, resulting in significant radiometric differences between them. Visible–SAR 2 is a medium-resolution image in a suburban area. In addition, significant changes had occurred in this area as the SAR image was taken 14 months after the visible image in Visible–SAR 2, thereby complicating the matching process.
- (b)
- LiDAR–Visible: LiDAR–Visible images is collected in urban areas. Significant noise and nonlinear radiometric differences make it more challenging to match LiDAR image data.
- (c)
- Visible–infrared: Both medium- and high-resolution images were used (Daedalus and Landsat 5 TM). The medium-resolution data were acquired over a suburban area.
- (d)
- Visible–map: These data were collected from Google Earth. The images had been rasterized, and there was local distortion between image pairs due to the relief displacement of buildings. In addition, there were radiometric differences between the map data and visible images. The lack of texture features to construct local descriptors makes it challenging to match an image to a map.
4. Experiments
4.1. Parameters and Evaluation Criteria
Precision, RMSE (Root Mean Square Error), and computational cost were used to evaluate the proposed algorithm. Matches with errors below a given threshold are considered correct matches. Multiple evenly distributed checkpoints were selected in each image to determine the true value. Generally, checkpoints are determined manually. However, due to various texture features and radiometric differences, particularly in the visible–SAR and the LiDAR–visible test, it is difficult to locate the ground truth manually in multi-source images. HOPCncc was to select 200 control points, which were evenly distributed in the image; 50 points with the lowest residuals were chosen as checkpoints. Once a checkpoint was determined, the projective transformation model was used, and the location error was calculated.
4.2. Tests for Similarity Measurement
The similarity obtained from the proposed CFPC was compared to the HPEO, FHOG, and NCC to illustrate the proposed method’s advantages for matching multi-source images. Three groups of typical multi-source images were used to calculate likelihood estimation maps. Figure 2 shows the likelihood estimation maps of these description methods. The maximum likelihood estimate represents the pixels of the target center. As can be seen, all methods can detect the pixel of interest. However, the NCC’S accuracy is insufficient. The estimation map calculated by FHOG has multiple peaks, which results in estimation errors. The HPEO and proposed CFPC produce smooth likelihood estimates and achieve precise localization for the three cases. However, the proposed CFPC has a more concentrated location area. The preliminary test results demonstrate that the proposed CFPC is more robust than other algorithms (HPEO, FHOG, and NCC). A more detailed analysis will be presented next.
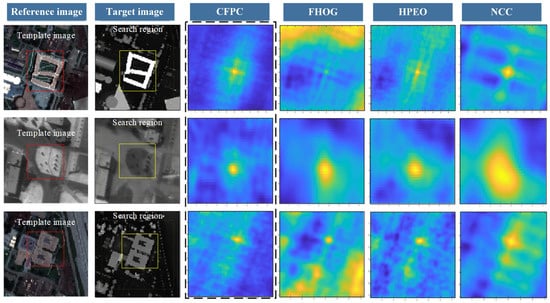
Figure 2.
Likelihood estimation obtained from the CFPC and comparison algorithms.
4.3. Precision
To evaluate the matching precision of the proposed algorithm, this section compares the proposed method with some classical methods in terms of CMR. The selected test data correspond to LiDAR–visible 1, visible–infrared 1, 2, and visible–map 1, 2 in Table 1. There are significant radiometric distortions between each pair of images, which will greatly limit the matching performance. In general, artificially synthesized images are more difficult to match than other data as they contain fewer texture features. Different template sizes (ranging from 20 × 20 to 100 × 100 pixels) are also used to analyze the robustness of the similarity measures.
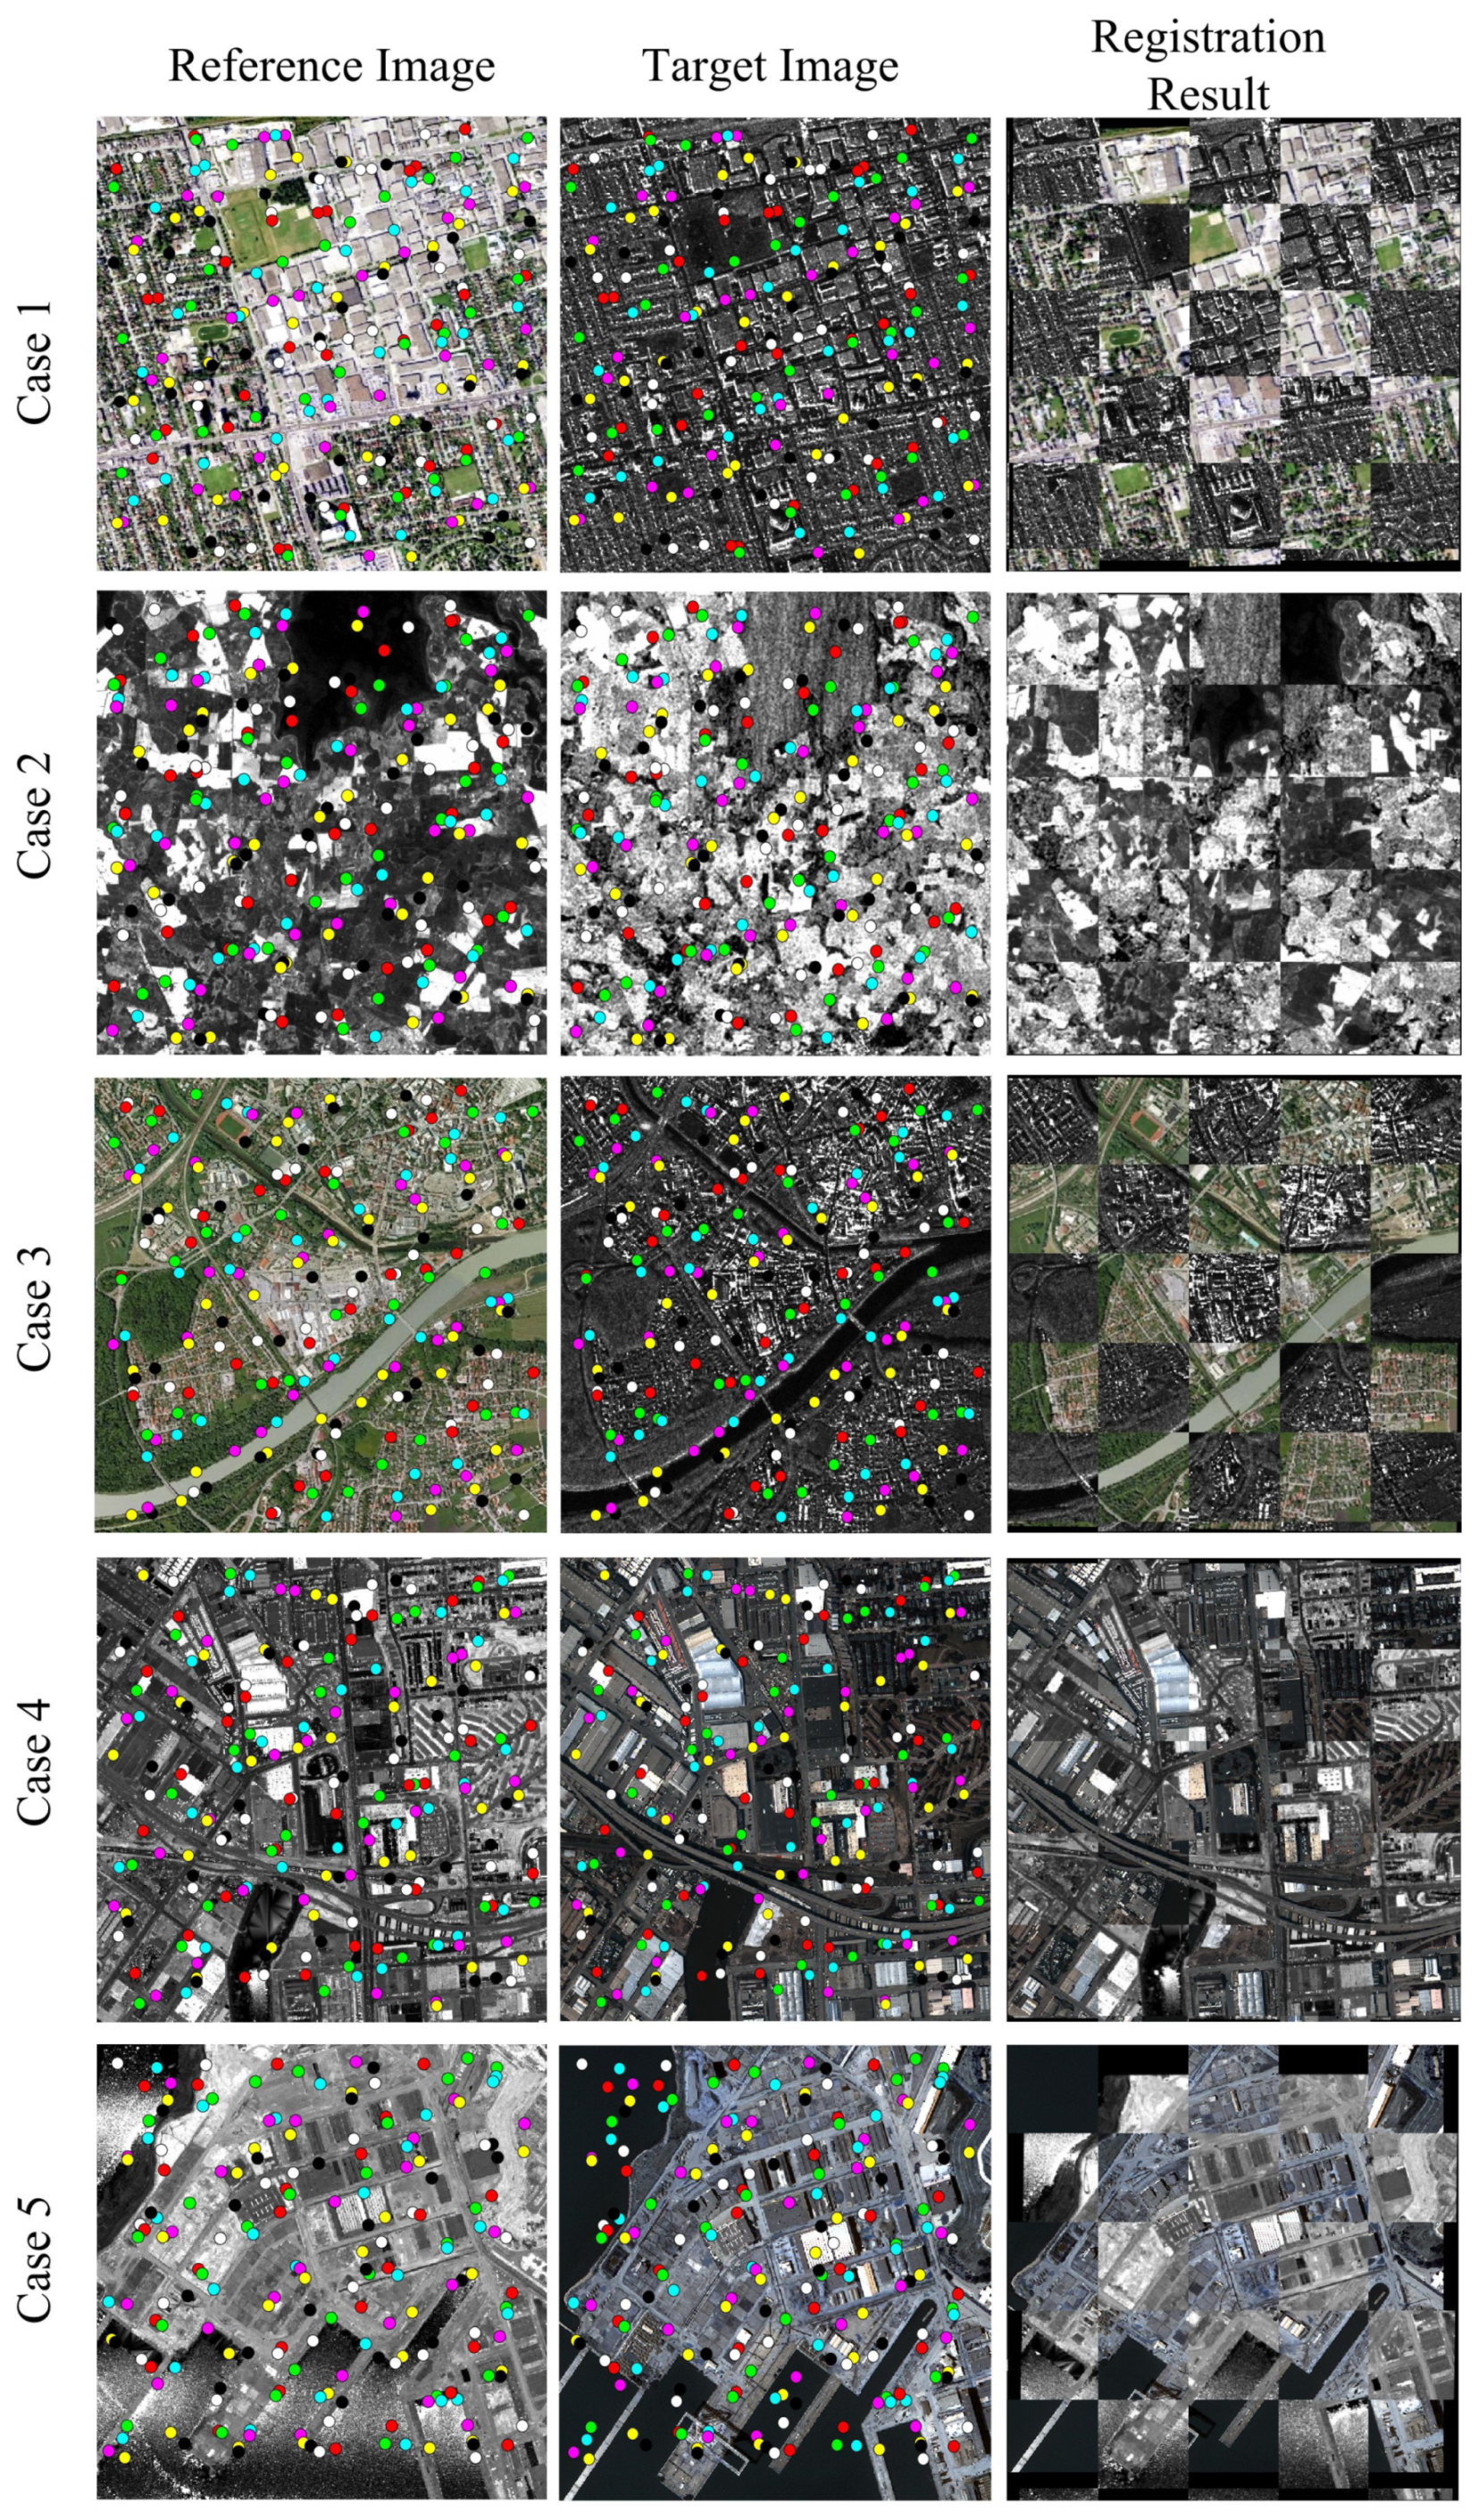
As seen, Figure 3 gives the test results of the proposed algorithm for the five datasets. The first two columns show the target and reference images, respectively, whereas the third column shows the matching results. The points with different colors represent the corresponding pixels of the matching result. As for matching precision, it is reflected in the control points’ position. As can be seen, although the radiometric differences between multi-source images are obvious, the corresponding points are in the correct position, and the images are therefore correctly matched. As for the quantization accuracy, it will be shown in Figure 4.
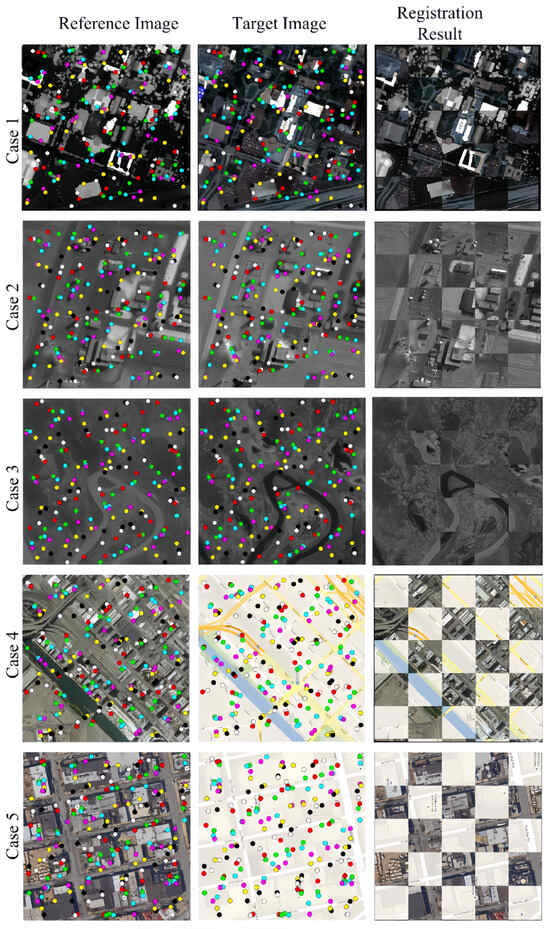
Figure 3.
The matching results of the proposed CFPC. (The point pairs with same color in the consistency area of two images represent the matching positions).
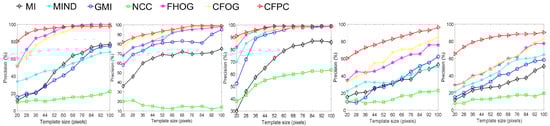
Figure 4.
Image matching precision for different template sizes.
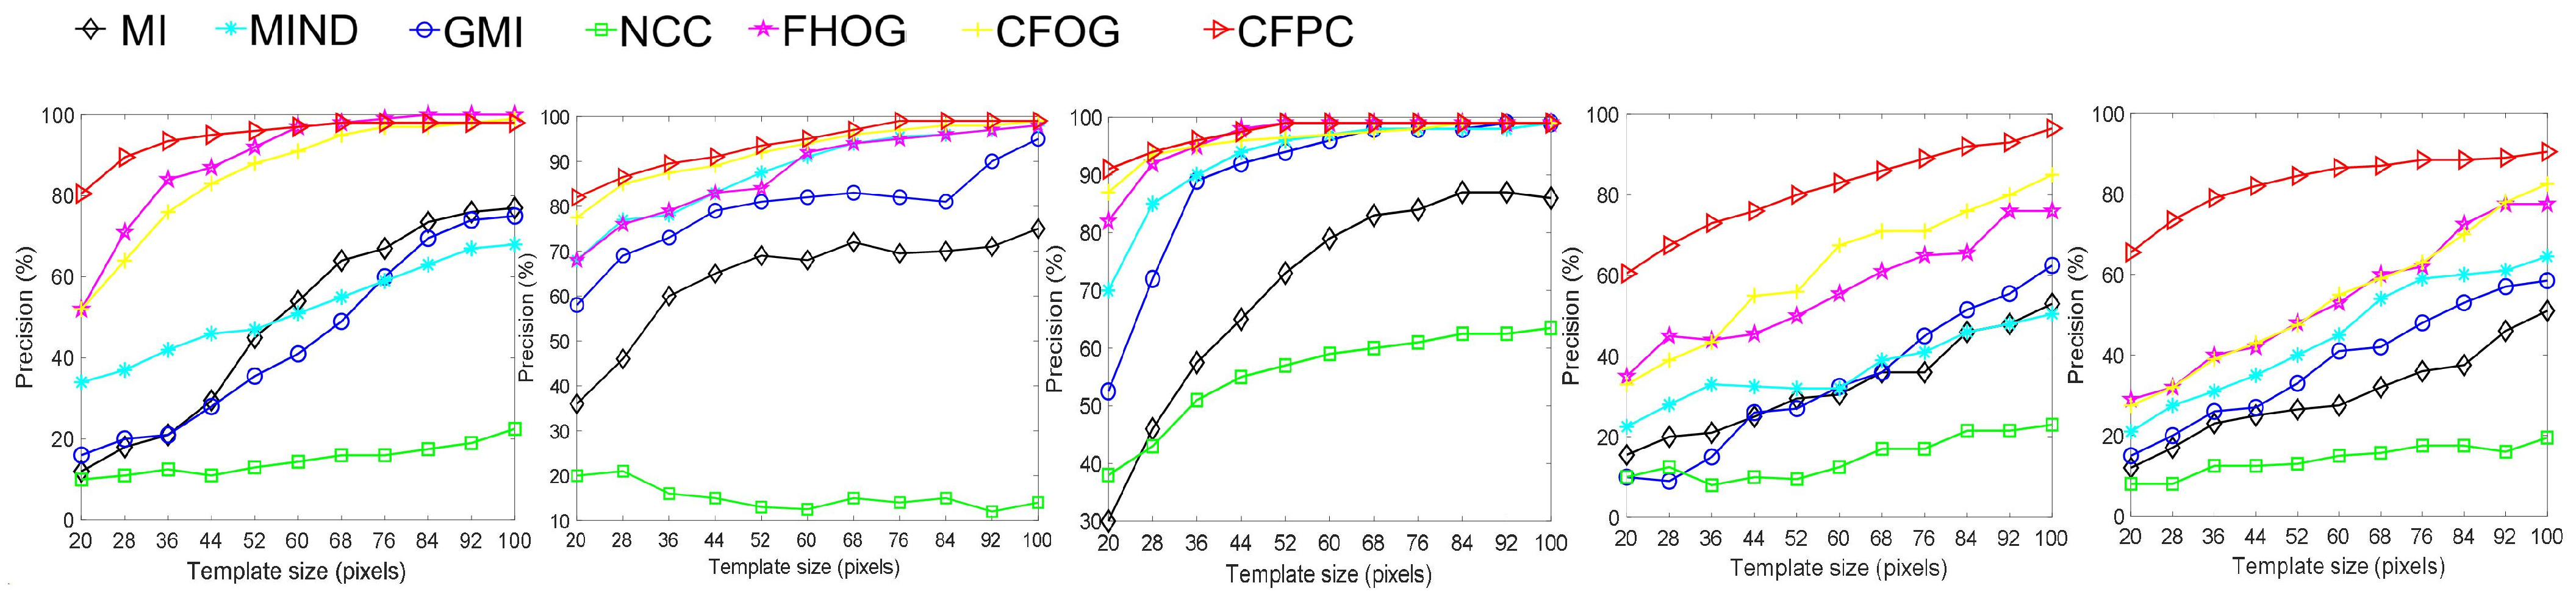
Image matching precision is easily affected by the size of the template window. As its size increases, the matching performance significantly improves. The matching precision curves calculated by different template sizes are illustrated in Figure 5. MI, GMI, and MIND are capable of mitigating nonlinear intensity differences to a certain degree and have been proven suitable for multi-source image matching. While the matching results of NCC remain relatively stable, a primary drawback of the method is its disregard for the structural information of neighboring pixels, leading to a decline in image matching quality. Unlike NCC, CFOG and FHOG enhance the matching performance using the orientated gradient information and are invariant to radiation differences. Moreover, the proposed mixture model, CFPC, which combines both the oriented gradient and the response intensity of phase congruency, has achieved the best performance in all the test results. More specifically, for visible–map experiments with insufficient texture features, the proposed algorithm can also extract weak structural information from images by using the proposed mixed model, as it achieves better performance compared to the other algorithms in multi-source image matching.
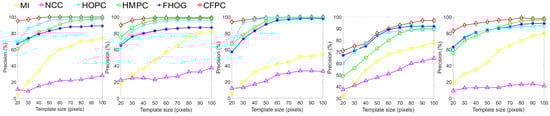
Figure 5.
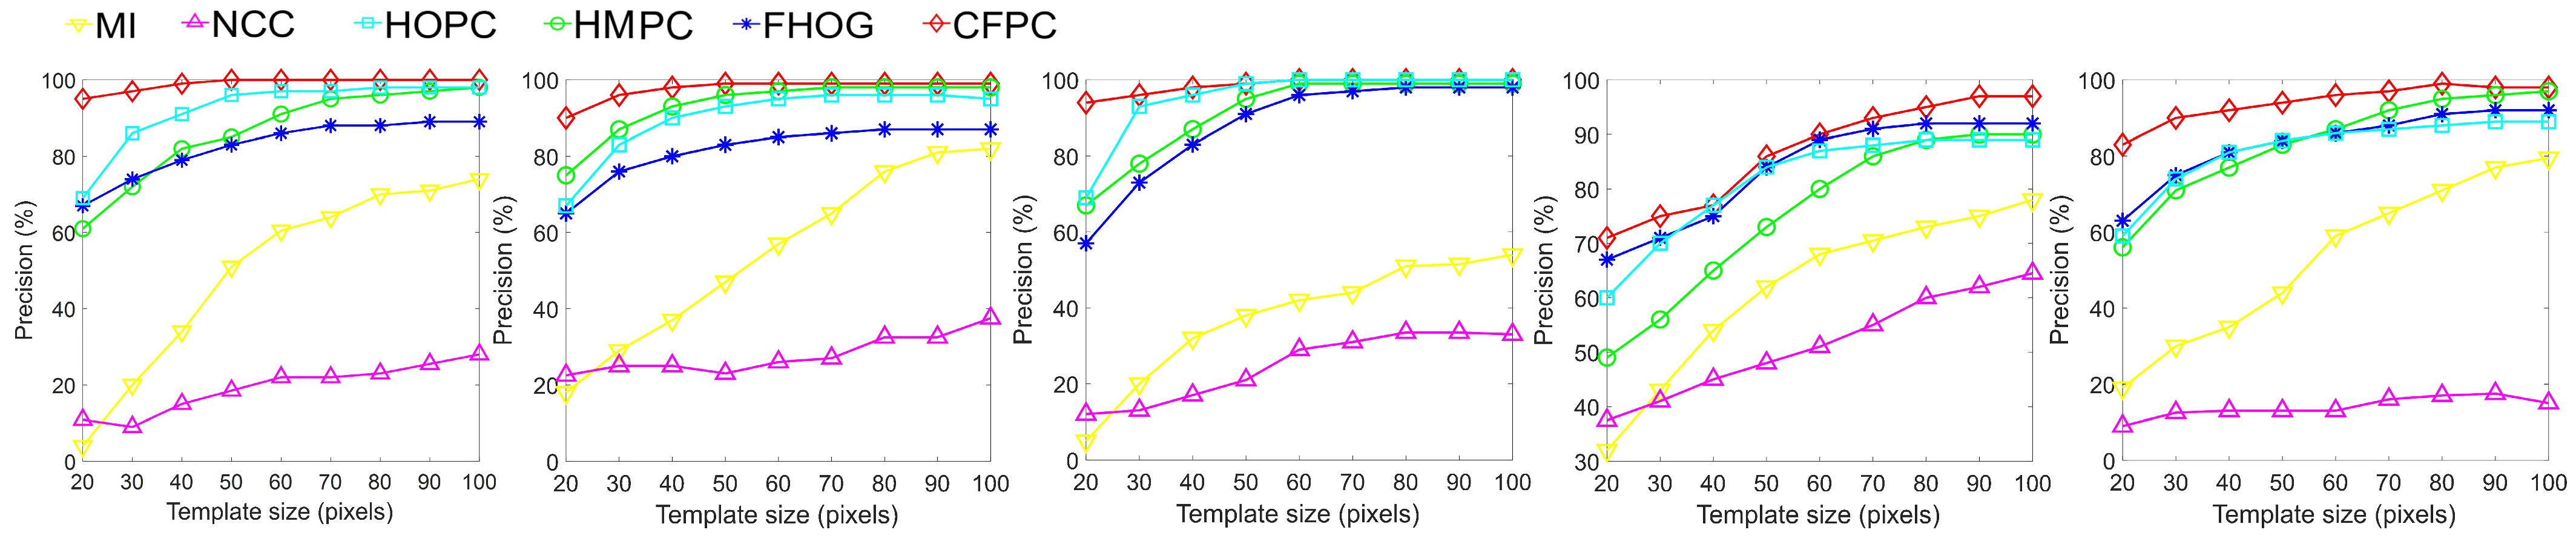
Image matching precision for different template sizes. The HMPC, FHOG, HOPC, and CFPC use similarity measures based on the F-SSDA.
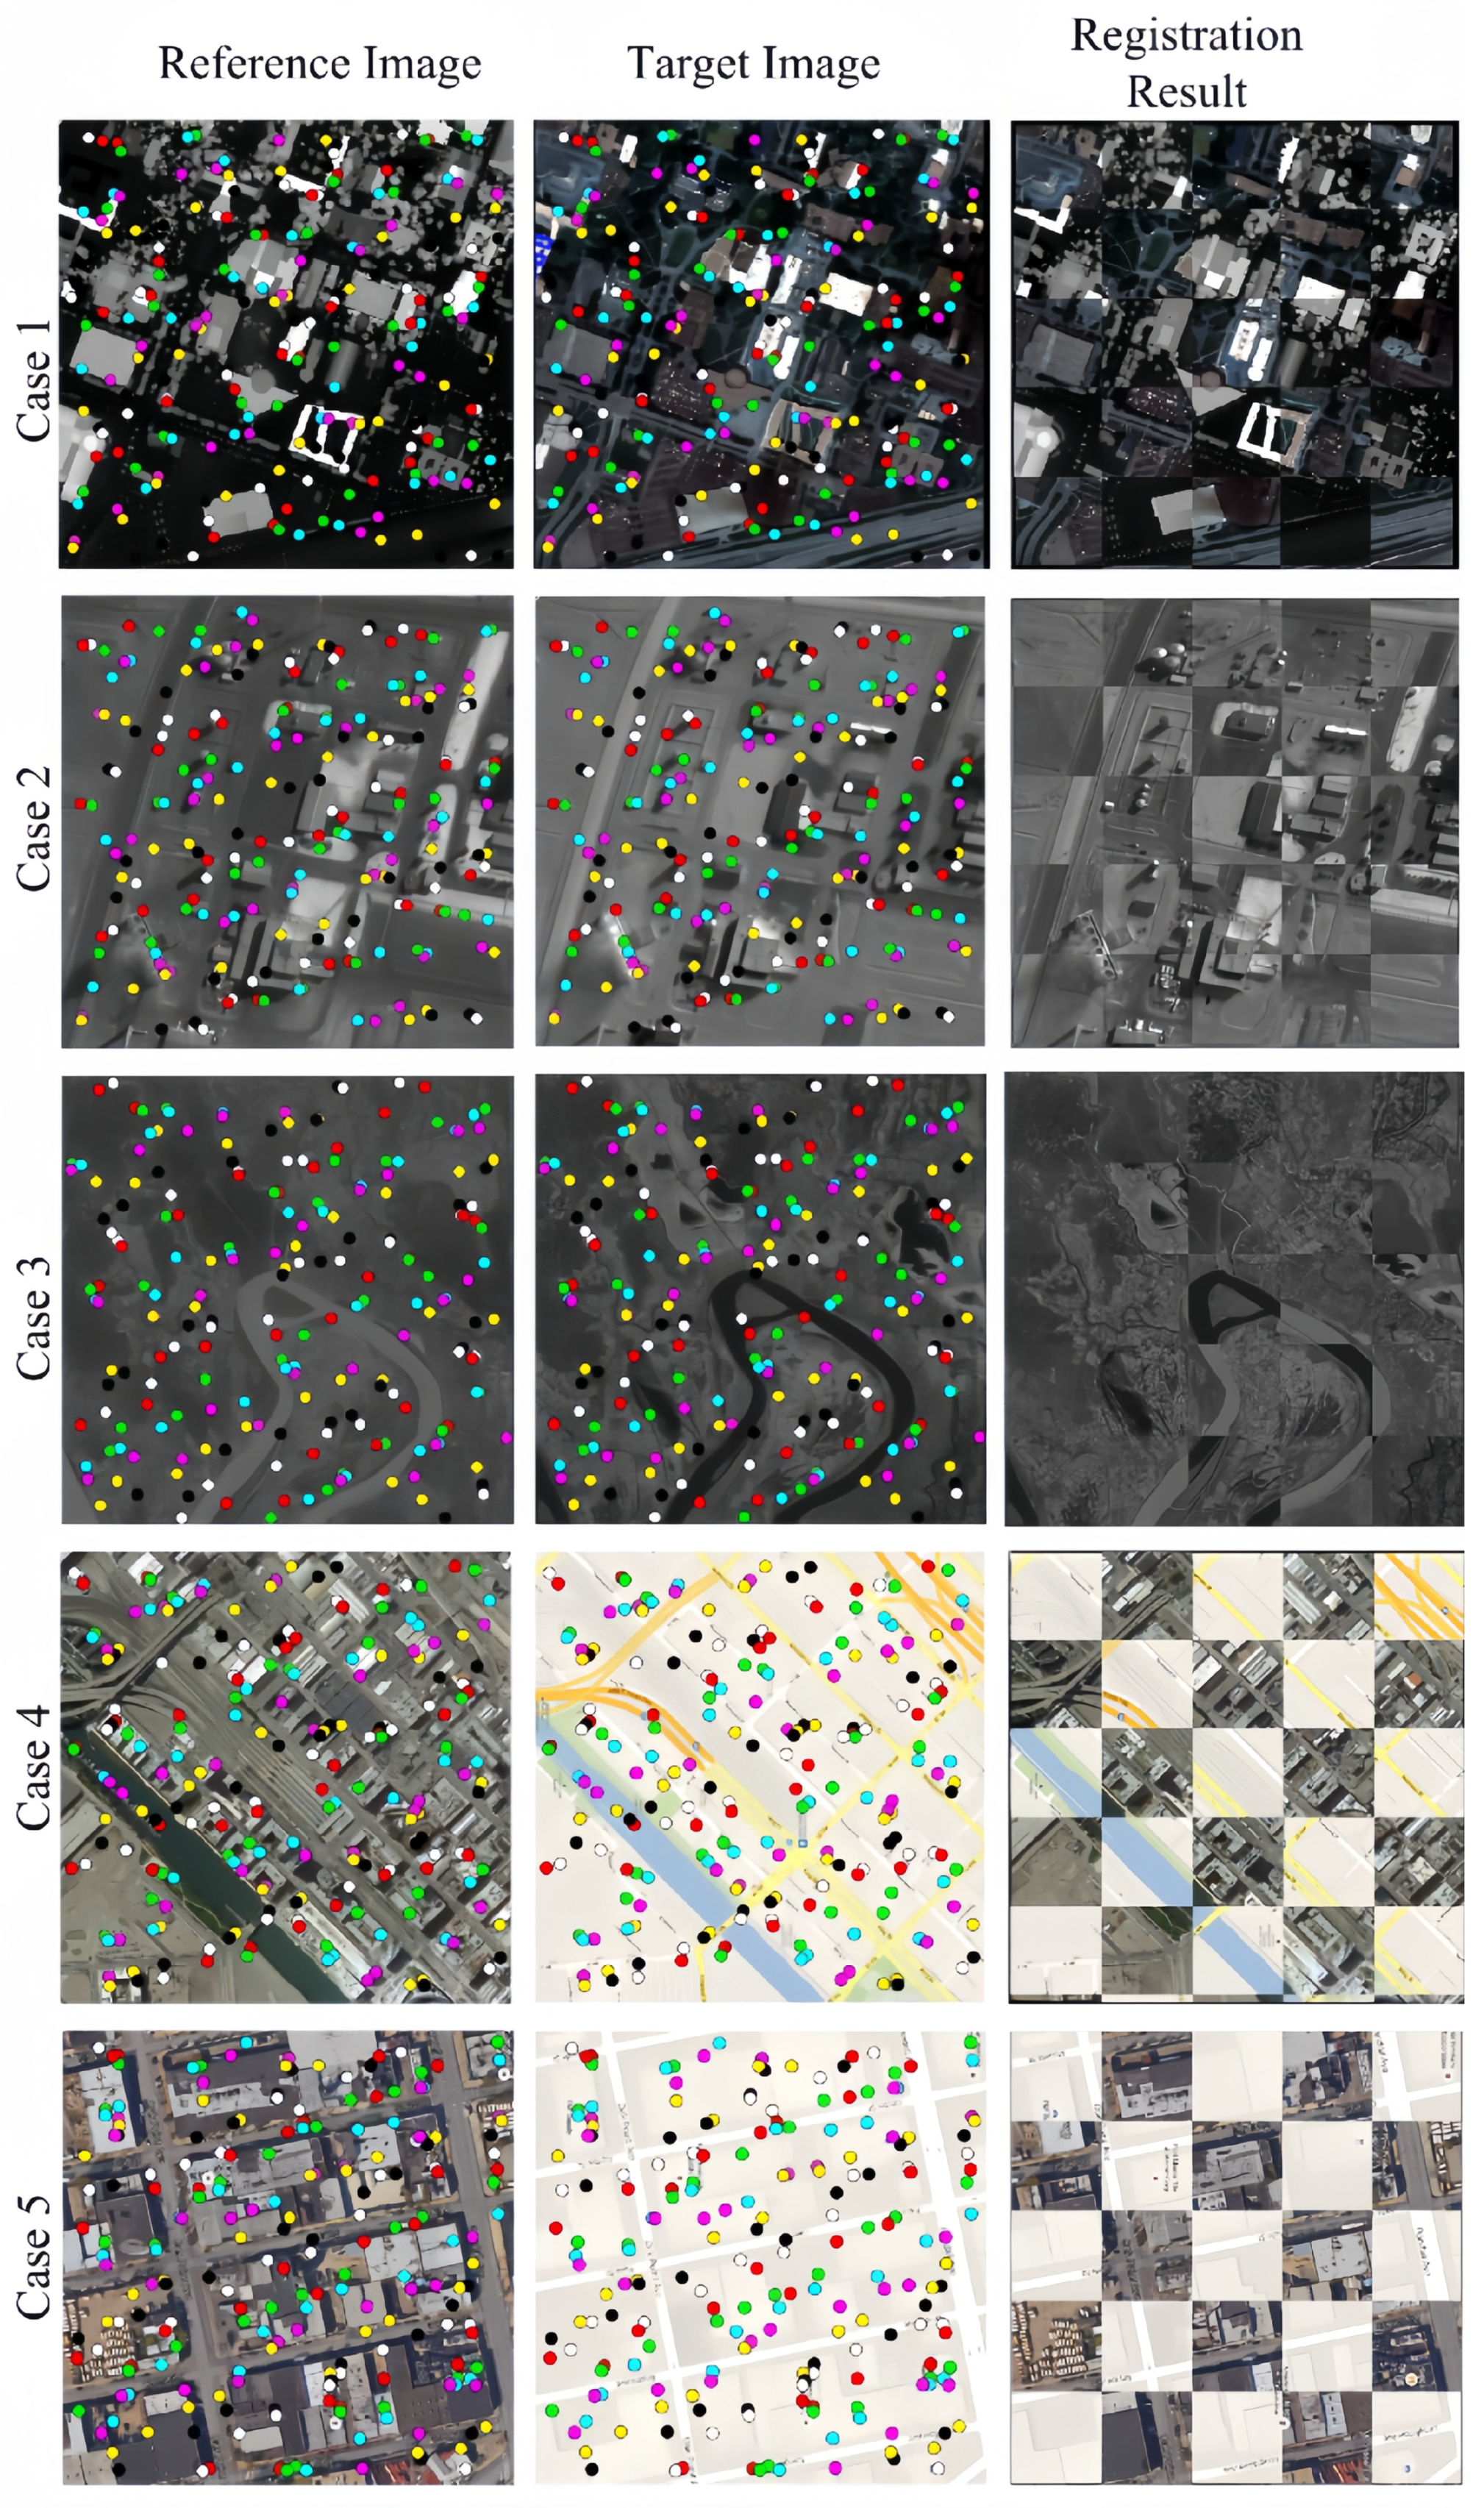
The features of HMPC, FHOG, and HOPC were converted to the frequency domain, and the matching was performed with the proposed F-SSDA technique. Furthermore, some classical methods were chosen for comparison. Figure 6 shows the results for the five datasets (visible–SAR 1, 2, 3 and LiDAR–visible 2, 3). The matching results (i.e., HMPC, FHOG, and HOPC) calculated using the proposed similarity measure are superior to the classical algorithms (NCC and MI) in almost all cases. Obviously, NCC exhibits the worst matching performance, indicating that it is not suitable for multi-source image matching. As for HOPC, it shows better matching precision than NCC and MI because the stable structural features were extracted to evaluate similarity. Although the HMPC converted the similarity measure into the frequency domain, the template image does not consider the image texture, which will greatly influence the regional representation. Contrarily, the proposed CFPC smooths the oriented gradient and response intensity to minimize feature distortions caused by local nonlinear radiometric difference between multi-source images. Added to that, the optimal matching point pair is obtained by calculating the objective function in the frequency domain to ensure high matching performance. The proposed algorithm’s matching results are shown in Figure 6, where the matched pixels are shown in different colors and achieve high consistency. From the registration results, the visual matching effect of each module has a high degree of continuity. Regarding the quantitative indicator RMSE, it will be discussed in the next paragraph.

Figure 6.
Matching results of the CFPC. (The point pairs with same color in the consistency area of two images represent the matching positions).
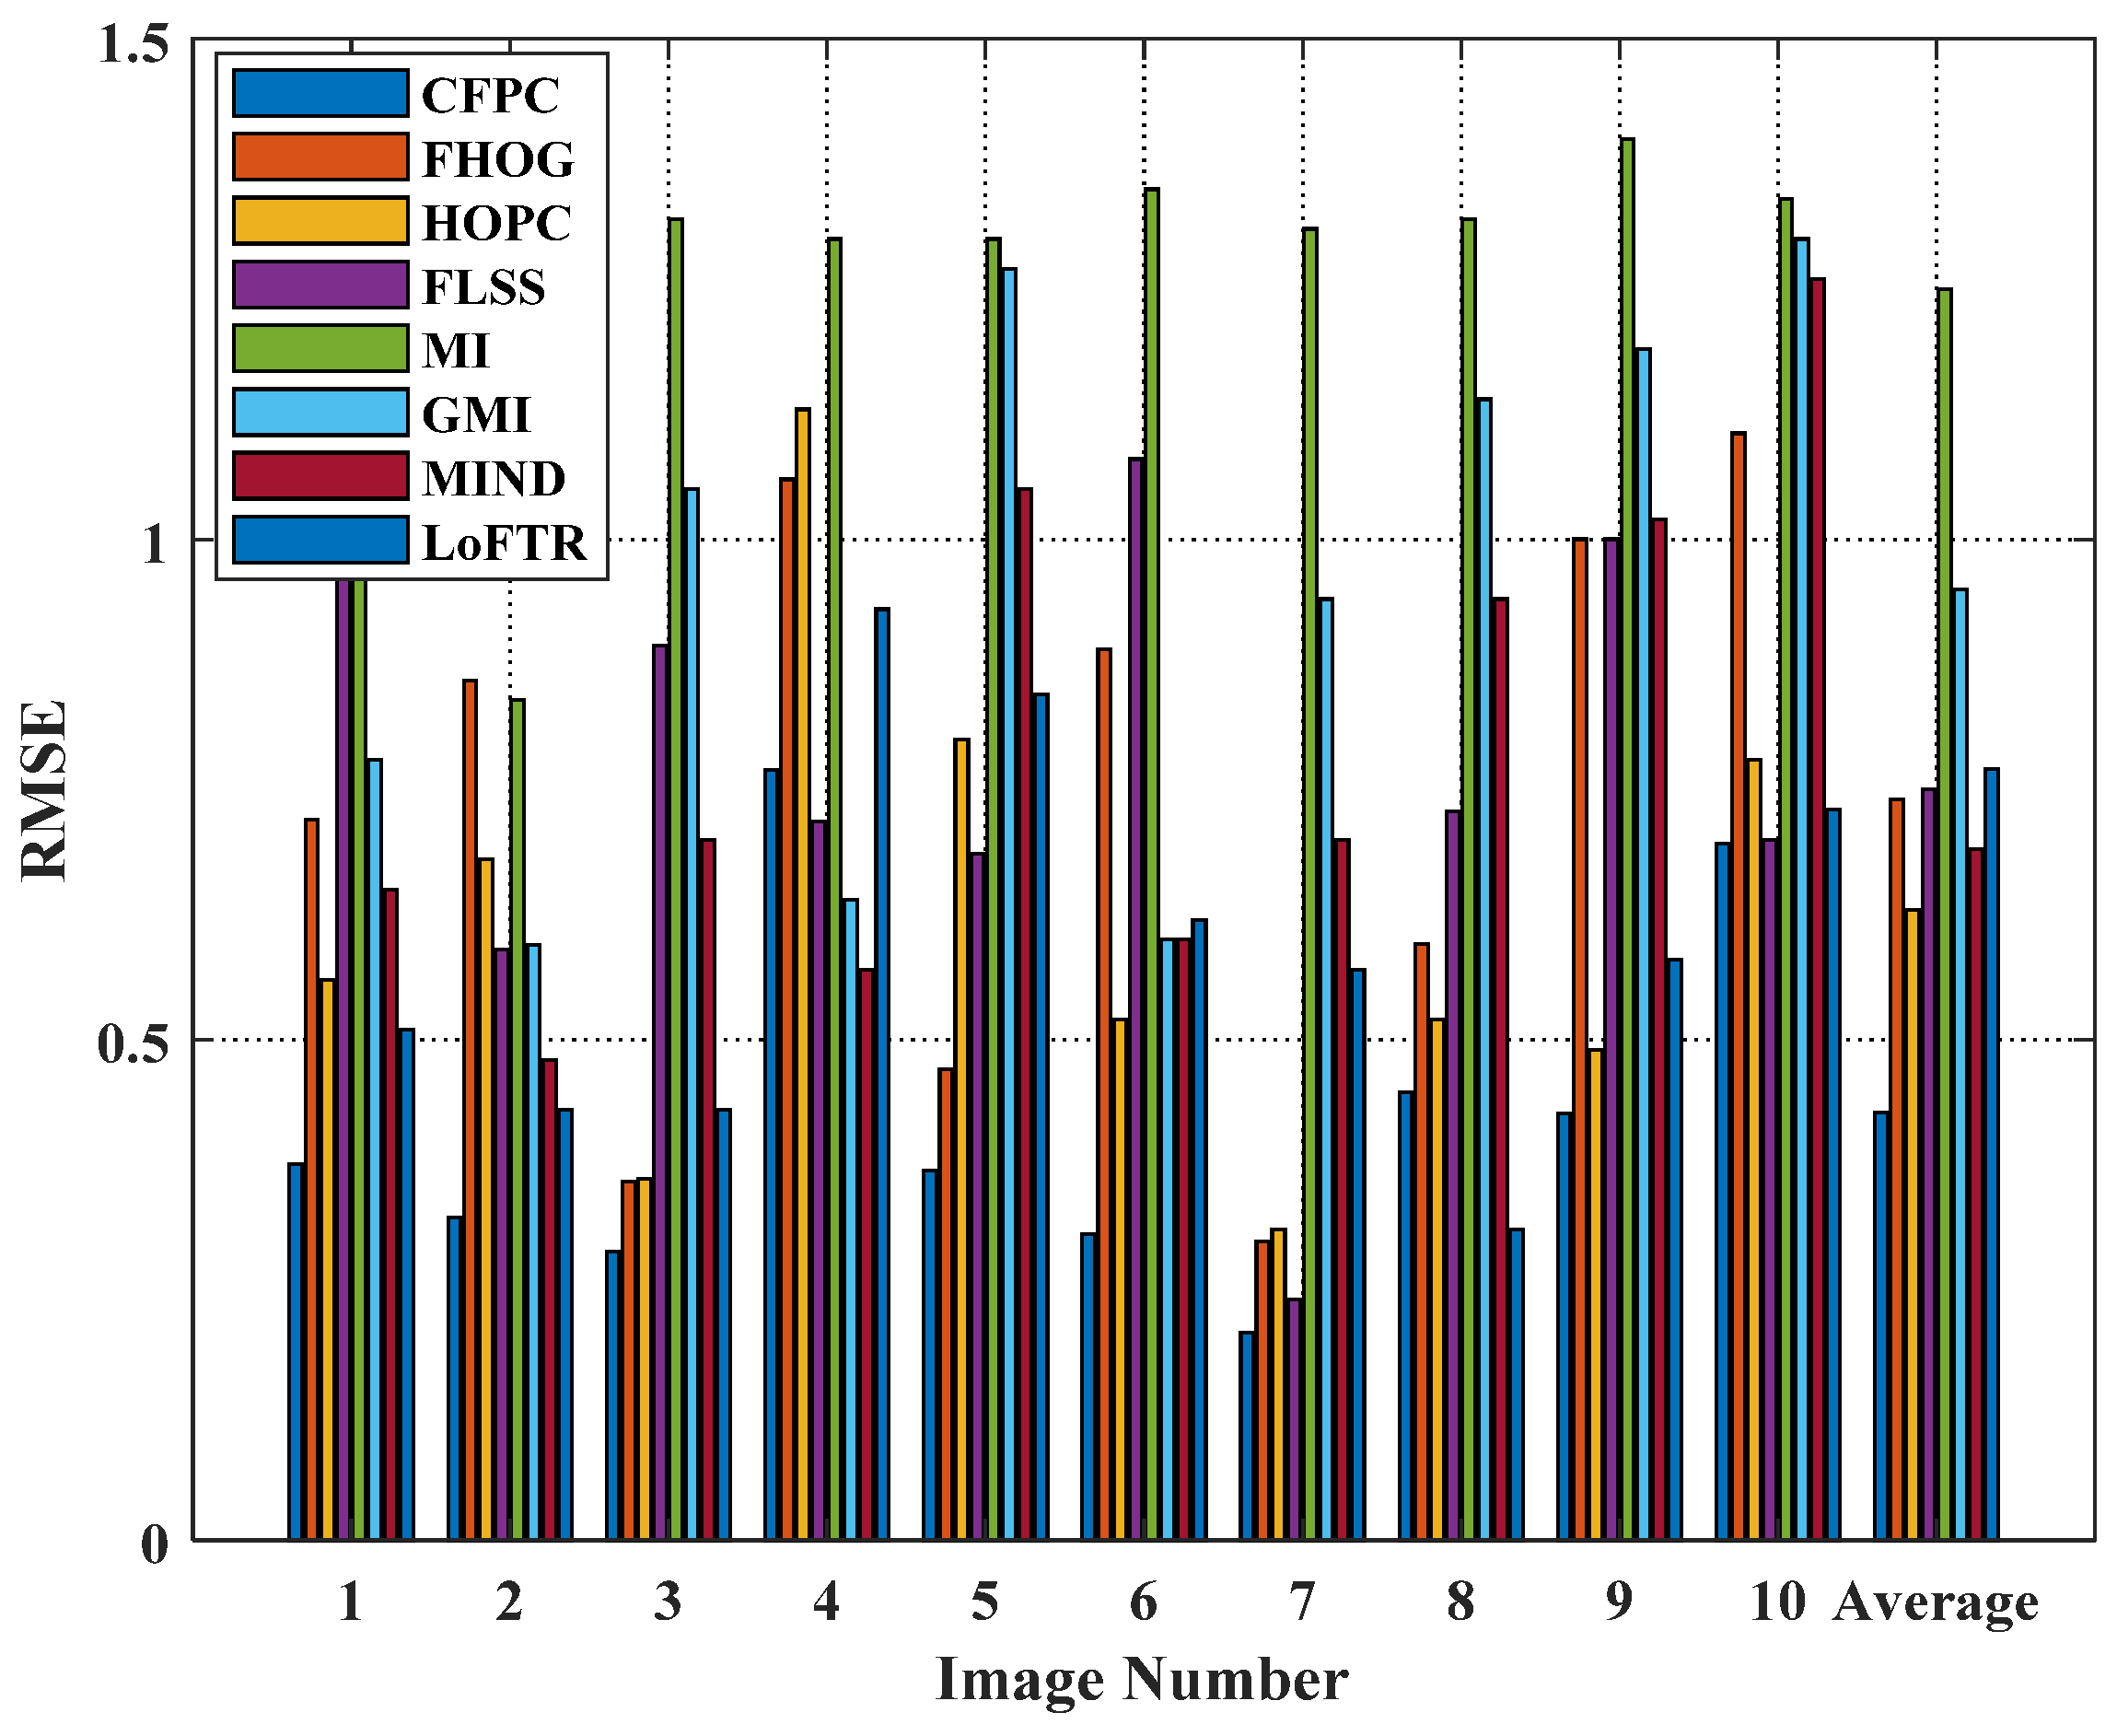
Figure 7 gives the RMSE between the real and measured values. Histograms 1 to 10 illustrate the comparison of test results for all methods on different data, whereas histogram 11 represents the average value calculated from data 1 to 10. Obviously, the proposed CFPC outperforms all other methods (MI, GMI, MIND, FHOG, HOPC, LoFTR, and FLSS), and have the minimum RMSE. This can be attributed to the proposed method being able to extract structural features, which is invariant between multi-source image with radiometric differences. Moreover, the average test result is optimal in terms of RMSE values (histogram 11). The proposed method achieves enhanced robustness due to substantial radiometric variations among the multi-source images and to notable noise in the LiDAR and SAR images, posing challenges in feature matching. However, the proposed method can fully utilize existing information and captures the structural information of the multi-source image; it can effectively establish congruency relationships between corresponding regions.
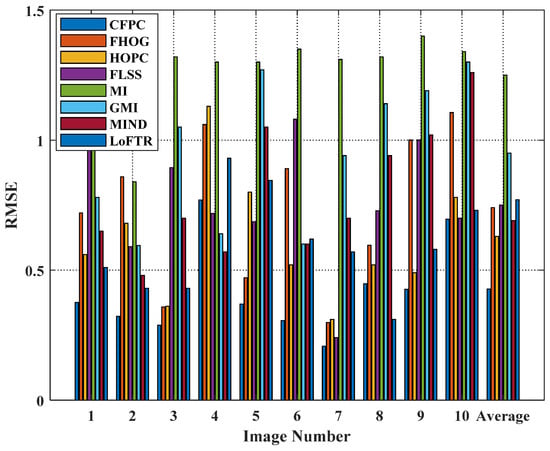
Figure 7.
RMSE for the ten test cases.
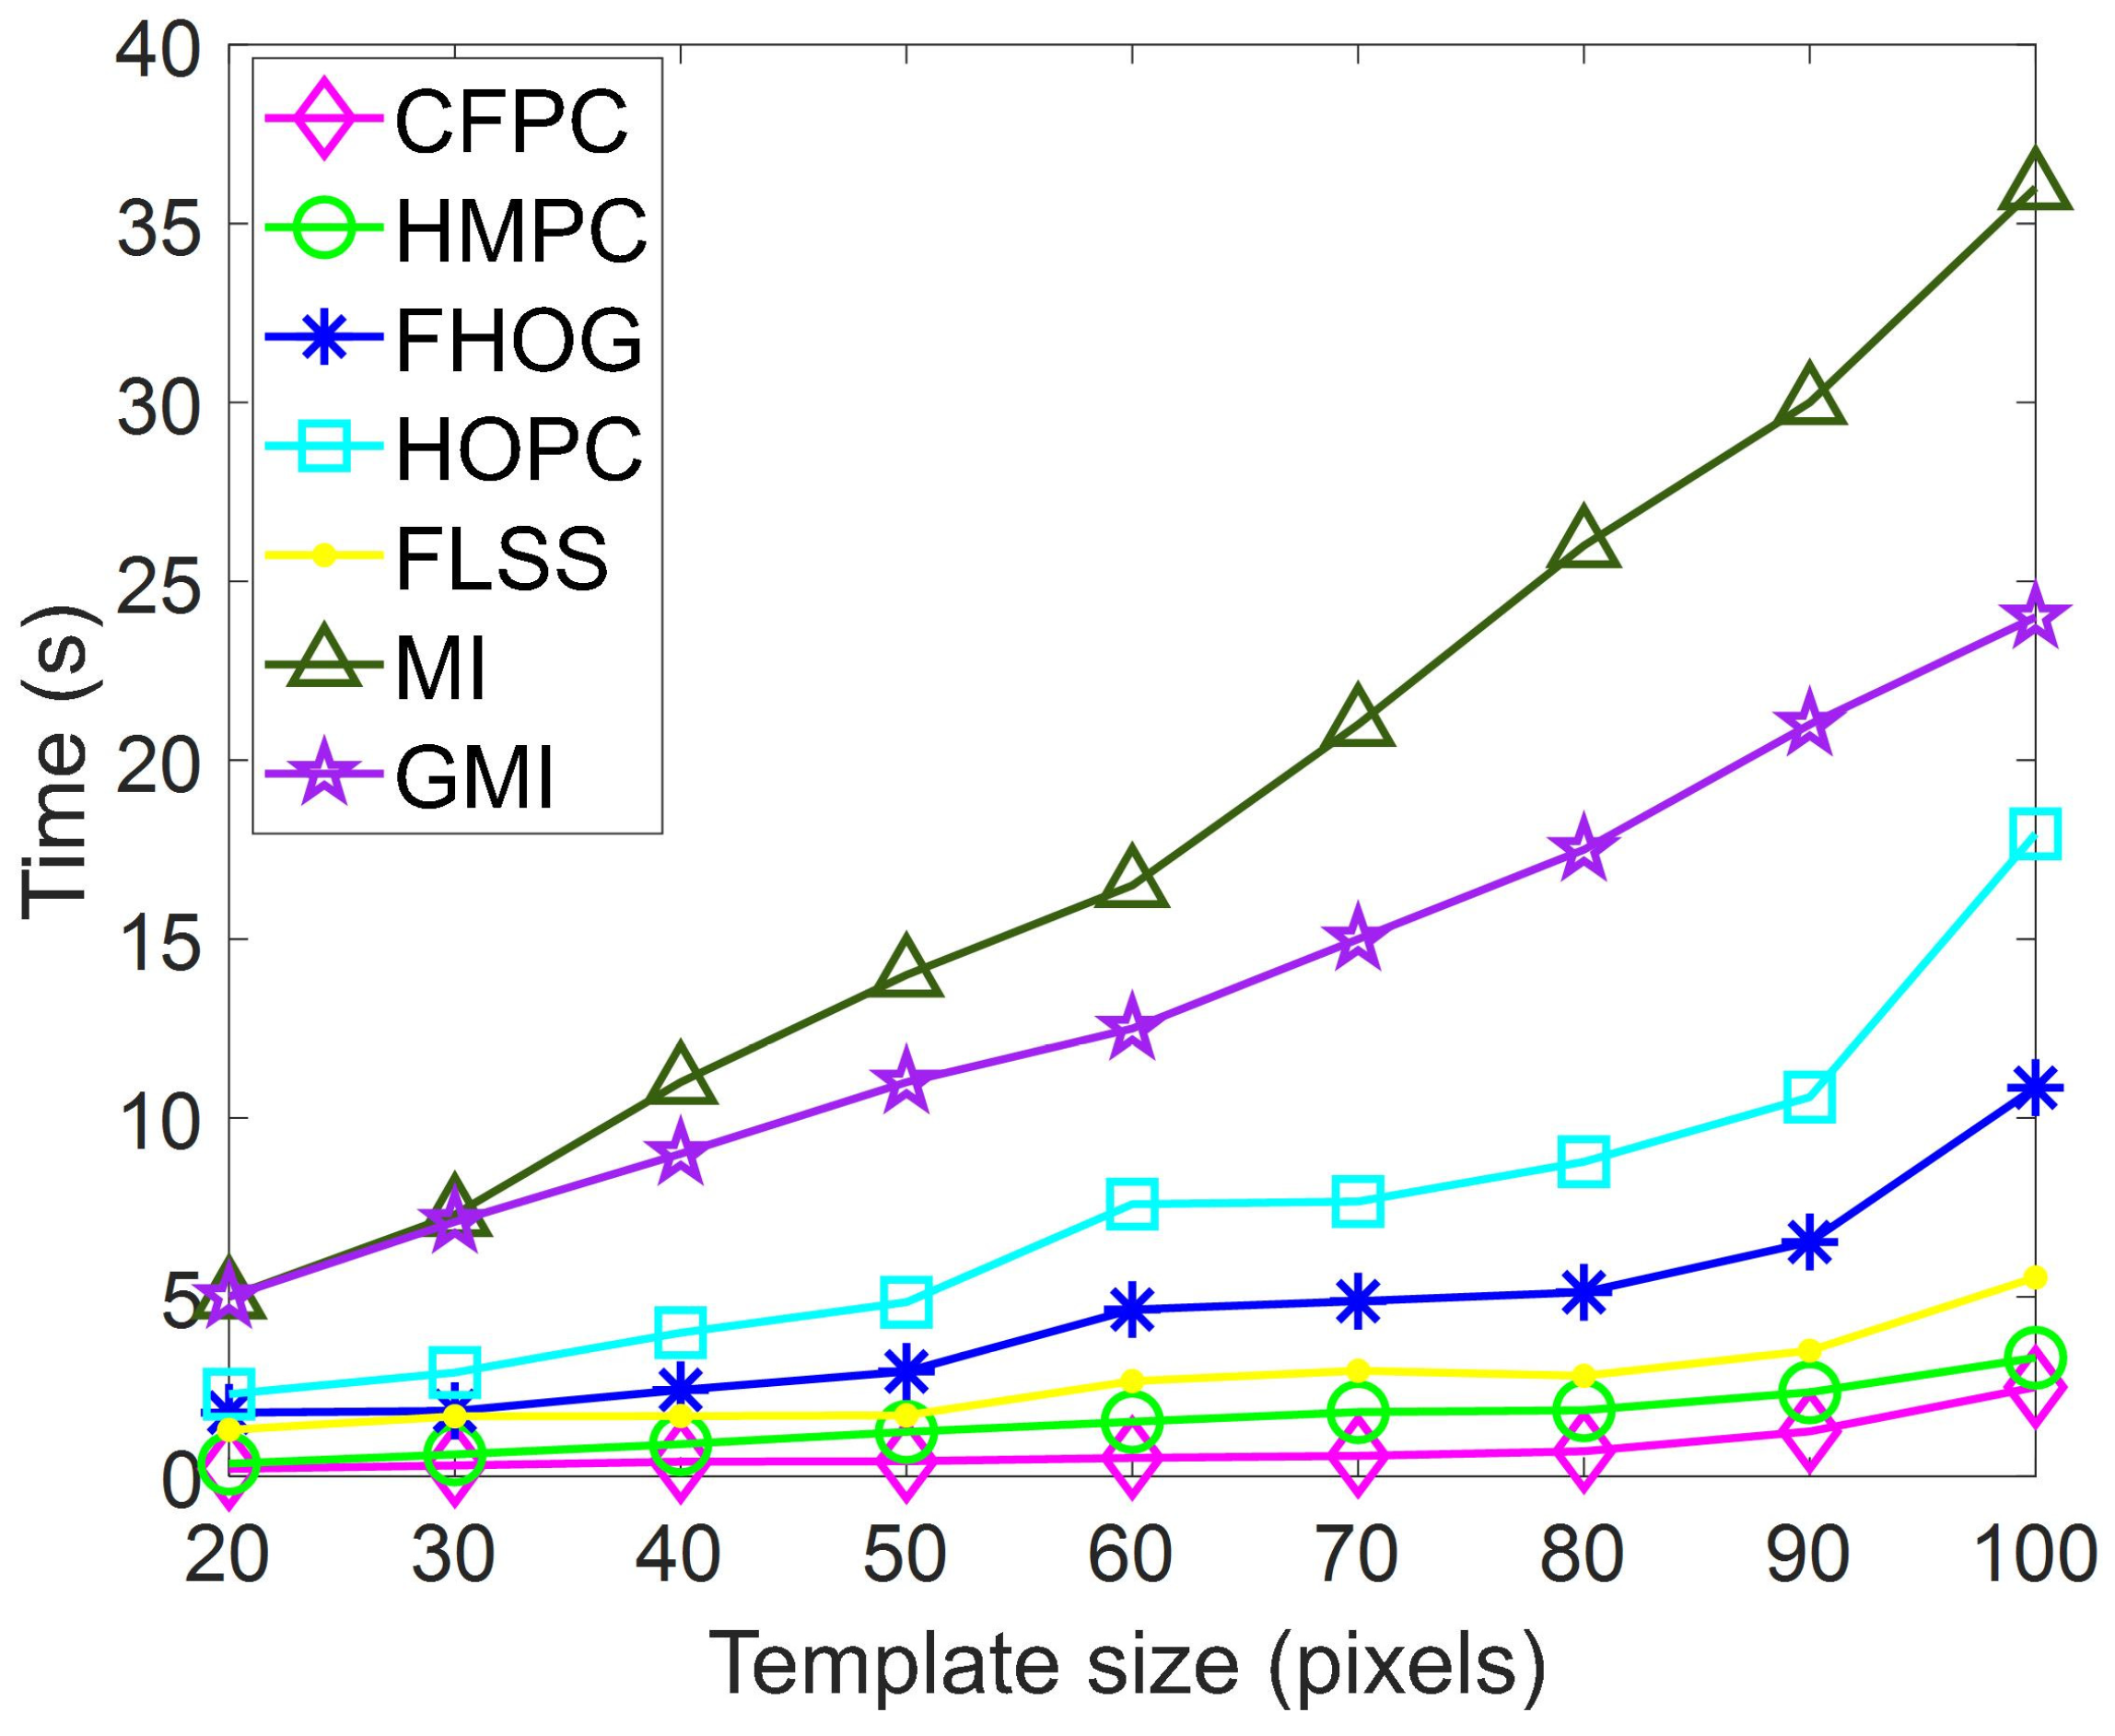
The proposed method has a potential advantage in terms of computational efficiency. As depicted in Figure 8, GMI and MI stand out as the two most time-consuming techniques among these similarity measures, given that they necessitate the computation of the joint histogram for each matched window pair. However, the CFPC presents lower time consumption than other similarity measure methods (FHOG, FLSS, and HOPC) as the Fast Sequential Similarity Detection Algorithm (F-SSDA) is also developed to accelerate similarity measurement. The proposed matching method uses pixel-wise feature representation to evaluate the similarity between multi-source images. In addition, compared to other algorithms, our method has better performance when dealing with small target matching.
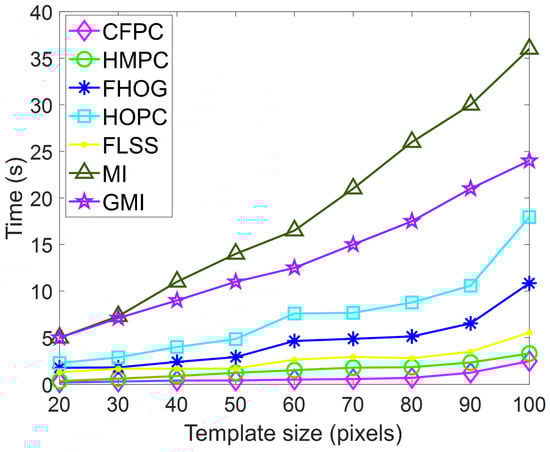
Figure 8.
Time consumption for different template images.
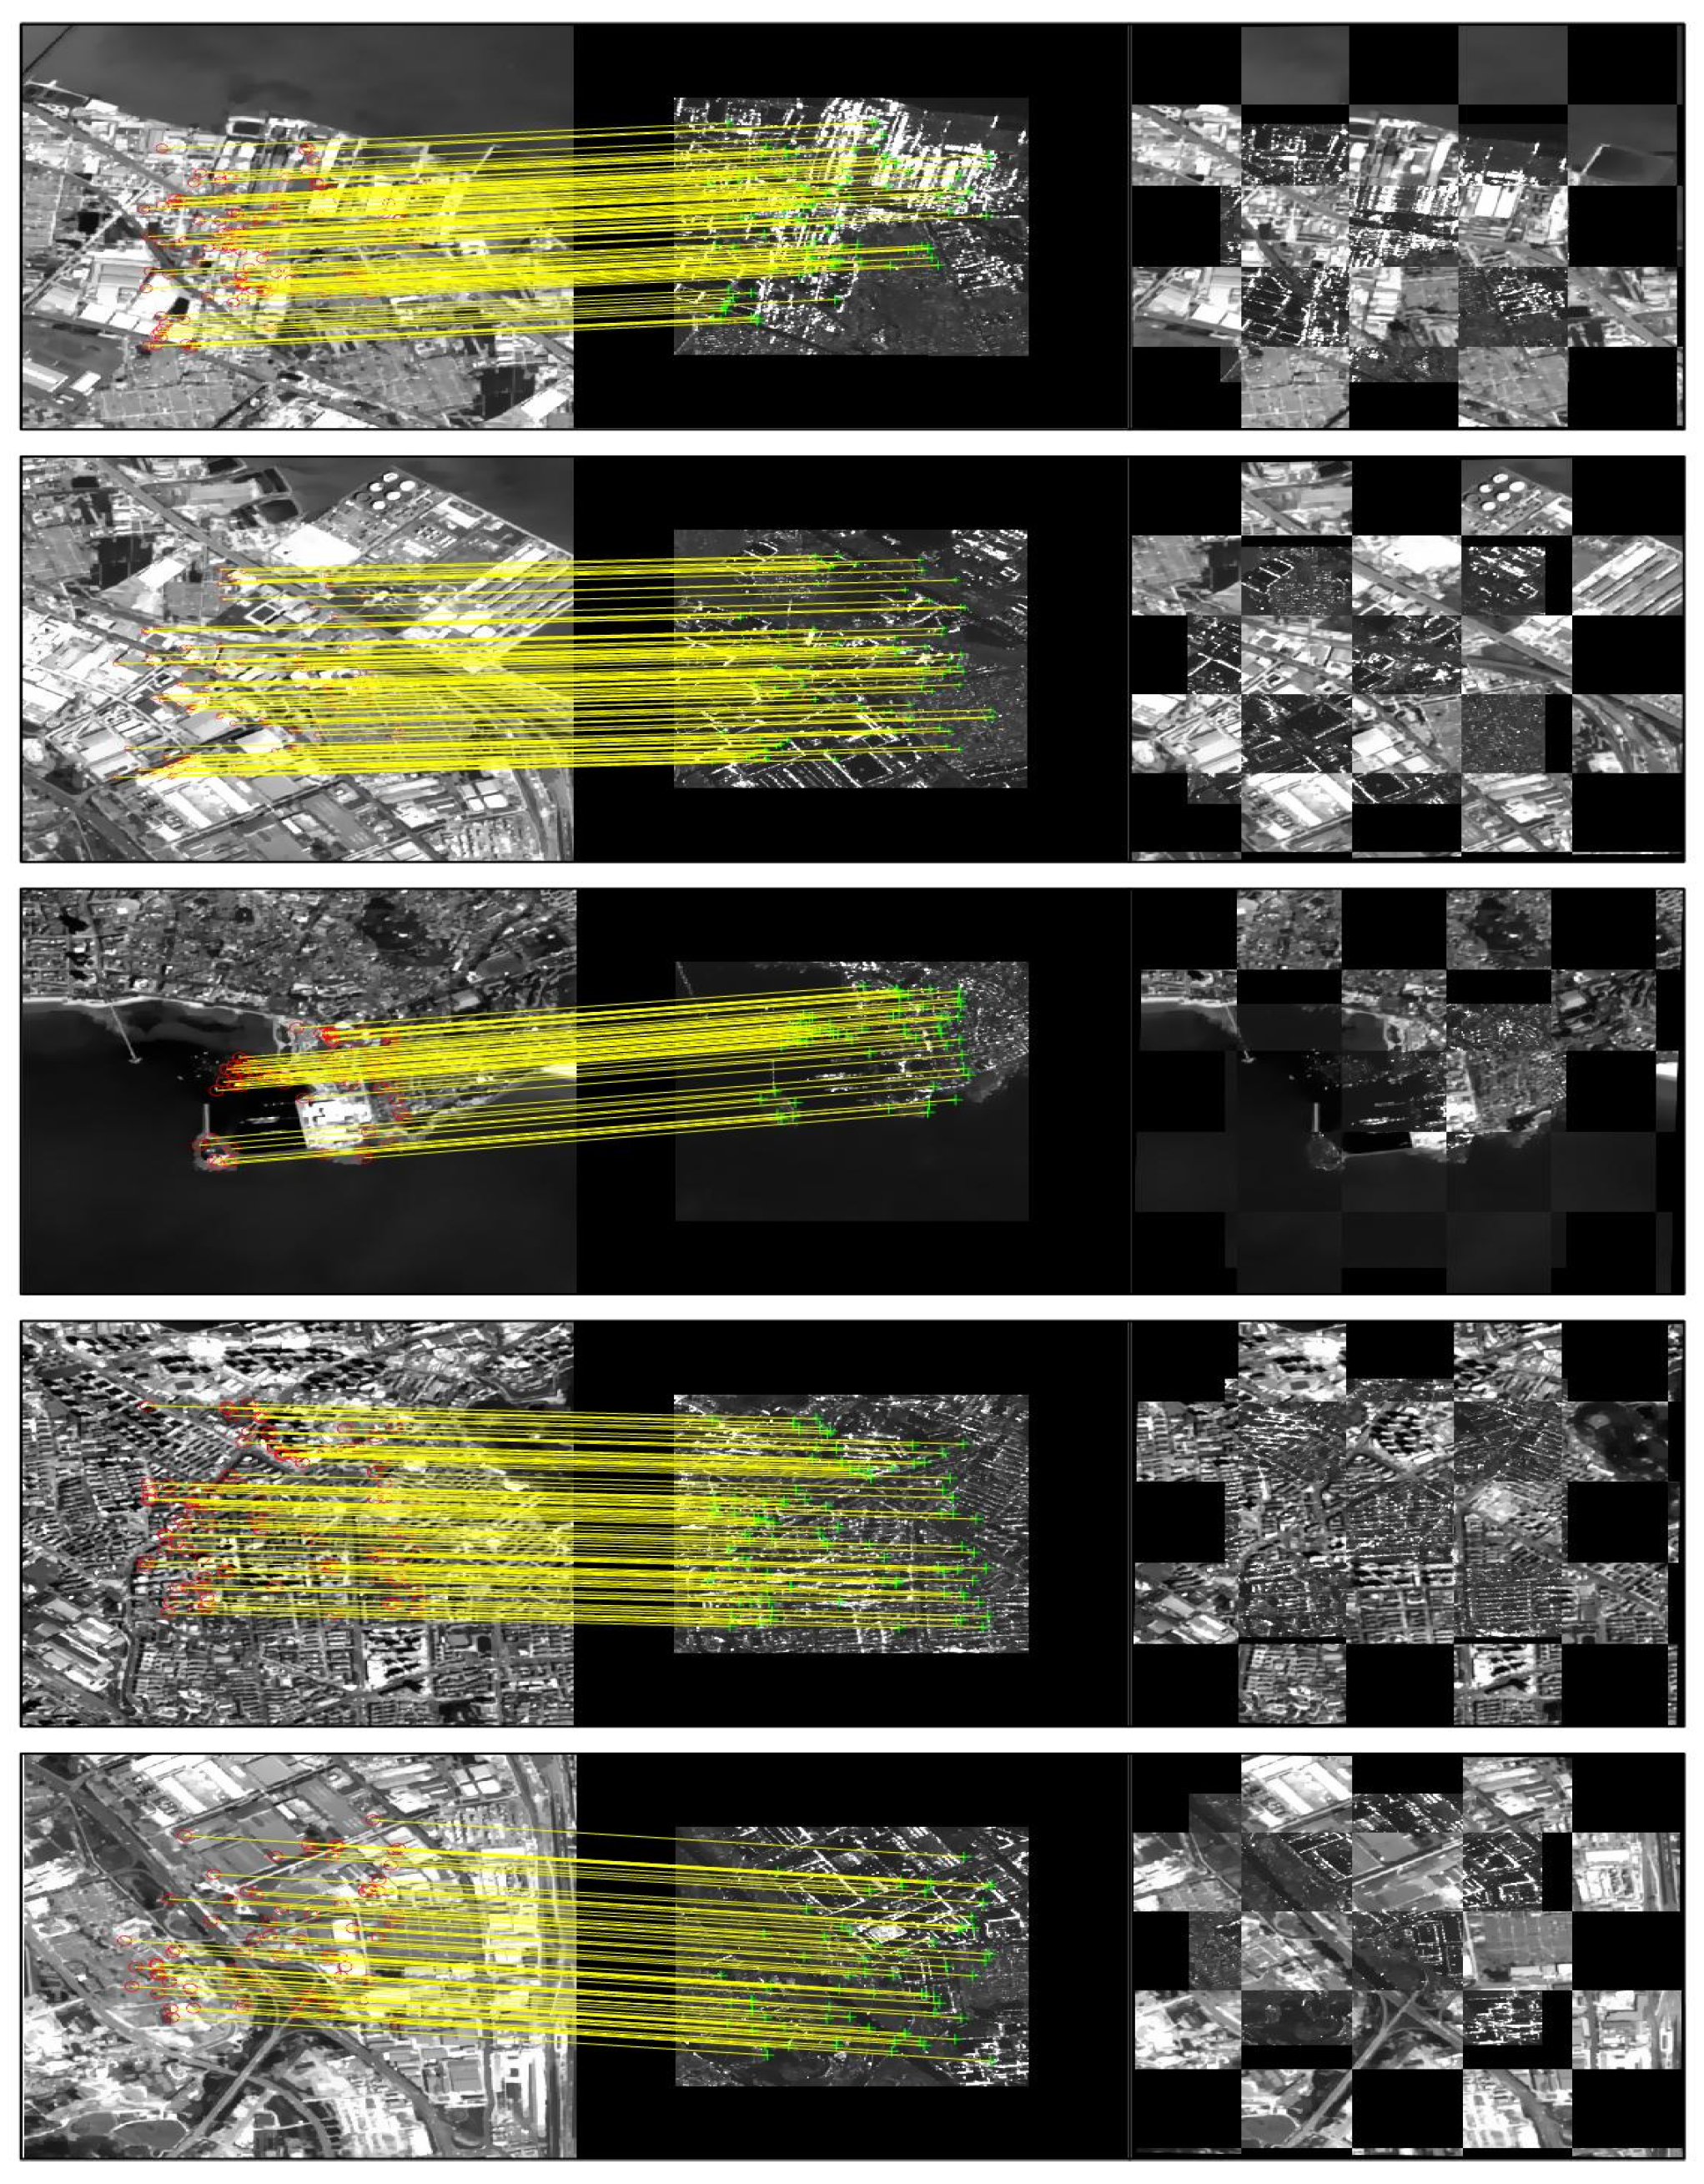
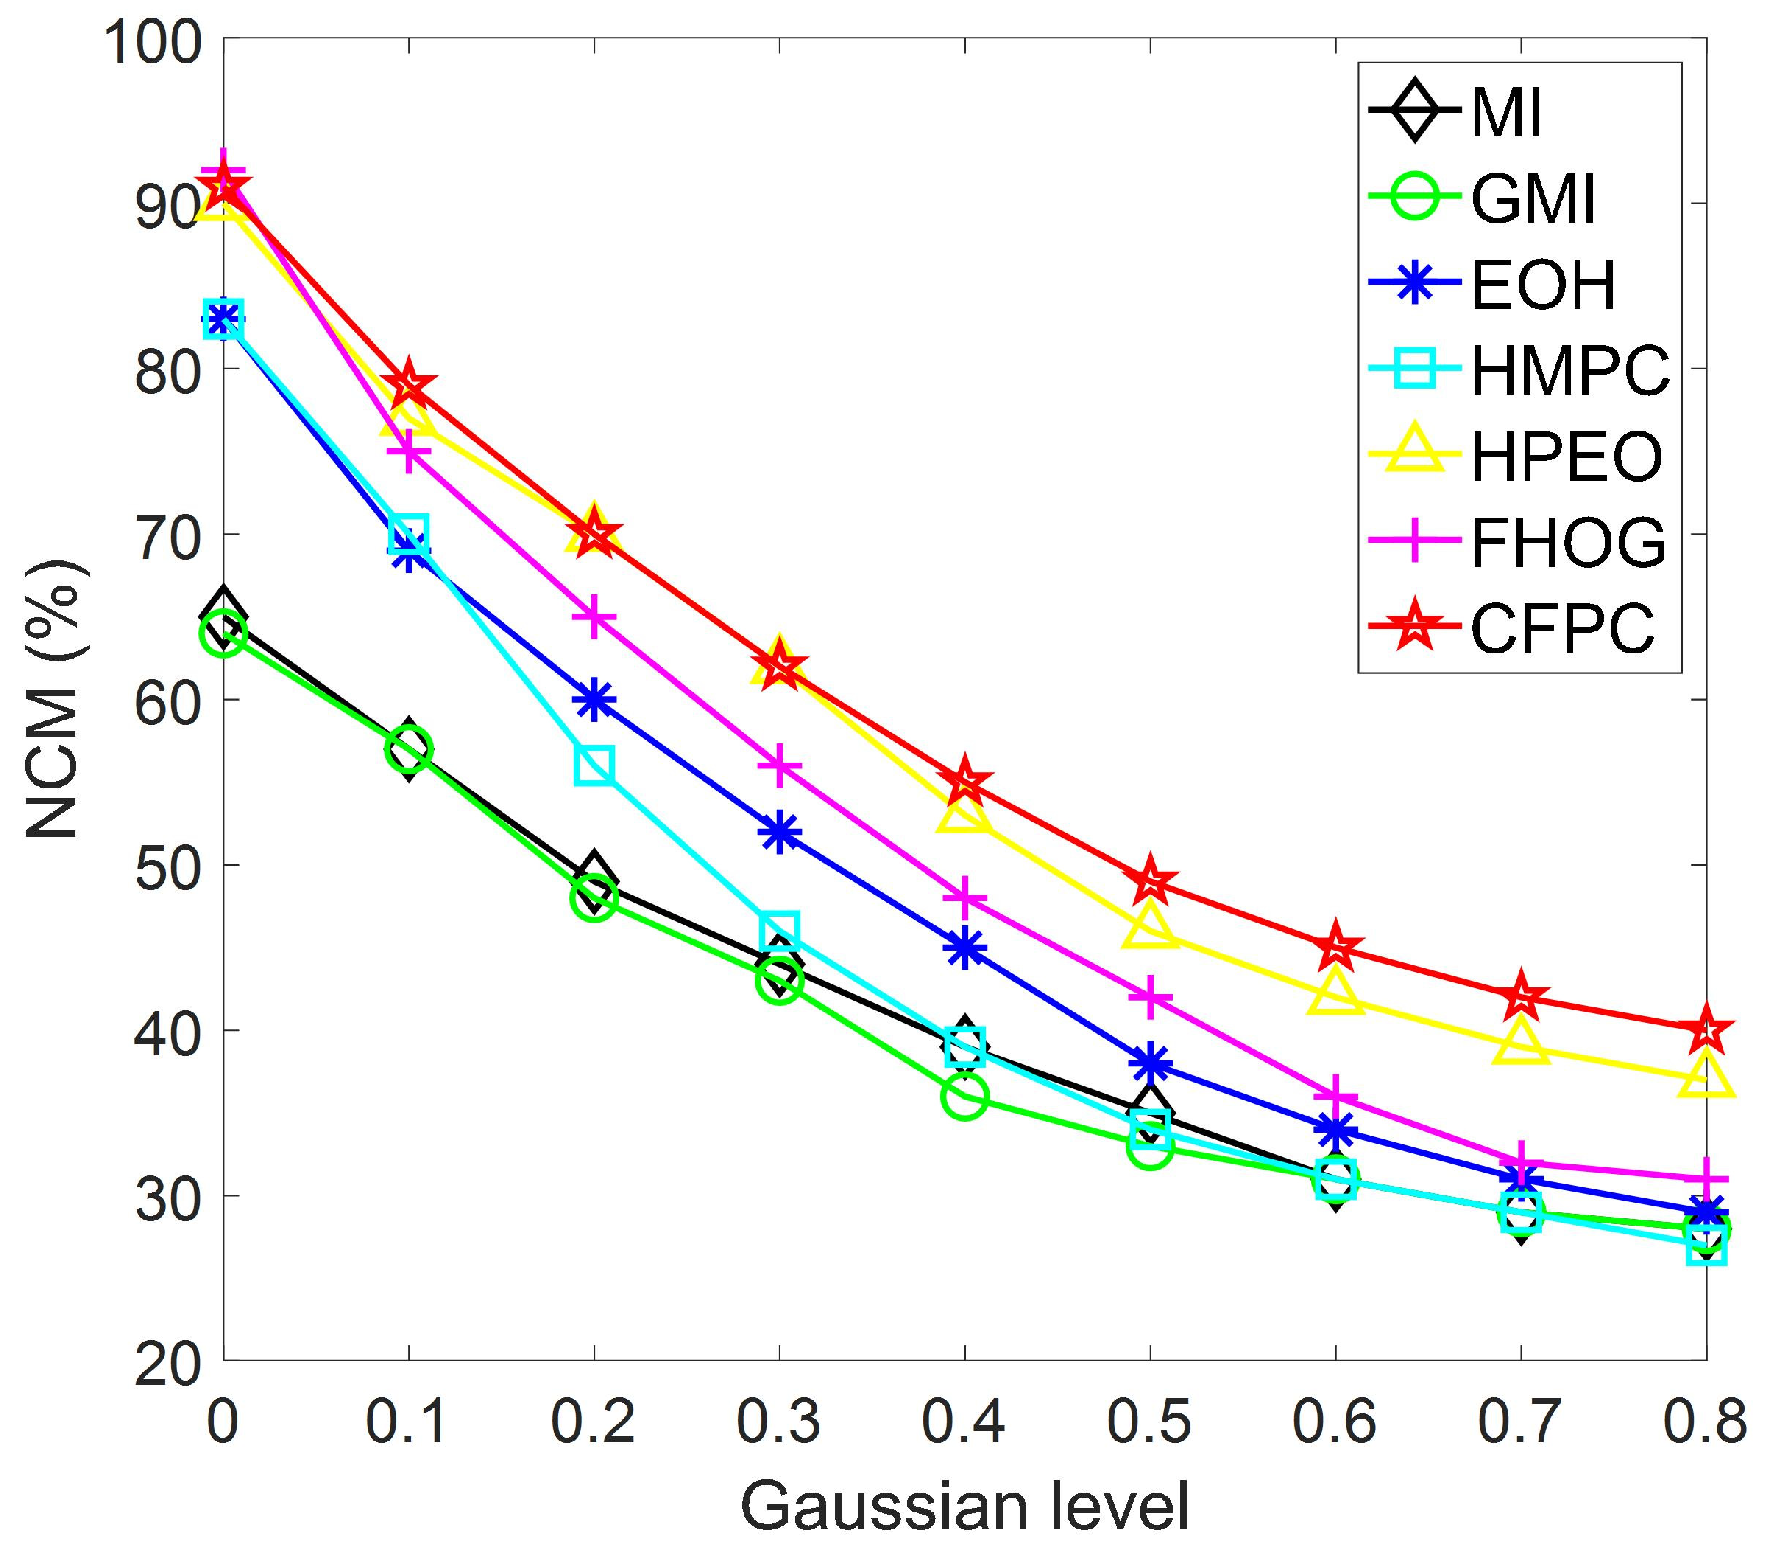
In previous studies, SAR images generally had more noise than other images due to imaging mechanisms and device interference, so it was challenging for them to achieve robust matching performance. Then, 40 pairs of SAR–visible images with various Gaussian noises were used in comparative experiments to verify the robustness of the proposed algorithm. As can be seen, Figure 9 shows the matching results of the proposed algorithm. In terms of visual effects, the matching results are very accurate. The detailed statistical results are shown in Figure 10 where MI and GMI achieve robust matching performance under changed noises, but their average precision is lower than EOH and HMPC. For similarity measures, the matching accuracy of proposed CFPC is significantly better than the other methods (MI, GMI, EOH, and HMPC), followed by HPEO and FHOG. Furthermore, compared to HPEO, the proposed CFPC, which constructs robust feature representation by integrating different types of local features, has reduced the influence of radiometric differences and achieved better matching performance in multi-source image matching.
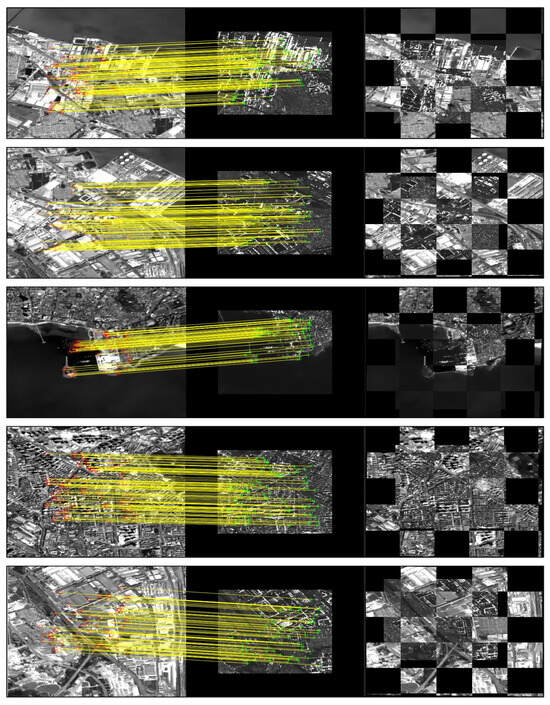
Figure 9.
Registration results of the proposed algorithm.
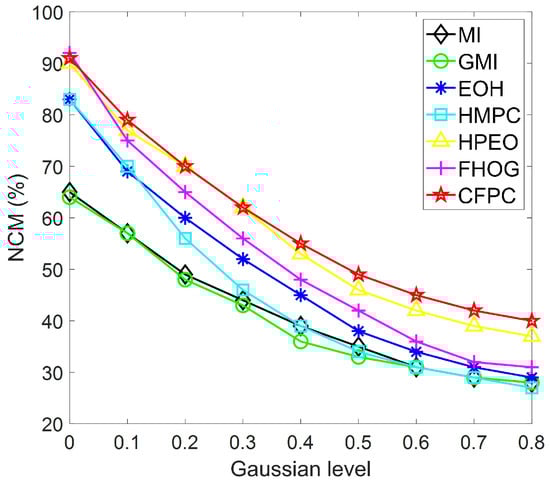
Figure 10.
Matching results with increasing noise.
4.4. Ablation Experiment
Finally, Table 2 reports the experimental results of average running time (RT) and precision under different template sizes (TS) and noise levels. The template size varies between 50 and 90 square patches, whereas the noise level from 0.1 to 0.7. The first group of experimental results shows the matching performance of the original algorithm (FHOG, HOPC, and HMPC), while the second group presents the performance of these descriptors using the proposed F-SSDA for similarity measurement. As the size of the template increases, the operation efficiency decreases. Similarly, as noise increases, the accuracy of all test results decreases. Using the F-SSDA algorithm to calculate the similarity of features in FHOG, HOPC, and HMPC, the average matching efficiency was improved by 52.4%, 88.6%, and 11.9%, respectively. Meanwhile, the average matching accuracy was improved by 3.2%, 5.2%, and 1.4%, respectively. In addition, the proposed algorithm achieves the highest computational efficiency and matching accuracy. Therefore, our method can effectively improve matching robustness by constructing a joint feature model, and the matching efficiency obtained through the F-SSDA algorithm is also significantly improved.
Table 2.
Ablation experiment.
5. Conclusions
This paper introduced the CFPC descriptor and the similarity measure F-SSDA for multi-source image matching. The CFPC extracts structural information from images using the oriented gradient and response intensity of phase congruency to produce robust local features and handles radiometric differences between multi-source images. The proposed CFPC is not only simple to combine but is also highly efficient and somewhat insensitive to noise and intensity changes. To enhance the matching efficiency, the Fast Sequential Similarity Detection Algorithm is proposed to perform the matching process. Experiments conducted with multi-source remote sensing datasets demonstrated that the proposed method outperformed state-of-the-art methods like MI, GMI, MIND, FHOG, HOPC, and FLSS.
Although the test results are encouraging, there is still some additional work to be done. For instance, there is significant deformation and inconsistent structural features between the reference image and the target image. Therefore, the deformation factor can be taken into account when calculating the similarity of phase congruency to solve the problem of multi-source image deformation.
Author Contributions
Conceptualization, Q.W.; validation, Q.W.; formal analysis, Q.W.; investigation, resources, Q.W.; data curation, Q.W.; writing—original draft preparation, Q.W. and Q.Y.; review and editing, Q.W. and Q.Y.; visualization, Q.W. and Q.Y.; funding acquisition, Q.Y. All authors have read and agreed to the published version of the manuscript.
Funding
This research was funded by the National Natural Science Foundation of China (62073161), the Startup Foundation for Introducing Talent of NUIST (2022r083, 2022r078), and the Natural Science Foundation of the Jiangsu Higher Education Institutions of China (23KJB510012).
Data Availability Statement
Data sharing not applicable.
Acknowledgments
The authors would like to thank Fenghe Lv from the Nanjing University for providing the test environment and open source code.
Conflicts of Interest
The authors declare no conflicts of interest.
References
- Li, R.; Gao, X.; Shi, F. Scale Effect of Land Cover Classification from Multi-Resolution Satellite Remote Sensing Data. Sensors 2023, 23, 6136. [Google Scholar] [CrossRef]
- Wang, C.; Xu, L.; Xu, R. Triple Robustness Augmentation Local Features for multi-source image registration. ISPRS J. Photogramm. Remote Sens. 2023, 199, 1–14. [Google Scholar] [CrossRef]
- Li, X.; Lyu, X.; Tong, Y. An object-based river extraction method via optimized transductive support vector machine for multi-spectral remote-sensing images. IEEE Access 2019, 7, 46165–46175. [Google Scholar] [CrossRef]
- Lati, A.; Belhocine, M.; Achour, N. Fuzzy correlation based algorithm for UAV image mosaic construction. Multimed. Tools Appl. 2024, 1, 3285–3311. [Google Scholar] [CrossRef]
- Hu, J.; Hu, P.; Wang, Z. Spatial dynamic selection network for remote-sensing image fusion. IEEE Geosci. Remote Sens. Lett. 2021, 19, 8013205. [Google Scholar] [CrossRef]
- Zhang, C.; Wang, L.; Cheng, S. SwinSUNet: Pure transformer network for remote sensing image change detection. IEEE Trans. Geosci. Remote Sens. 2022, 60, 5224713. [Google Scholar] [CrossRef]
- Pallotta, L.; Giunta, G.; Clemente, C. Subpixel SAR image registration through parabolic interpolation of the 2-D cross correlation. IEEE Trans. Geosci. Remote Sens. 2020, 58, 4132–4144. [Google Scholar] [CrossRef]
- Cole-Rhodes, A.; Johnson, L.; LeMoigne, J. Multiresolution registration of remote sensing imagery by optimization of mutual information using a stochastic gradient. IEEE Trans. Image Process. 2003, 12, 1495–1511. [Google Scholar] [CrossRef]
- Ye, Y.; Shan, J.; Bruzzone, L. Robust registration of multimodal remote sensing images based on structural similarity. IEEE Trans. Geosci. Remote Sens. 2017, 55, 2941–2958. [Google Scholar] [CrossRef]
- Wu, Q.; Zhu, S. Multispectral Image Matching Method Based on Histogram of Maximum Gradient and Edge Orientation. IEEE Geosci. Remote Sens. Lett. 2021, 19, 1–5. [Google Scholar] [CrossRef]
- He, H.; Chen, Z.; Liu, H.; Guo, Y.; Li, J. Practical Tracking Method based on Best Buddies Similarity. Cyborg Bionic Syst. 2023, 4, 50. [Google Scholar] [CrossRef]
- Ma, W.; Wu, Y.; Liu, S. Remote sensing image registration based on phase congruency feature detection and spatial constraint matching. IEEE Access 2018, 6, 77554–77567. [Google Scholar] [CrossRef]
- Ma, J.; Chan, C.; Canters, F. Fully automatic subpixel image registration of multiangle CHRIS/Proba data. IEEE Trans. Geosci. Remote Sens. 2010, 48, 2829–2839. [Google Scholar]
- Pluim, P.; Maintz, A. Image registration by maximization of combined mutual information and gradient information. In Proceedings of the Medical Image Computing and Computer-Assisted Intervention–MICCAI 2000: Third International Conference, Pittsburgh, PA, USA, 11–14 October 2000. [Google Scholar]
- Shechtman, E.; Irani, M.; Xu, R. Matching local self-similarities across images and videos. In Proceedings of the 2007 IEEE Conference on Computer Vision and Pattern Recognition, Minneapolis, MN, USA, 17–22 June 2007. [Google Scholar]
- Liu, J.; Zeng, G.; Fan, J. Fast local self-similarity for describing interest regions. Pattern Recognit. Lett. 2012, 33, 1224–1235. [Google Scholar] [CrossRef]
- Sedaghat, A.; Xu, L.; Xu, R. Distinctive order based self-similarity descriptor for multi-sensor remote sensing image matching. ISPRS J. Photogramm. Remote Sens. 2023, 108, 62–71. [Google Scholar] [CrossRef]
- Jenkinson, P.; Bhushan, M. MIND: Modality independent neighbourhood descriptor for multi-modal deformable registration. Med. Image Anal. 2012, 16, 1423–1435. [Google Scholar]
- Wu, Q.; Xu, G.; Cheng, Y. Robust and efficient multi-source image matching method based on best-buddies similarity measure. Infrared Phys. Technol. 2019, 101, 88–95. [Google Scholar] [CrossRef]
- Ye, Y.; Bruzzone, L.; Shan, J. Fast and robust matching for multimodal remote sensing image registration. IEEE Trans. Geosci. Remote Sens. 2019, 57, 9059–9070. [Google Scholar] [CrossRef]
- Lowe, D. Distinctive image features from scale-invariant keypoints. Int. J. Comput. Vis. 2004, 60, 91–110. [Google Scholar] [CrossRef]
- Rublee, E.; Rabaud, V.; Konolige, K. ORB: An efficient alternative to SIFT or SURFs. IEEE Comput. Soc. Conf. Comput. Vis. Pattern Recognit. 2011, 199, 2564–2571. [Google Scholar]
- Morel, M.; Yu, G. ASIFT: A new framework for fully affine invariant image comparison. SIAM J. Imaging Sci. 2009, 2, 438–469. [Google Scholar] [CrossRef]
- Dellinger, F.; Delon, J.; Gousseau, Y. SAR-SIFT: A SIFT-like algorithm for SAR images. IEEE Trans. Geosci. Remote Sens. 2014, 53, 453–466. [Google Scholar] [CrossRef]
- Sedaghat, A.; Ebadi, H. Remote sensing image matching based on adaptive binning SIFT descriptor. IEEE Trans. Geosci. Remote Sens. 2015, 53, 5283–5293. [Google Scholar] [CrossRef]
- Zhu, X.; Huang, Z.; Ding, M. Non-rigid multi-modal brain image registration based on two-stage generative adversarial nets. Neurocomputing 2022, 505, 44–57. [Google Scholar] [CrossRef]
- Fu, C.; Yuan, H.; Xu, H.; Zhang, H.; Shen, L. TMSO-Net: Texture adaptive multi-scale observation for light field image depth estimation. J. Vis. Commun. Image Represent. 2023, 90, 103731. [Google Scholar] [CrossRef]
- Tang, L.; Deng, Y.; Ma, Y. SuperFusion: A versatile image registration and fusion network with semantic awareness. IEEE/CAA J. Autom. Sin. 2022, 9, 2121–2137. [Google Scholar] [CrossRef]
- Yang, T.; Bai, X.; Cui, X. DAU-Net: An unsupervised 3D brain MRI registration model with dual-attention mechanism. Int. J. Imaging Syst. Technol. 2023, 33, 217–229. [Google Scholar] [CrossRef]
- Sun, J.; Shen, Z.; Wang, Y.; Bao, H.; Zhou, X. LoFTR: Detector-free local feature matching with transformers. In Proceedings of the IEEE/CVF Conference on Computer Vision and Pattern Recognition, Virtual Conference, 19–25 June 2021. [Google Scholar]
- Wu, Q.; Xu, G.; Cheng, Y. A deformed contour segment matching for multi-source images. Pattern Recognit. 2021, 117, 107968. [Google Scholar] [CrossRef]
- Meng, X.; Yang, G.; Yin, Y. Finger vein recognition based on local directional code. Sensors 2012, 12, 14937–14952. [Google Scholar] [CrossRef] [PubMed]
- Aguilera, C.; Barrera, F. Multispectral image feature points. Sensors 2012, 12, 12661–12672. [Google Scholar] [CrossRef]
- Wu, Q.; Xu, G.; Cheng, Y. Histogram of maximal point-edge orientation for multi-source image matching. Int. J. Remote Sens. 2020, 41, 5166–5185. [Google Scholar] [CrossRef]
- Ye, Y.; Shen, L. Hopc:A novel similarity metric based on geometric structural properties for multi-modal remote sensing image matching. ISPRS Ann. Photogramm. 2016, 3, 9–16. [Google Scholar]
- Wu, Q.; Li, H.; Zhu, S. Nonlinear intensity measurement for multi-source images based on structural similarity. Measurement 2021, 179, 109474. [Google Scholar] [CrossRef]


Disclaimer/Publisher’s Note: The statements, opinions and data contained in all publications are solely those of the individual author(s) and contributor(s) and not of MDPI and/or the editor(s). MDPI and/or the editor(s) disclaim responsibility for any injury to people or property resulting from any ideas, methods, instructions or products referred to in the content. |
© 2024 by the authors. Licensee MDPI, Basel, Switzerland. This article is an open access article distributed under the terms and conditions of the Creative Commons Attribution (CC BY) license (https://creativecommons.org/licenses/by/4.0/).