Article

Infrared Weak Target Detection in Dual Images and Dual Areas

School of Aerospace Science and Technology, Xidian University, Xi’an 710126, China
*
Author to whom correspondence should be addressed.
Remote Sens. 2024, 16(19), 3608; https://doi.org/10.3390/rs16193608
Submission received: 23 July 2024 / Revised: 11 September 2024 / Accepted: 24 September 2024 / Published: 27 September 2024

Abstract

:
This study proposes a novel approach for detecting weak small infrared (IR) targets, called double-image and double-local contrast measurement (DDLCM), designed to overcome challenges of low contrast and complex backgrounds in images. In this approach, the original image is decomposed into odd and even images, and the gray difference contrast is determined using a dual-neighborhood sliding window structure, enhancing target saliency and contrast by increasing the distinction between the target and the local background. A central unit is then constructed to capture relationships between neighboring and non-neighboring units, aiding in clutter suppression and eliminating bright non-target interference. Lastly, the output value is derived by extracting the lowest contrast value of the weak small targets from the saliency map in each direction. Experimental results on two datasets demonstrate that the DDLCM algorithm significantly enhances real-time IR dim target detection, achieving an average performance improvement of 32.83%. The area under the ROC curve (AUC) decline is effectively controlled, with a maximum reduction limited to 3%. Certain algorithms demonstrate a notable AUC improvement of up to 43.96%. To advance infrared dim target detection research, we introduce the IFWS dataset for benchmarking and validating algorithm performance.

1. Introduction

With advancements in infrared (IR) technology, IR target detection has expanded its use in military reconnaissance, surveillance, and security monitoring, owing to its resilience against external light interference, compact form, and high maneuverability [1]. IR weak small targets are a crucial area of IR technology, characterized by low contrast, a low signal-to-noise ratio, and a small target size. In practice, identifying targets like small uncrewed aerial vehicles at extended ranges, low-altitude helicopters, and vehicles with minimal thermal radiation frequently leads to high incidences of missed detections and false alarms. Thus, studying weak small IR targets in complex backgrounds can improve real-time intelligence, target tracking, and security alarms, improving detection capability and recognition [2,3,4].
Recent advancements in deep learning have also progressed IR small target detection. Researchers are not required to establish specific prior parameters to limit the algorithm. The deep network model autonomously learns key information from data features to detect targets meeting the criteria in the image [5,6]. Dai et al. [7] developed a hybrid model-driven deep learning approach for IR small target detection, integrating discriminant networks with conventional techniques to leverage both labeled data and domain expertise. The proposed network architecture incorporates feature map cyclic shifting and bottom–up attention adjustment, enhancing both the performance and efficiency of IR small target detection. Hou et al. [8] developed RISTDnet to enable the accurate and real-time detection of small IR targets, even in challenging environments with low signal-to-noise ratio. Unlike conventional algorithms, data-driven deep learning networks excel in processing small target detection. However, the effectiveness of this performance is significantly dependent on an extensive IR small target dataset. Nonetheless, obtaining adequate IR small target data is difficult, and acquiring more complex, weak small target data is even more challenging. Therefore, leveraging prior image knowledge has become a key approach to addressing weak IR small target detection challenges.
Recent advancements in small target research have been significant, particularly in single-frame IR target detection methods. Liu et al. [9] developed an IR small target detection method that utilizes a sparse representation of sky clutter interference targets. By simulating IR small target signals with generalized Gaussian intensity, the method effectively suppresses complex sky environments, but it suffers from poor real-time performance. It is challenging to meet practical application requirements. Peng et al. [10] introduced an IR small target detection algorithm that employs dual structural element morphological filtering combined with local Z score normalization to enhance performance, particularly in low signal-to-noise ratio conditions. Wu et al. [11] developed a rapid detection algorithm leveraging saliency and scale space, enhancing real-time performance; however, it requires improvements in detection rate for low signal-to-noise ratio. The aforementioned algorithms utilize scale space to enhance accuracy and robustness through multiscale image analysis. It allows the detection system to manage varying target sizes, incorporate contextual information, and improve the identification of small targets in complex backgrounds.
This study initially developed an IR weak small (IRWS) target image test dataset (IRWS), drawing from the Miss Detection versus False Alarm (MDFA) [12], Maritime-SIRST [13], NUDT-SIRST [14], and other datasets. Each image is precisely annotated to capture different IR scenarios, including various sky types, lighting conditions, and target sizes. The dataset comprises 100 real-world sky scene images, as illustrated in Figure 1. This dataset offers a high number of small target images and IR target images with lower contrast, ranging from 3% to 30%, compared to existing IR datasets.
Our research is primarily motivated by the challenges of detecting IR targets in complex backgrounds and under low-contrast conditions. We observed that current algorithms struggle to detect low-contrast IR targets effectively. This study focuses on IR dim small target detection using a dual-image, dual-region local contrast measurement algorithm within the scale space. The primary contributions are as follows:
  • We introduced a novel double-image and double-local contrast measurement (DDLCM) method for IR target detection. This approach utilizes a specialized similarity-focus design to significantly enhance the detection of weak small targets.
  • We devised a dual-neighborhood sliding window structure to amplify the difference between the target and the local background, thereby improving target saliency and contrast.
  • We released a test dataset of 100 real IR images of IRWS targets to advance the development of the detection method.
The remainder of this paper is structured as follows. Section 2 reviews related research. Section 3 describes the proposed methodology, and Section 4 includes the comparative and ablation experiments, results, and discussion. Finally, Section 5 concludes the study.

2. Related Works

The effective detection of weak small targets depends on enhancing image contrast and signal-to-noise ratio, enabling precise target extraction and recognition through sophisticated feature extraction and detection algorithms. Detection methods for weak IR targets are categorized into single-frame and multi-frame methods [15].

2.1. Methods Based on Multi-Frame Detection

Weak IR targets exhibit minimal grayscale variation over short periods, allowing for the use of prior information, such as small target motion trajectories, for target segmentation in IR images [16,17,18]. The most common methods for multi-frame IR moving small target detection are Detect Before Motion (DBM) and Motion Before Detection (MBD) [19]. DBM is a detection method that employs motion information in inter-frame sequences based on single-frame detection. This method filters out potential target regions, enabling the accurate identification of foreground targets and reducing false positives [20]. Liu et al. [21] addressed small-moving IR target detection as a multi-classification framework and introduced multi-layer convolutional features to counteract spatial information loss in thermal IR tracking, enhancing detection accuracy. Yi et al. [22] integrated several independent saliency methods to develop a rapid detection technique for weak IR targets, effectively enhancing small target visibility while minimizing background interference. In MBD, the target’s future position is determined by tracking its trajectory and aggregating motion energy across multiple frames. Jiao et al. [23] employed background prediction and higher-order statistic approaches to distinguish clutter from background in IR images, thereby enhancing detection accuracy. Zhang et al. [24] introduced the Quaternion discrete cosine transform (QDCT) to utilize salient regions from color feature detection for identifying weak IR targets, thereby maximizing the capture of target information in the image. Multi-frame processing methods typically outperform single-frame approaches. However, practical scenarios impose high real-time requirements, as IR technologies cannot provide high-speed imaging, thus limiting the number of usable images.

2.2. Methods Based on Single-Frame Detection

A small number of frames makes it difficult to develop motion models for trajectory prediction, which is central to multi-frame detection methods. Thus, enhancing the performance of single-frame methods has gained increased attention. Zhang et al. [25] integrate an enhanced top-hat transform and Gaussian differential filtering method. In this method, target candidate regions are identified using a Mexican hat distribution, with targets determined by maximum-intensity positioning. Local Contrast Method (LCM) [26] techniques leverage human visual characteristics and employ straightforward operations to facilitate the extraction of small targets. Wei et al. [27] introduced a multiscale patch-based contrast measure (MPCM) method, inspired by biological systems, to enhance target–background contrast and background clutter. Han et al. [28] introduced the Relative Local Contrast Measure (RLCM) method, which computes the RLCM for each pixel across multiple scales. This method enhances the contrast between the target and background while minimizing interference from various types of clutter. Pan et al. [29] employed a dual-layer diagonal grayscale contrast analysis mechanism. This mechanism leverages prior contrast information of small targets and performs effectively in diverse complex environments. Lin et al. [30] developed the Regional Bi-Neighborhood Saliency Map (RBNSM) algorithm for detecting weak small IR targets in complex backgrounds. This algorithm significantly mitigates the issues of low detection and high false alarm rates for weak small targets in complex backgrounds. Zhong et al. introduced the channel-space attention nested UNet (CSAN-UNet), which emphasizes channel-level adjustment and spatial attention mechanism to effectively extract deep semantic information pertinent to small IR targets. AIMED-Net [31] is a novel edge-computing method designed to improve IR small target detection on UAVs. This method features a multi-layer enhancement architecture that combines adversarial-based and detection-oriented networks to boost robustness and accuracy. Guo et al. [13] developed FCNet, an advanced convolutional network for detecting marine IR small ships. This network features feature enhancement, context fusion, and semantic fusion, along with squeeze-and-excitation blocks, to improve feature representation and context integration, thereby significantly enhancing detection accuracy.
These methods are effective with gradual changes in the IR background. Regardless, high-contrast edges persist in the presence of complex backgrounds or bright non-target interference. The missing detection rate is significantly high, particularly when small targets have low contrast with the backgrounds. This study presents a dual-image regional saliency map algorithm for detecting weak IR small targets. First, the original image is divided into similar images according to SF. Next, a diagonal grayscale contrast analysis mechanism is applied to enhance target contrast in the odd and even images while further suppressing background clutter interference. Subsequently, a method to enhance local patch contrast is employed to amplify the distinction between targets and their local backgrounds. This method is grounded in the proposed hypothesis that local contrast consistency outweighs global consistency. Ultimately, adaptive extraction methods achieve both efficiency and the accurate detection of weak IR small targets amidst complex backgrounds.

3. Methods

Figure 2 illustrates the DDLCM algorithm, which can be summarized into three key components. Similarity focus (SF) is used to decompose the original image into odd and even images, enhancing the algorithm’s adaptability to real-time requirements. Simultaneously, an enhanced layer sliding window structure is proposed to assess the contrast between the target and background, incorporating multi-frame image detection to evaluate contrast consistency in odd and even areas. Finally, salient features from the odd and even images are reconstructed to produce the final detection results. The DDLCM approach utilizes SF to analyze images from multiple angles without extra computational budget, leading to superior detection accuracy and real-time performance.

3.1. Construction of Similarity Focus

The human visual system (HVS) identifies targets by distinguishing them from the background using the human eye’s visual saliency regions [32,33,34]. If the IR target is surrounded by a low grayscale halo, it can produce an isolated saliency, regardless of its size. When the grayscale intensity difference between the target and local background is minimal, conventional algorithms modeled on the human visual system struggle to enhance target brightness and effectively suppress the background. This mechanism complicates the generation of isolated saliency. To address these issues, we divided the original IR image (I) into an odd image ( I o d d ) and an even image ( I e v e n ), as illustrated in Figure 3.
Extracting saliency maps separately from the odd and even images captures greater directional differences and leverages more local information. Moreover, the relationship between the odd and even images resembles that of two adjacent frames. The precise location in one image can be treated as continuous frames, allowing the introduction of temporal processing to single-frame IR images. This approach addresses issues like the inability of IR imaging technologies to achieve high-speed imaging and meet real-time requirements without increasing costs. Although reducing the target size to half may slightly impact detection accuracy, the HSV-based algorithm fundamentally aims to identify whether a low grayscale halo surrounds the target. The target size imposes fewer constraints. Since this strategy focuses on two images instead of focusing on the intersection one of a single image, and these two images have specific similarities, we call it SF. Notably, SF is a general module that is usable in different algorithms.

3.2. Dual-Image Grayscale Difference Contrast Calculation

This study uses a dual-layer sliding window structure for diagonal grayscale contrast (DLCM) to calculate the contrast features between the target and background. The odd and even images are individually traversed using a dual-layer sliding window, and the DLCM value of each pixel relative to the sliding window is computed simultaneously (Figure 4).
Each odd and even image includes 5 × 5 sub-windows, with 3 × 3 pixels and 1 × 1 pixels across the sub-windows of the odd and even images, respectively. This study selects a 1 × 1 pixel sub-window size of the image because averaging multiple contrast pixels does not enhance contrast when the target and background contrast is low. Conversely, this approach may reduce image contrast and missed detection. The difference d T , I i between the internal region grayscale contrast and the target grayscale contrast is expressed as
d T , I i = m t m I i if m 0 m I i > 0 0 else
m i = 1 N k = 1 N P k
where m t denotes the average gray value of the sub-window of the target, m i signifies the average gray value of each sub-window, i 1 , 2 , 3 , 4 , 5 , 6 , 7 , 8 , and N represents the number of pixels in each sub-window.
The difference d T , O i between the external regional grayscale contrast and the target grayscale contrast is expressed as
d T , O i = m t m O i if m 0 m O i > 0 0 else
The expression for calculating DLCM is
D L C M = min d T , I i × d T , I 9 i × min d T , O i
The minimum dot product of the diagonal grayscale contrast d T , I i and d T , I 9 i of sub-windows is the minimum value of the external region grayscale contrast measure.

3.3. Odd and Even Area Contrast Consistency

Given two images C t and C t + t , where t is the time interval between them, we assume that the difference between the odd image I o d d and the even image I e v e n is linearly related to the difference between C t and C t + t . The formula is expressed as
lim t 0 D C t , C t + t D I o d d , I e v e n
where D(a,b) denotes the difference between a and b. We incorporate pixel neighborhoods and an odd–even contrast consistency technique to elevate local contrast. According to Formula (7), the target’s relationship with its neighborhood in the odd image should be identical to its relationship in the even image. This weakens the effect of a single image and extracts more differentiated information from multiple directions to determine the target edge. The odd and salient maps are multiplied to eliminate noise clutter.
The correlation between the target and its neighborhood indicates that both the relationships between T and I i and between I i and O i are considered. For ease of reference, we denote the set of adjacent neighborhoods of I i as
Ψ = { I 1 , O 2 , O 16 , I 8 , I 2 , O 3 , I 1 , I 3 , I 3 , O 4 , O 6 , I 4 , I 4 , O 7 , I 5 , I 5 , O 8 , O 10 , I 6 , O 11 , I 7 , I 7 , O 12 , O 14 , I 8 , O 15 , I 7 }
where Ψ is a set. The elements in this set represent the four neighborhoods of sub-window I i but do not include the target sub-window.
The difference is determined as follows:
d I i , φ a = m i n ( I i φ a 0 , I i φ a 1 , I i φ a 2 )
φ a φ , a = 1 , 2 , 3 · · · 8 φ a b φ a , b = 1 , 2 , 3 o r 1 , 2
where φ a b represents the average brightness of the corresponding adjacent neighborhood unit. The target in the infrared image is weak, which results in low contrast between the local background and the target. To solve this issue, we use the neighborhood information of the filter window of the connected unit to propose the double-layer connected neighborhood saliency map (DNSM), which can not only weaken the effect of a single unit but also extract differentiated information from multiple directions, thereby establishing the target edge, as shown in Formula (9):
D N S M = m i n d T , I i d I i , φ a b
where d I i , φ a b represents the grayscale of the internal area and its four neighboring areas (excluding the target area T ). The minimum value of the difference between d I i , φ a b and d T , I i is taken as the output value DNSM of T . The value of the dual-image region and dual-layer local contrast measure at point x , y is defined by the Formula (12)
D D L C M o d d I o d d ( x , y ) = D L C M I o d d ( x , y ) × D N S M I o d d ( x , y )
D D L C M e v e n I e v e n ( x , y ) = D L C M I e v e n ( x , y ) × D N S M I e v e n ( x , y )
D D L C M x , y = D D L C M o d d D D L C M e v e n
The inverse operation of Figure 3 is denoted by ⊕ The sliding window processes each element individually to determine the relationship between the center point and its neighborhood. This process enhances the contrast between the target and background and reduces clutter, regardless of the number of targets. This method achieves effective detection results by relying exclusively on the grayscale relationship between individual pixels. Algorithm 1 provides a pseudocode summary of this strategy.
Algorithm 1 DDLCM area processing algorithm
Input: the IR image I, length parameter len
Output: result image L
 /*Initialization*/
 The size of the image is (R × C)
 Initialize window pixel line number n r × n c
 Filtered image = (R, C, nr × nc).
 Array op = l e n × n r , l e n × n c , n r × n c .
for (ii=1; ii<=nr×nc; ii++) do
      Create a per-cell binary filter mask.
      Normalize and transpose matrix and store it in op.
      Apply each filter from op to the input image.
end for
 Compute the inner window contrast d 1 .
 Determine the difference between each layer
 Find the minimum difference d 2 .
 Calculate the gray difference in various child areas
 Merge child areas and target areas for the minimum value d 3 .
 Calculate r e = d 1 . × d 2 . × d 3 .
return result image L

3.4. Infrared Detection DDLCM Framework

By integrating SF and the enhanced DLCM, the proposed DDLCM IR target detection algorithm yields several positive outcomes:
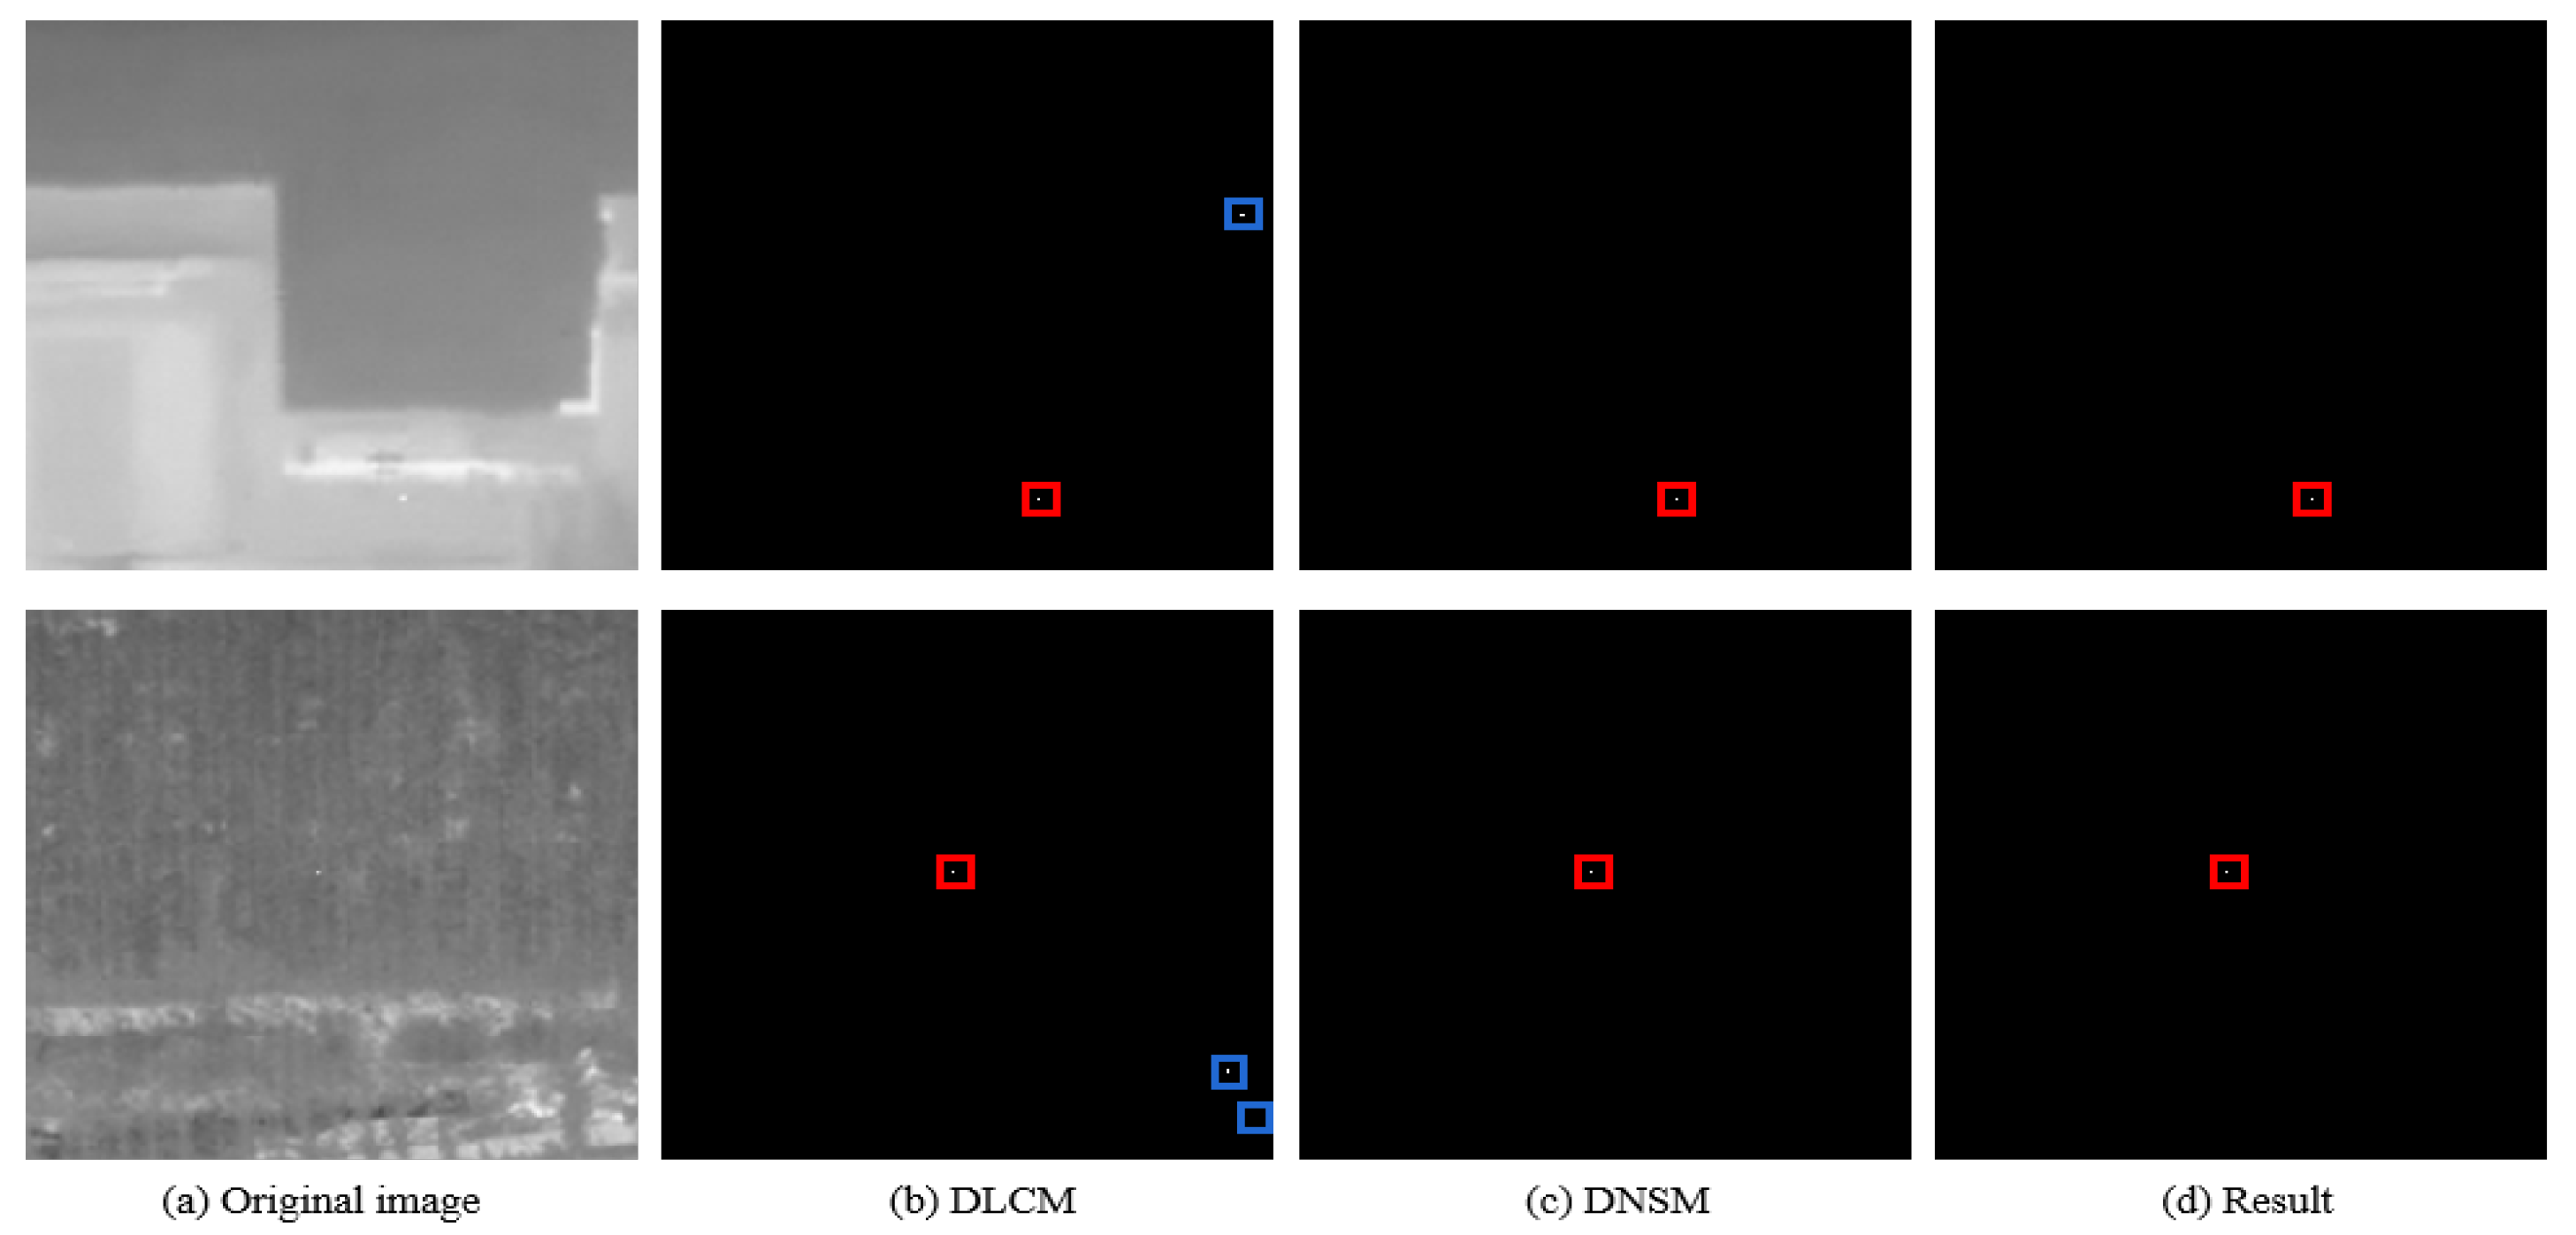
  • The SF strategy simplifies the algorithm and enhances multiscale analysis from various angles. However, due to inherent limitations, the target size must exceed 1 × 1 to avoid ambiguity between even and odd images.
  • The SF strategy captures a broader range of image contrast, enhancing the processing of targets with low contrast.
  • The DNSM strategy reveals relationships between different image patches, aiding in the detection of small IR targets.
  • This combination enhances target detection accuracy and requires fewer manual parameter adjustments, minimizing human intervention. Thus, setting appropriate values for each parameter in these two strategies is straightforward.
Overall, CONIC ensures both high computational efficiency and enhanced algorithm accuracy. It also demonstrates improved detection of small targets with weak contrast. Algorithm 2 provides a pseudocode summary of the framework.
Algorithm 2 DDLCM IR detection framework
Input: the image I2
Output: Combined result image L2
 /*Initialization*/
 The size of the image is (R2 × C2)
 initialize padding flags R f , C f
 /*Calculate padding size*/
for (x = rows or cols) do
      if (x is an odd number) then
           Assign the corresponding padding flags to 1
     end if
     for (i = 1; i<=(x - padding flags) ; i+=2) do
           Extract a subset of an image.
     end for
end for
 Use Algorithm 1 to obtain two result images L 1 and L 2 ;
 Merge L 1 and L 2 ;
return Combined result image L2

3.5. Target Adaptive Extraction

Following the DDLCM processing of the original IR image, the signal-to-noise ratio of the resulting salient map is significantly enhanced. At this point, the brightest part of the salient map corresponds to the target. Therefore, an adaptive threshold segmentation approach is employed to extract the target, with the threshold computation detailed in Formula (16):
T h = μ + λ × σ
where μ and σ denote the mean and standard deviation of the DDLCM significance map; λ signifies a hyperparameter. We refer to the value of paper [30] in the dataset and set the value of λ = 2 .

4. Experiments

To evaluate the algorithm’s real-time performance in this paper, tests were conducted on a desktop computer with a 3.20 GHz Intel Core i5-4570 processor, 8 GB of memory, and MATLAB R2023b.

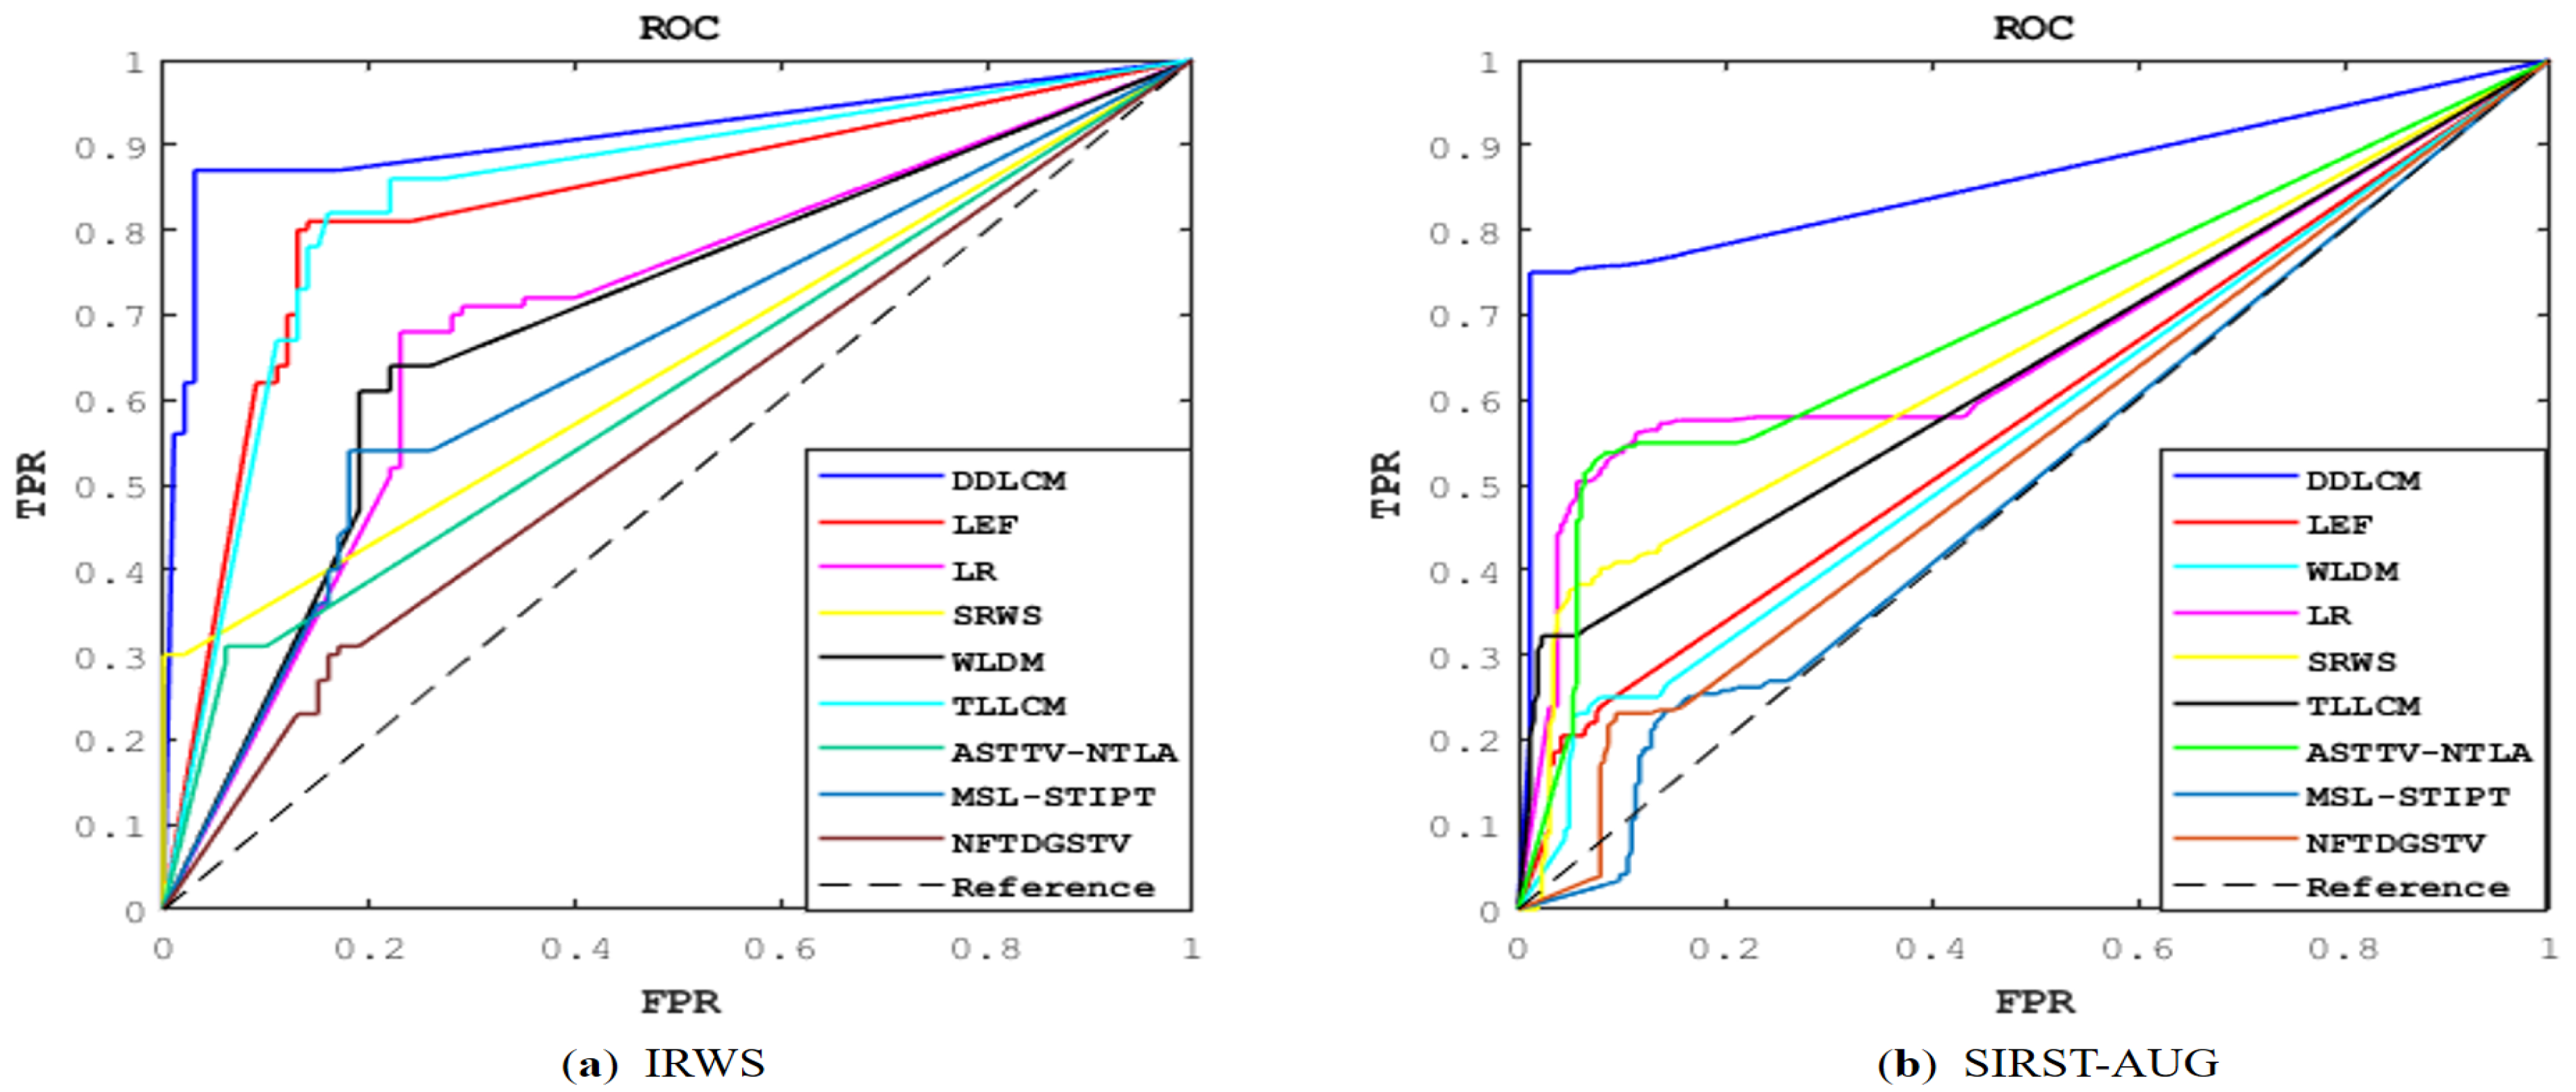
4.1. Evaluation Metrics

To assess the proposed method’s effectiveness, we tested DDLCM and other representative algorithms across various scenes and contrasts. We compared our method with state-of-the-art IRWS and SIRS-AUG [35]. The SIRS-AUG dataset comprises 8525 images, each sized 256 × 256. Each image contains 1–4 objects, with sizes ranging from 5 × 5 to 20 × 20. The test set comprises 264 images. SIRS-AUG includes 545 IR images. Additionally, a series of ablation studies were performed to validate the effectiveness of each DDLCM component.
This study employed three evaluation indicators: signal clutter ratio gain (SCRG) [36], background suppression factor (BSF), and algorithm real-time performance to evaluate all algorithms. SCRG evaluates target enhancement performance and is expressed as
S C R G = S C R out / S C R in
S C R = μ t μ b σ b
where S C R in and S C R out denote the SCR of the original image and the SCR of the separated target image, respectively, with the higher target SCR facilitating easier detection; μ t signifies the average pixel value of the target, and μ b and σ b represent the average pixel value and standard deviation of pixel values of the adjacent area around the target. BSF assesses the algorithm’s background suppression performance and is expressed as
B S F = σ i n σ o u t
where σ i n and σ o u t denote the grayscale standard deviation of background clutter in the input and output images. The higher SCRG and BSF values indicate better suppression of background, clutter, and noise.
To further assess the algorithm’s effectiveness, we also used precision (Prec) [37], recall (Rec) [37], F1-score [37], and AUC [37] as accuracy metrics.
Prec, Rec, and F1 are standard metrics for evaluating model accuracy in binary classification tasks. Prec represents the proportion of true positives (TPs) among all samples predicted as positive by the model. Rec represents the true positives among all samples labeled as positive. Prec and Rec are determined as follows:
P r e c = T P T P + F P
R e c = T P T P + F N
where FP denotes the number of samples that the model incorrectly predicts as positive categories; FP signifies the number of samples the model incorrectly predicts as negative categories. F1-score balances Prec and Rec, achieving high values only when both are high. Thus, a higher F1-score indicates stronger model performance [38,39]. The formula is as follows:
F 1 s c o r e = 2 × P r e c × R e c P r e c + R e c

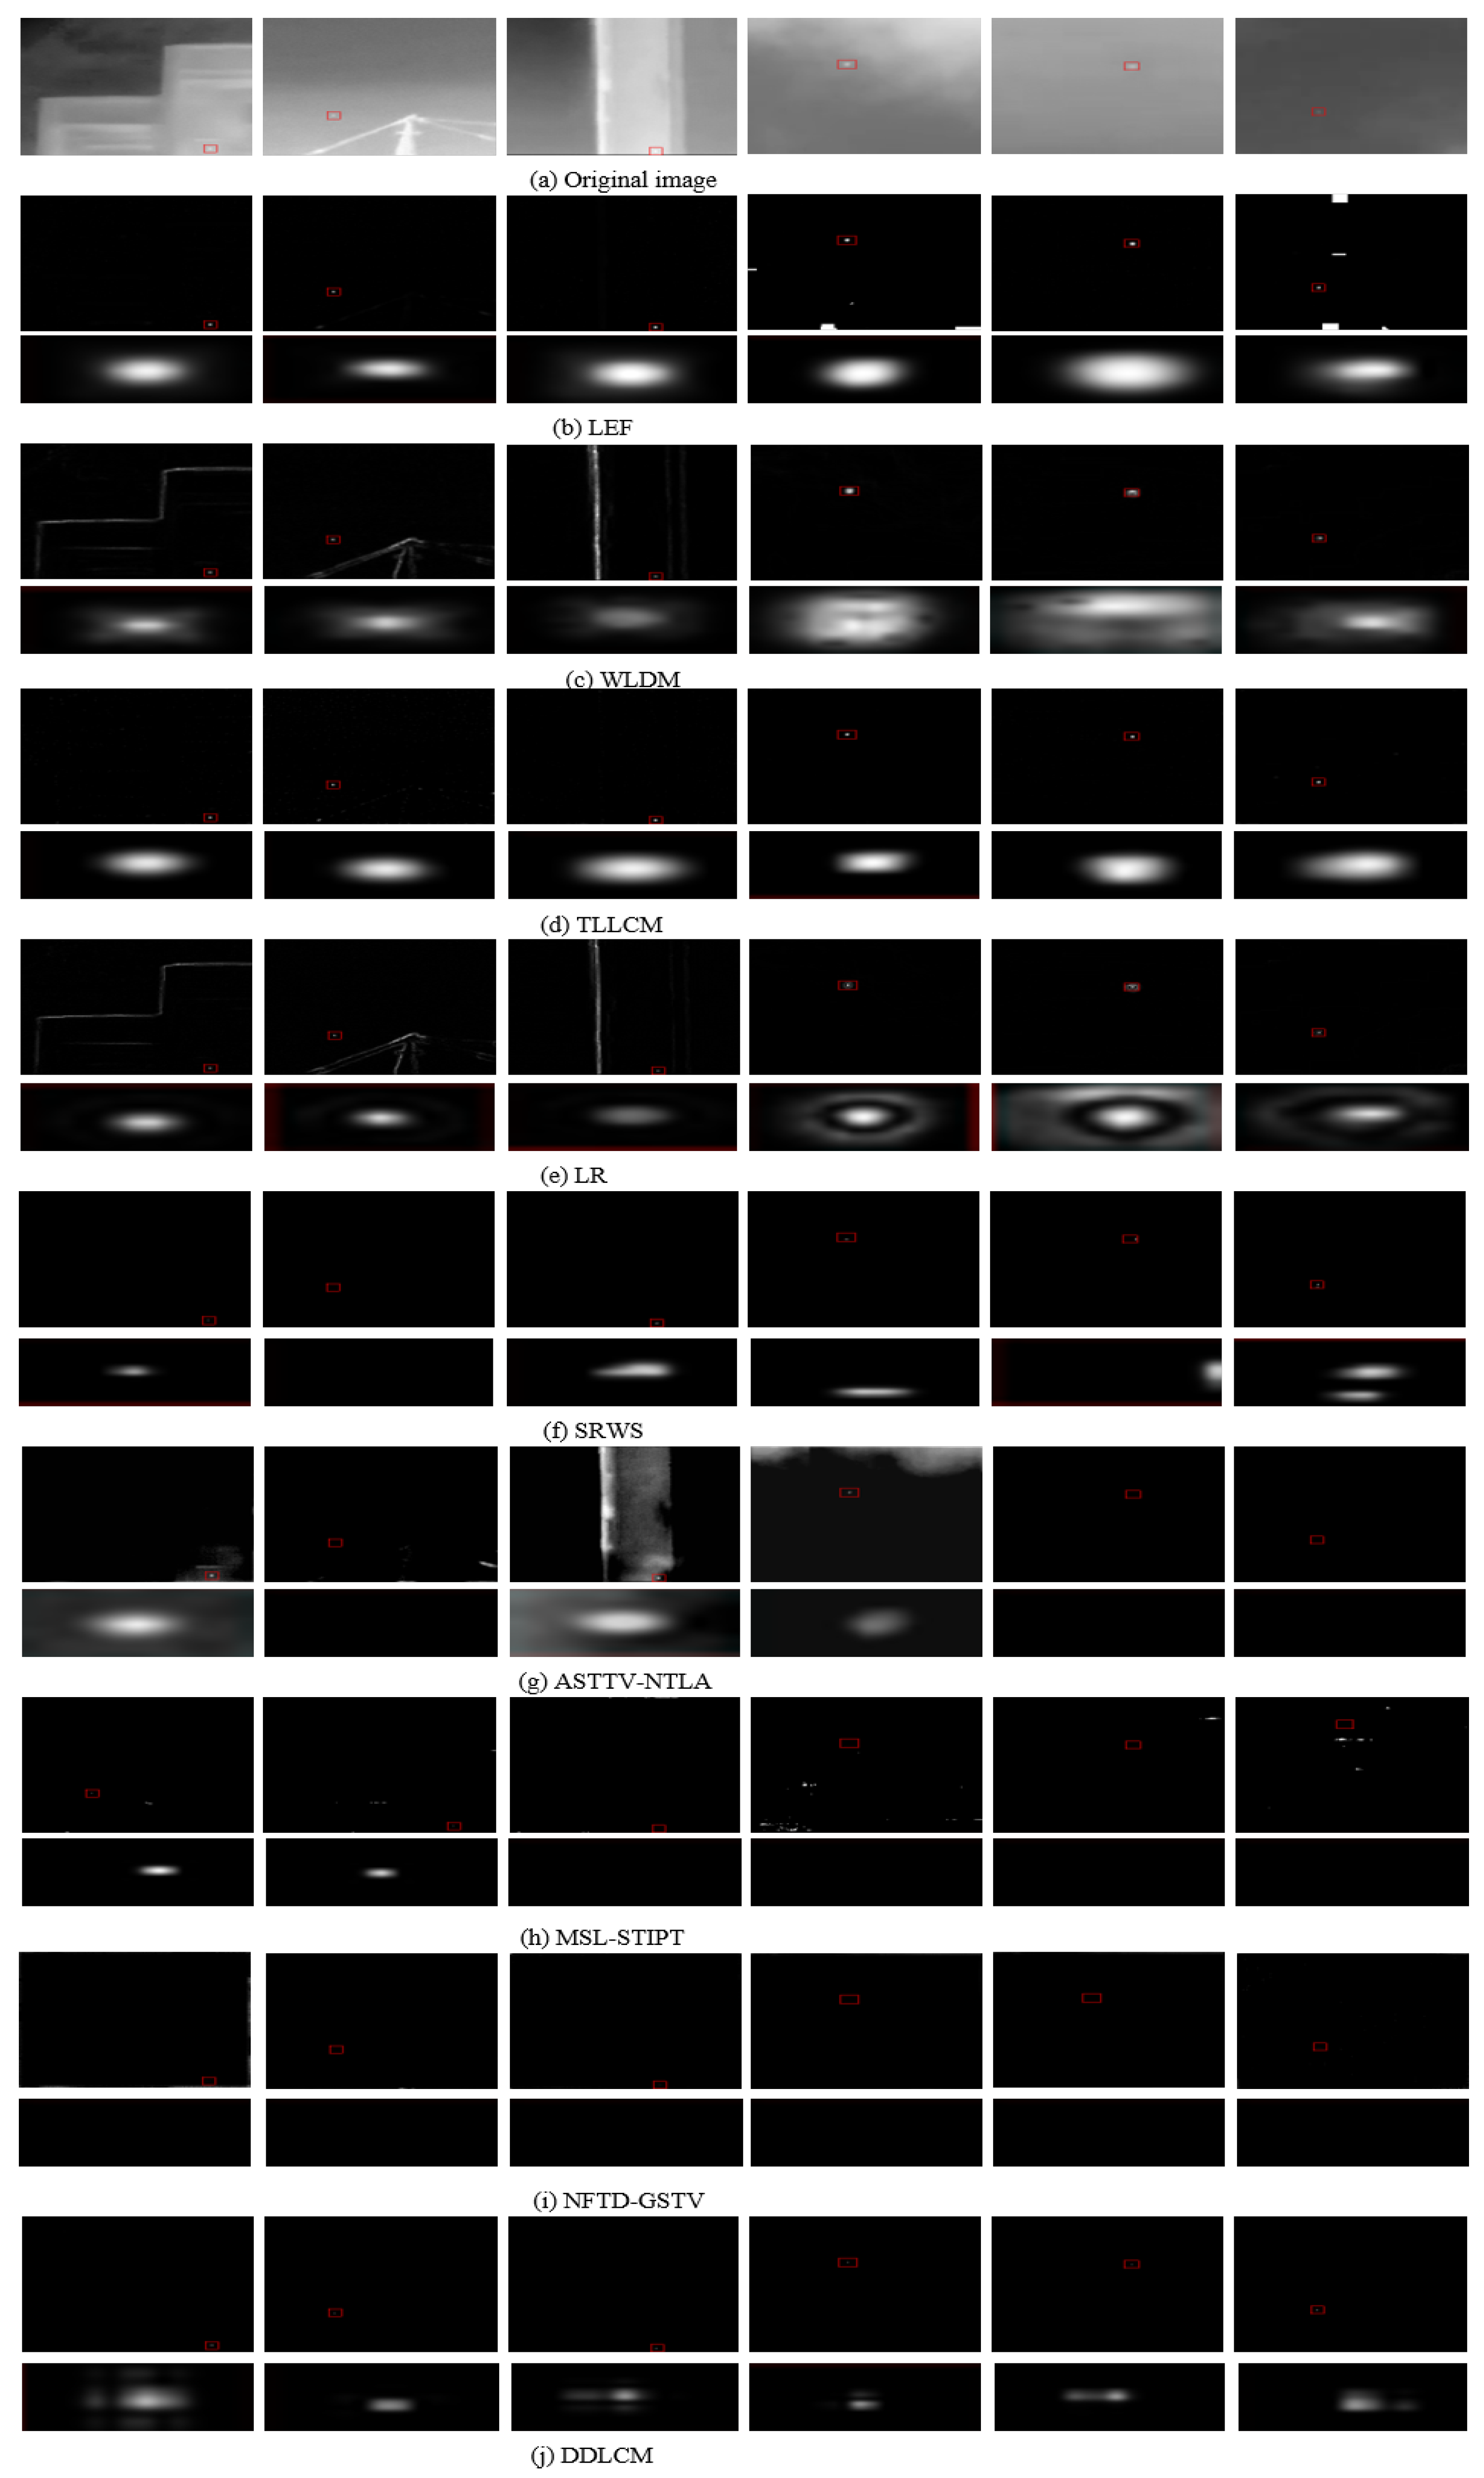
4.2. Qualitative Analysis

This study evaluated six groups of IR image sequences, as depicted in Figure 5. The features of the test images are illustrated in Table 1. We mainly focused on target size and contrast, with targets sized 3 × 3 and the contrast varying from 8% to 38%.
As illustrated in Figure 5, MPCM, ADMD, AMWLCM, LR, and RLCM algorithms were chosen for their effectiveness in detecting small IR targets in complex environments. However, images processed by these algorithms may still contain some residual background clutter and noise, impacting final target detection. All images have been standardized to the same scale.
Although contrast remains undefined, this study uses the Michelson contrast, defined as follows:
C M = L m a x L m i n L m a x + L m i n
where C M refers to the Michelson contrast; L m a x and L m i n correspond to the maximum and minimum brightness values in the image, respectively.
Ground1 and Ground2 are scenes with white patches and significant noise. High-brightness non-target interference, bright edges, and complex backgrounds generate numerous irrelevant candidate target points in the algorithm’s saliency map. However, our algorithm’s saliency map minimizes non-target interference, facilitating effective target extraction. Ground3 and Ground4 feature significant substantial building edge interference. Buildings and structures create a cluttered background, complicating the differentiation of small targets from surrounding objects and increasing the risk of false alarms and missed detections. This interference primarily impacts AWMLCM, LR, and RLCM. Ground5 and Ground6 feature faint targets obscured by the background. AWMLCM suppresses background clutter but produces numerous candidate targets in the saliency map.
Table 2 presents the SCRG and the BSF values for five methods across various complex IR scene images, with all optimal values marked in bold. Our method’s SCRG and BSF values are significantly higher than those of the other five comparative methods. For Ground2, our method’s SCRG value is 13.8 times higher than the highest value of other methods, demonstrating its superior target enhancement capability. For image d, our method’s BSF value is 37.9 times higher than the highest value of other methods, indicating superior background suppression capability. For Ground3, with an 8% target-background contrast, our method’s SCRG is 1.32 times and BSF value is 2.1 times higher than the maximum value of other methods, highlighting its advantage in low-contrast images. Our approach yields SCRG and BSF values that are 4.7 times and 11.6 times higher, respectively, than the maximum values of each Ground in various complex environments and contrast levels.
Table 3 demonstrates that the proposed SF and DNSM enhance the algorithm’s overall performance. Results from Exps. 1 and 2 highlight that, with SF, the F1-score, AUC, and runtime are 0.853, 0.894, and 0.0784, respectively. In comparison, DLCM with SF achieves a 20.64% improvement in the F1-score evaluation index, a 17.31% in the AUC, and a 3.92% reduction in runtime. This approach has significantly enhanced the F1-score and AUC while ensuring real-time performance. In Exps. 1 and 3, adding DLCM with DNSM further improved F1-score and AUC by 0.150 and 0.116, respectively. Exp. 4, which integrates all components, exhibits only a minor runtime increase of 0.0012 s while boosting the F1-score and AUC of DLCM by 24.30% and 19.84%, respectively. Our approach achieves the highest F1-score and AUC of 0.879% and 0.913%, respectively. Employing SF and DNSM with the same base algorithm effectively extracts more valuable data, significantly improving IR detection performance.
As shown in Figure 6, Figure 6b is DLCM, which extracts the regional double neighborhood saliency map based on the characteristics of the regional double neighborhood and the difference between the weak target and the background in multiple directions, while considering rich local information. Figure 6c is DNSM, which combines the grayscale of the internal region with the grayscale of its four neighboring regions, weakens the effect of a single unit, and increases the difference in features between the target and the background. DLCM and DNSM are point-multiplied to further remove clutter noise and increase the gap between the weak target and the local background.
From Table 4, DDLCM outperforms other algorithms with precision, recall, and F1-scores of 0.8878, 0.87, and 0.8788, respectively. Compared with the second-best algorithm (TLLCM), DDLCM significantly improved by 7.93% in AUC, 1.16% in recall, and 6.78% in F1-score. Most notably, DDLCM’s runtime of 0.0894 s is 88.67 times faster than LEF’s 7.2707 s, making it particularly suitable for applications requiring a rapid response. DDLCM achieved a significant improvement of 4.09% in precision compared to the suboptimal algorithm.
Figure 7 illustrates that the proposed DDLCM (Figure 7h) provides superior detection performance. It addresses the instability of WLDM and LR in handling low-contrast images, where these algorithms struggle to eliminate interference. SRWS and ASTTV-NTLANA also perform poorly with small target images. While TLLCM achieves better detection results, its runtime is at least twice that of the proposed DDLCM. Beyond the seed reallocation strategy, DDLCM utilizes contour prior for distance measurement, yielding excellent visual results across two different datasets. It effectively reduces image noise interference and maintains stable detection accuracy.
Table 5 shows that DDLCM demonstrates exceptional performance. Although its Prec was marginally below the highest score, DDLCM excelled in key metrics, achieving an AUC, Rec, and F1-score of 0.86, 0.75, and 0.7543, respectively. These results establish DDLCM as the best-performing algorithm across all evaluated criteria. Furthermore, ROC curves constructed from the experimental data in the SIRS-AUG and IRWS datasets are illustrated in Figure 8.
To assess the impact of SF in the algorithm, we conducted experiments incorporating SF into various algorithms. As shown in Table 6, algorithms with SF experience an average runtime improvement of 32.83%. However, excluding MSL-STIPT and NFTD-GSTV, the average AUC decreases by about 3%.
For ASTTV-NTLA, MSL-STIPT, and NFTD-GSTV while the runtime average reduces by 52.29%, 13.40 %, and 54.05%, the AUC average reduces by 19.17%, 4.25%, and 17.1%. This decline is attributed to ASTTV-NTLA, MSL-STIPT, and NFTD-GSTV, which adaptively assign weights to different singular values through non-convex tensor low-rank approximation. Integrating SF can disrupt these singular values obtained by the algorithm, impairing the algorithm’s global optimization capabilities and reducing background estimation accuracy. In contrast, WLDM focuses primarily on local contrast with minimal reliance on global information, yielding an 8.12% increase in AUC and a 33.07% increase in runtime. Overall, SF enhances the processing of local information and benefits algorithms that depend on local data for IR target detection. However, for algorithms that rely on global information, SF may inhibit their performance improvements. The ROC curves of the algorithm before and after incorporating SF are presented in Figure 9.

5. Conclusions

This study proposed a novel approach for detecting weak, small IR targets in complex backgrounds and low-contrast environments. The method decomposes the image into odd and even components to capture more directional differences and utilize additional local information. It then employs a dual-neighborhood-focused gray difference contrast measurement, using a dual-neighborhood sliding window structure that spans the typical scale range of small targets within a single scale. This mechanism allows for the simultaneous detection of targets across small, large, and very large scales. Four saliency maps are extracted, with the minimum contrast value from each direction serving as the output value, enhancing the accuracy of detecting low-contrast IR small targets. While SF reduces the algorithm’s runtime, it may lead to a minor loss of global information, slightly decreasing accuracy in actual operation. The dual-image grayscale difference contrast computation introduces some computational complexity, but this study significantly reduces it without sacrificing performance. When applied to multi-frame IR detection, this approach effectively addresses the challenges of detecting low-contrast IR small targets in complex environments.

Author Contributions

Conceptualization, Y.Y. and B.G.; methodology, J.Z.; software, W.C.; validation, W.C., Y.Y. and J.Z.; formal analysis, J.Z.; investigation, J.Z.; resources, W.C.; data curation, W.C.; writing—original draft preparation, J.Z.; writing—review and editing, B.G.; visualization, Y.Y.; supervision, B.G. and Y.Y.; project administration, B.G. and Y.Y.; funding acquisition, B.G. and Y.Y. All authors have read and agreed to the published version of the manuscript.

Funding

This research was funded by the National Natural Science Foundation of China (No. 62171341).

Data Availability Statement

The data presented in this study are openly available in SIRST-AUG (https://github.com/Tianfang-Zhang/AGPCNet, accessed on 7 July 2021) at arXiv:2111.03580.

Acknowledgments

The authors would like to thank the reviewers and editors for their valuable suggestions and comments, which enhanced the quality of this manuscript.

Conflicts of Interest

The authors declare no conflicts of interest.

References

  1. Guan, X.; Zhang, L.; Huang, S.; Peng, Z. Infrared small target detection via non-convex tensor rank surrogate joint local contrast energy. Remote Sens. 2020, 12, 1520. [Google Scholar] [CrossRef]
  2. Ahmadi, K.; Salari, E. Small dim object tracking using frequency and spatial domain information. Pattern Recognit. 2016, 58, 227–234. [Google Scholar] [CrossRef]
  3. Lu, R.; Yang, X.; Li, W.; Fan, J.; Li, D.; Jing, X. Robust infrared small target detection via multidirectional derivative-based weighted contrast measure. IEEE Geosci. Remote Sens. Lett. 2020, 19, 7000105. [Google Scholar] [CrossRef]
  4. Li, Y.; Li, Z.; Guo, Z.; Siddique, A.; Liu, Y.; Yu, K. Infrared small target detection based on adaptive region growing algorithm with iterative threshold analysis. IEEE Trans. Geosci. Remote Sens. 2024. [Google Scholar] [CrossRef]
  5. LeCun, Y.; Bengio, Y.; Hinton, G. Deep learning. Nature 2015, 521, 436–444. [Google Scholar] [CrossRef] [PubMed]
  6. Kamilaris, A.; Prenafeta-Boldú, F.X. Deep learning in agriculture: A survey. Comput. Electron. Agric. 2018, 147, 70–90. [Google Scholar] [CrossRef]
  7. Dai, Y.; Wu, Y.; Zhou, F.; Barnard, K. Attentional local contrast networks for infrared small target detection. IEEE Trans. Geosci. Remote Sens. 2021, 59, 9813–9824. [Google Scholar] [CrossRef]
  8. Hou, Q.; Wang, Z.; Tan, F.; Zhao, Y.; Zheng, H.; Zhang, W. RISTDnet: Robust infrared small target detection network. IEEE Geosci. Remote Sens. Lett. 2021, 19, 7000805. [Google Scholar] [CrossRef]
  9. Liu, D.; Li, Z.; Liu, B.; Chen, W.; Liu, T.; Cao, L. Infrared small target detection in heavy sky scene clutter based on sparse representation. Infrared Phys. Technol. 2017, 85, 13–31. [Google Scholar] [CrossRef]
  10. Peng, L.; Lu, Z.; Lei, T.; Jiang, P. Dual-Structure Elements Morphological Filtering and Local Z-Score Normalization for Infrared Small Target Detection against Heavy Clouds. Remote Sens. 2024, 16, 2343. [Google Scholar] [CrossRef]
  11. Qiang, W.; Hua-Kai, L. An Infrared Small Target Fast Detection Algorithm in the Sky Based on Human Visual System. In Proceedings of the 2018 4th Annual International Conference on Network and Information Systems for Computers (ICNISC), Wuhan, China, 19–21 April 2018; IEEE: Piscataway, NJ, USA, 2018; pp. 176–181. [Google Scholar]
  12. Wang, H.; Zhou, L.; Wang, L. Miss detection vs. false alarm: Adversarial learning for small object segmentation in infrared images. In Proceedings of the IEEE/CVF International Conference on Computer Vision, Seoul, Republic of Korea, 27 October–2 November 2019; pp. 8509–8518. [Google Scholar]
  13. Guo, F.; Ma, H.; Li, L.; Lv, M.; Jia, Z. FCNet: Flexible Convolution Network for Infrared Small Ship Detection. Remote Sens. 2024, 16, 2218. [Google Scholar] [CrossRef]
  14. Li, B.; Xiao, C.; Wang, L.; Wang, Y.; Lin, Z.; Li, M.; An, W.; Guo, Y. Dense Nested Attention Network for Infrared Small Target Detection. IEEE Trans. Image Process. 2022, 32, 1745–1758. [Google Scholar] [CrossRef]
  15. Li, J.H.; Zhang, P.; Wang, X.W.; Huang, S.Z. Infrared small-target detection algorithms: A survey. J. Image Graph. 2020, 25, 1739–1753. [Google Scholar]
  16. Rogalski, A. Infrared detectors: An overview. Infrared Phys. Technol. 2002, 43, 187–210. [Google Scholar] [CrossRef]
  17. Barth, A. Infrared spectroscopy of proteins. Biochim. Biophys. Acta-(BBA)-Bioenerg. 2007, 1767, 1073–1101. [Google Scholar] [CrossRef]
  18. Rogalski, A. Recent progress in infrared detector technologies. Infrared Phys. Technol. 2011, 54, 136–154. [Google Scholar] [CrossRef]
  19. Jiang, A.; Kennedy, D.N.; Baker, J.R.; Weisskoff, R.M.; Tootell, R.B.; Woods, R.P.; Benson, R.R.; Kwong, K.K.; Brady, T.J.; Rosen, B.R. Motion detection and correction in functional MR imaging. Hum. Brain Mapp. 1995, 3, 224–235. [Google Scholar] [CrossRef]
  20. Morgan, M.J. Spatial filtering precedes motion detection. Nature 1992, 355, 344–346. [Google Scholar] [CrossRef] [PubMed]
  21. Liu, Q.; Lu, X.; He, Z.; Zhang, C.; Chen, W.S. Deep convolutional neural networks for thermal infrared object tracking. Knowl.-Based Syst. 2017, 134, 189–198. [Google Scholar] [CrossRef]
  22. Xiang, Y.I.; Wang, B. Fast infrared and dim target detection algorithm based on multi-feature. Acta Photonica Sin. 2017, 46, 610002. [Google Scholar] [CrossRef]
  23. Jiao, J.; Lingda, W. Infrared dim small target detection method based on background prediction and high-order statistics. In Proceedings of the 2017 2nd International Conference on Image, Vision and Computing (ICIVC), Chengdu, China, 2–4 June 2017; IEEE: Piscataway, NJ, USA, 2017; pp. 53–57. [Google Scholar]
  24. Zhang, P.; Wang, X.; Wang, X.; Fei, C.; Guo, Z. Infrared small target detection based on spatial-temporal enhancement using quaternion discrete cosine transform. IEEE Access 2019, 7, 54712–54723. [Google Scholar] [CrossRef]
  25. Zhang, Y.; Zheng, L.; Zhang, Y. Small infrared target detection via a Mexican-Hat distribution. Appl. Sci. 2019, 9, 5570. [Google Scholar] [CrossRef]
  26. Chen, C.P.; Li, H.; Wei, Y.; Xia, T.; Tang, Y.Y. Alocal contrast method for small infrared target detection. IEEE Trans. Geosci. Remote Sens. 2014, 52, 574–581. [Google Scholar] [CrossRef]
  27. Wei, Y.; You, X.; Li, H. Multiscale patch-based contrast measure for small infrared target detection. Pattern Recognit. 2016, 58, 216–226. [Google Scholar] [CrossRef]
  28. Han, J.; Liang, K.; Zhou, B.; Zhu, X.; Zhao, J.; Zhao, L. Infrared small target detection utilizing the multiscale relative local contrast measure. IEEE Geosci. Remote Sens. Lett. 2018, 15, 612–616. [Google Scholar] [CrossRef]
  29. Pan, S.D.; Zhang, S.; Zhao, M.; An, B.W. Infrared small target detection based on double-layer local contrast measure. Acta Photonica Sin. 2020, 49, 0110003. [Google Scholar]
  30. Lin, S.; Zhang, H.; Lu, X.; Li, D.; Li, Y. RBNSM: A Novel Method for Weak Small Infrared Target Detection in Complex Backgrounds. Infrared Technol. 2022, 44, 667–675. [Google Scholar]
  31. Pan, L.; Liu, T.; Cheng, J.; Cheng, B.; Cai, Y. AIMED-Net: An Enhancing Infrared Small Target Detection Net in UAVs with Multi-Layer Feature Enhancement for Edge Computing. Remote Sens. 2024, 16, 1776. [Google Scholar] [CrossRef]
  32. Thorpe, S.; Fize, D.; Marlot, C. Speed of processing in the human visual system. Nature 1996, 381, 520–522. [Google Scholar] [CrossRef]
  33. Banks, M.S.; Read, J.C.; Allison, R.S.; Watt, S.J. Stereoscopy and the human visual system. Smpte Motion Imaging J. 2012, 121, 24–43. [Google Scholar] [CrossRef]
  34. Adini, Y.; Sagi, D.; Tsodyks, M. Context-enabled learning in the human visual system. Nature 2002, 415, 790–793. [Google Scholar] [CrossRef] [PubMed]
  35. Zhang, T.; Cao, S.; Pu, T.; Peng, Z. AGPCNet: Attention-Guided Pyramid Context Networks for Infrared Small Target Detection. arXiv 2021, arXiv:2111.03580. [Google Scholar]
  36. Gao, C.; Meng, D.; Yang, Y.; Wang, Y.; Zhou, X.; Hauptmann, A.G. Infrared patch-image model for small target detection in a single image. IEEE Trans. Image Process. 2013, 22, 4996–5009. [Google Scholar] [CrossRef] [PubMed]
  37. Guo, F.; Ma, H.; Li, L.; Lv, M.; Jia, Z. Multi-attention pyramid context network for infrared small ship detection. J. Mar. Sci. Eng. 2024, 12, 345. [Google Scholar] [CrossRef]
  38. Li, L.; Ma, H.; Jia, Z. Gamma correction-based automatic unsupervised change detection in SAR images via FLICM model. J. Indian Soc. Remote Sens. 2023, 51, 1077–1088. [Google Scholar] [CrossRef]
  39. Li, L.; Ma, H.; Zhang, X.; Zhao, X.; Lv, M.; Jia, Z. Synthetic aperture radar image change detection based on principal component analysis and two-level clustering. Remote Sens. 2024, 16, 1861. [Google Scholar] [CrossRef]
  40. Moradi, S.; Moallem, P.; Sabahi, M.F. Fast and robust small infrared target detection using absolute directional mean difference algorithm-ScienceDirect. Signal Process. 2018, 177, 107727. [Google Scholar] [CrossRef]
  41. Liu, J.; He, Z.; Chen, Z.; Shao, L. Tiny and dim infrared target detection based on weighted local contrast. IEEE Geosci. Remote Sens. Lett. 2018, 15, 1780–1784. [Google Scholar] [CrossRef]
  42. Shang, K.; Sun, X.; Tian, J.; Li, Y.; Ma, J. Infrared small target detection via line-based reconstruction and entropy-induced suppression. Infrared Phys. Technol. 2016, 76, 75–81. [Google Scholar] [CrossRef]
  43. Xia, C.; Li, X.; Zhao, L.; Shu, R. Infrared small target detection based on multiscale local contrast measure using local energy factor. IEEE Geosci. Remote Sens. Lett. 2019, 17, 157–161. [Google Scholar] [CrossRef]
  44. Deng, H.; Sun, X.; Liu, M.; Ye, C.; Zhou, X. Small infrared target detection based on weighted local difference measure. IEEE Trans. Geosci. Remote Sens. 2016, 54, 4204–4214. [Google Scholar] [CrossRef]
  45. Han, J.; Moradi, S.; Faramarzi, I.; Liu, C.; Zhang, H.; Zhao, Q. A local contrast method for infrared small-target detection utilizing a tri-layer window. IEEE Geosci. Remote Sens. Lett. 2019, 17, 1822–1826. [Google Scholar] [CrossRef]
  46. Zhang, T.; Peng, Z.; Wu, H.; He, Y.; Li, C.; Yang, C. Infrared small target detection via self-regularized weighted sparse model. Neurocomputing 2021, 420, 124–148. [Google Scholar] [CrossRef]
  47. Liu, T.; Yang, J.; Li, B.; Xiao, C.; Sun, Y.; Wang, Y.; An, W. Nonconvex tensor low-rank approximation for infrared small target detection. IEEE Trans. Geosci. Remote Sens. 2021, 60, 5614718. [Google Scholar] [CrossRef]
  48. Sun, Y.; Yang, J.; An, W. Infrared dim and small target detection via multiple subspace learning and spatial-temporal patch-tensor model. IEEE Trans. Geosci. Remote Sens. 2020, 59, 3737–3752. [Google Scholar] [CrossRef]
  49. Liu, T.; Yang, J.; Li, B.; Wang, Y.; An, W. Infrared small target detection via nonconvex tensor tucker decomposition with factor prior. IEEE Trans. Geosci. Remote Sens. 2023, 61, 5617317. [Google Scholar] [CrossRef]
Figure 1. Example of images in the IRWS dataset.
Remotesensing 16 03608 g001
Figure 2. Proposed DDLCM scheme for IR detection. All patches are extracted from the sub-image. The red box denotes the sliding window’s central area ( T A or T a ), while the blue box indicates the inner box patch ( T B 1 , T B 2 or T b 1 , T b 2 ). The black box indicates the outer box patch ( T C or T c ). Odd and even images undergo the same process. Identifying diverse information from sub-images is key to maximizing target data and enhancing IR detection accuracy. The sub-image undergoes SF inversion and is fused to produce the final result saliency map. The red box represents the target region, and the blue and red boxes are the internal and external regions of the sliding box.
Remotesensing 16 03608 g002
Figure 3. Similarity focus. A similar graph is constructed by categorizing nodes into odd and even images based on alternating properties like degree or state. Merging, the inverse of splitting, combines the odd and even images into a single output matching the original image size. Orange and blue are the even and odd positions of the image.
Remotesensing 16 03608 g003
Figure 4. Dual-image grayscale difference contrast calculation.
Remotesensing 16 03608 g004
Figure 5. Visual comparison of IR detection results across six different environments. Alternating rows display each segmented image along with its zoom-in performance. The red box indicates the target.
Remotesensing 16 03608 g005
Figure 6. DNSM and DLCM for visualizing infrared target images. (a) Original image; (b) saliency map of DLCM; (c) saliency map of DNSM; (d) saliency map of results. Alternating rows show each segmented image along with its zoom-in performance. The red and blue boxes represent targets and false targets.
Remotesensing 16 03608 g006
Figure 7. Visual comparison of IR detection results under different datasets (the three columns on the left are for the IWRS dataset, and the three columns on the right are for the SIRS-AUG dataset). Alternating rows display each segmented image along with its zoom-in performance.
Remotesensing 16 03608 g007
Figure 8. ROC curves of different methods on the (a) IRWS and (b) SIRS-AUG datasets.
Remotesensing 16 03608 g008
Figure 9. ROC curves of various methods on the (a) IRWS test dataset and (b) SIRS-AUG dataset. The solid and dotted lines represent the original algorithm and the one with SF added, respectively.
Remotesensing 16 03608 g009
Table 1. Comparison of IR images in different scenes.
Image ResolutionTarget SizeContrastScene Description
Group1127 × 1273 × 338%Complex background
Group2127 × 1273 × 210%Strong edge
Group3250 × 2503 × 38%Weak contrast
Group4250 × 2503 × 316%Building scene
Group5300 × 2103 × 315%Strong light
Group6356 × 2253 × 313%Similar background
Table 2. The comparative experimental data between DDLCM and other algorithms in SCRG and BSF.
ContrastMetricsMPCM [27]ADMD [40]AMW LCM [41]LR [42]RLCM [28]DDLCM
Ground138%SCRG7.4576.1368.07915.5046.65150.881
BSF2.3442.9462.1384.6642.82047.828
Ground210%SCRG18.9609.96010.62513.2380.244261.060
BSF4.5214.1652.8712.7771.350171.508
Ground38%SCRG0.35110.7511.0890.2534.75762.847
BSF4.88920.1972.6971.9364.345189.073
Ground416%SCRG16.59041.35414.7523.064124.790164.810
BSF8.92425.2562.3133.2853.95353.696
Ground515%SCRG211.222507.7826.04323.3230.7921233.920
BSF127.922279.0114.48114.53515.5141861.988
Ground613%SCRG108.524146.22629.56656.15630.243159.320
BSF64.54384.04711.48135.0515.803214.363
Table 3. Numerical results of module ablation experiments on the IRWS dataset.
SFDLCMDNSMF1-Score↑AUC↑Time(s)↓
Exp. 1 0.7070.7620.0816
Exp. 2 0.8530.8940.0784
Exp. 3 0.8570.8780.1022
Exp. 40.8790.9130.0828
Table 4. Various evaluation indicators to compare different algorithms on IRWS. The best and second-best of these indicators are depicted in red and blue fonts, respectively.
LEF [43]WLDM [44]TLL-CM [45]LRSRWS [46]ASTTV-NTLA [47]MSL-STIPT [48]NFTD-GSTV [49]DDLCM
Prec0.82650.72730.78900.66060.85290.77500.70130.62000.8878
Rec0.810.640.860.720.290.310.54000.31000.87
AUC0.83000.70730.84540.69810.64150.6110.65210.56200.9125
F1-score0.81820.68090.82300.68900.44960.44290.61020.41330.8788
Time(s)7.27074.32801.90940.09381.31472.23363.95741.91900.0828
Table 5. Different evaluation indicators to compare various algorithms on SIRS-AUG. The best and second- best of these indicators are depicted in red and blue fonts, respectively.
LEFWLDMTLLCMLRSRWSASTTV-NTLAMSL-STIPTNFTD-GSTVDDLCM
Prec0.76320.65350.85860.57740.77100.72860.56780.64210.7586
Rec0.21970.25000.32200.57950.38260.54920.25380.23110.7500
AUC0.58000.56710.63940.67860.65510.70090.50780.54040.8600
F1-score0.34120.36160.46830.57840.51140.62630.35080.33980.7543
Table 6. Ablation study on the impact of the SF. In IRWS and SIRS-AUG, the performance was analyzed from the perspectives of runtime, runtime improvement (RI), and AUC Variation Rate (AUC-VR). “−” indicates a performance downgrade, and a positive value indicates a performance improvement.
Dataset LEFWLDMTLLCMLRSRWSASTTV-NTLAMSL-STIPTNFTD-GSTV
Time5.20582.89681.67460.0920.99631.19123.46630.9383
IRWSRI28.40%33.07%12.30%1.92%24.22%46.67%12.41%51.10%
AUC-VR−2.4%−2.64%−12.20%−0.53%43.96%2.83%−9.26%−23.9%
Time4.36372.70361.59560.07710.42131.29173.45080.9874
SIRS-AUGRI44.38%38.53%14.62%17.98%73.95%57.91%14.39%57.01%
AUC-VR0.0%8.12%−2.42%7.80%1.74%−22.0%0.77%−10.3%
Disclaimer/Publisher’s Note: The statements, opinions and data contained in all publications are solely those of the individual author(s) and contributor(s) and not of MDPI and/or the editor(s). MDPI and/or the editor(s) disclaim responsibility for any injury to people or property resulting from any ideas, methods, instructions or products referred to in the content.

