Abstract
Supercooled liquid water (SLW) refers to droplets in clouds that remain unfrozen at temperatures below 0 °C. SLW is an important intermediate hydrometeor in the processes of snowfall and rainfall that can modulate the radiation budget. This study investigates the distribution of supercooled cloud water over mainland China using the East Asia–Pacific cloud macro- and microphysical properties dataset (2016), derived from Himawari-8 observations. The results show that the highest frequency of SLW in liquid-phase stratus clouds occur at the eastern slope of the Tibetan Plateau, the western side of the Sichuan Basin. Additional SLW is mostly found in liquid-phase clouds over the Sichuan Basin and its adjacent areas in southern China. In the region with the highest frequency of SLW, the mechanical forcing of the Tibetan Plateau causes the convergence of low-level airflow within the basin, which also carries moisture that is forced to ascend stably, creating a favorable condition for the formation of supercooled clouds. As the airflow continues to ascend, it encounters the mid-to-upper-level westerlies and temperature inversion. At the mid-to-upper level, the westerlies exhibit stronger wind speeds, directing flow towards the basin. Concurrently, the temperature inversion stabilizes the atmospheric stratification, limiting the further ascent of airflow. This inversion can also restrain convection and upward motion within the clouds, allowing for SLW to exist and persist for an extended period.
1. Introduction
Supercooled water clouds (SWCs) are composed of liquid-phase particles or ice-phase particles and liquid particles with temperatures below 0 °C. The cloud top temperature of clouds containing SWC is generally 0 °C~−40 °C, with significant amounts of supercooled water observed between 0 °C and −20 °C [1]. In SWCs, cloud droplets below 0 °C are supercooled cloud water or supercooled liquid water (SLW).
SLW plays a crucial role in artificial weather modification. It impacts cloud precipitation, snowfall, and cloud lifetime by affecting ice particles in clouds [2]. Tabazadeh (2002) proposed a theoretical model, and based on it, they found that the surface crystallization rate of ice in SWC is much higher than the volume-based freezing rate and that the surface crystallization rate depends on the droplet size, temperature, and ambient phase [3]. Based on airborne in situ observations, Maciel and Diao (2022) considered that ice crystals are initially surrounded by supercooled liquid water droplets, and then, as they grow, pure ice segments are formed [4]. Furthermore, the concentration and location of SLW determine the location and timing of cloud seeding [5]. Morrison (2013) utilizes satellite observations to show that differences in the SLW between two regions lead to distinct changes in cloud microphysics after cloud seeding [6]. Li (2022) uses both in situ aircraft and satellite remote sensing observations to find that in regions seeded with supercooled water, droplets quickly transform into ice crystals, causing cloud-top sinking and precipitation [7]. Yang (2022) demonstrated that seeding at the height where SLW and ice crystals coexist showed obvious responses in the cloud microphysical properties [8].
In light of the mentioned factors, the unique characteristics of supercooled water and its role in aviation safety are critical. In aviation, when the aircraft flies through clouds, the SLW suspended in clouds induces the formation of flight ice [9]. Aircraft icing leads to engine failure and subsequent aviation accidents. Ice accretion on aircraft wings and the deposition or coating of ice on an airplane can damage the aircraft components [10].
The distribution of SLW has impacts on radiative energy balance, and SLW near the cloud top increases the cloud-top radiative cooling [11]. Between 40° and 70°S, clouds with supercooled liquid tops dominate the population of liquid clouds, and clouds with supercooled liquid tops contribute between 27% and 38% of the total reflected solar radiation [12]. In addition, SLW is important for the phase change process in clouds at different stages, and cloud phases regulate climate by affecting radiation [13]. However, in global climate models, the radiation in supercooled clouds cannot be simulated well, causing deviations in the simulation results of climate models [14]. For all of the above reasons, SLW strongly influences the weather and climate.
So far, much attention has been paid to the microphysics and radiation equilibrium of SLW, but the impacts regarding the distribution of SWC have received little attention. Hou (2010), based on CALIOP and MODIS global measurement data, found that the highest amount of SWCs is over the land of Europe and East Asia (mainly in China) [15]. In this study, the author investigates the occurrence and distribution of SLW in mainland China to explore the possible causes of the eastern boundary of the Tibetan Plateau (TP) becoming a high-frequency region for SLW. The motivation of the present study concerns providing references for the scientific implementation of artificial rain, the formulation of aircraft flight routes, and the effect of SWCs on the climate in China.
After analyzing the distribution characteristics of SLW, it was found that SLW is mainly concentrated in the part where the Sichuan Basin borders the TP and SLW. Notably, the transition zone between the eastern boundary of the Qinghai–Tibetan Plateau and the Sichuan Basin has always been a key focus of studies. The eastern edge of the Qinghai–Tibetan Plateau features complex terrain and is influenced by various weather systems, leading to frequent occurrences of extreme summer precipitation [16]. In winter, the leeward slope effect along the eastern edge of the Tibetan Plateau exacerbates air pollution in the Sichuan Basin [17]. The complex terrain between the eastern slope of the Qinghai–Tibetan Plateau and the Sichuan Basin creates a topographically dependent atmospheric environment, which is analyzed in this paper to explain the high frequency of SLW on the eastern slope of the TP.
2. Data and Methods
The East Asia–Pacific cloud macro- and microphysical properties dataset was developed using the next-generation geostationary satellite Himawari-8, the dataset includes parameters such as cloud cover (CF), cloud detection (CM), cloud phase detection (CP), cloud type (CT), and supercooled water detection (SWC), with temporal resolution of 1 h and spatial resolutions of 0.1° 0.1° [18]. Compared to CALIOP and MODIS, this dataset is derived from the Himawari-8 satellite and has been processed using a novel algorithm, resulting in cloud products with enhanced temporal and spatial precision [19].
The fifth generation atmospheric reanalysis data ERA5 provided by the ECMWF (European Centre for Medium-Range Weather Forecasts) on pressure levels, includes 37 layers of temperature, u-component of wind, v-component of wind, vertical velocity, specific humidity and divergence with pressure levels 1000 hPa–0.01 hPa, and surface pressure (temporal resolution of 1 h and spatial resolutions of 0.25° × 0.25°) [20].
The MODIS Level-2 Cloud product (MOD06_L2) consists of cloud optical and physical parameters; it is derived using remotely sensed infrared and visible and near-infrared solar reflected radiances, and the infrared channel radiances are used to derive cloud top temperature and cloud top height [21]. MOD06_L2 consists of parameters at a spatial resolution of either 1 km or 5 km (at nadir), and each MOD06_L2 product file covers a 5 min time interval [22].
The method for calculating the frequency of SLW involves assigning a value of 1 to each 0.1° × 0.1° grid point that contains SLW per hour and a value of 0 where it is absent. The frequency of SLW is obtained by summing the value of 1 for each occurrence (as Equation (1)). The statistics of CT and CP with SWC are similar. (Similar to the statistics for SLW, the frequency of various CT and CP is denoted by 1 when supercooled water is present and then cumulatively tallied.)
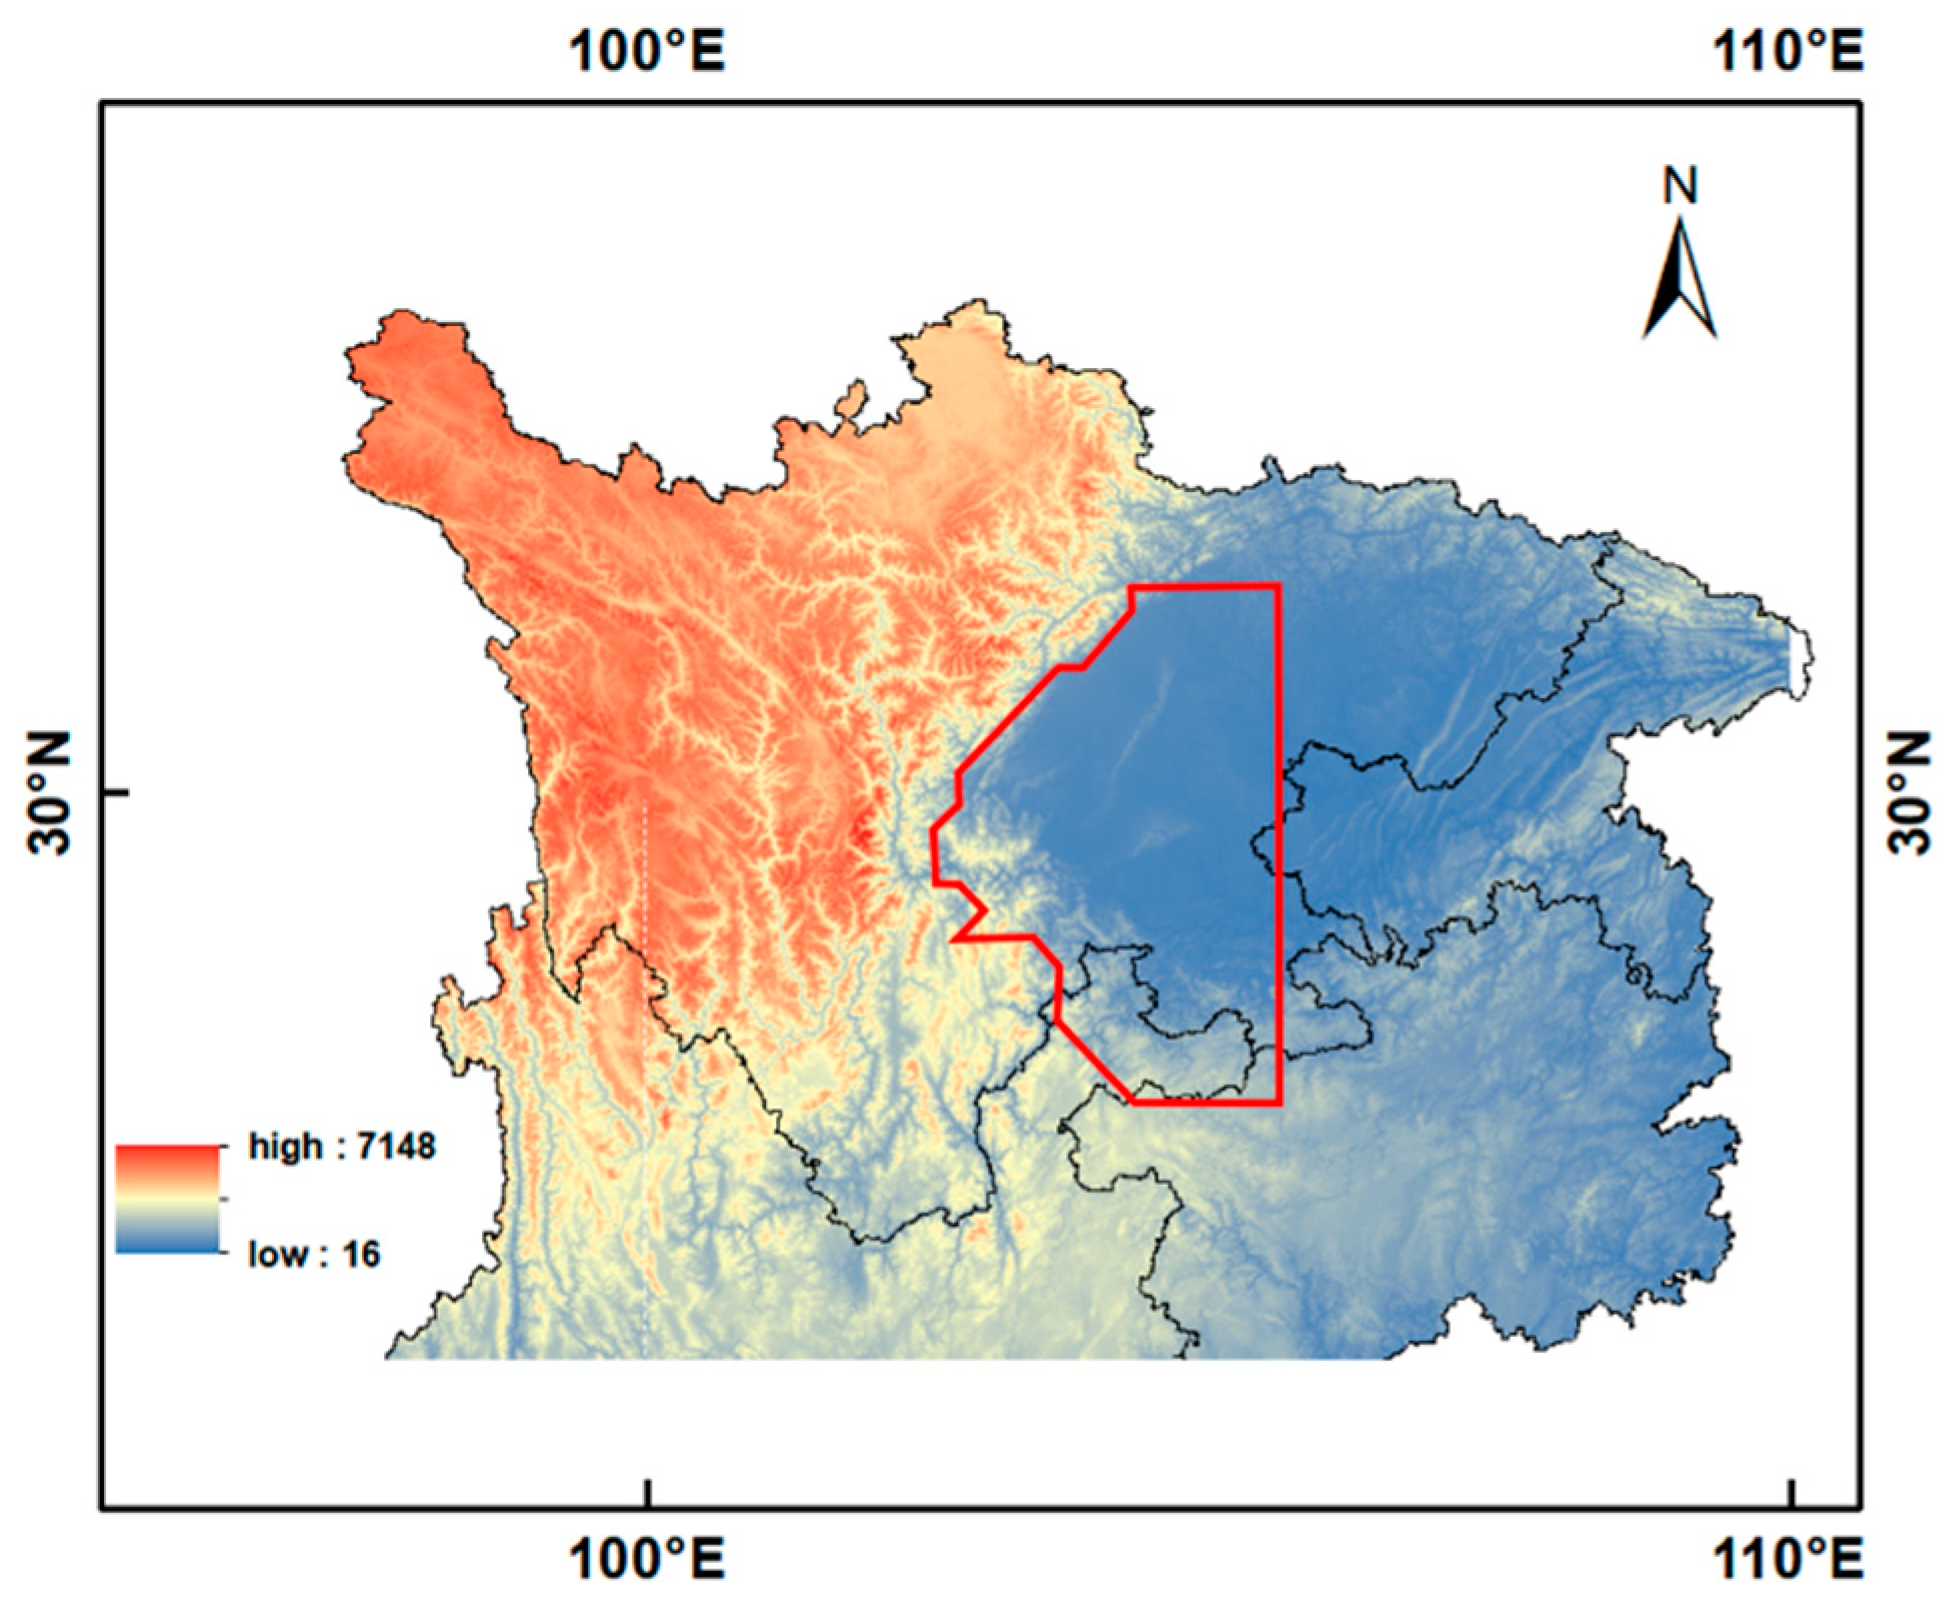
When selecting specific areas, due to the varying spatial resolutions of the utilized data, the chosen regions correspond to irregular high frequency zones of SLW. These are then interpolated to different resolutions, and the approximate region is shown in Figure 1. Due to differences in the temporal precision of the data, the cloud top temperature (CTT) and cloud top pressure (CTP) of non-supercooled clouds are also included when discussing CTT and CTP. Normalization was employed in the statistical analysis of CTP and CTT (as Equation (2)); () is the original data, () is the minimum value in the dataset, and () is the maximum value. This formula subtracts the minimum value from the original data and then divides by the range (maximum value minus minimum value), and the resulting values will be scaled between 0 and 1.

Figure 1.
Typical area geographical location (the area within the red box is a typical region).
3. Results
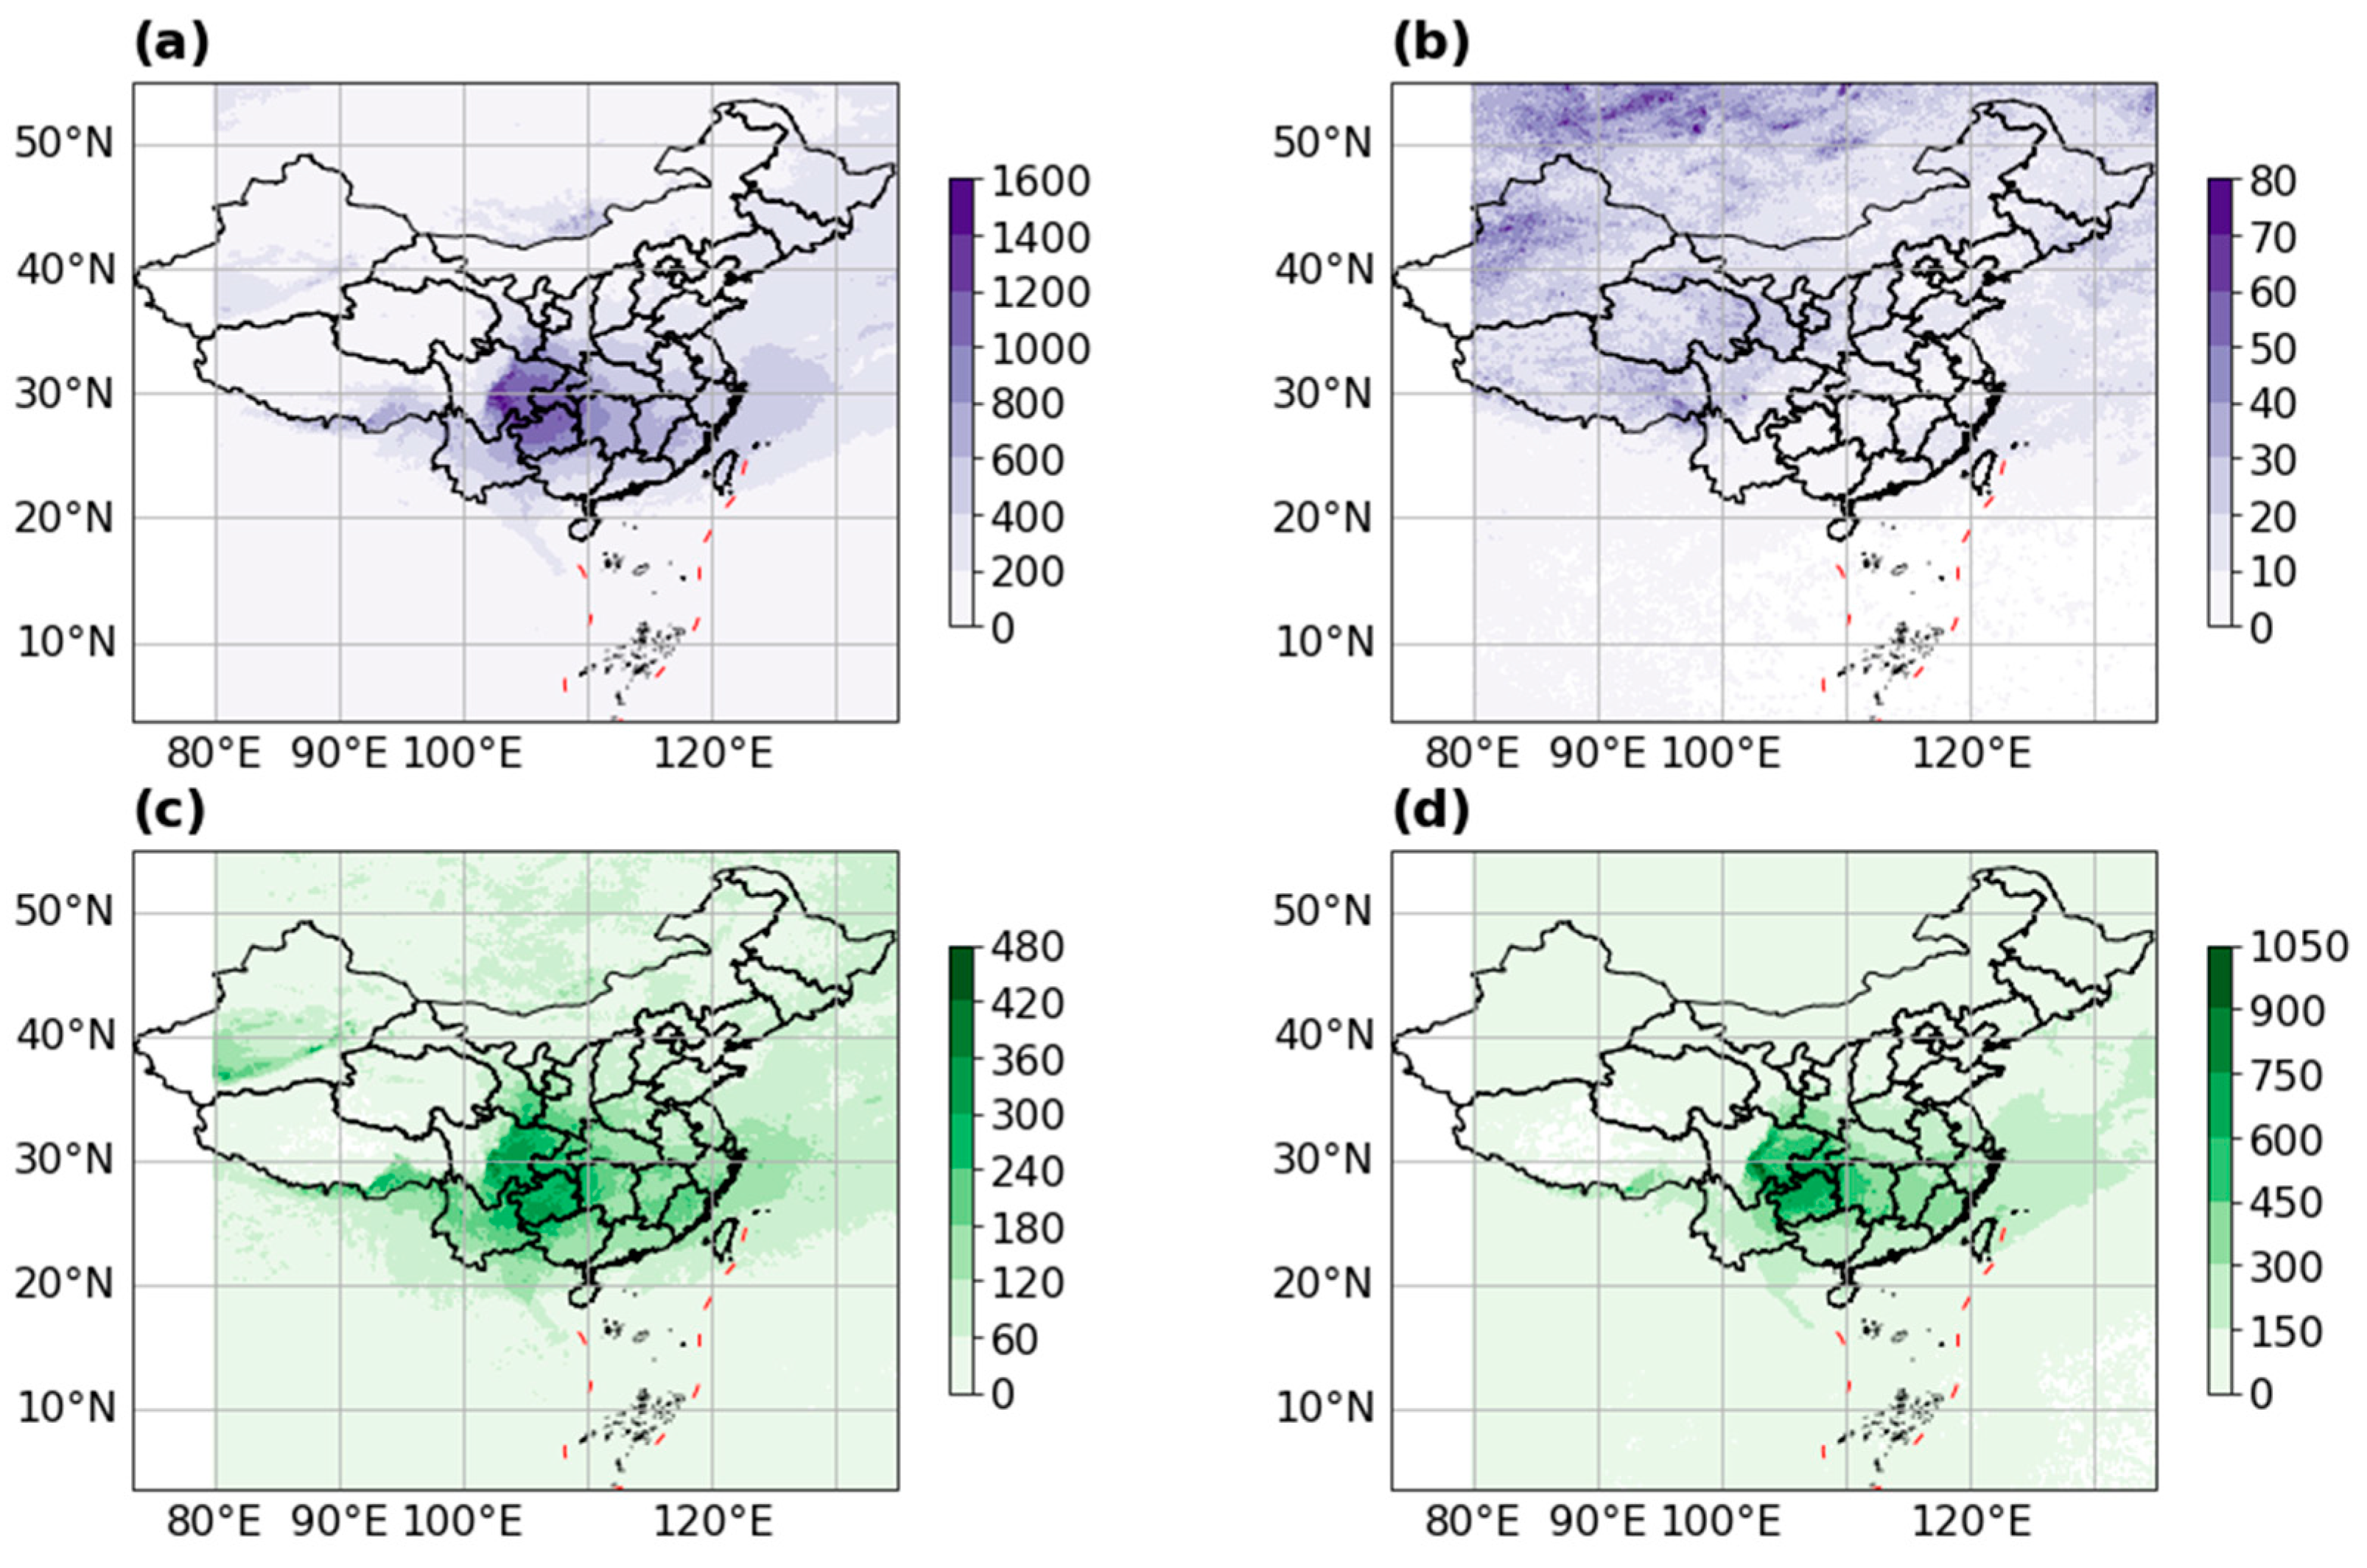
Based on the East Asia–Pacific cloud macro- and microphysical properties dataset, the frequency of SLW and the probability of SLW occurring within clouds are shown in Figure 2, respectively. The maximum SLW frequency, exceeding 1000 occurrences, is observed at the junction of the Sichuan Basin and the eastern slope of the Tibetan Plateau. In the Sichuan Basin and its adjacent areas, the frequency of SLW ranges from 600 to 1000. A smaller frequency of SLW is distributed predominantly in Southeast China. Overall, the distribution of SLW decreases progressively from the confluence of the Sichuan Basin and the Tibetan Plateau, extending towards the southeastern regions of China. The probability distribution of SLW occurrence in clouds mirrors the frequency distribution of SLW. In the eastern slope of the Tibetan Plateau and within the Sichuan Basin, the probability surpassing of SLW in clouds is significantly higher, exceeding a probability of 42%. In the southern part of the Sichuan Basin and the transitional region between the Sichuan Basin and the Yunnan–Guizhou Plateau, the probability of encountering supercooled water in clouds is above 36%. Previous studies have demonstrated that SWCs are mostly observed over the ocean near the storm-track regions and high-latitude regions [23]. However, in China, SLW is mainly distributed in mid-latitude clouds. The Sichuan Basin and its surrounding areas exhibit a significantly higher incidence of SLW in clouds than the precipitation-rich Southeast China coast.
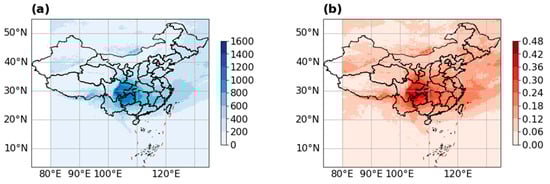
Figure 2.
The distribution of supercooled cloud water in 2016: (a) the frequency of supercooled cloud water occurrences; (b) the probability of supercooled cloud water occurring within clouds.
Figure 3 further counts the frequency of the occurrence of SLW in different CTs and CP in 2016. It found that SLW almost appears in liquid water clouds (Figure 3a), and only a small portion was found in mixed-phase clouds in North China (Figure 3b). According to the statistical analysis of CTs, the frequency of SLW in China mainly occurs in nimbostratus clouds (Figure 3d). The highest frequency, exceeding 900 occurrences, is found in the elongated belt-like region at the transition between the Sichuan Basin and the eastern slope of the Tibetan Plateau. In the junction of Sichuan, Chongqing, and Guizhou (the transitional zone bridging the Sichuan Basin and the Yunnan–Guizhou Plateau), the frequency of nimbostratus clouds containing SLW exceeds 600. In addition to nimbostratus, SLW is also prevalent in altostratus clouds (Figure 3c). The highest frequency of altostratus clouds containing SLW, exceeding 400 occurrences, is observed along where the eastern slope of the Tibetan Platea meets the Sichuan Basin. Subsequently, within the Sichuan Basin and the southern part of Guizhou, the frequency hovers around 300.
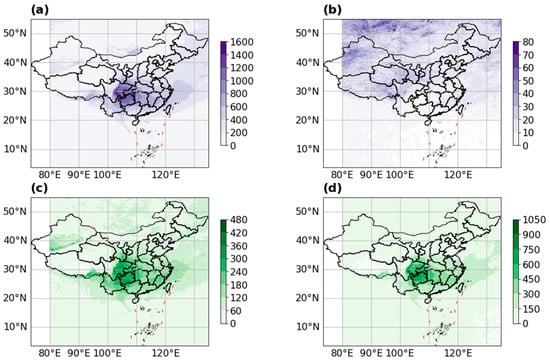
Figure 3.
Distribution of supercooled water in different cloud types and cloud phases. (a) Distribution of supercooled water in liquid cloud. (b) Distribution of supercooled water in mixed-phase clouds. (c) Distribution of supercooled water in altostratus clouds. (d) Distribution of supercooled water in nimbostratus clouds.
In general, SLW is predominantly found within the liquid-phase stratiform clouds surrounding the Sichuan Basin. The stratiform clouds are primarily nimbostratus and altostratus. Yu discovered that downstream on the eastern side of the Tibetan Plateau, the dominance of nimbostratus and altostratus clouds resulted in extremely large cloud optical thickness and attributed this to the topography of the Tibetan Plateau [24]. The work described here suggests the transitional region between the Sichuan Basin and the Tibetan Plateau is a critical area for the distribution of SLW. Therefore, this article proposes that the SLW in China is mainly distributed in liquid-phase stratus clouds that may be impacted by the topographic factors of the Tibetan Plateau. Even a liquid cloud is likely to occur preferentially in the storm region [14], and though with abundant clouds and many storms passing through southeastern China [25], the frequency of SLW is far less than that in the Sichuan Basin, which has long been affected by the Tibetan Plateau.
To further verify the above inference, the study selected regions within the inner sections of the Sichuan Basin and along the eastern slopes of the Tibetan Plateau, which are characterized by a higher frequency of SLW, for a detailed analysis as representative areas (Figure 1). Due to variations in the temporal and spatial resolution of different datasets, the analysis was only including January, February, November, and December, as these months have a higher frequency of SLW and the greatest probability of SLW occurrence in clouds. Concurrently, the months of January, February, November, and December, which are the winter season in the northern hemisphere, provide a suitable environment for SLW due to the lower temperatures relative to other seasons.
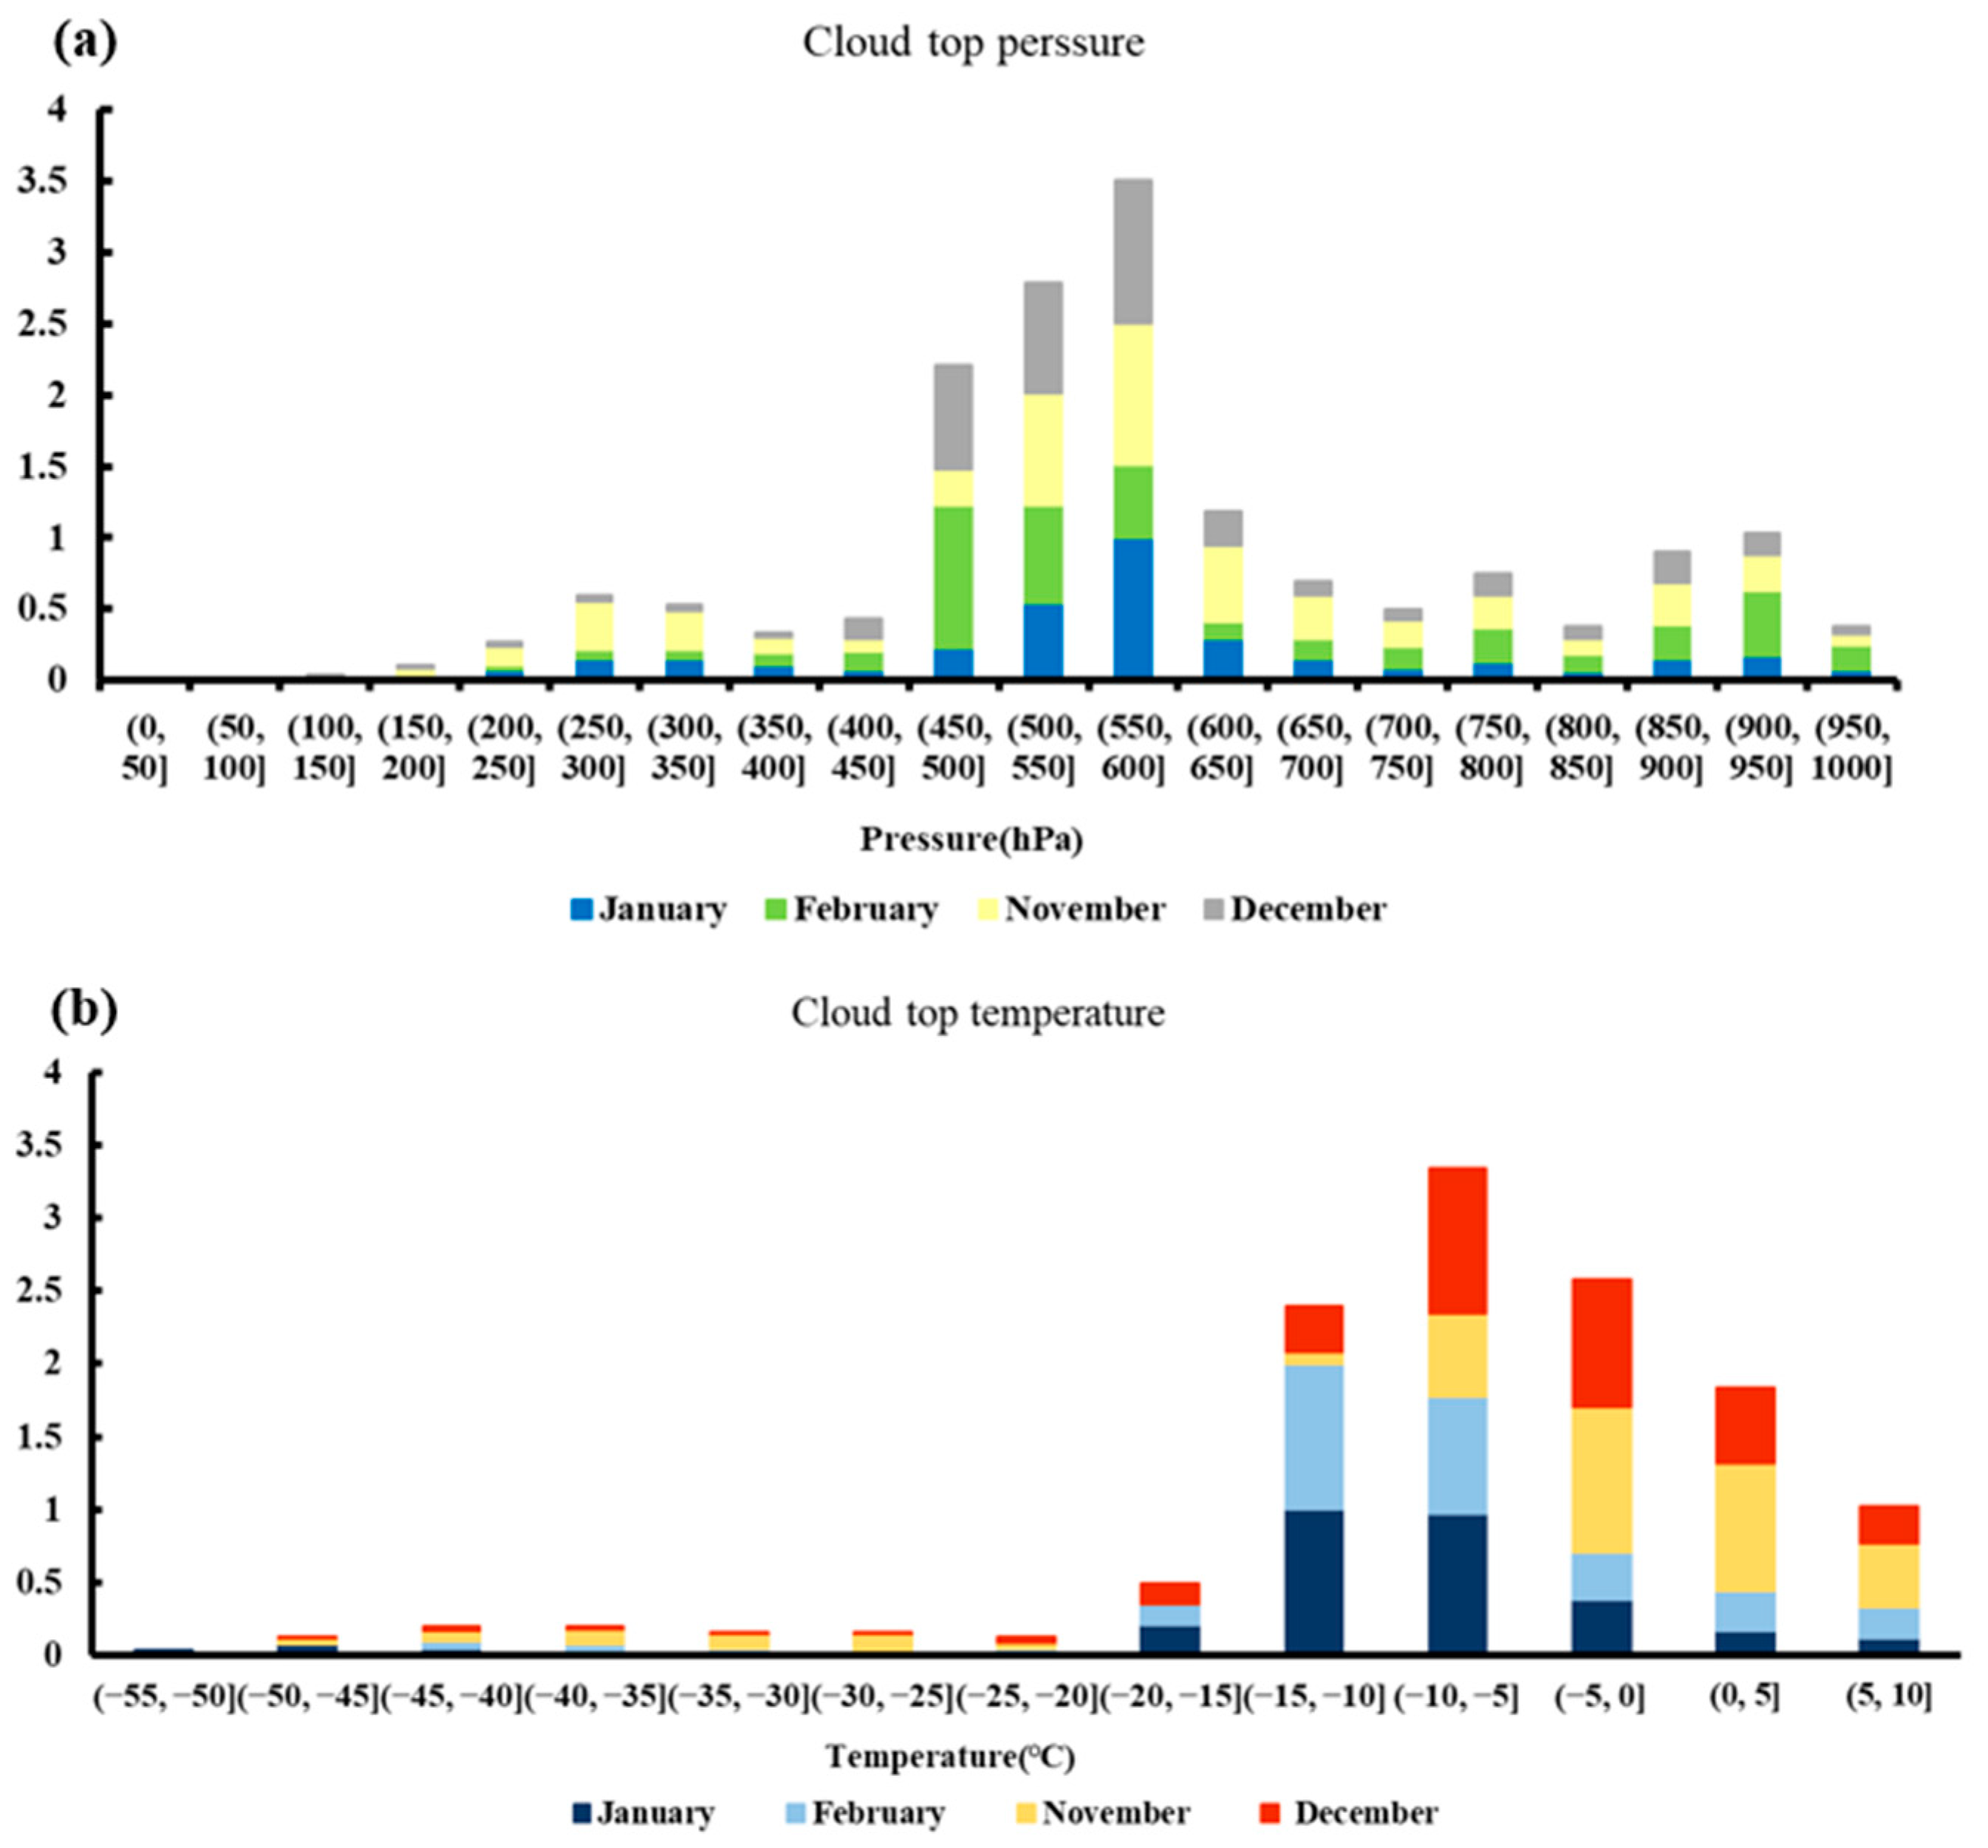
In the above conclusion, SLW mainly appears in nimbostratus clouds and altostratus clouds, which basically are liquid-phase clouds. To explore the reason, use MODIS satellite data to statistically measure CTP and CTT for the months of January, February, November, and December. The statistical results are presented in Figure 4. The distribution of CTP exhibits a multi-peak pattern, with the main peaks occurring between 450 hPa and 700 hPa (Figure 4a). The temperature distribution at the cloud tops is characterized by a unimodal pattern, predominantly spanning from −20 °C to 10 °C (Figure 4b). When the cloud temperature is between −20 °C and 0 °C, a large amount of SLW exists [26]. The predominant range of CTT lies between −20 °C and 0 °C, fostering an environment conducive to the presence of SLW. Furthermore, the CTP primarily resides within the mid-tropospheric layer, signifying that in typical areas during the winter season, mid-level and low-level clouds account for the majority of cloud layers. Mid-level or low-level nimbostratus and altostratus clouds with cloud top temperatures between −20 °C and 0 °C create conditions conducive to the presence of SLW.
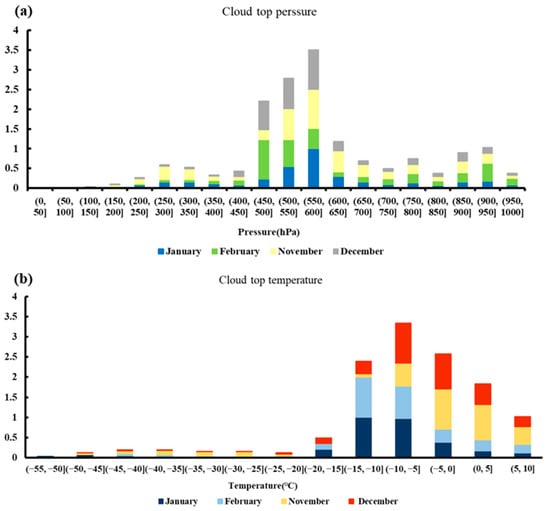
Figure 4.
Cloud top pressure and cloud top temperature statistics. (a) Statistics of cloud top pressure in January, February, November, and December. (b) Statistics of cloud top temperature in January, February, November, and December (the values on the Y-axis are normalized and then aggregated).
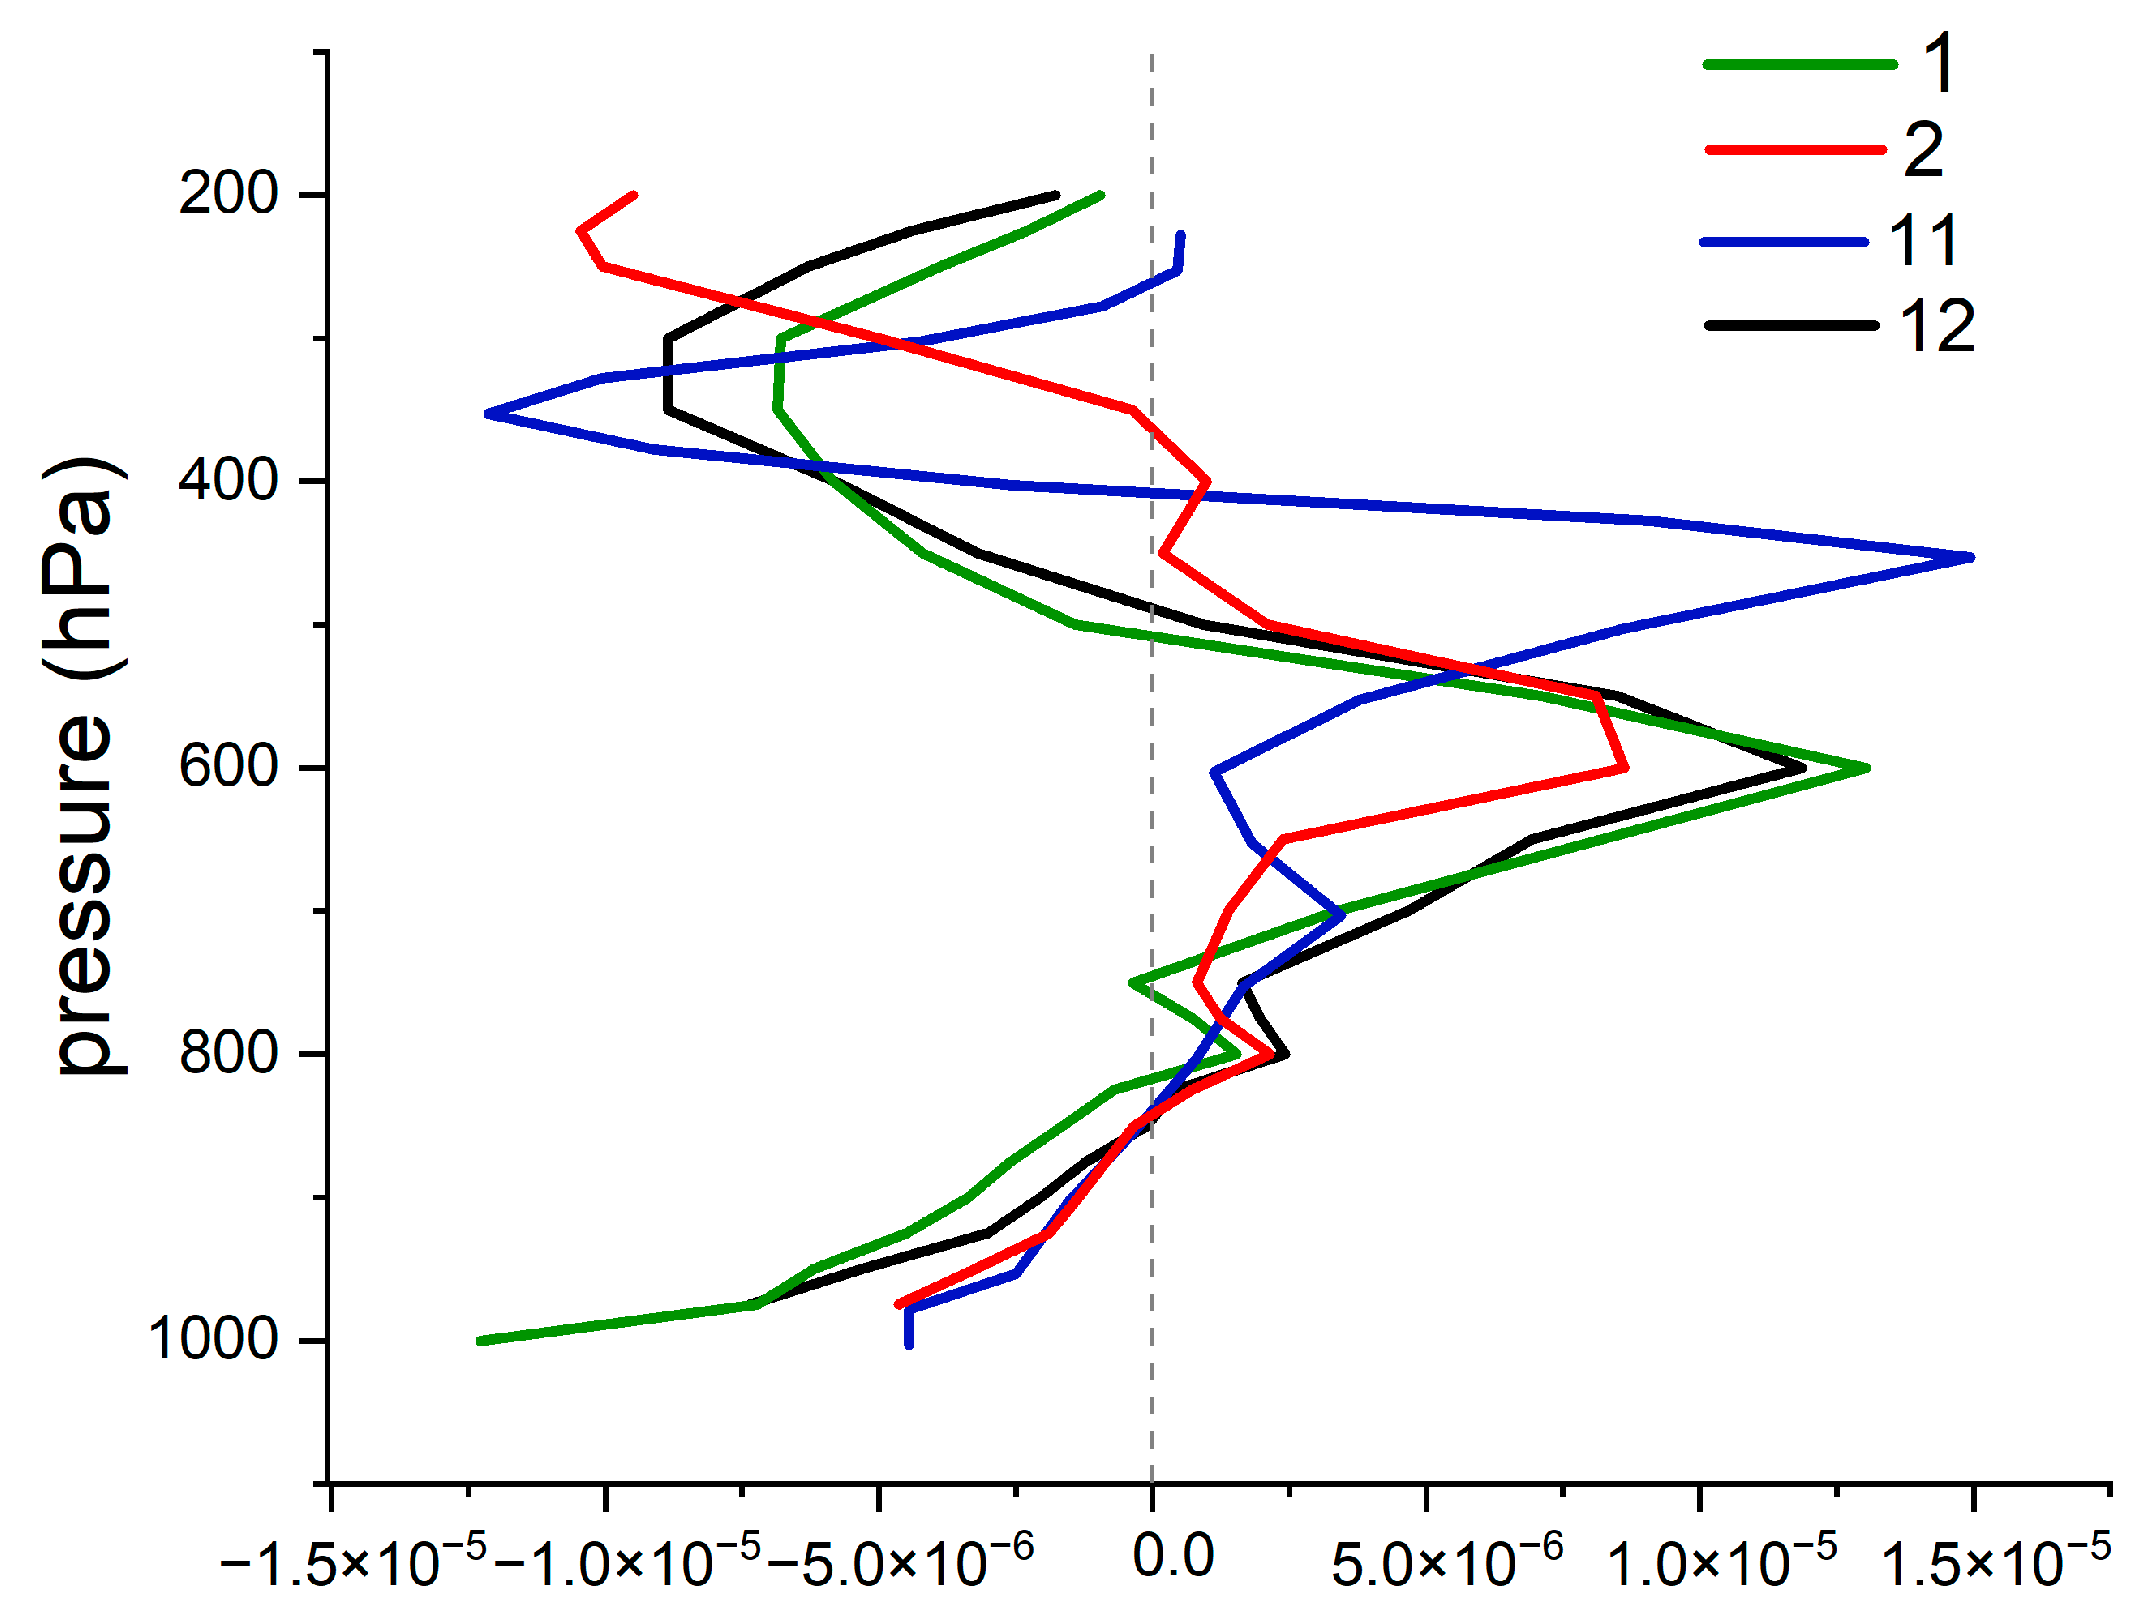
Downstream of the Tibetan Plateau, nimbostratus and altostratus clouds often develop from the gradual ascent of moist air, resulting in relatively weak turbulence within the cloud [25,27]. In the typical area, SWCs form in an environment with weak ascending air currents. We conducted an analysis of vertical divergence for different months (January, February, November, and December), as shown in Figure 5. The trend in all four months is relatively consistent. The low-level (from the surface to 800 hPa) divergence is less than 0. The mid–high-level (700 hPa~500 hPa) divergence is greater than 0. It indicates convergence in the low-level and mid-level divergence in the region. This may be related to the Tibetan Plateau acting as a barrier to the westerly winds, with notable effects during specific months (January, February, November, and December) [28].
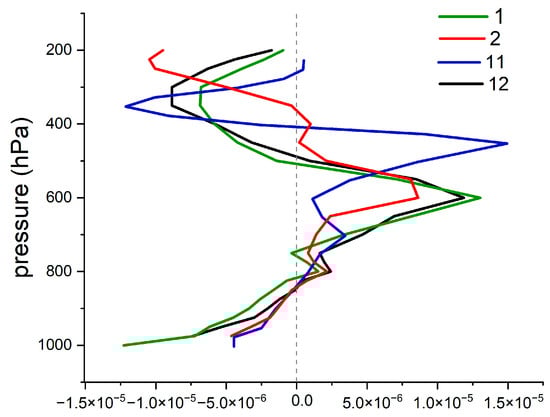
Figure 5.
Average vertical divergence.
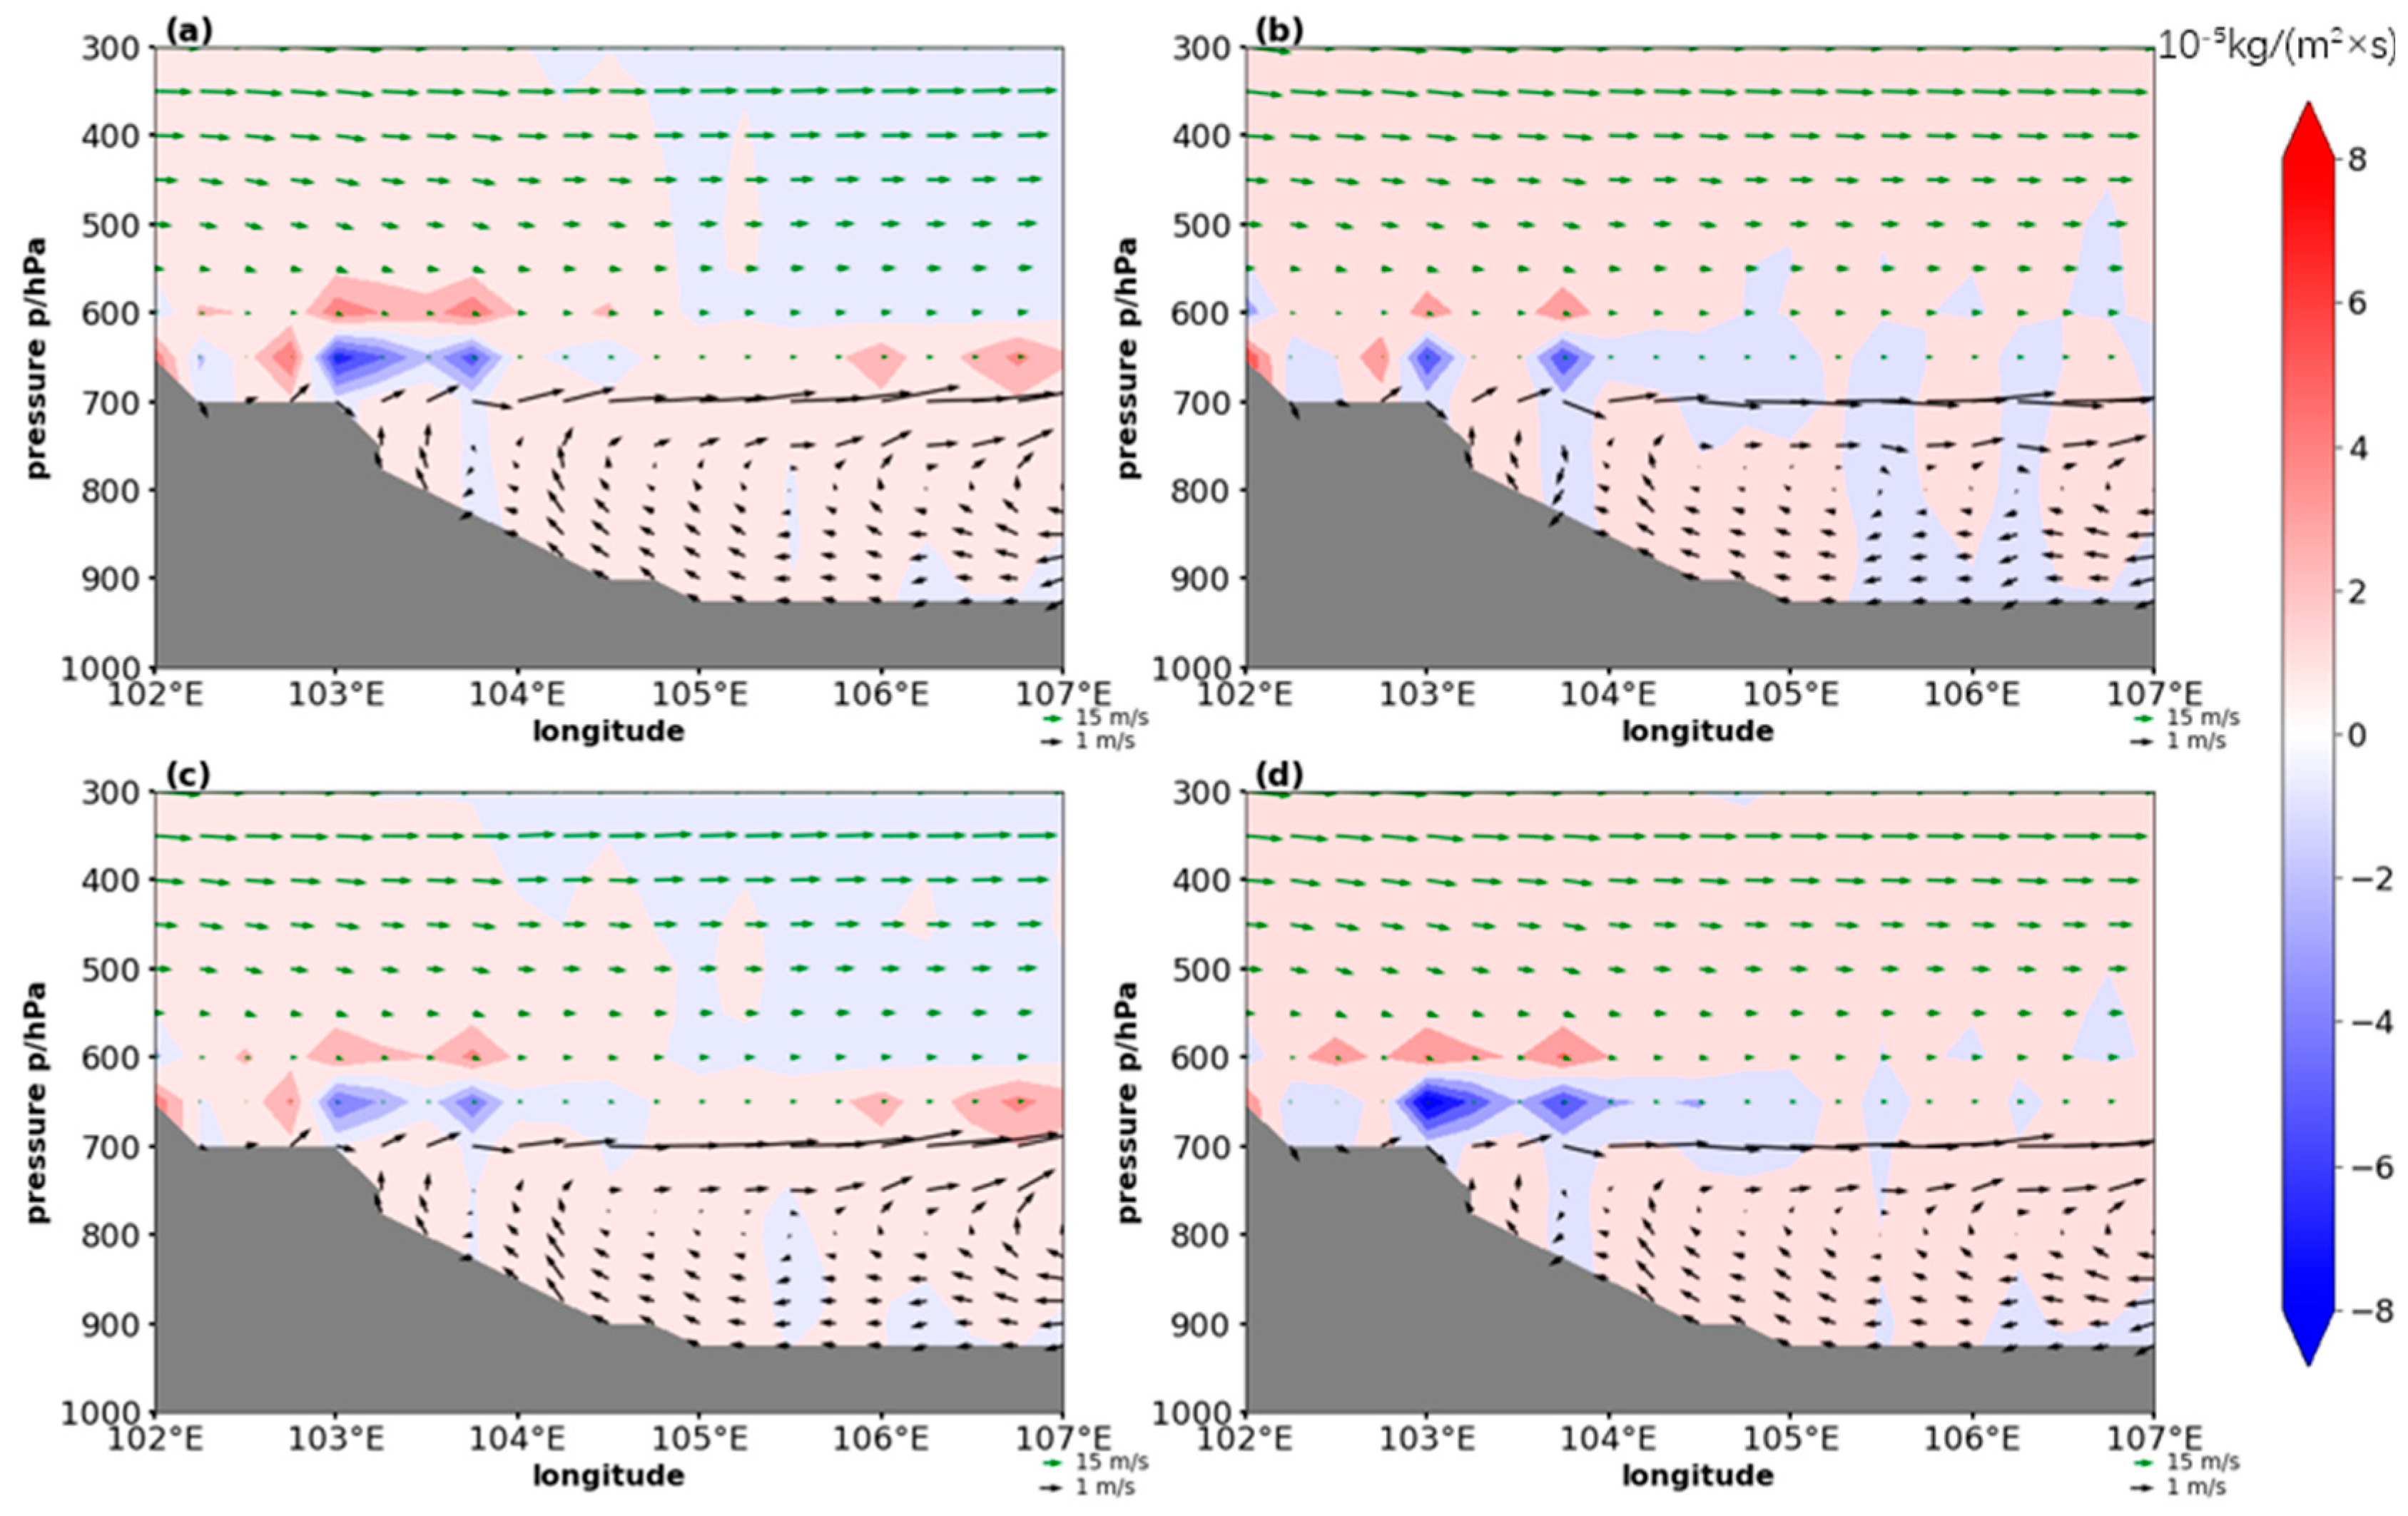
Based on ERA5 reanalysis data, Figure 6 shows the larger-scale annual mean wind and water vapor flux at 850 hPa. It is clear that the blocking of the terrain causes low-altitude westerly airflow upstream of the TP divided into two branches, and then, two air flows bypassing the Qinghai–Tibetan Plateau and the northwestern part of the Yunnan–Guizhou Plateau converge toward the basin this is consistent with previous research results [29]. Meanwhile, the southern branch of the low-level westerly carries water vapor from the Indian subcontinent and the Bay of Bengal into the Sichuan Basin [30]. Low-level convergence maintains large-scale stable uplift. However, the moist airflow converging in the basin is obstructed by topography again. We used an ERA5 reanalysis data analysis of integrated water vapor transport (IVT) and wind in the vertical direction at the link between the Sichuan Basin and the Tibetan Plateau (Figure 7). The low-level airflow in the basin climbs toward the leeward slope of the Tibetan Plateau. The westerly flow, upon traversing the Tibetan Plateau, is considerably slowed down, which leads to pronounced divergence within the mid-tropospheric levels on the Tibetan Plateau’s leeward side (Figure 5 and Figure 7). The ascending low-level airflow encounters middle-layer divergence corresponding to the variation in the westerly, which suppresses its further ascent. Due to the westerly airflow blowing toward the basin, the climbing airflow, with a much lower wind speed than the westerlies, subsequently alters its upward direction to follow the westerly flow. From the perspective of IVT distribution (Figure 7, between longitude 105°E and 104°E), the transmission of water vapor to the Tibetan Plateau is blocked by terrain [31]. This work posits that within a large-scale environmental context, the topographical influence of the Tibetan Plateau causes low-level moist air currents to ascend from the Sichuan Basin towards the Tibetan Plateau, furnishing favorable conditions for cloud formation. However, divergence in the mid-latitude westerlies curtails the vertical development of clouds, confining them to the mid-troposphere. This also corresponds to the cloud top pressure statistics in Figure 4, which means that the obstruction of the Qinghai–Tibetan Plateau and the topographical variations between the Sichuan Basin and the eastern boundary of the Tibetan Plateau provides good conditions for the formation and maintenance of SLW.
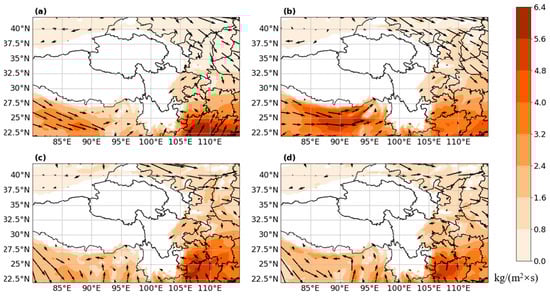
Figure 6.
The average water vapor flux and the average winds at 850 hPa in (a) January, (b) February, (c) November, and (d) December.
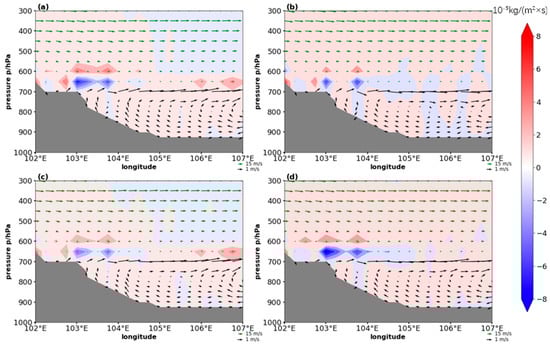
Figure 7.
The average IVT (integrated water vapor transport) and the average winds in (a) January, (b) February, (c) November, and (d) December (the values > 8 or <−8, treated as the same value for interpolation, and positive values show that water vapor is transported in the direction of the wind, while negative values indicate the opposite).
The frequency of temperature inversions at different heights when SWCs exist in the region is analyzed, as shown in Table 1. In January, February, November, and December, the height with the highest temperature inversion frequency is 650 hPa, and the temperature inversion mainly occurs between 775 hPa and 550 hPa. Temperature inversion will make the upper air temperature higher than the lower air, causing the upper air to be less dense, hindering the upward movement of the lower air and inhibiting the convective movement of the air [32]. Temperature inversion not only makes the atmosphere stratification more stable but also reduces the vertical transport of water vapor and lowers the relative humidity of the atmosphere [33]. The inversion layer also weakens the radiative cooling of the ground so that the lower part of the stratus clouds will not be overcooled, maintaining the stability of the stratus clouds [34]. As a result, under inversion conditions, stratus clouds are more plausible to form and persist without being destroyed by convective motion and radiative cooling so that SLW can exist for a long time.

Table 1.
Statistical results of temperature inversion.
4. Discussion
Yu proposed that the cloud amount and surface correlate negatively over the Yangtze River valley and Sichuan basin, a coupling between the surface temperature and the cloud radiative forcing, and the cloud can affect the surface temperature through changing cloud radiative forcing [24]. Although this study briefly analyzes the causes of supercooled water in typical areas in the winter of 2016, the frequency of SLW was also higher in September, October, and March in 2016. That is, in spring and summer, the supercooled water frequency is relatively low, which is likely to be related to surface temperature and the cloud–radiation feedback mechanism. Rising surface temperature leads to a decreasing static stability and relative humidity at low levels [24], which suppress the formation of supercooled stratus clouds. Meanwhile, the reduction of the supercooled stratus clouds would lead to cloud radiative cooling and favor further surface warming. In addition, the above-mentioned cloud feedback mechanism may also be related to the presence of more SLW at the top of the cloud. Supercooled cloud droplets can have a higher albedo and a lower absorption coefficient than warm cloud droplets, meaning that they reflect more SWR (shortwave radiation) and emit more LWR (longwave radiation) [35].
In the statistical results of this study, SLW are almost found in liquid-phase clouds. In addition to the considered inversion temperature and low surface temperature, which are beneficial to the maintenance of stratus clouds, the lack of ice phase particles should also be considered. The lack of ice particles in stratus clouds cannot consume SLW, let alone form precipitation, which may cause stratus clouds to maintain for a longer period of time under favorable weather conditions, resulting in SLW also persisting in the clouds for a long time [13].
5. Conclusions
Using Himawari-8 product, it was found that the high value area of SLW is located in the part where the Sichuan Basin borders the TP and that SLW occurs mainly in nimbostratus and altostratus clouds in these regions. This work analyzes the relevant causes from two perspectives: large-scale weather conditions and local dynamic conditions.
When obstructed by the TP, the low-level westerly airflow splits into southern and northern branches, with the southern branch carrying moisture and converging with the northern branch in the Sichuan Basin. In the Sichuan Basin, the converging airflow encounters the leeward slope of the eastern edge of the Qinghai–Tibetan Plateau, causing the moisture-laden air to ascend the Tibetan Plateau. That provides a favorable large-scale environment for the formation of nimbostratus and altostratus clouds. Simultaneously, the presence of localized temperature inversions contributes to atmospheric stability. Inversions occur at heights concentrated around 650 hPa, while the cloud-top pressure peaks are between 550 hPa and 600 hPa. This indicates that when ascending air forms clouds, it is hampered by inversions, resulting in weaker convection. During this ascent, the airflow encounters the stable mid-level westerlies. The combined effects of westerly-induced divergence, the guidance of ascending airflow by the westerlies toward the basin, and the presence of temperature inversions typically results in the formation of mid-level or low-level stratiform clouds and a few high-level clouds rather than convective clouds. In the winter, temperatures within the mid-to-low troposphere (specifically, cloud interior temperatures) typically range from approximately −20 °C to 0 °C. At these temperatures and altitudes, cloud particles have difficulty spontaneously freezing. As a result, the majority of SWCs remain in a liquid phase that allows for the substantial presence of SLW.
In studies on pollutants in the Sichuan Basin, weather patterns influenced by topography have been categorized into several main types [29]. Different weather patterns exhibit variations in cloud types and cloud heights as well as differences in the occurrence of SLW. This paper does not analyze the differences in cloud types and supercooled water under different weather conditions. Future research should employ multiple methods to conduct more detailed analyses of the occurrence of SLW occurrence under various weather conditions and topographical influences.
Author Contributions
Data curation, writing—original draft preparation, Q.W.; methodology, review, and editing, J.C.; conceptualization, funding acquisition, Y.Y. All authors have read and agreed to the published version of the manuscript.
Funding
This work is supported by National Science Foundation of China (42230604, 42075067), and the Open Research Program of the State Key Laboratory of Severe Weather (Grant No. 2023LASW-B25).
Data Availability Statement
The data presented in this study is available on request from the cor-responding author.
Acknowledgments
The datasets are provided by National Tibetan Plateau/Third Pole Environment Data Center (http://data.tpdc.ac.cn). (https://cstr.cn/18406.11.Atmos.tpdc.272822) (accessed on 8 September 2022). This study utilized ERA5 reanalysis data from the Copernicus Climate Change Service (C3S) at ECMWF. We thank the European Centre for Medium-Range Weather Forecasts (ECMWF) for providing the data. The views expressed are those of the authors and do not necessarily reflect those of the European Commission or ECMWF. This study also utilized MODIS Cloud (06_L2) data from the NASA MODIS Adaptive Processing System (MODAPS). We thank the MODIS Atmosphere Science Team for providing the data. The data were processed using the MODIS instrument on the Terra and Aqua platforms. The authors are solely responsible for the content and conclusions of this study. The data storage and analysis in this paper were completed on the supercomputing system at the Supercomputing Center of Nanjing University of Information Science & Technology.
Conflicts of Interest
The authors declare no conflicts of interest.
References
- Wang, Z.; Letu, H.; Shang, H.; Zhao, C.; Li, J.; Ma, R. A Supercooled Water Cloud Detection Algorithm Using Himawari-8 Satellite Measurements. J. Geophys. Res. Atmos. 2019, 124, 2724–2738. [Google Scholar] [CrossRef]
- Jiang, H.; Cotton, W.R.; Pinto, J.O.; Curry, J.A.; Weissbluth, M.J. Cloud Resolving Simulations of Mixed-Phase Arctic Stratus Observed during BASE: Sensitivity to Concentration of Ice Crystals and Large-Scale Heat and Moisture Advection. J. Atmos. Sci. 2000, 57, 2105–2117. [Google Scholar] [CrossRef]
- Tabazadeh, A.; Djikaev, Y.S.; Reiss, H. Surface Crystallization of Supercooled Water in Clouds. Proc. Natl. Acad. Sci. USA 2002, 99, 15873–15878. [Google Scholar] [CrossRef] [PubMed]
- Maciel, F.V.; Diao, M. The Transition from Supercooled Liquid Water to Ice Crystals in Mixed-Phase Clouds Based on Airborne In-Situ Observations. Atmos. Meas. Tech. Discuss. 2022, 17, 4843–4861. [Google Scholar] [CrossRef]
- Bruintjes, R.T. A Review of Cloud Seeding Experiments to Enhance Precipitation and Some New Prospects. Bull. Am. Meteorol. Soc. 1999, 80, 805–820. [Google Scholar] [CrossRef]
- Morrison, A.E.; Siems, S.T.; Manton, M.J. On a Natural Environment for Glaciogenic Cloud Seeding. J. Appl. Meteorol. Climatol. 2013, 52, 1097–1104. [Google Scholar] [CrossRef]
- Li, D.; Zhao, C.; Yue, Z.; Liu, C.; Sun, Y.; Cohen, J.B. Response of Cloud and Precipitation Properties to Seeding at a Supercooled Cloud-Top Layer. Earth Space Sci. 2022, 9, e2021EA001791. [Google Scholar] [CrossRef]
- Yang, Y.; Zhao, C.; Fu, J.; Cui, Y.; Dong, X.; Mai, R.; Xu, F. Response of Mixed-Phase Cloud Microphysical Properties to Cloud-Seeding Near Cloud Top Over Hebei, China. Front. Environ. Sci. 2022, 10, 865966. [Google Scholar] [CrossRef]
- Brown, S.; Lengaigne, J.; Sharifi, N.; Pugh, M.; Moreau, C.; Dolatabadi, A.; Martinu, L.; Klemberg-Sapieha, J.E. Durability of Superhydrophobic Duplex Coating Systems for Aerospace Applications. Surf. Coat. Technol. 2020, 401, 126249. [Google Scholar] [CrossRef]
- Li, S.; Paoli, R. Modeling of Ice Accretion over Aircraft Wings Using a Compressible OpenFOAM Solver. Int. J. Aerosp. Eng. 2019, 2019, e4864927. [Google Scholar] [CrossRef]
- Chen, C.; Cotton, W.R. The Physics of the Marine Stratocumulus-Capped Mixed Layer. J. Atmos. Sci. 1987, 44, 2951–2977. [Google Scholar] [CrossRef]
- Bodas-Salcedo, A.; Hill, P.G.; Furtado, K.; Williams, K.D.; Field, P.R.; Manners, J.C.; Hyder, P.; Kato, S. Large Contribution of Supercooled Liquid Clouds to the Solar Radiation Budget of the Southern Ocean. J. Clim. 2016, 29, 4213–4228. [Google Scholar] [CrossRef]
- Murray, B.J.; Carslaw, K.S.; Field, P.R. Opinion: Cloud-Phase Climate Feedback and the Importance of Ice-Nucleating Particles. Atmos. Chem. Phys. 2021, 21, 665–679. [Google Scholar] [CrossRef]
- Li, J.; Lv, Q.; Zhang, M.; Wang, T.; Kawamoto, K.; Chen, S.; Zhang, B. Effects of Atmospheric Dynamics and Aerosols on the Fraction of Supercooled Water Clouds. Atmos. Chem. Phys. 2017, 17, 1847–1863. [Google Scholar] [CrossRef]
- Hou, T.; Lei, H.; Hu, Z. A Comparative Study of the Microstructure and Precipitation Mechanisms for Two Stratiform Clouds in China. Atmos. Res. 2010, 96, 447–460. [Google Scholar] [CrossRef]
- Zhang, L.; Guo, X.; Zhao, T.; Xu, X.; Zheng, X.; Li, Y.; Luo, L.; Gui, K.; Zheng, Y.; Shu, Z. Effect of Large Topography on Atmospheric Environment in Sichuan Basin: A Climate Analysis Based on Changes in Atmospheric Visibility. Front. Earth Sci. 2022, 10, 997586. [Google Scholar] [CrossRef]
- Zhao, R.; Chen, B.; Zhang, W.; Yang, S.; Xu, X. Formation Mechanisms of Persistent Extreme Precipitation Events over the Eastern Periphery of the Tibetan Plateau: Synoptic Conditions, Moisture Transport and the Effect of Steep Terrain. Atmos. Res. 2024, 304, 107341. [Google Scholar] [CrossRef]
- National Tibetan Plateau Data Center. HUSI Letu East Asia-Pacific Cloud Macro- and Microphysical Properties Data Set (2016). 2022. Available online: https://data.tpdc.ac.cn/en/data/70c753d2-0471-4689-abab-798e2270c8b2/ (accessed on 8 September 2022).
- Letu, H.; Yang, K.; Nakajima, T.Y.; Ishimoto, H.; Nagao, T.M.; Riedi, J.; Baran, A.J.; Ma, R.; Wang, T.; Shang, H.; et al. High-Resolution Retrieval of Cloud Microphysical Properties and Surface Solar Radiation Using Himawari-8/AHI next-Generation Geostationary Satellite. Remote Sens. Environ. 2020, 239, 111583. [Google Scholar] [CrossRef]
- Hersbach, H.; Bell, B.; Berrisford, P.; Hirahara, S.; Horányi, A.; Muñoz-Sabater, J.; Nicolas, J.; Peubey, C.; Radu, R.; Schepers, D.; et al. The ERA5 Global Reanalysis. Q. J. R. Meteorol. Soc. 2020, 146, 1999–2049. [Google Scholar] [CrossRef]
- Baum, B.A.; Menzel, W.P.; Frey, R.A.; Tobin, D.C.; Holz, R.E.; Ackerman, S.A.; Heidinger, A.K.; Yang, P. MODIS Cloud-Top Property Refinements for Collection 6. J. Appl. Meteorol. Climatol. 2012, 51, 1145–1163. [Google Scholar] [CrossRef]
- Platnick, S.; King, M.D.; Meyer, K.G.; Wind, G.; Amarasinghe, N.; Marchant, B.; Arnold, G.T.; Zhang, Z.; Hubanks, P.A.; Ridgway, B.; et al. MODIS Cloud Optical Properties: User Guide for the Collection 6 Level-2 MOD06/MYD06 Product and Associated Level-3 Datasets. Version 2015, 1, 145. [Google Scholar]
- Hu, Y.; Rodier, S.; Xu, K.; Sun, W.; Huang, J.; Lin, B.; Zhai, P.; Josset, D. Occurrence, Liquid Water Content, and Fraction of Supercooled Water Clouds from Combined CALIOP/IIR/MODIS Measurements. J. Geophys. Res. 2010, 115, 2009JD012384. [Google Scholar] [CrossRef]
- Yu, R.; Wang, B.; Zhou, T. Climate Effects of the Deep Continental Stratus Clouds Generated by the Tibetan Plateau. J. Clim. 2004, 17, 2702–2713. [Google Scholar] [CrossRef]
- Qi, H.; Cai, F.; Lei, G.; Cao, H.; Shi, F. The Response of Three Main Beach Types to Tropical Storms in South China. Mar. Geol. 2010, 275, 244–254. [Google Scholar] [CrossRef]
- Yang, C.A.; Diao, M.; Gettelman, A.; Zhang, K.; Sun, J.; McFarquhar, G.; Wu, W. Ice and Supercooled Liquid Water Distributions Over the Southern Ocean Based on In Situ Observations and Climate Model Simulations. J. Geophys. Res. Atmos. 2021, 126, e2021JD036045. [Google Scholar] [CrossRef]
- Yang, S.; Zou, X. Temperature Profiles and Lapse Rate Climatology in Altostratus and Nimbostratus Clouds Derived from GPS RO Data. J. Clim. 2013, 26, 6000–6014. [Google Scholar] [CrossRef]
- Schiemann, R.; Lüthi, D.; Schär, C. Seasonality and Interannual Variability of the Westerly Jet in the Tibetan Plateau Region. J. Clim. 2009, 22, 2940–2957. [Google Scholar] [CrossRef]
- Zhao, S.; Feng, T.; Tie, X.; Wang, Z. The Warming Tibetan Plateau Improves Winter Air Quality in the Sichuan Basin, China. Atmos. Chem. Phys. 2020, 20, 14873–14887. [Google Scholar] [CrossRef]
- Liu, B.; Li, Y. Southwesterly Water Vapor Transport Induced by Tropical Cyclones over the Bay of Bengal during the South Asian Monsoon Transition Period. J. Meteorol. Res. 2022, 36, 140–153. [Google Scholar] [CrossRef]
- Ning, G.; Yim, S.H.L.; Wang, S.; Duan, B.; Nie, C.; Yang, X.; Wang, J.; Shang, K. Synergistic Effects of Synoptic Weather Patterns and Topography on Air Quality: A Case of the Sichuan Basin of China. Clim Dyn 2019, 53, 6729–6744. [Google Scholar] [CrossRef]
- Zhu, W.; Xu, X.; Zheng, J.; Yan, P.; Wang, Y.; Cai, W. The Characteristics of Abnormal Wintertime Pollution Events in the Jing-Jin-Ji Region and Its Relationships with Meteorological Factors. Sci. Total Environ. 2018, 626, 887–898. [Google Scholar] [CrossRef] [PubMed]
- Enz, J.W.; Hofman, V.; Thostenson, A. Air Temperature Inversions. NDSU Ext. 2019, 1705, 1–16. [Google Scholar]
- Zhang, J.; Zheng, Y.; Li, Z.; Xia, X.; Chen, H. A 17-Year Climatology of Temperature Inversions above Clouds over the ARM SGP Site: The Roles of Cloud Radiative Effects. Atmos. Res. 2020, 237, 104810. [Google Scholar] [CrossRef]
- Ricaud, P.; Del Guasta, M.; Lupi, A.; Roehrig, R.; Bazile, E.; Durand, P.; Attié, J.-L.; Nicosia, A.; Grigioni, P. Supercooled Liquid Water Clouds Observed over Dome C, Antarctica: Temperature Sensitivity and Surface Radiation Impact. Atmos. Chem. Phys. Discuss. 2022, 24, 613–630. [Google Scholar] [CrossRef]


Disclaimer/Publisher’s Note: The statements, opinions and data contained in all publications are solely those of the individual author(s) and contributor(s) and not of MDPI and/or the editor(s). MDPI and/or the editor(s) disclaim responsibility for any injury to people or property resulting from any ideas, methods, instructions or products referred to in the content. |
© 2024 by the authors. Licensee MDPI, Basel, Switzerland. This article is an open access article distributed under the terms and conditions of the Creative Commons Attribution (CC BY) license (https://creativecommons.org/licenses/by/4.0/).