


Quantitative Analysis of the Sloping Terrain on Al-Biruni’s Floor and Implications for the Cratering Process


Abstract
1. Introduction
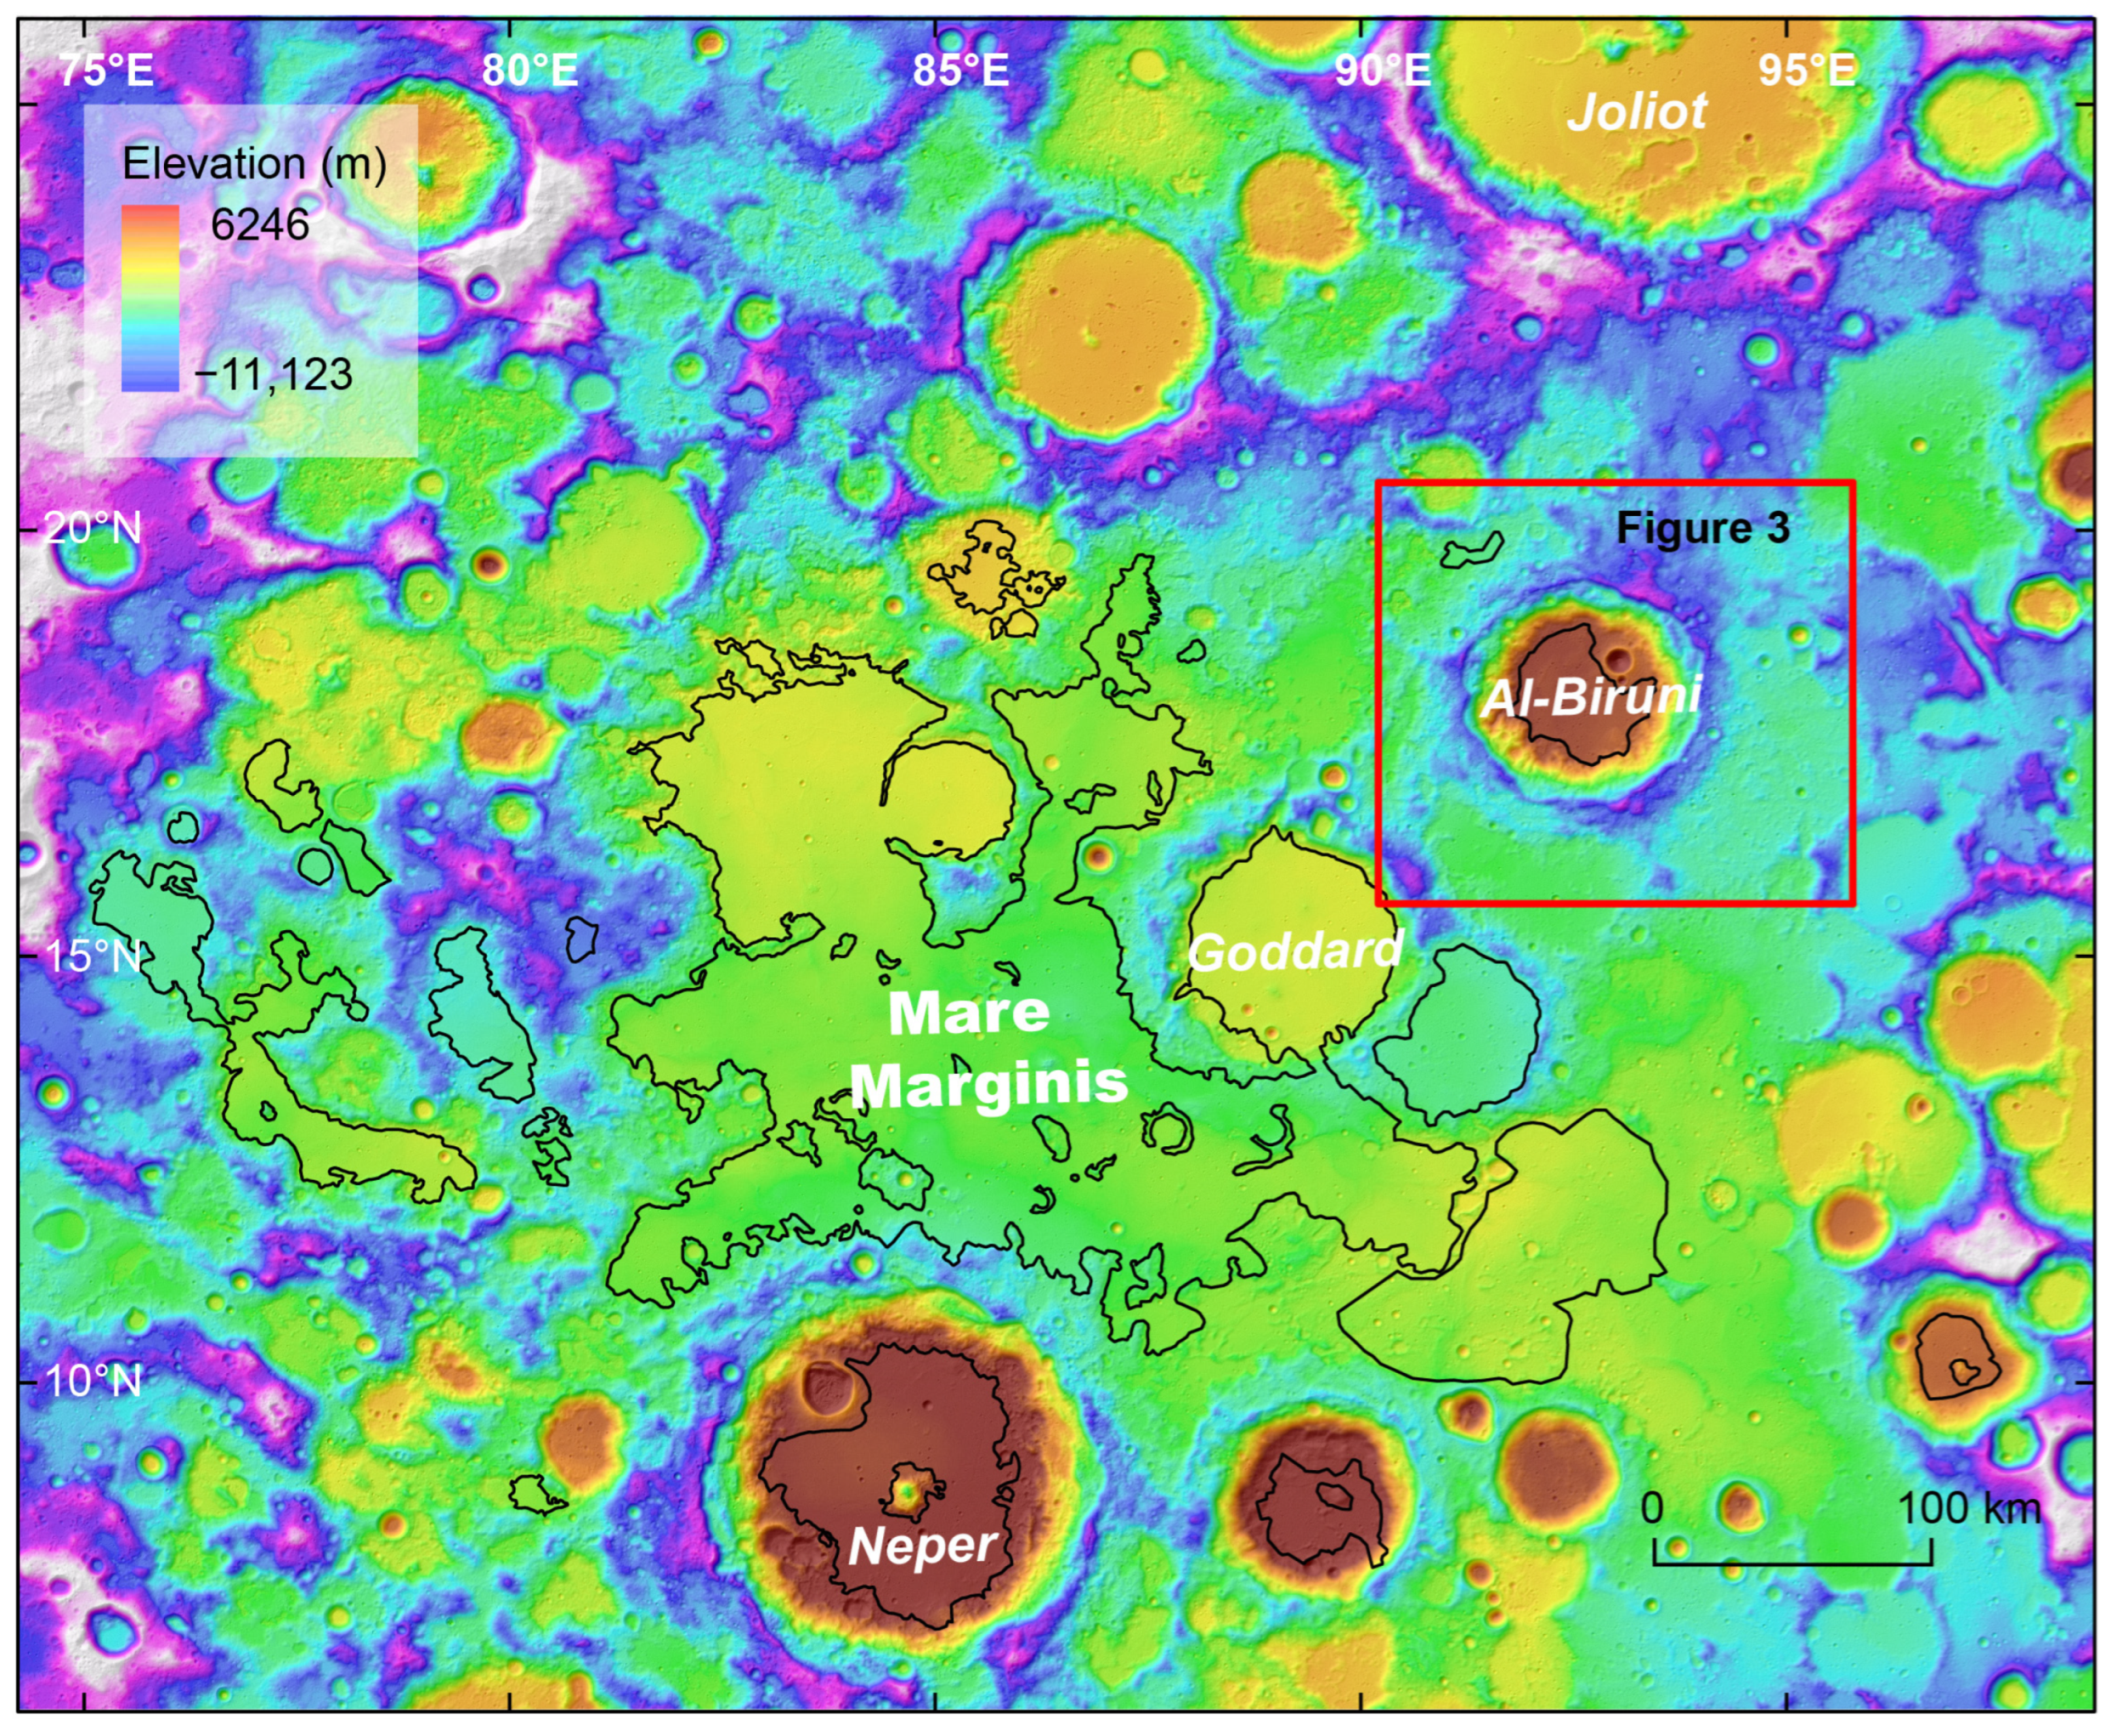
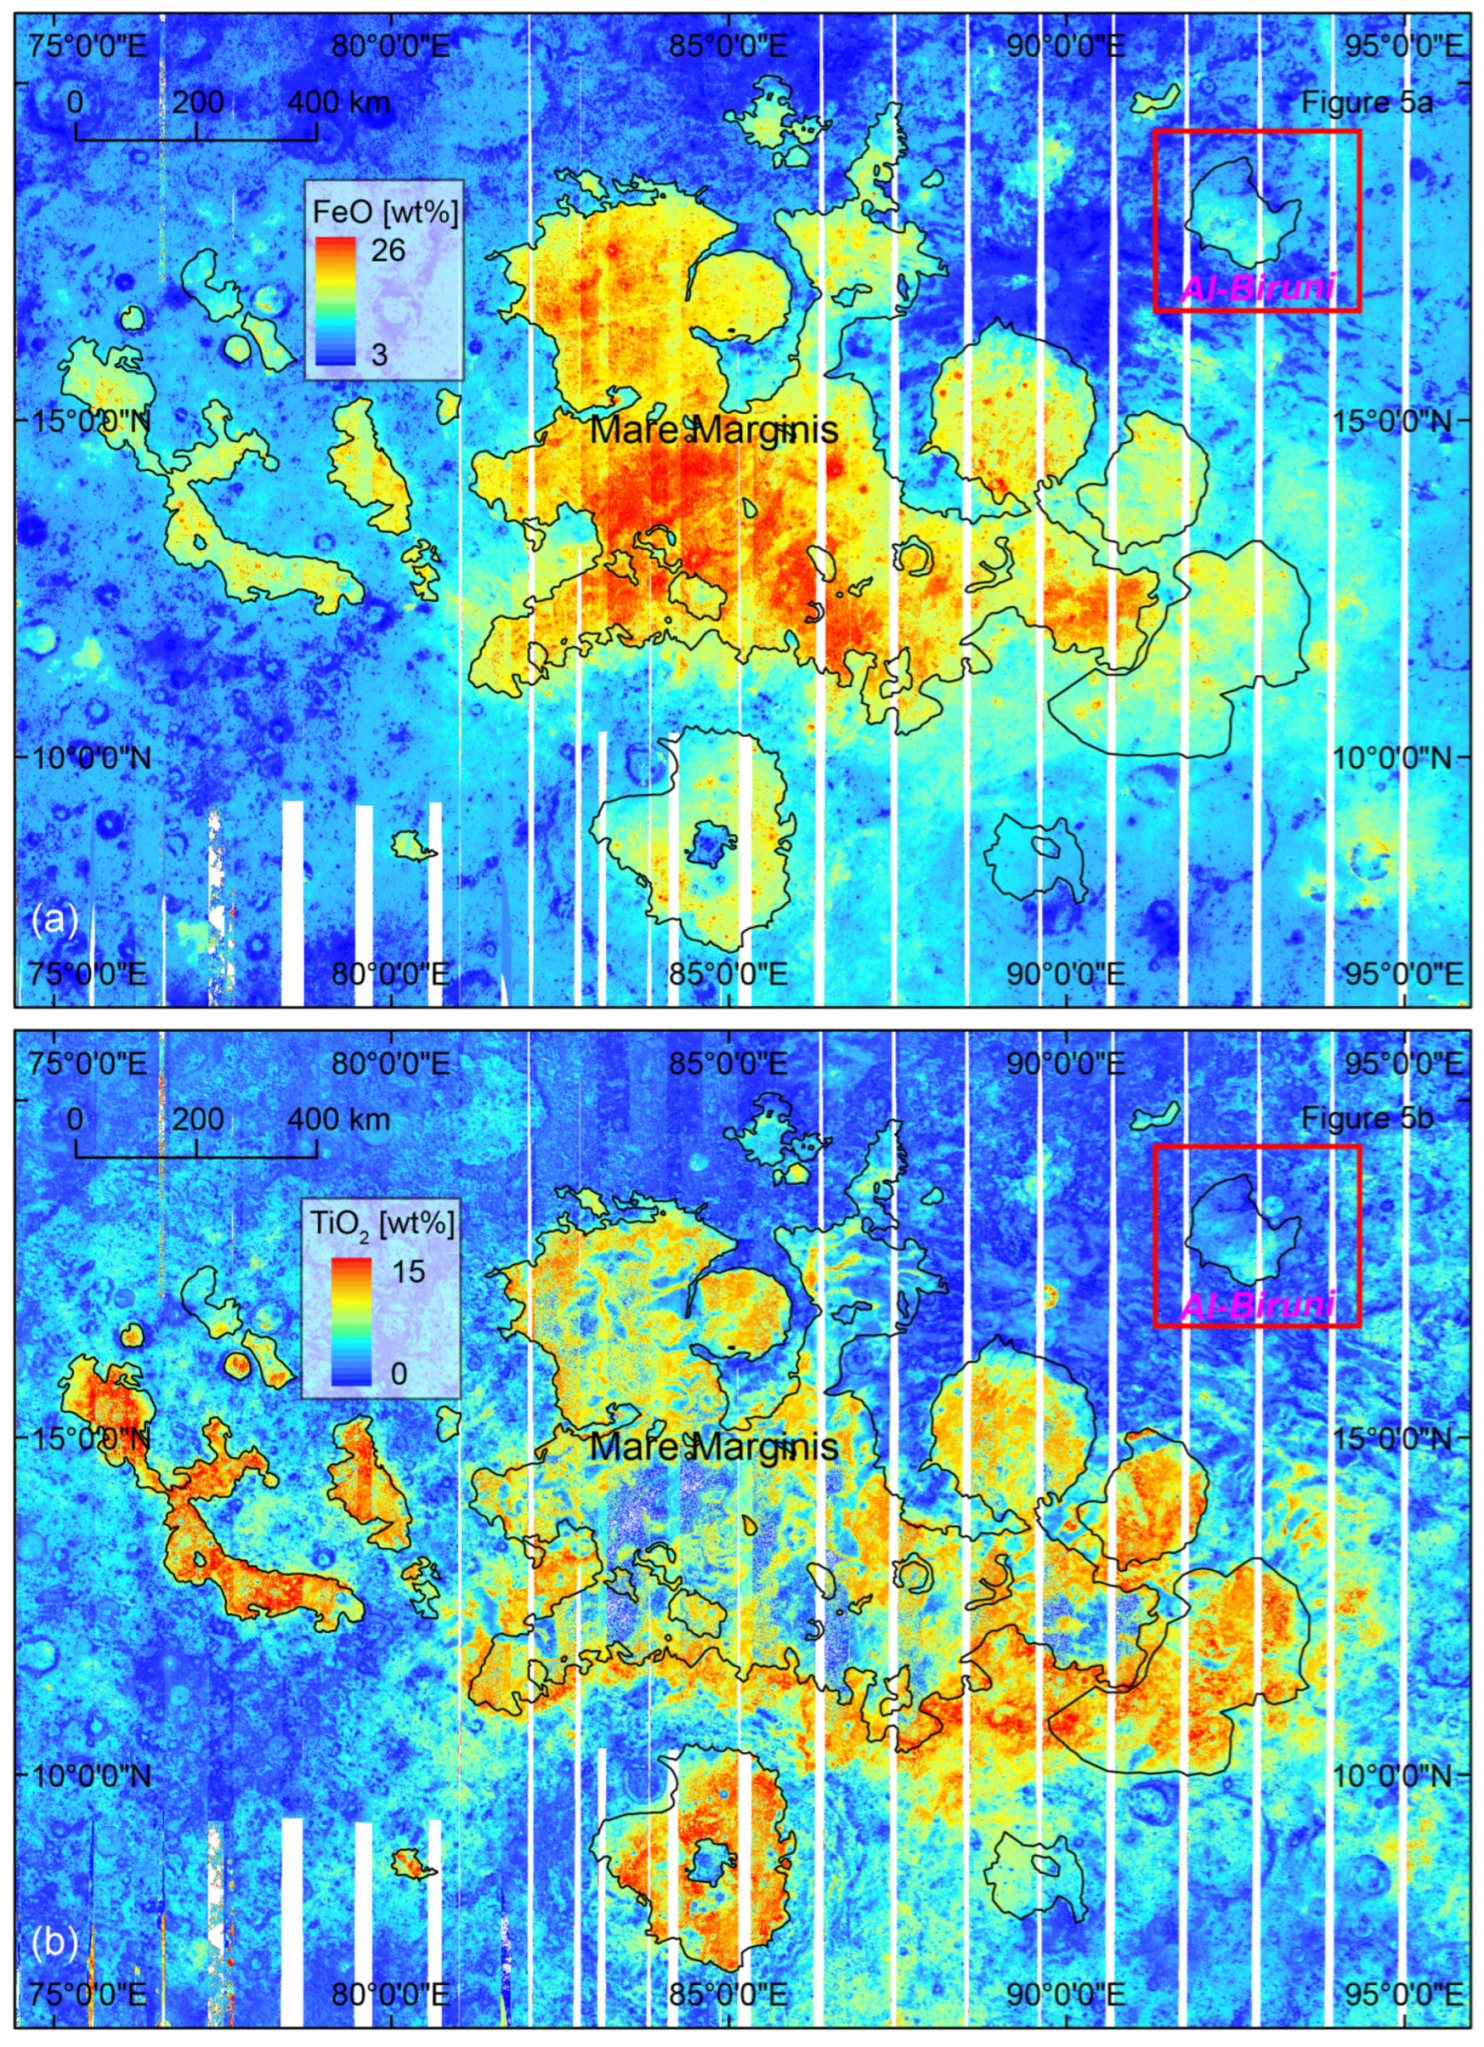
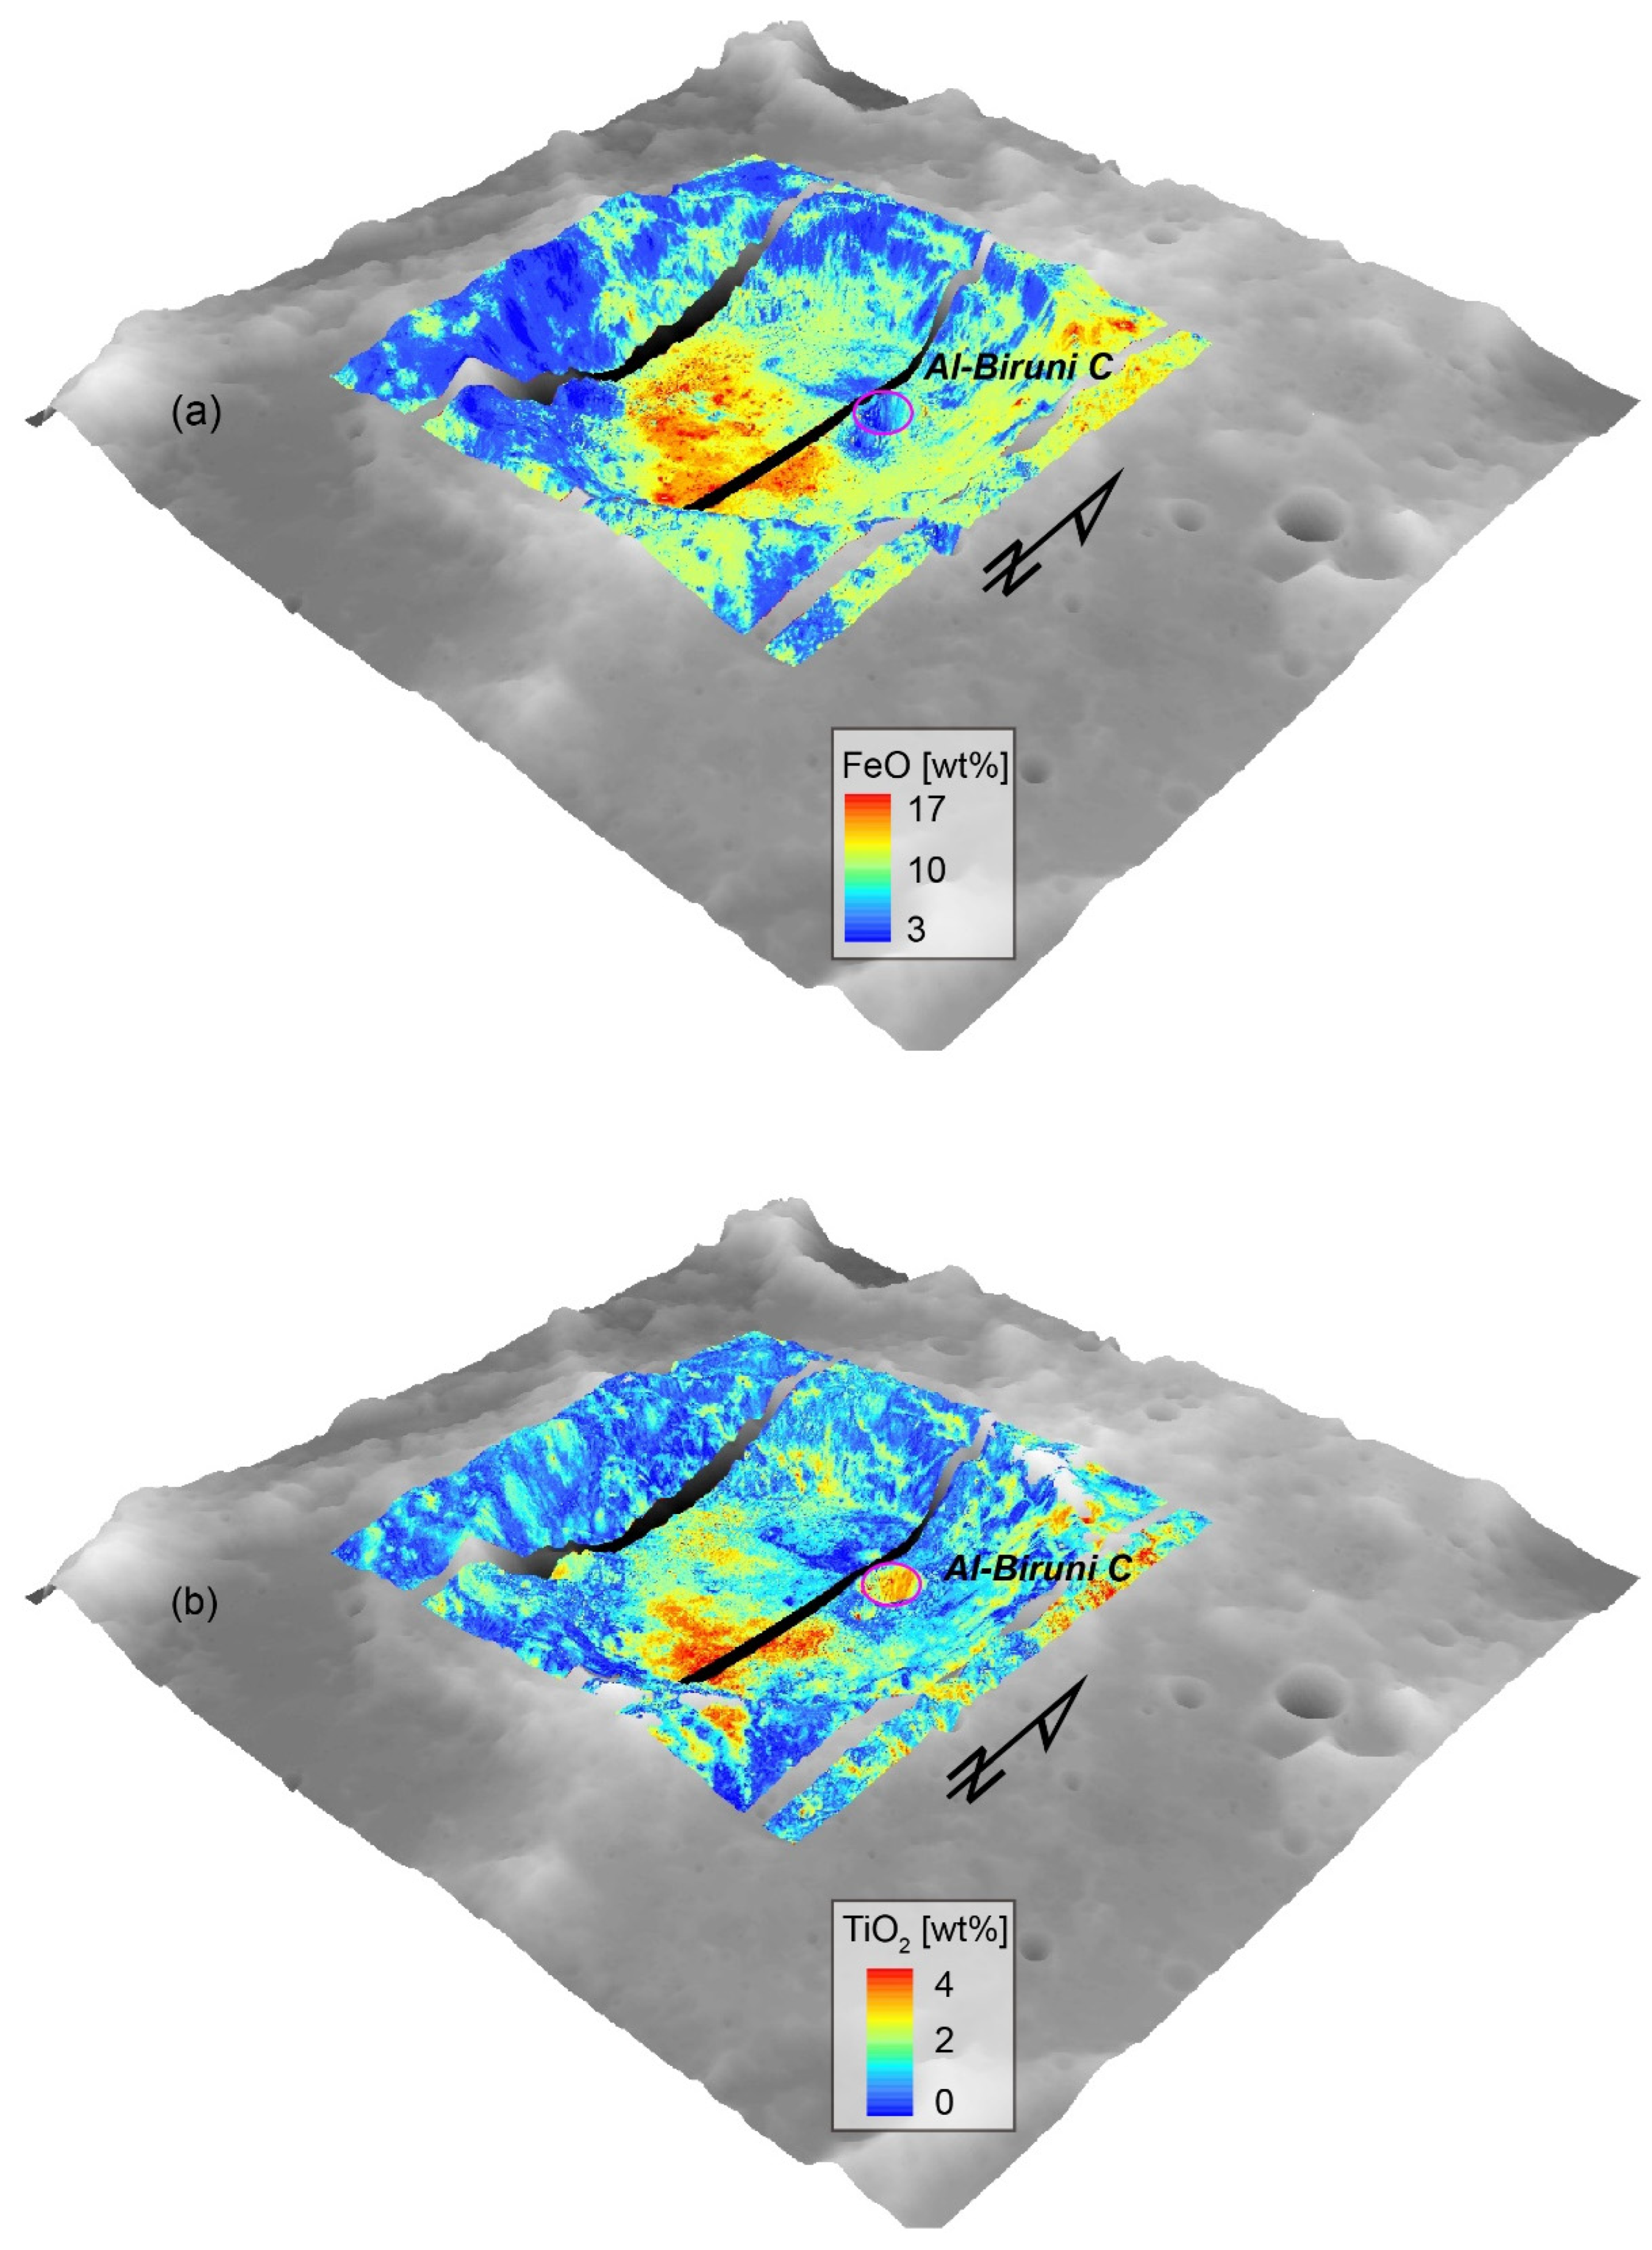
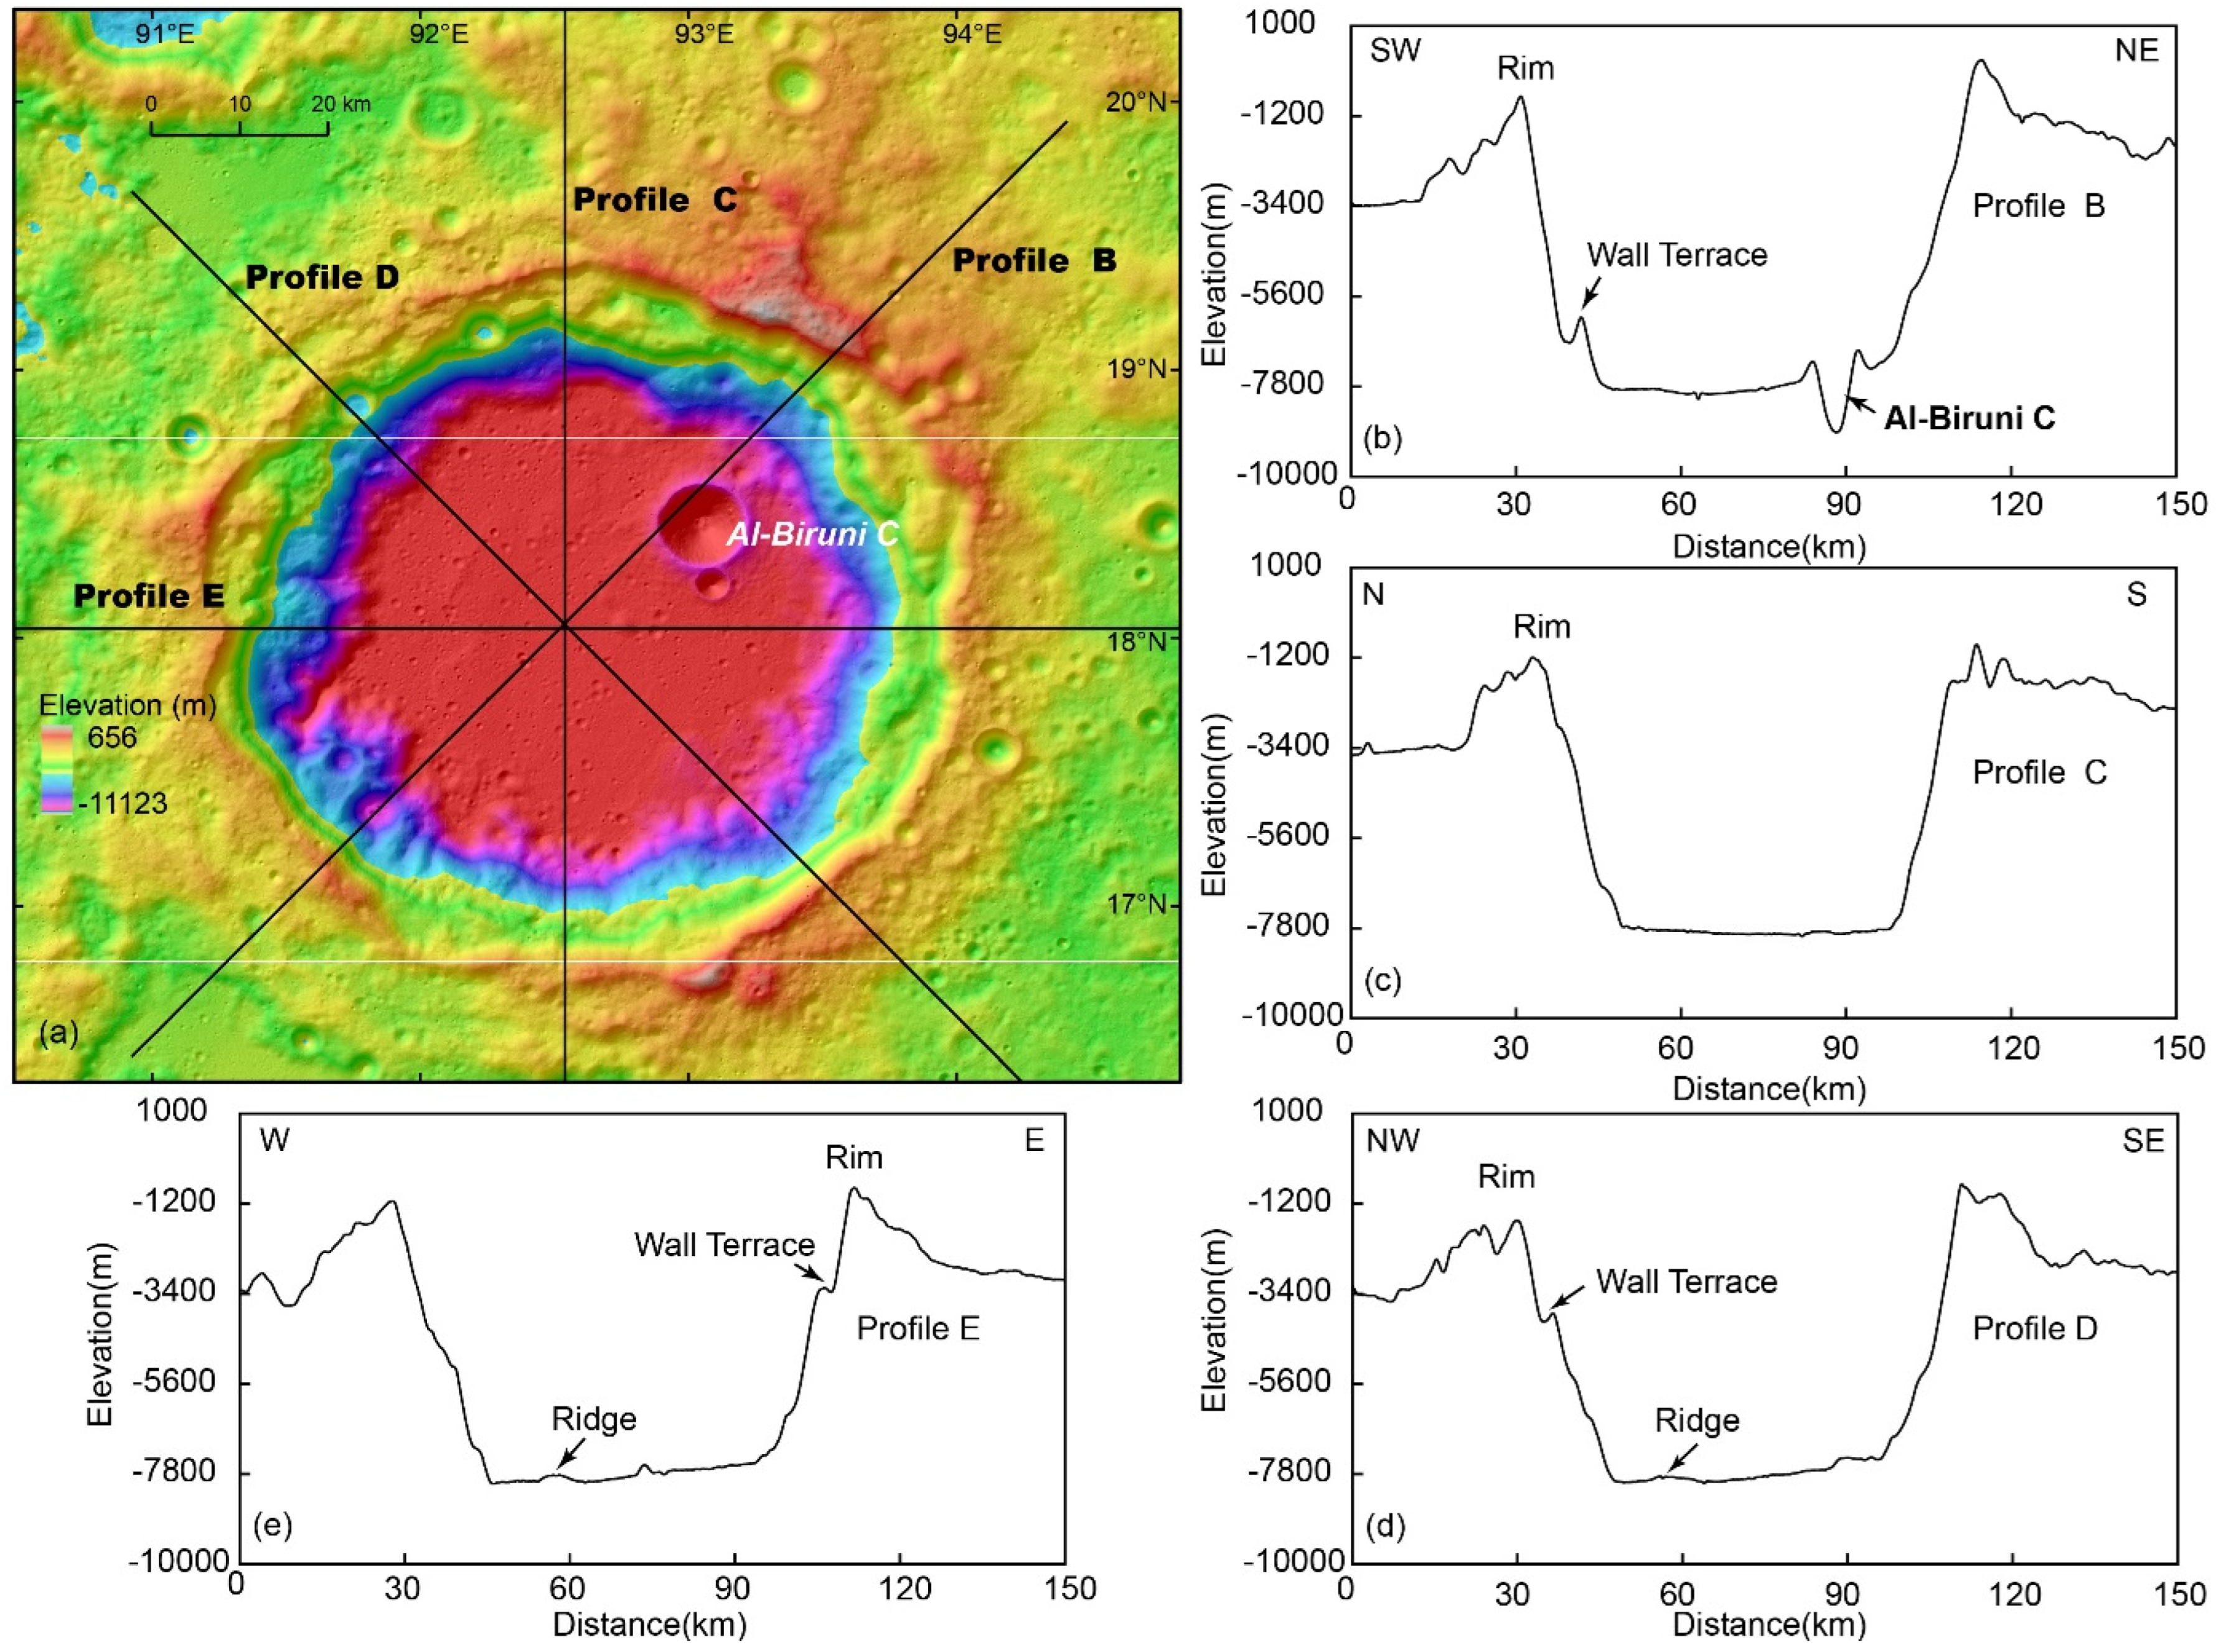
2. Geologic Setting
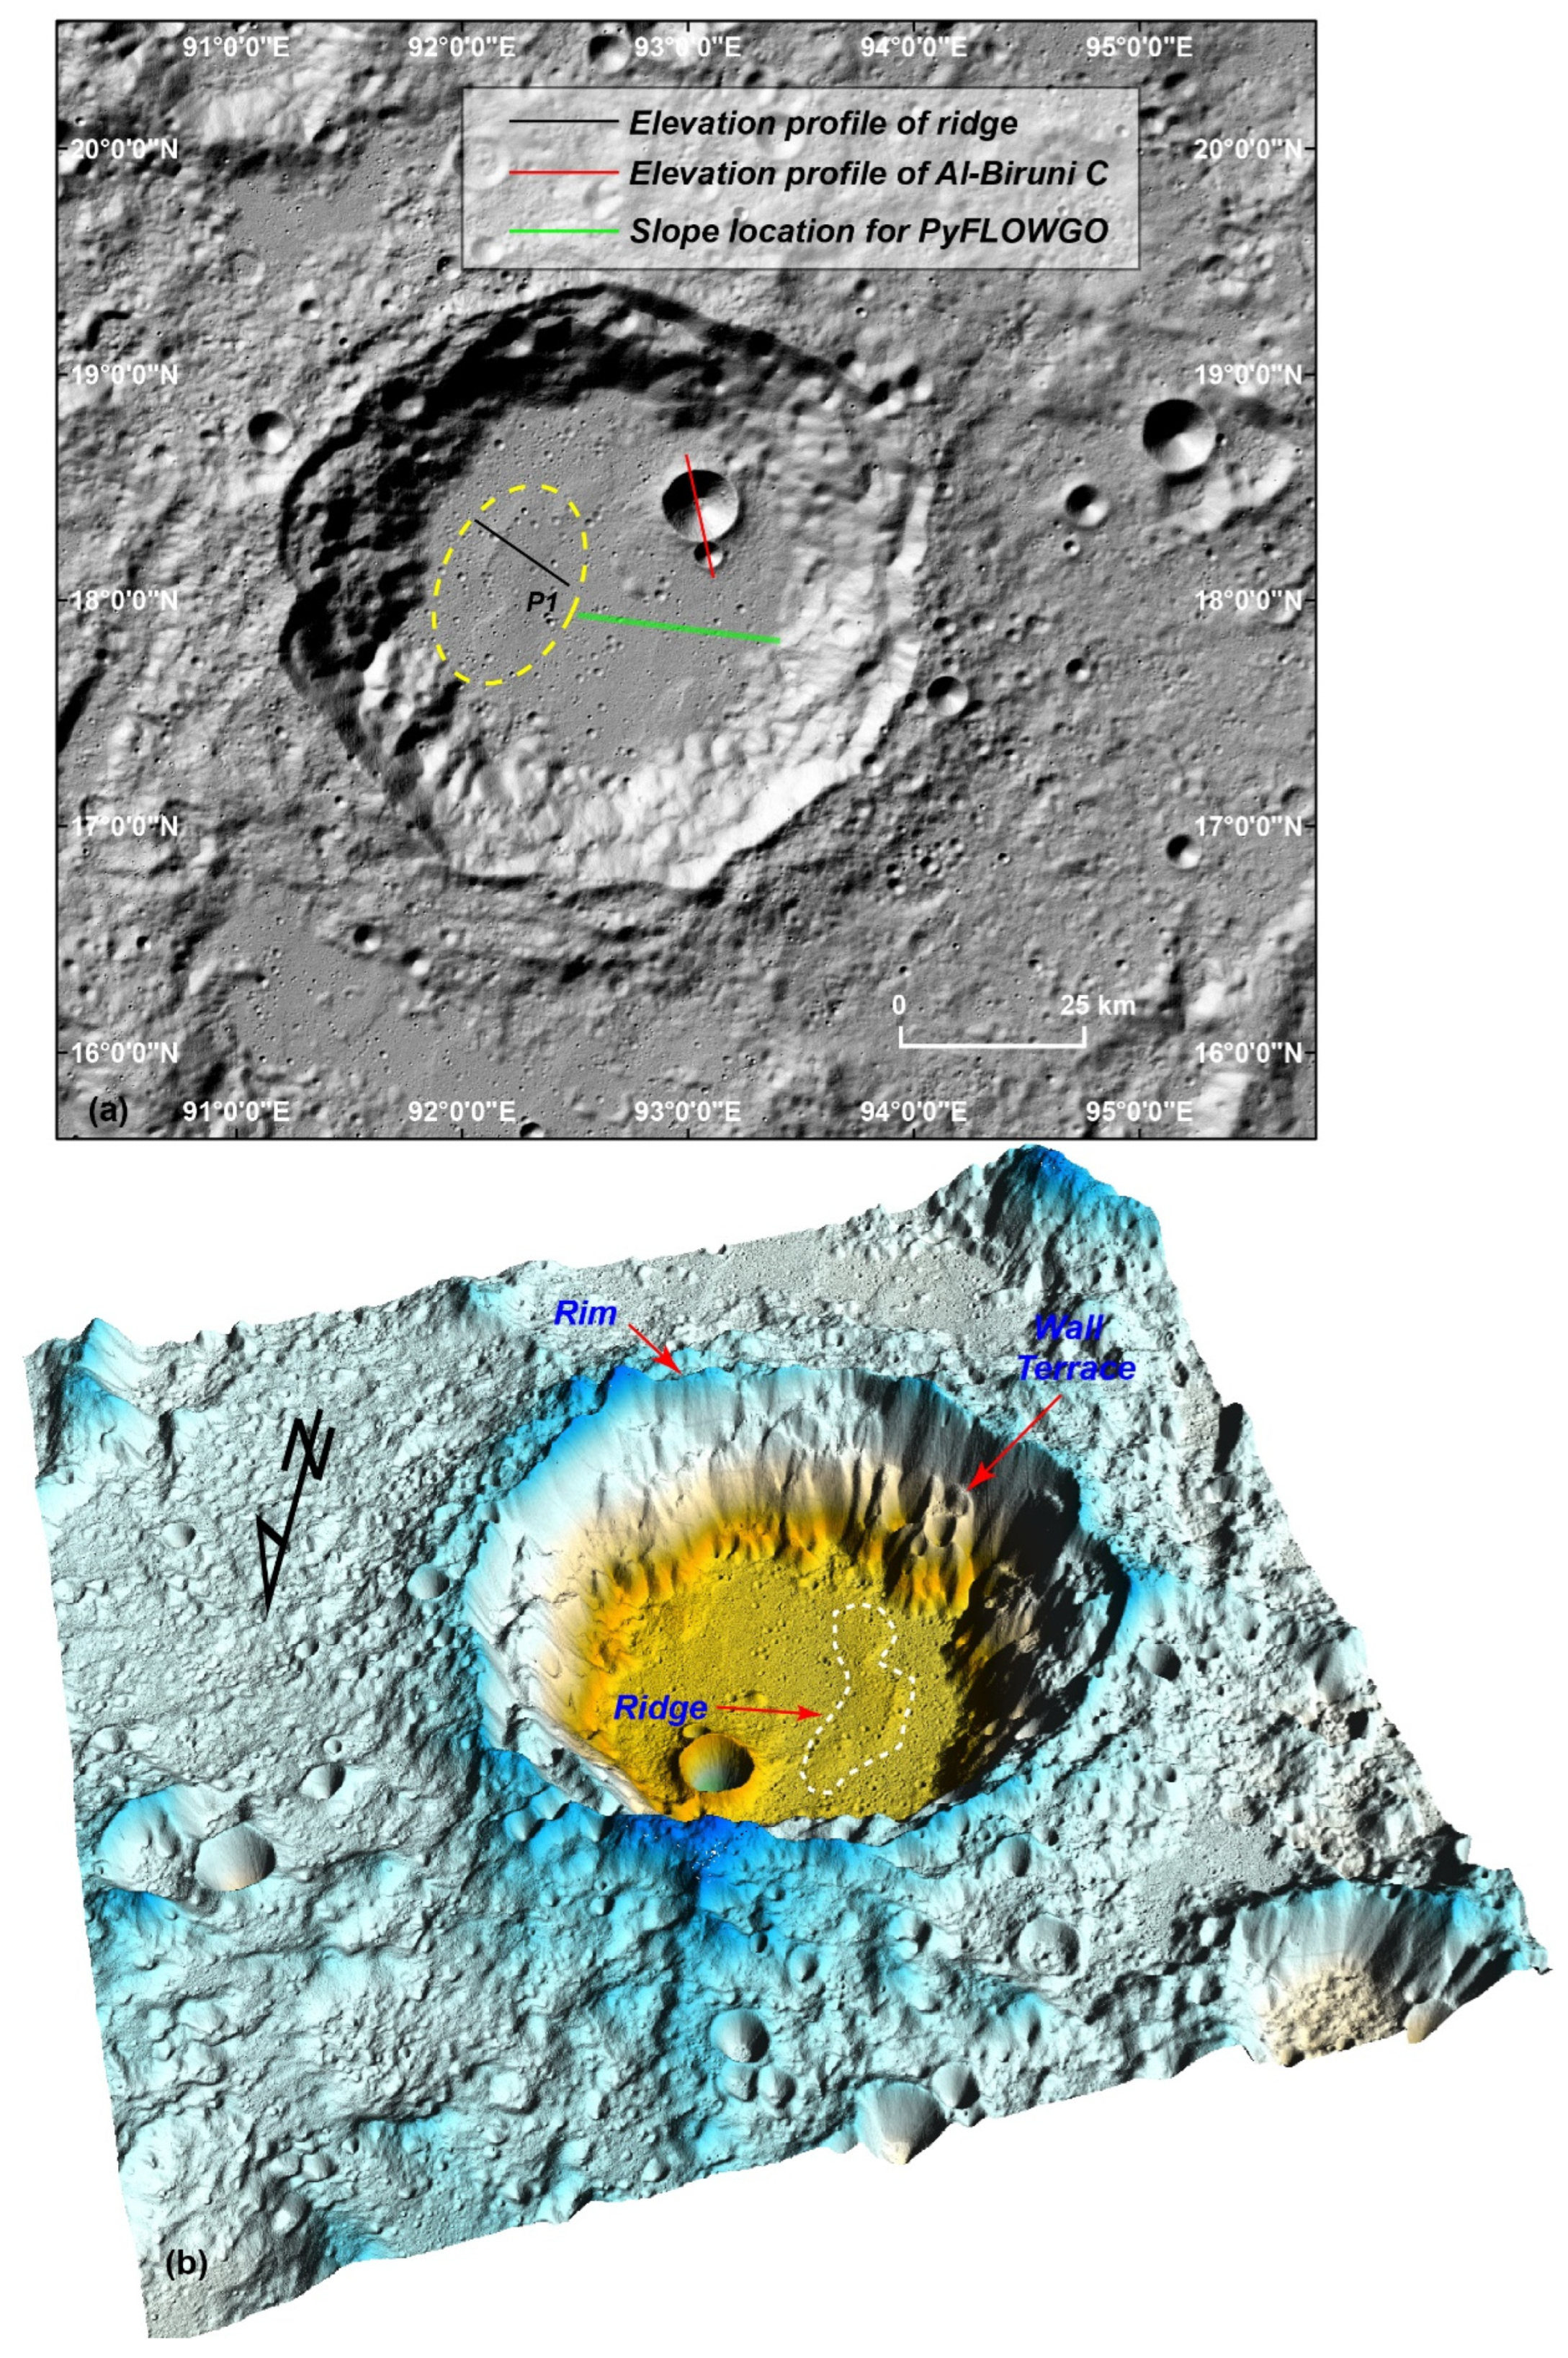
3. Methods and Data
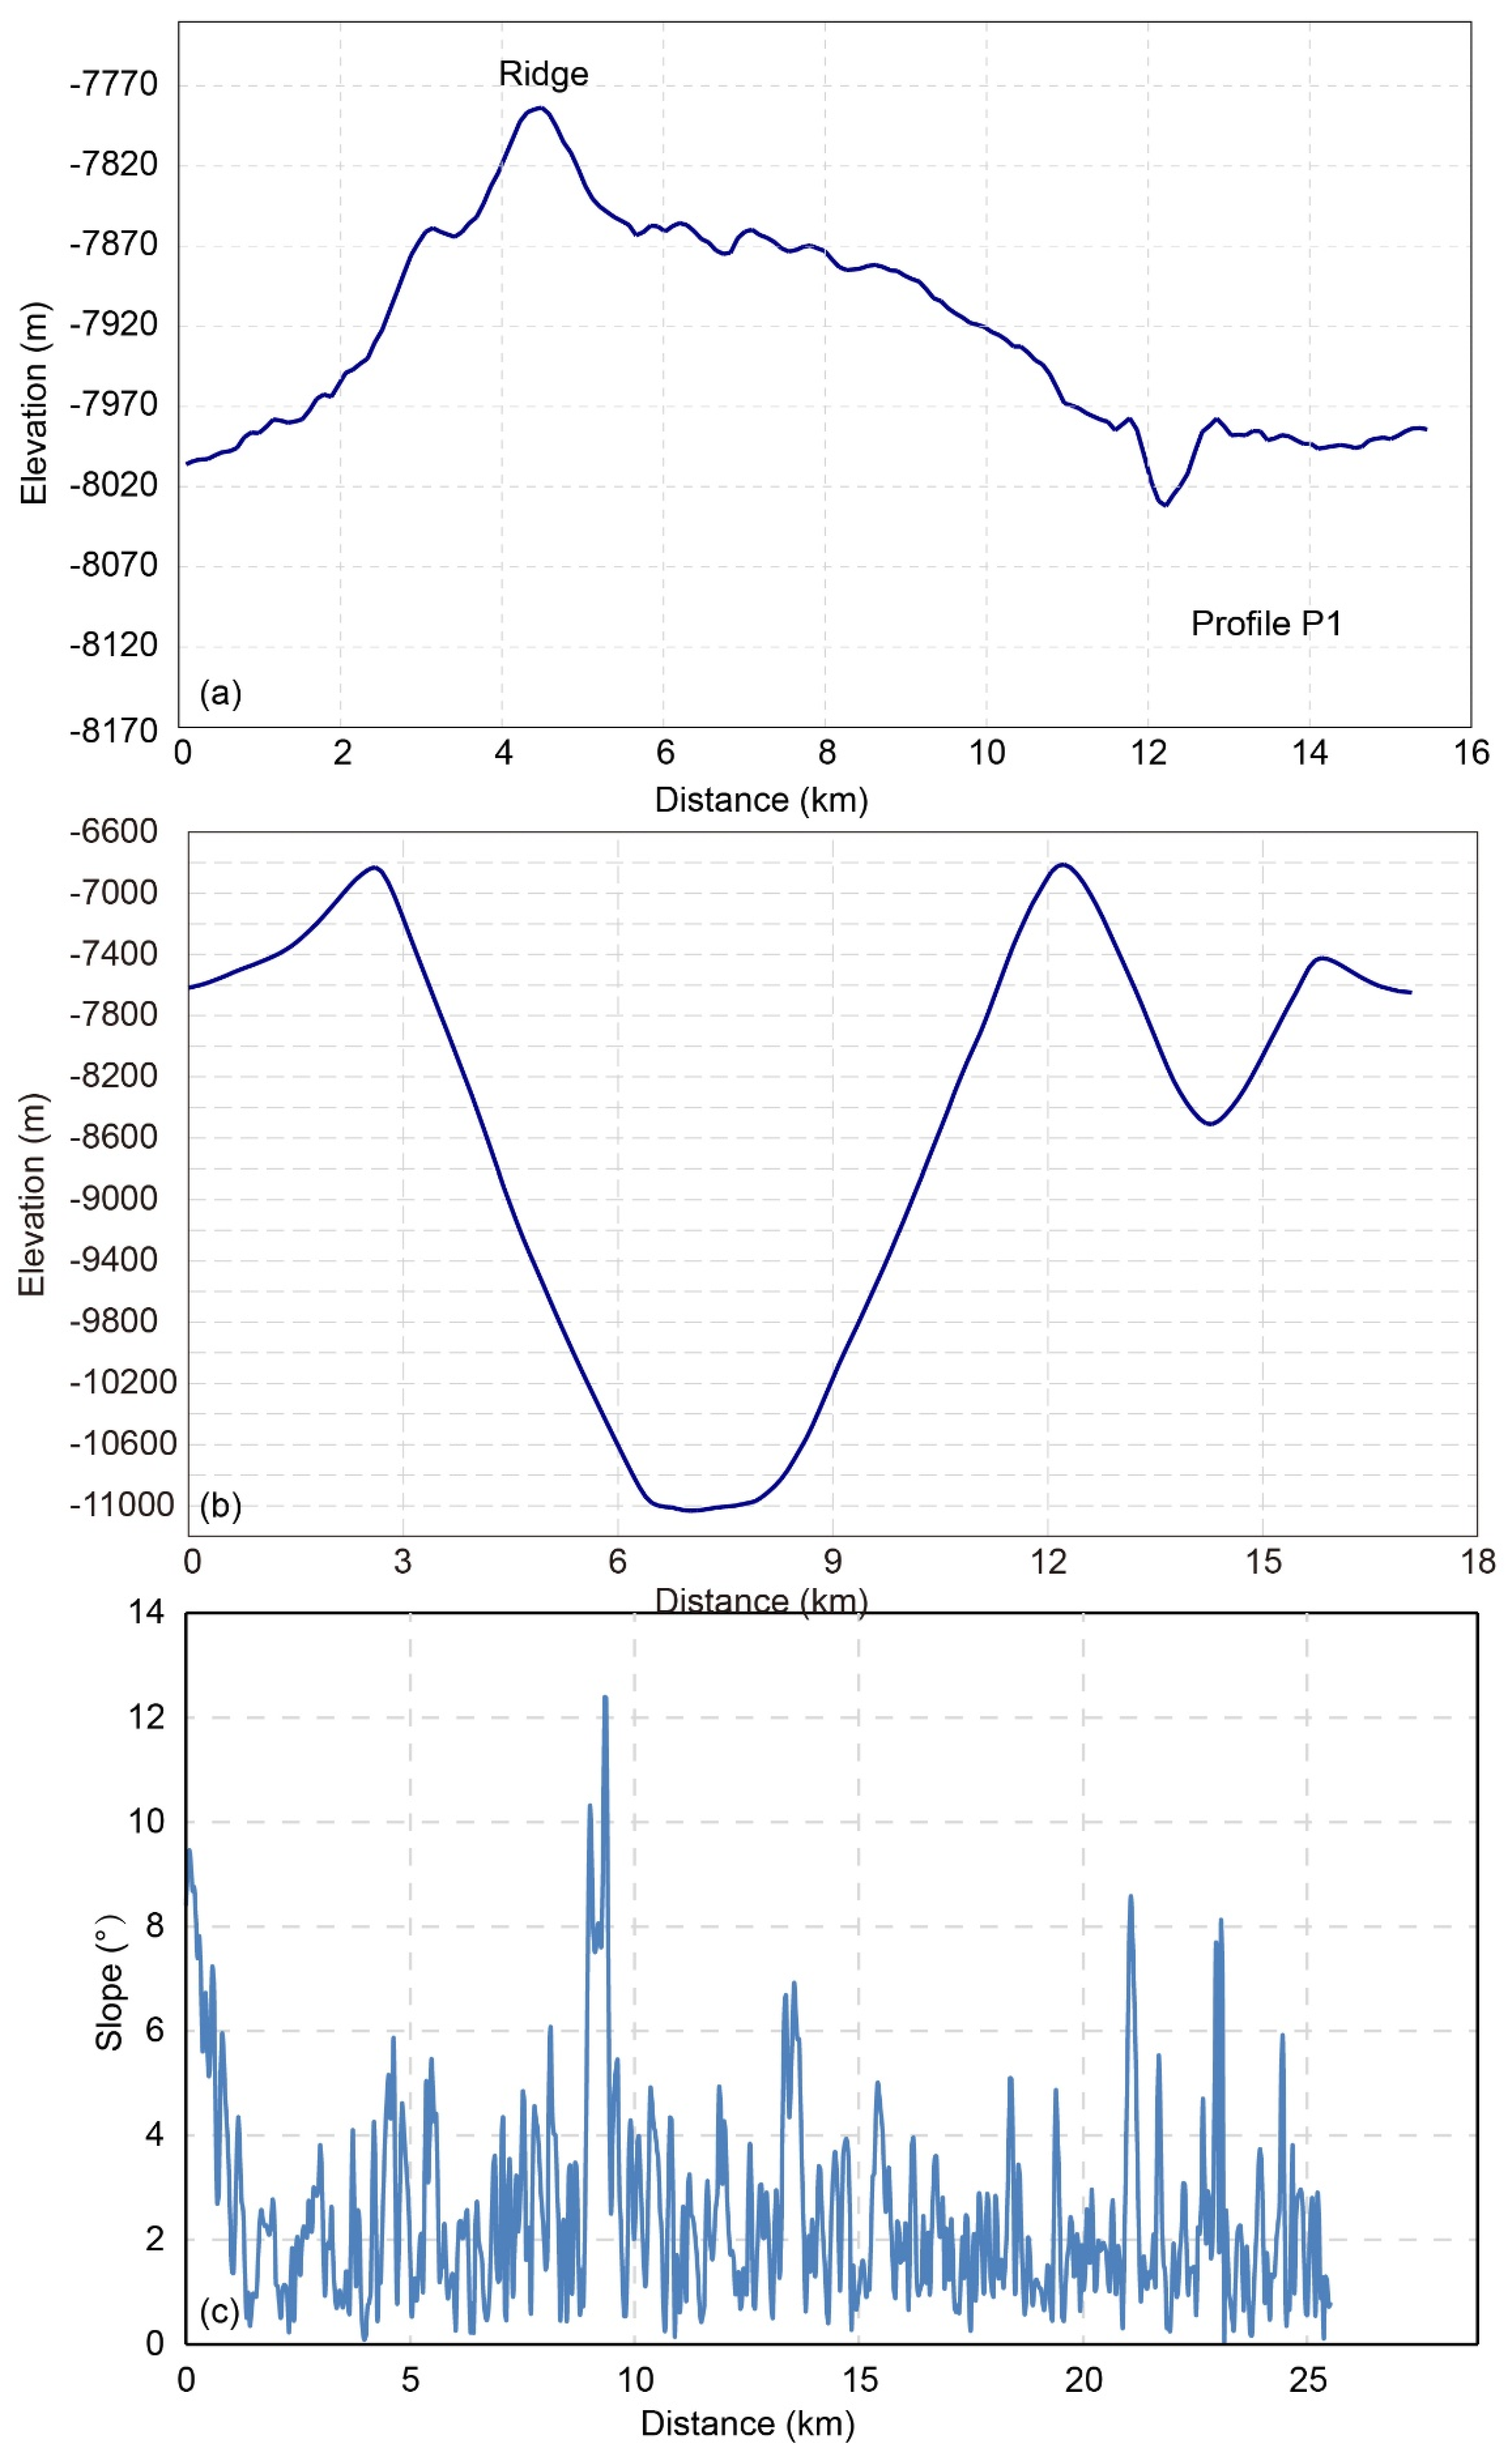
4. Results
5. Discussion
5.1. Possible Factors Influencing Elevation Differences on Crater Floor
5.2. Paradigm of Elevation Difference on Crater Floor
6. Conclusions
Supplementary Materials
Author Contributions
Funding
Data Availability Statement
Conflicts of Interest
References
- Osinski, G.R.; Tornabene, L.L.; Grieve, R.A.F. Impact ejecta emplacement on terrestrial planets. Earth Planet. Sci. Lett. 2011, 310, 167–181. [Google Scholar] [CrossRef]
- Michaut, C.; Pinel, V. Magma Ascent and Eruption Triggered by Cratering on the Moon. Geophys. Res. Lett. 2018, 45, 6408–6416. [Google Scholar] [CrossRef]
- Schultz, P.H. Floor-fractured lunar craters. Moon 1976, 15, 241–273. [Google Scholar] [CrossRef]
- Jozwiak, L.M.; Head, J.W.; Zuber, M.T.; Smith, D.E.; Neumann, G.A. Lunar floor-fractured craters: Classification, distribution, origin and implications for magmatism and shallow crustal structure. J. Geophys. Res. Planets 2012, 117. [Google Scholar] [CrossRef]
- Neish, C.D.; Herrick, R.R.; Zanetti, M.; Smith, D. The role of pre-impact topography in impact melt emplacement on terrestrial planets. Icarus 2017, 297, 240–251. [Google Scholar] [CrossRef]
- Kimi, K.B.; Harish; Vijayan, S. Mare filled craters on the Moon. Icarus 2023, 390, 115298. [Google Scholar] [CrossRef]
- Dhingra, D.; Head, J.W.; Pieters, C.M. Geological mapping of impact melt deposits at lunar complex craters Jackson and Tycho: Morphologic and topographic diversity and relation to the cratering process. Icarus 2017, 283, 268–281. [Google Scholar] [CrossRef]
- Thaker, A.D.; Patel, S.M.; Solanki, P.M. Morphological analysis and mapping of complex craters of Copernican age: Crookes, Ohm and Stevinus. Planet. Space Sci. 2020, 184, 104856. [Google Scholar] [CrossRef]
- Li, B.; Ling, Z.; Zhang, J.; Chen, J.; Liu, C.; Bi, X. Geological mapping of lunar highland crater Lalande: Topographic configuration, morphology and cratering process. Planet. Space Sci. 2018, 151, 85–96. [Google Scholar] [CrossRef]
- Liu, F.; Han, J.; Pei, J. Lava filling history of the herodotus crater on the aristarchus plateau: Insights from remote sensing observations. Planet. Space Sci. 2023, 238, 105784. [Google Scholar] [CrossRef]
- Margot, J.-L.; Campbell, D.B.; Jurgens, R.F.; Slade, M.A. The topography of Tycho Crater. J. Geophys. Res. Planets 1999, 104, 11875–11882. [Google Scholar] [CrossRef]
- Wilson, L.; Head, J.W. Impact melt sheets in lunar basins: Estimating thickness from cooling behavior. In Proceedings of the 42nd Annual Lunar and Planetary Science Conference, The Woodlands, TX, USA, 7–11 March 2011. [Google Scholar]
- Gulick, S.P.S.; Barton, P.J.; Christeson, G.L.; Morgan, J.V.; McDonald, M.; Mendoza-Cervantes, K.; Pearson, Z.F.; Surendra, A.; Urrutia-Fucugauchi, J.; Vermeesch, P.M.; et al. Importance of pre-impact crustal structure for the asymmetry of the Chicxulub impact crater. Nat. Geosci. 2008, 1, 131–135. [Google Scholar] [CrossRef]
- Nelson, D.; Koeber, S.; Daud, K.; Robinson, M.; Watters, T.; Banks, M.; Williams, N. Mapping lunar maria extents and lobate scarps using LROC image products. In Proceedings of the 45th Annual lunar and planetary science conference, The Woodlands, TX, USA, 17–21 March 2014; p. 2861. [Google Scholar]
- Panwar, N.; Srivastava, N.; Bhatt, M.; Bhardwaj, A. Compositional diversity in the Mare Marginis and Mare Smythii: An insight into the volcanism in the region. Icarus 2023, 395, 115496. [Google Scholar] [CrossRef]
- Head, J.W.; Wilson, L. Lunar mare volcanism: Stratigraphy, eruption conditions, and the evolution of secondary crusts. Geochim. Cosmochim. Acta 1992, 56, 2155–2175. [Google Scholar] [CrossRef]
- Robbins, S.J.; Hynek, B.M. A new global database of Mars impact craters ≥1 km: 1. Database creation, properties, and parameters. J. Geophys. Res. Planets 2012, 117. [Google Scholar] [CrossRef]
- Hiesinger, H.; Head, J.W., III; Wolf, U.; Jaumann, R.; Neukum, G. Ages and stratigraphy of lunar mare basalts: A synthesis. In Recent Advances and Current Research Issues in Lunar Stratigraphy; Ambrose, W.A., Williams, D.A., Eds.; Geological Society of America: Boulder, CO, USA, 2011; Volume 477, pp. 1–51. [Google Scholar]
- Gillis, J.J.; Spudis, P.D. Geology of the Smythii and Marginis region of the Moon: Using integrated remotely sensed data. J. Geophys. Res. Planets 2000, 105, 4217–4233. [Google Scholar] [CrossRef]
- Liu, D.; Wang, X.; Liu, J.; Liu, B.; Ren, X.; Chen, Y.; Chen, Z.; Zhang, H.; Zhang, G.; Zhou, Q.; et al. Spectral interpretation of late-stage mare basalt mineralogy unveiled by Chang’E-5 samples. Nat. Commun. 2022, 13, 5965. [Google Scholar] [CrossRef] [PubMed]
- Yang, C.; Zhang, X.; Bruzzone, L.; Liu, B.; Liu, D.; Ren, X.; Benediktsson, J.A.; Liang, Y.; Yang, B.; Yin, M.; et al. Comprehensive mapping of lunar surface chemistry by adding Chang’e-5 samples with deep learning. Nat. Commun. 2023, 14, 7554. [Google Scholar] [CrossRef]
- Wilhelms, D.E.; McCauley, J.F.; Trask, N.J. The Geologic History of the Moon; USGS: Reston, VA, USA, 1987. [Google Scholar]
- Frey, H. Previously unknown large impact basins on the Moon: Implications for lunar stratigraphy. Recent Adv. Curr. Res. Issues Lunar Stratigr. 2011, 477, 53–75. [Google Scholar]
- Neumann, G.A.; Zuber, M.T.; Wieczorek, M.A.; Head, J.W.; Baker, D.M.H.; Solomon, S.C.; Smith, D.E.; Lemoine, F.G.; Mazarico, E.; Sabaka, T.J.; et al. Lunar impact basins revealed by Gravity Recovery and Interior Laboratory measurements. Sci. Adv. 2015, 1, e1500852. [Google Scholar] [CrossRef]
- Otake, H.; Ohtake, M.; Hirata, N. Lunar iron and titanium abundance algorithms based on SELENE (Kaguya) Multiband Imager data. In Proceedings of the 43rd Annual Lunar and Planetary Science Conference, The Woodlands, TX, USA, 19–23 March 2012; p. 1905. [Google Scholar]
- Ohtake, M.; Pieters, C.; Isaacson, P.; Besse, S.; Yokota, Y.; Matsunaga, T.; Boardman, J.; Yamomoto, S.; Haruyama, J.; Staid, M. One Moon, many measurements 3: Spectral reflectance. Icarus 2013, 226, 364–374. [Google Scholar] [CrossRef]
- Lucey, P.G.; Blewett, D.T.; Jolliff, B.L. Lunar iron and titanium abundance algorithms based on final processing of Clementine ultraviolet-visible images. J. Geophys. Res. Planets 2000, 105, 20297–20305. [Google Scholar] [CrossRef]
- Lucey, P.G.; Blewett, D.T.; Taylor, G.J.; Hawke, B.R. Imaging of lunar surface maturity. J. Geophys. Res. Planets 2000, 105, 20377–20386. [Google Scholar] [CrossRef]
- Barker, M.K.; Mazarico, E.; Neumann, G.A.; Zuber, M.T.; Haruyama, J.; Smith, D.E. A new lunar digital elevation model from the Lunar Orbiter Laser Altimeter and SELENE Terrain Camera. Icarus 2016, 273, 346–355. [Google Scholar] [CrossRef]
- Chandnani, M.; Herrick, R.R.; Kramer, G.Y. Geologic Analyses of the Causes of Morphological Variations in Lunar Craters Within the Simple-to-Complex Transition. J. Geophys. Res. Planets 2019, 124, 1238–1265. [Google Scholar] [CrossRef]
- Melosh, H.J. Impact Cratering: A Geologic Process; Oxford University Press: New York, NY, USA, 1989. [Google Scholar]
- Pike, R.J. Size-dependence in the shape of fresh impact craters on the moon. In Impact and Explosion Cratering: Planetary and Terrestrial Implications, Proceedings of the Symposium on Planetary Cratering Mechanics, Flagstaff, AZ, USA, 13–17 September 1977; Lunar Science Institute: Houston, TX, USA, 1977; pp. 489–507. [Google Scholar]
- Krüger, T.; Hergarten, S.; Kenkmann, T. Deriving Morphometric Parameters and the Simple-to-Complex Transition Diameter From a High-Resolution, Global Database of Fresh Lunar Impact Craters (D ≥ ~3 km). J. Geophys. Res. Planets 2018, 123, 2667–2690. [Google Scholar] [CrossRef]
- Chevrel, M.O.; Labroquère, J.; Harris, A.J.L.; Rowland, S.K. PyFLOWGO: An open-source platform for simulation of channelized lava thermo-rheological properties. Comput. Geosci. 2018, 111, 167–180. [Google Scholar] [CrossRef]
- Lev, E.; Hamilton, C.W.; Voigt, J.R.C.; Stadermann, A.C.; Zhan, Y.; Neish, C.D. Emplacement conditions of lunar impact melt flows. Icarus 2021, 369, 114578. [Google Scholar] [CrossRef]
- Jozwiak, L.M.; Head, J.W.; Wilson, L. Lunar floor-fractured craters as magmatic intrusions: Geometry, modes of emplacement, associated tectonic and volcanic features, and implications for gravity anomalies. Icarus 2015, 248, 424–447. [Google Scholar] [CrossRef]
- Walwer, D.; Michaut, C.; Pinel, V.; Adda-Bedia, M. Magma ascent and emplacement below floor fractured craters on the Moon from floor uplift and fracture length. Phys. Earth Planet. Inter. 2021, 312, 106658. [Google Scholar] [CrossRef]
- Wilson, L.; Head, J.W. Lunar floor-fractured craters: Modes of dike and sill emplacement and implications of gas production and intrusion cooling on surface morphology and structure. Icarus 2018, 305, 105–122. [Google Scholar] [CrossRef]
- Wilson, L.; Head, J.W. Generation, ascent and eruption of magma on the Moon: New insights into source depths, magma supply, intrusions and effusive/explosive eruptions (Part 1: Theory). Icarus 2017, 283, 146–175. [Google Scholar] [CrossRef]
- Dhingra, D.; Head, J.; Pieters, C.M. Elevation Differences on the Floors of Complex Craters: Insights into the Crater Evolution Processes. In Proceedings of the 47th Annual Lunar and Planetary Science Conference, The Woodlands, TX, USA, 21–25 March 2016. [Google Scholar]
- Bratt, S.R.; Solomon, S.C.; Head, J.W. The evolution of impact basins: Cooling, subsidence, and thermal stress. J. Geophys. Res. Solid Earth 1985, 90, 12415–12433. [Google Scholar] [CrossRef]
- Broquet, A.; Andrews-Hanna, J.C. The moon before mare. Icarus 2024, 408, 115846. [Google Scholar] [CrossRef]
- Murase, T.; McBirney, A.R. Viscosity of Lunar Lavas. Science 1970, 167, 1491–1493. [Google Scholar] [CrossRef]
- Rhéty, M.; Harris, A.; Villeneuve, N.; Gurioli, L.; Médard, E.; Chevrel, O.; Bachélery, P. A comparison of cooling-limited and volume-limited flow systems: Examples from channels in the Piton de la Fournaise April 2007 lava-flow field. Geochem. Geophys. Geosyst. 2017, 18, 3270–3291. [Google Scholar] [CrossRef]
- Davis, E.; Wilson, L.; Chen, Y.; Head, J. Rheology and Flow Dynamics of Lunar Lava Flows. In Proceedings of the 53rd Lunar and Planetary Science Conference, Houston, TX, USA, 7–11 March 2022. [Google Scholar]


| Parameter | Empirical Equation | Results (km) |
|---|---|---|
| Central peak height Hpeak | 0.005D1.297 | 1.5 |
Disclaimer/Publisher’s Note: The statements, opinions and data contained in all publications are solely those of the individual author(s) and contributor(s) and not of MDPI and/or the editor(s). MDPI and/or the editor(s) disclaim responsibility for any injury to people or property resulting from any ideas, methods, instructions or products referred to in the content. |
© 2024 by the authors. Licensee MDPI, Basel, Switzerland. This article is an open access article distributed under the terms and conditions of the Creative Commons Attribution (CC BY) license (https://creativecommons.org/licenses/by/4.0/).
Share and Cite
Liu, F.; Ma, Y.; Ha, G. Quantitative Analysis of the Sloping Terrain on Al-Biruni’s Floor and Implications for the Cratering Process. Remote Sens. 2024, 16, 3645. https://doi.org/10.3390/rs16193645
Liu F, Ma Y, Ha G. Quantitative Analysis of the Sloping Terrain on Al-Biruni’s Floor and Implications for the Cratering Process. Remote Sensing. 2024; 16(19):3645. https://doi.org/10.3390/rs16193645
Chicago/Turabian StyleLiu, Feng, Yuanxu Ma, and Guanghao Ha. 2024. "Quantitative Analysis of the Sloping Terrain on Al-Biruni’s Floor and Implications for the Cratering Process" Remote Sensing 16, no. 19: 3645. https://doi.org/10.3390/rs16193645
APA StyleLiu, F., Ma, Y., & Ha, G. (2024). Quantitative Analysis of the Sloping Terrain on Al-Biruni’s Floor and Implications for the Cratering Process. Remote Sensing, 16(19), 3645. https://doi.org/10.3390/rs16193645