Abstract
Drought is a widespread natural hazard resulting from an extended period of reduced rainfall, with significant socioeconomic and ecological consequences. Drought severity can impact food security globally due to its high spatial and temporal coverage. The primary objective of this paper consists of a comparative spatiotemporal analysis of environmental extremes (drought/wetness) through the estimation of a twelve-month Standardized Precipitation Index (SPI12) between three distinct vulnerable agricultural regions in the Mediterranean basin (i.e., Spain, Lebanon and Tunisia), under a climate change environment in the last 38 years (1982–2020). The added value of this paper lies in the simultaneous estimation of temporal and spatial variability of drought and wetness periodic events, paying special attention to the geographical patterns of these extremes both in annual and interannual (seasonal) time scales. The results indicated that Spain and Tunisia (western Mediterranean) exhibit similar patterns over the studied period, while Lebanon demonstrates contrasting trends. Comparing the two extreme dry hydrological years, the Spanish study area faced the highest drought intensity, areal extent and duration (SPI12 = −1.18; −1.84; 28–78%; 9–12 months), followed by the Lebanese (SPI12 = −1.28; −1.39; 37–50%; 7–12 months) and the Tunisian ones (SPI12 = −1.05; −1.08; 10–34%; 8 months). Concerning the wettest hydrological years, the Lebanese study domain has recorded the highest SPI12 values, areal extent and duration (SPI12 = 1.58; 2.28; 66–83%; 8–11 months), followed by the Tunisian (SPI12 = 1.55; 1.79; 49–73%; 7–10 months) and Spanish one (SPI12 = 1.07; 1.99; 21–73%; 4–11 months). The periodicity of drought/wetness episodes is about 20 years in Spanish area and 10 years in the Lebanese area (for drought events), whereas there seems no periodicity in the Tunisian one. Understanding the spatial distribution of drought is crucial for targeted mitigation strategies in high-risk areas, potentially avoiding broad, resource-intensive measures across entire regions.
1. Introduction
Drought is a global natural phenomenon that originates from a prolonged period of rainfall shortage and may provoke severe socioeconomic and ecological implications [1,2]. Both historical precipitation data and drought-based models indicate the escalating risk of aridity over many territories around the world, highlighting the necessity of taking appropriate measures for climate change mitigation [3]. The magnitude of drought may affect food security in many countries due to its high spatial and temporal coverage. One more critical aspect of drought monitoring/prevention/management is related to the type of drought confrontation. Public authorities usually provide financial assistance after the event breaks out to relieve the affected population, whereas non-structural measures focusing on drought mitigation (e.g., development of water conservation systems; use of forecasting models, etc.) would enhance the society’s resilience and preparedness [4].
There are several definitions of drought within the framework of hydrosphere. As a result, many studies have focused on these distinct dimensions of drought. Drought is an atmospheric phenomenon. However, different types of drought hazards are considered [1]. Specifically, meteorological drought is primarily related to the deficiency or lack of precipitation [5]; agricultural drought is related to soil moisture deficiency [6]; hydrological drought goes deeper affecting the quantity of surface and groundwater potential, increasing the risk of water quality degradation [7]; socioeconomic drought is related to the shortage of water as an economic good to support the demand for fulfilling the essential economic activities of a society [8]. Beyond direct drought impacts on crop productivity and health [9], drought may have severe side effects affecting a significant number of ecosystems services, such as the initiation of high-severity wildfires [10,11], which require the adoption of additional and demanding preventative measures [12,13]. Hence, drought quantification is considered of utmost importance leading to the timely adoption of counterbalancing measures to tackle this complex environmental hazard.
Drought quantification can be estimated through the calculation of specific indicators and indices. There are several widely used drought indices based on conventional and/or remotely sensed data [14,15,16,17]. Traditional drought quantification methods are primarily based on conventional meteorological data. However, there is a shortage of this type of data in many regions worldwide, whereas these data are characterized by inaccuracy and unavailability at least for real-time purposes [18]. On the contrary, satellite-based data are characterized by increasing reliability and gradually high temporal resolution providing a constant flow of this type of data contributing to more effective assessment and monitoring of drought hazards and their expected implications [19,20,21].
Many indices have been developed for drought quantification [22,23,24,25,26,27,28]. As a result, decision-makers can plan the most suitable counterbalancing measures for drought mitigation. Some of the most representative indices, which have been used by many researchers, consist of (i) the Aridity Index, which examines the synergistic effect of precipitation and evapotranspiration [29] and is a climatic feature of a region; (ii) the Standardized Precipitation Index (SPI), which relies on the probability of precipitation and the estimation of deviations from normal conditions (i.e., dry/wet conditions) [30,31]; the Palmer Drought Severity Index, which considers the effect of precipitation and temperature on soil moisture [32]; the Reconnaissance Drought Index (RDI) [33], or the Standardized Precipitation Evapotranspiration Index (SPEI) [34], which examine the relation of precipitation to potential evapotranspiration, namely RDI the ratio and SPEI the difference, respectively.
In this context, [35] estimated the drought and wetness changes for more than 50 years through the application of SPI and RDI, using conventional data (i.e., derived from weather stations) on an annual and seasonal basis. The superiority of SPI has been confirmed by a recent study [36] where the authors conducted a comparative assessment of nine drought indices in a high drought prone area. Similarly, [37] proceeded to a monthly SPI-based spatiotemporal analysis estimating the probability of occurrence of severe drought. Even for the projection of future drought events, SPI and SPEI indices are most widely used based on regional climate modeling [38,39]. Even though both indices are considered reliable for drought identification, SPEI will play a greater role as the Potential Evapotranspiration (PET) increases (i.e., especially in regions with high PET) [40,41].
The primary objective of this paper consists of a comparative spatiotemporal analysis of environmental extremes (drought/wetness) between three distinct vulnerable agricultural regions in the Mediterranean basin (i.e., Spain, Lebanon and Tunisia), under a climate change environment in the last 40 years (1982–2020). To this end, satellite data were used, as provided by the CHIRPS database (i.e., Rainfall Estimates from Rain Gauge and Satellite Observations), to estimate the monthly Standardized Precipitation Index (SPI) based on the precipitation evolution for the last 12 months (SPI12), through the transformation of gamma cumulative distribution to a standardized normal distribution [42]. Even though SPI is one of the most widely used indices in drought assessment, the added value of the paper lies in the simultaneous estimation of temporal and spatial variability of drought and wetness periodic events, paying special attention to the geographical patterns of these extremes both in annual and interannual (seasonal) time scales at three distinct vulnerable Mediterranean regions, which may be affected the most by the increasing climate variability.
The structure of this paper consists of (i) the spatiotemporal analysis of annual and intra-annual drought/wetness severity of three Mediterranean regions in Spain, Tunisia and Lebanon, respectively, through the temporal evolution of drought/wetness severity from 1982 to 2020 as well as the spatial distribution of drought/wetness severity for the two driest and wettest hydrological years; and (ii) the comparative assessment of the four main components of drought and wetness (i.e., severity, frequency, geographical coverage—areal extent—and duration) among those regions to explore the similarities/differences of the geographical patterns of these phenomena.
2. Materials and Methods
2.1. Study Areas
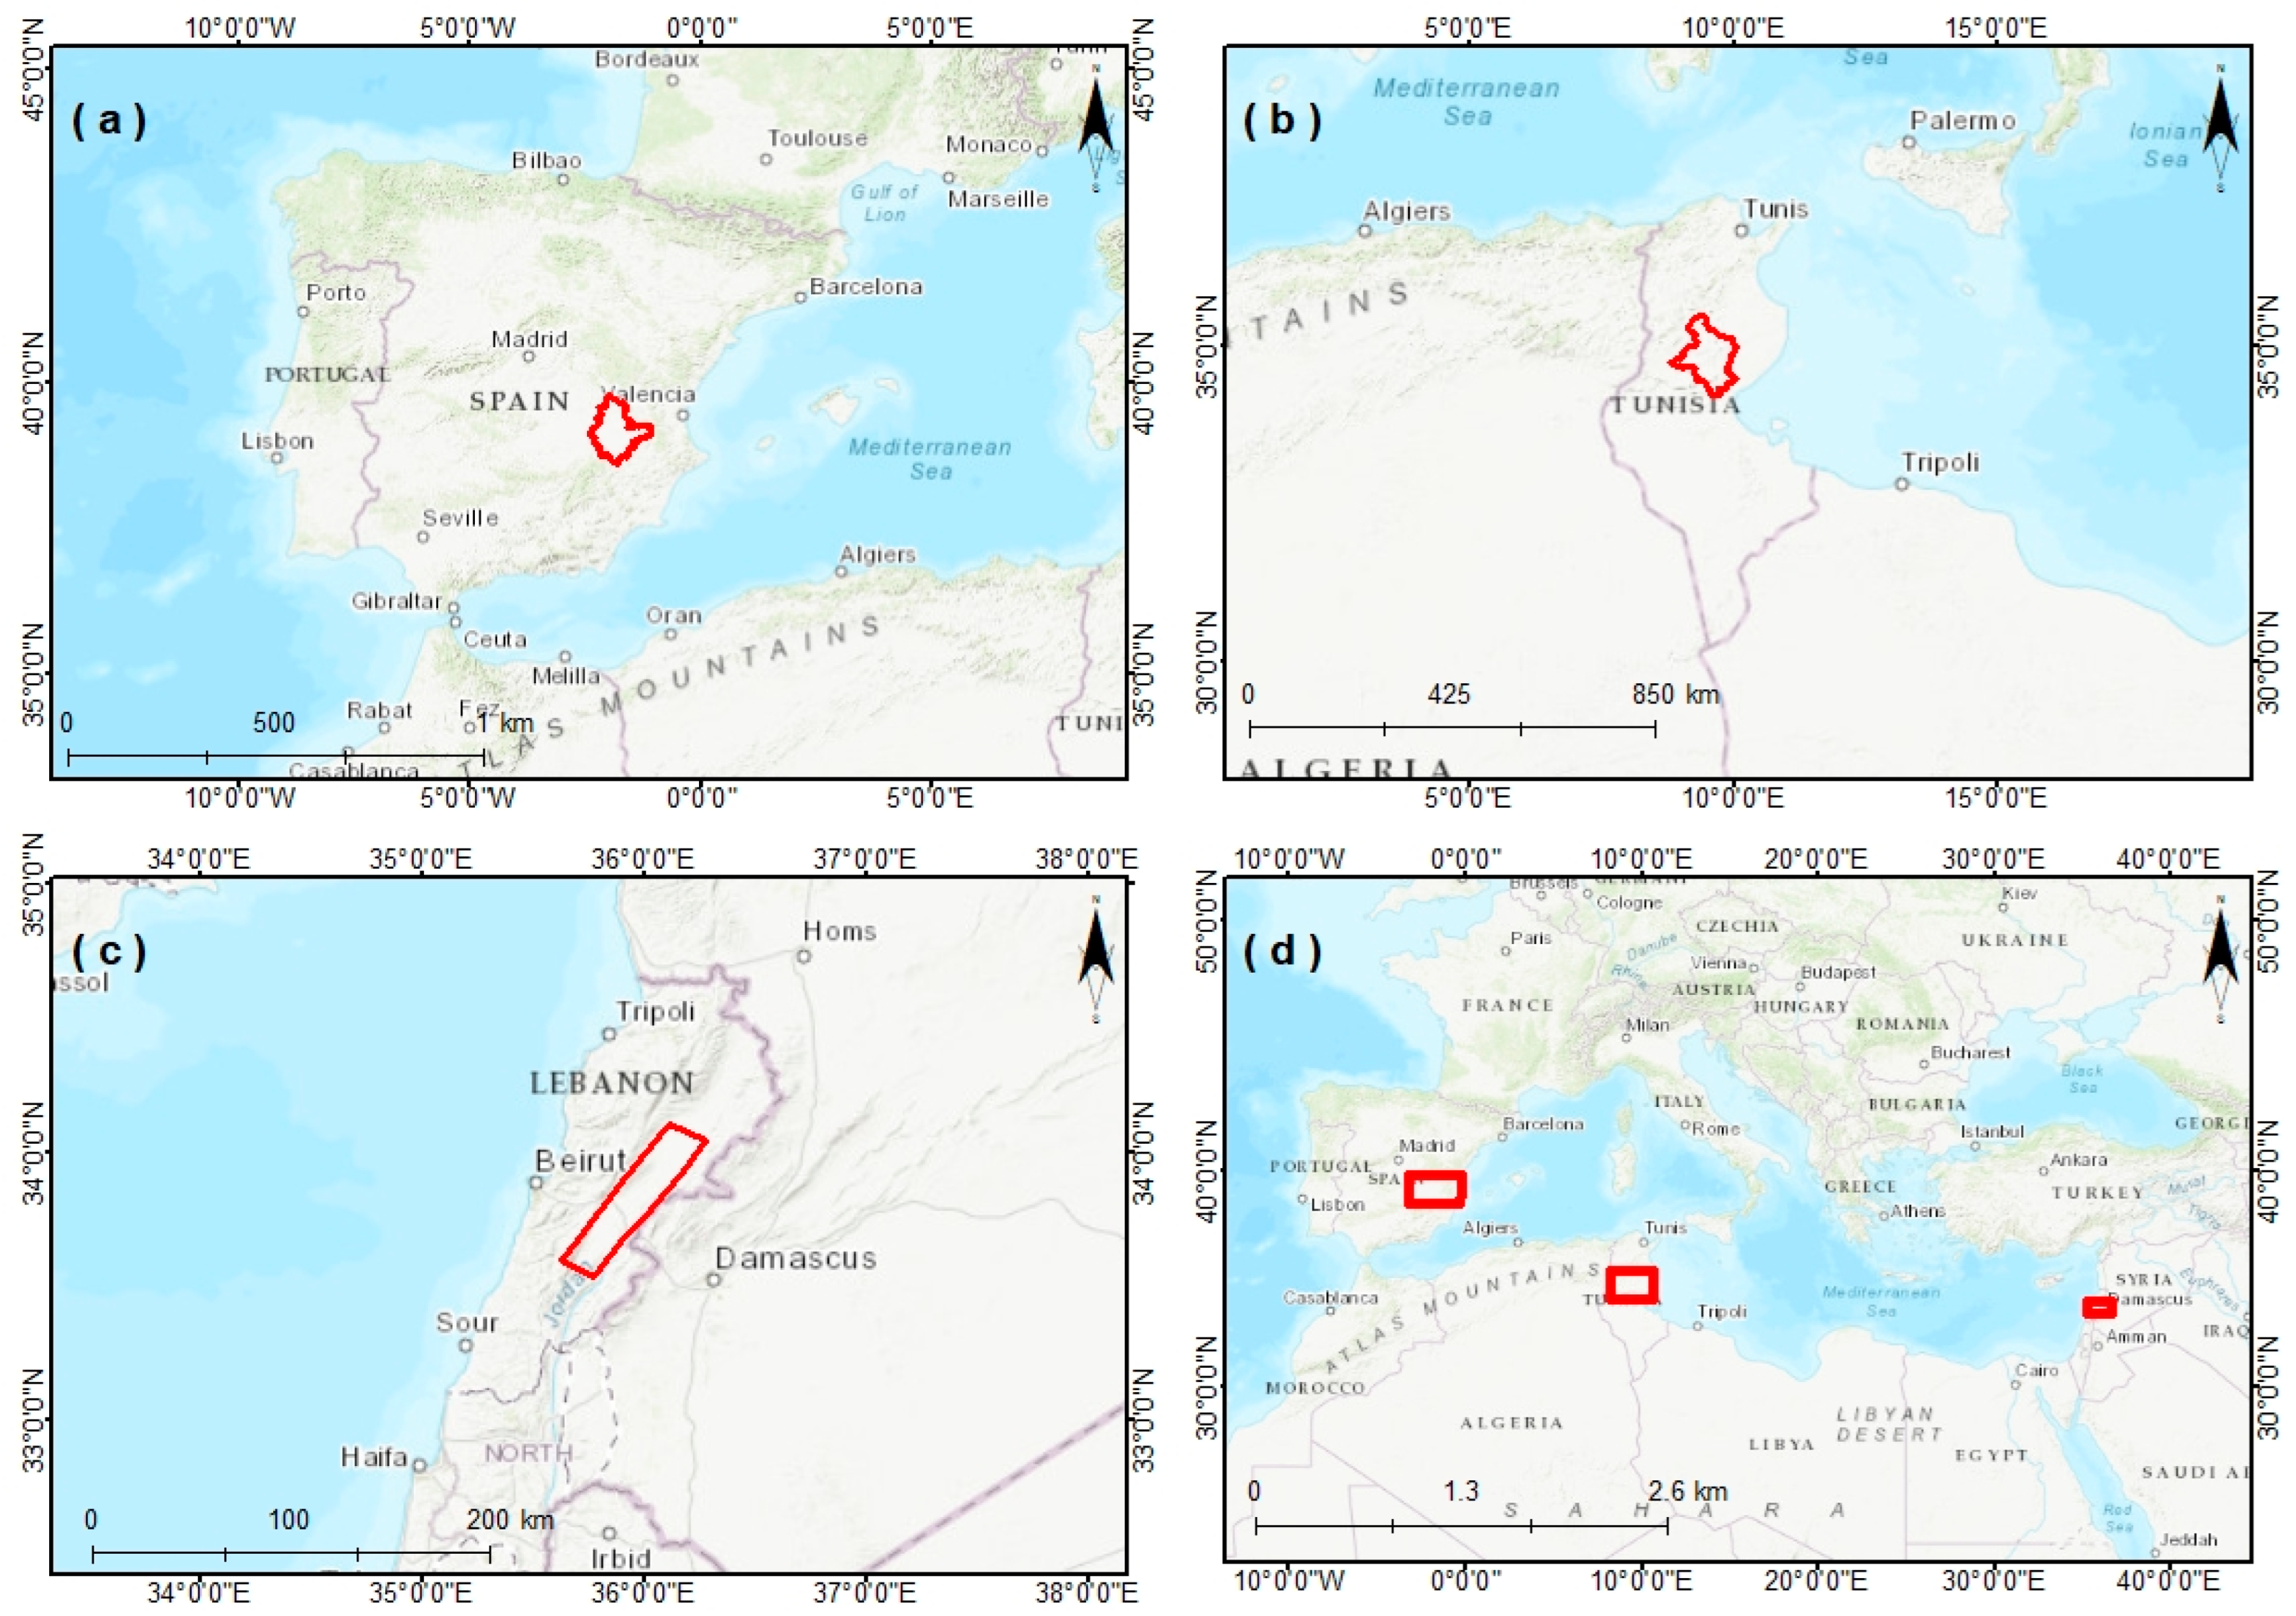
Drought assessment took place in three study areas representing different and distinct aspects of the Mediterranean conditions (Figure 1). The first one is the Hydrogeological Unit “Eastern Mancha” mainly located in Albacete, a province within the Castilla-La Mancha region in the southeastern part of Spain. The study area occupies 9962 km2 that accounts for around 130,000 ha of irrigated land, whereas the population density amounts to 150 people per km2. The geographical coordinates are 38°59′N, 1°51′W [43]. The climate is characterized by short and hot summers and long very cold winters. The average temperature is 14.6 °C and usual values vary from 0.5 to 33.3 °C; the average annual rainfall amounts to 360 mm; the average wind speed is 14.5 km/h [44].
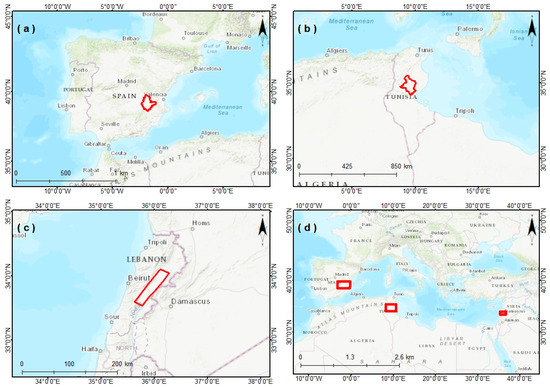
Figure 1.
The geographical location of (a) Eastern Mancha, (b) Sidi Bouzid, (c) Beqaa Valley and (d) all the three study areas in the Mediterranean.
The second study area is Sidi Bouzid Governorate in Tunisia, which is one of the 24 provinces of Tunisia. It is in the central part of Tunisia. It covers an area of 7405 km2 and has a population of 429,912 (2014 census). The population density amounts to 58 people per km2. The geographical coordinates are 35°02′N, 9°30′E. [45]. The climate is characterized by very hot summers and long cold winters. The temperature varies from 4.4 to 36.6 °C; the annual average rainfall amounts to 248 mm; the average wind speed is 13.7 km/h [46]. The groundwater is the only source of irrigation.
The third study area extends into the Beqaa Valley in Lebanon. Beqaa Valley is 120 km long and 16 km wide. The geographical coordinates are 34°00′N and 36°08′E. The climate is typical continental Mediterranean with wet, often snowy winters and dry, warm summers [47]. The temperature varies from 3 °C to 34 °C; the average rainfall ranges from 230 mm in the northern parts of the Valley to 610 mm in the central parts; the average wind speed is 7 km/h [48].
The main reasons for the selection of these three study areas are the following:
- The study domains should belong to the Mediterranean basin.
- There must be high probability of distinct drought/wetness differences based on the geographical background. That is why a European, an African and Middle Eastern country has been selected.
- A certain geographical distance between them should be guaranteed to capture local meteorological and environmental variability.
These parameters will permit us to explore the similarities and differences on spatiotemporal patterns of meteorological conditions and extremes events (i.e., rainfall; drought; wetness), as well as the intercomparison of the three distinct regions based on the four main components of drought, one of the most detrimental environmental hazards (i.e., severity; frequence, geographical coverage—areal extent—and duration).
2.2. Materials
The primary data source of the study was retrieved and edited by the CHIRPS database which contains rainfall estimates from rain gauge and satellite observations [49]. The CHIRPS database consists of daily and monthly precipitation data at a spatial resolution of 0.05 and 0.25°, respectively, for the quasi-global coverage of 50° N–50° S from 1981 to the present [49,50]. The comparative advantage of CHIRPS is the fact that it constitutes a synthesis of remotely sensed imagery and data from rain-gauge stations [49]. We retrieved and edited CHIRPS data (spatial resolution: 5 km) monthly for a timeframe from 1982–2020.
2.3. Methodology
The Use of SPI for a Comparative Spatiotemporal Analysis of Wet/Dry Conditions
The scope of the study is a comparative spatiotemporal analysis of hydrological droughts in distinct vulnerable Mediterranean agroecosystems. In principle, meteorological drought can be considered as a temporary lack or reduction of precipitation as compared to long-term average conditions [14]. The persistence of this reduction over time may lead to other types of droughts, such as agricultural, hydrological, or socio-economic droughts [34,51]. Meteorological droughts can be assessed using indices, such as the Standardized Precipitation Index (SPI) [52] which has been recommended by the World Meteorological Organization (WMO) as a global measure of meteorological drought, which considers only precipitation [53]. Since precipitation data are mostly skewed, precipitation data are fitted using a gamma distribution and then normalized to compute SPI. It is based on the cumulative probability of precipitation data and can assign a numerical value to provide the ground in various climatic regions. Again, SPI is based on precipitation for selected time scales (or reference periods), i.e., the aggregation of previous months/years’ precipitation.
There are several advantages of SPI, such as simplicity, application of accessible rainfall data, statistically robust and calculability for multiple time scales [54,55]. Moreover, SPI can be used to monitor droughts, mainly due to its multi-scalar attribute [53], leading to the identification of different drought types, it is simple to compute and easy to interpret. The index strongly depends on the reference period selected for calibration [56]. Specifically, drought features, such as trend, frequency and especially severity or spatial extent are affected by the selected reference period. Indeed, the standardized nature of the SPI allows it to be comparable across different regions globally and can be interpreted in terms of return periods [57].
The Standardized Precipitation Index (SPI) is adopted in this paper, which has been proven as ideal for identifying both dry and wet periods [58] and has been successfully applied by the authors recently [31]. SPI can be applied in different ground conditions and different or multiple timescales using only precipitation data as the input [59]. For example, 6-month SPI (SPI6) or 12-month SPI (SPI12) is better suited to identify longer-term or seasonal drought trends. Specifically, when SPI is applied for a 3- or 6-month period, it is suitable for the description of agricultural drought [60]. When SPI is applied for longer time periods (12–48 months), then the index is suitable for describing hydrological drought [21,42,58].
After incorporating precipitation data into a time series, properties of maximum likelihood can be applied for the estimation of gamma distribution coefficients and finally fit a gamma distribution. Cumulative probability is then used to compute inverse normal function, computing the SPI [16,61]. Next, SPI is estimated consuming a fraction, where the numerator is the abstraction of the long-term seasonal mean minus the normalized seasonal precipitation, while the denominator is the standard deviation itself. The last stage is the use of a classification table to determine the existence of wet/dry conditions (Table 1). Seven classes of SPI are depicted in Table 1 [62]. When SPI values are lower than −1, significant drought is assigned. Likewise, SPI values higher than 1 indicate wet conditions. In this way, SPI12 can be calculated through the entire available time series (from 1982 to 2020).

Table 1.
SPI classification table (adjusted from [62].)
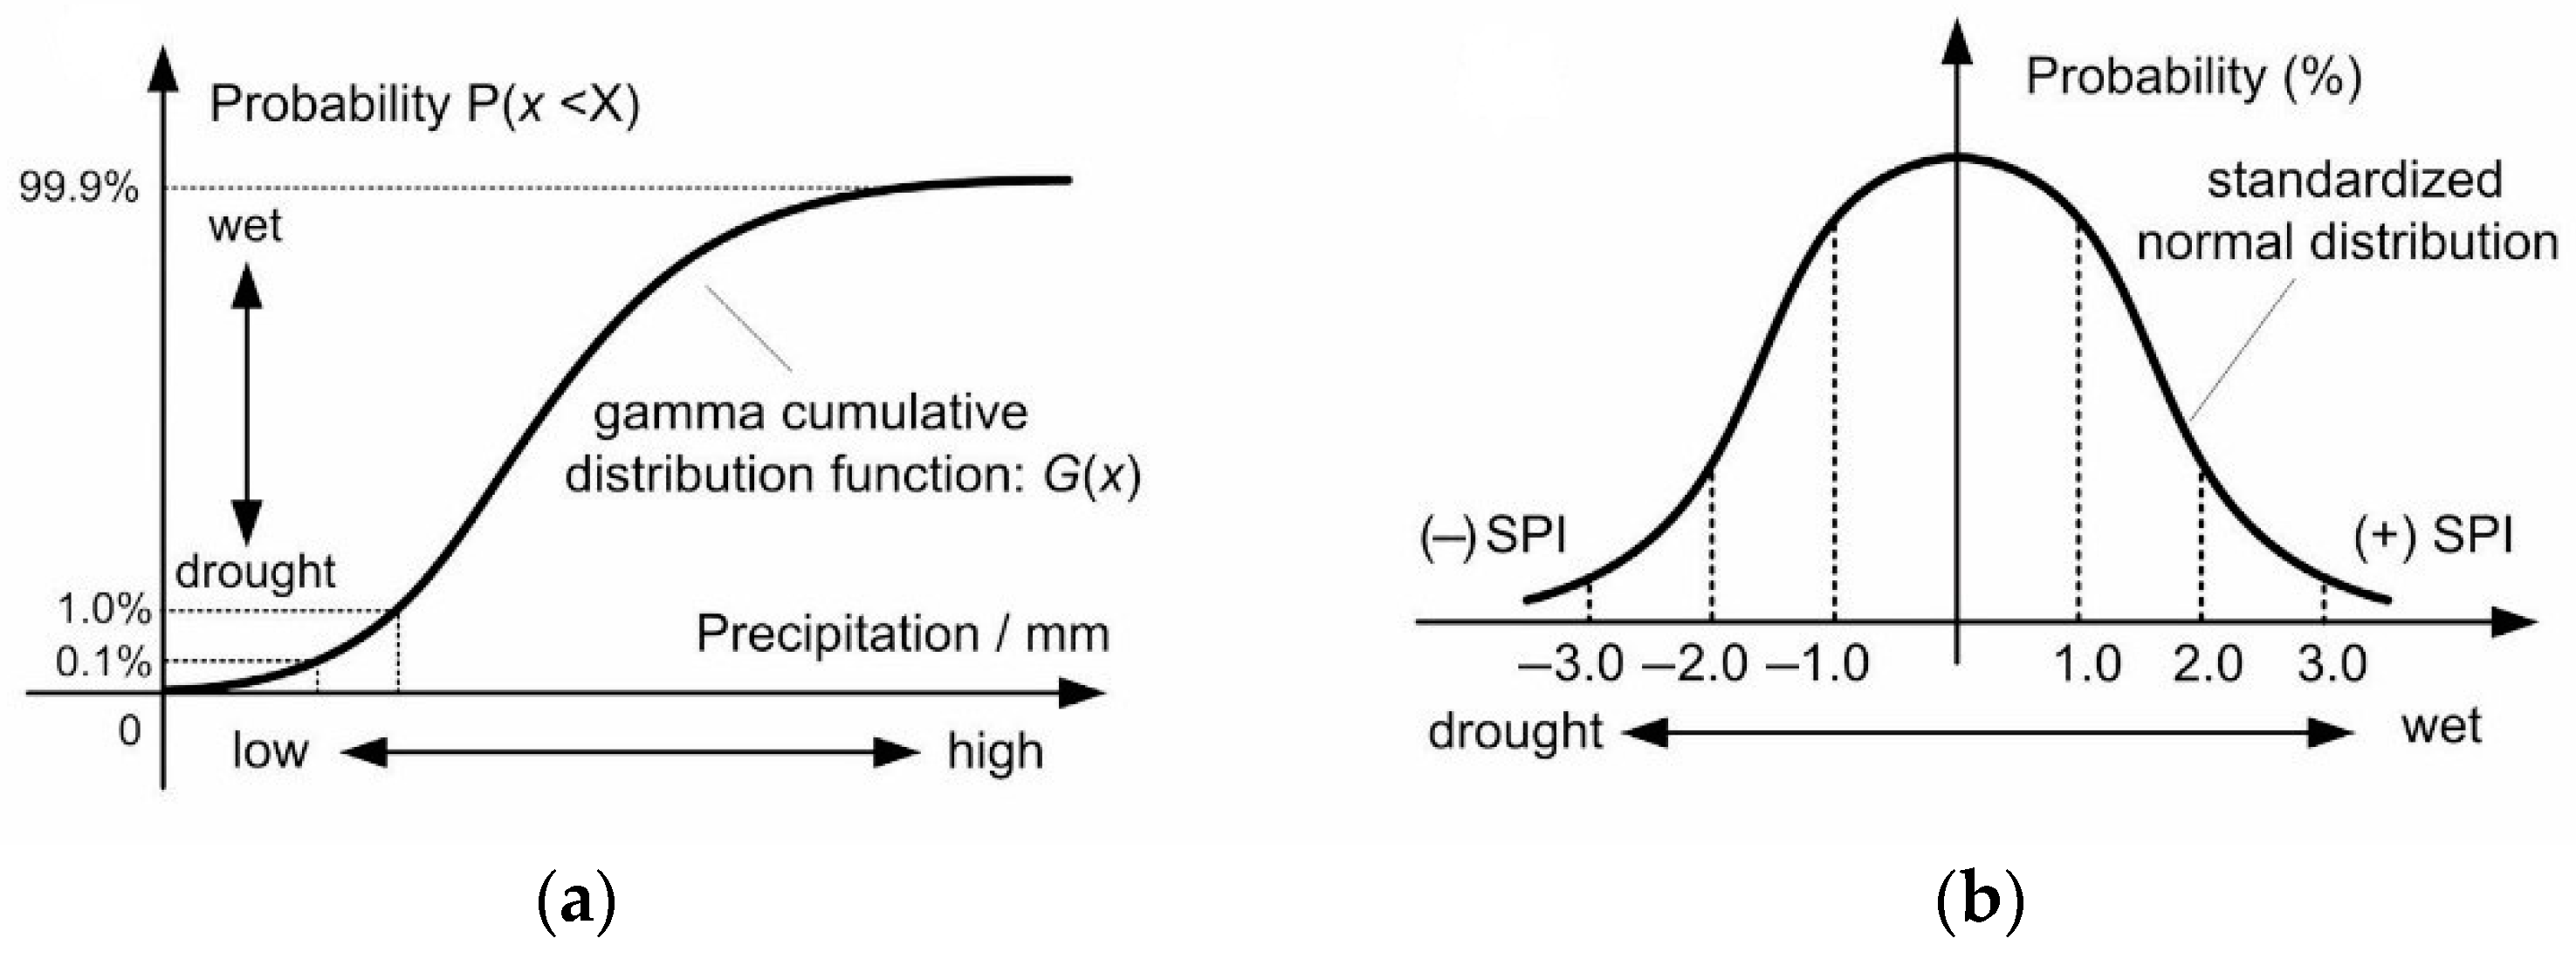
The main advantage of SPI is that it relies on the normalized distribution (Figure 2) and the final SPI value is computed from a predefined probability distribution function [16,42,50,63]. In this way, it has the strength to illustrate both the dryness and wetness in different spatial and temporal resolution. Supposing that the x axis denotes the cumulated monthly precipitation in the desired time scale (1, 3, 6, 12 months), then a gamma probability density function g(x) can be fitted according to
where g(x) is the gamma function. In the Equations (1a) and (1b), constants α and β are well described by the maximum likelihood methodology [16,42,61] using the following formulas:
where n denotes the length of the time series (number of months). The resulting precipitation x can be expressed as a cumulative probability:

Figure 2.
SPI computation: (a) gamma distribution after fitting to Formulas (3) and (4); (b) normal distribution according to Formula (6). Wetness (+SPI)/Dryness (−SPI) [16].
Constituting t = x/b into Equation (3) is finally transformed into a gamma function type:
Considering the extreme case where the cumulated monthly precipitation x = 0, then Equation (4) finally is modified into H(x):
where q is now the probability of x = 0, which is the frequency of occurrence of x = 0 in the whole time series. Next, SPI is then expressed by a standardized normal distribution function using the following formula:
assuming the constants c0 = 2.51552, c1 = 0.80285, c2 = 0.01033, d1 = 1.43279, d2 = 0.18927 and d3 = 0.00131.
Considering the above, SPI12 may estimate the severity of wet/drought conditions based on precipitation data related to the previous 12 months’ period. Precipitation data again has been adjusted to a “gamma” probability distribution, and then transformed into a typical normal distribution (mean SPI value is zero). Similarly, significant rainfall deficits are indicated as SPI decreases (below −1.0), while significant severe rainfall surplus are indicated as SPI is more than +1.0 [62].
At the next step, wet/dry conditions for every hydrological year (October through September) are estimated. As a result, the computation of the index estimates the average conditions (according to each index value) for every hydrological year. The results are supported by a series of related maps representing the two most wet/dry conditions in the three study areas.
Finally, the spatial distribution of SPI is mapped applying Voronoi polygons described at Delaunay triangulation methodology [64] for both monthly and annual modes. The Voronoi polygons have been used to estimate the distance between any region (i.e., the center of the pixel) and the closest meteorological station. The total process enhances the spatial resilience of any region giving the necessary information to the local authorities before the possible event breaks out.
3. Results
This section describes the analysis results of SPI12 in the three distinct Mediterranean regions for a historical period from 1982 to 2020. This type of analysis would allow the presentation of the features of the historical driest and wettest periods that occurred in the study areas, exploring potential patterns (cycles) in meteorological conditions. This section is divided into four sub-sections. Specifically, in the first three sub-sections, the features and characteristics of drought/wet conditions for each of the three areas are presented, namely for Eastern Mancha in Spain, Sidi-Bouzid Governorate in Tunisia and Beqaa Valley in Lebanon. In the fourth sub-section, a spatiotemporal comparative analysis is presented between these three distinct Mediterranean areas focusing on the main features of drought and wet conditions, such as severity, duration, frequency or periodicity and areal extent.
3.1. Spatiotemporal Analysis of Annual and Intra-Annual Drought/Wetness Severity in Eastern Mancha (Spain)
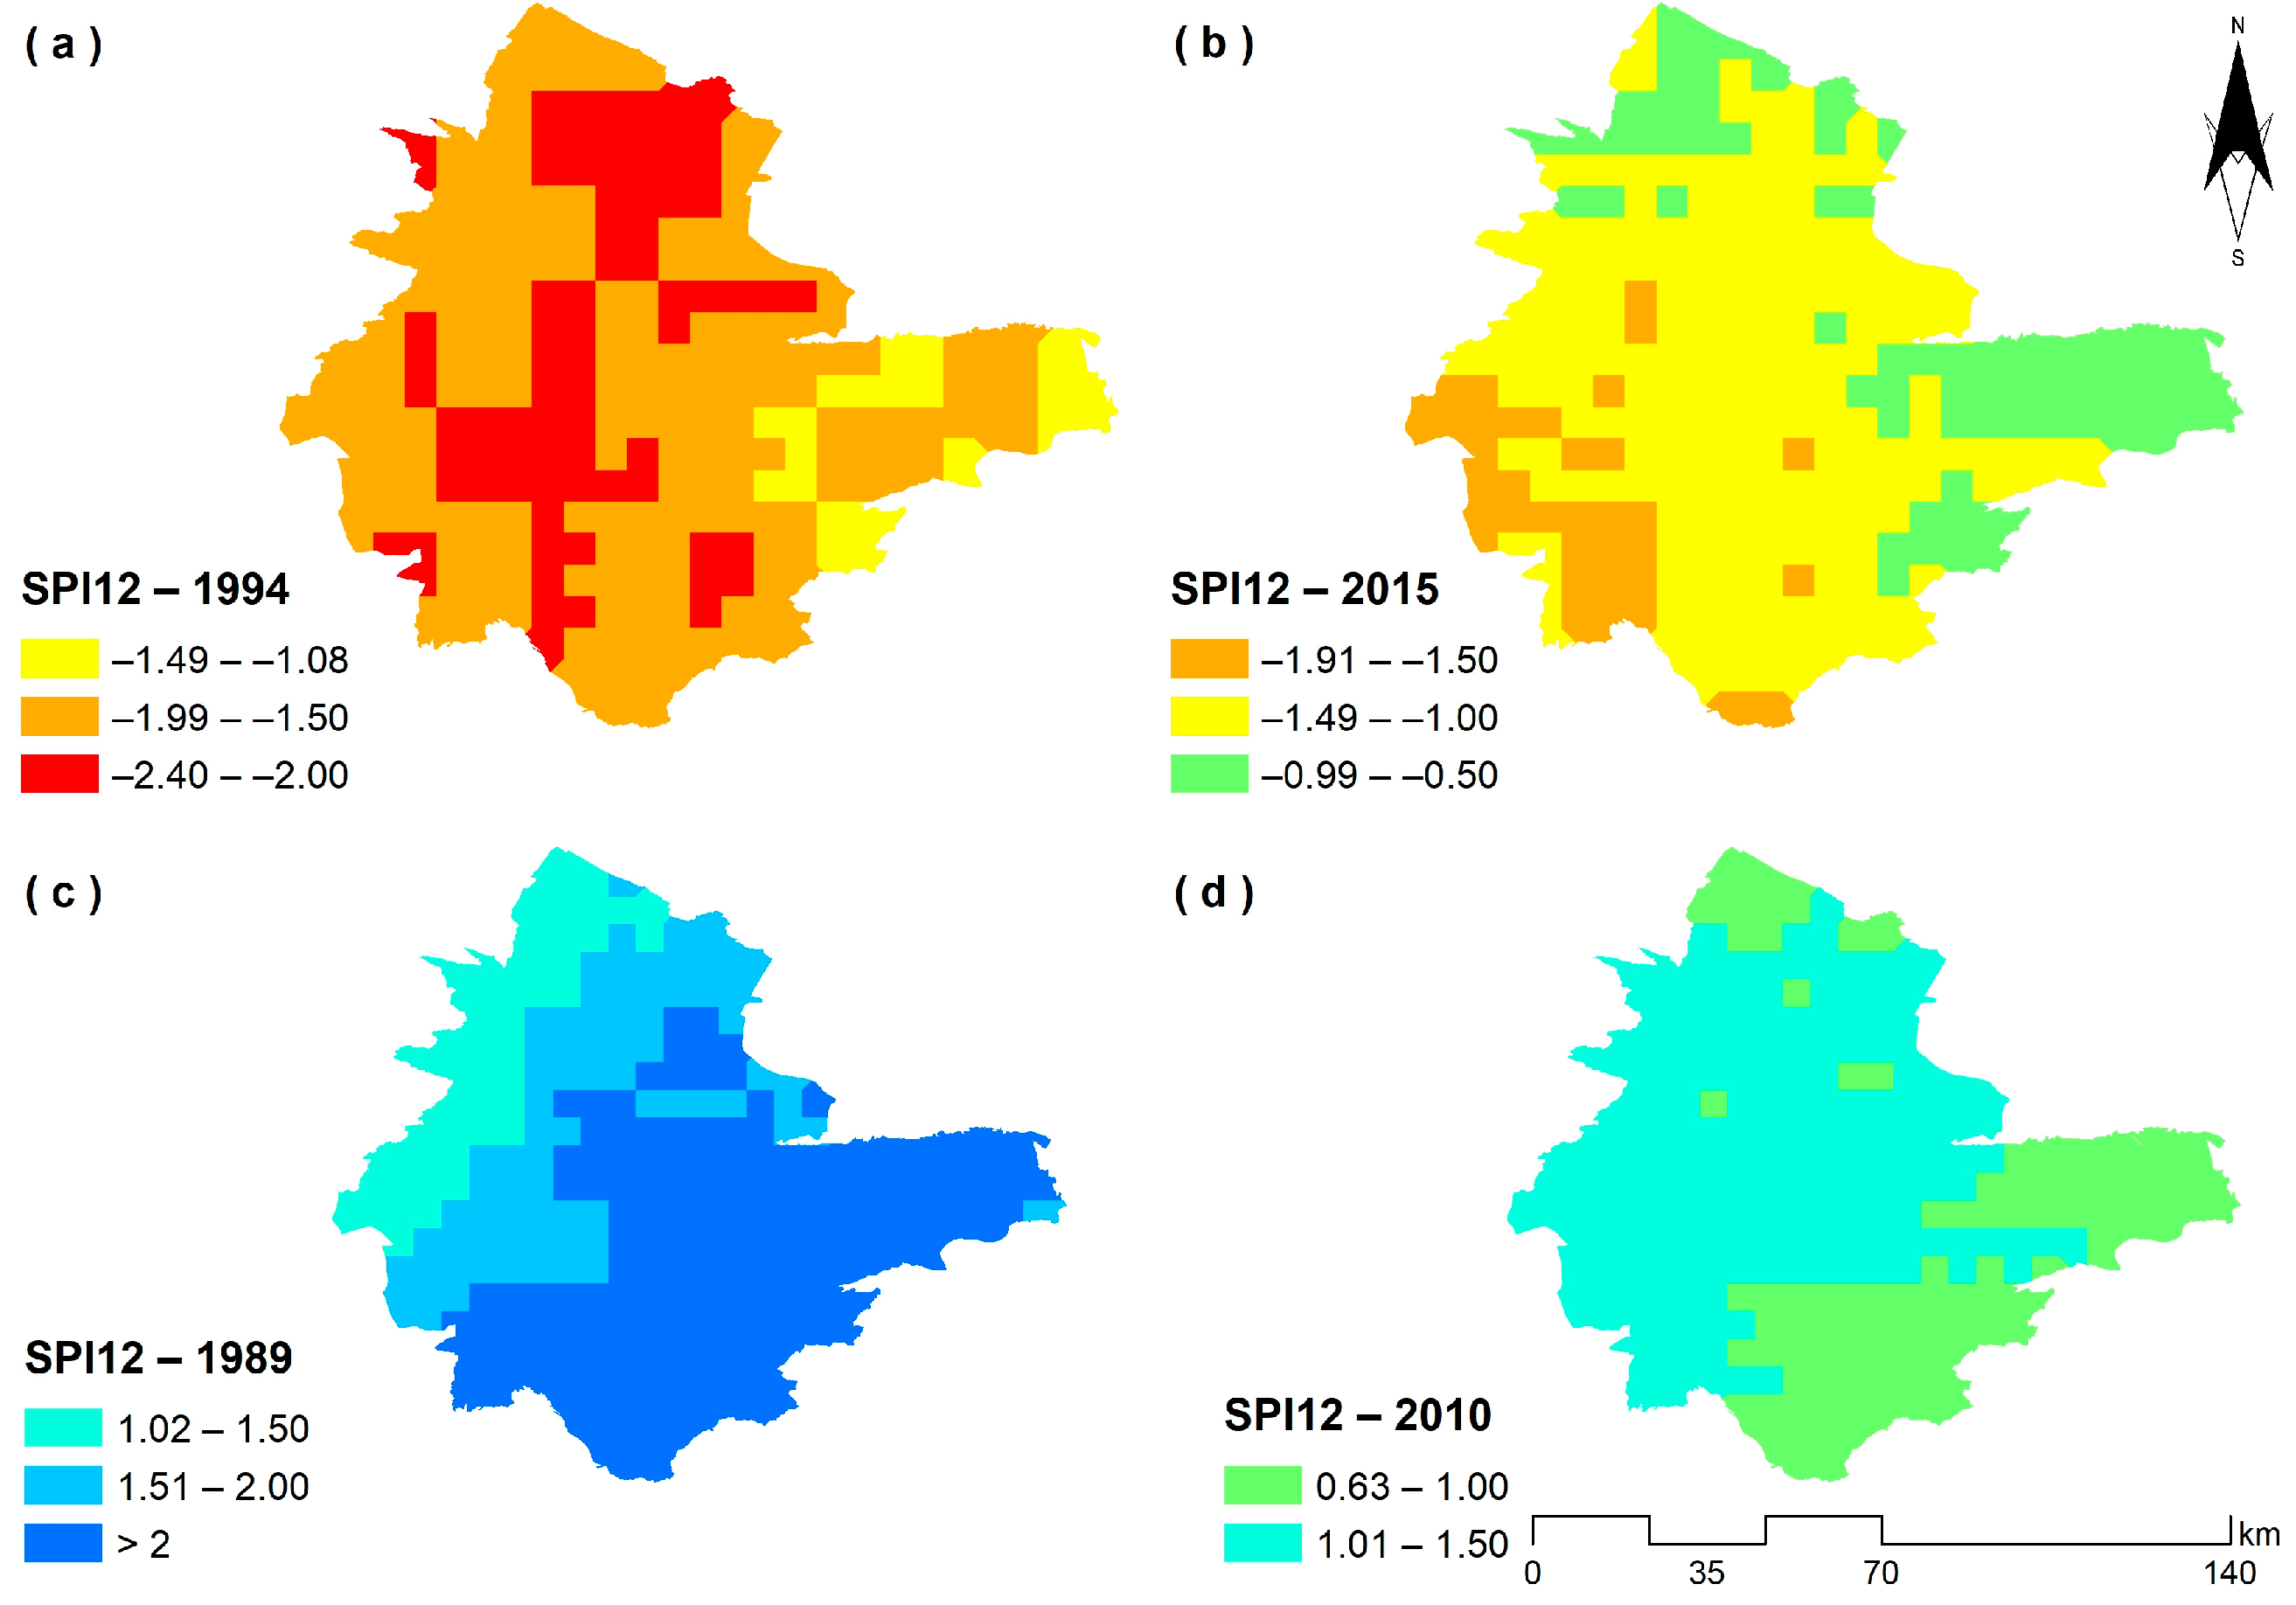
The first section of the analysis includes the annual evolution of SPI12 for all Mediterranean countries. Figure 3a depicts the driest hydrological year (1994) in Eastern Mancha (Spain) throughout the time reference (1982–2020). The values of SPI12 range from −2.4 to −1.08. The driest regions are in the central and northern part of Eastern Mancha area (−2 < SPI < −2.4), surrounded by a region of milder drought (−1.5 < SPI < −2), whereas there are a few areas in the eastern part of the study domain with the least degree of drought (−1 < SPI < −1.5). Figure 3b represents the second driest hydrological year which occurred in 2015–2016. Here, the lowest value is −1.91, whereas the highest value is −0.5. The pattern is slightly different. Specifically, the zone with the highest degree of drought is in the southwestern area (−1.5 < SPI < −1.91), followed by extensive territory in the central Eastern Mancha area with less severe drought (−1 < SPI < 1.5), whereas there are a few parts in the northern and eastern territory of the study area that are characterized by the least degree of drought (−0.5 < SPI < −1) as compared to the neighboring areas. Figure 3c depicts the wettest year that occurred in the hydrological year of 1989–1990 where the least value of SPI12 is 1.02 and the highest value is 2.77. From the same figure, it is observed that the study area is divided into three conceivable zones, where the first zone begins from the northwest and is characterized by the lowest degree of wetness (1 < SPI < 1.5), followed by a second zone in immediate proximity to the first zone (1.51 < SPI < 2) and a third more extensive zone, which is in the southeastern part of Eastern Mancha area (SPI > 2). Finally, Figure 3d shows the second wettest year that occurred in the hydrological year of 2010–2011. The range of SPI12 is from 0.63 to 1.45. Here, the central and western part of Eastern Mancha is characterized by the highest degree of wetness (1< SPI < 1.5), whereas the remaining part (mostly the southeastern and a small part in the north) is slighter wetter (0.63 < SPI < 1) representing favorable conditions for crop viability.
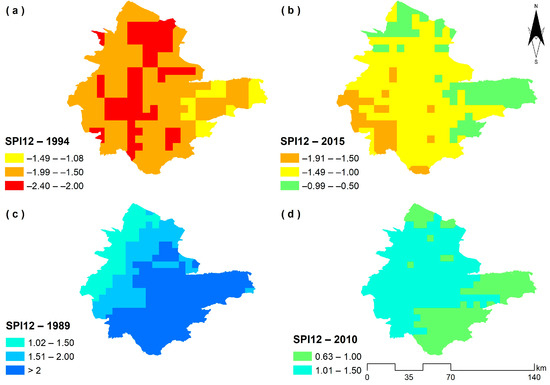
Figure 3.
SPI12 mapping in (a) the driest year, (b) the second driest year, (c) the wettest year, (d) the second wettest year in eastern Mancha region (Spain).
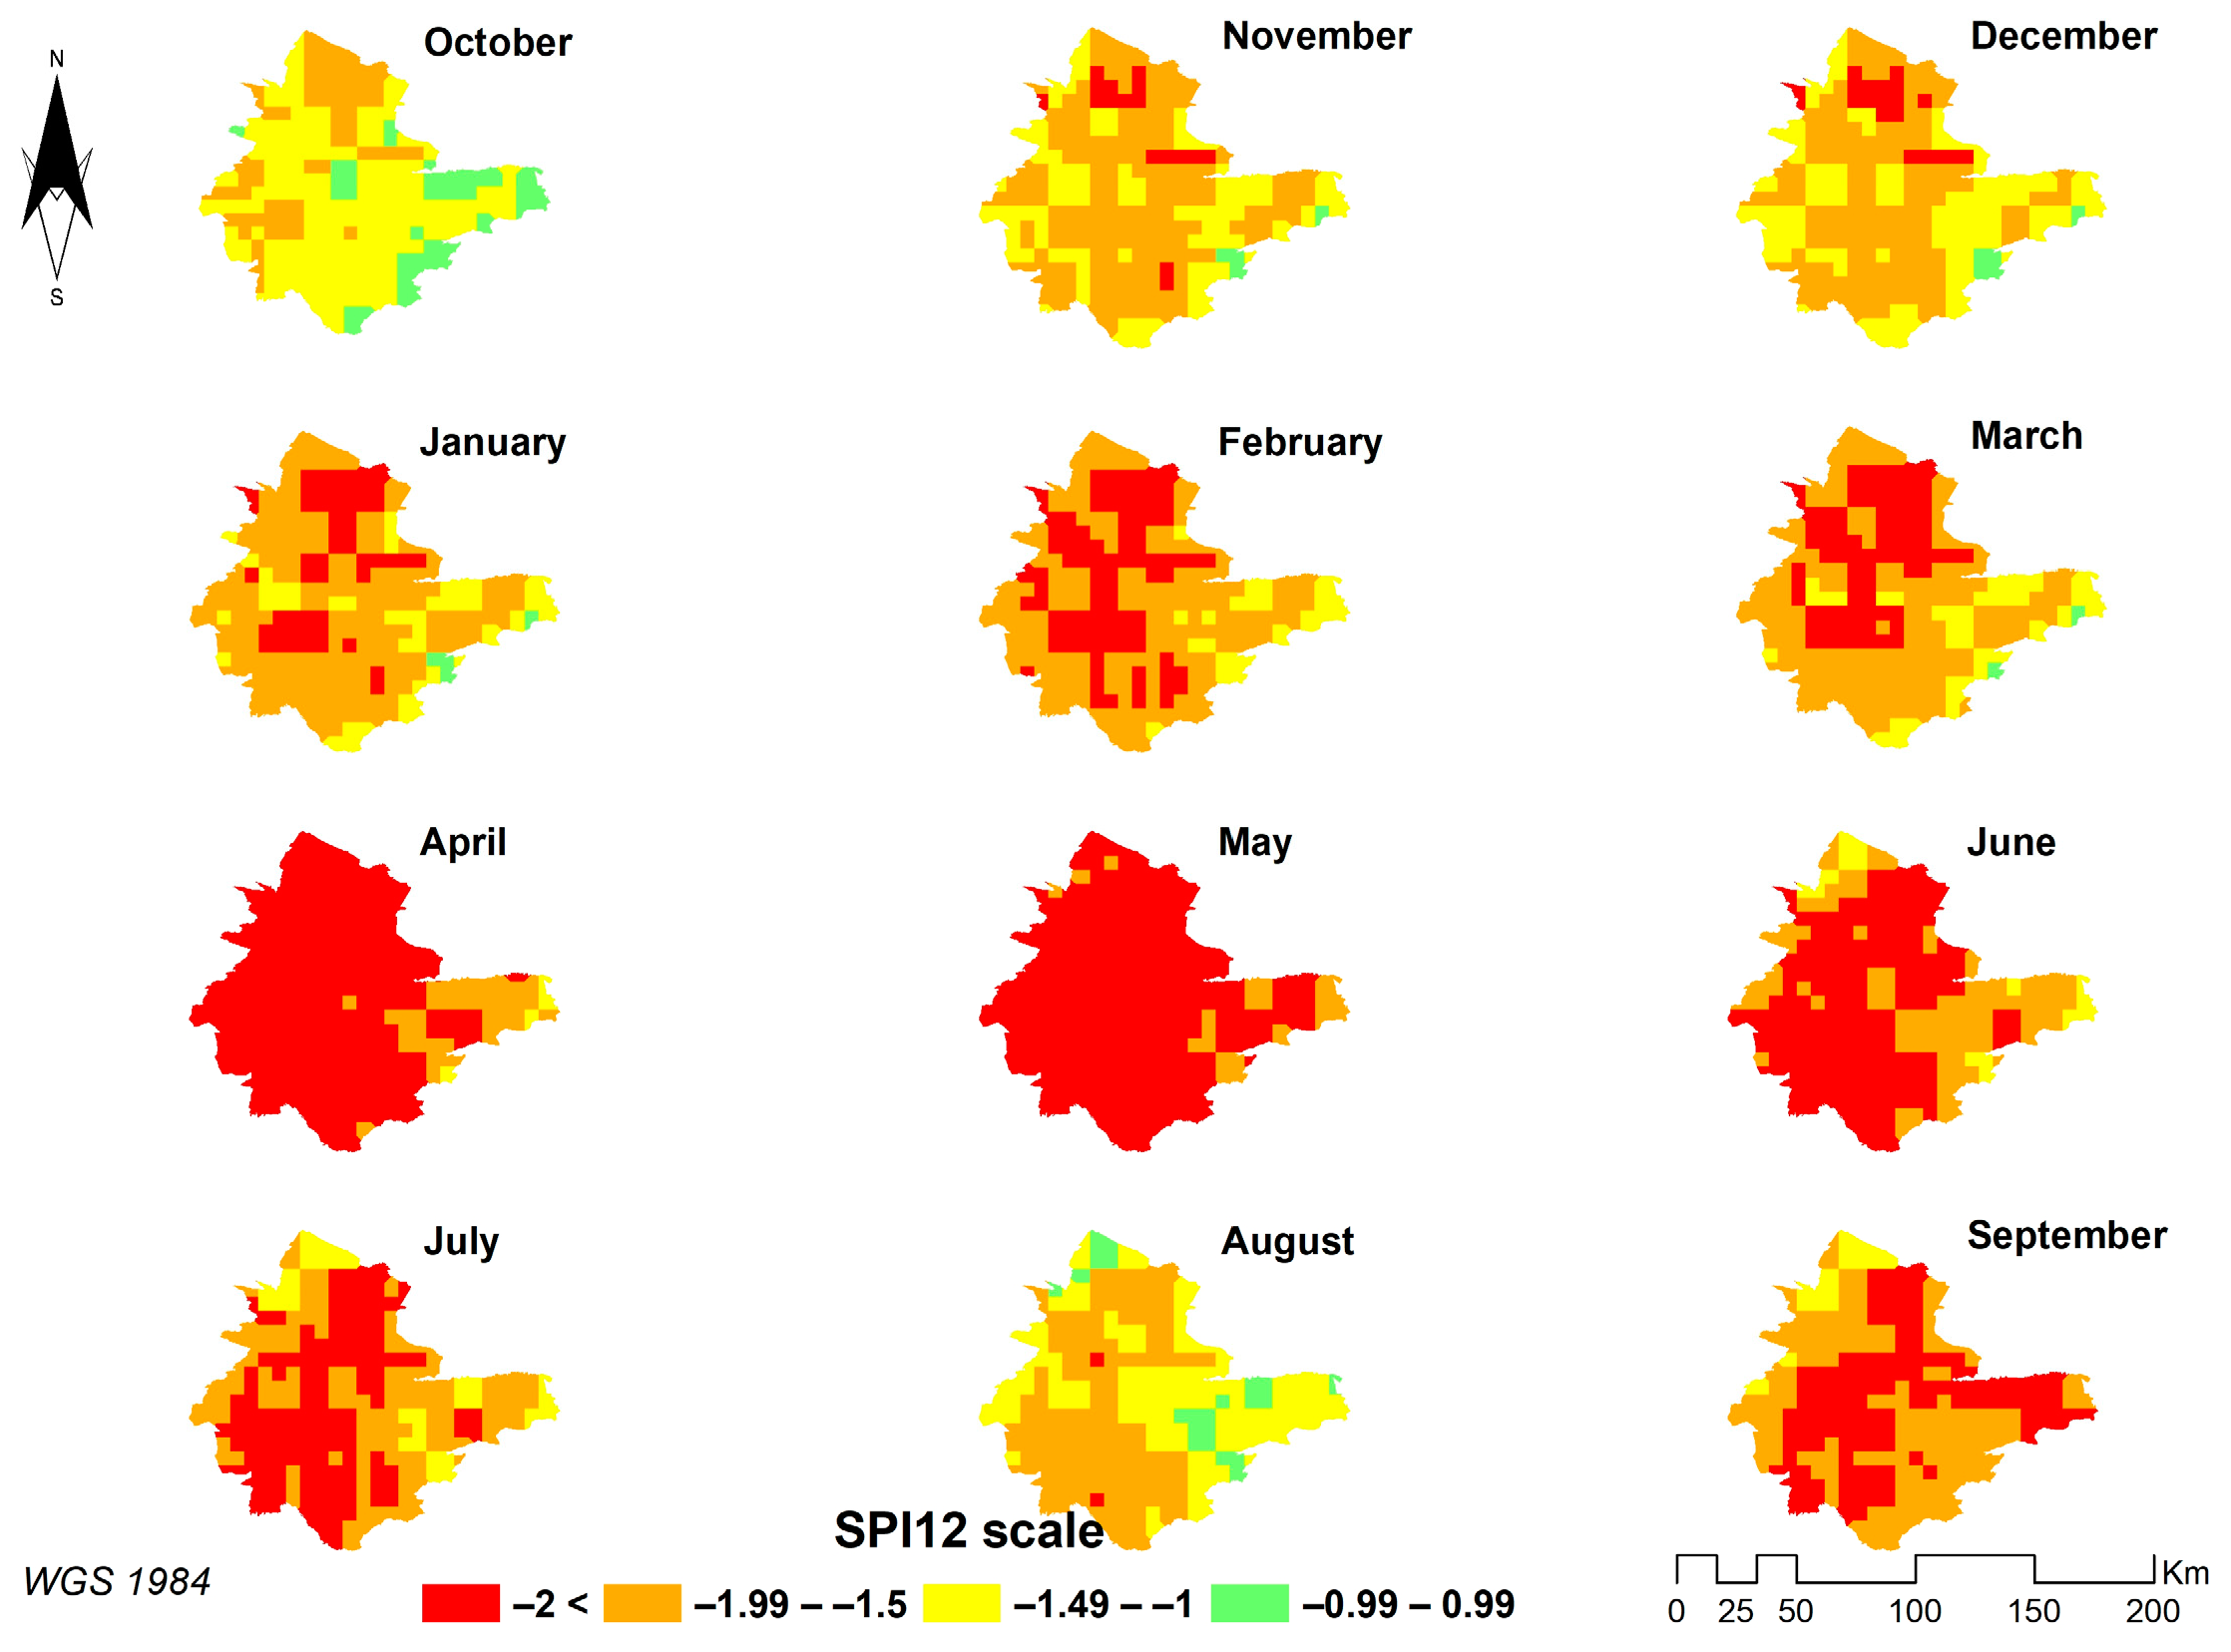
Next, the intra-annual evolution of SPI12 in the study area highlights the driest and wettest months in the most extreme hydrological years in terms of drought/wetness. The driest hydrological year in the eastern Mancha area is 1994–1995, which presents a high degree of fluctuations in drought conditions. Specifically, the months from April to July, including September, face extremely dry conditions, with most of the study area occupied by extensive regions with SPI12 below −2. On the other hand, January to March consist of months with severely dry conditions, where extensive regions are characterized by SPI12 from −1.5 to −1.99, including many regions with extremely dry conditions (SPI < −2). November, December and August mainly face severe drought, whereas several geographical parts present moderate drought conditions (−1 < SPI < 1.49). October constitutes the only month with the lowest drought conditions, where most of the study area is characterized by moderate drought, while some parts in the east face normal conditions (−1 < SPI < 1) (Figure 4).

Figure 4.
Monthly SPI12 in Eastern Mancha area, Spain (hydrological year: 1994–1995).
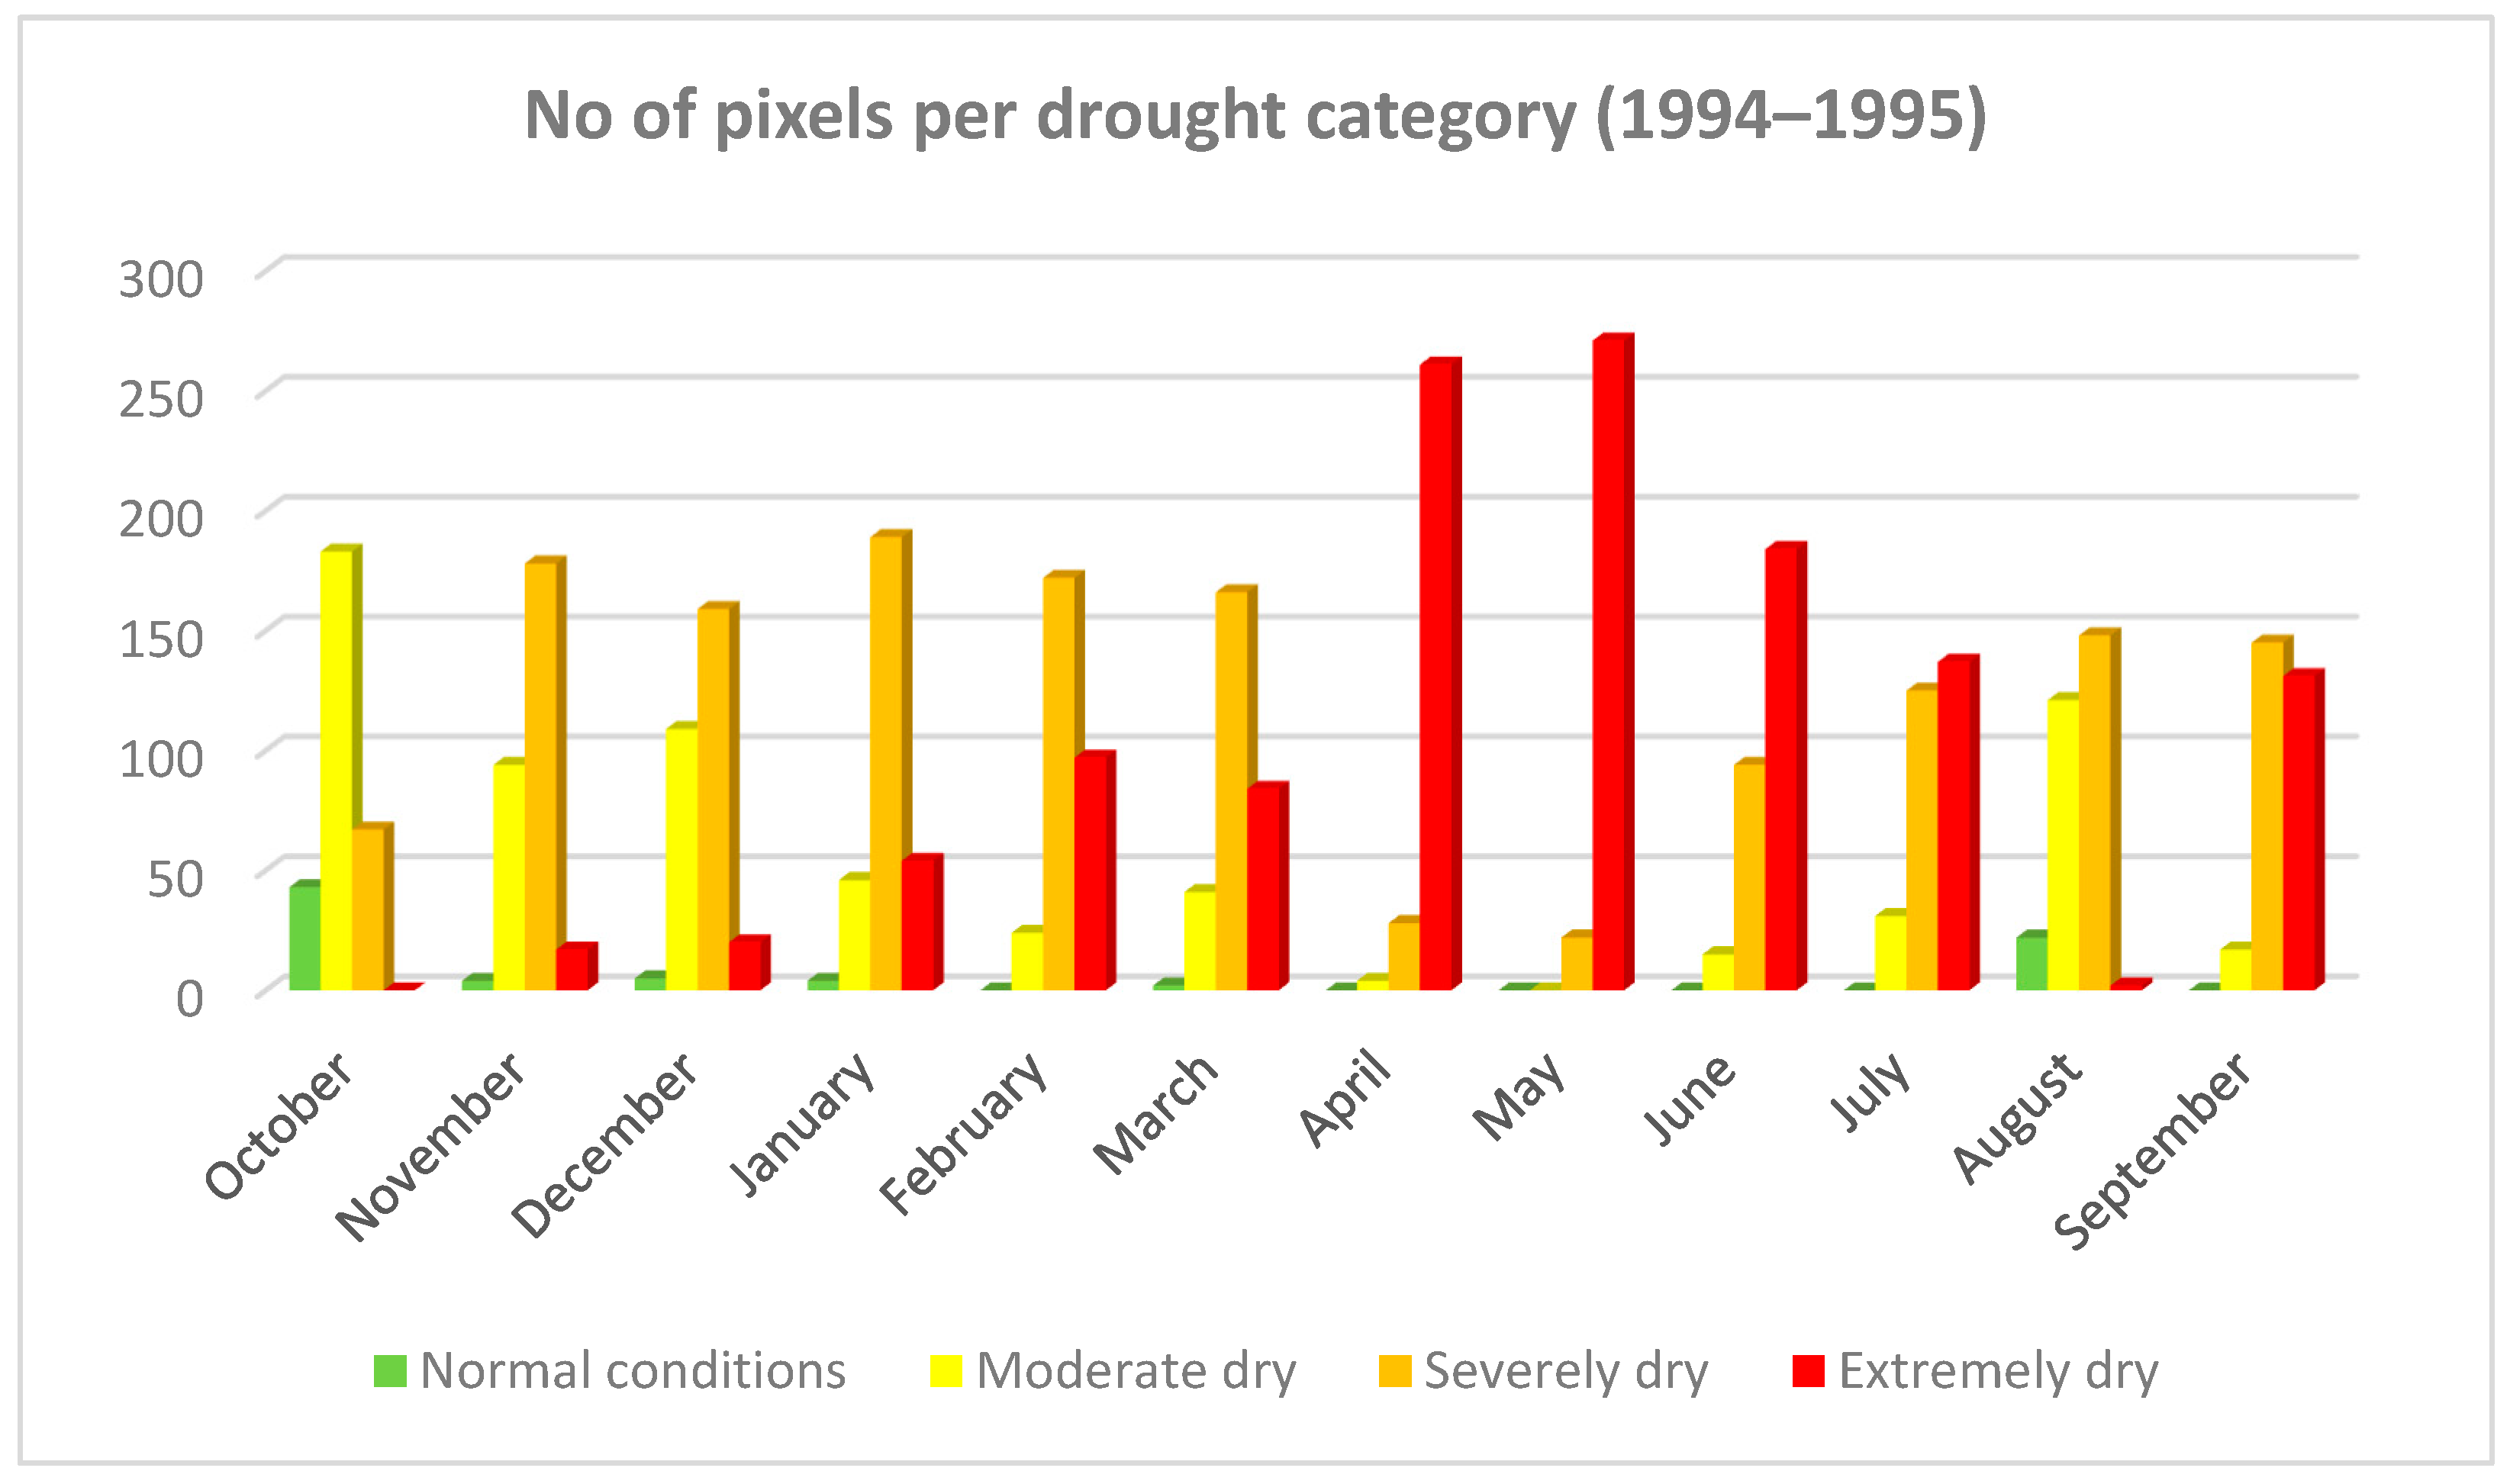
Figure 5 shows the total number of pixels (i.e., each pixel occupies a geographical area of 25 km2) falling into different categories of drought severity for the driest hydrological year in the Eastern Mancha area. Even though extremely dry conditions prevail from April to July (63–89% of the entire area), the remaining months, except October, are characterized by severely dry conditions which cover from 49 to 65% of the total study area.
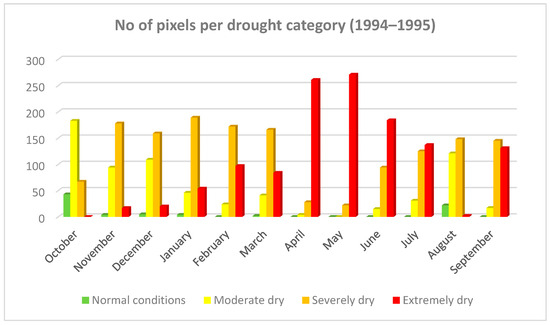
Figure 5.
Number of pixels per drought category in Eastern Mancha, Spain (hydrological year: 1994–1995).
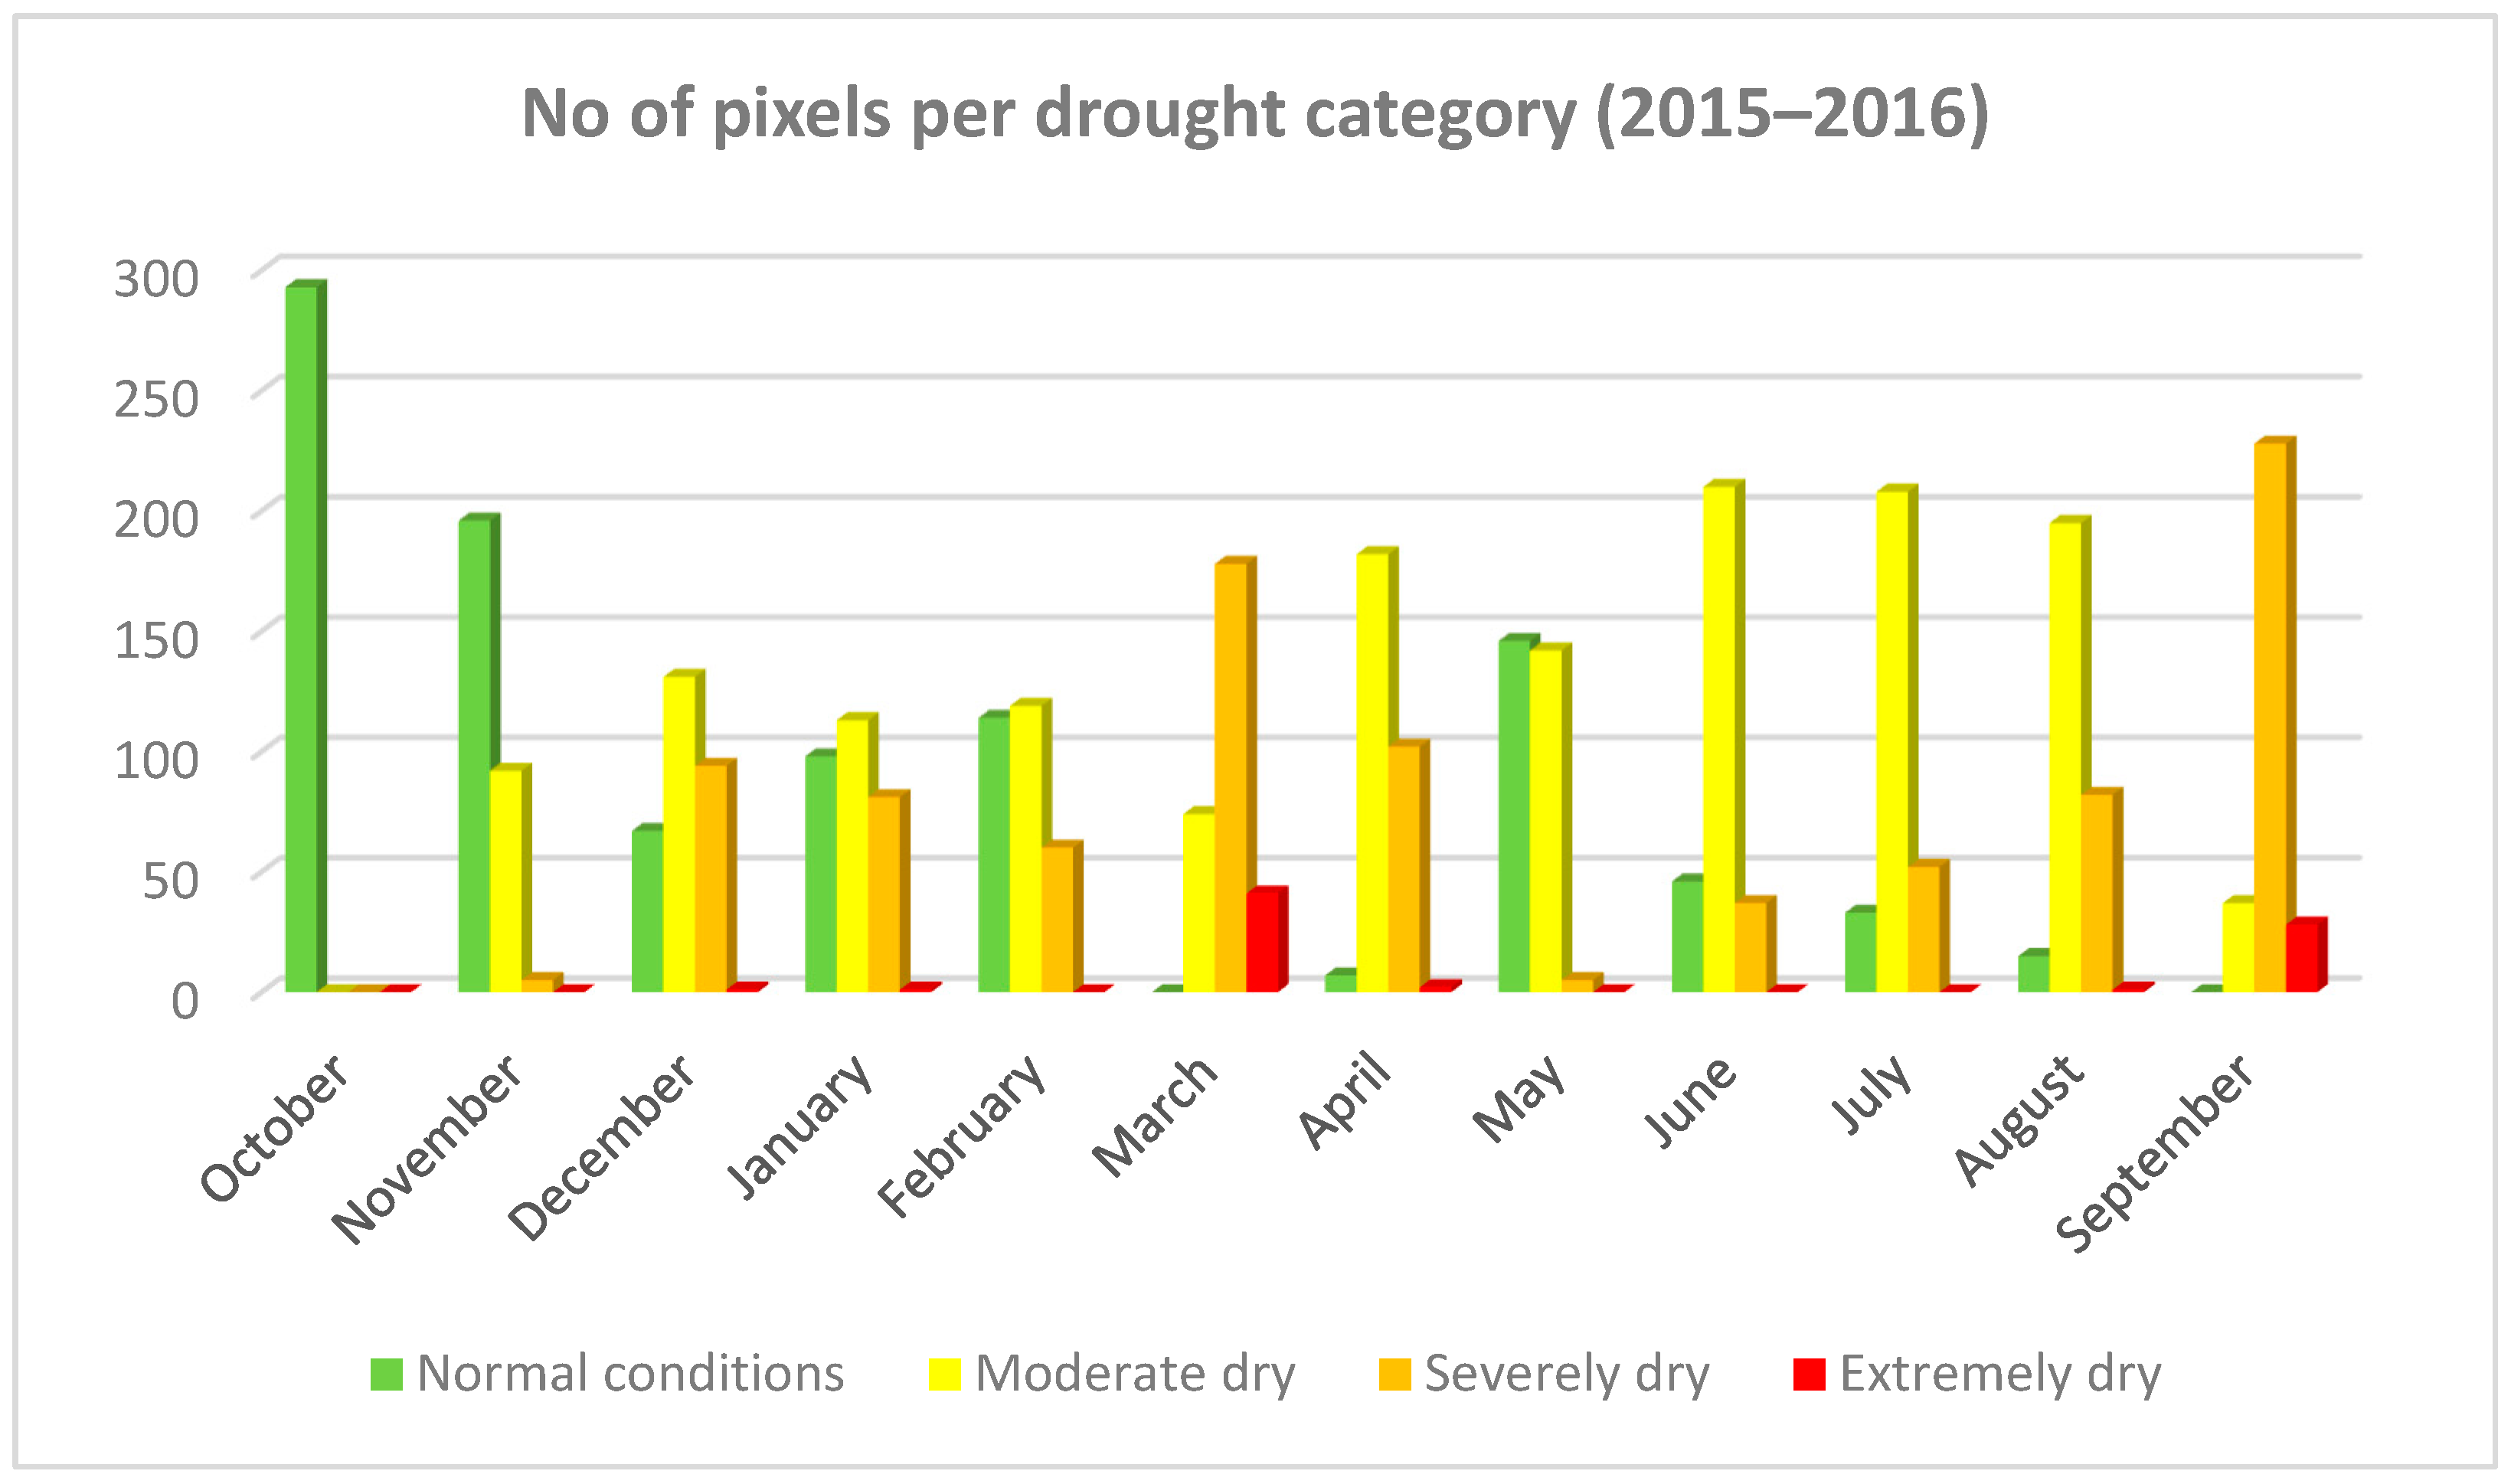
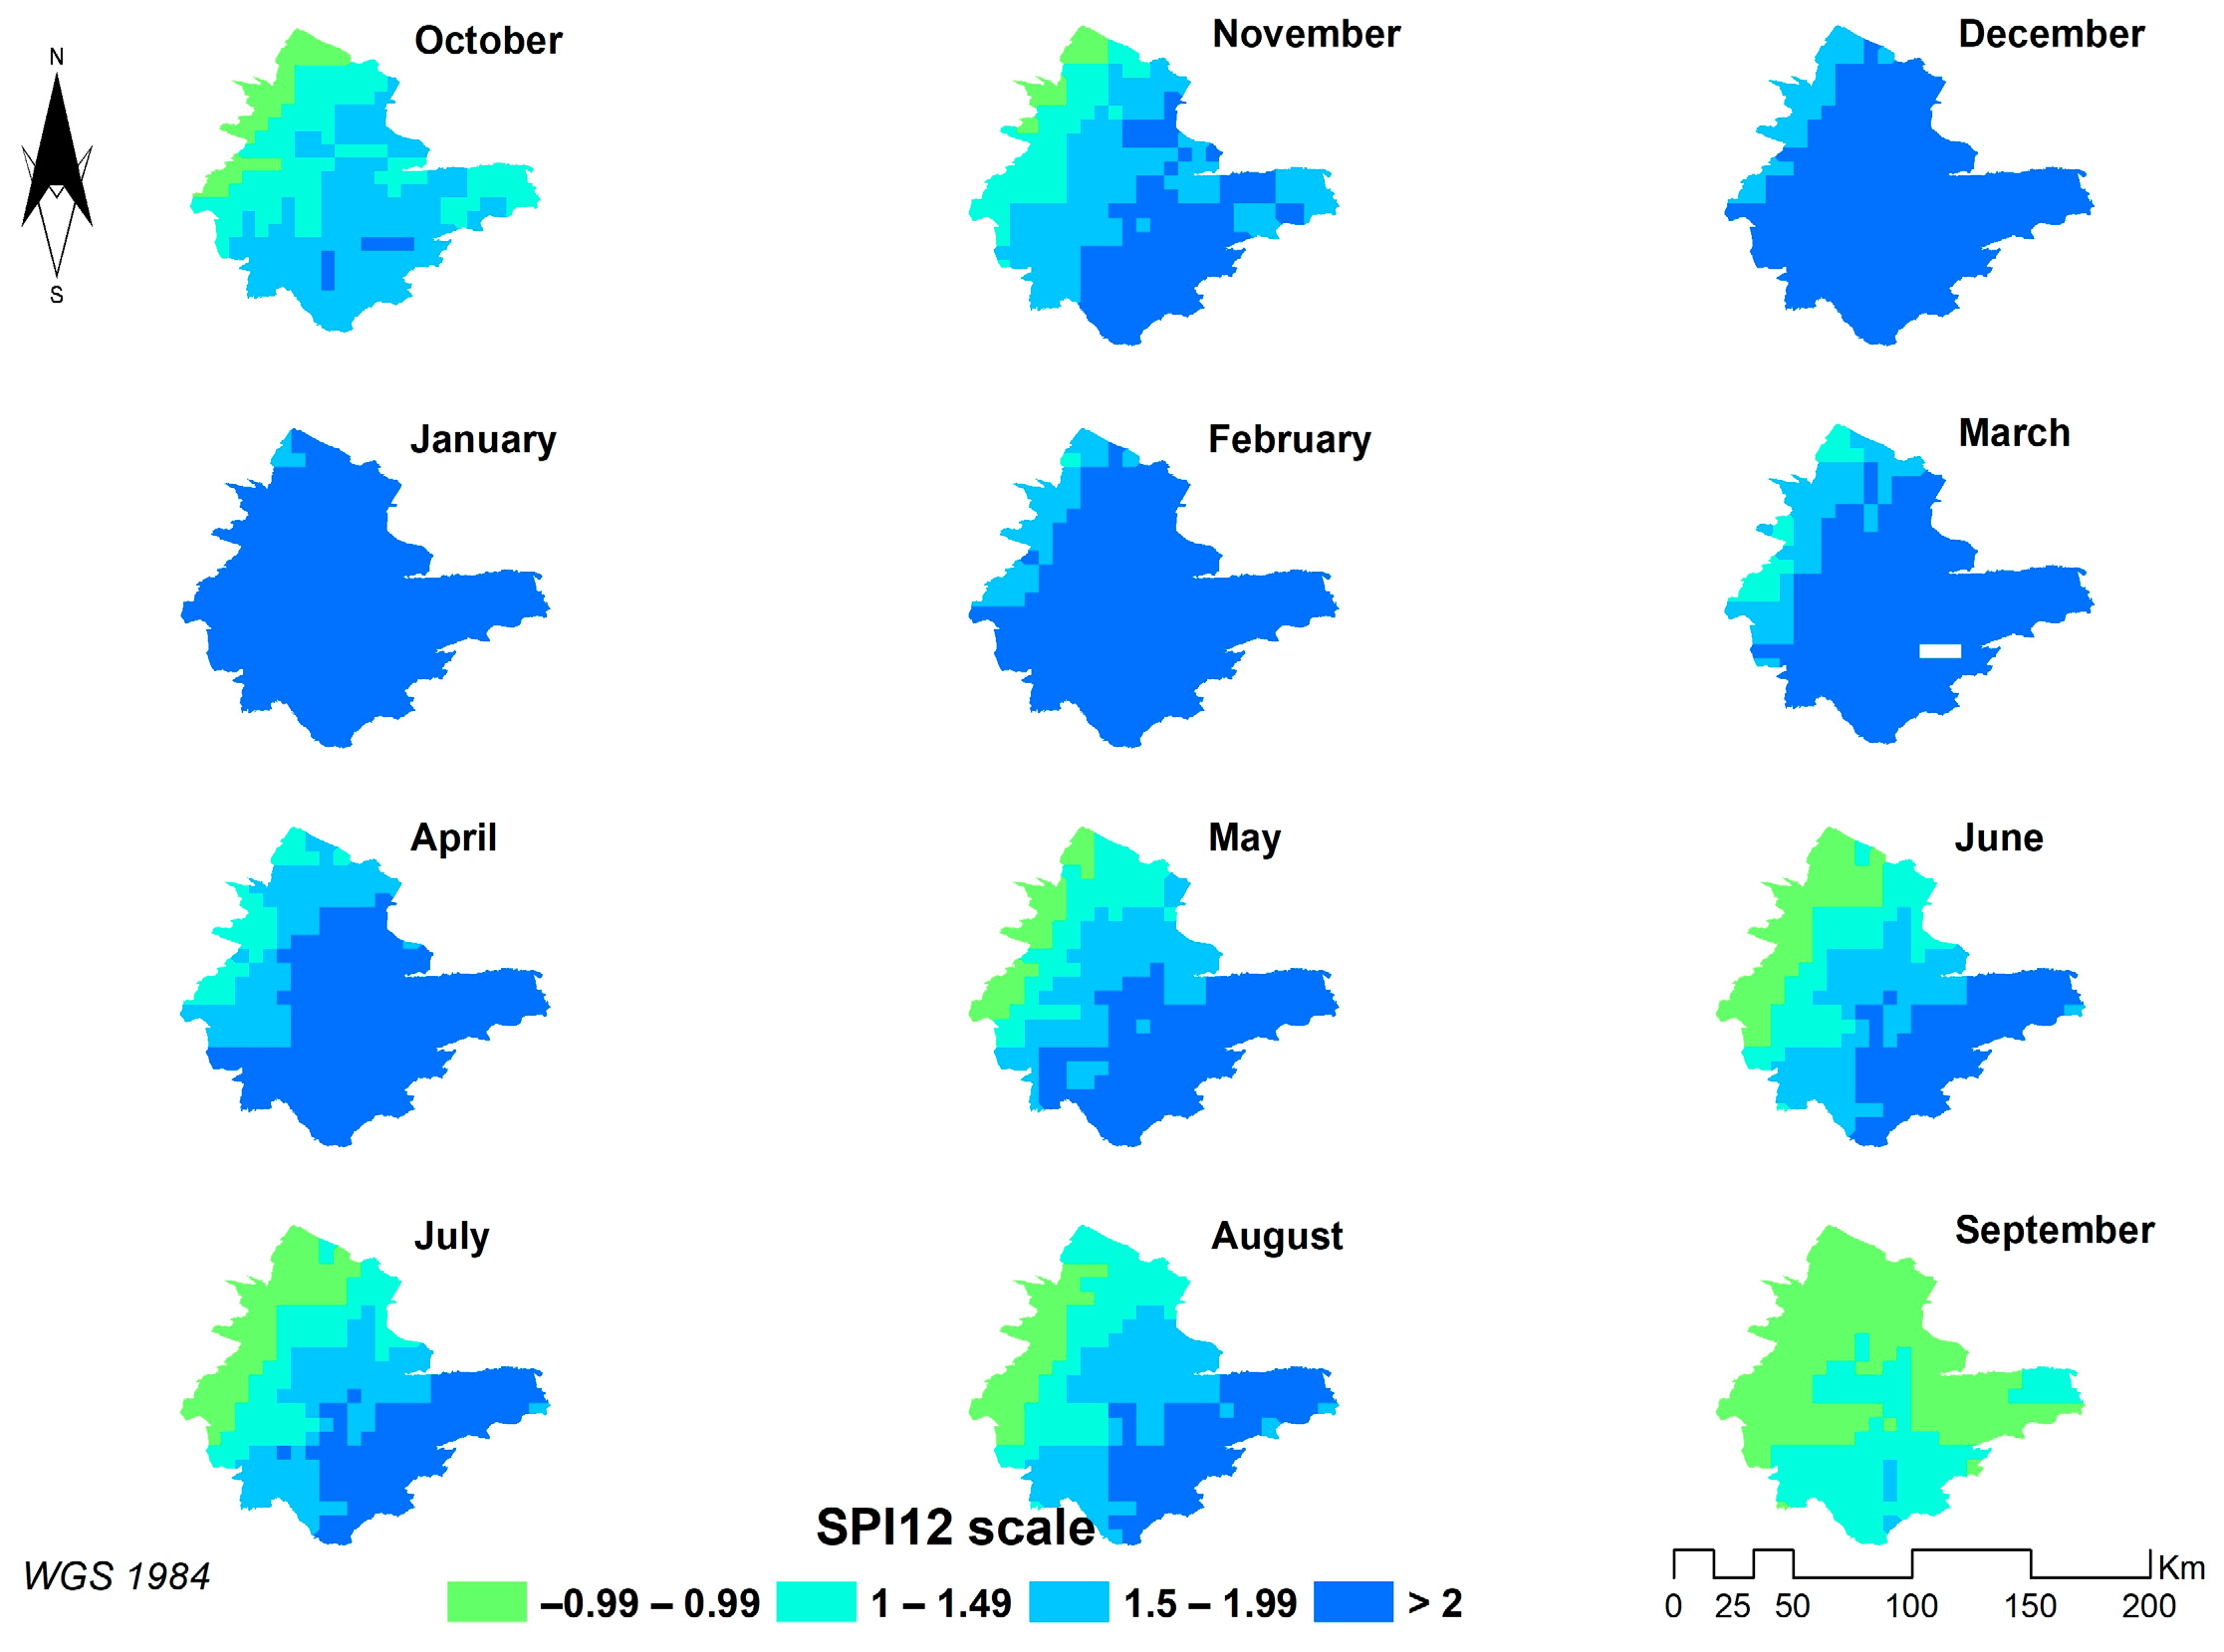
The second driest hydrological year (2015–2016) can be considered highly varied in terms of drought conditions. The Eastern Mancha area falls into normal conditions in October. The southwestern part of the study area was estimated as moderately dry, whereas the remaining part falls into normal conditions for two months, namely November and May. As it can be seen from Figure 6, three distinct regions emerge with declining drought conditions. The southwestern area is characterized by higher levels of drought (severely dry conditions) followed by an interior zone with less severe drought (moderately dry conditions), and an area in the northeastern part of the study domain which presents quite normal conditions. This pattern takes place in January and February. Similar conditions are observed in April and the summer months, namely from June to August, where the territories with normal conditions tend to be minimized. The most severe drought conditions take place in March and September, when most of the study domain is covered by territories with severe drought conditions; there are a few areas with extreme drought conditions, whereas few parts indicate moderately dry conditions (Figure 6).
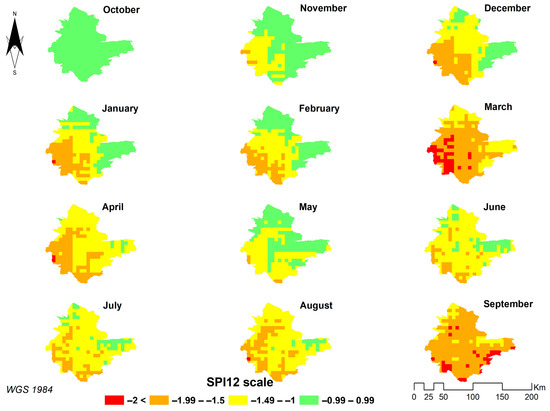
Figure 6.
Monthly SPI12 in Eastern Mancha, Spain (hydrological year: 2015–2016).
Based on Figure 7, December, March, April and September are characterized by a high degree of severely dry conditions which ranges from 32 to 78% of the Eastern Mancha area, whereas the remaining months, except October, mainly face moderately dry conditions, which range from 31 to 72% of the study domain. Indeed, there is a significant difference in drought conditions as compared to the previous driest hydrological year.
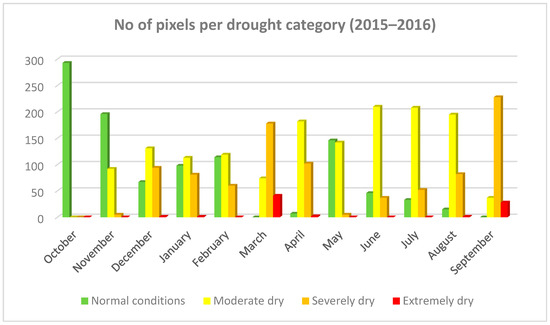
Figure 7.
Number of pixels per drought category in Eastern Mancha, Spain (hydrological year: 2015–2016).
The wettest hydrological year during the 38-year period is 1989–1990. As we can observe from Figure 8, December to April consist of the wettest months (SPI > 2). Moreover, there are three distinct regions in the study area with slightly differentiated conditions. The southeastern part of Eastern Mancha can be considered the wettest region (SPI > 2), whereas three additional zones follow with declining wetness, but with no indication of drought. Specifically, moving from the southeastern to the northwestern part of the study domain, the first zone faces very wet conditions (1.5 < SPI < 1.99), the second zone faces moderately wet conditions (1 < SPI < 1.49), whereas the last conceivable region in the northwestern part faces quite normal conditions (−1 < SPI < 1). These patterns take place in October, November and from May to August. The only exception takes place in September, where there are two conceivable regions. The first half in the south constitutes the wettest part with SPI above 1. The second half in the north is characterized by normal conditions. Hence, there is a certain pattern of declining wetness from the northwestern region to the southeastern.
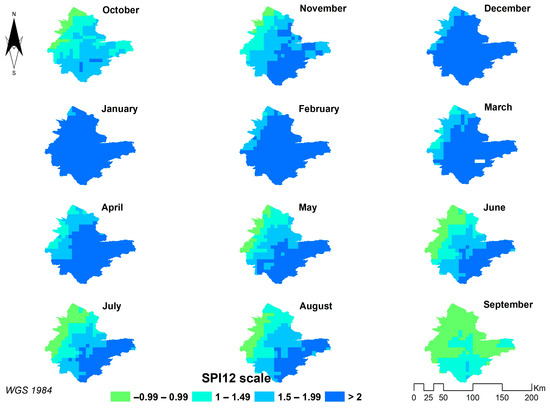
Figure 8.
Monthly SPI12 in Castilla-la-Mancha, Spain (hydrological year: 1989–1990).
The hydrological year 2010–2011 constitutes the second wettest year in Eastern Mancha from 1982 to 2020. Concerning the SPI12 monthly evolution, it is observed that almost the entire study area is characterized by normal conditions (−1 < SPI < 1) with few areas in the west to be characterized with moderately wetter conditions (1 < SPI < 1.49) in March, as well as from June to September. In the same context, the study domain is split into two conceivable regions with slightly differentiated conditions. Specifically, the western region is moderately wet, whereas the eastern part continues to face normal conditions in February, April and May. On the other hand, the wettest months are from October to January with SPI12 higher than 1. In addition, there are a few regions with SPI12 higher than 2 in November making it the wettest month in the entire hydrological year (Figure 9).
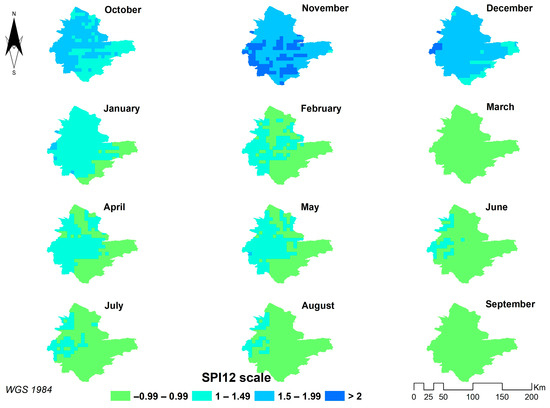
Figure 9.
Monthly SPI12 in Eastern Mancha, Spain (hydrological year: 2010–2011).
3.2. Spatiotemporal Analysis of Annual and Intra-Annual Drought/Wetness Severity in Sidi Bouzid (Tunisia)
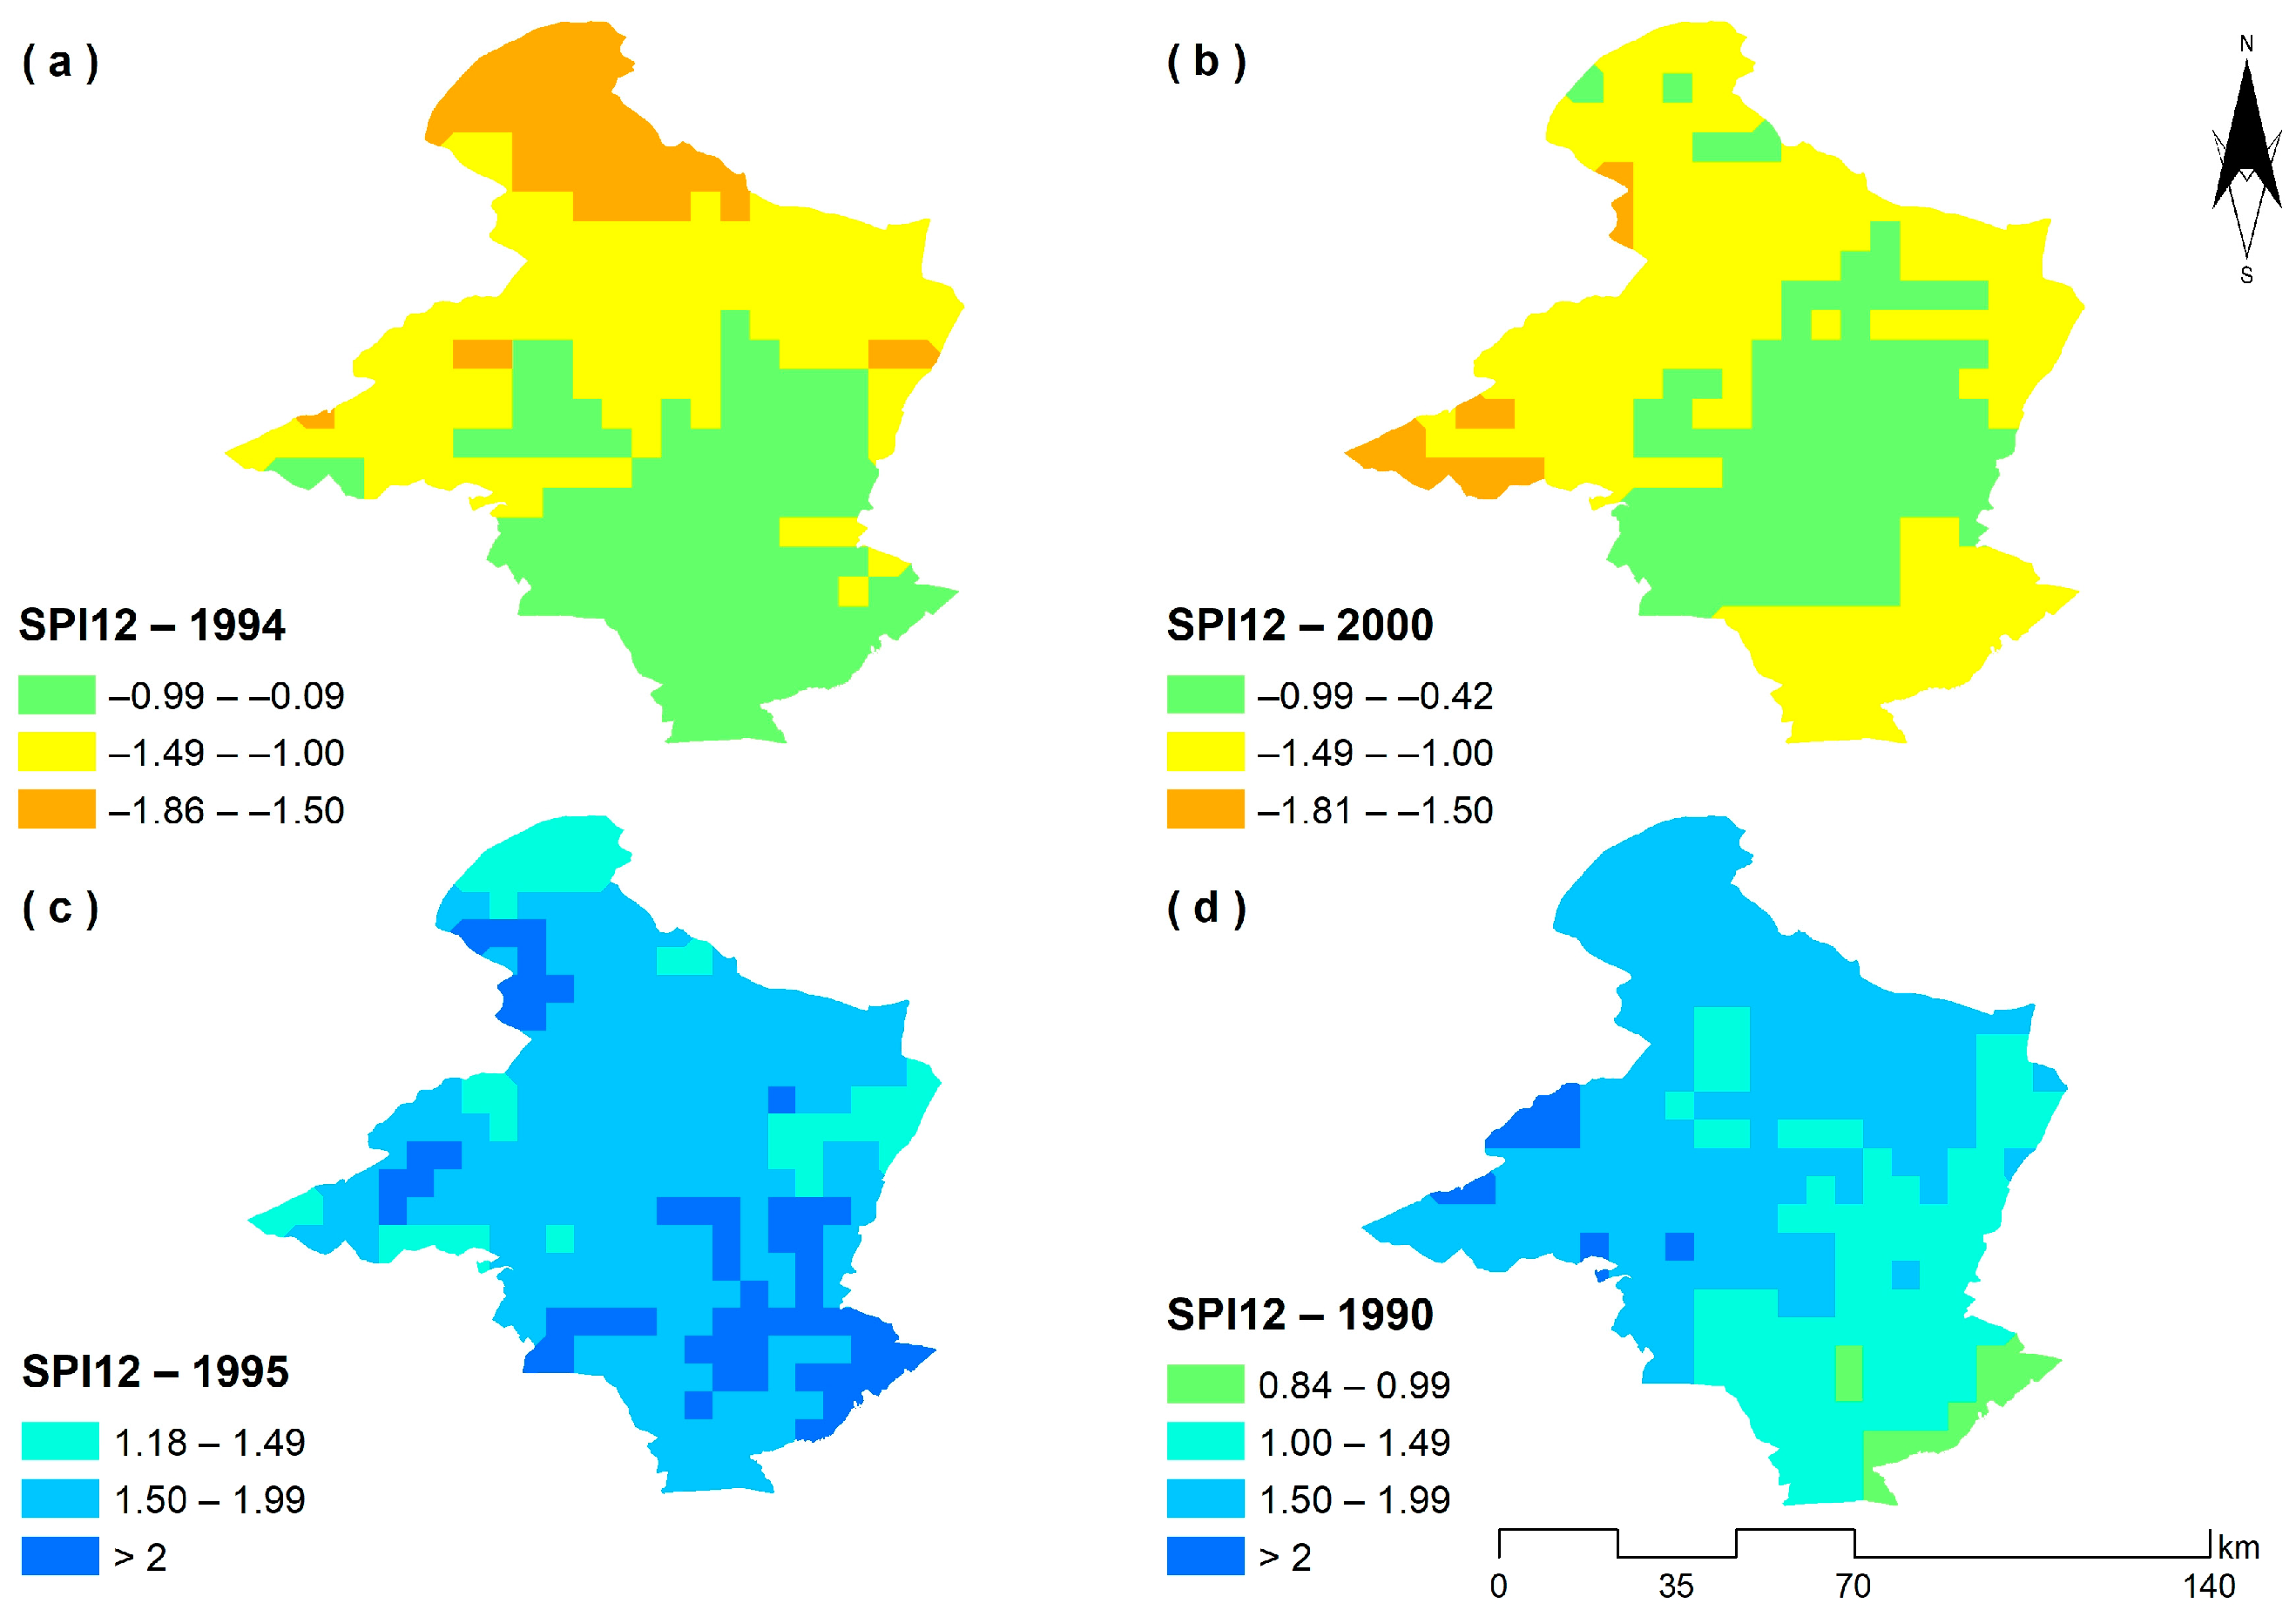
Next, the environmental extremes are examined in terms of drought in Sidi Bouzid (Tunisia). Figure 10a depicts the driest hydrological year (1994–1995). The values of SPI12 range from −1.86 to −1. The driest regions are in the north of the study area (−1.86 < SPI < −1.50), followed by a region in the center of Sidi Bouzid, which faces moderate drought conditions (−1 < SPI < 1.5), whereas the degree of drought is very close to normal conditions (−1–0) in the southern part of the study domain. Figure 10b represents the second driest hydrological year that occurred in 2000–2001. Here, the least value is −1.81, whereas the highest value is −0.42. Specifically, the zone with the highest degree of drought is in the western region (−1.81–−1.50). The northern, southern and northeastern parts of Sidi Bouzid are characterized by moderate drought conditions (−1 < SPI < 1.5), whereas the central territory faces normal conditions (−0.99 < SPI < 0.99). Figure 10c depicts the wettest year in Tunisia that occurred in the hydrological year of 1995–1996, where the lowest value of SPI12 is 1.18 and the highest value is 2.56. From the same figure, it is observed that the study area is divided into three zones of wetness, where the first zone covers almost all the central study area, which is characterized by very wet conditions (1.5 < SPI < 2). A few scattered regions in the north and east face a moderate degree of wetness (1 < SPI < 1.5), whereas the wettest regions of Sidi Bouzid are in the southeastern and northwestern territory (SPI > 2). Finally, Figure 10d shows the second wettest hydrological year (1990–1991) in Tunisia throughout the time reference (1980–2020). The range of SPI12 is from 0.84 up to 2. Here, the western and northern part of the Tunisia pilot site is characterized by the highest degree of wetness (1< SPI < 1.5), whereas the remaining part (mostly the southeastern) is slightly drier (0.84 < SPI < 1). However, the overall conditions in Sidi Bouzid represent favorable conditions for the crop viability.

Figure 10.
SPI12 mapping in (a) the driest year, (b) the second driest year, (c) the wettest year, (d) the second wettest year in Sidi Bouzid (Tunisia).
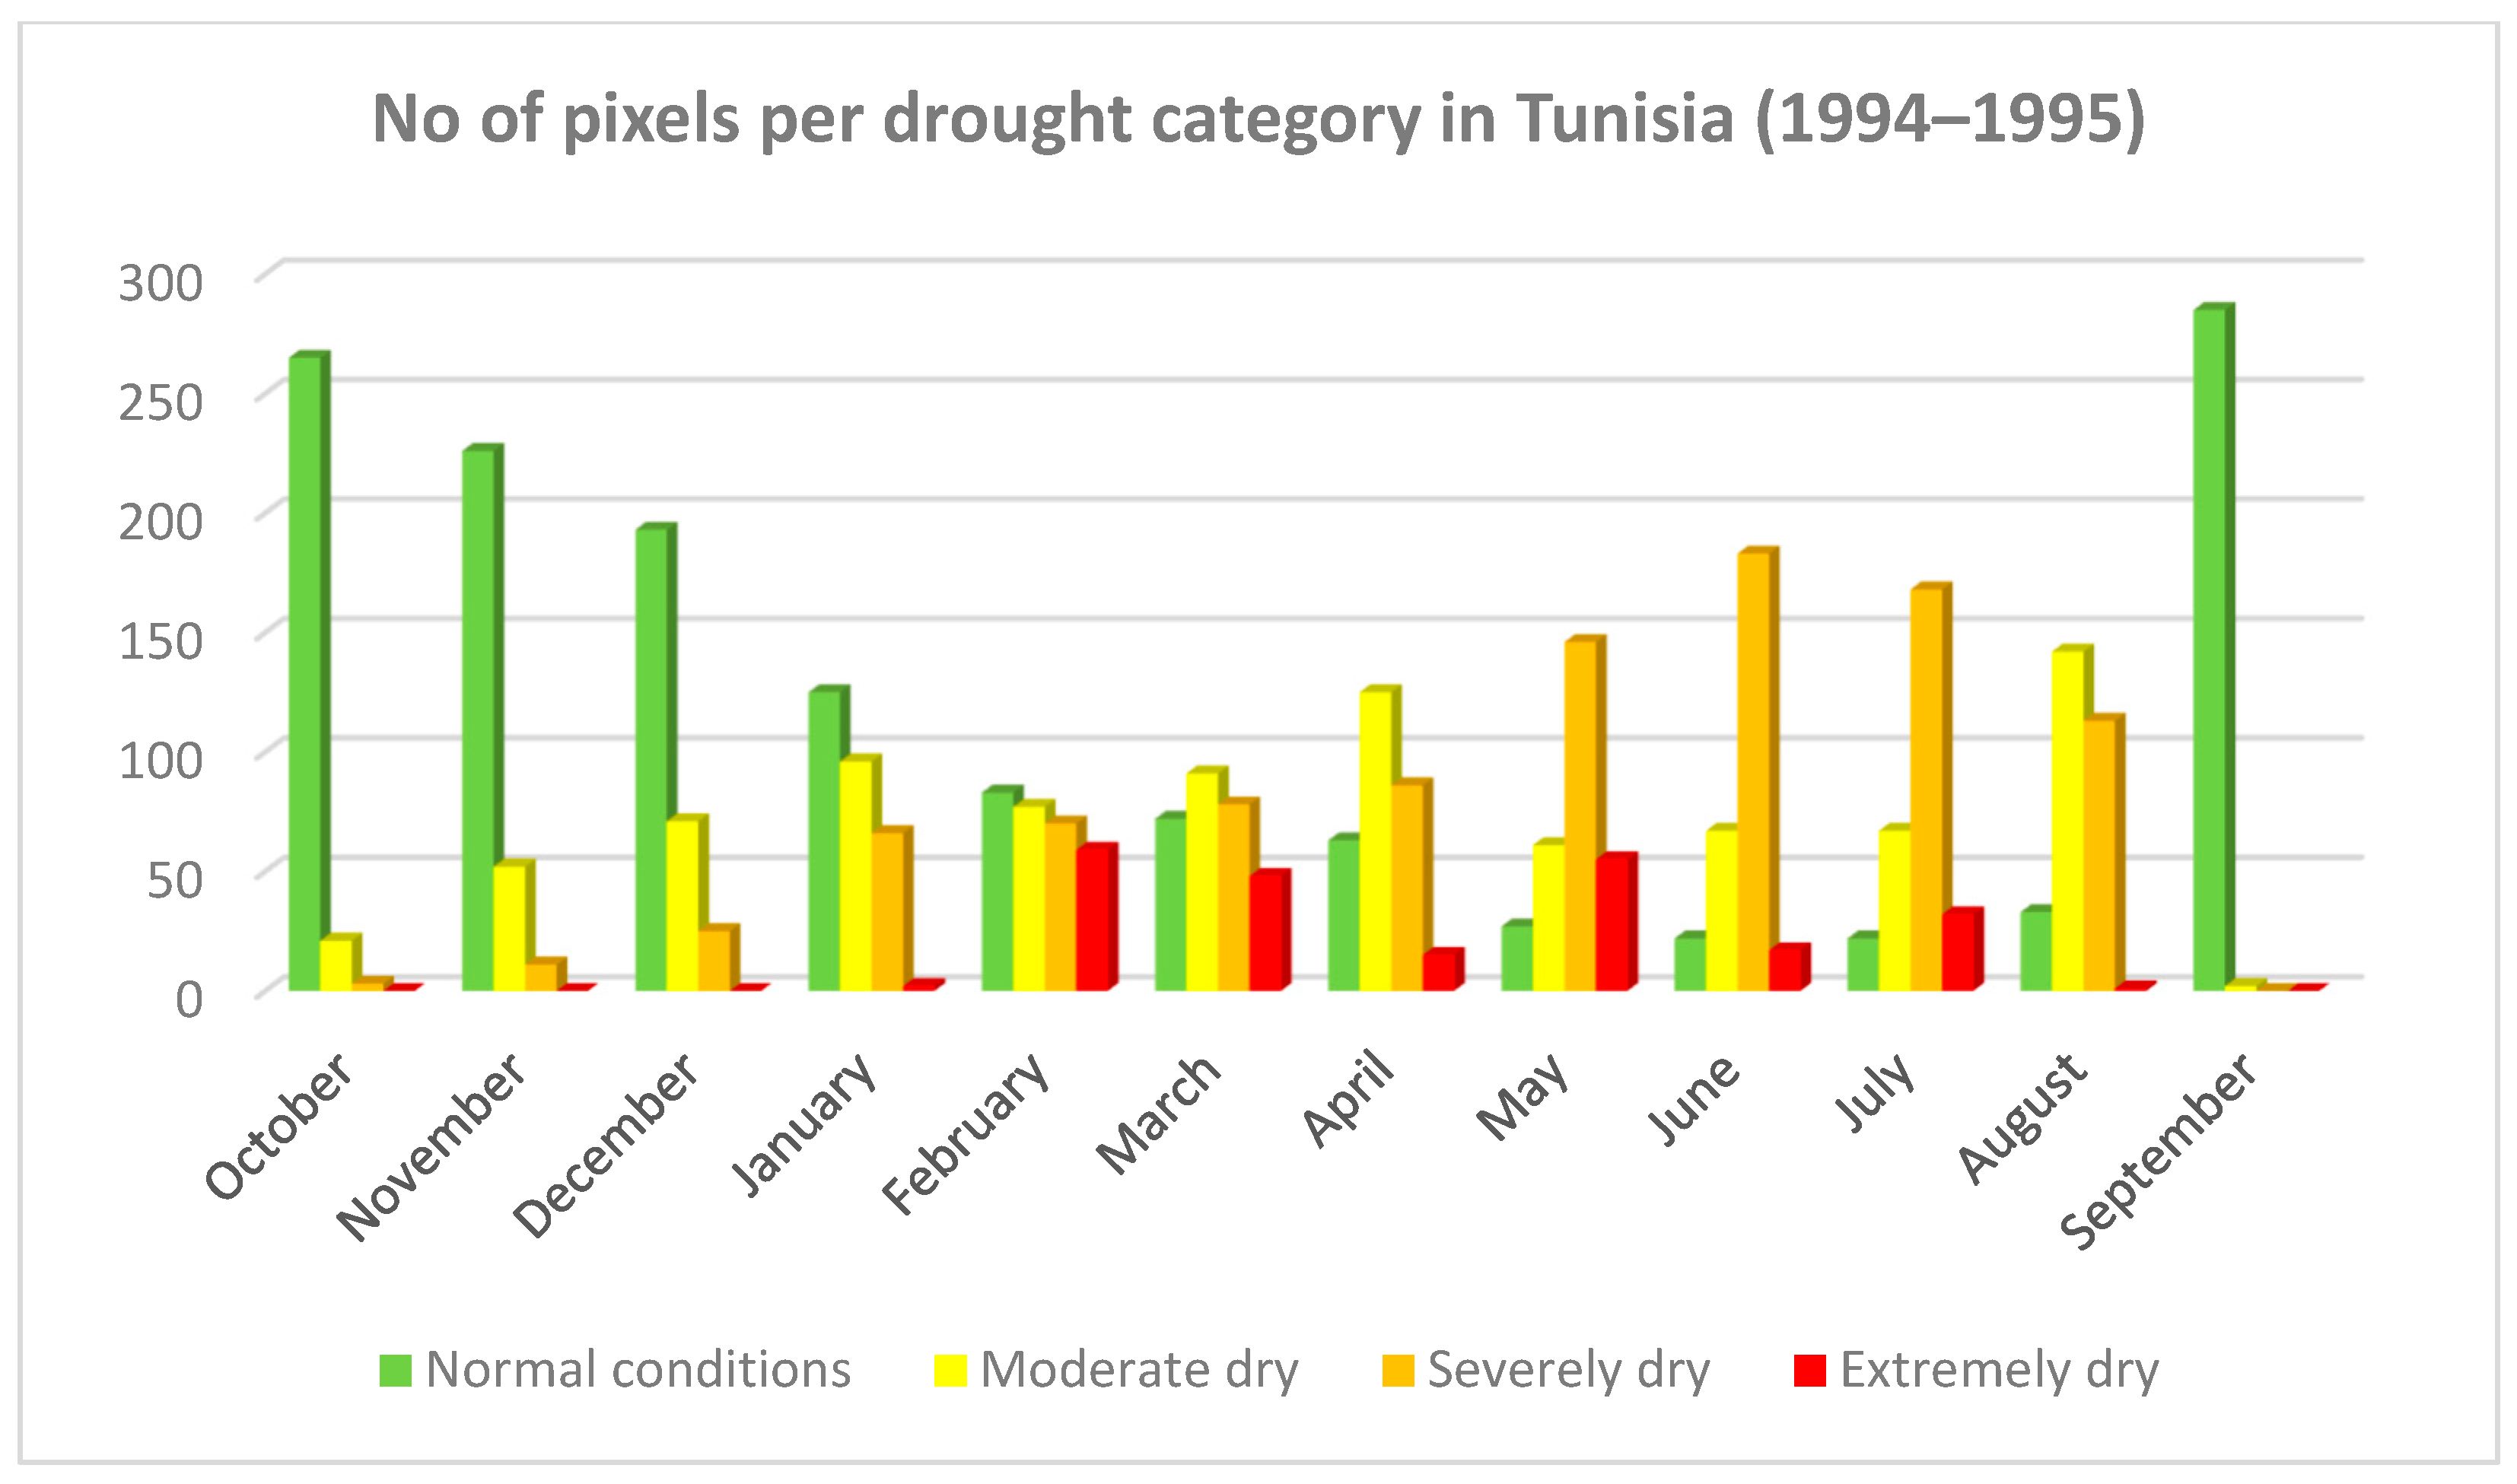
The driest hydrological year in Sidi Bouzid is 1994–1995 with a high degree of fluctuations in drought conditions (Figure 11). Specifically, the months from February to July and September face extremely dry conditions, where the northern part of the study area is characterized as the driest territory (SPI < −2). Moreover, the same months are characterized by moderate and severe drought conditions covering the central part of Sidi Bouzid, where extensive regions are characterized by SPI12 from −1.5 to −1.99 and from −1 to −1.49. The southern territory of the study area faces normal conditions (−1 < SPI < 1), but it constitutes just a small part of the entire study area. On the other hand, the months from October to December consist of months that face normal conditions, where extensive regions are characterized by SPI12 from −0.99 to 0.99. In addition, a few regions in the north are characterized by moderate drought conditions (−1.49 < SPI < −1). Almost the entire study domain faces normal conditions in September.
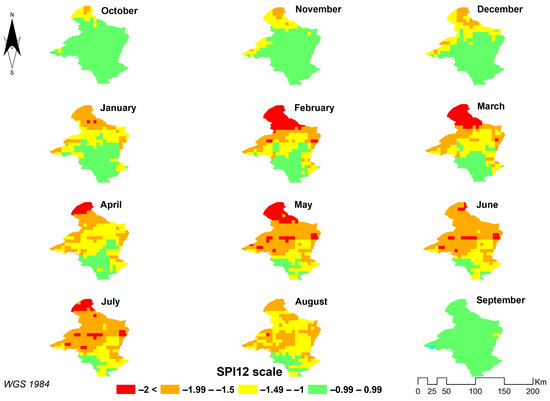
Figure 11.
Monthly SPI12 in Sidi Bouzid (hydrological year: 1994–1995).
Figure 12 shows the total number of pixels falling into different categories of drought severity for the driest hydrological year in Sidi Bouzid (Tunisia). Extremely dry conditions are in just 19–20% of the study area in February and April, whereas severely dry conditions prevail from January to August covering from 23% to 63% of the entire region. 21% to 49% of the Sidi Bouzid are characterized by moderately dry conditions for the same months, whereas the normal conditions prevail from October to December and September (67–99% of the study domain).

Figure 12.
Number of pixels per drought category in Sidi Bouzid, Tunisia (hydrological year: 1994–1995).
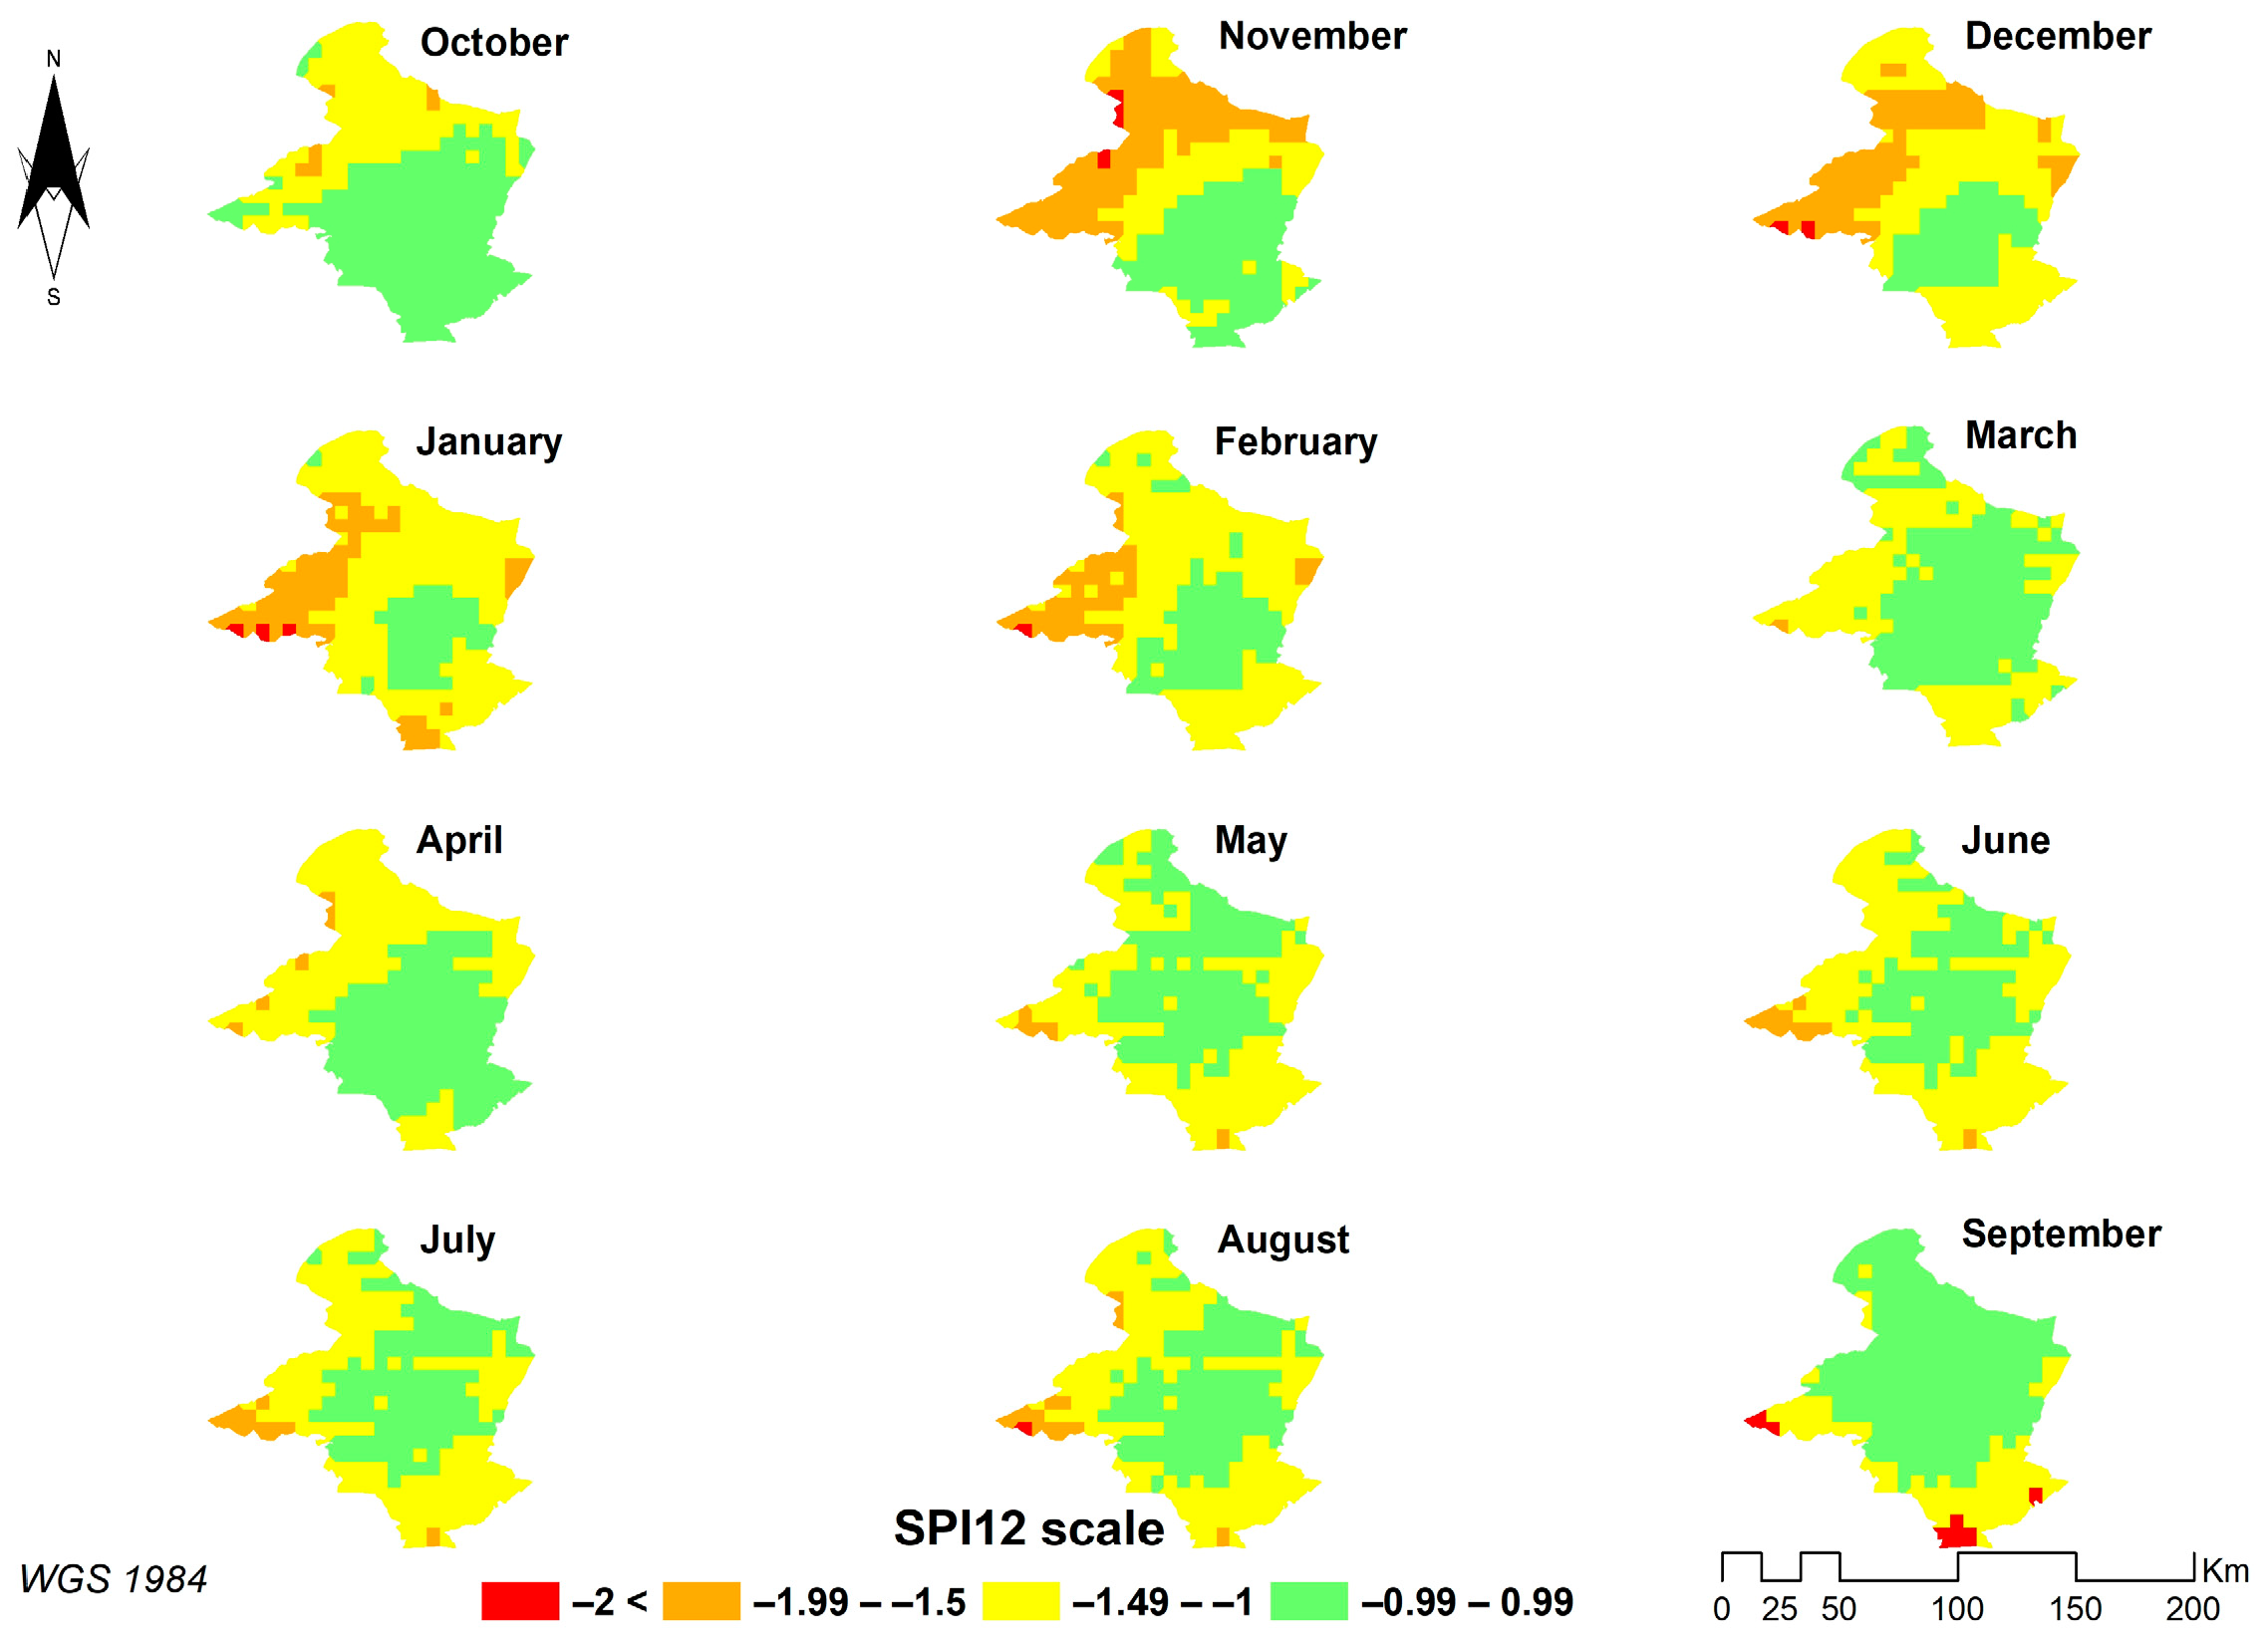
The hydrological year 2000–2001 (the second driest year) can be considered highly varied in terms of drought conditions. The central part of Sidi Bouzid is characterized by normal conditions (−0.99 < SPI < 0.99) for all the months of this hydrological year. The northern–western part of the study area was estimated as moderately dry, whereas the remaining part falls into moderately drought conditions for four months, namely from November to February. There seems to be a certain pattern of drought conditions from March to August. The central area is surrounded by the territory of moderately drought conditions (−1.49 < SPI < −1), whereas there are a few regions in the west with a higher degree of drought (−1.99 < SPI < −1.5). Very few areas with extreme drought conditions are observed in September. They are in the southern and western parts of the study domain. However, a major part of Sidi Bouzid is characterized by normal conditions, whereas there is a small adjacent buffer in the south with moderate drought conditions (Figure 13).

Figure 13.
Monthly SPI12 in Sidi Bouzid (hydrological year: 2000–2001).
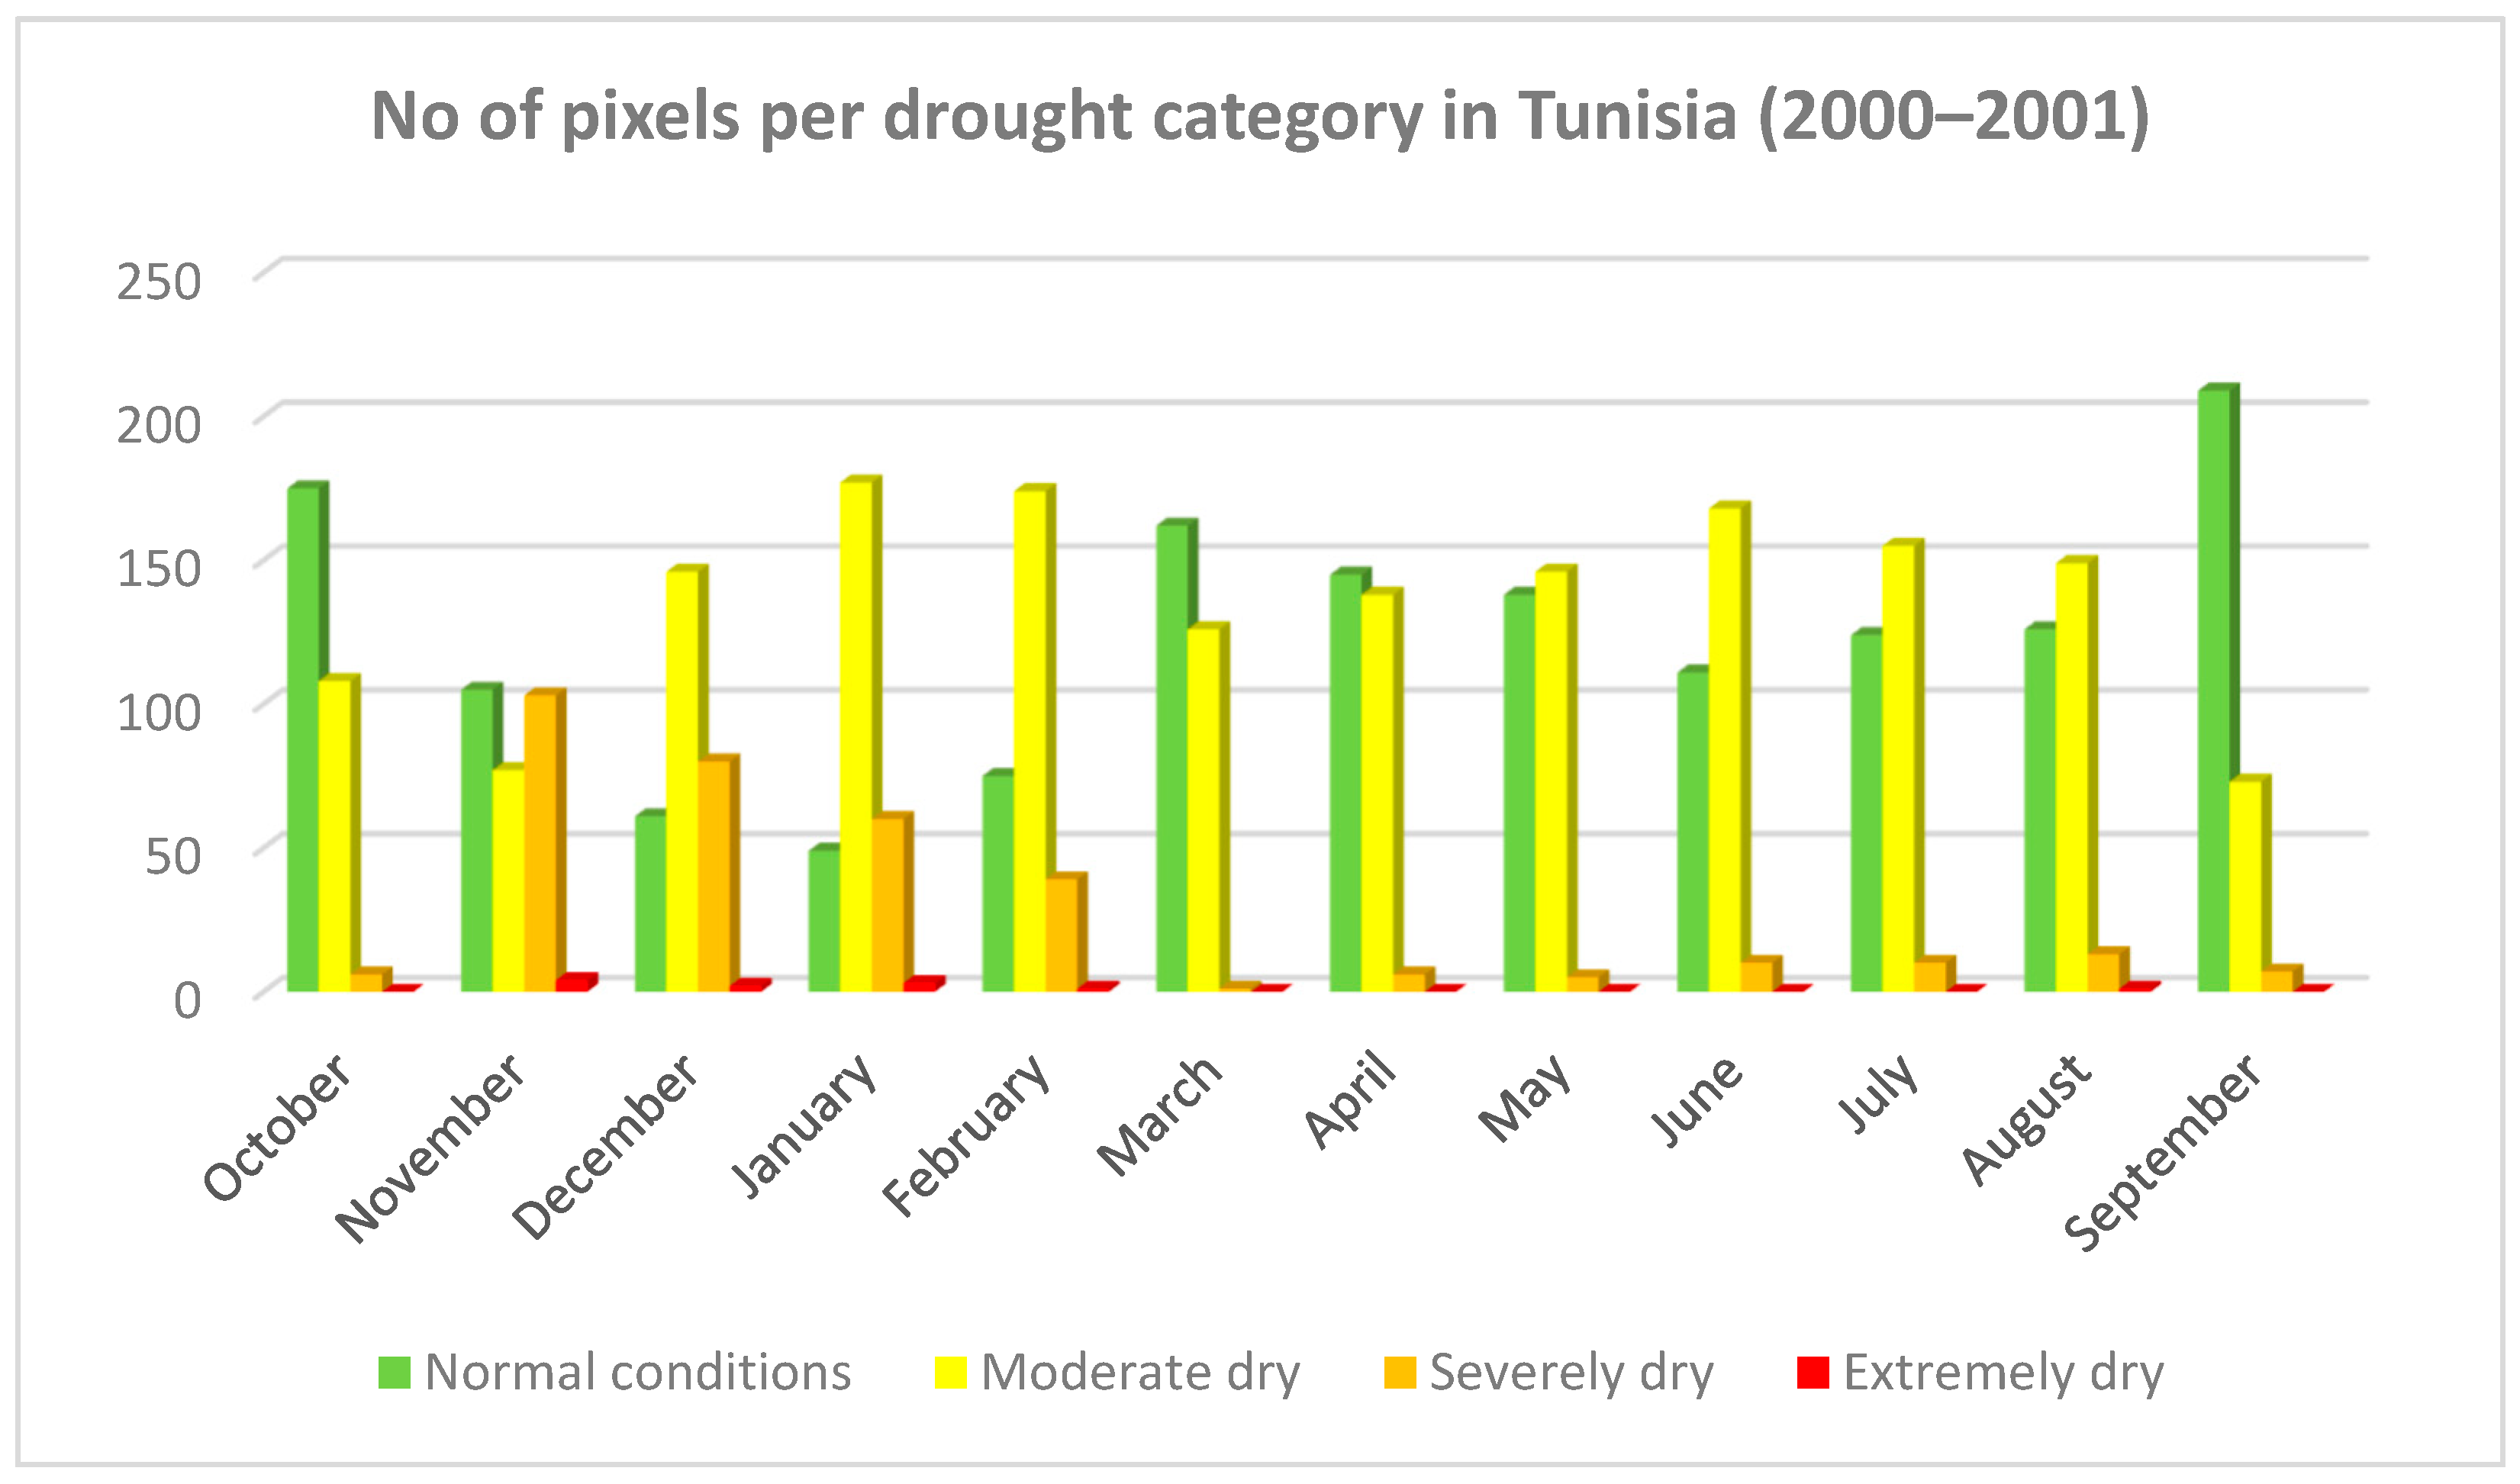
The conditions in the second driest year are significantly different. Severely dry conditions exist only from November to January (21–36% of the study domain), whereas all the remaining months, except November and September, face moderately dry conditions, which is translated to a total geographical coverage from 37% to 61% of Sidi Bouzid. All months, except January, present normal conditions for more than 20% of the entire study area (Figure 14).
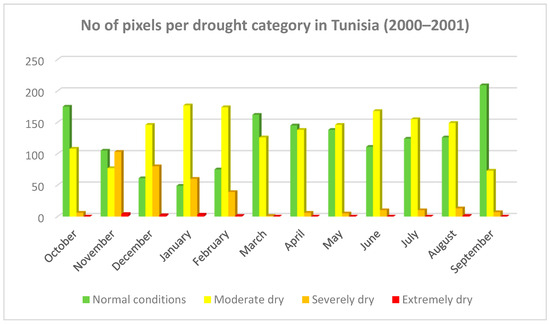
Figure 14.
Number of pixels per drought category in Sidi Bouzid, Tunisia (hydrological year: 2000–2001).
The wettest hydrological year in the time frame of 40 years is 1995–1996. As it is observed from Figure 15, January to December consist of the wettest months (SPI > 2). Specifically, the first three months of this hydrological year (i.e., October to December) mainly present normal humidity conditions (−0.99 < SPI < 0.99). On the other hand, the central territory, as well as a few regions in the south, are characterized by moderate drought conditions (−1.49 < SPI < −1) for the same months. Almost the entire study area is characterized by extremely wet conditions from January to August, except a few regions in the north, which face very wet conditions. September seems to be a drier month compared to the previous ones, indicating moderate and very wet conditions (Figure 15).

Figure 15.
Monthly SPI12 in Sidi Bouzid (hydrological year: 1995–1996).
The hydrological year 1990–1991 constitutes the second wettest year in the Sidi Bouzid area from 1982 to 2020 (Figure 16). Regarding the monthly evolution of SPI12, it is observed that from May to September almost the entire study area is characterized by normal conditions (−1 < SPI < 1) with a few areas in the north and west being characterized by moderately wet conditions (1 < SPI < 1.49). In the same context, there are different conditions in the remaining months, namely from October to April. Specifically, these months present exceptional humidity with its peak taking place in the first three months of the hydrological year. The central and western regions of the study domain are characterized by extreme and moderate drought conditions, whereas the southern territory faces normal conditions (Figure 16).
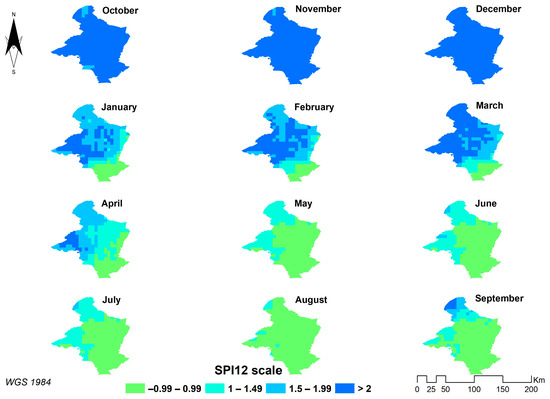
Figure 16.
Monthly SPI12 in Sidi Bouzid (hydrological year: 1990–1991).
3.3. Spatiotemporal Analysis of Annual and Intra-Annual Drought/Wetness Severity in Beqaa Valley (Lebanon)
The third sub-section describes the drought/wetness extremes in Beqaa valley (Lebanon). Figure 17a depicts the driest hydrological year (1989–1990) throughout the reference 38-year period (1982–2020). The values of SPI12 range from −1.92 to −0.67. The driest regions (−1.99 < SPI < −1.5) are in the central part of the wider area of the study domain (inside the pilot study area, which is represented by a black rectangle, followed by extensive regions in the east). The southwestern part of this region is characterized by normal conditions, whereas the remaining territory primarily faces moderate drought conditions (−1.49 < SPI < −1). Figure 17b represents the second driest hydrological year that occurred in 2007–2008. Here, the lowest value is −1.64, whereas the highest value is −0.81. Almost the entire study area is characterized by moderate drought conditions for this year. The same happens in the entire pilot study area. There are only a few regions with drier conditions in the west (−1.99 < SPI < −1.5) and a few regions with wetter conditions in the southeastern part of the wider territory (−0.99 < SPI < 0.99). Figure 17c shows the wettest year in Lebanon (2018–2019), where the minimum value of SPI12 is 1.42 and the highest value is 2.9. The greatest part of the wider area is characterized by extremely wet conditions (SPI > 2), whereas there are some scattered regions with slightly less humidity (1 < SPI < 2). Almost the entire pilot study area faces extremely wet conditions. Finally, Figure 17d depicts the second wettest year that occurred in the hydrological year of 2002–2003. The range of SPI12 varies from 1.07 up to 1.98. Here, the southern half part of the pilot study area mostly faces moderate wet conditions (1 > SPI > 1.49), whereas the remaining part (the northern region) is slightly wetter (1.5 > SPI > 1.98) representing favorable conditions for crop viability.
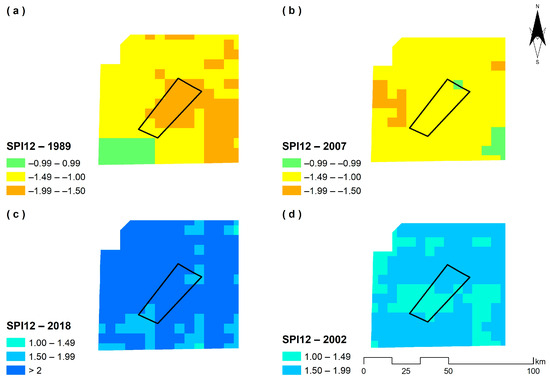
Figure 17.
SPI12 mapping in (a) the driest year, (b) the second driest year, (c) the wettest year, (d) the second wettest year in Beqaa valley (Lebanon).
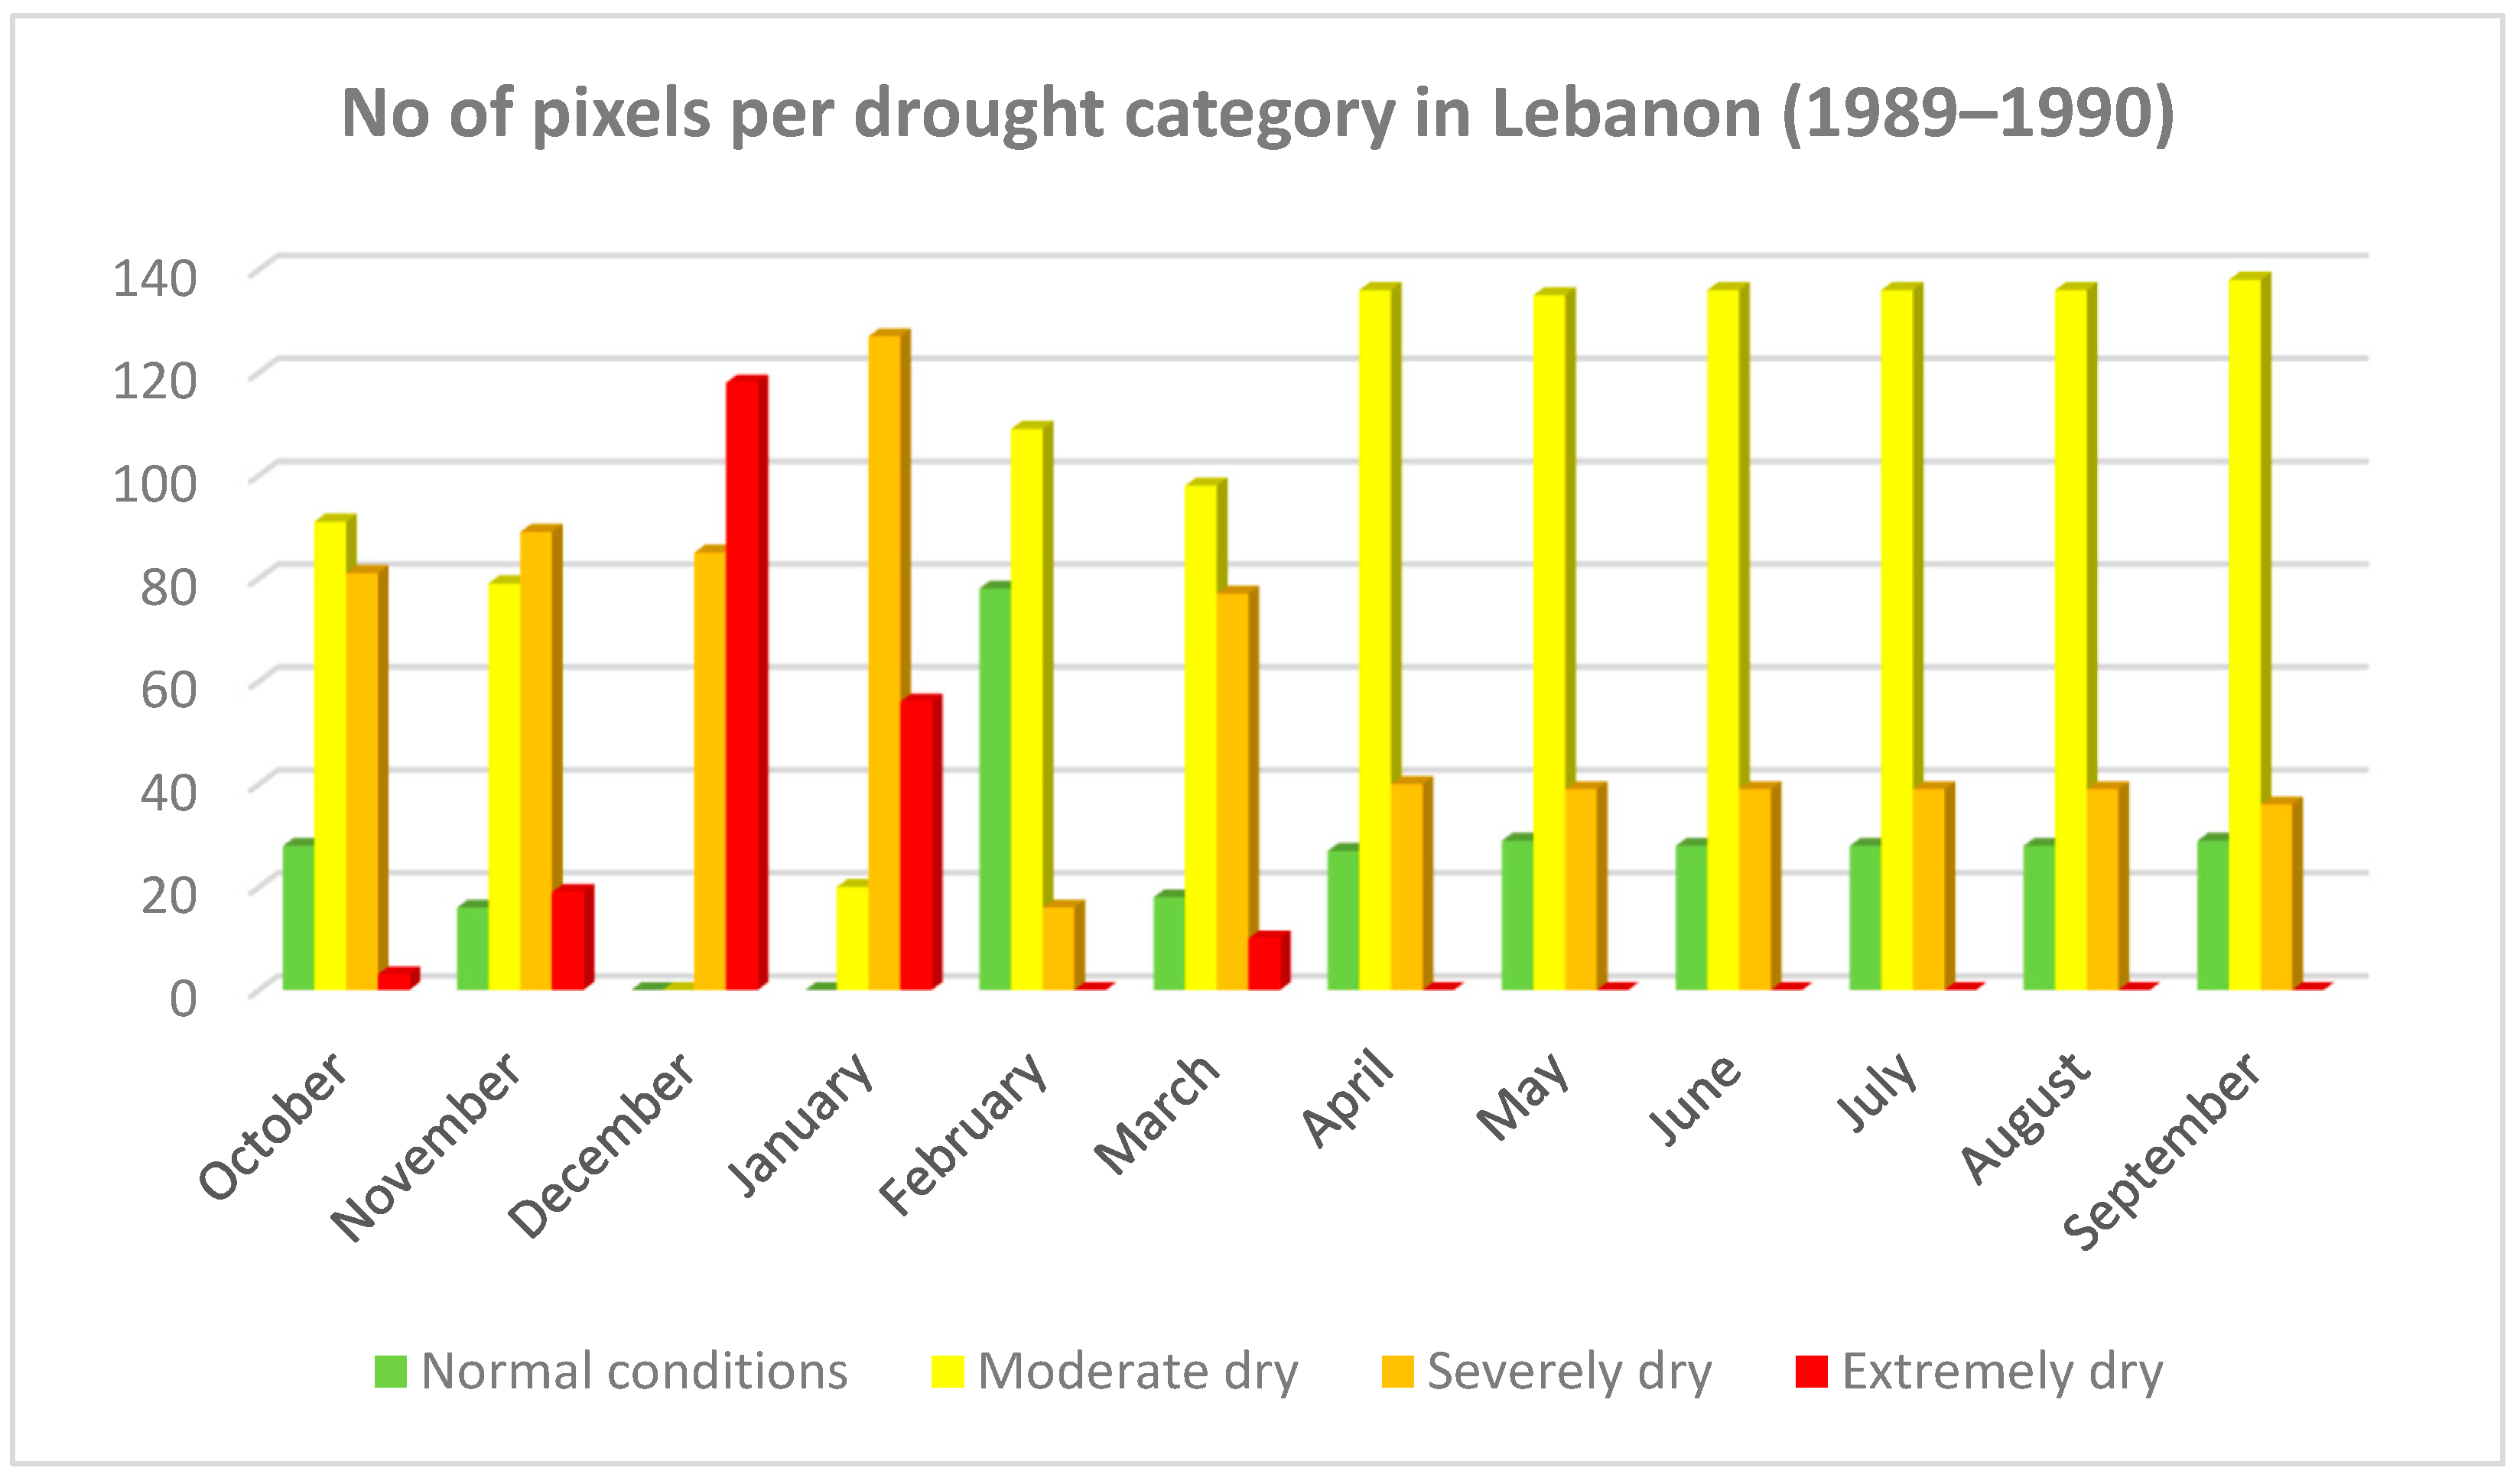
Regarding Beqaa valley, the hydrological year 1989–1990 has been estimated as the driest hydrological year. Exclusively focusing on the pilot study area, December and January consist of the two months with the highest degree of drought (SPI < −2). In all the other months, except February, severe drought conditions are observed (−1.99 < SPI < −1.5) in the greatest part of the study domain with a few scattered regions exhibiting moderate drought conditions (−1.49 < SPI < −1). The pilot study area faces exclusively moderate drought conditions only in February (Figure 18).
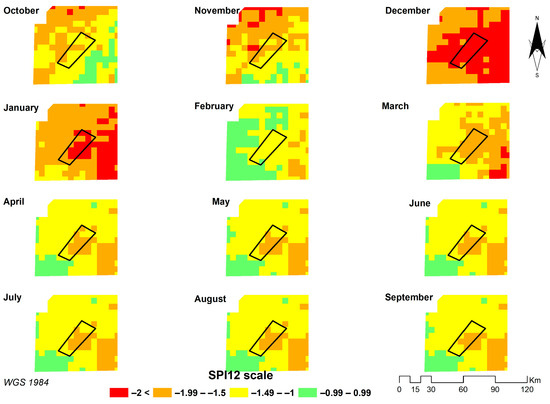
Figure 18.
Monthly SPI12 in Beqaa Valley (hydrological year: 1989–1990).
Based on Figure 19, extremely dry conditions primarily exist only in December and January, which range from 28 to 58% of Beqaa Valley. Severely dry conditions prevail primarily from October to January and March covering 40–63% of the entire study area. However, the driest hydrological year in the study area is mainly characterized by moderately dry conditions for all months, except December and January (which face extreme and severe drought), covering 39–68% of Beqaa Valey.

Figure 19.
Number of pixels per drought category in Beqaa Valley, Lebanon (hydrological year: 1989–1990).
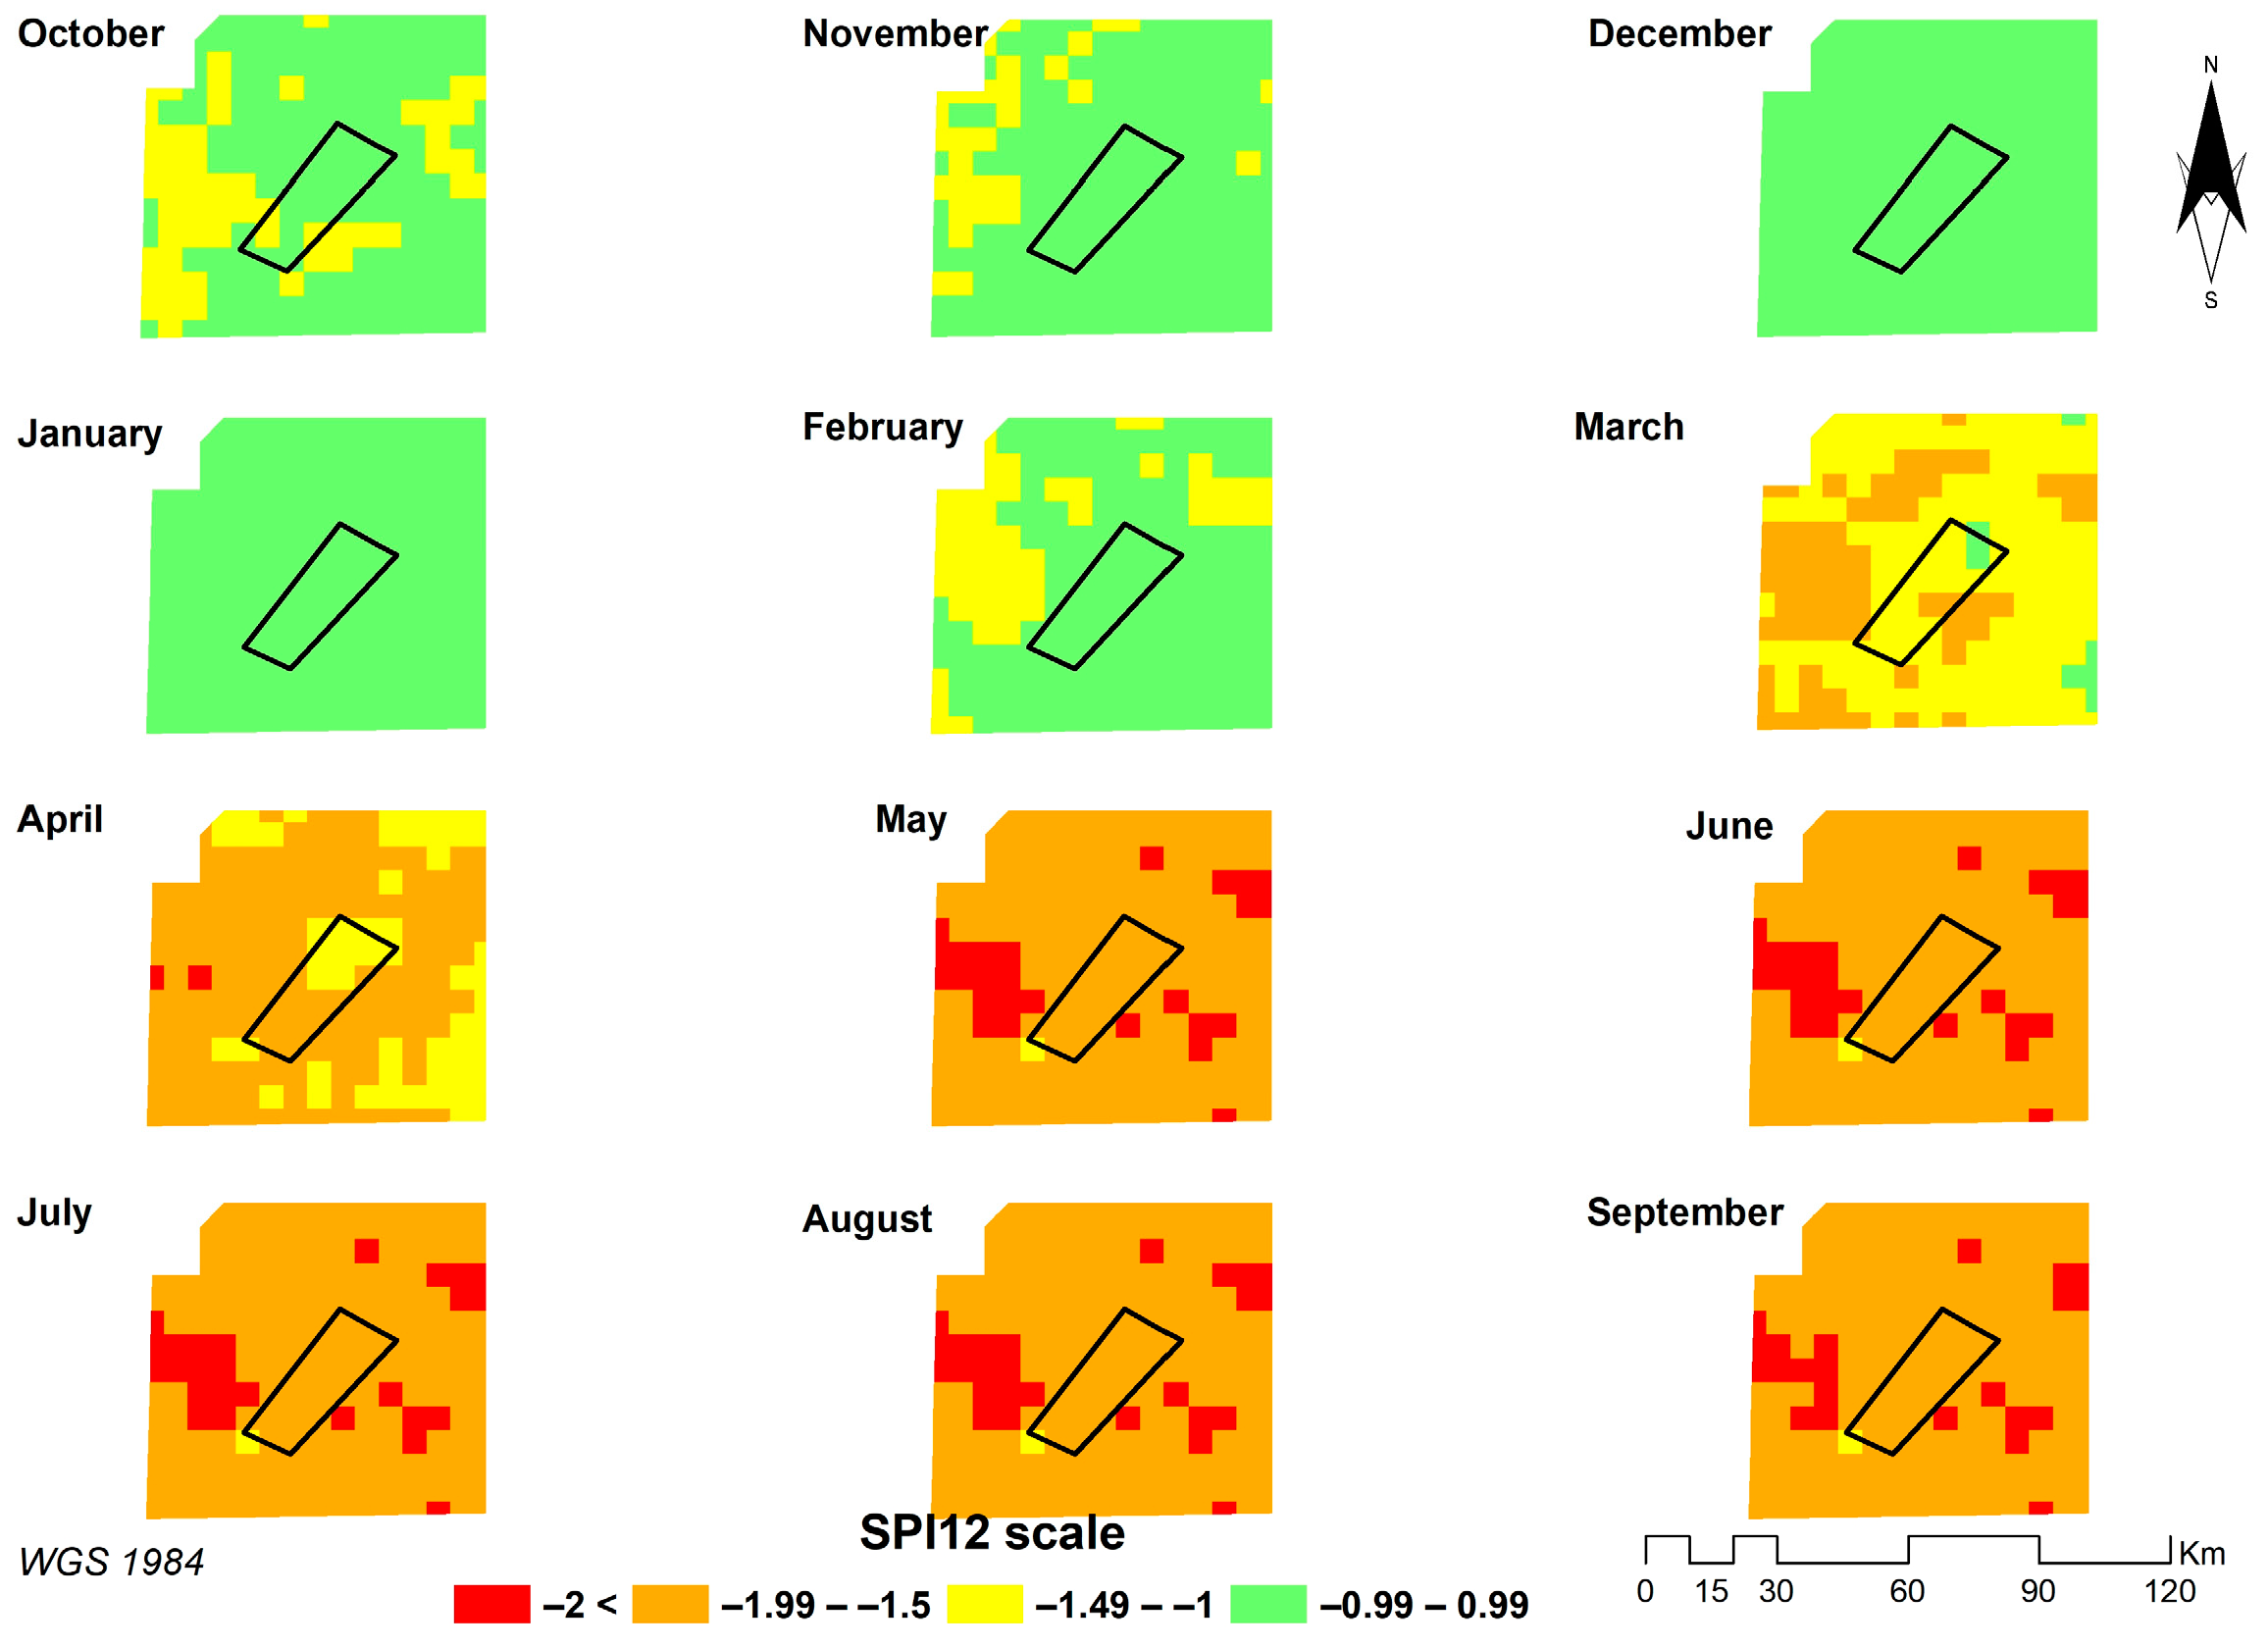
The hydrological year 2007–2008 constitutes the second driest year in the Beqaa Valley. With regards to the monthly evolution of SPI12, it is observed that the pilot study area is characterized by severe drought conditions (−1.99 < SPI < −1.5) from April to September. There is a small region with less severe drought conditions (moderately drought conditions: −1.49 < SPI < −1) in April. It is noticed that the study domain faces normal conditions (−0.99 < SPI < 0.99) from October to February, whereas the wider area of Beqaa Valley is characterized by moderate drought conditions in March (Figure 20).

Figure 20.
Monthly SPI12 in Beqaa valley (hydrological year: 2007–2008).
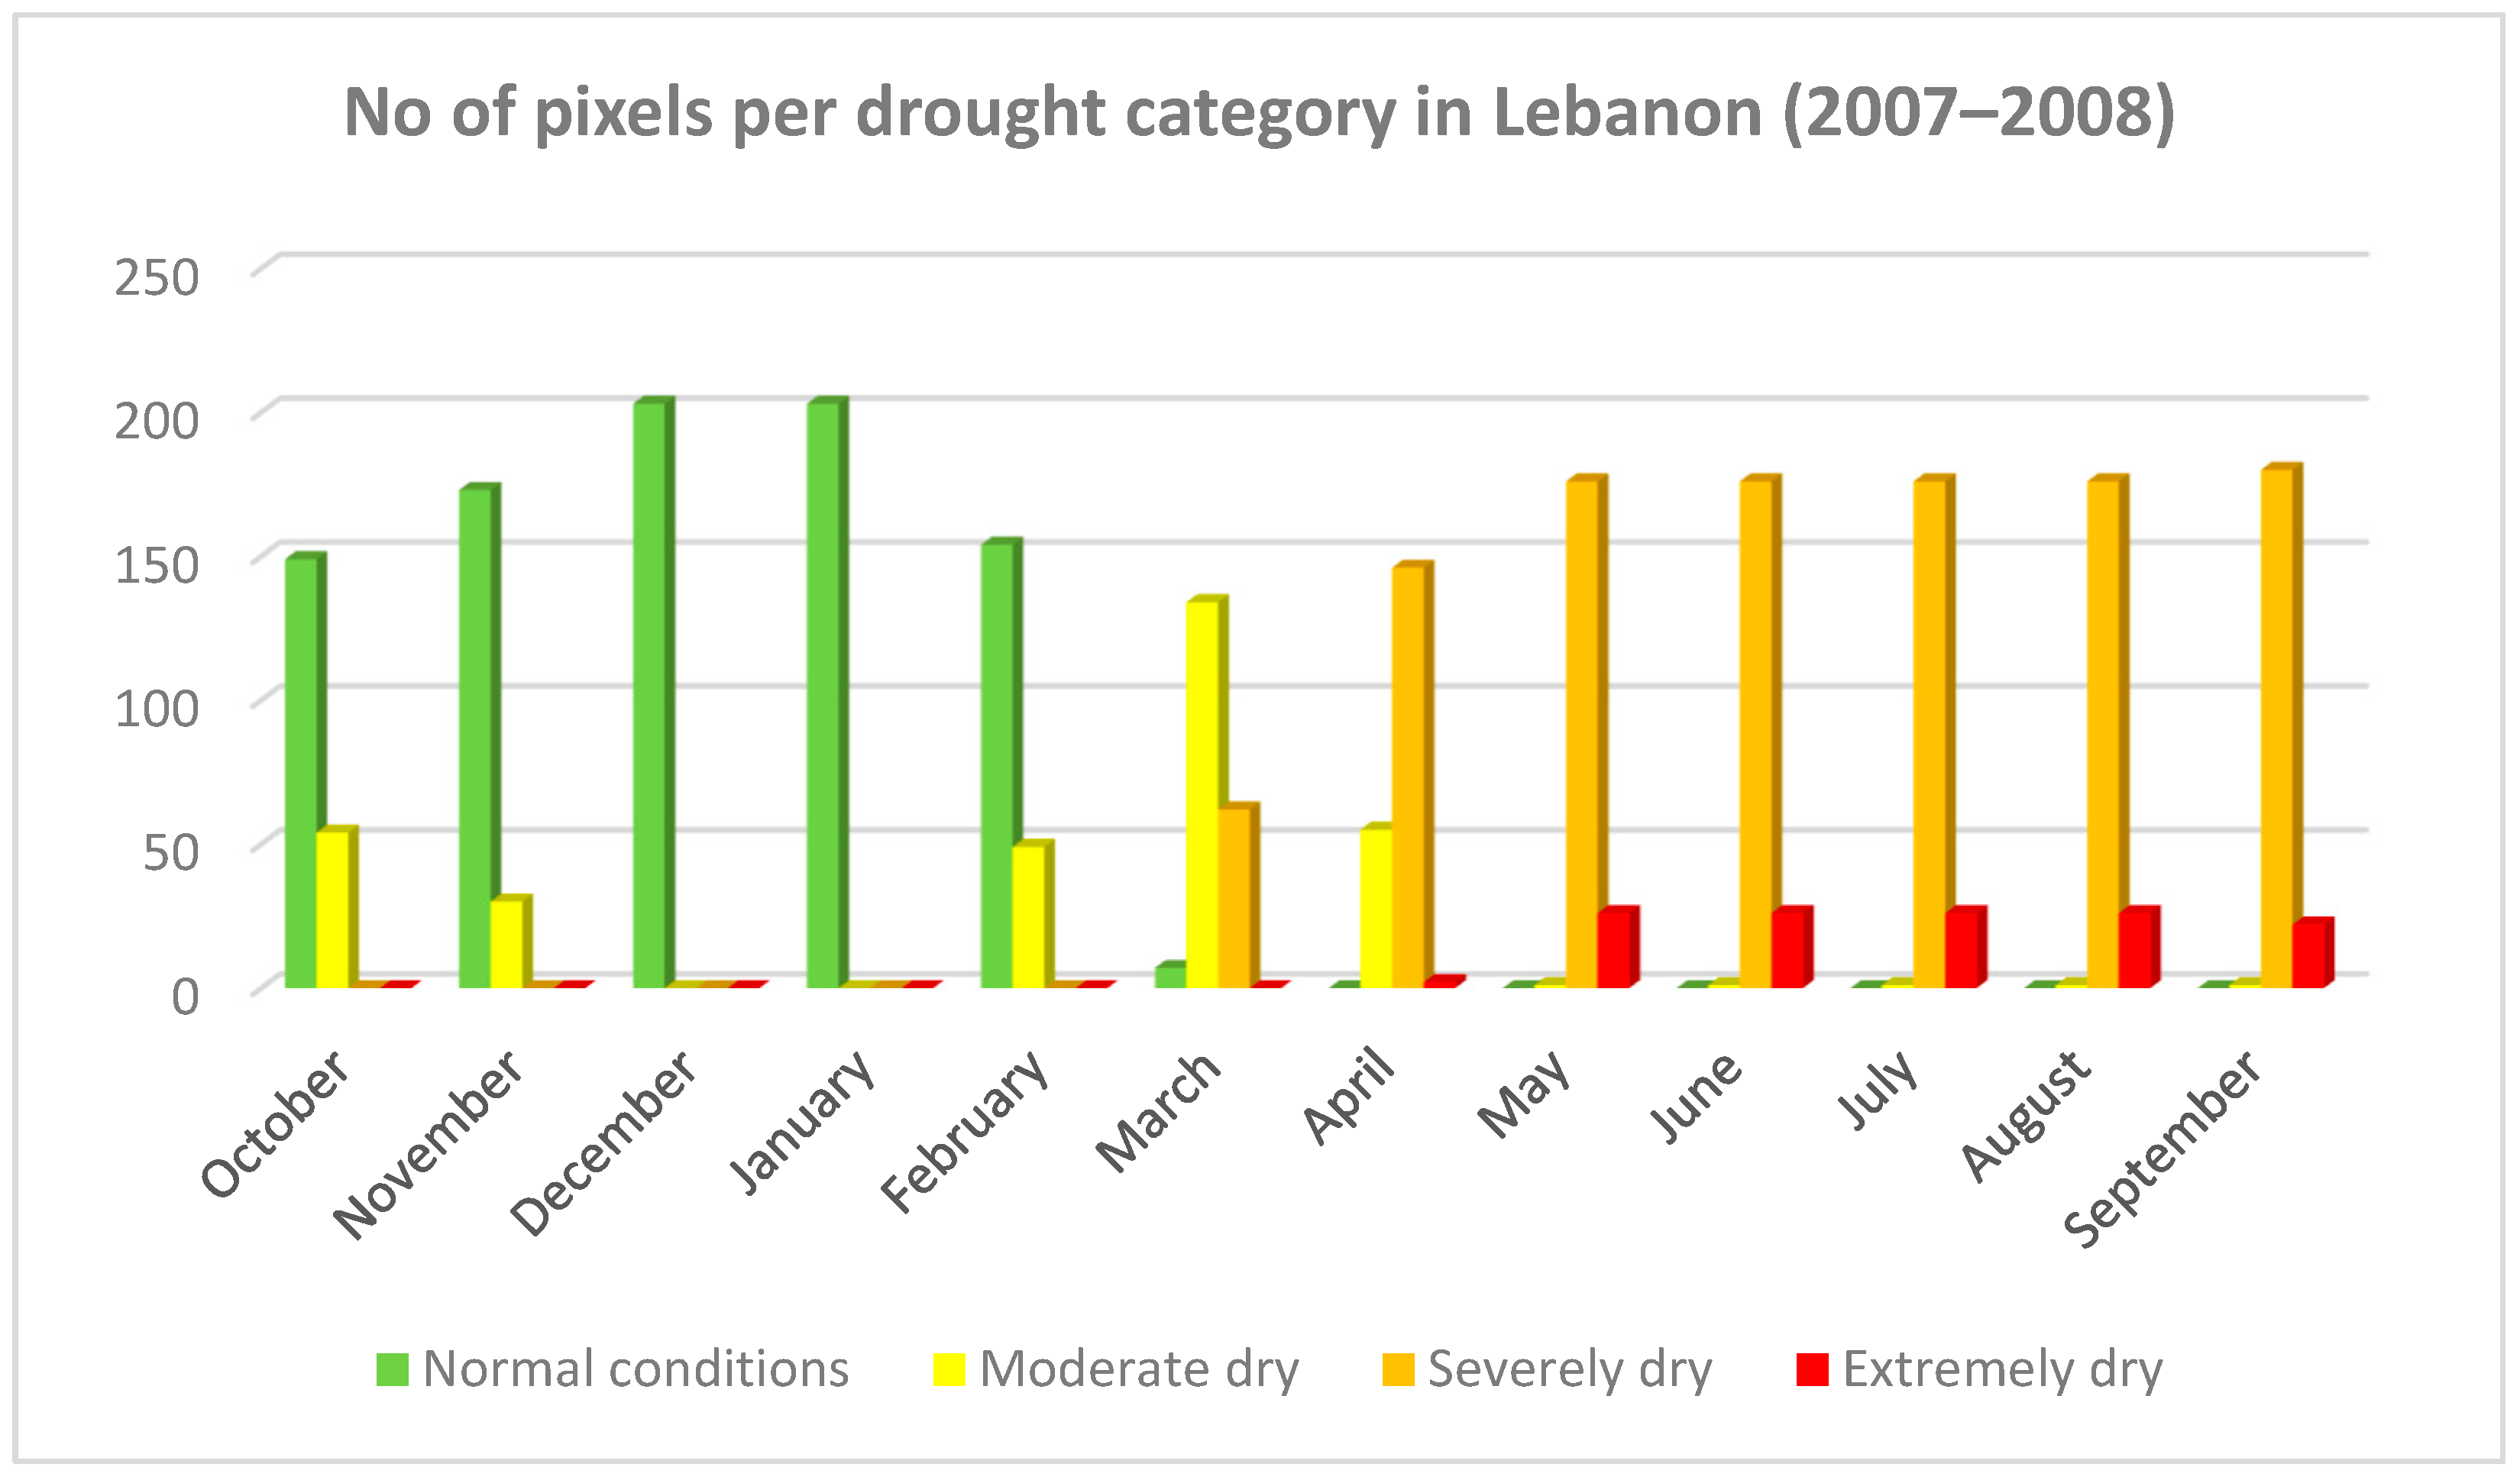
The second driest year in Beqaa valley is characterized by relatively mild drought conditions. Specifically, the months with the worst conditions seem to be from April to September facing severely dry conditions covering 72–89% of the entire study area, whereas approximately 13% of the total territory is characterized by extreme drought. All the remaining months (from October to February) face normal conditions with total coverage higher than 73% of the study region, except March which presents moderate drought conditions in 66% of Beqaa valley (Figure 21).
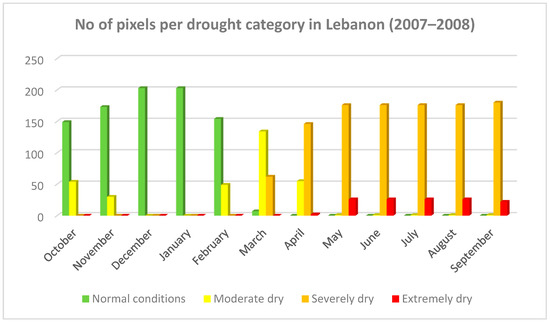
Figure 21.
Number of pixels per drought category in Beqaa Valley, Lebanon (hydrological year: 2007–2008).
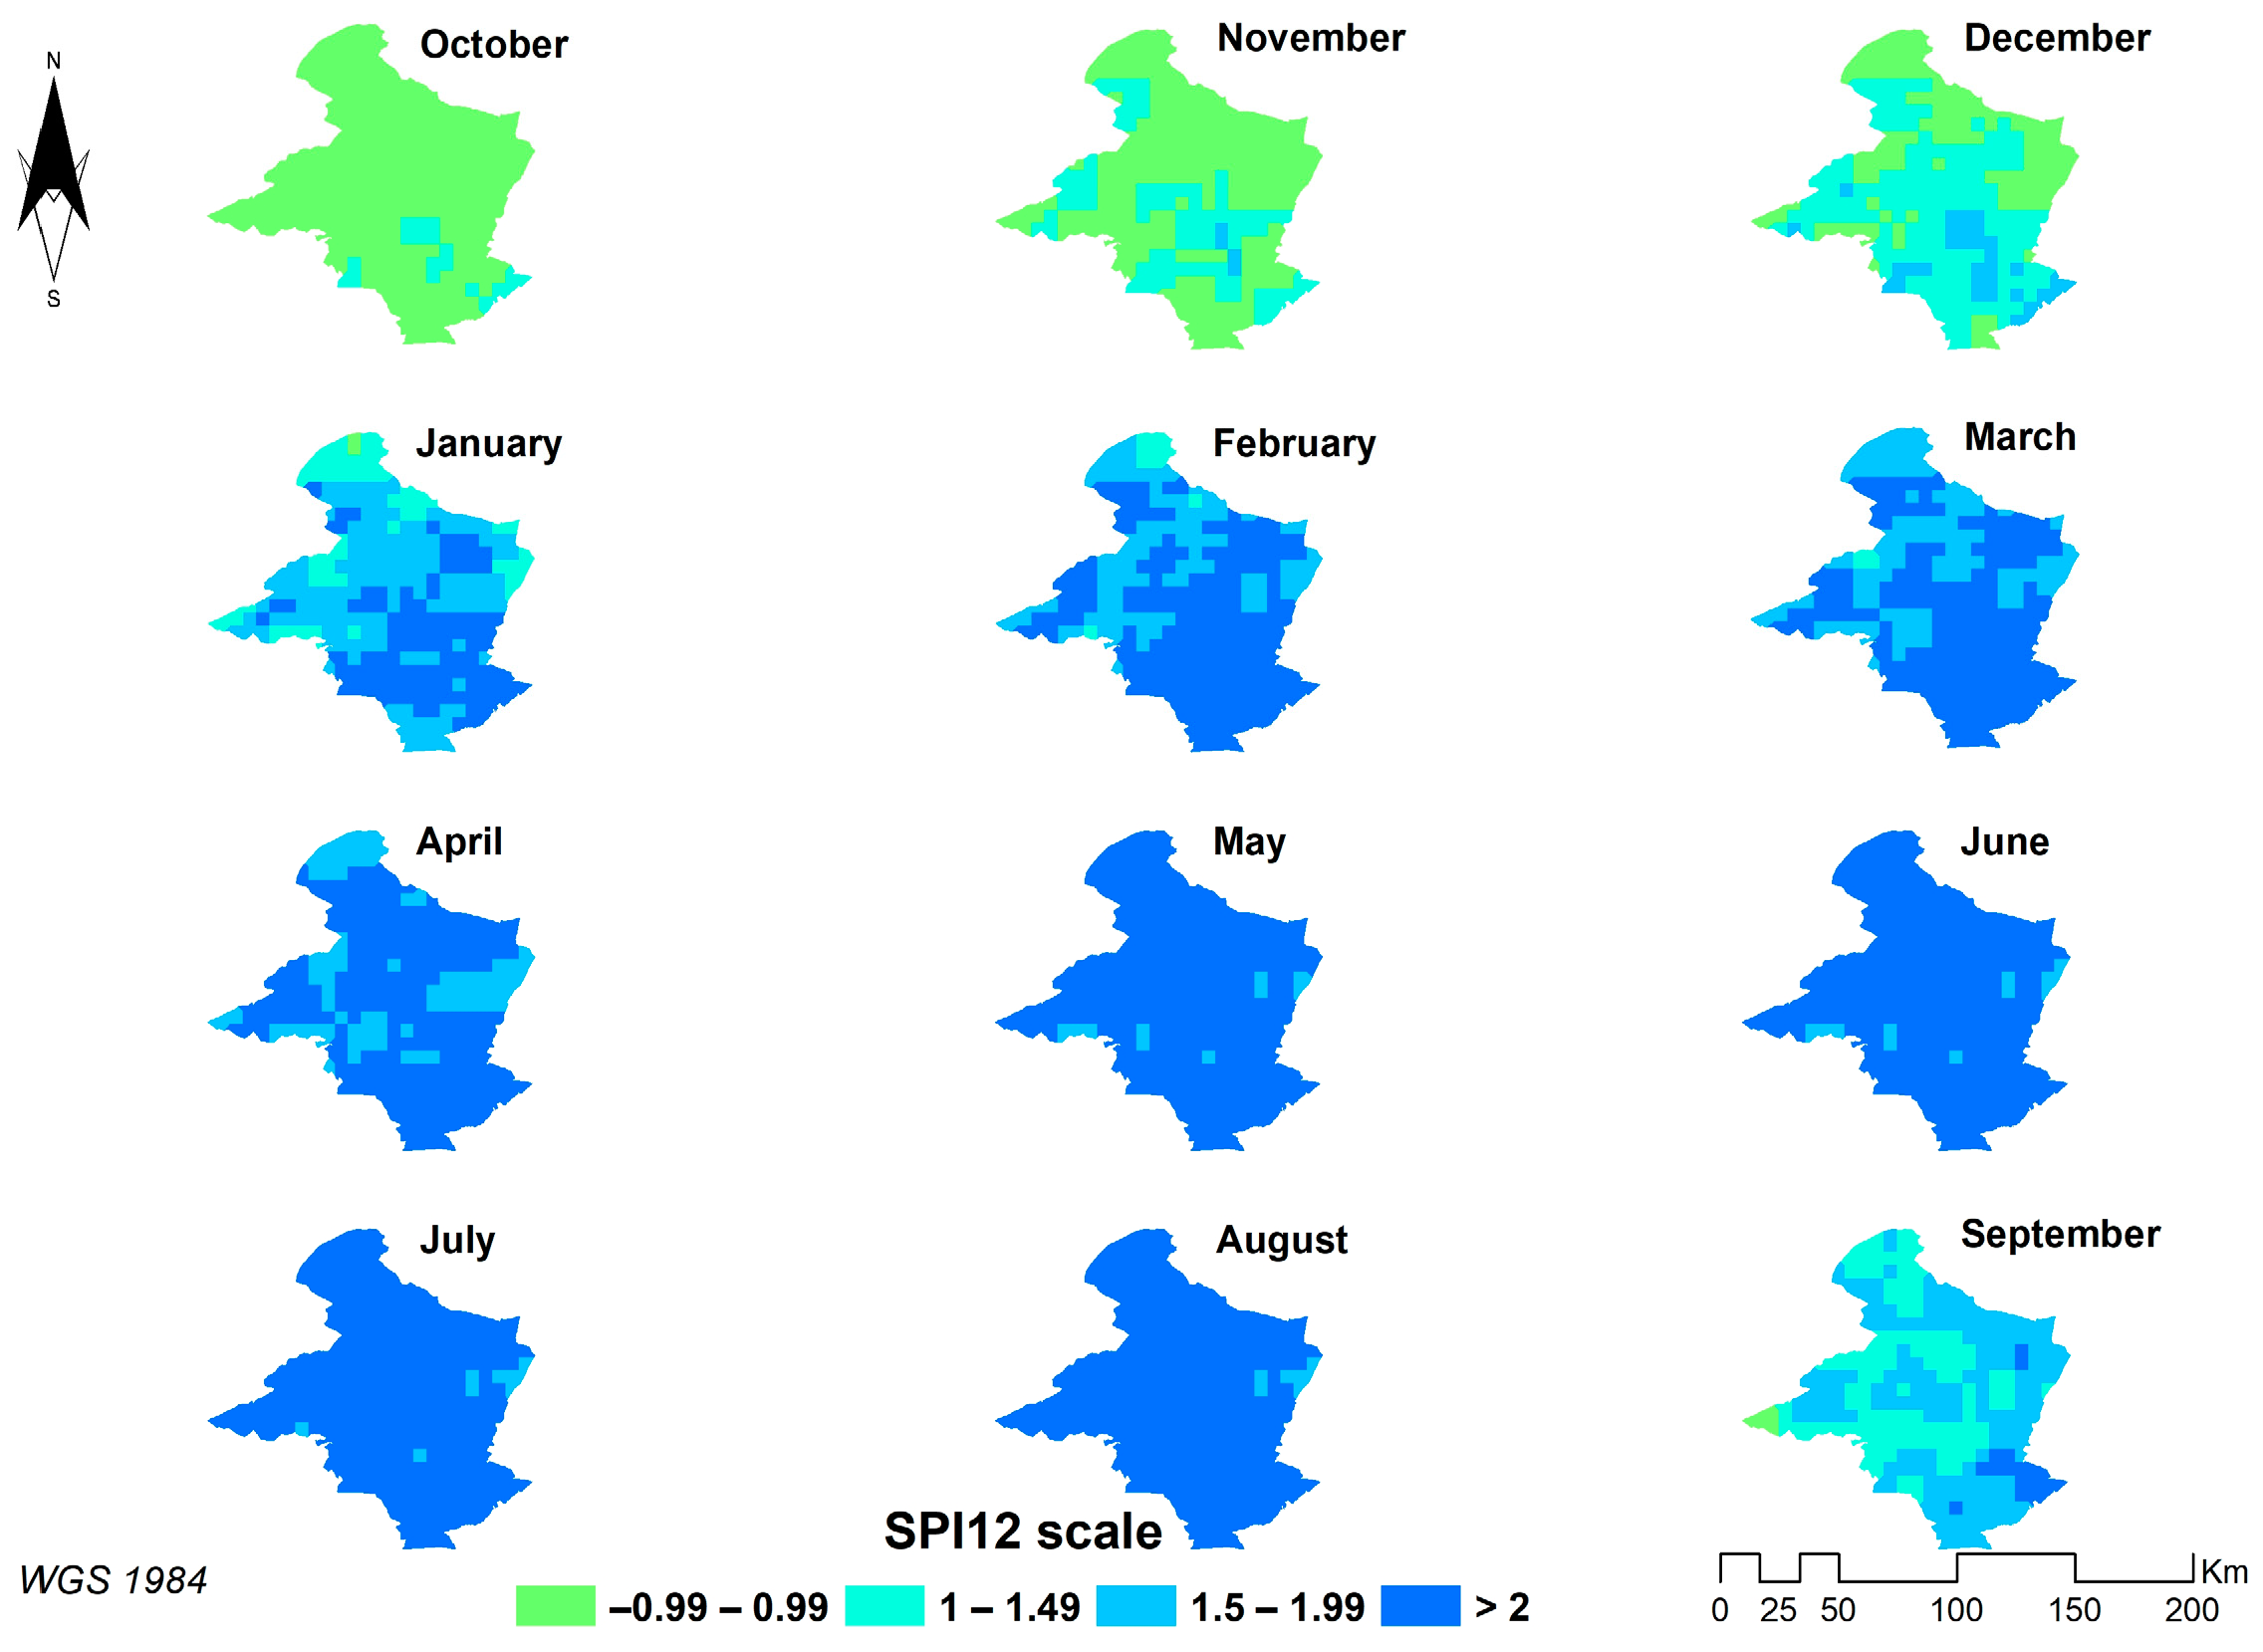
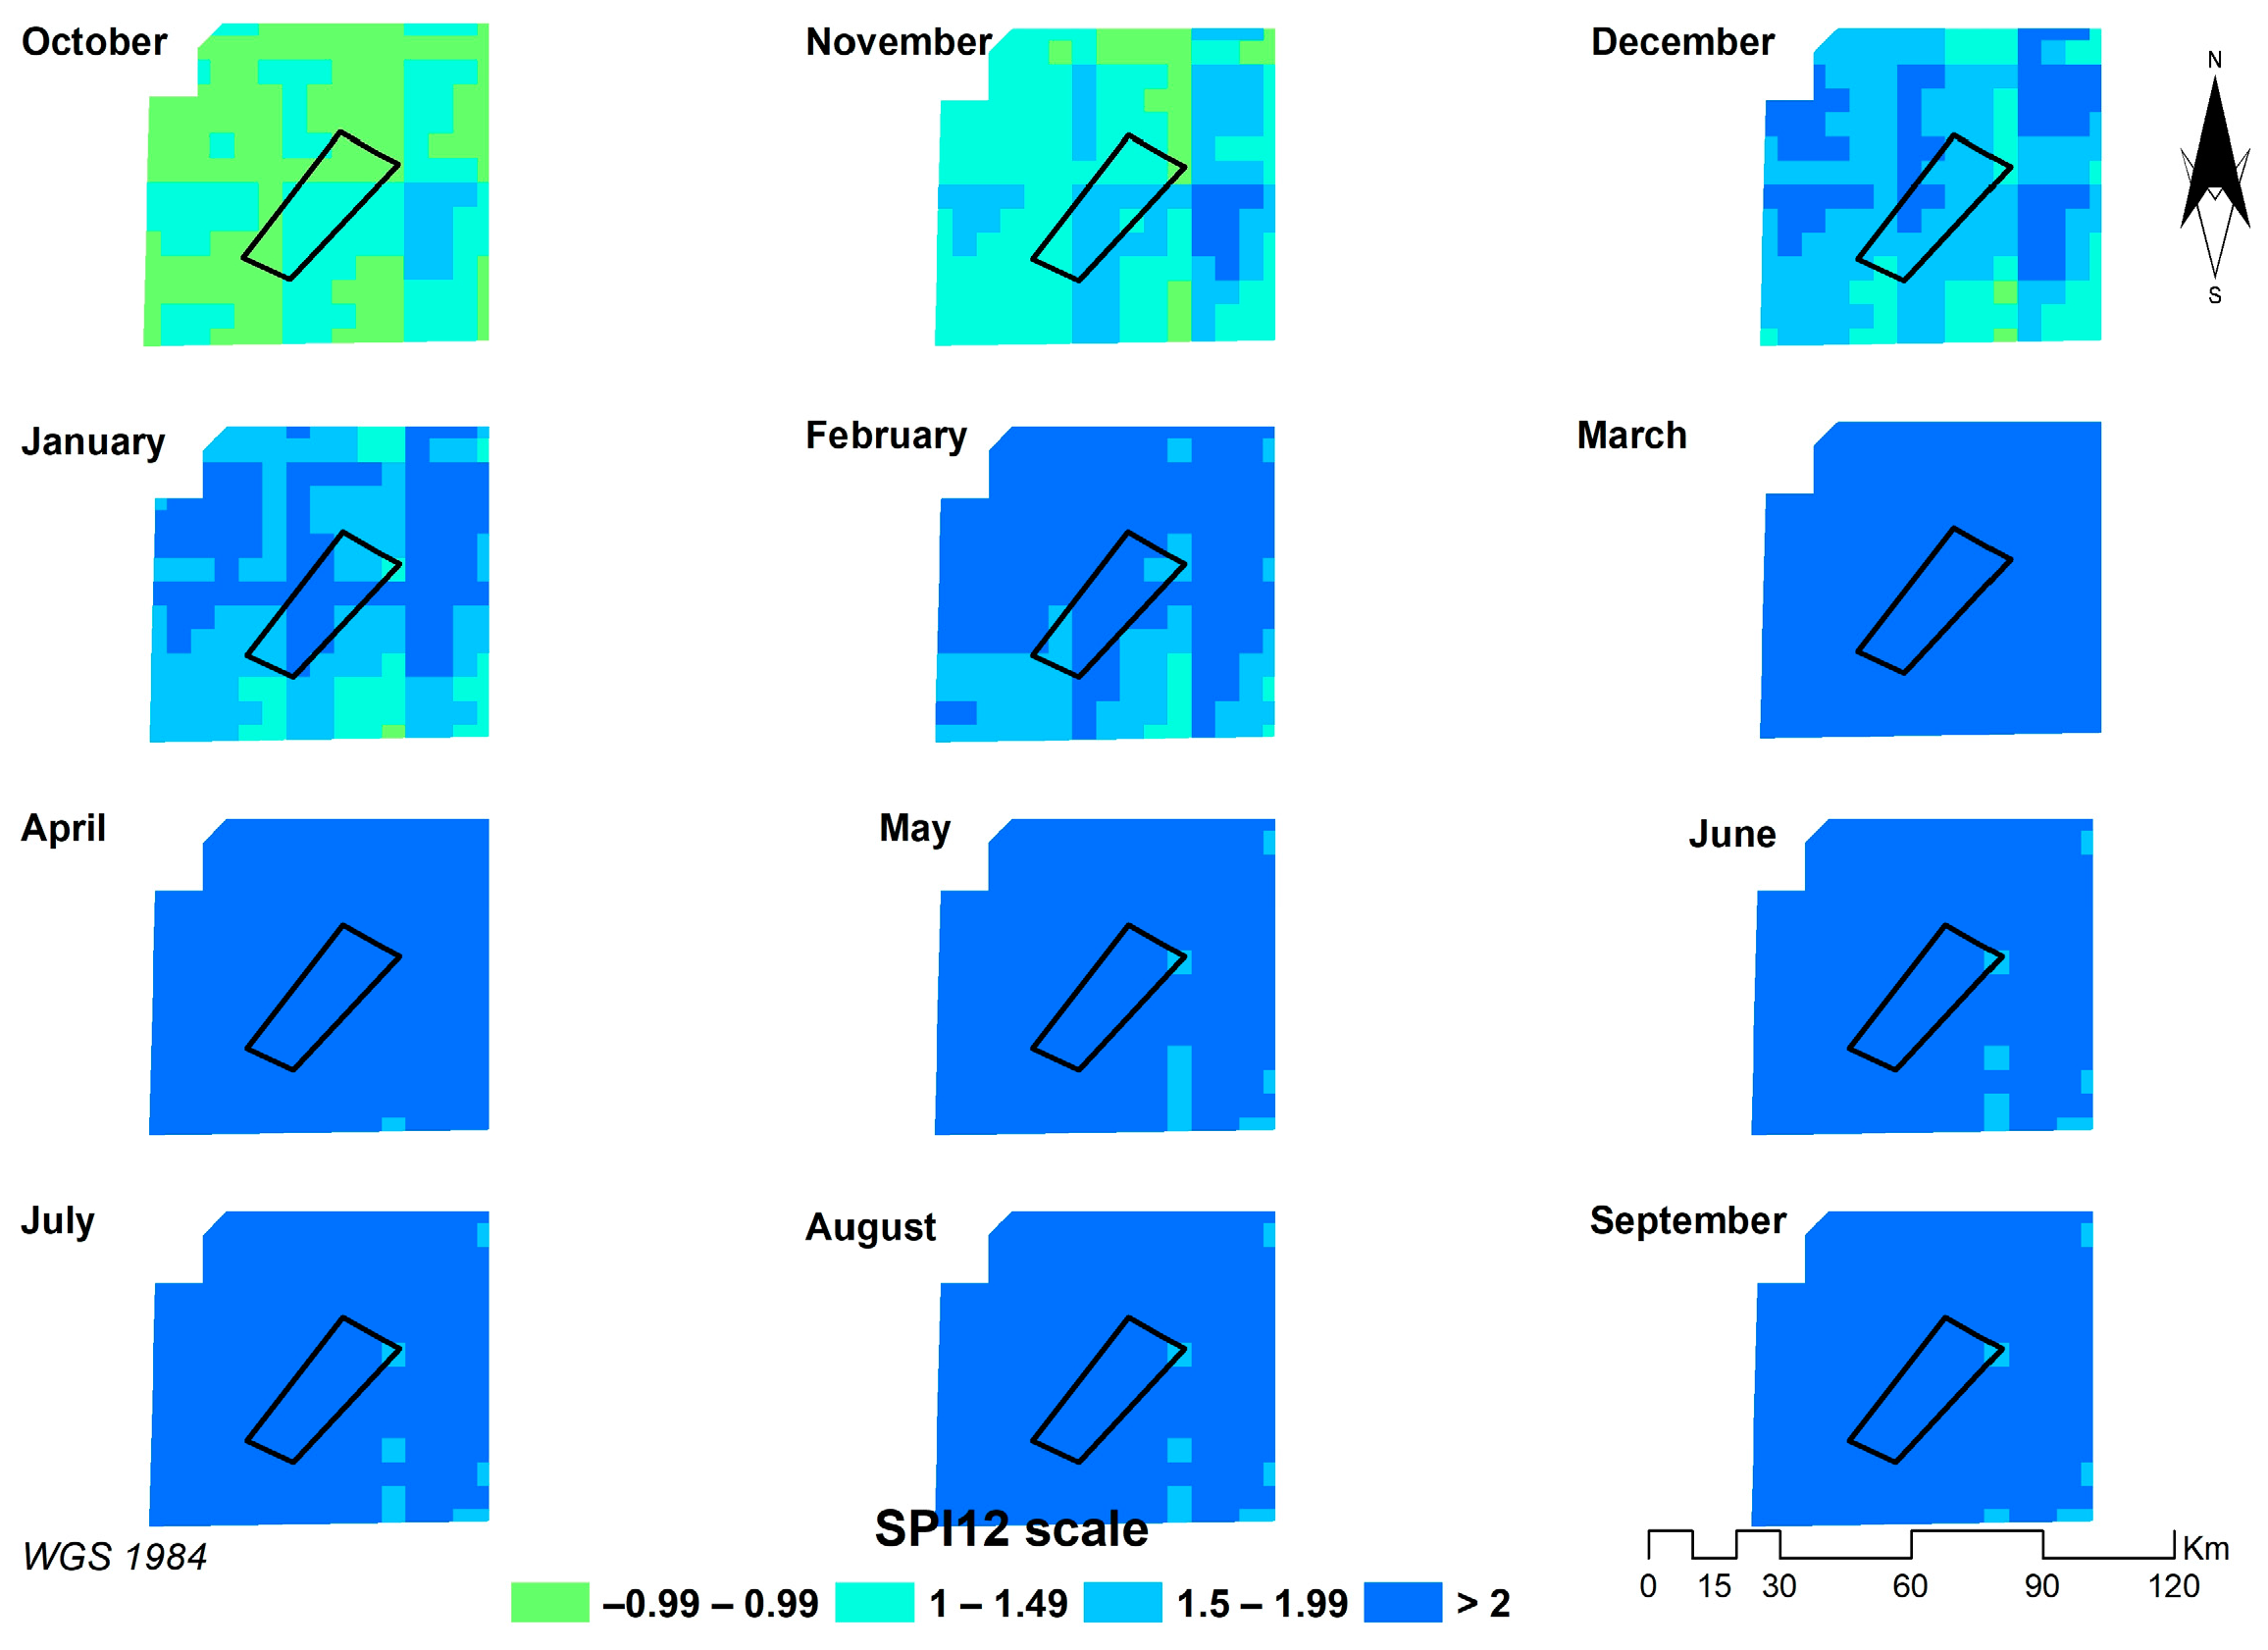
On the other side, the hydrological year 2018–2019 has been estimated as the wettest hydrological year throughout the study area for the entire time frame. The pilot study area is characterized by extremely wet conditions (SPI > 2) from February to September. Slightly less wet conditions are observed in the remaining months. Specifically, the study domain faces moderate (1 < SPI < 1.49) and extreme wet conditions in December and January, and primarily moderate wet conditions in October (including a few regions with normal conditions: −0.99 < SPI < 0.99) (Figure 22).

Figure 22.
Monthly SPI12 in Beqaa valley (hydrological year: 2018–2019).
Finally, the hydrological year of 2002–2003 constitutes the second wettest year in Beqaa valley. The variability of wetness conditions is too small. The conditions are normal for the pilot study area from October to January. The first half of the study area is characterized by moderately wet conditions and the second half faces extremely wet conditions from April to September. There are two exceptions. The study area faces extremely wet conditions in March and moderate wet conditions in February (Figure 23).
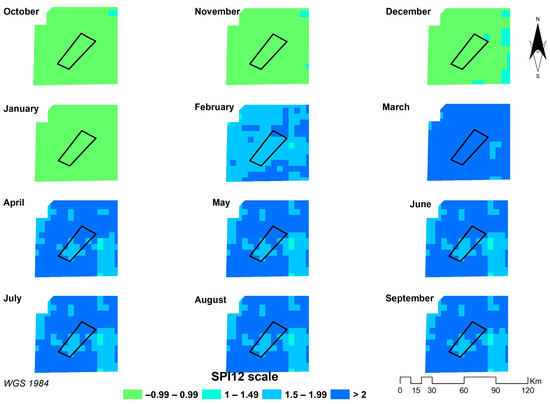
Figure 23.
Monthly SPI12 in Beqaa valley (hydrological year: 2002–2003).
3.4. Comparative Analysis among the Three Study Areas
In Eastern Mancha (Spain), it is observed that the driest hydrological year is 1994–1995 (SPI = −1.84), whereas the second driest year is 2015–2016 (SPI12 = −1.18). On the contrary, the wettest hydrological year is 1989–1990 (SPI12 = 1.99), whereas the second wettest year is 2010–2011 (SPI12 = 1.07). When it comes to Sidi Bouzid (Tunisia), it is observed that the driest hydrological year is 2000–2001 (SPI = −1.08), whereas the second driest year is 1994–1995 (SPI12= −1.05). On the other side, the wettest hydrological year is 1995–1996 (SPI12= 1.79), whereas the second wettest year is 1990–1991 (1.55). The results for the third study area, Beqaa Valley (Lebanon), indicate that the driest hydrological year is 1989–1990 (SPI12 = −1.39), whereas the second driest year is 2007–2008 (SPI12 = −1.28). On the contrary, the wettest hydrological year is 2018–2019 (SPI12 = 2.28), whereas the second wettest year is 2002–2003 (SPI12 = 1.58) (Table 2).
Table 2.
Comparative analysis of the two most extreme hydrological years in terms of drought severity/wetness.
Therefore, based on the two most representative extreme years, Eastern Mancha seems to face the most extreme drought among all the examined regions; however, the conditions range from moderate to very dry (not extreme drought). Beqaa Valley is characterized by moderate drought on the two most extreme years, whereas Sidi Bouzid faces normal or marginally moderate dry conditions. Conversely, Beqaa Valley faces the wettest conditions among all the study areas and is characterized by very wet and extremely wet conditions, followed by Sidi Bouzid which faces very wet conditions. Finally, Eastern Mancha has experienced moderate and very wet conditions on the two wettest hydrological years within the examined timeframe (Table 2).
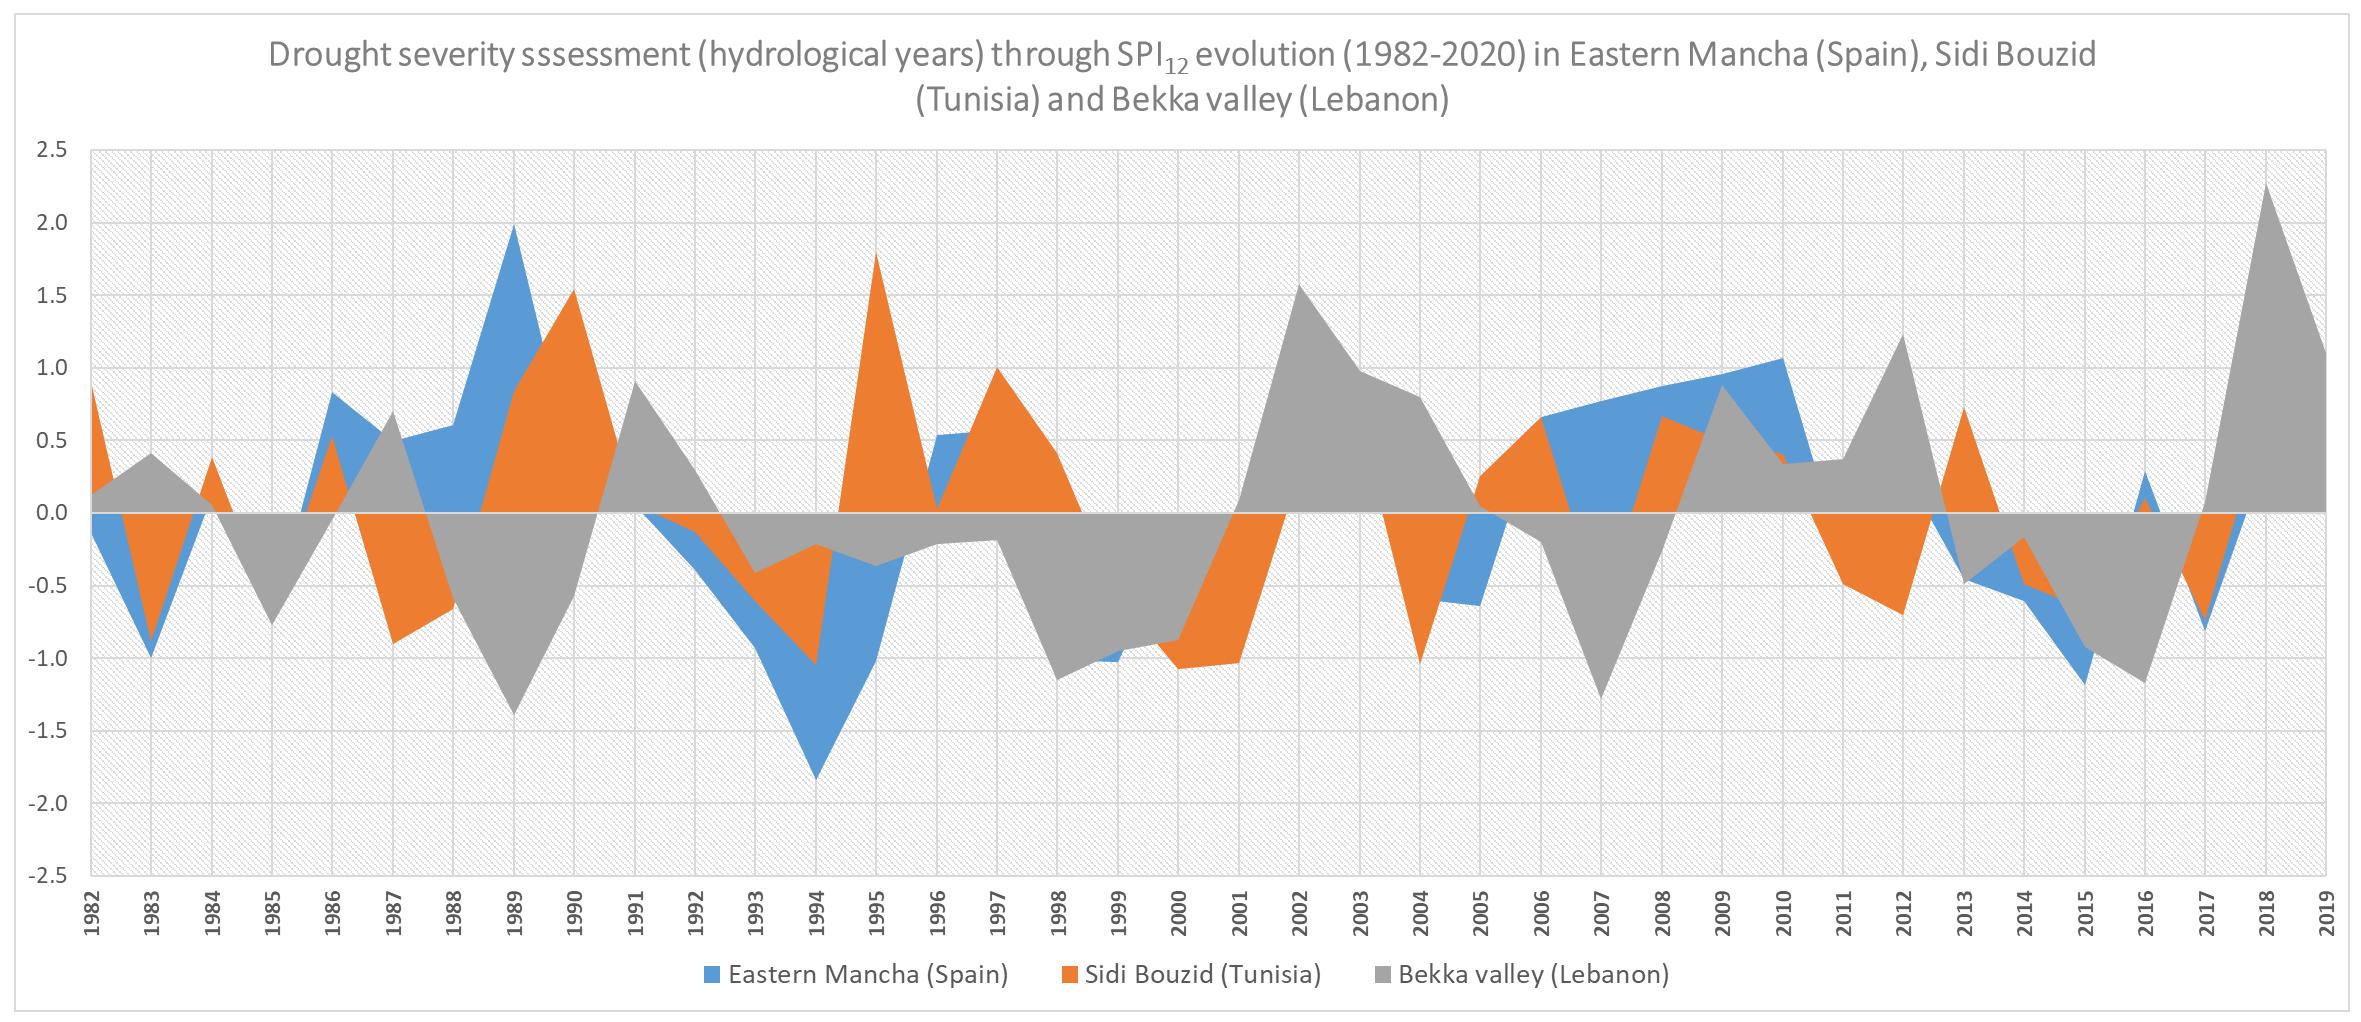
Based on Figure 24, it is observed that, beyond the expected fluctuations in drought and wetness conditions, Eastern Mancha and Sidi Bouzid seem to follow similar patterns as compared to Beqaa Valley. Specifically, the most obvious cases are manifested in 1988–1990, 1995–1998, 2001–2008 and 2017–2019, where the two first aforementioned regions show contradicting climatic conditions in relation to the third one (Beqaa Valley, Lebanon). Such conditions underline the importance of geographical dimension, since the areas in the western Mediterranean seem to have different enough climatic conditions and environmental extremes as compared to the eastern Mediterranean, at least during the last 40 hydrological years. Beyond the statistical assessment of SPI12, the mapping of extreme conditions in each of the study areas is considered of crucial importance. To this end, the average SPI12 values for two extremely dry and wet years were mapped, as depicted in the previous sections.
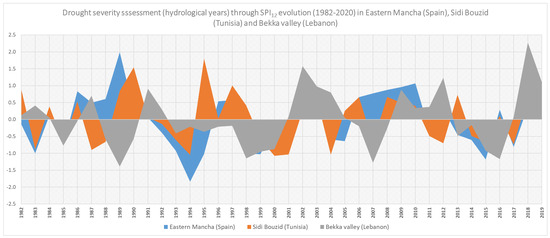
Figure 24.
Spatiotemporal analysis of drought severity in three Mediterranean countries from 1982 to 2020.
Table 3 presents the comparative analysis of frequency of drought/wetness episodes from 1982 to 2020. Some regions seem to manifest periodicity in extreme events and some others not. Specifically, Eastern Mancha faces drought episodes approximately every twenty years. In the same context, Beqaa Valley experiences drought events more frequently, almost every ten years, whereas Sidi Bouzid seems to face no periodicity and be characterized by randomness in drought events. Conversely, only Eastern Mancha experiences periodicity in wetness episodes (again almost every 20 years), while the two other regions are characterized by randomness in wet years.
Table 3.
Comparative analysis of frequency of drought/wetness episodes.
Table 4 presents the comparative analysis of areal extent of the two most extreme hydrological years in terms of drought/wetness. Most of the areas in Eastern Mancha faced severe and extreme drought (78%) in the driest year, while most of the same territory experienced moderate and severe drought (69%) in the second driest year. In the same context, most of the areas in Sidi Bouzid faced moderate and severe drought (52%) in the driest year, while most of the same territory experienced moderate (47%) and a few regions faced severe drought (10%) in the second driest year. Last, most of the areas in Beqaa Valley faced severe drought (45%) in the driest year, while most of the same territory experienced moderate (50%) and many regions faced severe drought (29%) in the second driest year. Conversely, wetness episodes (i.e., very and extremely wet conditions) have affected the most regions in the Lebanese study domain (66–83%), followed by the Tunisian (49–73%) and Spanish one (21–73%).
Table 4.
Comparative analysis of areal extent of the two most extreme hydrological years in terms of drought/wetness (annual average values).
Table 5 presents the comparative analysis of drought/wetness duration in the two most extreme hydrological years. It is observed that Eastern Mancha (Spain) and Beqaa Valley (Lebanon) face long-term drought covering the entire year in the driest year. Sidi Bouzid (Tunisia) seems to face fewer months of drought conditions, namely, ¾ of the entire year. In the second driest year, almost the same timeframe applies for all areas (7–9 months of drought conditions). When wet conditions prevail, almost the entire year is characterized wet for all the three study areas (10–11 months). For the second wettest year, only Eastern Mancha (Spain) is wet for less than 6 months, whereas wet conditions for more than 6 months prevail in the remaining study areas (7–8 months).
Table 5.
Comparative analysis of the two most extreme hydrological years in terms of drought severity/wetness.
Consequently, the outputs can be a valuable tool for more spatially targeted measures (where needed) to avoid extreme drought conditions with profound implications on crop viability.
4. Discussion
This paper explored the spatiotemporal variability of environmental extremes, in terms of drought and wetness, in three susceptible agroecosystems in the Mediterranean basis. The added value of the paper is not limited to the temporal (through time-series analysis) and spatial (through the annual and interannual mapping of different drought categories) variability, but it also considers the comparative assessment of drought conditions in the countries which are in the western, south and eastern part of the Mediterranean.
The adopted methodological framework is in line with previous research, where authors either used CHIRPS data, which are a conjunction of remotely sensed and weather stations’ data [31,65], or conventional data from land meteorological stations [66,67,68,69]. Similarly, [70] proceeded to conduct an integrated drought analysis in the Mediterranean including a trend seasonal analysis. The current research has been expanded using more recent data (up until 2020) for the temporal evolution of SPI in three different Mediterranean regions and proceeded to conduct annual and interannual geospatial analysis (including all months) of the two most extreme hydrological years in terms of drought/wetness. This choice is justified because the usage of just the average values obscures the most extreme conditions in terms of drought and wetness and specifically the regions which were affected the most.
Based on the research outcomes, it is noticed that the meteorological cycles (the periodic occurrence of drought/wetness) have great resemblance for the study areas in Spain and Tunisia, whereas the study area in Lebanon seems to present a contradicting trend compared to the previous regions (at least for most of the years of the examined timeframe). In addition, the drought intensity seems to primarily affect the Spanish region, followed by the Lebanese and the Tunisian one. This is obvious in both statistical (temporal evolution of SPI) and geospatial analysis (annual and intra-annual mapping of SPI in the two extreme hydrological years in terms of drought). Drought conditions affect more regions in Eastern Mancha (Spain), followed by Beqaa Valley (Lebanon), while Sidi Bouzid (Tunisia) is affected the least. When wet conditions prevail, the most regions are characterized by wet conditions in Beqaa Valley (Lebanon), followed by Sidi Bouzid (Tunisia) and Eastern Mancha (Spain). Finally, drought seems to last more in Eastern Mancha (Spain) and Beqaa Valley (Lebanon) and less in Sidi Bouzid (Tunisia). In the wettest hydrological years, wet conditions seem to last the same for all areas (almost 10–11 months), but there might be wet periods where wet conditions last less than 6 months (i.e., in Eastern Mancha, Spain), whereas wet conditions are extended more than 6 months in the other two study areas.
A feature of the current research effort lies in the fact that even though the SPI is considered a reliable drought assessment index, it is exclusively based on precipitation data. Temperature is one more critical variable, which may affect drought conditions through evapotranspiration intensity. However, the SPI is quite valuable in regions where temperature data do not exist [71]. In the same context, the validity of the SPI has been confirmed by similar studies, where R2 approaches sufficient levels of validity between the SPI coming from CHIRPS data and the SPI calculated from land meteorological stations [31]. A future perspective includes the projection of drought analysis, predicting the precipitation levels through Weather Research Forecast (WRF). This type of analysis would allow decision makers to be effective in rational water management, especially in the most affected regions. In this context, [72] estimated the SPI6 and Evaporative Demand Drought Index (EDDI6) under differentiated climate change scenarios (RCP 4.5 and RCP 8.5).
As a result, the spatiotemporal drought assessment may contribute to the implementation of targeted measures against drought in regions, where there is a major need. The research outcomes can be used to better recognize the frequency and severity of drought and wetness episodes, which is crucial for agriculture and other industries that may be affected by climatic variability, as well as for the sensible management and planning of water resources [31]. To this end, an assessment of investments in smart irrigations systems should be considered, equipped with sophisticated communications technology, that would save water resources and limit the leaks [73]. In the same context, farmers can take advantage of decision support systems that exploit the Internet of Things (IOT) integrating wireless sensors that continuously record the microclimatic environment and let the farmer know when water shortage may drastically affect crop productivity [74].
5. Conclusions
The simultaneous spatial and temporal drought assessment constitutes a valuable tool for drought mitigation. In detail, the temporal dimension can reveal both any potential meteorological cycles (i.e., periodic manifestation of drought episodes) and the degree of drought intensity. The spatial dimension comes to specify which regions exactly suffer or may suffer the most by similar drought events. This paper explored the assessment of environmental extremes (drought/wetness) in three study areas in the Mediterranean basin through the estimation of SPI12 focusing on the hydrological drought. The results highlighted that the regions belonging to Spain and Tunisia (western Mediterranean) tend to present similar patterns in the examined timeframe (1981–2020), whereas the study domain in Lebanon tends to have a contradicting trend compared to the previous regions. Comparing the two most extreme hydrological years, the Spanish regions faced the highest drought intensity, areal extent and duration, followed by the Lebanese and the Tunisian one. Concerning the wettest hydrological years, the Lebanese region has recorded the highest SPI12 values, areal extent and duration, followed by the Tunisian and Spanish one. The periodicity of drought/wetness episodes is about 20 years in the Spanish area and 10 years in the Lebanese area (for drought events), whereas there seems to be no periodicity in Tunisian one. The spatial distribution of drought inevitably varies; however, that is the key for targeted counterbalancing measures to the areas with the highest risk. Consequently, horizontal measures to the entire regions can be avoided, saving valuable financial and environmental resources. Future projections of the drought assessment based on historical data constitutes the next necessary step for actual drought mitigation exploiting the best available technology that would ensure socioeconomic and ecological benefits to any given region.
Author Contributions
Conceptualization, S.S., N.A., N.R.D. and I.F.; methodology, S.S., N.A. and I.F.; software, S.S., N.A. and G.A.T.; validation, M.S., N.A., S.S. and P.S.; formal analysis, P.S.; investigation, A.D., H.M.L., F.M., R.L.-U., F.K., H.A. and R.N.; resources, A.D., H.M.L., F.M., R.L.-U., F.K., H.A. and R.N.; data curation, N.A., I.F. and G.A.T.; writing—original draft preparation, M.S. and S.S.; writing—review and editing, S.S., N.R.D. and M.S.; visualization, N.R.D. and N.D.; supervision, N.R.D., N.D., A.D., S.S., H.M.L. and F.M.; project administration, S.S. and N.R.D.; funding acquisition, N.R.D. and N.D. All authors have read and agreed to the published version of the manuscript.
Funding
This research was funded by the SUPROMED project, Call 2018, under the PRIMA program of the European Commission. Grant Agreement No 1813.
Data Availability Statement
The data presented in this study are available on request from the corresponding author. The data are not publicly available due to privacy restrictions.
Acknowledgments
The authors acknowledge the Climate Hazards Center and USGS Climate for the provided data.
Conflicts of Interest
The authors declare no conflicts of interest.
References
- Dalezios, N.R.; Dunkel, Z.; Eslamian, S. Meteorological Drought Indices: Definitions. In Handbook of Drought and Water Scarcity; CRC Press: Boca Raton, FL, USA, 2017; pp. 27–44. [Google Scholar] [CrossRef]
- Naumann, G.; Alfieri, L.; Wyser, K.; Mentaschi, L.; Betts, R.A.; Carrao, H.; Spinoni, J.; Vogt, J.; Feyen, L. Global Changes in Drought Conditions Under Different Levels of Warming. Geophys. Res. Lett. 2018, 45, 3285–3296. [Google Scholar] [CrossRef]
- Dai, A. Increasing Drought under Global Warming in Observations and Models. Nat. Clim. Chang. 2013, 3, 171. [Google Scholar] [CrossRef]
- Wilhite, D.A.; Sivakumar, M.V.K.; Pulwarty, R. Managing Drought Risk in a Changing Climate: The Role of National Drought Policy. Weather Clim. Extrem. 2014, 3, 4–13. [Google Scholar] [CrossRef]
- Spinoni, J.; Barbosa, P.; De Jager, A.; McCormick, N.; Naumann, G.; Vogt, J.V.; Magni, D.; Masante, D.; Mazzeschi, M. A New Global Database of Meteorological Drought Events from 1951 to 2016. J. Hydrol. Reg. Stud. 2019, 22, 100593. [Google Scholar] [CrossRef]
- Trnka, M.; Hlavinka, P.; Možný, M.; Semerádová, D.; Štěpánek, P.; Balek, J.; Bartošová, L.; Zahradníček, P.; Bláhová, M.; Skalák, P.; et al. Czech Drought Monitor System for Monitoring and Forecasting Agricultural Drought and Drought Impacts. Int. J. Climatol. 2020, 40, 5941–5958. [Google Scholar] [CrossRef]
- Van Loon, A.F. Hydrological Drought Explained. Wiley Interdiscip. Rev. Water 2015, 2, 359–392. [Google Scholar] [CrossRef]
- Shi, H.; Chen, J.; Wang, K.; Niu, J. A New Method and a New Index for Identifying Socioeconomic Drought Events under Climate Change: A Case Study of the East River Basin in China. Sci. Total Environ. 2018, 616–617, 363–375. [Google Scholar] [CrossRef]
- Al-Kaisi, M.M.; Elmore, R.W.; Guzman, J.G.; Hanna, H.M.; Hart, C.E.; Helmers, M.J.; Hodgson, E.W.; Lenssen, A.W.; Mallarino, A.P.; Robertson, A.E.; et al. Drought Impact on Crop Production and the Soil Environment: 2012 Experiences from Iowa. J. Soil. Water Conserv. 2013, 68, 19A–24A. [Google Scholar] [CrossRef]
- Parente, J.; Amraoui, M.; Menezes, I.; Pereira, M.G. Drought in Portugal: Current Regime, Comparison of Indices and Impacts on Extreme Wildfires. Sci. Total Environ. 2019, 685, 150–173. [Google Scholar] [CrossRef]
- Sakellariou, S.; Sfougaris, A.; Christopoulou, O.; Tampekis, S. Integrated Wildfire Risk Assessment of Natural and Anthropogenic Ecosystems Based on Simulation Modeling and Remotely Sensed Data Fusion. Int. J. Disaster Risk Reduct. 2022, 78, 103129. [Google Scholar] [CrossRef]
- Sakellariou, S.; Samara, F.; Tampekis, S.; Christopoulou, O.; Sfougaris, A. Optimal Number and Location of Watchtowers for Immediate Detection of Forest Fires in a Small Island. Int. J. Agric. Environ. Inf. Syst. 2017, 8, 1–19. [Google Scholar] [CrossRef]
- Tampekis, S.; Sakellariou, S.; Palaiologou, P.; Arabatzis, G.; Kantartzis, A.; Malesios, C.; Stergiadou, A.; Fafalis, D.; Tsiaras, E. Building Wildland–Urban Interface Zone Resilience through Performance-Based Wildfire Engineering. A Holistic Theoretical Framework. Euro-Mediterr. J. Environ. Integr. 2023, 8, 675–689. [Google Scholar] [CrossRef]
- Mishra, A.K.; Singh, V.P. A Review of Drought Concepts. J. Hydrol. 2010, 391, 202–216. [Google Scholar] [CrossRef]
- Mukherjee, S.; Mishra, A.; Trenberth, K.E. Climate Change and Drought: A Perspective on Drought Indices. Curr. Clim. Chang. Rep. 2018, 4, 145–163. [Google Scholar] [CrossRef]
- Sidiropoulos, P.; Dalezios, N.R.; Loukas, A.; Mylopoulos, N.; Spiliotopoulos, M.; Faraslis, I.N.; Alpanakis, N.; Sakellariou, S. Quantitative Classification of Desertification Severity for Degraded Aquifer Based on Remotely Sensed Drought Assessment. Hydrology 2021, 8, 47. [Google Scholar] [CrossRef]
- Zargar, A.; Sadiq, R.; Naser, B.; Khan, F.I. A Review of Drought Indices. Environ. Rev. 2011, 19, 333–349. [Google Scholar] [CrossRef]
- Thenkabail, P.S.; Gamage, M.S.D.N.; Smakhtin, V.U. The Use of Remote Sensing Data for Drought Assessment and Monitoring in Southwest Asia; IWMI: Anand, India, 2004. [Google Scholar]
- Reading the Sendai Framework for Disaster Risk Reduction 2015–2030|UNDRR. Available online: https://www.undrr.org/publication/reading-sendai-framework-disaster-risk-reduction-2015-2030 (accessed on 25 April 2024).
- Dalezios, N.R. Drought and Remote Sensing: An Overview. In Remote Sensing of Hydrometeorological Hazards; CRC Press: Boca Raton, FL, USA, 2017; pp. 3–31. [Google Scholar] [CrossRef]
- Dalezios, N.R.; Dercas, N.; Eslamian, S. Water Scarcity Management: Part 2: Satellite-Based Composite Drought Analysis. Int. J. Glob. Environ. Issues 2018, 17, 262–295. [Google Scholar] [CrossRef]
- Nastos, P.T.; Dalezios, N.R.; Faraslis, I.N.; Mitrakopoulos, K.; Blanta, A.; Spiliotopoulos, M.; Sakellariou, S.; Sidiropoulos, P.; Tarquis, A.M. Risk Management Framework of Environmental Hazards and Extremes in Mediterranean Ecosystems. Nat. Hazards Earth Syst. Sci. 2021, 21, 1935–1954. [Google Scholar] [CrossRef]
- Barthelemy, S.; Bonan, B.; Calvet, J.C.; Grandjean, G.; Moncoulon, D.; Kapsambelis, D.; Bernardie, S. A New Approach for Drought Index Adjustment to Clay-Shrinkage-Induced Subsidence over France: Advantages of the Interactive Leaf Area Index. Nat. Hazards Earth Syst. Sci. 2024, 24, 999–1016. [Google Scholar] [CrossRef]
- Li, P.; Jia, L.; Lu, J.; Jiang, M.; Zheng, C. A New Evapotranspiration-Based Drought Index for Flash Drought Identification and Monitoring. Remote Sens. 2024, 16, 780. [Google Scholar] [CrossRef]
- Li, Y.; Chen, Y.; Chen, Y.; Duan, W.; Wang, J.; Wang, X. Characteristics of Dry and Wet Changes and Future Trends in the Tarim River Basin Based on the Standardized Precipitation Evapotranspiration Index. Water 2024, 16, 880. [Google Scholar] [CrossRef]
- Pei, W.; Hao, L.; Fu, Q.; Ren, Y.; Li, T. The Standardized Precipitation Evapotranspiration Index Based on Cumulative Effect Attenuation. J. Hydrol. 2024, 635, 131148. [Google Scholar] [CrossRef]
- Shayeghi, A.; Ziveh, A.R.; Bakhtar, A.; Teymoori, J.; Hanel, M.; Vargas Godoy, M.R.; Markonis, Y.; AghaKouchak, A. Assessing Drought Impacts on Groundwater and Agriculture in Iran Using High-Resolution Precipitation and Evapotranspiration Products. J. Hydrol. 2024, 631, 130828. [Google Scholar] [CrossRef]
- Yang, Y.; Dai, E.; Yin, J.; Jia, L.; Zhang, P.; Sun, J. Spatial and Temporal Evolution Patterns of Droughts in China over the Past 61 Years Based on the Standardized Precipitation Evapotranspiration Index. Water 2024, 16, 1012. [Google Scholar] [CrossRef]
- Greve, P.; Roderick, M.L.; Ukkola, A.M.; Wada, Y. The Aridity Index under Global Warming. Environ. Res. Lett. 2019, 14, 124006. [Google Scholar] [CrossRef]
- Du, J.; Fang, J.; Xu, W.; Shi, P. Analysis of Dry/Wet Conditions Using the Standardized Precipitation Index and Its Potential Usefulness for Drought/Flood Monitoring in Hunan Province, China. Stoch. Environ. Res. Risk Assess. 2013, 27, 377–387. [Google Scholar] [CrossRef]
- Sakellariou, S.; Spiliotopoulos, M.; Alpanakis, N.; Faraslis, I.; Sidiropoulos, P.; Tziatzios, G.A.; Karoutsos, G.; Dalezios, N.R.; Dercas, N. Spatiotemporal Drought Assessment Based on Gridded Standardized Precipitation Index (SPI) in Vulnerable Agroecosystems. Sustainability 2024, 16, 1240. [Google Scholar] [CrossRef]
- Yang, P.; Xia, J.; Zhang, Y.; Zhan, C.; Qiao, Y. Comprehensive Assessment of Drought Risk in the Arid Region of Northwest China Based on the Global Palmer Drought Severity Index Gridded Data. Sci. Total Environ. 2018, 627, 951–962. [Google Scholar] [CrossRef]
- Vangelis, H.; Tigkas, D.; Tsakiris, G. The Effect of PET Method on Reconnaissance Drought Index (RDI) Calculation. J. Arid. Environ. 2013, 88, 130–140. [Google Scholar] [CrossRef]
- Vicente-Serrano, S.M.; Quiring, S.M.; Peña-Gallardo, M.; Yuan, S.; Domínguez-Castro, F. A Review of Environmental Droughts: Increased Risk under Global Warming? Earth Sci. Rev. 2020, 201, 102953. [Google Scholar] [CrossRef]
- Ren, Y.; Liu, J.; Shalamzari, M.J.; Arshad, A.; Liu, S.; Liu, T.; Tao, H. Monitoring Recent Changes in Drought and Wetness in the Source Region of the Yellow River Basin, China. Water 2022, 14, 861. [Google Scholar] [CrossRef]
- Khanmohammadi, N.; Rezaie, H.; Behmanesh, J. Investigation of Drought Trend on the Basis of the Best Obtained Drought Index. Water Resour. Manag. 2022, 36, 1355–1375. [Google Scholar] [CrossRef]
- Razmi, R.; Sotoudeh, F.; Ghane, M.; Ostad-Ali-Askari, K. Temporal–Spatial Analysis of Drought and Wet Periods: Case Study of a Wet Region in Northwestern Iran (East Azerbaijan, West Azerbaijan, Ardebil and Zanjan Provinces). Appl. Water Sci. 2022, 12, 1–11. [Google Scholar] [CrossRef]
- Tefera, A.S.; Ayoade, J.O.; Bello, N.J. Comparative Analyses of SPI and SPEI as Drought Assessment Tools in Tigray Region, Northern Ethiopia. SN Appl. Sci. 2019, 1, 1265. [Google Scholar] [CrossRef]
- Makuya, V.; Tesfuhuney, W.; Moeletsi, M.E.; Bello, Z. Assessing the Impact of Agricultural Drought on Yield over Maize Growing Areas, Free State Province, South Africa, Using the SPI and SPEI. Sustainability 2024, 16, 4703. [Google Scholar] [CrossRef]
- Reyniers, N.; Osborn, T.J.; Addor, N.; Darch, G. Projected Changes in Droughts and Extreme Droughts in Great Britain Strongly Influenced by the Choice of Drought Index. Hydrol. Earth Syst. Sci. 2023, 27, 1151–1171. [Google Scholar] [CrossRef]
- Gebremichael, H.B.; Raba, G.A.; Beketie, K.T.; Feyisa, G.L. Temporal and Spatial Characteristics of Drought, Future Changes and Possible Drivers over Upper Awash Basin, Ethiopia, Using SPI and SPEI. Environ. Dev. Sustain. 2024, 26, 947–985. [Google Scholar] [CrossRef]
- Qin, Y.; Yang, D.; Lei, H.; Xu, K.; Xu, X. Comparative Analysis of Drought Based on Precipitation and Soil Moisture Indices in Haihe Basin of North China during the Period of 1960–2010. J. Hydrol. 2015, 526, 55–67. [Google Scholar] [CrossRef]
- Ámbito e Integración—Junta Central Regantes Mancha Oriental. Available online: https://www.jcrmo.org/entidad/ambito-e-integracion/ (accessed on 10 June 2024).
- Agricultural Water Management in Castilla-La Mancha (Spain). Available online: https://www.researchgate.net/publication/285525110_Agricultural_water_management_in_Castilla-La_Mancha_Spain (accessed on 10 June 2024).
- Sidi Bouzid Governorate—Wikipedia. Available online: https://en.wikipedia.org/wiki/Sidi_Bouzid_Governorate (accessed on 25 April 2024).
- Sidi Bouzid Climate, Weather by Month, Average Temperature (Tunisia)—Weather Spark. Available online: https://weatherspark.com/y/61917/Average-Weather-in-Sidi-Bouzid-Tunisia-Year-Round (accessed on 25 April 2024).
- Mahfouz, P.; Mitri, G.; Jazi, M.; Karam, F. Investigating the Temporal Variability of the Standardized Precipitation Index in Lebanon. Climate 2016, 4, 27. [Google Scholar] [CrossRef]
- Kobrossi, J.; Karam, F.; Mitri, G. Rain Pattern Analysis Using the Standardized Precipitation Index for Long-Term Drought Characterization in Lebanon. Arab. J. Geosci. 2021, 14, 1–17. [Google Scholar] [CrossRef]
- CHIRPS: Rainfall Estimates from Rain Gauge and Satellite Observations|Climate Hazards Center—UC Santa Barbara. Available online: https://www.chc.ucsb.edu/data/chirps (accessed on 25 April 2024).
- Duan, Z.; Liu, J.; Tuo, Y.; Chiogna, G.; Disse, M. Evaluation of Eight High Spatial Resolution Gridded Precipitation Products in Adige Basin (Italy) at Multiple Temporal and Spatial Scales. Sci. Total Environ. 2016, 573, 1536–1553. [Google Scholar] [CrossRef] [PubMed]
- Wilhite, D.A.; Glantz, M.H. Understanding: The Drought Phenomenon: The Role of Definitions. Water Int. 1985, 10, 111–120. [Google Scholar] [CrossRef]
- McKee, T.B.; Doesken, N.J.; Kleist, J. The Relationship of Drought Frequency and Duration to Time Scales. In Proceedings of the 8th Conference on Applied Climatology, Anaheim, CA, USA, 17 January 1993; pp. 179–184. [Google Scholar]
- Hayes, M.; Svoboda, M.; Wall, N.; Widhalm, M. The Lincoln Declaration on Drought Indices: Universal Meteorological Drought Index Recommended. Proc. Bull. Am. Meteorol. Soc. 2011, 92, 485–488. [Google Scholar] [CrossRef]
- Piri, J.; Abdolahipour, M.; Keshtegar, B. Advanced Machine Learning Model for Prediction of Drought Indices Using Hybrid SVR-RSM. Water Resour. Manag. 2023, 37, 683–712. [Google Scholar] [CrossRef]
- Keyantash, J.; Dracup, J.A. The Quantification of Drought: An Evaluation of Drought Indices. Bull. Am. Meteorol. Soc. 2002, 83, 1167–1180. [Google Scholar] [CrossRef]
- Carbone, G.J.; Lu, J.; Brunetti, M. Estimating Uncertainty Associated with the Standardized Precipitation Index. Int. J. Climatol. 2018, 38, E607–E616. [Google Scholar] [CrossRef]
- Uml, M.J.; Kim, Y.; Park, D.; Kim, J. Effects of Different Reference Periods on Drought Index (SPEI) Estimations from 1901 to 2014. Hydrol. Earth Syst. Sci. 2017, 21, 4989–5007. [Google Scholar] [CrossRef]
- WMO. Standardized Precipitation Index User Guide. 2012. Available online: https://www.droughtmanagement.info/literature/WMO_standardized_precipitation_index_user_guide_en_2012.pdf (accessed on 10 January 2024).
- Habibi, B.; Meddi, M.; Torfs, P.J.J.F.; Remaoun, M.; Van Lanen, H.A.J. Characterisation and Prediction of Meteorological Drought Using Stochastic Models in the Semi-Arid Chéliff–Zahrez Basin (Algeria). J. Hydrol. Reg. Stud. 2018, 16, 15–31. [Google Scholar] [CrossRef]
- Jiménez-Donaire, M.d.P.; Tarquis, A.; Giráldez, J.V. Evaluation of a Combined Drought Indicator and Its Predictive Potential for Agricultural Droughts in Southern Spain. Nat. Hazards Earth Syst. Sci. Discuss. 2019, 20, 21–33. [Google Scholar] [CrossRef]
- Guttman, N.B. Accepting the standardized precipitation index: A calculation algorithm1. JAWRA J. Am. Water Resour. Assoc. 1999, 35, 311–322. [Google Scholar] [CrossRef]
- EDO. European Drought Observatory. 2024. Available online: https://drought.emergency.copernicus.eu/data/factsheets/factsheet_spi.pdf (accessed on 15 January 2024).
- Ayub, M.; Ashraf, M.Y.; Kausar, A.; Saleem, S.; Anwar, S.; Altay, V.; Ozturk, M. Growth and Physio-Biochemical Responses of Maize (Zea Mays L.) to Drought and Heat Stresses. Plant Biosyst. Int. J. Deal. All Asp. Plant Biol. 2021, 155, 535–542. [Google Scholar] [CrossRef]
- Aurenhammer, F.; Klein, R.; Lee, D.T. Voronoi Diagrams and Delaunay Triangulations. World Scientific Publishing Co., Inc.: Hackensack, NJ, USA, 2013; pp. 1–337. [Google Scholar] [CrossRef]
- Pandey, V.; Srivastava, P.K.; Singh, S.K.; Petropoulos, G.P.; Mall, R.K. Drought Identification and Trend Analysis Using Long-Term Chirps Satellite Precipitation Product in Bundelkhand, India. Sustainability 2021, 13, 1042. [Google Scholar] [CrossRef]
- Awchi, T.A.; Kalyana, M.M. Meteorological Drought Analysis in Northern Iraq Using SPI and GIS. Sustain. Water Resour. Manag. 2017, 3, 451–463. [Google Scholar] [CrossRef]
- Dikici, M. Drought Analysis with Different Indices for the Asi Basin (Turkey). Sci. Rep. 2020, 10, 20739. [Google Scholar] [CrossRef] [PubMed]
- Kamruzzaman, M.; Almazroui, M.; Salam, M.A.; Mondol, M.A.H.; Rahman, M.M.; Deb, L.; Kundu, P.K.; Zaman, M.A.U.; Islam, A.R.M.T. Spatiotemporal Drought Analysis in Bangladesh Using the Standardized Precipitation Index (SPI) and Standardized Precipitation Evapotranspiration Index (SPEI). Sci. Rep. 2022, 12, 20694. [Google Scholar] [CrossRef]
- Liu, C.; Yang, C.; Yang, Q.; Wang, J. Spatiotemporal Drought Analysis by the Standardized Precipitation Index (SPI) and Standardized Precipitation Evapotranspiration Index (SPEI) in Sichuan Province, China. Sci. Rep. 2021, 11, 1280. [Google Scholar] [CrossRef]
- Caloiero, T.; Veltri, S.; Caloiero, P.; Frustaci, F. Drought Analysis in Europe and in the Mediterranean Basin Using the Standardized Precipitation Index. Water 2018, 10, 1043. [Google Scholar] [CrossRef]
- Tirivarombo, S.; Osupile, D.; Eliasson, P. Drought Monitoring and Analysis: Standardised Precipitation Evapotranspiration Index (SPEI) and Standardised Precipitation Index (SPI). Phys. Chem. Earth 2018, 106, 1–10. [Google Scholar] [CrossRef]
- Won, J.; Kim, S. Future Drought Analysis Using SPI and EDDI to Consider Climate Change in South Korea. Water Sci. Technol. Water Supply 2020, 20, 3266–3280. [Google Scholar] [CrossRef]
- Bwambale, E.; Abagale, F.K.; Anornu, G.K. Smart Irrigation Monitoring and Control Strategies for Improving Water Use Efficiency in Precision Agriculture: A Review. Agric. Water Manag. 2022, 260, 107324. [Google Scholar] [CrossRef]
- Karim, F.; Karim, F.; Frihida, A. Monitoring System Using Web of Things in Precision Agriculture. Procedia Comput. Sci. 2017, 110, 402–409. [Google Scholar] [CrossRef]


Disclaimer/Publisher’s Note: The statements, opinions and data contained in all publications are solely those of the individual author(s) and contributor(s) and not of MDPI and/or the editor(s). MDPI and/or the editor(s) disclaim responsibility for any injury to people or property resulting from any ideas, methods, instructions or products referred to in the content. |
© 2024 by the authors. Licensee MDPI, Basel, Switzerland. This article is an open access article distributed under the terms and conditions of the Creative Commons Attribution (CC BY) license (https://creativecommons.org/licenses/by/4.0/).