Abstract
Floods are significant global disasters, but their impact in developing countries is greater due to the lower shock tolerance, many subsistence farmers, land fragmentation, poor adaptation strategies, and low technical capacity, which worsen food security and livelihoods. Therefore, accurate and timely monitoring of flooded crop areas is crucial for both disaster impact assessments and adaptation strategies. However, most existing methods for monitoring flooded crops using remote sensing focus solely on estimating the flood damage, neglecting the need for adaptation decisions. To address these issues, we have developed an approach to mapping flooded rice fields using Earth observation and machine learning. This approach integrates high-resolution multispectral satellite images with Sentinel-1 data. We have demonstrated the reliability and applicability of this approach by using a manually labelled dataset related to a devastating flood event in north-western Nigeria. Additionally, we have developed a land suitability model to evaluate potential areas for paddy rice cultivation. Our crop extent and land use/land cover classifications achieved an overall accuracy of between 93% and 95%, while our flood mapping achieved an overall accuracy of 99%. Our findings indicate that the flood event caused damage to almost 60% of the paddy rice fields. Based on the land suitability assessment, our results indicate that more land is suitable for cultivation during natural floods than is currently being used. We propose several recommendations as adaptation measures for stakeholders to improve livelihoods and mitigate flood disasters. This study highlights the importance of integrating multispectral and synthetic aperture radar (SAR) data for flood crop mapping using machine learning. Decision-makers will benefit from the flood crop mapping framework developed in this study in a number of spatial planning applications.
1. Introduction
Extreme weather conditions and other climate change impacts are threatening global food security. Today, there is growing scientific evidence that climate change is already negatively impacting many crops [1,2]. The United Nations Sustainable Development Goals have placed priority on protecting and restoring land affected by desertification, drought, and floods, combating climate change and its impacts, ending poverty, achieving food security by promoting sustainable agriculture, and disaster response and control. Although regular flooding may enhance agriculture, biodiversity, and ecosystems, specifically agricultural losses resulting from flooding caused by increased precipitation further worsen the food security situations in many countries around the globe [3]. It has been estimated that between 2009 and 2018, the global losses occurring because of flooding accounted for USD 400 billion—the total amount of damage to property, crops, and livestock [3,4,5].
From 1985 to 2014, flooding in Nigeria affected more than 11 million lives, with a total of 1100 deaths and property damage exceeding USD 17 billion [6,7]. Mashi, et al. [8], who proposed a critical appraisal of the National Emergency Management Agency (NEMA) Act for disaster and risk reduction, explained that flooding is one of the three major disasters in Nigeria. However, they noted that addressing this issue has been challenging in Nigeria over past decades due to inadequate funding. One of the most reliable solutions is to ensure that funding for disaster management operations becomes the responsibility of all stakeholders [9]. The United Nations Office for Disaster Risk Reduction (UNISDR) has proposed four priority areas to help nations achieve effective disaster risk reduction: (i) understanding the disaster risk, (ii) strengthening disaster risk governance to manage the disaster risk, (iii) investing in disaster risk reduction for resilience, and (iv) enhancing disaster preparedness for an effective response and to “Build Back Better” in terms of recovery, rehabilitation, and reconstruction [10].
Most studies on floods in Nigeria focus on mapping the flood extent and areas prone to flooding [11,12,13]. Other studies emphasise the need for policy reviews to mitigate flood disasters [6,14,15]. Echendu [7] examined the links between flooding, food security, and Sustainable Development Goals (SDGs) in Nigeria, particularly poverty and hunger, providing a detailed analysis of the flood impacts on food security. The study highlighted that policymakers do not prioritize flood disasters due to the absence of a flood control and prevention framework in the Nigeria Agriculture Promotion Policy [7]. However, poor policy implementation in Nigeria, along with a significant communication gap between scientists and policymakers, makes it challenging to communicate the findings of environmental research effectively [16,17]. This emphasizes the urgent need to address these disasters, especially given projections that flood events may increase in future years [18]. These increased risks present important challenges for key stakeholders, scientists, and policymakers. To ensure food security in the country, a comprehensive evaluation of flood impact assessment and identification of potential adaptation measures in different geographical zones are necessary.
Over 12 million Nigerians are estimated to be involved in paddy rice farming [19]. National paddy rice production increased by 7 million metric tonnes (MT) in 2014. This success was attributed to the implementation of the Rice Transformation Agenda Action Plan (RTA-AP) from 2012 to 2015. Also, estimates indicate that Nigeria’s paddy rice production doubled at the end of the Coalition for African Rice Development (CARD) Phase 1 in 2018. The output increased from approximately 6.0 million tonnes in 2008 to 12.85 million tonnes by 2018. However, it is worth noting that rice production has declined in recent times. This implies that there is still a significant gap between rice supply and demand. Reports indicate that Nigeria’s future output beyond 20–25 million MT of paddy per year from the current production area, with only one crop per year, remains uncertain unless over 50% of rice farmers can cultivate at least two crops annually, either through fully irrigated systems or rainfed lowlands with alternative water supply solutions [20]. However, in many riverine communities in Nigeria, farmers practice fallowing, not for land recovery, organic matter storage, or moisture retention but mainly due to a lack of credit facilities and the fear of flood disasters.
To strengthen the resilience of production, it is necessary to design appropriate mitigation options to minimize flood damage to, for example, paddy rice production, where there is a need to predict the paddy rice fields’ extent and flood events. Monitoring the magnitude, frequency and spatial extent of flood events is one of the best options for identifying loss and damage, providing emergency response, and predicting future events [21]. Over the past decade, remote sensing monitoring and data collection have advanced rapidly, which has made modelling activities easier. The application of Earth observation (EO) to flood monitoring provides an interesting opportunity for operational and near-real-time risk assessment and vulnerability mapping [22,23]. Mapping surface water and floods using optical sensors is one of the fastest and most cost-effective approaches, as it has been available since the 1970s. However, optical sensors may be limited in terms of flood predictions, especially over large areas, due to cloud contamination, especially during flood events [24,25].
Since the inception of the Copernicus programme and its Sentinel satellite missions, research on the remote sensing of floods using synthetic aperture radar (SAR) has increased [23,26,27]. SAR data are advantageous because they are not hindered by cloud cover and can capture images of any part of the Earth, regardless of day or night. Today, SAR data are now well established in land use and flood inundation mapping. Previous studies utilizing SAR data have relied on unsupervised change detection methods (such as histogram-based thresholding). This is primarily due to the limited availability of training data. Various thresholding approaches have been developed to automatically detect flood events. These algorithms include those of Otsu [28], Kapur et al. [29], and Kittler and Illingworth [30], and some have been applied to automatically detect floodwater [31,32]. However, one of the most significant challenges for these techniques is the need for validation data. High-resolution datasets such as PlanetScope [32] and Worldview [33] have been used as validation datasets to assess the accuracy of these techniques. Due to the importance of these datasets, as mentioned earlier, and because they are freely available, it is useful to evaluate the performance of these techniques across different ecosystems to gain a better understanding of their benefits and limitations.
The use of multi-sensor data for flood mapping can provide a more accurate result when dealing with an emergency response to flooding [34]. A combination of multispectral (e.g., PlanetScope, Landsat and Sentinel-2 data) and radar data (e.g., Sentinel-1) for flood risk mapping has been observed to be quite promising. A radar signal can penetrate clouds and provide information about the Earth’s surface that optical sensors cannot capture due to the topography, land cover structure, orientation, and moisture characteristics. The integration of SAR and optical data has been shown to increase the classification accuracy in LULC [35] and flood damage assessments [9]. Several artificial intelligence (AI)/machine learning (ML) algorithms have been developed to examine EO data to map land use/land cover (LULC) and to find trends related to the effects of flooding [23]. Random forest has been proved to be effective in supervised classification in remote sensing [35,36,37]. The RF approach is highly robust because of its numerous advantages, including the ability to combine predictions from multiple individual models (decision trees), handle non-linear relationships, robustness to outliers and noisy data, feature importance selection, and the ability to reduce overfitting [38].
This study contributes to a broader discussion on strategies to mitigate flood-related losses in rice production, focusing on land use planning and adaptation measures [39,40,41,42,43,44]. This is important because continuous cropping in a floodplain area without proper land evaluation is vulnerable to flood disasters and can result in severe loss and damage. Land suitability evaluation is an adaptation strategy that provides information on suitable land for specific land use and highlights the various limitations of the land, taking into account multiple factors [45]. In addition to assessing crop damage, this study proposes conducting a land suitability evaluation as an adaptive approach that considers flood events, land uses, soil conditions, topographic features, and climate variables. This will help improve resilience in agriculture and floodplain management. This study, therefore, leverages multi-sensor satellite data to assess the complex relationship between the flood extent and paddy rice fields based on RF machine learning, while connecting the losses to adaptation measures for increased rice production in the region. Specifically, the objectives of this study are to (1) develop an approach for mapping paddy rice fields and the flood extent based on high-resolution optical spectral features and SAR data, (2) evaluate the extent of the flooding-related losses or damage to paddy rice crops, and (3) estimate potential cultivable lands for paddy rice farming based on land suitability evaluation using different scenarios.
2. Materials and Methods
2.1. Study Area
This area is situated between latitude 12°27′N and 12°47′N of the equator and longitude 4°15′E and 4°35′E (Figure 1a). This area is located in the Argungu local government area of Kebbi State, Nigeria. The area is renowned for its rice production and fishing in Nigeria. The climate in the area is tropical continental, with two distinct seasons: dry and wet. This is determined by the presence of two contrasting air masses, the tropical continental and the tropical maritime, which originate from the Sahara Desert and the Atlantic Ocean, respectively. The wet season is from May to October, while the dry season is from November to April. The average rainfall is 800 mm, and the average temperature is 27 °C, which can rise to 40 °C in the summer [35]. It is a floodplain with predominantly clayey and hydromorphic soils (e.g., clay, clay-loam, sandy-loam, loamy, sand, silty). The area is mostly characterized by lowland, with a few highland areas ranging between 194 to 344 m above sea level, dissected by large flowing rivers.
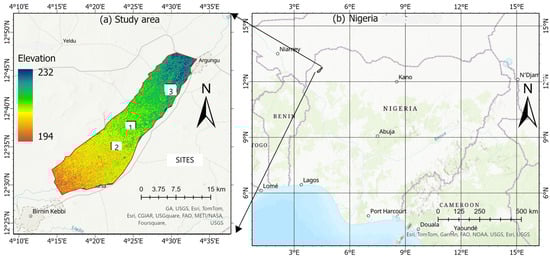
Figure 1.
Study area location showing digital elevation and showing three sites that were used in the subsequent sections as extracts of the LULC/crop and flood extents from pre- and post-flood imagery, respectively, (a) and study area overlay on Nigeria (b).
Currently, the land use patterns are undergoing various transformations due to changing demographics, economics, and policymaking (e.g., ban on rice importation), which are further exacerbating environmental problems. This area is home to vulnerable socioeconomic groups who depend on agriculture for their incomes and livelihoods. Over 70% of the people in the region engage in subsistence agriculture, with paddy rice being the main crop cultivated during both the dry and rainy seasons. However, due to the uncertainty caused by interannual weather and climate variability, more people prefer to engage in dry-season agriculture. Unfortunately, a recent deregulation policy in the oil sector, which announced the removal of oil subsidies, has made it difficult for many farmers to afford the fuel needed for their agricultural activities. This has further increased the vulnerability of people in the area. Additionally, excessive dry-season farming in the area is beginning to exert excessive pressure on water resources, with many streams and rivers recently drying out completely. Rainfed agriculture is now the most viable option for people in the area, but extreme weather events also make it quite uncertain due to flood and drought occurrences. From late August to late September 2020, a devastating flood event occurred in north-western Nigeria, affecting many states in the region [46]. In Argungu, this catastrophic occurrence has been deemed exceptional, as residents have expressed that they have never encountered such a disaster in their lifetimes. The flood has severely impacted local communities, displacing them from their homes and sources of livelihoods. In Kebbi State alone, it has been estimated that rice farmers incurred losses amounting to NGN 1 billion because of the flood [47]. As the land use system undergoes rapid changes, it is crucial to develop an accurate mapping framework to effectively study the land use patterns and assess the sustainability of land resources [35,48].
2.2. Remote Sensing Data
2.2.1. PlanetScope Imagery
PlanetScope data are level 3B high-resolution data (3 m) provided by Planet, which operates a constellation of approximately 130 satellites. These satellites are capable of capturing images of the entire land surface of the Earth daily, with a collection capacity of 200 million km2/day [49]. The PlanetScope Ortho Analytic 4B Scene product used in this study is an orthorectified, surface reflectance 4-band image product suitable for analytical applications [50]. The four bands include visible (blue, green, and red) and near-infrared (NIR). The PlanetScope imagery utilized in this study is atmospherically corrected. The atmospheric correction process employs the 6S radiative transfer code [51] and uses the closest spatial and temporal MODIS aerosol optical depth (AOD) available data [52]. Despite the atmospheric processes undertaken by the data providers, we carefully selected tiles across different dates within the study area to ensure the use of cloud-free imagery. The affected tiles are less than 3% cloudy. We utilized images of pre- and post-flood events. The pre-flood data consisted of images taken on 12, 17, and 19 August 2020, and the post-flood images were downloaded for 19 and 23 September 2020 [49,50].
2.2.2. Sentinel-1
Sentinel-1 is a C-band SAR satellite mission of the European Copernicus Programme. In this study, the publicly available Sentinel-1 data on Google Earth Engine (GEE) were used. The Sentinel-1 data matched the date ranges for PlanetScope for both the pre- and post-flood periods. The data are available in single polarisation (VV) and double polarisation (VH). Images produced by SAR frequently contain speckle noise. Primarily, speckle noise results from the random interference of all the backscatter signals at a given imaging resolution. Speckle reduction was applied to the backscatter to reduce the granular ‘salt and pepper’ effects. Specifically, the Lee filter method was applied. The Lee filter reduces the speckle noise by applying a spatial filter to each pixel in an image while preserving the edges in the image and texture information [53]. In general, data from SAR, such as those from Sentinel-1, provide different and complementary information than those provided by optical remote sensing. The pre-flood Sentinel data were filtered from 12 to 19 August 2020, while the post-flood SAR data were filtered from 18 to 25 September 2020, to match the PlanetScope data.
2.2.3. STRM DEM
The Shuttle Radar Topographic Mission (SRTM) is a collaborative project between the National Geospatial-Intelligence Agency and the National Aeronautics and Space Administration (NASA). Its objective is to generate a detailed, high-resolution digital topographic database of the Earth by gathering elevation data worldwide using radar technology [54]. For our analysis, we employed the publicly accessible 30 m ArcGRID format on GEE. Subsequently, we computed the slope using these data.
2.2.4. CHIRPS Precipitation Data
CHIRPS stands for Climate Hazards group Infrared Precipitation with Stations. This dataset was developed using ‘smart’ interpolation techniques and high-resolution, long-period precipitation estimates derived from infrared Cold Cloud Duration (CCD) observations. Satellite information is also incorporated to provide data for locations with limited gauge coverage. Daily precipitation records from 2016 to 2023 were downloaded as csv files from the Climate Engine Web Application site, which we used along with the corresponding temporal signals of affected and non-affected rice fields from the Sentinel-1 data. Mean annual precipitation data from 2000 to 2023 were downloaded from GEE, which we used as one of the inputs for our land suitability evaluation modelling.
2.2.5. Soil Properties
The soil data used in this study (soil depth, drainage, organic carbon, pH, texture) were the soil properties and nutrients developed by Heng et al. [55]. It is a product with a spatial resolution of 30 m, prepared based on machine learning, and is available on the GEE platform. For a detailed explanation about this product, refer to Heng et al. [55].
2.3. Method
This study integrates PlanetScope, Sentinel-1, soil properties, climate, and digital elevation model data to study the flood damage to paddy rice fields and propose land use planning based on land suitability evaluations to exploit the benefits of varied ecological factors for enhancing rice production while reducing the risk of flood events.
2.3.1. RF Classification
A collection of tree predictors is used in RF classification. Each tree in the forest is dependent on values from a random vector that is independently sampled for every tree using the same distribution. Many decision trees are built when using RF to classify images. Each tree provides a class prediction, and the class with the most votes determines the final model prediction [56,57]. In this study, RF classification was used to classify the LULC categories (to generate a crop extent layer) and flood and non-flood layers. The RF classification was implemented in GEE. The classification was carried out for the LULC and flood extent, as detailed below.
RF Classification for Identifying Paddy Rice Field from Pre-Flood Images
Many studies have used the crop extent or LULC products previously developed by the scientific community as input for climate and ecological models. Venkatappa et al. [58] applied a 10 × 10 km global cropland dataset developed by Teluguntla et al. [59] to assess the impacts of droughts and floods on croplands and crop production in Southeast Asia, while Qamer et al. [60] used the crop extent layer extracted from the European Space Agency (ESA) 10 m LULC product [61] to estimate the crop losses due to flooding in Pakistan. However, in this context, it may not be appropriate for at least two reasons: (1) some of these products are too coarse and may not be suitable for the study area, given the smaller size of farmlands resulting from land fragmentation and subsistence agriculture practices in the region, and (2) although the ESA’s LULC, which has a 10 m medium resolution from the Sentinel-2 data, is applicable, the fallow farming system practiced during the wet season leads to a transition from cropland to bare surface annually. The complex pattern of the paddy cropping requires mapping of the crop extent for the reference period. Therefore, the LULC categories were classified into three classes: paddy rice, water bodies and barren land. The classification procedure employed in the study was as follows:
- Training data: The RF classifier was trained with polygons from the LULC classes using an RGB composite derived from PlanetScope data for the three classes. This is because most of the paddy rice fields are quite small, and it has been observed that a large amount of training increases the accuracy of the RF classification method [62,63]. We used 250 number trees and chose the variable importance based on this method.
- Predictor variables: PlanetScope’s visible and NIR bands and the VV and VH polarizations of the Sentinel-1 data were used for the classification. In addition, for the pre-flood data, four vegetation indices were calculated to increase the number of features to enhance the accuracy of the RF classification. These indices include the Normalised Difference Vegetation Index (NDVI), which uses red and NIR [64]; the Normalised Difference Water Index (NDWI), calculated from the green and near-infrared wavelengths [65]; the Green Difference Vegetation Index (GNDVI), which is similar to the NDVI but uses the green band instead and is sensitive to the chlorophyll content of the leaves [66]; and the Soil Adjusted Vegetation Index (SAVI), which is specifically developed to minimize the soil brightness effects [67]. We expect these vegetation indices to improve the classification accuracy, given the nature of the study area, with paddy rice crops being at various stages of development, the presence of bare soil and water bodies, and the challenges of discriminating these components when a single channel is used. Different input variables were tested for the classification. In the first scenario, we used PlanetScope’s four bands, including Blue, Green, Red and NIR. In the second scenario, we used PlanetScope’s four bands, along with vegetation indices, including the NDVI, NDWI, GNDVI, and SAVI. In the third scenario, only PlanetScope’s four bands, along with Sentinel-1 VV and VH polarization, were utilized. In the fourth scenario, NDWI was added to the variables used in the third scenario.
- Accuracy assessment
First, the LULC/flood extent classifications based on RF relied (for error metric computation) on the out-of-bag confusion matrix of the RF, which was computed internally by the model. The standard metrics used for the accuracy assessments are recall, precision, F1, and overall accuracy (OA). Additionally, commission and omission errors were computed to provide further insight into the error estimates. Precision calculates the fraction of correctly classified pixels among all the predicted pixels from the validation samples ((Equation (1)). Recall measures the fraction of predicted LULC class/flooded or non-flooded pixels (as the case may be) among the actual pixels, while F1 is the harmonized mean of recall and precision, which balances the two in evaluating the performance of the algorithm ((Equation (2)). OA is a metric that evaluates the overall performance.
where TP, FP, TN, and FN the mean for the true positive, false positive, true negative, and false negative, respectively.
RF Classification for Identifying Flood Extent from Post-Flood Images
The RF classification method was used to map the extent of the flood. All the flood extent maps were produced at 3 m spatial resolution. In this case, two separate classifications were performed because machine learning methods are efficient in estimating flash floods. The visible and NIR bands of PlanetScope were classified using training data composed of polygons that were digitized from the RGB composite of the same datasets. Similarly, the Sentinel-1 data were trained using the same data obtained from the RGB composite. Otsu’s segmentation floodwater detection algorithm was also applied to the Sentinel-1 data to classify the flooded and non-flooded pixels into binary categories, as explained in more detail in the following section. Before performing the flood classifications, the histogram distributions and descriptive statistics were calculated for the flooded and non-flooded points derived from the training data. This analysis was conducted to assess the distinctiveness of the flooded and non-flooded signals as captured by the PlanetScope imagery and Sentinel-1 VV and VH polarizations. After classifying the flood events, the Sentinel-1 VV backscatter coefficients from 2016 to 2023 were extracted for the flooded and non-flooded rice fields and plotted against the daily rainfall data for the same period. However, the rainfall anomalies were calculated by subtracting a 30-day rolling mean from the actual daily rainfall values. This process helps to highlight deviations from typical rainfall patterns, identifying periods where the rainfall was unusually high or low relative to the expected seasonal trends. The flood extent classifications based on RF relied (for the error metric computation) on the out-of-bag confusion matrix of the RF, which was computed internally by the model. The standard metrics used for the accuracy assessments were recall, precision, F1, and overall accuracy (OA). Additionally, commission and omission errors were computed to provide further insight into the error estimates. Precision calculates the fraction of correctly classified pixels among all the predicted pixels from the validation samples ((Equation (1)). Recall measures the fraction of predicted LULC class/flooded or non-flooded pixels (as the case may be) among the actual pixels, while F1 is the harmonized mean of recall and precision, which balances the two in evaluating the performance of the algorithm ((Equation (2)). OA is a metric that evaluates the overall performance.
2.3.2. Otsu’s Segmentation Algorithm Segmentation for Identifying Flood Extent from Post-Flood Images
Otsu is a non-parametric and unsupervised change detection method that is based on a thresholding algorithm developed by Otsu [26]. It is now widely used for different applications. This technique is particularly useful because of the challenge of acquiring training data to be used in most supervised classification methods. However, the accuracy of this technique for floodwater detection, especially with SAR data, is still being assessed [64]. Now, two algorithms are mostly used for Otsu’s thresholding. The algorithms are the Bmax and Edge Otsu algorithms, which were originally developed by Cao et al. [65] and Donchyts et al. [66], respectively. The Bmax Otsu algorithm is a method for extracting a bimodal histogram from images, which is used as an input for Otsu thresholding. On the other hand, Edge Otsu is a technique that uses a water index to extract feature edges in imagery by applying a Canny edge filter [65,67]. A comparative analysis of these two algorithms indicates that Edge Otsu is more accurate than Bmax Otsu. Therefore, in this study, the edge detection was implemented in GEE with adjustments to suit the local conditions, especially in terms of thresholding. The thresholding algorithm resulted in flooded and non-flooded binary classes.
Otsu’s segmentation algorithm for floodwater detection was also validated using validation datasets from the PlanetScope data. Five hundred (500) pixels were selected based on equalized random stratified sampling. The standard metrics used for the accuracy assessments were recall, precision, F1, and overall accuracy (OA). Additionally, commission and omission errors were computed to provide further insight into the error estimates. Precision calculates the fraction of correctly classified pixels among all the predicted pixels from the validation samples ((Equation (1)). Recall measures the fraction of predicted LULC class/flooded or non-flooded pixels (as the case may be) among the actual pixels, while F1 is the harmonized mean of recall and precision, which balances the two in evaluating the performance of the algorithm ((Equation (2)). OA is a metric that evaluates the overall performance.
2.3.3. Damage Assessment
In this study, flood damage to paddy rice fields was assessed by calculating the differences between the area of rice fields before and after the flood events. We extracted the crop extent layer from the LULC map of the PlanetScope and Sentinel-1 data. Using the flood and non-flood classification of the same PlanetScope data, we used the crop extent layer derived from the LULC data to extract the available paddy rice fields that were flooded and not flooded. This gave us the total area of land of paddy rice fields affected by the flood event. Simultaneously, we calculated the total amount of land that was flooded by subtracting the total flooded area from the actual land occupied by the water bodies before the flooding event. We calculated the percentages for the LULC, affected/unaffected rice fields, and flooded and non-flooded land features.
2.3.4. Land Suitability Evaluations
Agricultural land suitability analyses require careful selection of the most appropriate method. Globally, numerous systems and studies have adopted the multi-criteria decision-making (MCDM) approach [68,69] for agricultural land suitability assessments. Various criteria have been evaluated by different researchers, as no universal standard criteria exist for all scenarios. For instance. Das et al. [70] assessed the land suitability for sustainable tea production in northeastern Bangladesh using phenological datasets (including vegetation indices like the NDVI), climate parameters, geospatial datasets of soil–plant biophysical properties, elevation, expert opinions, and land use/land cover (LULC) derived from Sentinel-2 imagery. They determined the suitability classes through weighted overlay spatial analysis by reclassifying the raster layers of all the parameters, incorporating multicriteria analysis results. Their findings revealed that only 41,460 hectares (3.37% of the total land) were highly suitable. Hussain et al. [71] applied a systematic approach integrating the Analytical Hierarchy Process (AHP) and Multi-Criteria Decision Analysis (MCDA) techniques to assess the agricultural land suitability in Southern Punjab. This method involved identifying relevant criteria and sub-criteria, establishing a hierarchical structure, and conducting pairwise comparisons to assign the relative importance to each factor. Their results indicated that around 43% of the area was highly suitable for agriculture.
This study assessed the potential areas for rainfed and irrigation farming based on land suitability evaluation. The suitability model integrates land use, soil, climate, and topographic variables to predict the potential area for paddy rice cultivation. The information from the LULC data and flood extent layer developed in this study was used as input variables. The FAO guidelines’ approach for land evaluation was adopted with a few modifications, depending on the spatial information of rice growth requirements and physical conditions [72,73]. Only the topographical features (elevation and slope), soil texture and the flood layer were limiting factors for paddy rice cultivation in the area; however, other factors showed a varying pattern. In this study, the MCDM, specifically the Weighted Linear Combination (WLC) approach, was used to classify the thematic layers in a weighted overlay analysis. Weighted overlay involves assigning weights to different layers of spatial data based on their relative importance or influence on a particular outcome. This process requires prior knowledge and judgment to determine the appropriate weights for each layer. First, the climate, landscape, and soil spatial data were reclassified and rated in terms of importance (Appendix A). Classes or scores ranging from 1 (not suitable) to 5 (highly suitable) were assigned to each layer. Secondly, overlay approach operations on the layers were performed on these variables, considering the weighted significance of each variable (Table 1), and then suitability maps were produced. Three scenarios were developed: rainfed (no flood layer), rainfed under natural flood (with flood layer), and irrigation farming.

Table 1.
Weights of the input parameters.
3. Results
3.1. Crop Extent Maps
Figure 2a–c display high-resolution RGB colour composites from PlanetScope. The RF classification method was based on the most accurate classification, which was derived from the combination of PlanetScope visible bands, Sentinel-1 and NDWI. All the classification results closely reflect the spatial pattern of paddy rice fields, water bodies, and barren land within the area. The distribution of paddy rice fields is sporadic, primarily occurring in small patches within the regions. This is due to the favourable conditions for paddy rice cultivation, such as the presence of water and essential soil edaphic and mineral requirements. However, this discrepancy is not consistent across the entire study area, as water bodies and barren land are clearly distinguished. Paddy rice fields are underestimated in both classifications, as observed in Figure 2f. This underestimation may be attributed to hazy weather conditions, as indicated by the RGB composite of the PlanetScope data (Figure 2c). Despite the significant amount of water present in the area when the imagery was acquired in August, which is the peak of the rainy season, most of the rice fields were not affected by flood inundation at that time.
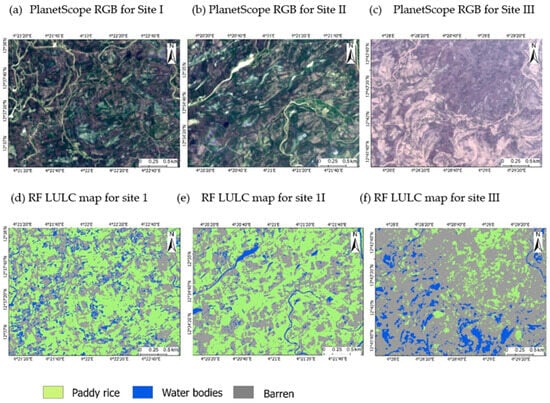
Figure 2.
(a–f) depict the RGB composites for three sites within the study area, along with their corresponding. RF LULC maps from PlanetScope four bands, SAR and NDWI. (a) PlanetScope RGB for site I, (b) PlanetScope RGB for site II, (c) PlanetScope RGB for site III, (d) RF LULC map for site I, (e) RF LULC map for site II, and (f) RF LULC map for site III.
3.2. Descriptive Statistics and Histogram Distribution of the Flooded and Non-Flooded Points
Figure 3a–c present the descriptive statistics and histogram distribution for the PlanetScope NDWI and Sentinel-1 VV and VH polarization. These statistics were derived from the mean values of each training polygon used for the flooded/non-flooded classification. The statistics include the count, mean, standard deviation, minimum, maximum, and quartiles (25th percentile, 50th percentile, and 75th percentile). The results show clear discrimination between the flooded and non-flooded signals. For the NDWI, the mean values are −0.06 for flooded pixels and −0.46 for non-flooded pixels (Figure 3a). The maximum values are −0.11 and 0.02, respectively, with the third quartile values being −0.05 for flooded and −0.40 for non-flooded pixels. This distinction arises because flooded pixels typically have higher NDWI values, reflecting more in the green band and absorbing more in the near-infrared (NIR) band. For the Sentinel-1 VV backscatter, the mean values are −9.17 for flooded pixels and −18.95 for non-flooded pixels (Figure 3b). The maximum values are −5.08 and −9.98, while the third quartile values are −7.93 and −18.38, respectively. Similarly, the Sentinel-1 VH backscatter shows mean values of −18.05 for flooded pixels and −27.16 for non-flooded pixels, with maximum values of −12.41 and −15.70 (Figure 3c). The third quartile values are −15.70 for flooded and −26.88 for non-flooded pixels. Overall, the Sentinel-1 data reveal that flooded areas have lower backscatter values compared to non-flooded areas, where vegetation or other structures cause higher backscatter. This leads to distinct backscatter characteristics for flooded versus non-flooded areas, despite some mixed pixels (Figure 3a,b).

Figure 3.
Histogram distribution of the flood and non-flood points extracted based on the training data used for the flooded/non-flooded classification using the (a) NDWI (PlanetScope), (b) Sentinel-1 VV backscatter, and (c) Sentinel-1 VH backscatter.
3.3. Floods and Flood Affected Rice Fields
Figure 4a–i illustrate the extent of flooding in the same locations presented in Figure 2a–f, along with their corresponding RGB composites. High-resolution RGB colour composites from PlanetScope are displayed in Figure 4a–c. Upon examination of the RGB composite of the post-flood data captured by PlanetScope between 19 and 23 September 2020, it is evident that a huge portion of the study area was inundated by floodwaters. The RF classification method effectively distinguishes between flooded and non-flooded areas in the study area, as demonstrated by the overlay of the classification results of the pre-flood imagery in Figure 2d–f. The rice fields, as determined by the RF classification, are shown in Figure 4c,f,i. In certain locations within the study area, many rice fields were impacted by the floodwaters. Additionally, in Figure 4a,d,g, the post-flood RGB composite reveals the presence of more rice fields in a specific area that was not detected by the RF classification. As mentioned earlier, this discrepancy can be attributed to the hazy weather conditions, as indicated by the pre-flood RGB composite from the PlanetScope data.
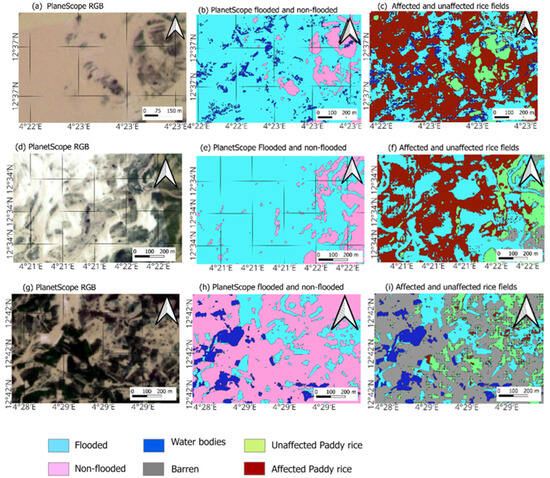
Figure 4.
(a–i) RF flooded and non-flooded layers overlaid by water bodies, affected and unaffected rice fields, from the subsets of the full scenes (zoom in from the three sites shown on the study area map).
3.4. Sentinel-1 Temporal Signals Track Flood Occurrence
Figure 5a,b display the rainfall anomaly data (derived from daily CHIRPS data) alongside the corresponding Sentinel-1 VV signals of the paddy rice fields across various locations, representing flooded and non-flooded sites from 2016 to 2023. A positive anomaly indicates that the observed rainfall exceeds the long-term average, while a negative anomaly indicates lower-than-average rainfall. The rainfall anomalies reveal that the year 2020 experienced the highest peak, with an anomaly exceeding 30 mm. Additionally, 2020 records two major peaks during this period (Figure 5a,b). In this area, which is characterized by a dry climate, a +30 mm anomaly could significantly increase the soil moisture, potentially leading to flooding or waterlogging, depending on the terrain and infrastructure. The VV signals in Figure 5a show a distinct growing cycle that corresponds with the wet season, providing evidence of wet-season agriculture in this region. The backscatter signals of the flooded area in the same figures highlight past flood events, with major flooding occurring in 2020, although there are intermittent breaks—typically in August and September—in other years. Regarding the rainfall anomalies, it is evident that the occurrence of floods can be attributed to the extreme rainfall patterns observed in 2020 (Figure 5a,b). However, it is unclear why there were no flood events in some years despite the presence of reasonable positive anomalies.

Figure 5.
Sentinel-1 VV signals of the paddy rice fields of flooded/non-flooded rice fields and their corresponding rainfall anomalies (2016–2023). (a) Flooded/non-flooded rice fields and rainfall anomalies for the three locations shown on the graph. (b) Flooded/non-flooded rice fields and rainfall anomalies for the three locations shown on the graph.
3.5. Model Performance Evaluation
The accuracy assessments for the different classification results are shown in Table 2. The accuracy metrics vary for each class and scenario, depending on the predictor variable used in the classification. In the crop extent LULC classification, the PlanetScope bands (visible and NIR) alone achieved an overall accuracy of 93%. When the four remote sensing indices (NDVI, NDWI, GNDVI, and SAVI) were added, the accuracy of the classification did not improve (93%), but when the PlanetScope bands and VV and VH polarizations of Sentinel-1 were combined, the accuracy slightly improved to 95%. Similarly, when the PlanetScope bands, NDWI, and Sentinel-1 polarizations were combined, the overall accuracy was maintained at 95%, but the class error reduced. Although all the classes have shown impressive accuracy based on the precision, recall, and F1, there are differences among these classes for different datasets. For example, the recall and F1 for the PlanetScope bands, VV, VH, and NDWI classification results were comparatively higher (recall/paddy rice = 0.98, water bodies = 0.50, barren = 0.94 and F1/paddy rice = 0.97, water bodies = 0.63, barren = 0.94) than those obtained for the other scenarios. A visual comparison of the RF classification results shows that the PlanetScope data overestimate the rice fields, while there is confusion between water bodies and barren land in both maps. This is probably due to the similar spectral signatures of water bodies and barren land, which may result due to the turbidity and shallow water bodies and wet barren land.
Table 2.
Accuracy assessments of crop extent/LULC and flooded/non-flooded classifications.
The major confusion was found between water bodies and barren land due to the similarity in their spectral reflectance signatures. Water bodies show a recall of 0.35 and 0.40 for the PlanetScope bands and PlanetScope bands/remote sensing indices, respectively. Barren land shows the lowest precision (0.60), recall (0.63), and F1 (0.60), which was observed when using the PlanetScope bands and VV and VH polarizations of Sentinel-1, but when the NDWI was added, the accuracy was much better than all the scenarios (precision = 0.93, recall = 0.94, F1 = 0.94). This was also confirmed with reference to the omission and commission errors. Based on the omission and commission errors, the PlanetScope bands and Sentinel-1 show fewer errors for paddy rice (1.87% and 4.02%) and water bodies (1.87% and 4.02%), but they fail to discriminate barren land (51.2% and 7.49%). The classification with the PlanetScope bands, Sentinel-1, and NDWI had the least error for all the classes: paddy rice (1.94% and 4.09%), water bodies (52.14% and 7.88%), and barren land (5.49% and 7.18%). On the other hand, the flood extent classification based on RF shows high accuracy (Table 2). Both the PlanetScope bands and Sentinel-1 achieved an overall accuracy of 99%. The validation results for the flood extent acquired based on Otsu’s segmentation algorithms achieved an overall accuracy of 76%. However, the omission and commission errors show that the non-flooded layer had the highest error of 26% and 29.2% for the omission and commission errors, respectively.
3.6. Damage Assessment
Figure 6 shows the area in 1000 ha and percentages for each LULC flooded/non-flooded and affected/non-affected area. According to the most accurate LULC RF classification, out of the total 30,702.71 ha of land, 11,125.15 ha are occupied by paddy rice fields (36.24%), 2207.41 ha by water bodies (7.19%), and 17,370.15 ha by barren land (56.57%). The flood extent, as determined using the PlanetScope high-resolution RF classification, is 19,712.6 ha (64.20%) for flooded areas and 8782.9 ha (28.61%) for non-flooded areas. The flood extent estimates include the area already occupied by water before the flood occurs. The damaged area for paddy rice fields is 6566.34 ha, which corresponds to 59.02% of the rice fields. The area in hectares and percentages for each LULC/flood extent, and the damage to paddy rice fields.
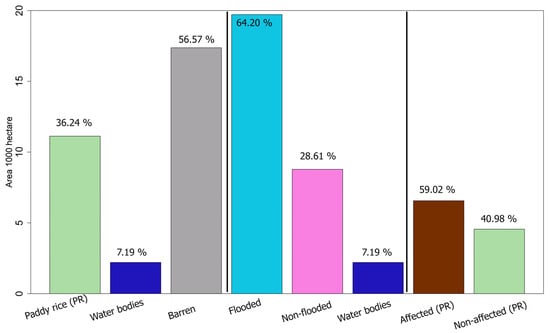
Figure 6.
Area in hectares and percentages for each LULC/crop extent, flooded/non-flooded area and the damaged PR.
3.7. Potential Area for RF, RFNF and IR Paddy Rice Farming
To minimize the flood damage to paddy rice in the study area, the potential cultivable land area was estimated using multicriteria analysis in GIS, following previous methods and guidelines. Figure 7 presents the distribution of land (in hectares) across three different scenarios, indicating highly suitable, suitable, and unsuitable regions. Specifically, the RF agriculture demonstrates a highly suitable area of 3809.43 ha (12.40), a suitable area of 25,119.80 ha (81.82%), and an unsuitable area of 1772.08 ha (5.79%). This implies that, out of the total land area of 30,701.32 ha, only 5.79% is deemed unsuitable for paddy rice cultivation during the wet season. On the contrary, when the flood layer was used as the input for the model, there was a significant reduction in the amount of land that was cultivable. Therefore, the RFNF scenario shows that 2156.60 ha (7.02%) are highly suitable, 10,904.50 ha (35.52%) are suitable, and 17,640.22 ha (57.46%) are unsuitable for paddy rice cultivation. Consequently, only 42.54% of the total area, which is equivalent to 13,061.1 ha, is deemed suitable for this type of cultivation under natural flood conditions. The third scenario considers the prevailing conditions for the cultivation of crops during the dry season. In this regard, IR identifies that 10,005.76 ha (32.5%) are highly suitable, 15,887.87 ha (51.75%) are suitable, and only 4807.70 ha (15.66%) are unsuitable. This indicates a high potential for cultivation during the dry season, as more than 80% of the area is deemed suitable in this scenario.

Figure 7.
Potential cultivable area estimated based on the weighted overlay approach for different scenarios: (a) for rainfed (RF) agriculture, (b) for rainfed under natural flood (RFNF) and (c) for Irrigation (IR) paddy rice farming.
4. Discussion
In this study, we have presented the mapping of the crop/flood extent and damage to paddy rice fields in a region in north-western Nigeria. We utilized high-resolution multispectral satellite images and Sentinel-1 data. Additionally, we have conducted a thorough validation of the RF classification method and the unsupervised floodwater detection algorithm implemented in this research. We demonstrated their robustness and applicability using a manually labelled dataset that relates to a devastating flood event in northern Nigeria in August/September 2020. Additionally, we have developed a land suitability model to assess potential areas for paddy rice cultivation under natural flood and irrigation farming as a strategy to help stakeholders mitigate flood disasters. Our classification methodology is innovative in that it explores the use of various input variables. We are concerned that the effectiveness of assessing flood damage and conducting land evaluations, which are the main objectives of this study, may be compromised if the classification results are unsuccessful. Through our research, we have discovered that high-resolution imagery, specifically from PlanetScope, shows great promise in monitoring LULC. By utilizing the visible and NIR bands of this imagery, we were able to achieve high classification accuracy for determining the crop extent and LULC, as well as detecting flood occurrences. Furthermore, we found that combining these bands with remote sensing indices and SAR data across different polarizations can enhance the accuracy of these classification methods. It has already been established that the accuracy of an RF classification method is influenced by factors such as the characteristics of the remote sensing data, the number of thematic classes, the size of the training and validation datasets, and the specific ecosystem in which the study is being conducted [62,74].
In our approach, we used a combination of spectral features with the RF algorithm. Initially, we noticed redundancy in the variables when we added the four remote sensing indices (NDVI, NDWI, GNDVI, and SAVI) to the original PlanetScope data, as doing so did not improve the classification accuracy (Table 2). However, when we combined the PlanetScope bands, NDWI, and Sentinel-1 polarizations, the overall accuracy improved and the class error was reduced. Many previous studies have reported the promising integration of multispectral and SAR data [75,76]. In particular, the use of the NDWI has proven quite useful in reducing the class error and improving the overall accuracy. Based on the F-scores, the class error for water bodies in this combination was reduced by 26% compared to the PlanetScope data (Table 2). This classification approach represents an improvement over a previous LULC classification in the same locality conducted by Ibrahim [35] using Sentinel-1, -2 and digital elevation models. The NDWI, specifically developed for water detection, has been observed to provide useful information for LULC and wetland mapping [77,78]. Therefore, the crop extent/LULC maps closely reflect the spatial extent of the paddy rice fields, water bodies, and barren land within the study area (Figure 2a–f). For improved accuracy, we recommend incorporating elevation and slope variables in future studies. The distribution of paddy rice fields is characterized by sporadic occurrences, appearing as small patches throughout the region. This phenomenon can be attributed to the presence of favourable conditions for paddy rice cultivation and the essential soil edaphic and mineral requirements. This region is well known for its rice cultivation. The underestimation of paddy rice cultivation observed in this study can be attributed to the hazy weather conditions, as shown by the RGB composite of PlanetScope data over a small portion of the study area. One of the limitations of random forest classification algorithms is their tendency to overestimate paddy fields when using cloudy data, as the classification relies heavily on the spectral signatures of LULC classes, which can be distorted or obscured by cloud cover. We recommend future studies with optical data to incorporate cloud masking techniques and multi-temporal data integration, as well as exploring more advanced algorithms such as deep learning to improve the classification accuracy. Despite this limitation, the mapping framework produced a spatial resolution map of 3 m for the study area (Figure 2a–f). These maps will be useful since northern Nigeria does not have a comprehensive land survey system in place to gather agricultural data. Although there was a significant effort to map the agricultural systems in northern Nigeria [48], the methodology developed in this study based on high-resolution data can potentially be expanded to other areas within Nigeria. This expansion would allow for the monitoring of agricultural systems over time and set the basis for agricultural monitoring. This study does not consider the proportion of natural plants in the area as it is insignificant due to the massive vegetation clearance and bush burning being practiced by farmers over the years. However, it will be good to identify areas with natural plants, but due to a lack of field data, we are unable to include a class representing other natural plants.
On the other hand, the flood extent prediction based on the RF classification was quite successful for both the PlanetScope and Sentinel-1 data (Table 2, Figure 4 and Figure 5), which may be due to the limited number of thematic classes or the distinct spectral signature of the two classes (Figure 3a–c). The floodwater segmentation algorithm, based on Otsu’s method, which was validated using the high-resolution PlanetScope data, also shows high accuracy (Table 2). The method has effectively delineated the flood extent in the area. One reason for its robustness in relation to water detection could be the improvement made to the algorithm’s segmentation ability (Edge Otsu). A previous study has already demonstrated that the Edge Otsu algorithm is more accurate than the Bmax Otsu algorithm. A more recent study compared Otsu’s method, K-means, and the unsupervised Gaussian mixture model (GMM) for mapping the flood damage resulting from a flood disaster [79]. Although the GMM (OA = 0.97, F1 = 0.84) outperformed the other algorithms, the accuracy of Otsu’s method is within an acceptable limit (OA = 0.96, F1 = 0.79). Unsupervised change detection approaches are quite useful, especially over a large area, due to the limited training datasets in many LULC classification frameworks.
Our studies have shown that the flood event in this region was one of the most severe and catastrophic flood disasters in the area within the last eight years (Figure 5a,b). Based on our investigation of the Senitinel-1 polarization temporal signals, the VV polarization results in higher temporal variations for flooded and non-flooded signals. Similar backscattering coefficient characteristics for maize, wheat and sunflower were observed by Nasirzadehdizaji et al. [80], further highlighting the usefulness of Sentinel-1 SAR data for crop growth monitoring. However, the absence of floods in certain years, despite the presence of positive anomalies, remains unclear (Figure 5a,b). We recommend further studies to explore this phenomenon. Our estimates show that over 60% of the area was flooded and about 60% of the damage was to paddy rice fields (Figure 6). A report stated that a considerable number of individuals lost their lives, and over 2,353,647 people were affected in Nigeria due to the flood disaster in 2020 [81]. By analysing the monthly precipitation data and their corresponding backscatter signals for the flooded and non-flooded paddy rice fields, it becomes clear that the occurrence of floods in 2020 can be attributed to the unusually heavy rainfall patterns (Figure 5a,b) in this locality. This can be due to the notable peaks in rainfall that occurred in July, August, and September in 2020. In West Africa, it has been observed that the rainfall shows significant variations over interannual and decadal periods, leading to droughts and floods across spatial and temporal scales [82]. However, the main source of uncertainty in this study relates to the availability of remote sensing data, which are required at shorter intervals due to the rapid and dynamic nature of flood inundation. These changes occur within a short period, necessitating daily or even hourly images. Unfortunately, there are currently no open-source satellite data available on a daily or even hourly basis that can satisfy this demand [75,79].
Currently, reports are indicating that heavy precipitation is expected to increase in West Africa in this century [82,83,84]. This is one of the reasons why the current study proposes an adaptation strategy based on land suitability evaluations to enhance rice production and promote sustainable living. Our results suggest that only 42.54% of the total area, equivalent to 13,061.1 ha, is suitable for paddy rice cultivation under natural flood conditions. However, most of these areas are not currently cultivated by the inhabitants. Our results show that there are approximately 13,061.1 ha of land that can be cultivated under natural flooding, compared to the current cultivation of 11,125.15 ha, of which about 60% was flooded. The flood event lasted for over a month, and the rice species under cultivation were unable to withstand the floodwater for more than two weeks. Although the land suitability model offers strong insight into various adaptation strategies, it is limited owing to the reliance on low-spatial-resolution precipitation and soil property datasets. Overall, the use of field survey data not only for the suitability model but also for LULC and flood inundation mapping is recommended in future research. Our recommendations for stakeholders in terms of adaptation measures are as follows. (1) Since there are possibilities for cultivating additional land in areas that are less susceptible to flooding, it is essential to make a significant effort to involve local communities and ensure that they are aware of and have access to these areas. This will help to ensure that agricultural activities are appropriately located. (2) Based on our land suitability evaluation, we found that paddy rice cultivation under irrigation activities can be viable in the region, as more than 80% of the area is deemed suitable under this scenario. Financial support and access to credit facilities will assist farmers in investing in resilient farming practices. (3) A substantial portion of the land (over 80%) is potentially cultivable if there is no flooding. This means that if local communities can be made aware of weather forecasts through early warnings, they will have a better understanding of whether or not to cultivate. (4) Diversifying cropping by encouraging the integration of alternative crops and farming practices to reduce dependency on paddy rice and spread the risk of flood impacts, and (5) planting flood-tolerant rice species, can be seen as additional options for adapting to flood vulnerability. There should be a substantial effort to undertake scientific research and produce early warning reports based on research (e.g., through climate change research) and innovations available to farmers through agricultural extension services.
5. Conclusions
This study presented a mapping framework for the crop extent/LULC and flood detection. This framework is based on Earth observation and machine learning, which integrate high-resolution multispectral satellite images and Sentinel-1 data. Our goal was to assess the flood damage to paddy rice fields in north-western Nigeria. We validated the RF classification method and the unsupervised floodwater detection algorithm used in this research. We demonstrated their reliability and applicability by using a manually labelled dataset related to a devastating flood event in northern Nigeria in August/September 2020. Additionally, we developed a land suitability model to evaluate potential areas for paddy rice cultivation. This model considers natural flooding and irrigation farming as strategies to help stakeholders mitigate flood disasters.
Our crop extent and LULC classifications achieved an overall accuracy of between 93% and 95%. We used different combinations of multispectral features, remote sensing indices, and SAR polarizations to achieve these results. However, the PlanetScope visible and NIR bands, NDWI, and Sentinel-1 polarizations had an overall accuracy of 95% and the lowest class error. For example, in this particular combination, the precision, recall, and F1 scores were comparatively higher (precision/paddy rice = 0.96, water bodies = 0.92, barren = 0.93, recall/paddy rice = 0.98, water bodies = 0.50, barren = 0.94, and F1/paddy rice = 0.97, water bodies = 0.63, barren = 0.94) than those obtained for the other scenarios. Based on the F-scores, the class error for water bodies in this combination was reduced by 26% compared to using only the PlanetScope data.
For flood mapping, both the PlanetScope bands and Sentinel-1 achieved an overall accuracy of 99%. The validation results for the flood extent acquired based on Otsu’s segmentation algorithms achieved an overall accuracy of 76%. We found that about 60% of the paddy rice fields were damaged by the flood event. Our adaptation strategy, based on land suitability evaluation, suggests that there is more land suitable for cultivation under a natural flood than is currently being cultivated. We proposed several recommendations as adaptation measures for stakeholders to improve livelihoods and mitigate flood disasters. The methodology developed in this study, based on high-resolution data, has the potential to be expanded to other areas within Nigeria, for the entire country, or at a regional scale. Future studies concerning shifting crop calendars to ensure early harvest and rainwater harvesting methods could strengthen the adaptation methods.
Author Contributions
Conceptualization, S.I.; methodology, S.I.; software, S.I.; validation, S.I.; formal analysis, S.I.; investigation, S.I.; resources, H.B.; data curation, S.I.; writing—original draft preparation, S.I.; writing—review and editing, S.I. and H.B.; visualization, S.I.; supervision, H.B.; project administration, S.I. and H.B.; funding acquisition, S.I. All authors have read and agreed to the published version of the manuscript.
Funding
This research was funded by the Tertiary Education Trust Fund of Nigeria HB was supported by the Natural Environment Research Council of the UK through the National Centre for Earth Observation.
Data Availability Statement
Data is available upon reasonable request.
Acknowledgments
The authors wish to acknowledge the support from the University of Leicester’s Institute for Environmental Futures, Space Park Leicester.
Conflicts of Interest
The authors declare no conflicts of interest.
Appendix A
Table A1.
Parameters used, sources of data, and suitability rating.
Table A1.
Parameters used, sources of data, and suitability rating.
| No | Parameters | Source of Data | Sub-Criteria | RF | RNF | IR |
|---|---|---|---|---|---|---|
| 1 | Precipitation (mm/year) | Climate Hazards group InfraRed Precipitation with Station (CHIRPS) data | 800–830 | 3 | 3 | 4 |
| 831–860 | 4 | 4 | 5 | |||
| 861–947 | 5 | 5 | 3 | |||
| 2 | Flood/non-flood (PlanetScope) | From this study | Flood | 1 | 5 | |
| Non-flood | 5 | 1 | ||||
| 3 | Slope (⸰) | Derived from the 30 m Shuttle Radar Topographic Mission (SRTM) Digital Elevation Model (DEM) | ≤3 | 5 | 5 | 5 |
| 4–6 | 4 | 4 | 4 | |||
| 4–15 | 3 | 3 | 3 | |||
| >15 | 1 | 1 | 1 | |||
| Soil texture | Sandy clay | 1 | 1 | 1 | ||
| 4 | Sand, loamy sand, sandy loam, sandy clay loam | 2 | 2 | 2 | ||
| Loam, silt loam, | 4 | 4 | 4 | |||
| Silty clay loam, clay, clay loam, | 5 | 5 | 5 | |||
| 5 | Soil drainage | Very poor | 5 | 5 | 5 | |
| Poor | 4 | 4 | 4 | |||
| Imperfect, moderately well | 3 | 3 | 3 | |||
| Well | 2 | 2 | 2 | |||
| Somewhat excessive | 1 | 1 | 1 | |||
| 6 | Land use (PlanetScope) | From this study | Paddy rice fields | 5 | - | 5 |
| Barren | 3 | - | 3 | |||
| Water bodies | 1 | - | 1 | |||
| 7 | Soil PH | ISDASOIL/Africa/v1/ph | 0–6.0 | 4 | 4 | 4 |
| 6.1–6.6 | 5 | 5 | 5 | |||
| 8 | Elevation (m) | 30 m Shuttle Radar Topographic Mission (SRTM) Digital Elevation Model (DEM) | 194–210 | 5 | 5 | 5 |
| 211–225 | 4 | 4 | 4 | |||
| 226–235 | 3 | 3 | 3 | |||
| 9 | Soil depth (cm) | 150–300 | 5 | 5 | 5 | |
| 100–150 | 4 | 4 | 4 | |||
| 50–100 | 3 | 3 | 3 | |||
| 10–50 | 2 | 2 | 2 | |||
| >10 | 1 | 1 | 1 | |||
| 10 | Soil organic carbon (% weight) | 1.0–2.0 | 2 | 2 | 2 | |
| 3–7 | 3 | 3 | 3 | |||
| 8.0–11 | 4 | 4 | 4 | |||
| 12–15 | 5 | 5 | 5 |
References
- Raza, A.; Razzaq, A.; Mehmood, S.S.; Zou, X.; Zhang, X.; Lv, Y.; Xu, J. Impact of Climate Change on Crops Adaptation and Strategies to Tackle Its Outcome: A Review. Plants 2019, 8, 34. [Google Scholar] [CrossRef] [PubMed]
- Jägermeyr, J.; Müller, C.; Ruane, A.C.; Elliott, J.; Balkovic, J.; Castillo, O.; Faye, B.; Foster, I.; Folberth, C.; Franke, J.A.; et al. Climate impacts on global agriculture emerge earlier in new generation of climate and crop models. Nat. Food 2021, 2, 873–885. [Google Scholar] [CrossRef]
- Kim, W.; Iizumi, T.; Hosokawa, N.; Tanoue, M.; Hirabayashi, Y. Flood impacts on global crop production: Advances and limitations. Environ. Res. Lett. 2023, 18, 054007. [Google Scholar] [CrossRef]
- CRED UNDRR. Economic Losses, Poverty & Disasters 1998–2017; Université Catholique de Louvain (UCL): Brussels, Belgium, 2018; Volume 33. [Google Scholar]
- CRED UNDRR. Human Cost of Disasters. An Overview of the Last 20 Years: 2000–2019; CRED UNDRR: Geneva, Switzerland, 2020. [Google Scholar]
- Nkwunonwo, U.C.; Malcolm, W.; Baily, B. Geography & Natural Disasters: Flooding and Flood Risk Reduction in Nigeria: Cardinal Gaps. Geogr. Nat. Resour. 2015, 5, 116–128. [Google Scholar] [CrossRef]
- Echendu, A.J. The impact of flooding on Nigeria’s sustainable development goals (SDGs). Ecosyst. Health Sustain. 2020, 6, 1791735. [Google Scholar] [CrossRef]
- Mashi, S.A.; Oghenejabor, O.D.; Inkani, A.I. Disaster risks and management policies and practices in Nigeria: A critical appraisal of the National Emergency Management Agency Act. Int. J. Disaster Risk Reduct. 2019, 33, 253–265. [Google Scholar] [CrossRef]
- Albris, K.; Lauta, K.C.; Raju, E. Strengthening Governance for Disaster Prevention: The Enhancing Risk Management Capabilities Guidelines. Int. J. Disaster Risk Reduct. 2020, 47, 101647. [Google Scholar] [CrossRef]
- UNISDR (United Nations International Strategy for Disaster Reduction). Global Assessment Report on Disaster Risk Reduction; UNISDR: Geneva, Switzerland, 2015. [Google Scholar]
- Eseosa Halima, I.; Hiroaki, S. Assessing the disparities of the population exposed to flood hazards in Nigeria. IOP Conf. Ser. Earth Environ. Sci. 2022, 1016, 012007. [Google Scholar] [CrossRef]
- Umar, N.; Gray, A. Flooding in Nigeria: A review of its occurrence and impacts and approaches to modelling flood data. Int. J. Environ. Stud. 2023, 80, 540–561. [Google Scholar] [CrossRef]
- Cirella, G.T.; Iyalomhe, F.O.; Adekola, P.O. Determinants of Flooding and Strategies for Mitigation: Two-Year Case Study of Benin City. Geosciences 2019, 9, 136. [Google Scholar] [CrossRef]
- Nkwunonwo, U.C. A Review of Flooding and Flood Risk Reduction in Nigeria. Glob. J. Hum. Soc. Sci. B Geogr. Geo-Sci. Environ. Sci. Disaster Manag. 2016, 16, 22–42. [Google Scholar]
- Alves, B.; Angnuureng, D.B.; Morand, P.; Almar, R. A review on coastal erosion and flooding risks and best management practices in West Africa: What has been done and should be done. J. Coast. Conserv. 2020, 24, 38. [Google Scholar] [CrossRef]
- Ogunkan, D.V. Achieving sustainable environmental governance in Nigeria: A review for policy consideration. Urban Gov. 2022, 2, 212–220. [Google Scholar] [CrossRef]
- Akamabe, U.B.; Kpae, G. A critique on Nigeria national policy on environment: Reasons for policy review. IIARD Int. J. Geogr. Environ. Manag. 2017, 3, 22–36. [Google Scholar]
- Tabari, H. Climate change impact on flood and extreme precipitation increases with water availability. Sci. Rep. 2020, 10, 13768. [Google Scholar] [CrossRef]
- Adeite, A. Interesting Facts about Rice Farming in Nigeria. 2024. Available online: https://usafricaagrialliance.com/2024/07/24/agriculture-in-nigeria-7-interesting-facts-statistics (accessed on 11 September 2024).
- FGN. National Rice Development Strategy I. 2020. Available online: https://riceforafrica.net/wp-content/uploads/2022/02/nigeria_nrds2.pdf (accessed on 11 September 2024).
- Balzter, H.; Macul, M.; Delaney, B.; Tansey, K.; Espirito-Santo, F.; Ofoegbu, C.; Petrovskii, S.; Forchtner, B.; Nicholes, N.; Payo, E.; et al. Loss and Damage from Climate Change: Knowledge Gaps and Interdisciplinary Approaches. Sustainability 2023, 15, 11864. [Google Scholar] [CrossRef]
- Schumann, G.J.-P.; Brakenridge, G.R.; Kettner, A.J.; Kashif, R.; Niebuhr, E. Assisting Flood Disaster Response with Earth Observation Data and Products: A Critical Assessment. Remote Sens. 2018, 10, 1230. [Google Scholar] [CrossRef]
- Schumann, G.J. The Full Potential of EO for Flood Applications: Managing Expectations. In Earth Observation for Flood Applications; Elsevier: Amsterdam, The Netherlands, 2021; pp. 305–320. [Google Scholar]
- Martinis, S.; Wieland, M.; Rättich, M. Chapter 2—An Automatic System for Near-Real Time Flood Extent and Duration Mapping Based on Multi-Sensor Satellite Data. In Earth Observation for Flood Applications; Schumann, G.J.P., Ed.; Elsevier: Amsterdam, The Netherlands, 2021; pp. 7–37. [Google Scholar]
- Rättich, M.; Martinis, S.; Wieland, M. Automatic Flood Duration Estimation Based on Multi-Sensor Satellite Data. Remote Sens. 2020, 12, 643. [Google Scholar] [CrossRef]
- Boryan, C.G.; Yang, Z.; Sandborn, A.; Willis, P.; Haack, B. Operational agricultural flood monitoring with Sentinel-1 synthetic aperture radar. In Proceedings of the IGARSS 2018—2018 IEEE International Geoscience and Remote Sensing Symposium, Valencia, Spain, 22–27 July 2018; pp. 5831–5834. [Google Scholar]
- Schumann, G.J. Earth Observation for Flood Applications: Progress and Perspectives. In Earth Observation for Flood Applications; Elsevier: Amsterdam, The Netherlands, 2021; pp. 3–6. [Google Scholar]
- Otsu, N. A Threshold Selection Method from Gray-Level Histograms. IEEE Trans. Syst. Man Cybern. 1979, 9, 62–66. [Google Scholar] [CrossRef]
- Kapur, J.N.; Sahoo, P.K.; Wong, A.K.C. A new method for gray-level picture thresholding using the entropy of the histogram. Comput. Vis. Graph. Image Process. 1985, 29, 273–285. [Google Scholar] [CrossRef]
- Kittler, J.; Illingworth, J. Minimum error thresholding. Pattern Recognit. 1986, 19, 41–47. [Google Scholar] [CrossRef]
- Amitrano, D.; Martino, G.D.; Iodice, A.; Riccio, D.; Ruello, G. Unsupervised Rapid Flood Mapping Using Sentinel-1 GRD SAR Images. IEEE Trans. Geosci. Remote Sens. 2018, 56, 3290–3299. [Google Scholar] [CrossRef]
- Markert, K.N.; Markert, A.M.; Mayer, T.; Nauman, C.; Haag, A.; Poortinga, A.; Bhandari, B.; Thwal, N.S.; Kunlamai, T.; Chishtie, F.; et al. Comparing Sentinel-1 Surface Water Mapping Algorithms and Radiometric Terrain Correction Processing in Southeast Asia Utilizing Google Earth Engine. Remote Sens. 2020, 12, 2469. [Google Scholar] [CrossRef]
- Vanama, V.S.K.; Mandal, D.; Rao, Y. GEE4FLOOD: Rapid mapping of flood areas using temporal Sentinel-1 SAR images with Google Earth Engine cloud platform. J. Appl. Remote Sens. 2020, 14, 034505. [Google Scholar] [CrossRef]
- Psomiadis, E.; Diakakis, M.; Soulis, K.X. Combining SAR and Optical Earth Observation with Hydraulic Simulation for Flood Mapping and Impact Assessment. Remote Sens. 2020, 12, 3980. [Google Scholar] [CrossRef]
- Ibrahim, S.A. Improving Land Use/Cover Classification Accuracy from Random Forest Feature Importance Selection Based on Synergistic Use of Sentinel Data and Digital Elevation Model in Agriculturally Dominated Landscape. Agriculture 2023, 13, 98. [Google Scholar] [CrossRef]
- Zare, M.; Schumann, G.J.P. Chapter 15—Emerging Techniques in Machine Learning for Processing Satellite Images of Floods. In Earth Observation for Flood Applications; Schumann, G.J.P., Ed.; Elsevier: Amsterdam, The Netherlands, 2021; pp. 321–336. [Google Scholar]
- Balzter, H.; Cole, B.; Thiel, C.; Schmullius, C. Mapping CORINE Land Cover from Sentinel-1A SAR and SRTM Digital Elevation Model Data using Random Forests. Remote Sens. 2015, 7, 14876–14898. [Google Scholar] [CrossRef]
- Maxwell, A.E.; Warner, T.A.; Fang, F. Implementation of machine-learning classification in remote sensing: An applied review. Int. J. Remote Sens. 2018, 39, 2784–2817. [Google Scholar] [CrossRef]
- FAO. Land Evaluation towards a Revised Framework; Food and Agriculture Organization of the United Nations: Rome, Italy, 1976. [Google Scholar]
- Verheye, W.; Koohafkan, A.; Nachtergaele, F. The FAO guidelines for land evaluation. Encycl. Land Use Land Cover Soil Sci. Land Eval. 2009, 2, 78–100. [Google Scholar]
- FAO. The Impact of Disasters and Crises on Agriculture and Food Security; FAO: Rome, Italy, 2018. [Google Scholar]
- Akpoti, K.; Kabo-bah, A.T.; Zwart, S.J. Review—Agricultural land suitability analysis: State-of-the-art and outlooks for integration of climate change analysis. Agric. Syst. 2019, 173, 172–208. [Google Scholar] [CrossRef]
- Ferguson, A.; Murray, C.; Mesfin Tessema, Y.; McKeown, P.C.; Reymondin, L.; Loboguerrero, A.M.; Talsma, T.; Allen, B.; Jarvis, A.; Golden, A. Can remote sensing enable a Biomass Climate Adaptation Index for agricultural systems? Front. Clim. 2022, 4, 938975. [Google Scholar] [CrossRef]
- Pachauri, R.K.; Reisinger, A. Climate Change 2007: Synthesis Report. Contribution of Working Groups I, II and III to the Fourth Assessment Report of the Intergovernmental Panel on Climate Change; Climate Change 2007. Working Groups I, II and III to the Fourth Assessment; IPCC: Geneva, Switzerland, 2007. [Google Scholar]
- Mazahreh, S.; Bsoul, M.; Hamoor, D.A. GIS approach for assessment of land suitability for different land use alternatives in semi arid environment in Jordan: Case study (Al Gadeer Alabyad-Mafraq). Inf. Process. Agric. 2019, 6, 91–108. [Google Scholar] [CrossRef]
- Vanguard. Inside Kebbi’s Floods of Fury, Pains and Tears; Vanguard Media: Northbridge, Australia, 2020. [Google Scholar]
- Vanguard. Kebbi Rice Farmers Lost N1bn to Flood—Official; Vanguard Media: Northbridge, Australia, 2020. [Google Scholar]
- Sedano, F.; Molini, V.; Azad, M.A.K. A Mapping Framework to Characterize Land Use in the Sudan-Sahel Region from Dense Stacks of Landsat Data. Remote Sens. 2019, 11, 648. [Google Scholar] [CrossRef]
- PlanetLabs. Planet To Launch 36 SuperDove Satellites with SpaceX. Available online: https://www.planet.com/pulse/planet-to-launch-36-superdove-satellites-with-spacex/ (accessed on 15 March 2024).
- PlanetLabs. Planet Imagery Product Specifications; Planet Labs: San Francisco, CA, USA, 2018. [Google Scholar]
- Kotchenova, S.Y.; Vermote, E.F.; Matarrese, R.; Klemm, F.J., Jr. Validation of a vector version of the 6S radiative transfer code for atmospheric correction of satellite data. Part I: Path radiance. Appl. Opt. 2006, 45, 6762–6774. [Google Scholar] [CrossRef]
- Team, P. Planet Surface Reflectance Version 2.0. 2020. Available online: https://assets.planet.com/marketing/PDF/Planet_Surface_Reflectance_Technical_White_Paper.pdf (accessed on 23 February 2024).
- Huang, Y.; Van Genderen, J. Evaluation of several speckle filtering techniques for ERS-1&2 imagery. Int. Arch. Photogramm. Remote Sens. 1996, 31, 164–169. [Google Scholar]
- Farr, T.G.; Kobrick, M. Shuttle radar topography mission produces a wealth of data. Eos Trans. Am. Geophys. Union 2000, 81, 583–585. [Google Scholar] [CrossRef]
- Hengl, T.; Miller, M.A.E.; Križan, J.; Shepherd, K.D.; Sila, A.; Kilibarda, M.; Antonijević, O.; Glušica, L.; Dobermann, A.; Haefele, S.M.; et al. African soil properties and nutrients mapped at 30 m spatial resolution using two-scale ensemble machine learning. Sci. Rep. 2021, 11, 6130. [Google Scholar] [CrossRef] [PubMed]
- Breiman, L. Random Forests. Mach. Learn. 2001, 45, 5–32. [Google Scholar] [CrossRef]
- Liaw, A.; Wiener, M. Classification and regression by randomForest. R News 2002, 2, 18–22. [Google Scholar]
- Venkatappa, M.; Sasaki, N.; Han, P.; Abe, I. Impacts of droughts and floods on croplands and crop production in Southeast Asia—An application of Google Earth Engine. Sci. Total Environ. 2021, 795, 148829. [Google Scholar] [CrossRef] [PubMed]
- Teluguntla, P.; Thenkabail, P.S.; Xiong, J.; Gumma, M.K.; Giri, C.; Milesi, C.; Ozdogan, M.; Congalton, R.G.; Tilton, J. Global food security support analysis data at nominal 1 km (GFSAD1km) derived from remote sensing in support of food security in the twenty-first century: Current achievements and future possibilities. In Land Resources Monitoring, Modeling, and Mapping with Remote Sensing; CRC Press: Boca Raton, FL, USA, 2015; pp. 131–159. [Google Scholar]
- Qamer, F.M.; Abbas, S.; Ahmad, B.; Hussain, A.; Salman, A.; Muhammad, S.; Nawaz, M.; Shrestha, S.; Iqbal, B.; Thapa, S. A framework for multi-sensor satellite data to evaluate crop production losses: The case study of 2022 Pakistan floods. Sci. Rep. 2023, 13, 4240. [Google Scholar] [CrossRef]
- Zanaga, D.; Van De Kerchove, R.; Daems, D.; De Keersmaecker, W.; Brockmann, C.; Kirches, G.; Wevers, J.; Cartus, O.; Santoro, M.; Fritz, S. ESA WorldCover 10 m 2021 v200. 2022. Available online: https://pure.iiasa.ac.at/18478 (accessed on 23 January 2024).
- Rodriguez-Galiano, V.F.; Ghimire, B.; Rogan, J.; Chica-Olmo, M.; Rigol-Sanchez, J.P. An assessment of the effectiveness of a random forest classifier for land-cover classification. ISPRS J. Photogramm. Remote Sens. 2012, 67, 93–104. [Google Scholar] [CrossRef]
- Pelletier, C.; Valero, S.; Inglada, J.; Champion, N.; Dedieu, G. Assessing the robustness of Random Forests to map land cover with high resolution satellite image time series over large areas. Remote Sens. Environ. 2016, 187, 156–168. [Google Scholar] [CrossRef]
- Rouse, J.W.; Haas, R.H.; Schell, J.A.; Deering, D.W. Monitoring vegetation systems in the Great Plains with ERTS. NASA Spec. Publ. 1974, 351, 309. [Google Scholar]
- McFeeters, S.K. The use of the Normalized Difference Water Index (NDWI) in the delineation of open water features. Int. J. Remote Sens. 1996, 17, 1425–1432. [Google Scholar] [CrossRef]
- Buschmann, C.; Nagel, E. In vivo spectroscopy and internal optics of leaves as basis for remote sensing of vegetation. Int. J. Remote Sens. 1993, 14, 711–722. [Google Scholar] [CrossRef]
- Huete, A.R. A soil-adjusted vegetation index (SAVI). Remote Sens. Environ. 1988, 25, 295–309. [Google Scholar] [CrossRef]
- Topuz, M.; Deniz, M. Application of GIS and AHP for land use suitability analysis: Case of Demirci district (Turkey). Humanit. Soc. Sci. Commun. 2023, 10, 115. [Google Scholar] [CrossRef]
- Nabiollahi, K.; Kebonye, N.M.; Molani, F.; Tahari-Mehrjardi, M.H.; Taghizadeh-Mehrjardi, R.; Shokati, H.; Scholten, T. Assessment of Land Suitability Potential Using Ensemble Approaches of Advanced Multi-Criteria Decision Models and Machine Learning for Wheat Cultivation. Remote Sens. 2024, 16, 2566. [Google Scholar] [CrossRef]
- Das, A.C.; Noguchi, R.; Ahamed, T. Integrating an Expert System, GIS, and Satellite Remote Sensing to Evaluate Land Suitability for Sustainable Tea Production in Bangladesh. Remote Sens. 2020, 12, 4136. [Google Scholar] [CrossRef]
- Hussain, S.; Nasim, W.; Mubeen, M.; Fahad, S.; Tariq, A.; Karuppannan, S.; Alqadhi, S.; Mallick, J.; Almohamad, H.; Ghassan Abdo, H. Agricultural land suitability analysis of Southern Punjab, Pakistan using analytical hierarchy process (AHP) and multi-criteria decision analysis (MCDA) techniques. Cogent Food Agric. 2024, 10, 2294540. [Google Scholar] [CrossRef]
- FAO. Agriculture Organization of the United Nations, 1976. A framework for land evaluation. Soils Bull. 1976, 32. Available online: https://www.fao.org/4/x5310e/x5310e00.htm (accessed on 11 September 2024).
- Sys, C. Land Evaluation; State University of Ghent: Brussels, Belgium, 1985. [Google Scholar]
- Sheykhmousa, M.; Mahdianpari, M.; Ghanbari, H.; Mohammadimanesh, F.; Ghamisi, P.; Homayouni, S. Support Vector Machine Versus Random Forest for Remote Sensing Image Classification: A Meta-Analysis and Systematic Review. IEEE J. Sel. Top. Appl. Earth Obs. Remote Sens. 2020, 13, 6308–6325. [Google Scholar] [CrossRef]
- Billah, M.; Islam, A.K.M.S.; Mamoon, W.B.; Rahman, M.R. Random forest classifications for landuse mapping to assess rapid flood damage using Sentinel-1 and Sentinel-2 data. Remote Sens. Appl. Soc. Environ. 2023, 30, 100947. [Google Scholar] [CrossRef]
- Singha, M.; Dong, J.; Sarmah, S.; You, N.; Zhou, Y.; Zhang, G.; Doughty, R.; Xiao, X. Identifying floods and flood-affected paddy rice fields in Bangladesh based on Sentinel-1 imagery and Google Earth Engine. ISPRS J. Photogramm. Remote Sens. 2020, 166, 278–293. [Google Scholar] [CrossRef]
- Albertini, C.; Gioia, A.; Iacobellis, V.; Manfreda, S. Detection of Surface Water and Floods with Multispectral Satellites. Remote Sens. 2022, 14, 6005. [Google Scholar] [CrossRef]
- Foroughnia, F.; Alfieri, S.M.; Menenti, M.; Lindenbergh, R. Evaluation of SAR and Optical Data for Flood Delineation Using Supervised and Unsupervised Classification. Remote Sens. 2022, 14, 3718. [Google Scholar] [CrossRef]
- Guan, H.; Huang, J.; Li, L.; Li, X.; Miao, S.; Su, W.; Ma, Y.; Niu, Q.; Huang, H. Improved Gaussian mixture model to map the flooded crops of VV and VH polarization data. Remote Sens. Environ. 2023, 295, 113714. [Google Scholar] [CrossRef]
- Nasirzadehdizaji, R.; Cakir, Z.; Balik Sanli, F.; Abdikan, S.; Pepe, A.; Calò, F. Sentinel-1 interferometric coherence and backscattering analysis for crop monitoring. Comput. Electron. Agric. 2021, 185, 106118. [Google Scholar] [CrossRef]
- Usigbe, L. Dogged by Massive Floods, Nigeria Ramps Up Actions to Tackle Climate Crisis. Africa Renewal November 2021. Available online: https://www.un.org/africarenewal/magazine/november-2021/dogged-massive-floods-nigeria-ramps-actions-tackle-climate-crisis (accessed on 14 February 2024).
- Akinsanola, A.A.; Zhou, W. Understanding the Variability of West African Summer Monsoon Rainfall: Contrasting Tropospheric Features and Monsoon Index. Atmosphere 2020, 11, 309. [Google Scholar] [CrossRef]
- Diallo, I.; Giorgi, F.; Deme, A.; Tall, M.; Mariotti, L.; Gaye, A.T. Projected changes of summer monsoon extremes and hydroclimatic regimes over West Africa for the twenty-first century. Clim. Dyn. 2016, 47, 3931–3954. [Google Scholar] [CrossRef]
- Seneviratne, S.I.; Zhang, X.; Adnan, M.; Badi, W.; Dereczynski, C.; Di Luca, A.; Ghosh, S.; Iskander, I.; Kossin, J.; Lewis, S. Weather and climate extreme events in a changing climate. In Climate Change 2021: The Physical Science Basis: Working Group I Contribution to the Sixth Assessment Report of the Intergovernmental Panel on Climate Change; Masson-Delmotte, V.P., Zhai, A., Pirani, S.L., Connors, C., Eds.; Cambridge University Press: Cambridge, UK, 2021; Chapter 11. [Google Scholar]
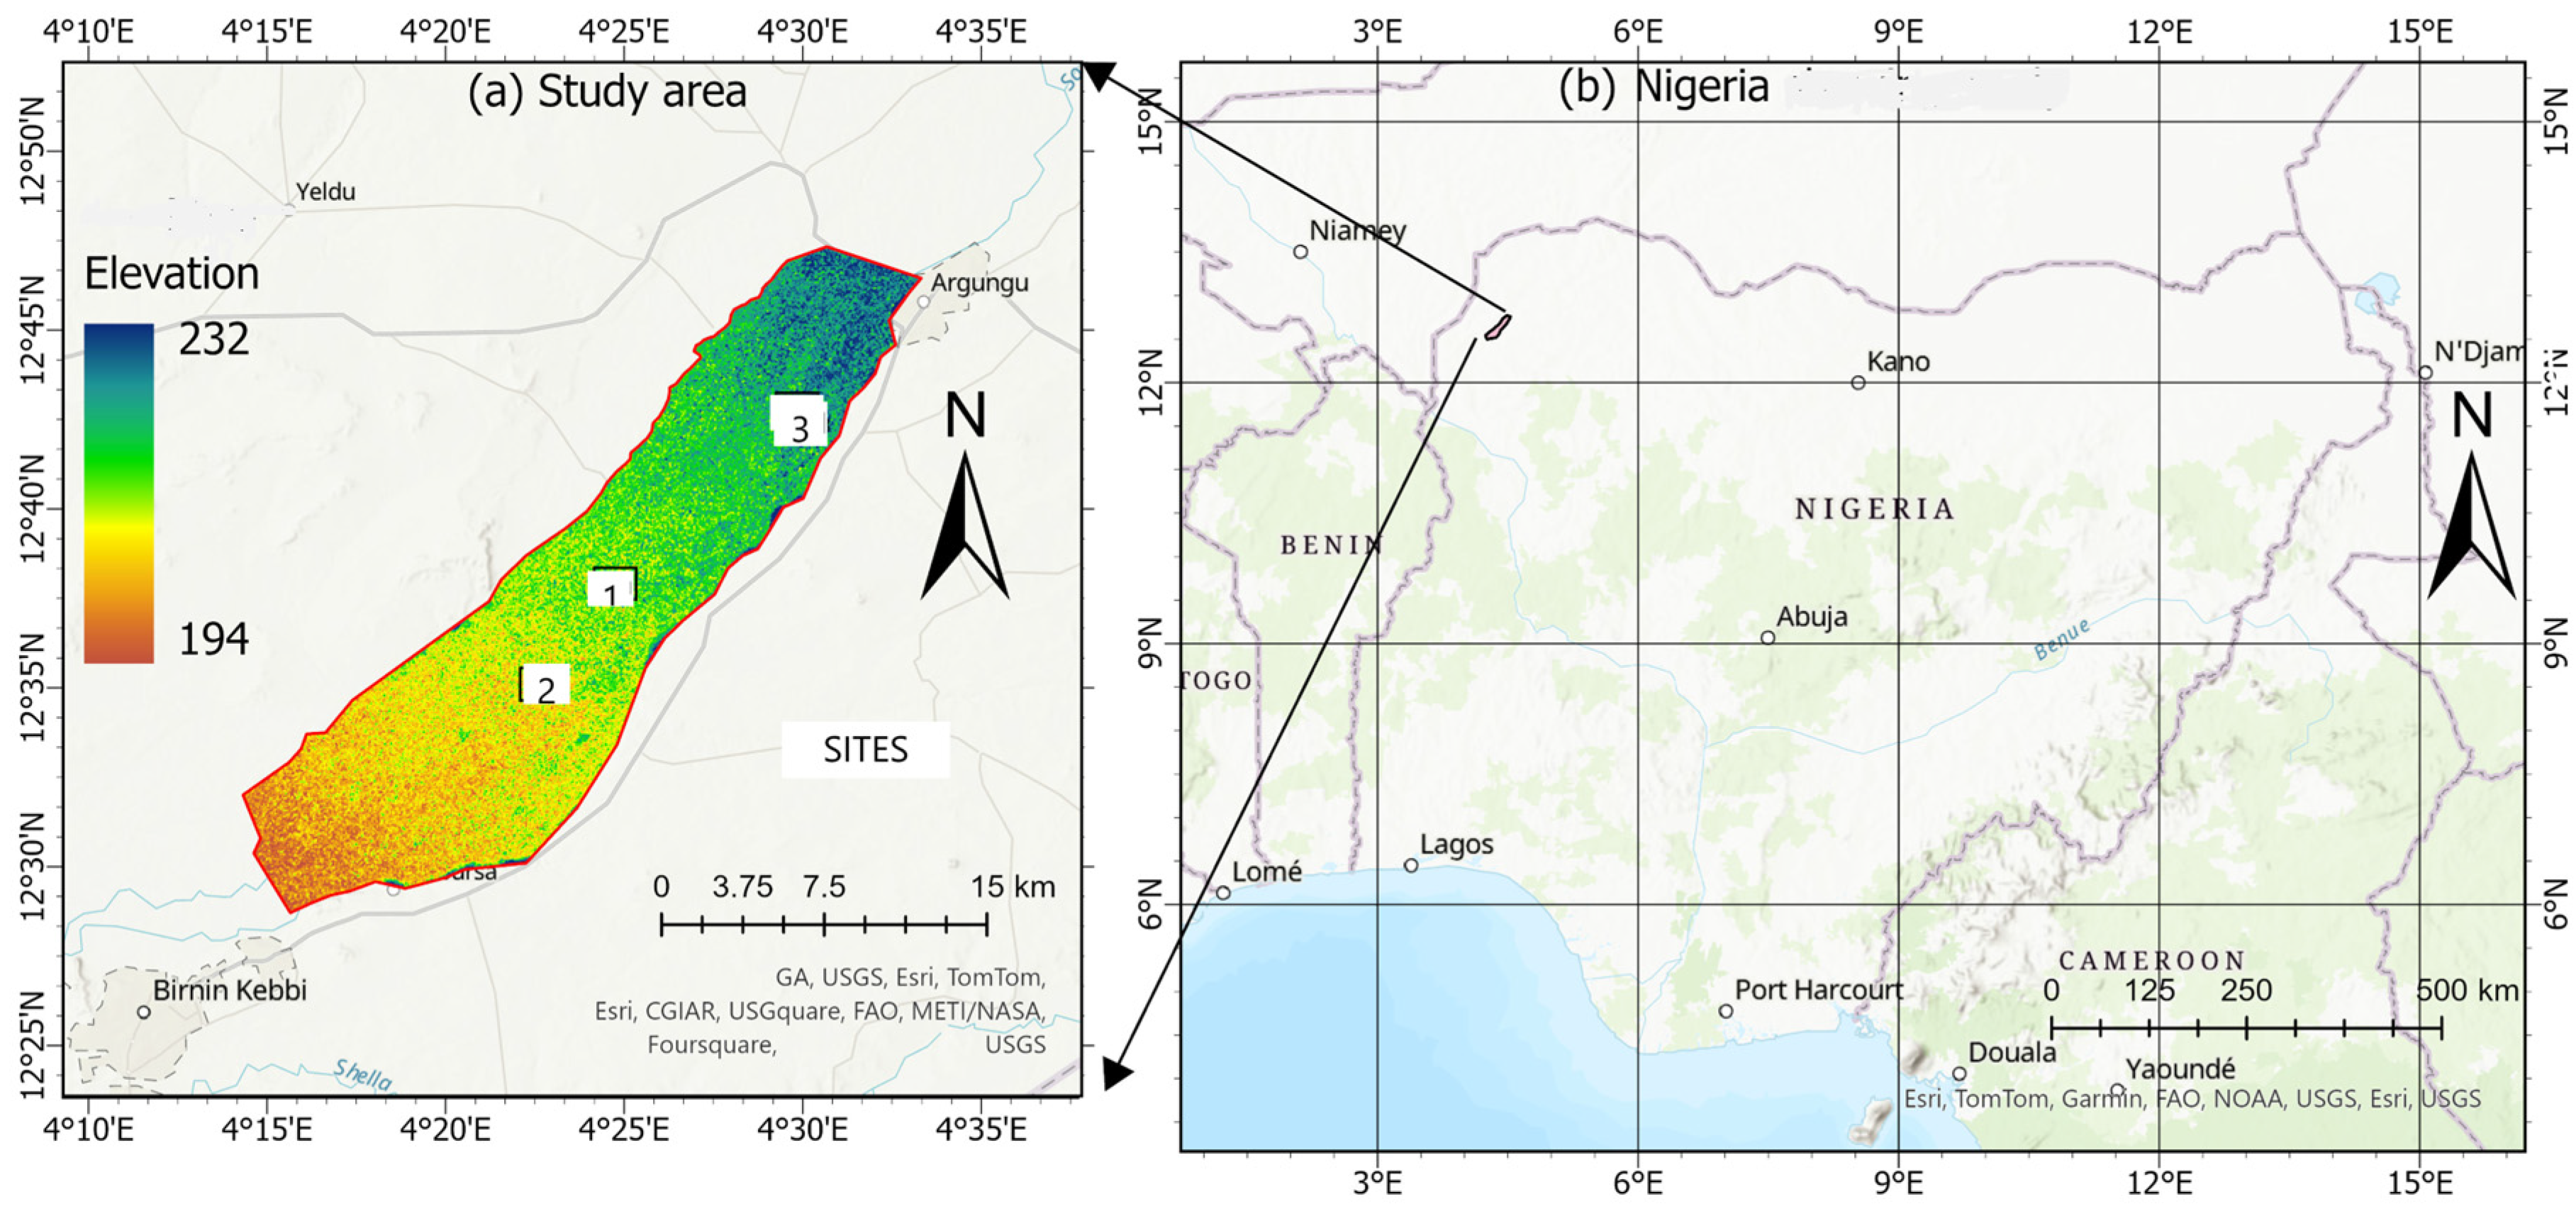
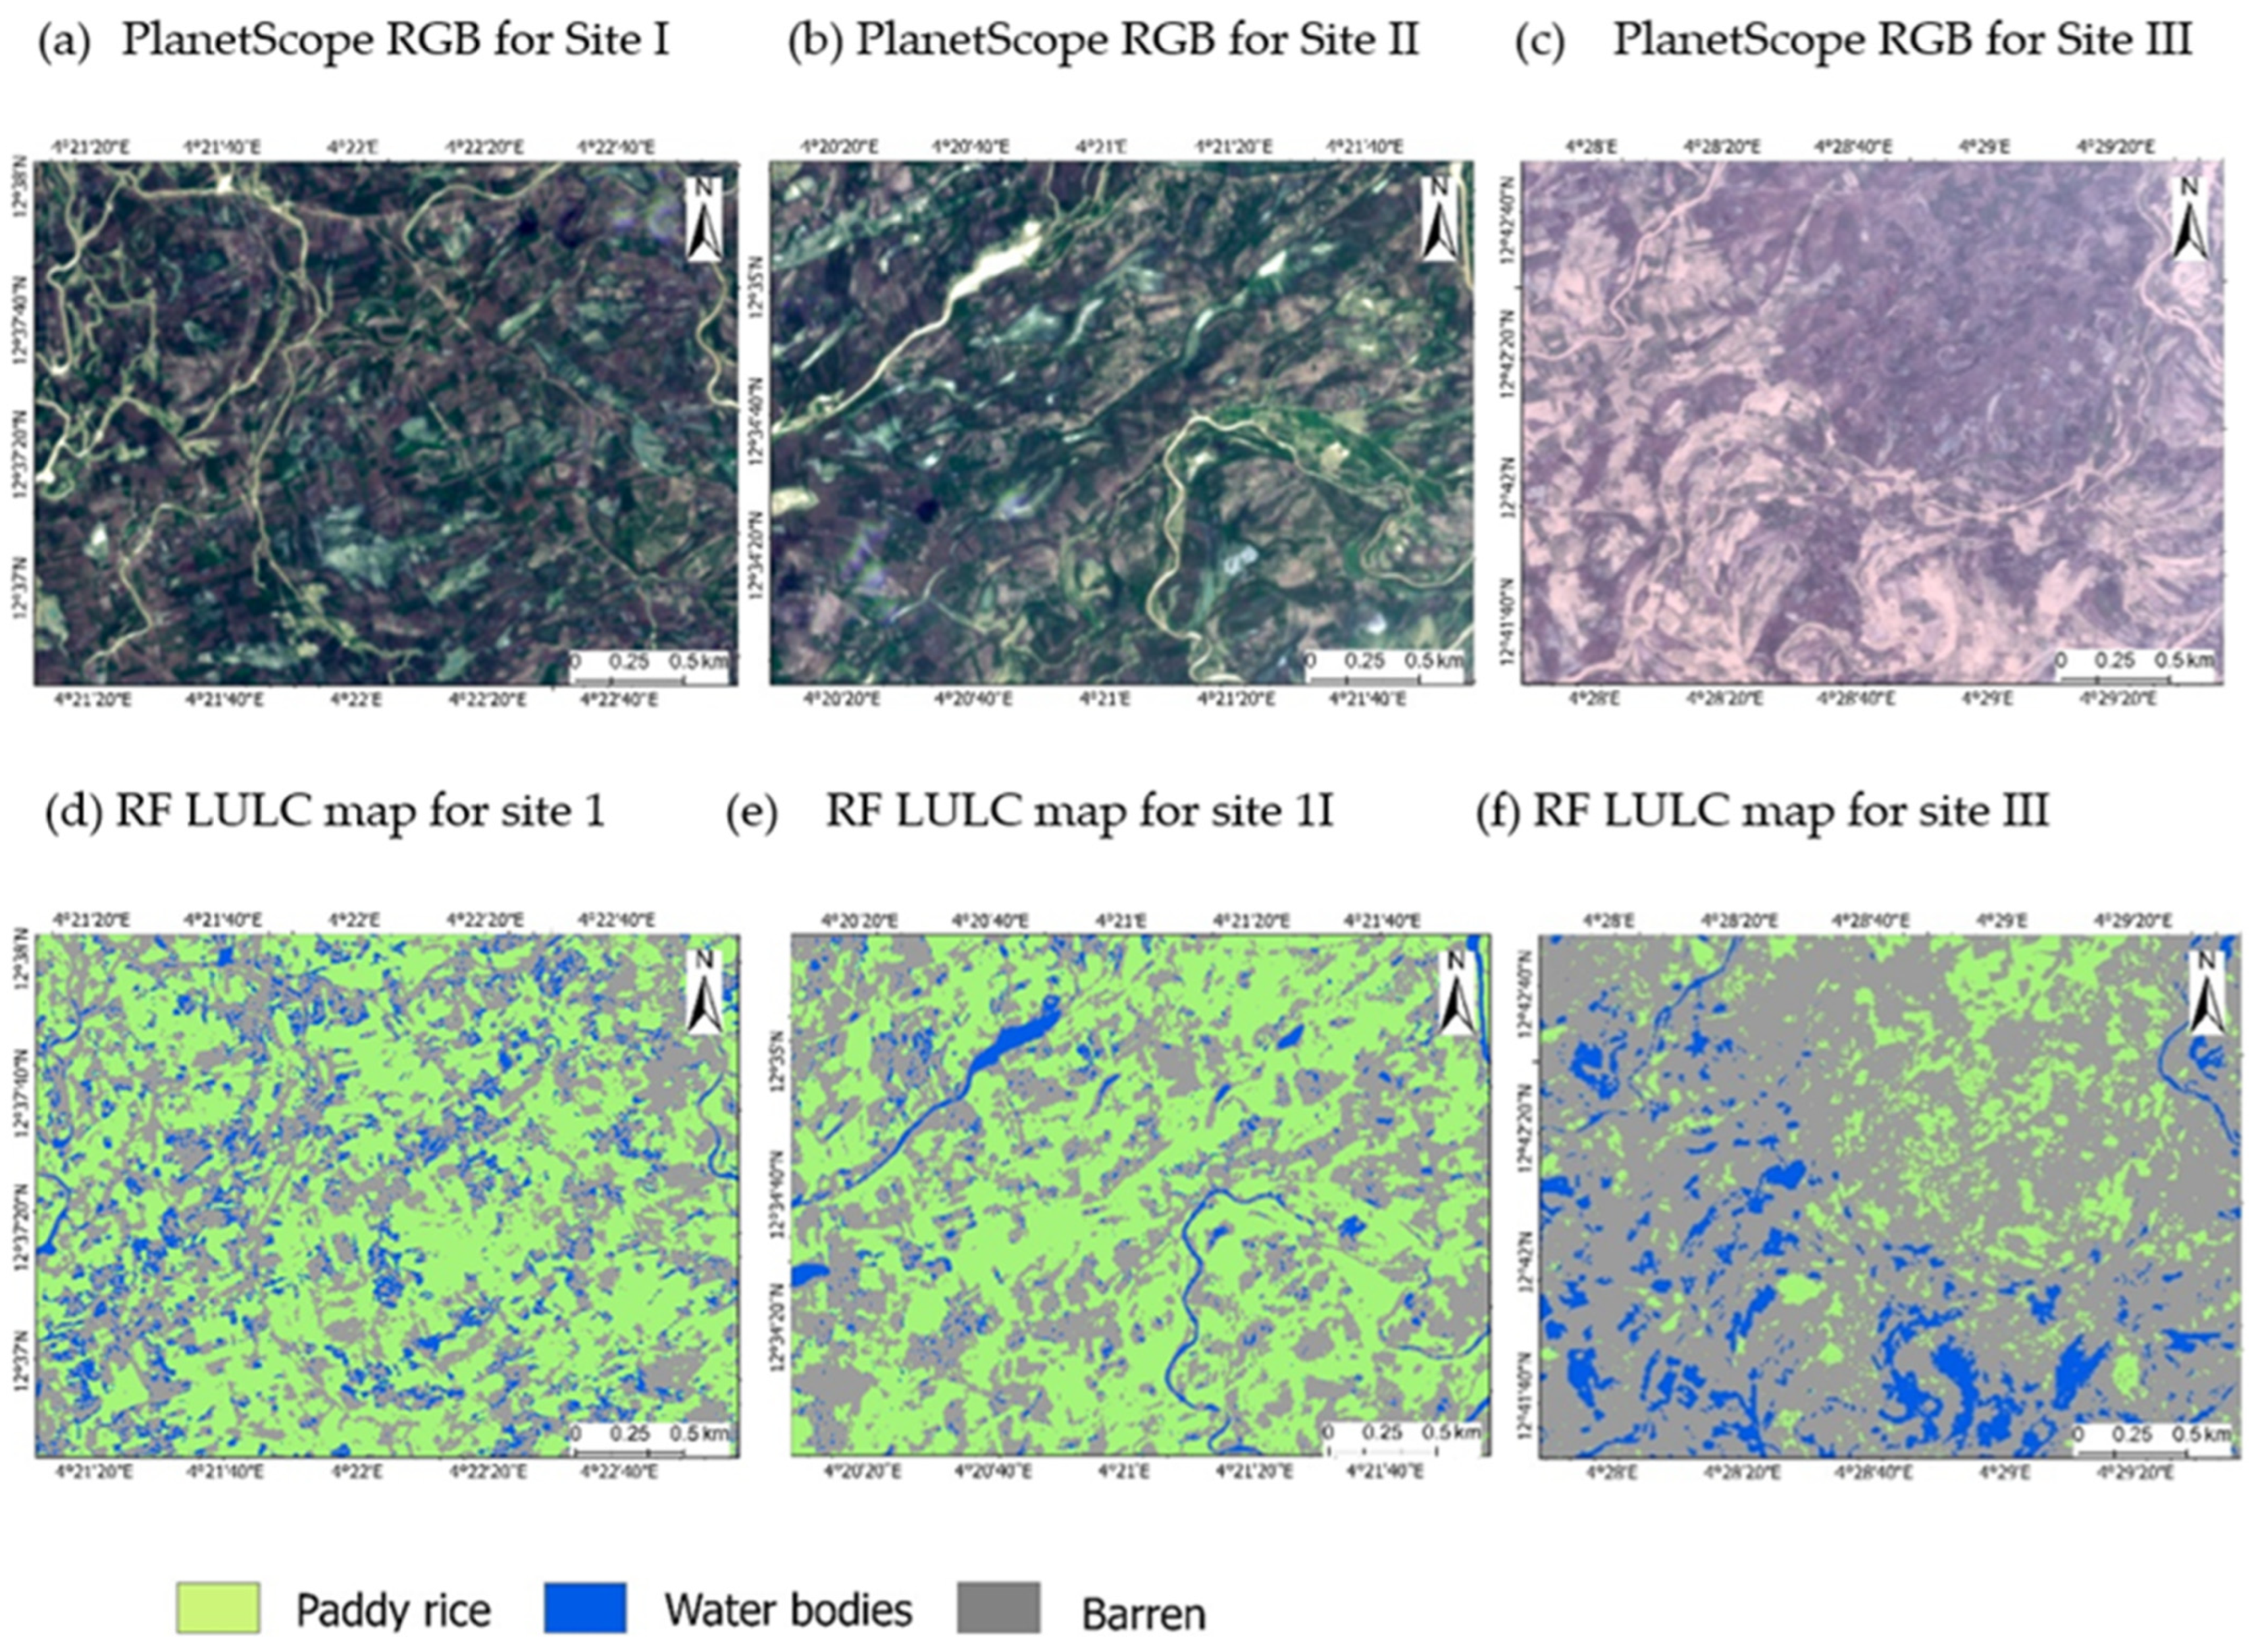
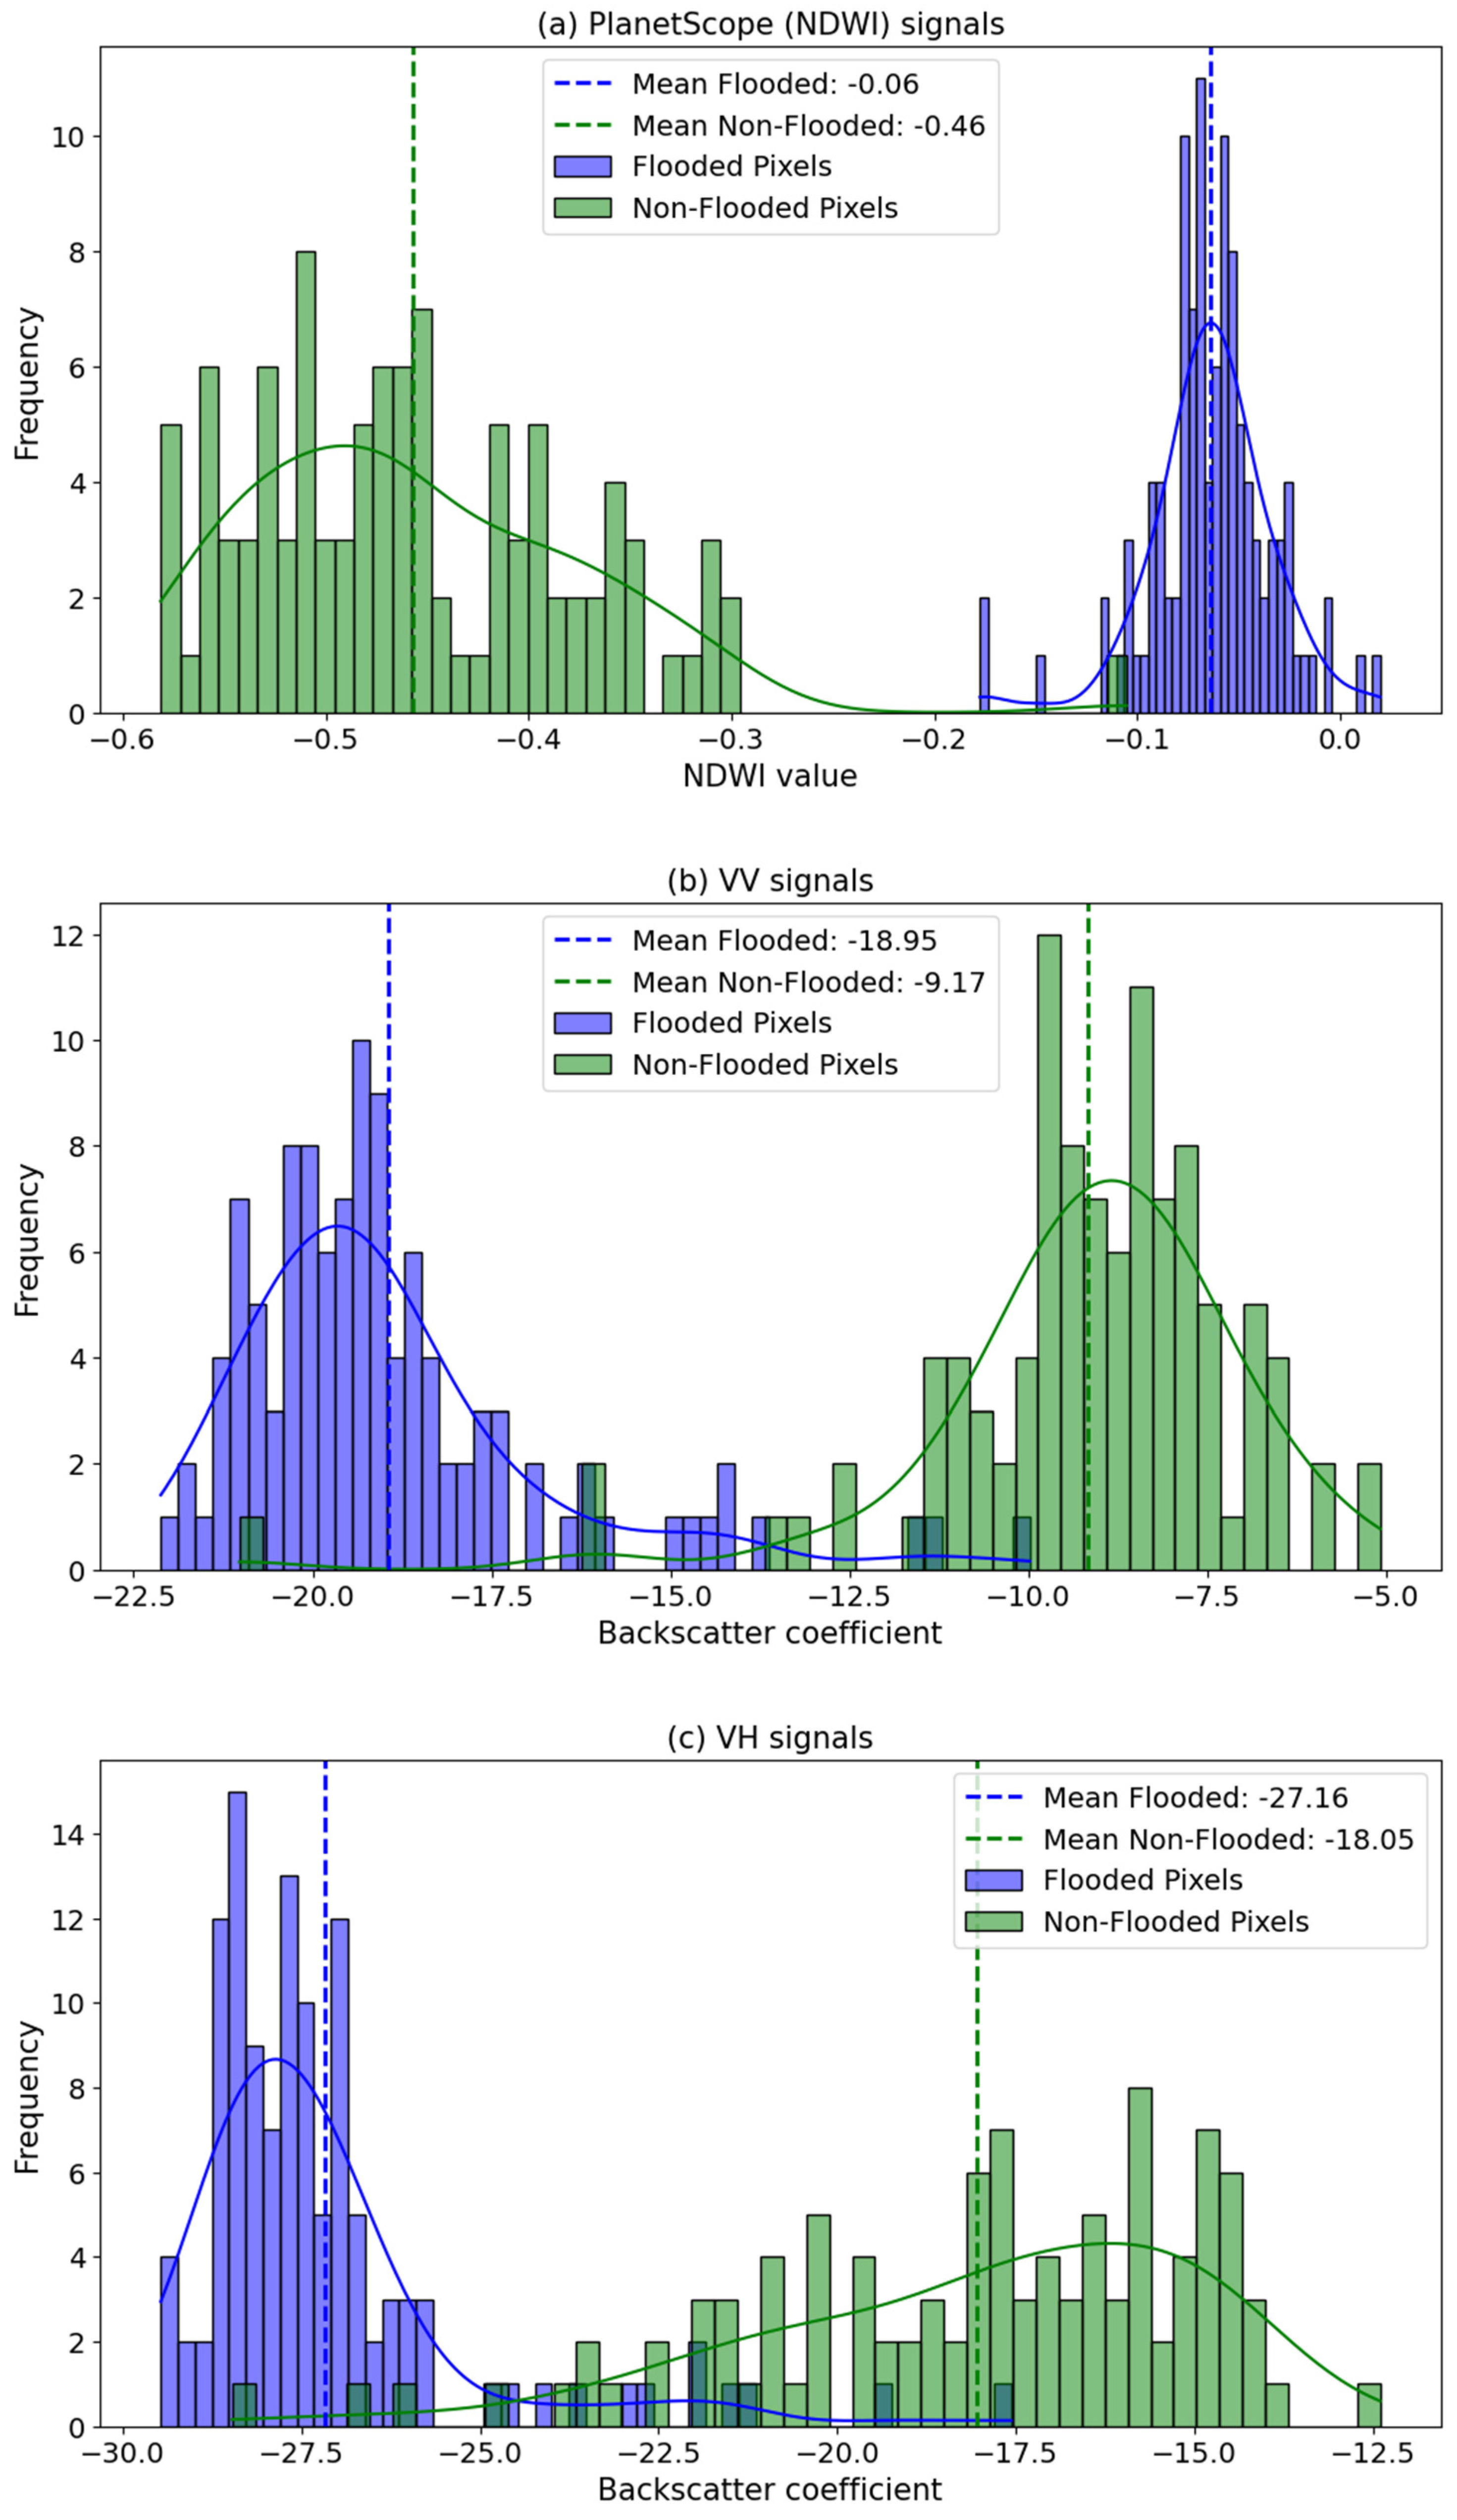
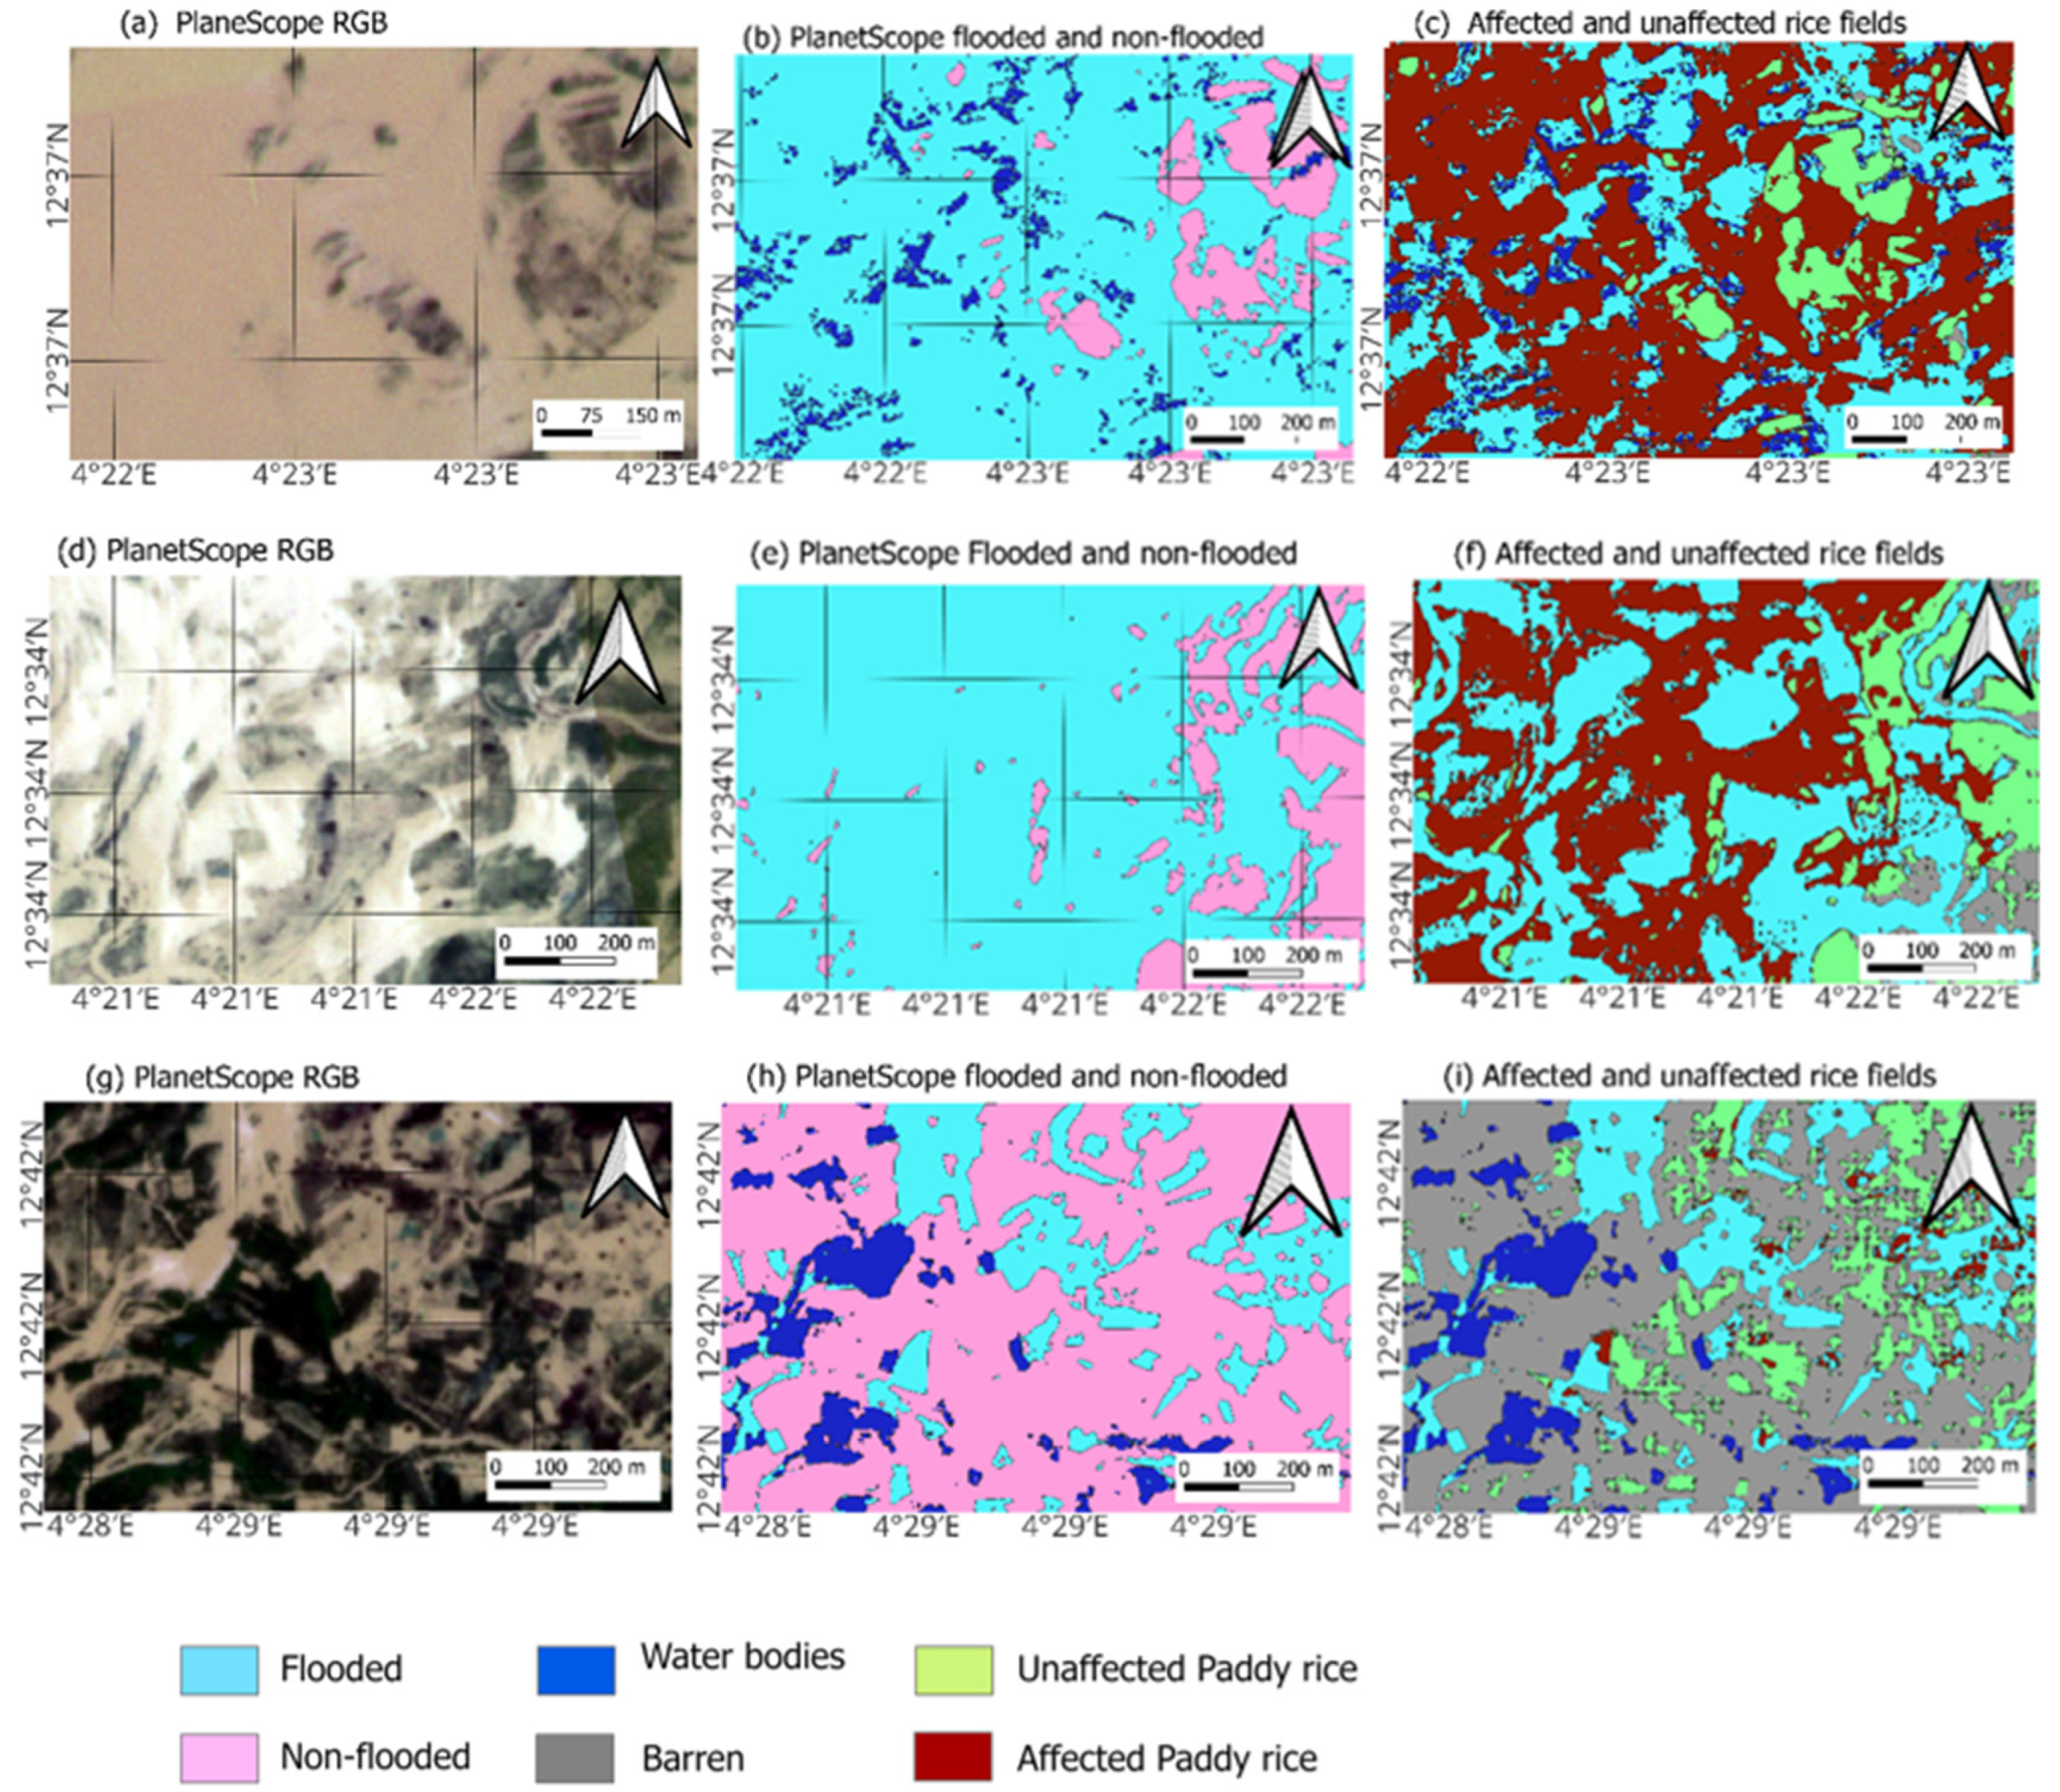
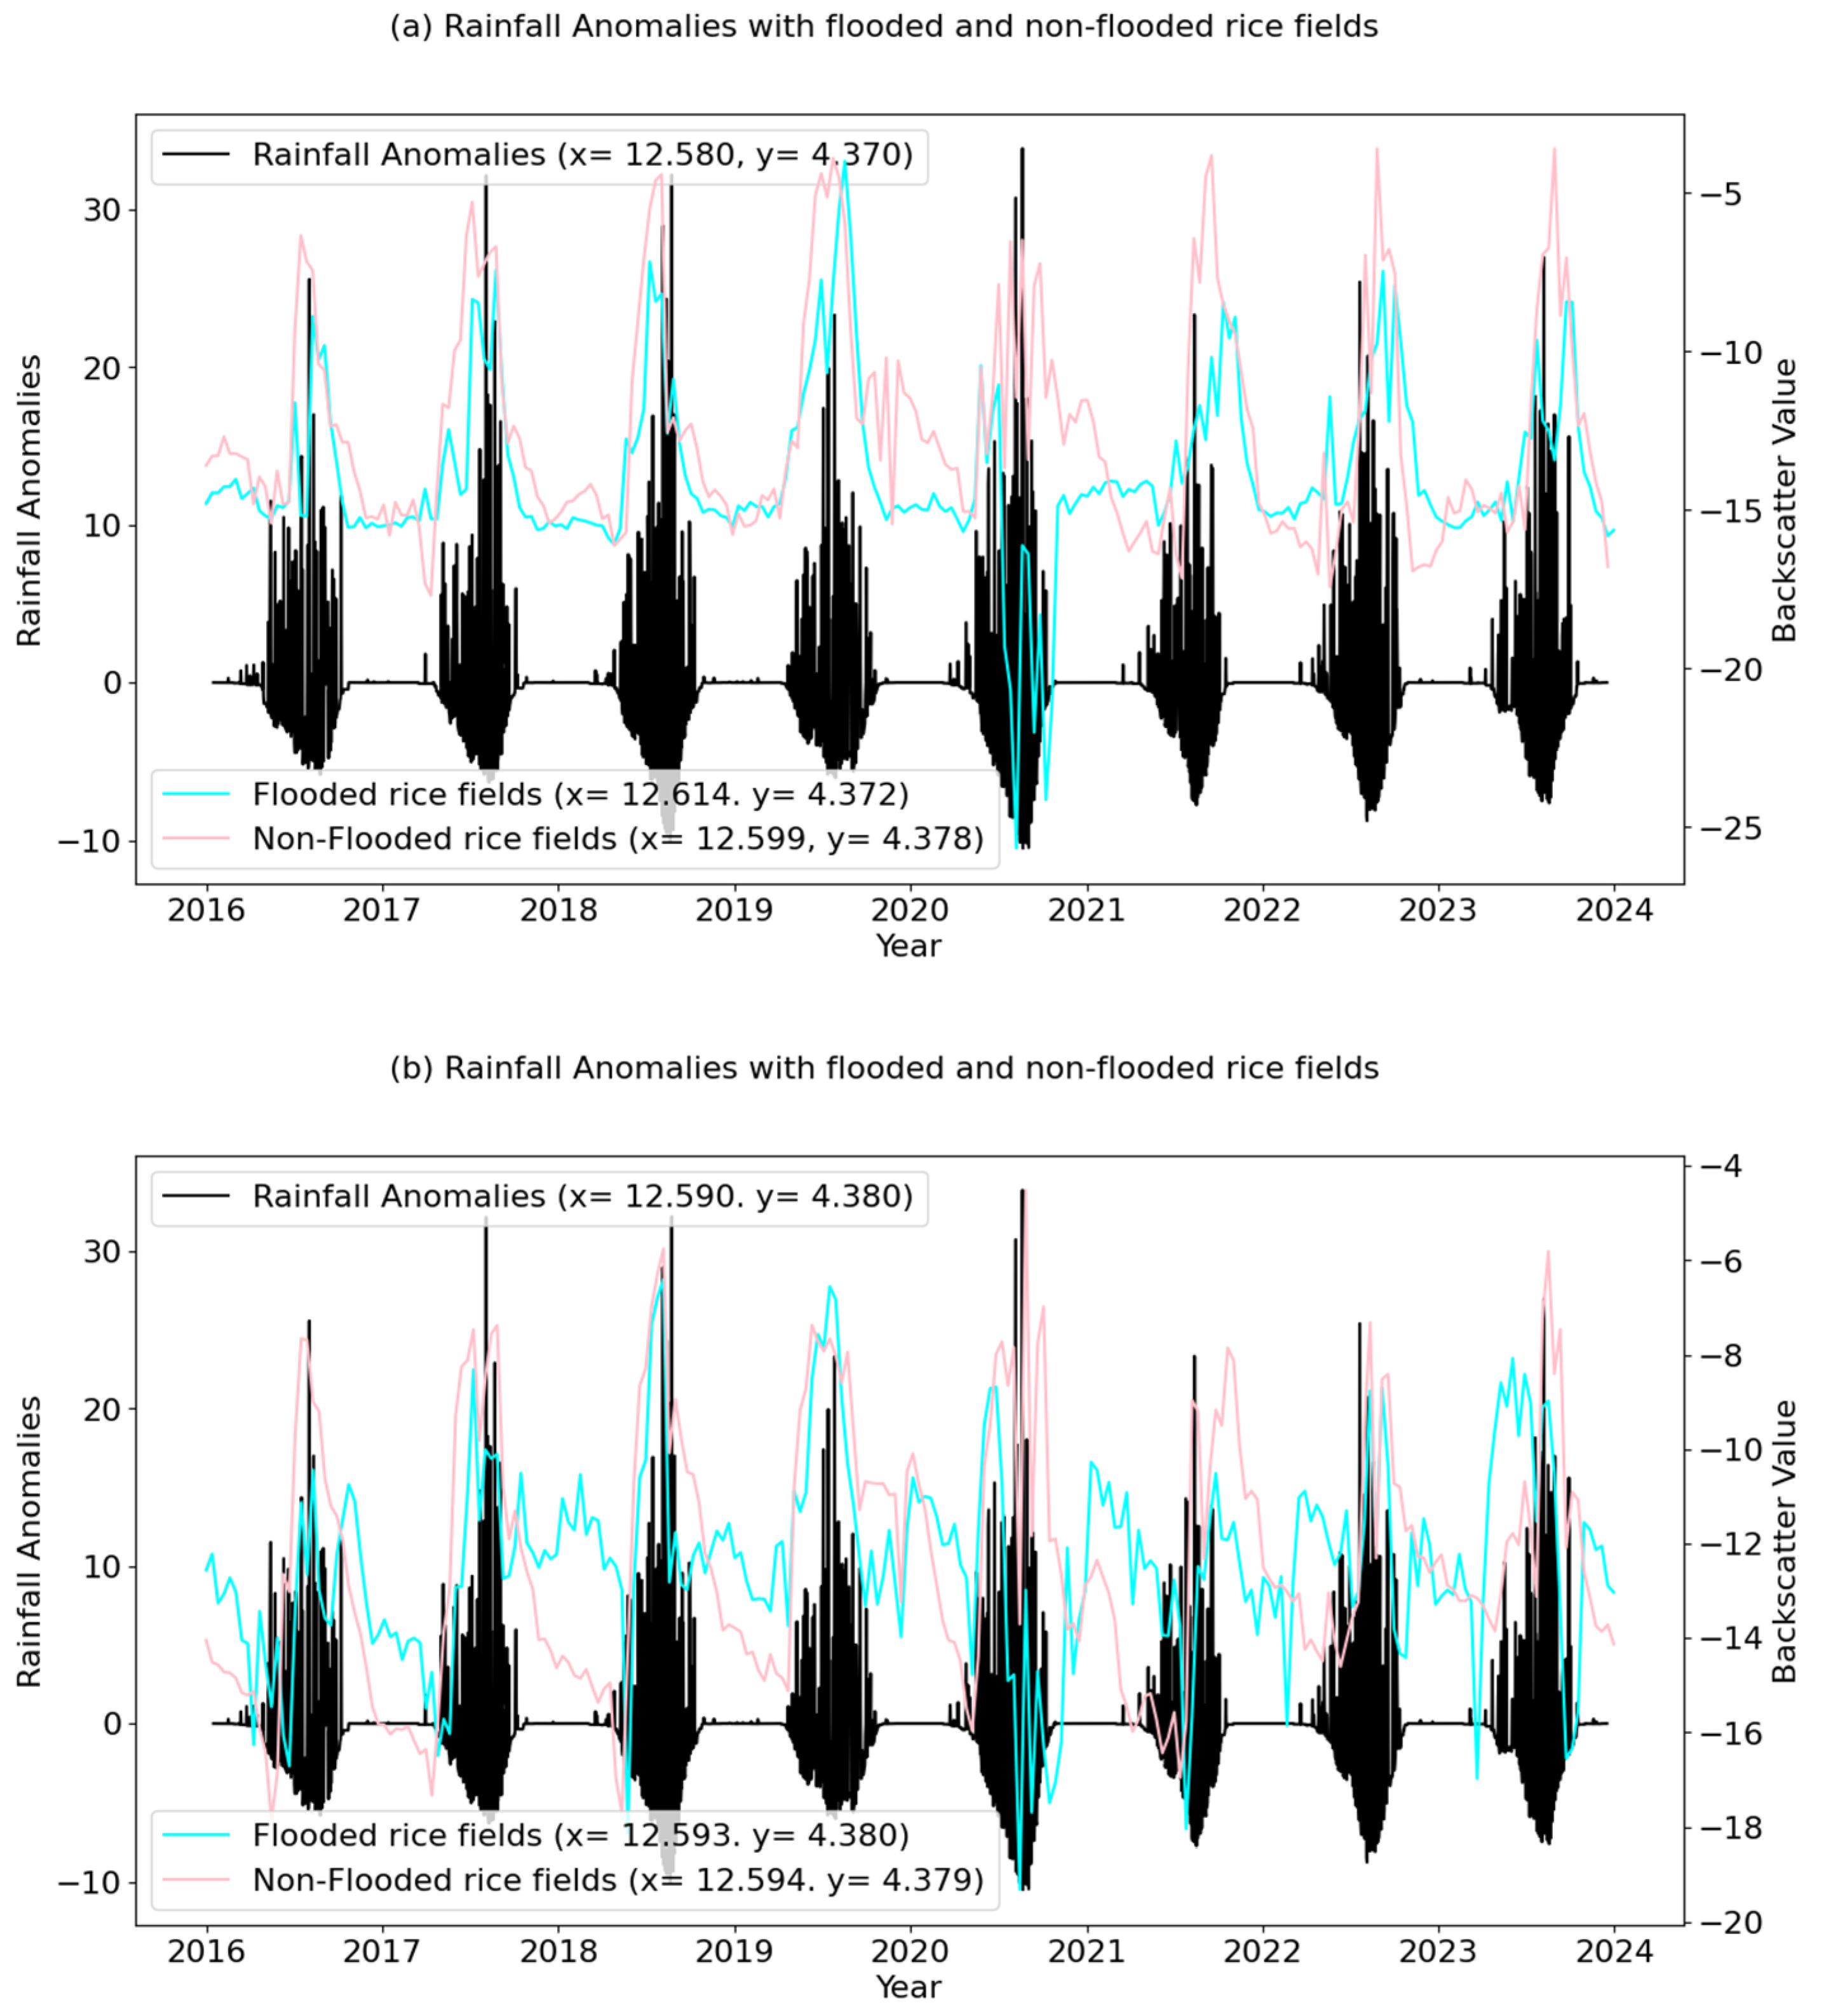

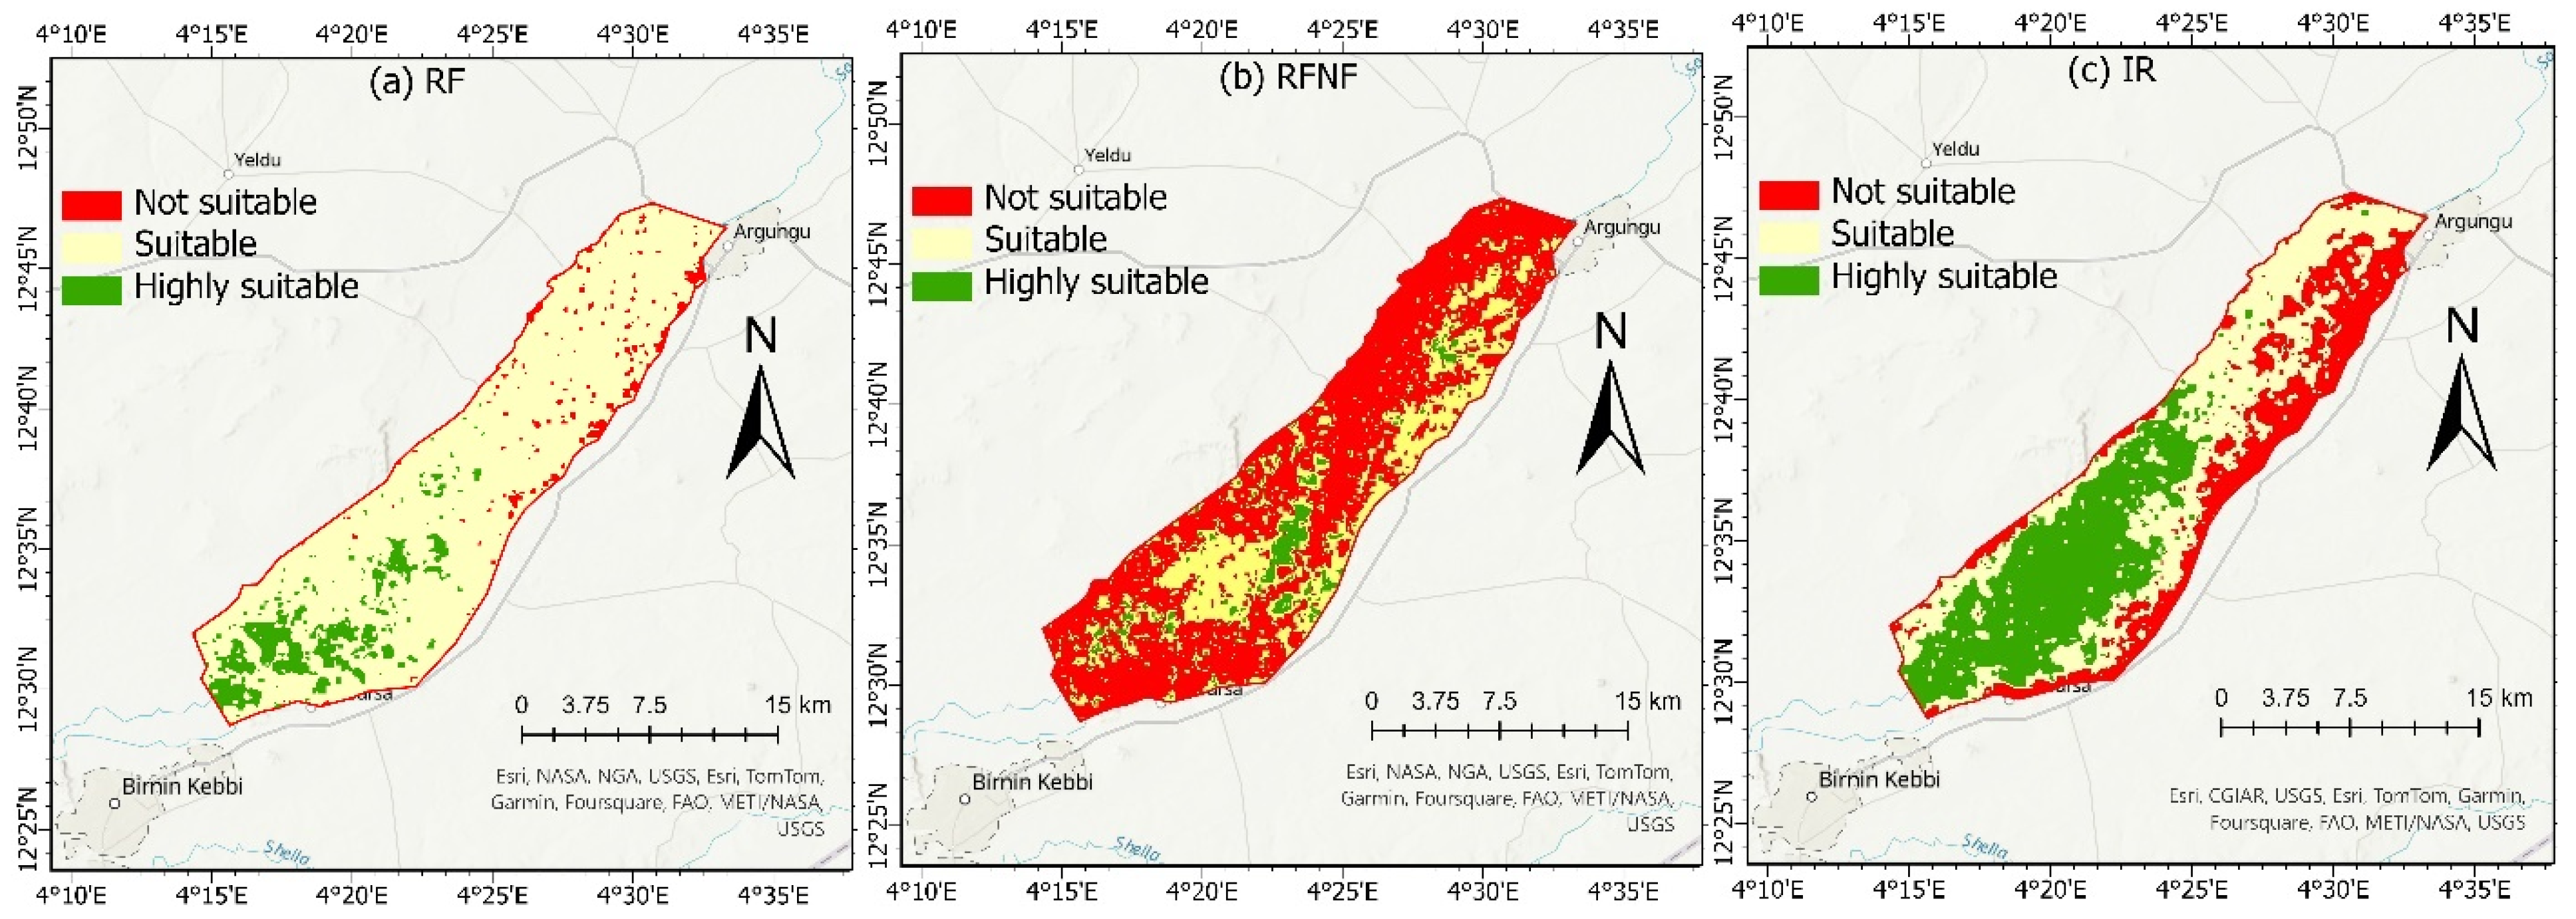
Disclaimer/Publisher’s Note: The statements, opinions and data contained in all publications are solely those of the individual author(s) and contributor(s) and not of MDPI and/or the editor(s). MDPI and/or the editor(s) disclaim responsibility for any injury to people or property resulting from any ideas, methods, instructions or products referred to in the content. |
© 2024 by the authors. Licensee MDPI, Basel, Switzerland. This article is an open access article distributed under the terms and conditions of the Creative Commons Attribution (CC BY) license (https://creativecommons.org/licenses/by/4.0/).