
Desertification Mitigation in Northern China Was Promoted by Climate Drivers after 2000

 , , , and
Abstract
:1. Introduction
2. Dataset and Methodology
2.1. Study Area
2.2. Data Sources
2.3. Methods
2.4. Empirical Orthogonal Function (EOF) Decomposition
3. Results
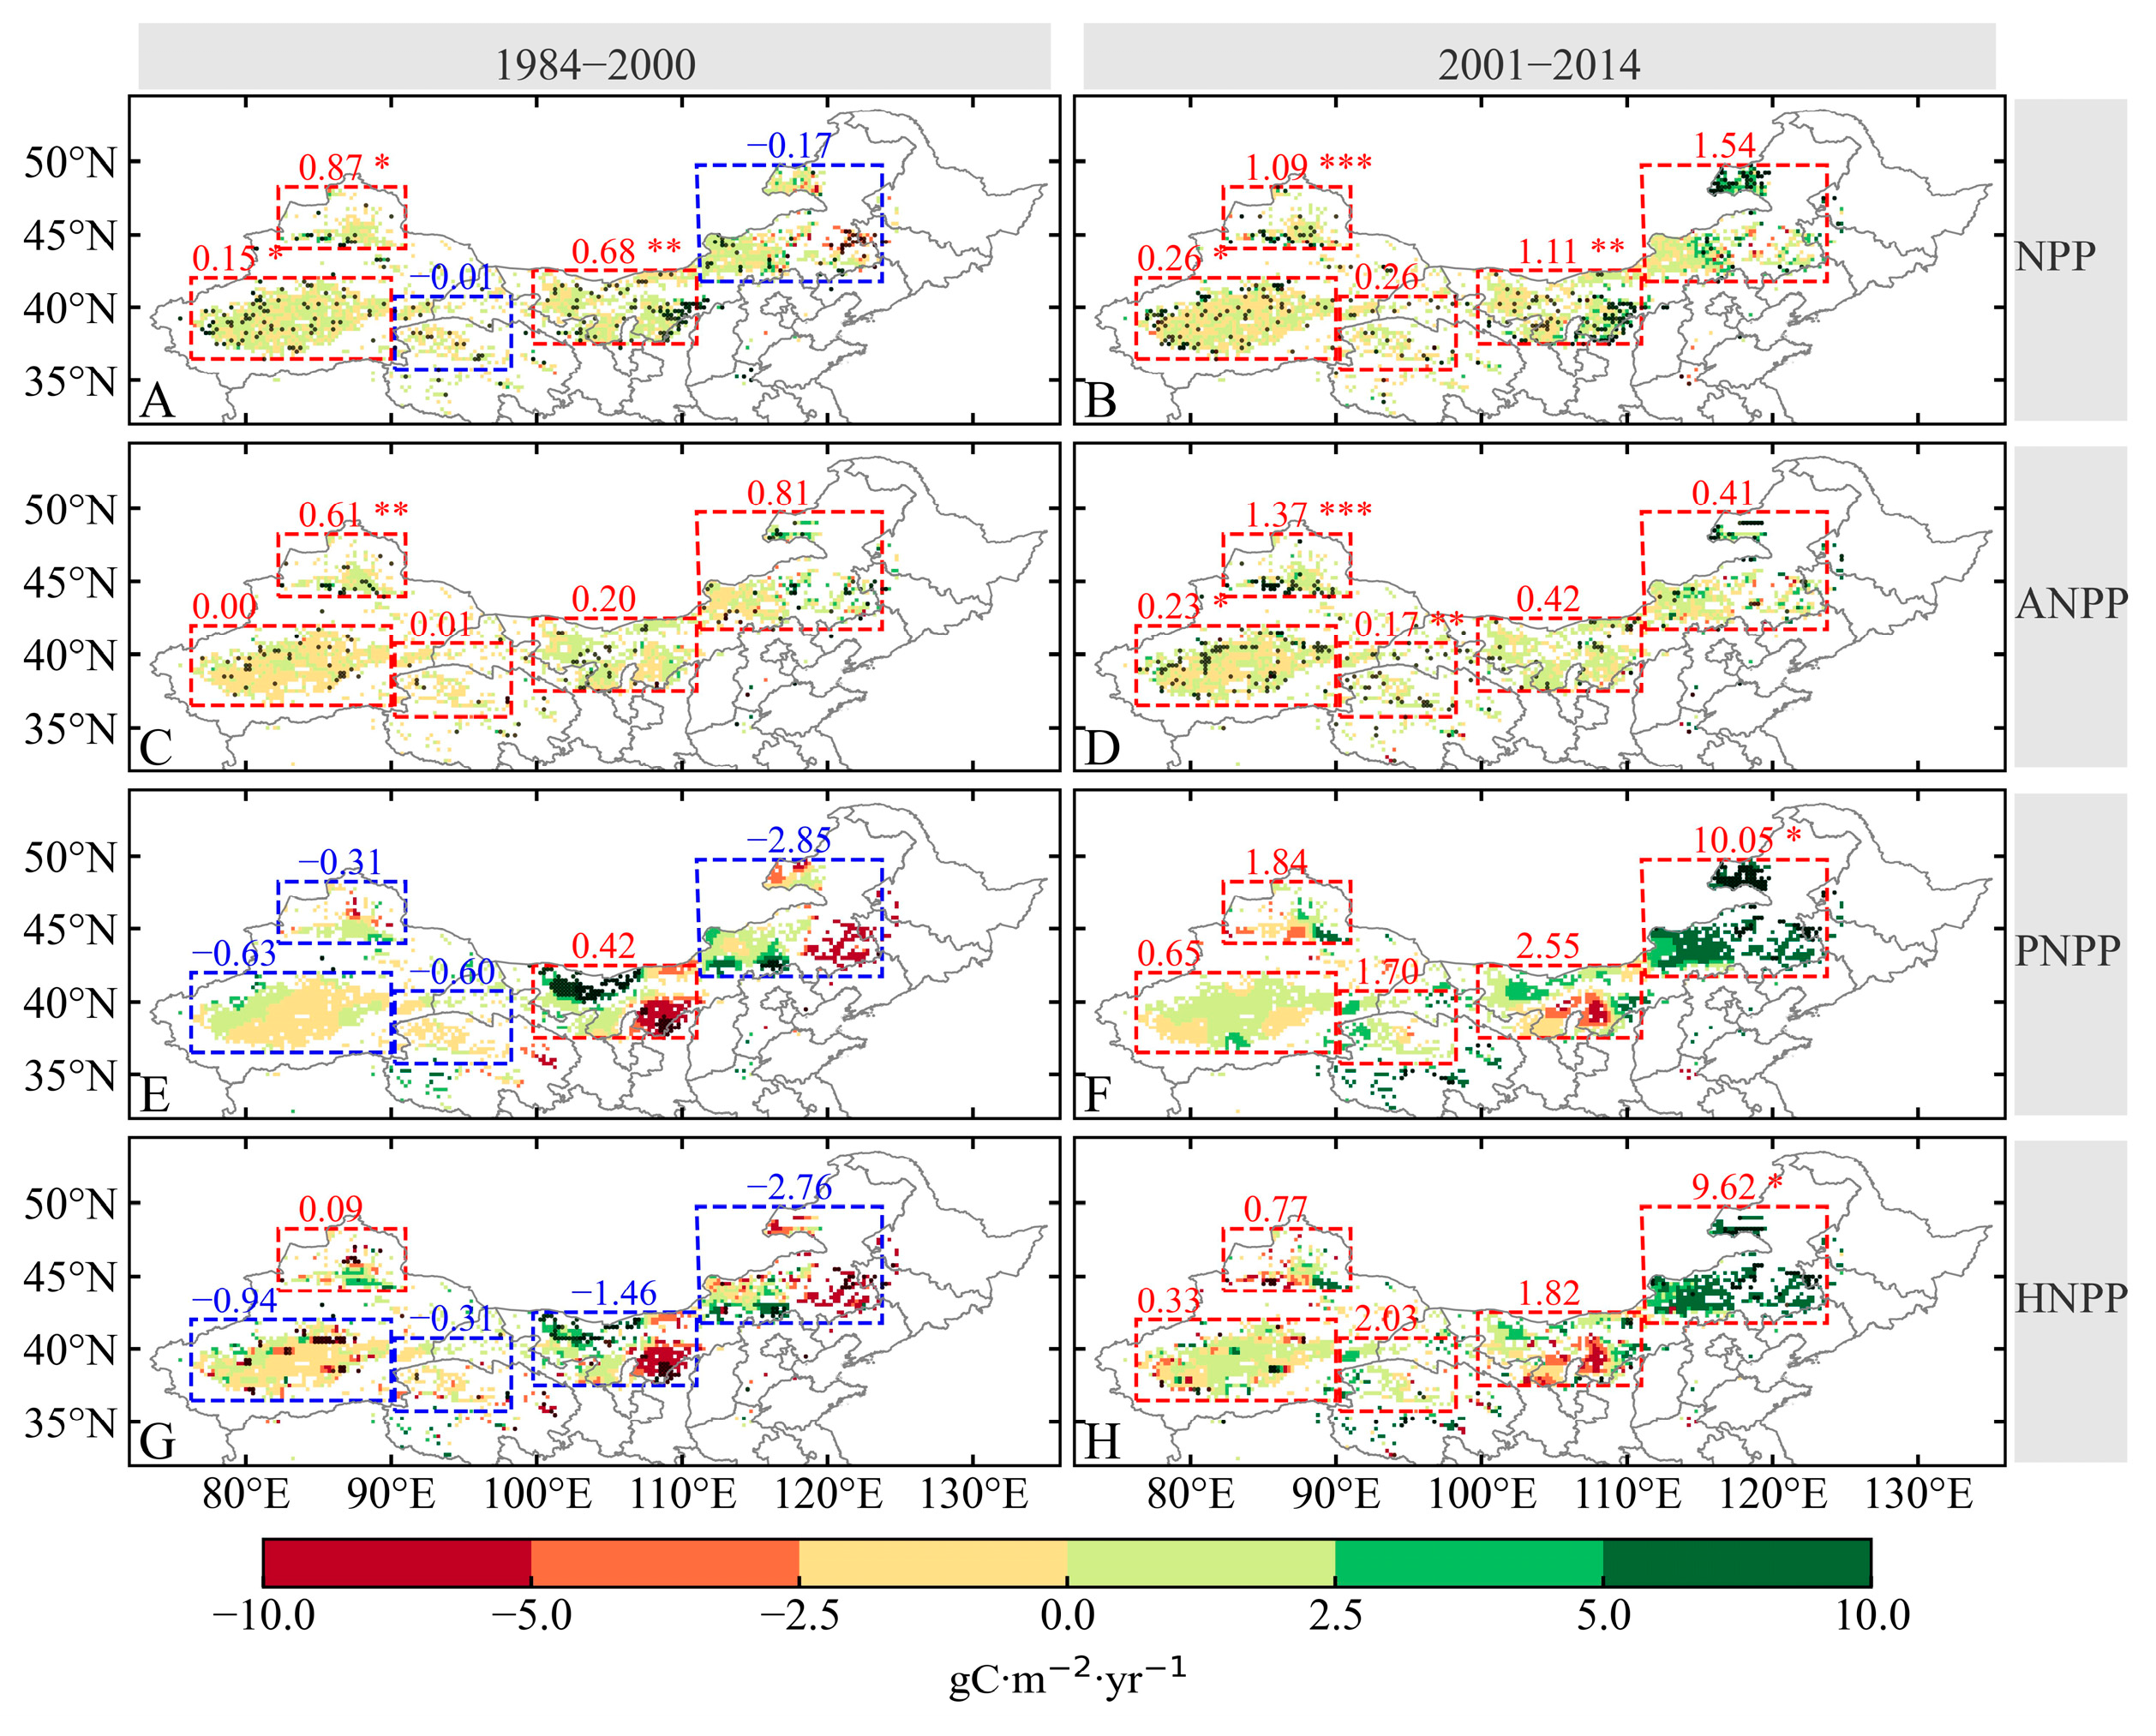
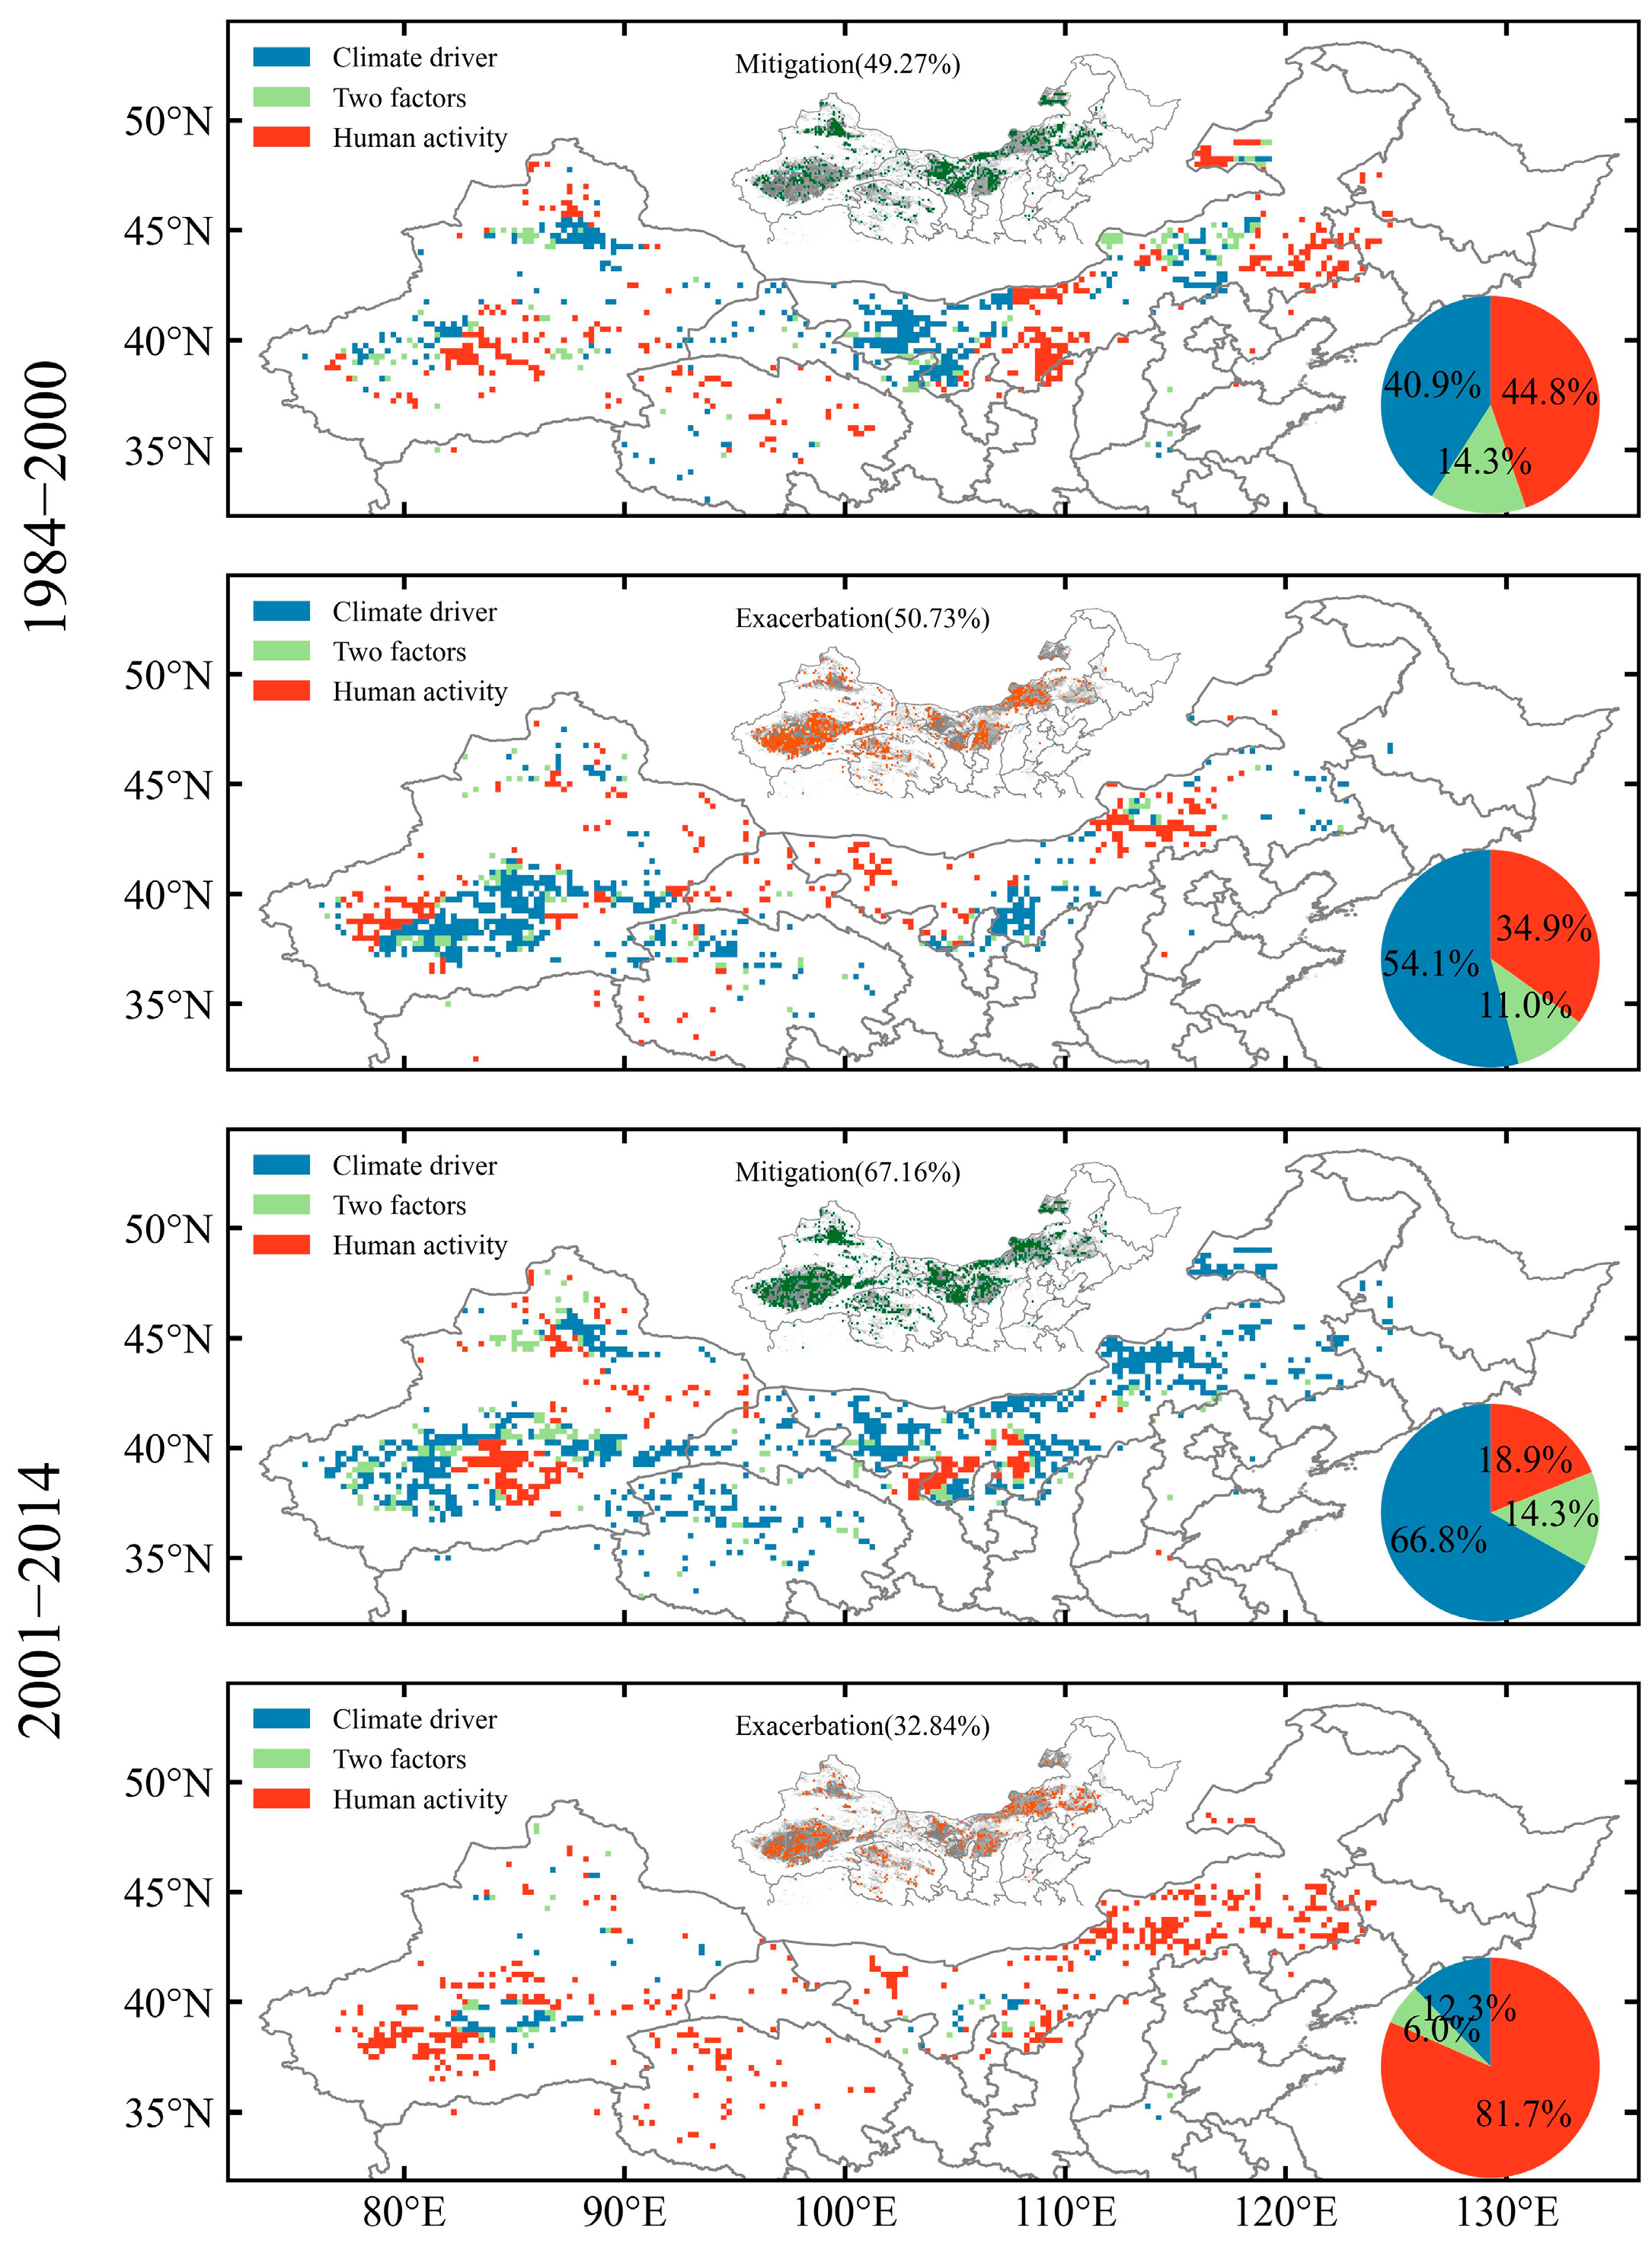
3.1. Attributions of Historical Desertification in NC during the Period from 1984 to 2014
3.2. Shift in Desertification after 2000 in NC
4. Discussion
4.1. Effects of Different Climatic Factors
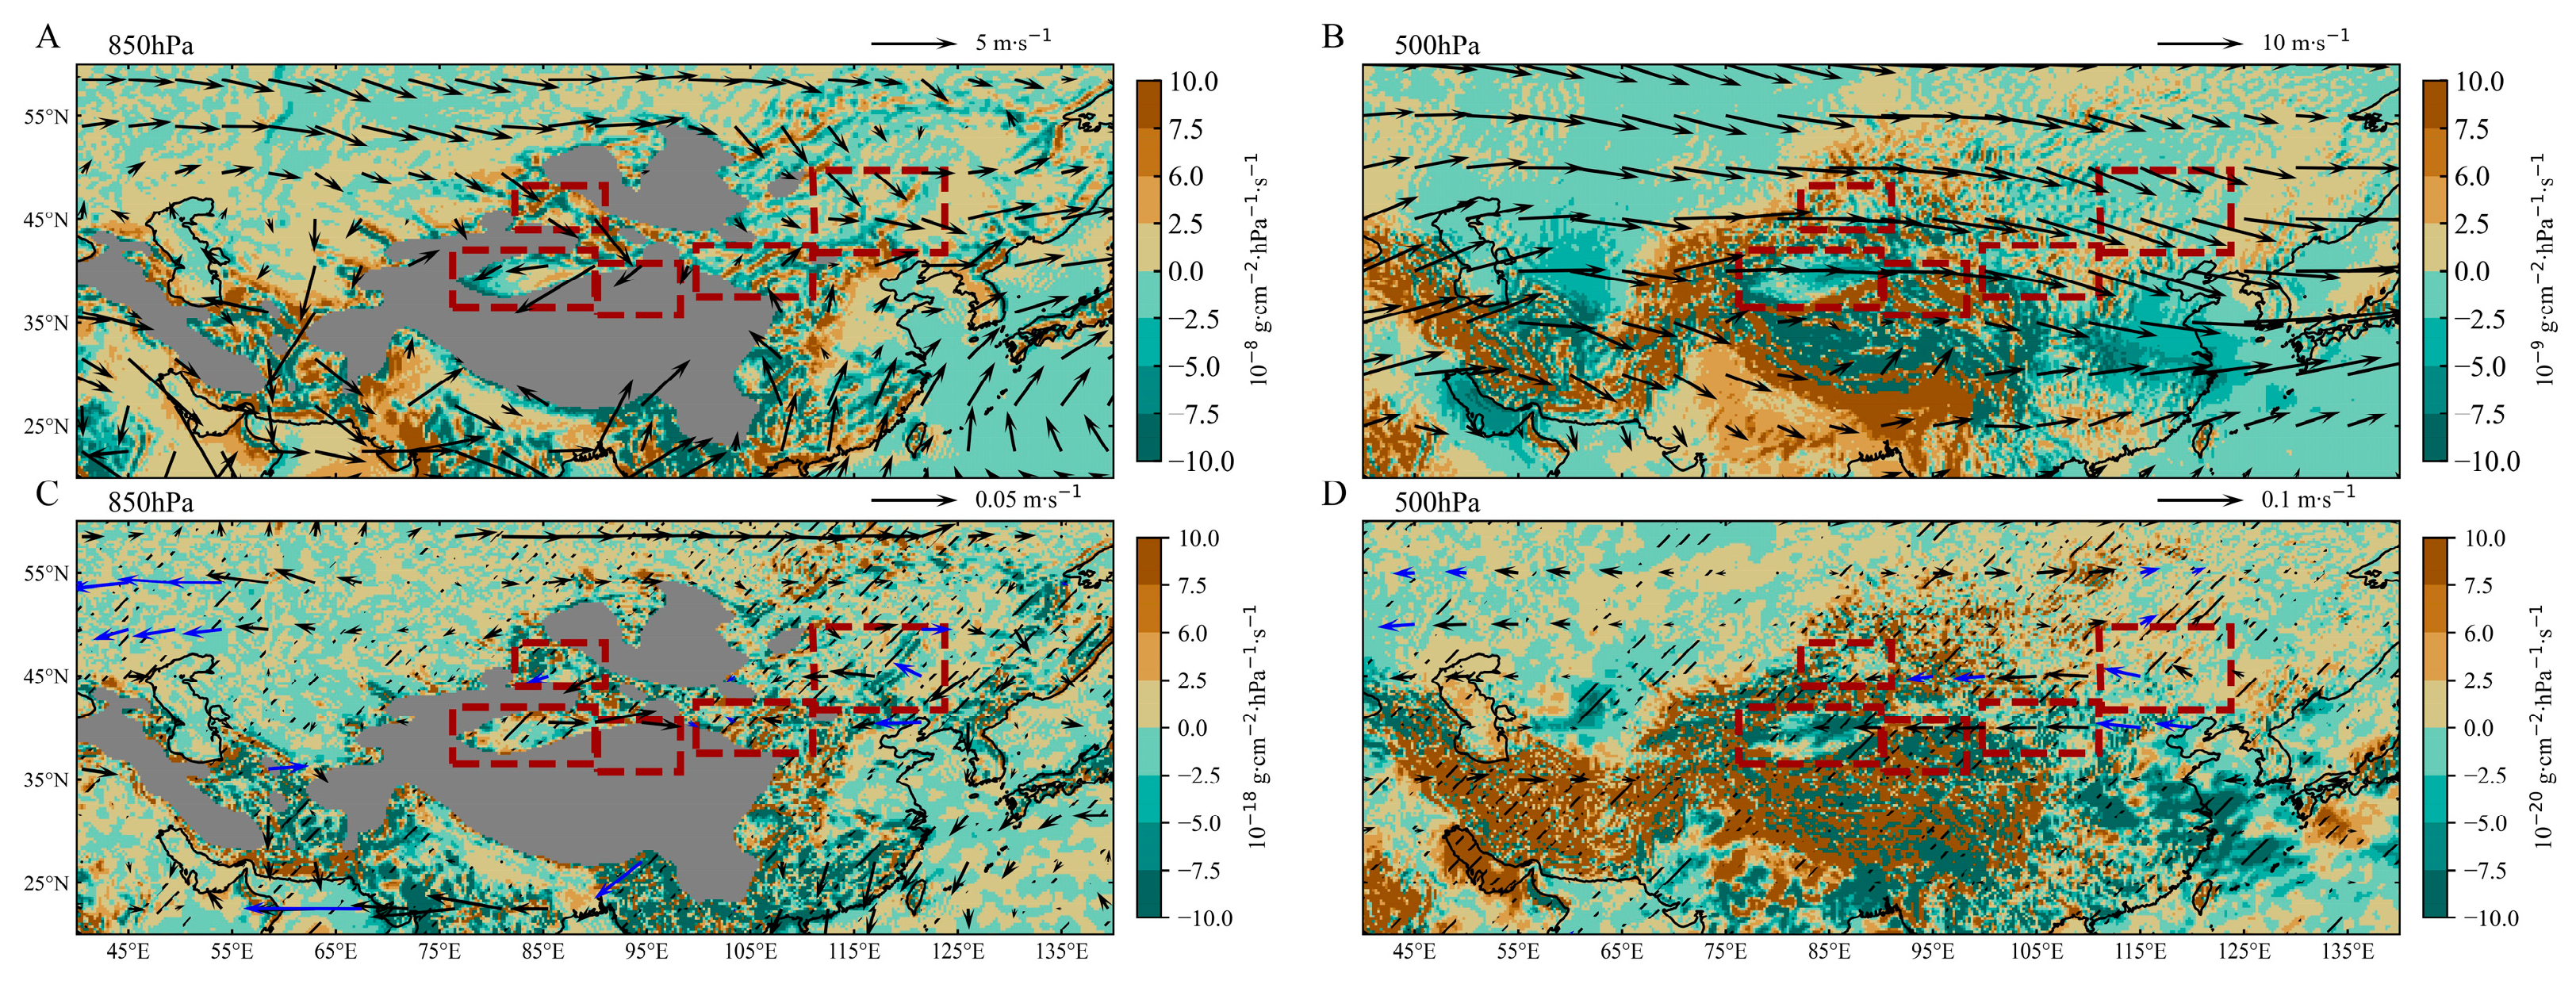
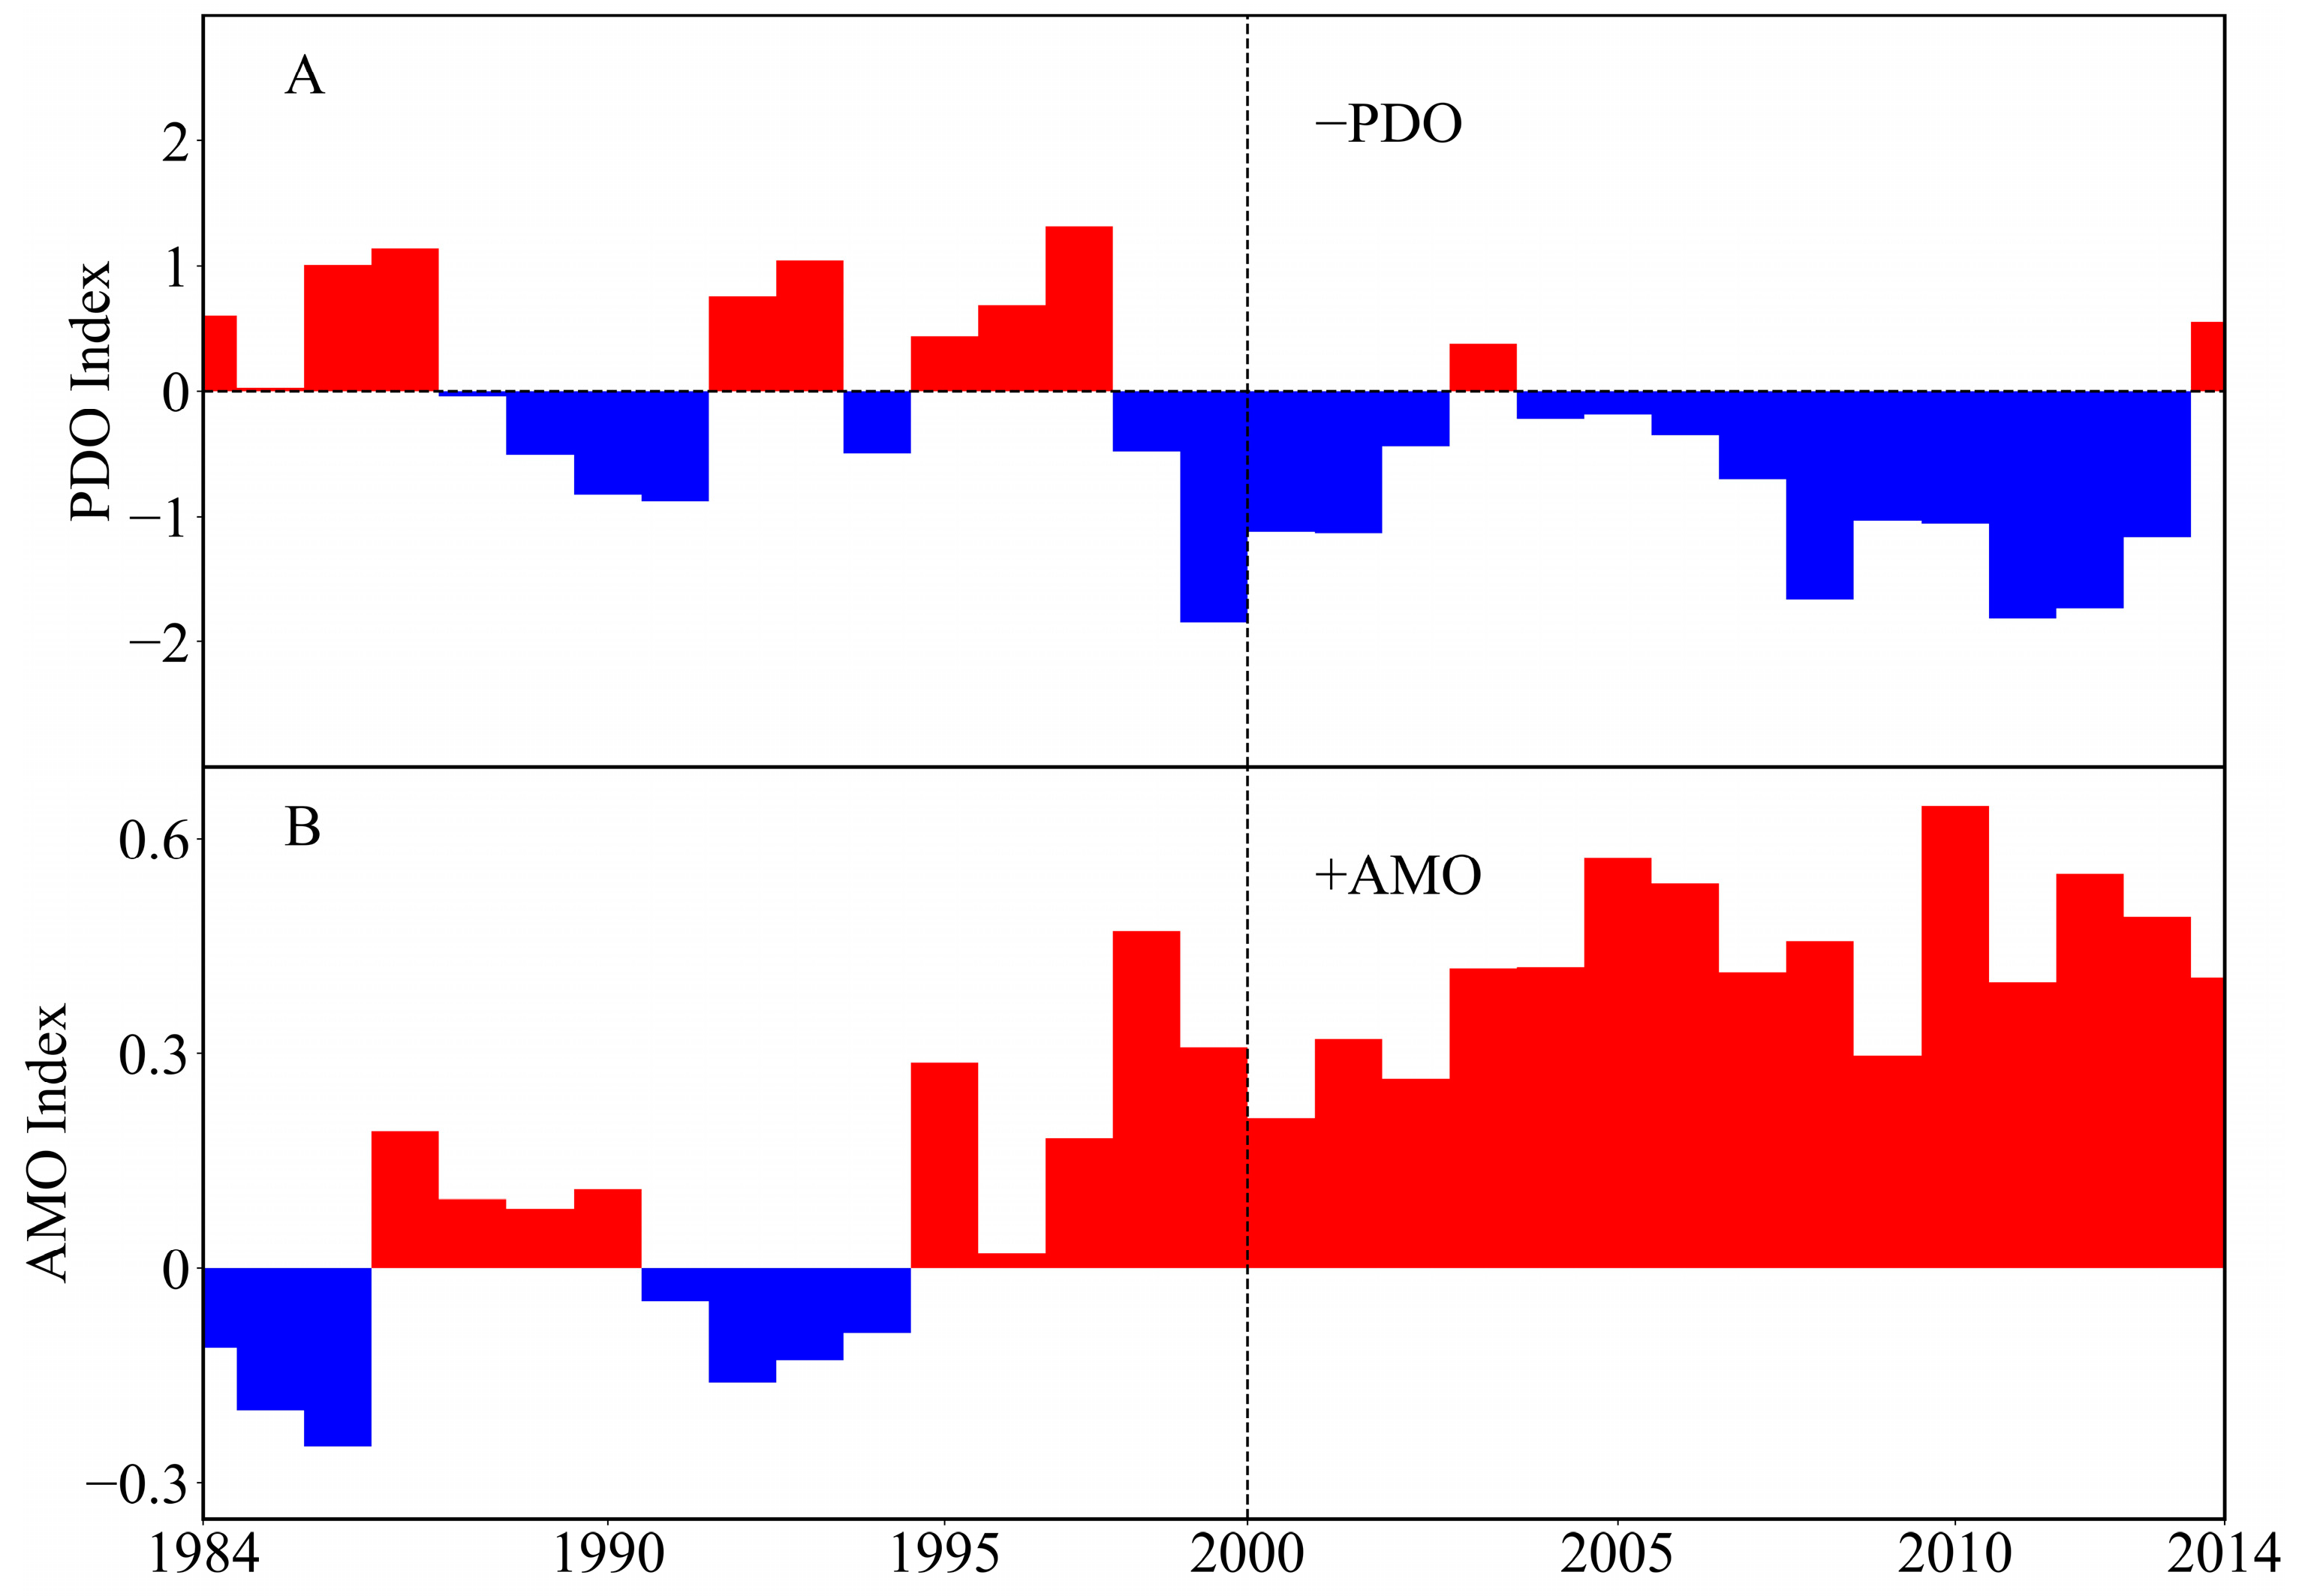
4.2. Atmospheric Circulation and Internal Variability
4.3. Human Activity in NC
4.4. Limitations
5. Conclusions
Supplementary Materials
Author Contributions
Funding
Data Availability Statement
Acknowledgments
Conflicts of Interest
References
- United Nations. Elaboration of an International Convention to Combat Desertification in Countries Experiencing Serious Drought and/or Desertification, Particularly in Africa. United Nations, 1994. Available online: https://wedocs.unep.org/20.500.11822/27569 (accessed on 3 October 2024).
- Sterk, G.; Stoorvogel, J.J. Desertification–Scientific versus Political Realities. Land 2020, 9, 156. [Google Scholar] [CrossRef]
- Nkonya, E.; Mirzabaev, A.; von Braun, J. (Eds.) Economics of land degradation and improvement: An introduction and overview. In Economics of Land Degradation and Improvement—A Global Assessment for Sustainable Development; Springer International Publishing: Cham, Switzerland, 2016; pp. 1–14. [Google Scholar] [CrossRef]
- United Nations. Transforming Our World: The 2030 Agenda for Sustainable Development. United Nations, 2015. Available online: https://wedocs.unep.org/20.500.11822/9814 (accessed on 3 October 2024).
- Barbier, E.B.; Hochard, J.P. Does land degradation increase poverty in developing countries? PLoS ONE 2016, 11, e0152973. [Google Scholar] [CrossRef]
- Hochman, Z.; Gobbett, D.L.; Horan, H. Climate trends account for stalled wheat yields in Australia since 1990. Glob. Chang. Biol. 2017, 23, 2071–2081. [Google Scholar] [CrossRef]
- Shao, W.Y.; Wang, Q.Z.; Guan, Q.Y.; Zhang, J.; Yang, X.Y.; Liu, Z. Environmental sensitivity assessment of land desertification in the Hexi Corridor, China. CATENA 2023, 220, 106728. [Google Scholar] [CrossRef]
- Wilting, H.C.; Schipper, A.M.; Bakkenes, M.; Meijer, J.R.; Huijbregts, M.A.J. Quantifying Biodiversity Losses Due to Human Consumption: A Global-Scale Footprint Analysis. Environ. Sci. Technol. 2017, 51, 3298–3306. [Google Scholar] [CrossRef]
- Bai, Z.G.; Dent, D.L.; Olsson, L.; Schaepman, M.E. Proxy global assessment of land degradation. Soil Use Manag. 2008, 24, 223–234. [Google Scholar] [CrossRef]
- Prince, S.D.; De Colstoun, E.B.; Kravitz, L.L. Evidence from rain-use efficiencies does not indicate extensive Sahelian desertification. Glob. Chang. Biol. 2004, 4, 359–374. [Google Scholar] [CrossRef]
- D’Odorico, P.; Bhattachan, A.; Davis, K.F.; Ravi, S.; Runyan, C.W. Global desertification: Drivers and feedbacks. Adv. Water. Resour. 2013, 51, 326–344. [Google Scholar] [CrossRef]
- Andela, N.; Liu, Y.Y.; Van Dijk, A.; De Jeu, R.A.M.; McVicar, T.R. Global changes in dryland vegetation dynamics (1988–2008) assessed by satellite remote sensing: Comparing a new passive microwave vegetation density record with reflective greenness data. Biogeosciences 2013, 10, 6657–6676. [Google Scholar] [CrossRef]
- Kassas, M. Desertification: A general review. J. Arid Environ. 1995, 30, 115–128. [Google Scholar] [CrossRef]
- Marland, G.; Pielke, R.A.; Apps, M.; Avissar, R.; Betts, R.A.; Davis, K.J.; Frumhoff, P.C.; Jackson, S.T.; Joyce, L.A.; Kauppi, P.; et al. The climatic impacts of land surface change and carbon management, and the implications for climate-change mitigation policy. Clim. Policy 2003, 3, 149–157. [Google Scholar] [CrossRef]
- Prince, S.; Von Maltitz, G.; Zhang, F.; Byrne, K.; Driscoll, C.; Eshel, G.; Kust, G.; Martínez-Garza, C.; Metzger, J.; Midgley, G. Status and trends of land degradation and restoration and associated changes in biodiversity and ecosystem functions. In Intergovernmental Science-Policy Platform on Biodiversity and Ecosystem Services (IPBES); Montanarella, L., Scholes, R.B.A., Eds.; IPBES: Bonn, Germany, 2018; pp. 221–338. [Google Scholar]
- Burrell, A.L.; Evans, J.P.; De Kauwe, M.G. Anthropogenic climate change has driven over 5 million km2 of drylands towards desertification. Nat. Commun. 2020, 11, 3853. [Google Scholar] [CrossRef]
- Horion, S.; Prishchepov, A.V.; Verbesselt, J.; de Beurs, K.; Tagesson, T.; Fensholt, R. Revealing turning points in ecosystem functioning over the Northern Eurasian agricultural frontier. Glob. Chang. Biol. 2016, 22, 2801–2817. [Google Scholar] [CrossRef]
- Wu, B.; Ci, L.J. Landscape change and desertification development in the Mu Us Sandland, Northern China. J. Arid Environ. 2002, 50, 429–444. [Google Scholar] [CrossRef]
- Zhang, X.Y.; Wang, X.; Yan, P. Re-evaluating the impacts of human activity and environmental change on desertification in the Minqin Oasis, China. Environ. Geol. 2008, 55, 705–771. [Google Scholar] [CrossRef]
- Ren, H.; Liu, Y.; Wen, Z.; Shi, H.; Zhou, R.; Wang, Z.; Kareem, H.A.; Zhang, W. Untangling the effects of climate variation and human interference on grassland dynamics in North China. Land Degrad. Dev. 2024, 35, 467–483. [Google Scholar] [CrossRef]
- Wang, J.; Cui, K.; Yang, F.; Li, J.; Zhang, C.; Du, T.; Zhang, H. Evaluation of spatiotemporal variation and impact factors for vegetation net primary productivity in a typical open-pit mining ecosystem in northwestern China. Land Degrad. Dev. 2024, 35, 3756–3770. [Google Scholar] [CrossRef]
- Chen, Y.; Xu, Y.; Chen, T.; Zhang, F.; Zhu, S. Exploring the Spatiotemporal Dynamics and Driving Factors of Net Ecosys-tem Productivity in China from 1982 to 2020. Remote Sens. 2024, 16, 60. [Google Scholar] [CrossRef]
- Herrmann, S.M.; Hutchinson, C.F. The changing contexts of the desertification debate. J. Arid Environ. 2005, 63, 538–555. [Google Scholar] [CrossRef]
- Rivera-Marin, D.; Dash, J.; Ogutu, B. The use of remote sensing for desertification studies: A review. J. Arid Environ. 2022, 206, 104829. [Google Scholar] [CrossRef]
- Xu, D.Y.; Li, C.L.; Song, X.; Ren, H.Y. The dynamics of desertification in the farming-pastoral region of North China over the past 10 years and their relationship to climate change and human activity. CATENA 2014, 123, 11–22. [Google Scholar] [CrossRef]
- Zhu, Z.C.; Piao, S.L.; Myneni, R.B.; Huang, M.T.; Zeng, Z.Z.; Canadell, J.G.; Ciais, P.; Sitch, S.; Friedlingstein, P.; Arneth, A.; et al. Greening of the Earth and its drivers. Nat. Clim. Chang. 2016, 6, 791–795. [Google Scholar] [CrossRef]
- Liu, Z.; Si, J.; Deng, Y.; Jia, B.; Li, X.; He, X.; Zhou, D.; Wang, C.; Zhu, X.; Qin, J.; et al. Assessment of Land Desertification and Its Drivers in Semi-Arid Alpine Mountains: A Case Study of the Qilian Mountains Region, Northwest China. Remote Sens. 2023, 15, 3836. [Google Scholar] [CrossRef]
- Song, X.P.; Hansen, M.C.; Stehman, S.V.; Potapov, P.V.; Tyukavina, A.; Vermote, E.F.; Townshend, J.R. Global land change from 1982 to 2016. Nature 2018, 560, 639–643. [Google Scholar] [CrossRef]
- Wang, C.H. Climate Change and Desertification; Chinese Meteorological Press: Beijing, China, 2003. [Google Scholar]
- Yang, X.; Zhang, K.; Jia, B.; Ci, L. Desertification assessment in China: An overview. J. Arid Environ. 2005, 63, 517–531. [Google Scholar] [CrossRef]
- State Forestry Administration of China. The Bulletin of Status Quo of Desertification and Sandification in China. State Forestry Administration of China (2000, 2005, 2010, 2015), Beijing, China. Available online: http://www.forestry.gov.cn/ (accessed on 3 October 2024).
- Zhang, C.X.; Wang, X.M.; Li, J.C.; Hua, T. Identifying the effect of climate change on desertification in northern China via trend analysis of potential evapotranspiration and precipitation. Ecol. Indic. 2020, 112, 106141. [Google Scholar] [CrossRef]
- Hua, D.; Hao, X.M. Spatiotemporal change and drivers analysis of desertification in the arid region of northwest China based on geographic detector. Environ. Chall. 2021, 4, 100082. [Google Scholar] [CrossRef]
- Wang, F.; Pan, X.B.; Wang, D.F.; Shen, C.Y.; Lu, Q. Combating desertification in China: Past, present and future. Land Use Policy 2013, 31, 311–313. [Google Scholar] [CrossRef]
- Wang, X.M.; Ge, Q.S.; Geng, X.; Wang, Z.S.; Gao, L.; Bryan, B.A.; Chen, S.Q.; Su, Y.N.; Cai, D.W.; Ye, J.S.; et al. Unintended consequences of combating desertification in China. Nat. Commun. 2023, 14, 1139. [Google Scholar] [CrossRef] [PubMed]
- Chen, W.; Lu, R.Y. A decadal shift of summer surface air temperature over Northeast Asia around the mid-1990s. Adv. Atmos. Sci. 2014, 31, 735–742. [Google Scholar] [CrossRef]
- Urabe, Y.; Maeda, S. The relationship between Japan’s recent temperature and decadal variability. Sci. Online Lett. Atmos. 2014, 10, 176–179. [Google Scholar] [CrossRef]
- Wei, K.; Chen, W. An abrupt increase in the summer high temperature extreme days across China in the mid-1990s. Adv. Atmos. Sci. 2011, 28, 1023–1029. [Google Scholar] [CrossRef]
- Li, B.F.; Chen, Y.N.; Chen, Z.S.; Xiong, H.G.; Lian, L.S. Why does precipitation in northwest China show a significant increasing trend from 1960 to 2010? Atmos. Res. 2016, 167, 275–284. [Google Scholar] [CrossRef]
- Xue, T.; Ding, Y.H.; Lu, C.H. Interdecadal Variability of Summer Precipitation in Northwest China and Associated Atmospheric Circulation Changes. J. Meteorol. Res. 2022, 36, 824–840. [Google Scholar] [CrossRef]
- Lyu, Y.L.; Shi, P.J.; Han, G.Y.; Liu, L.Y.; Guo, L.L.; Hu, X.; Zhang, G.M. Desertification Control Practices in China. Sustainability 2020, 12, 3258. [Google Scholar] [CrossRef]
- Wang, T.; Yan, C.Z.; Song, X.; Li, S. Landsat images reveal trends in the aeolian desertification in a source area for sand and dust storms in China’s Alashan plateau (1975–2007). Land Degrad. Dev. 2013, 24, 422–429. [Google Scholar] [CrossRef]
- Li, C.J.; Fu, B.J.; Wang, S.; Stringer, L.C.; Wang, Y.P.; Li, Z.D.; Liu, Y.X.; Zhou, W.X. Drivers and impacts of changes in China’s drylands. Nat. Rev. Earth Environ. 2021, 2, 858–873. [Google Scholar] [CrossRef]
- Xie, S.D.; Mo, X.G.; Hu, S.; Liu, S.X. Contributions of climate change, elevated atmospheric CO2 and human activities to ET and GPP trends in the Three-North Region of China. Agric. For. Meteorol. 2020, 295, 108183. [Google Scholar] [CrossRef]
- Duan, H.C.; Yan, C.Z.; Tsunekawa, A.; Song, X.; Li, S.; Xie, J.L. Assessing vegetation dynamics in the Three-North Shelter Forest region of China using AVHRR NDVI data. Environ. Earth Sci. 2011, 64, 1011–1020. [Google Scholar] [CrossRef]
- Schimel, D.S. Terrestrial biogeochemical cycles: Global estimates with remote sensing. Remote Sens. Environ. 1995, 51, 49–56. [Google Scholar] [CrossRef]
- Cai, D.W.; Wang, X.M.; Hua, T.; Jiao, L.L.; Geng, X. Baseline and status of desertification in Central Asia. Land Degrad. Dev. 2022, 33, 771–784. [Google Scholar] [CrossRef]
- Jackson, H.; Prince, S.D. Degradation of net primary production in a semiarid rangeland. Biogeosciences 2016, 13, 4721–4734. [Google Scholar] [CrossRef]
- Noojipady, P.; Prince, S.D.; Rishmawi, K. Reductions in productivity due to land degradation in the drylands of the southwestern united states. Ecosyst. Health Sustain. 2015, 1, 1–15. [Google Scholar] [CrossRef]
- Zika, M.; Erb, K.H. The global loss of net primary production resulting from human-induced soil degradation in drylands. Ecol. Econ. 2009, 69, 310–318. [Google Scholar] [CrossRef]
- Xu, X.L.; Liu, J.Y.; Zhang, S.W.; Li, R.D.; Yan, C.Z.; Wu, S.X. The multi-period land use land cover remote sensing monitoring dataset for China. Resour. Environ. Sci. Data Platform 2018. [Google Scholar] [CrossRef]
- Feng, F.; Wang, K.C. Merging High-Resolution Satellite Surface Radiation Data with Meteorological Sunshine Duration Observations over China from 1983 to 2017. Remote Sens. 2021, 13, 602. [Google Scholar] [CrossRef]
- Schiavina, M.; Freire, S.; Carioli, A.; MacManus, K. GHS-POP R2023A–GHS Population Grid Multitemporal (1975–2030); European Commission, Joint Research Centre, Publications Office of the European Union: Luxembourg, 2023. [Google Scholar] [CrossRef]
- Tu, Y.; Wu, S.; Chen, B.; Weng, Q.; Bai, Y.; Yang, J.; Yu, L.; and Xu, B. A 30 m annual cropland dataset of China from 1986 to 2021. Earth Syst. Sci. Data 2024, 16, 2297–2316. [Google Scholar] [CrossRef]
- Pinzon, J.E.; Tucker, C.J. A non-stationary 1981–2012 AVHRR NDVI3g time series. Remote Sens. 2014, 6, 6929–6960. [Google Scholar] [CrossRef]
- Beck, H.E.; McVicar, T.R.; van Dijk, A.I.; Schellekens, J.; de Jeu, R.A.; Bruijnzeel, L.A. Global evaluation of four AVHRR–NDVI data sets: Intercomparison and assessment against Landsat imagery. Remote Sens. Environ. 2011, 115, 2547–2563. [Google Scholar] [CrossRef]
- Zhang, Y.H.; Ye, A.Z. Spatial and temporal variations in vegetation coverage observed using AVHRR GIMMS and Terra MODIS data in the mainland of China. Int. J. Remote Sens. 2020, 41, 4238–4268. [Google Scholar] [CrossRef]
- Zheng, Y.; Shen, R.Q.; Wang, Y.W.; Li, X.Q.; Liu, S.G.; Chen, J.M.; Ju, W.M.; Zhang, L.; Yuan, W.P. Improved estimate of global gross primary production for reproducing its long-term variation, 1982–2017. Earth Syst. Sci. Data 2020, 12, 2725–2746. [Google Scholar] [CrossRef]
- Lv, G.; Li, X.; Fang, L.; Peng, Y.; Zhang, C.; Yao, J.; Ren, S.; Chen, J.; Men, J.; Zhang, Q.; et al. Disentangling the Influential Factors Driving NPP Decrease in Shandong Province: An Analysis from Time Series Evaluation Using MODIS and CASA Model. Remote Sens. 2024, 16, 1966. [Google Scholar] [CrossRef]
- Chen, B.; Jiapaer, G.; Yu, T.; Zhang, L.; Tu, H.; Liang, H.; Lin, K.; Ju, T.; Ling, Q. The role of climatic factor timing on grassland net primary productivity in Altay, Xinjiang. Ecol. Indic. 2023, 157, 111243. [Google Scholar] [CrossRef]
- Chen, F.H.; Chen, J.; Huang, W. Weakened East Asian summer monsoon triggers increased precipitation in Northwest China. Sci. China Earth Sci. 2021, 64, 835–837. [Google Scholar] [CrossRef]
- Field, C.B.; Randerson, J.T.; Malmström, C.M. Global net primary production: Combining ecology and remote sensing. Remote Sens. Environ. 1995, 51, 74–88. [Google Scholar] [CrossRef]
- Potter, C.S.; Randerson, J.T.; Field, C.B.; Matson, P.A.; Vitousek, P.M.; Mooney, H.; Klooster, S.A. Terrestrial ecosystem production: A process model based on global satellite and surface data. Glob. Biogeochem. Cycles 1993, 7, 811–841. [Google Scholar] [CrossRef]
- Li, Q.; Zhang, C.L.; Shen, Y.P.; Jia, W.R.; Li, J. Quantitative assessment of the relative roles of climate change and human activities in desertification processes on the Qinghai-Tibet Plateau based on net primary productivity. CATENA 2016, 147, 789–796. [Google Scholar] [CrossRef]
- Xu, D.Y.; Kang, X.W.; Liu, Z.L.; Zhuang, D.F.; Pan, J.J. Assessing the relative role of climate change and human activity in sandy desertification of Ordos region, China. Sci. China Ser. D Earth Sci. 2009, 56, 855–868. [Google Scholar] [CrossRef]
- Zhou, W.; Gang, C.C.; Zhou, F.C.; Li, J.L.; Dong, X.G.; Zhao, C.Z. Quantitative assessment of the individual contribution of climate and human factors to desertification in northwest China using net primary productivity as an indicator. Ecol. Indic. 2015, 48, 560–569. [Google Scholar] [CrossRef]
- Taylor, K.E. Summarizing multiple aspects of model performance in a single diagram. J. Geophys. Res. Atmos. 2001, 106, 7183–7192. [Google Scholar] [CrossRef]
- Lieth, H. Modeling the Primary Productivity of the World. In Primary Productivity of the Biosphere; Leith, H., Whittaker, R.H., Eds.; Springer: Berlin/Heidelberg, Germany, 1975; pp. 237–263. [Google Scholar] [CrossRef]
- Lieth, H.; Box, E. Evapotranspiration and primary productivity: C.W. Thornthwaite Memorial Model. Publ. Climatol. 1972, 25, 37–46. [Google Scholar]
- Jolliffe, I.T. Principal component analysis: A beginner’s guide—I. Introduction and application. Weather 1990, 45, 375–382. [Google Scholar] [CrossRef]
- North, G.R.; Bell, T.L.; Cahalan, R.F.; Moeng, F.J. Sampling errors in the estimation of empirical orthogonal function. Mon. Weather Rev. 1982, 110, 699–706. [Google Scholar] [CrossRef]
- Na, R.; Du, H.; Na, L.; Shan, Y.; He, H.S.; Wu, Z.; Zong, S.; Yang, Y.; Huang, L. Spatiotemporal changes in the Aeolian desertification of Hulunbuir Grassland and its driving factors in China during 1980–2015. CATENA 2019, 182, 104123. [Google Scholar] [CrossRef]
- Wang, T.; Song, X.; Yan, C.Z.; Li, S.; Xie, J.L. Remote sensing analysis on aeolian desertification trends in Northern China during 1975—2010. J. Desert Res. 2011, 31, 1351–1356. [Google Scholar]
- Xie, J.L.; Lu, Z.X.; Feng, K. Effects of climate change and human activities on aeolian desertification reversal in mu us Sandy land, China. Sustainability 2022, 14, 1669. [Google Scholar] [CrossRef]
- Guo, H.; Xu, M.; Hu, Q. Changes in near-surface wind speed in China: 1969–2005. Int. J. Climatol. 2011, 31, 349–358. [Google Scholar] [CrossRef]
- Hansen, J.; Ruedy, R.; Sato, M.; Lo, K. Global surface temperature change. Rev. Geophys. 2010, 48, RG4004. [Google Scholar] [CrossRef]
- Ma, S.M.; Zhou, T.J.; Dai, A.G.; Han, Z.Y. Observed Changes in the Distributions of Daily Precipitation Frequency and Amount over China from 1960 to 2013. J. Clim. 2015, 28, 6960–6978. [Google Scholar] [CrossRef]
- Wang, T. The progress of research on aeolian desertification. Bull. Chin. Acad. Sci. 2009, 24, 290–296. [Google Scholar] [CrossRef]
- Wang, T. Aeolian desertification and its control in Northern China. Int. Soil Water Conserv. Res. 2014, 2, 34–41. [Google Scholar] [CrossRef]
- Liu, Y.; Liu, R.G.; Chen, J.M. Retrospective retrieval of long-term consistent global leaf area index (1981–2011) from combined AVHRR and MODIS data. J. Geophys. Res. Biogeosci. 2012, 117, G04003. [Google Scholar] [CrossRef]
- Piao, S.L.; Wang, X.H.; Park, T.; Chen, C.; Lian, X.; He, Y.; Bjerke, J.W.; Chen, A.P.; Ciais, P.; Tømmervik, H.; et al. Characteristics, drivers and feedbacks of global greening. Nat. Rev. Earth Environ. 2020, 1, 14–27. [Google Scholar] [CrossRef]
- Duan, H.C.; Wang, T.; Xue, X.; Yan, C.Z. Dynamic monitoring of aeolian desertification based on multiple indicators in Horqin Sandy Land, China. Sci. Total Environ. 2019, 650, 2374–2388. [Google Scholar] [CrossRef]
- Gou, F.; Liang, W.; Sun, S.B.; Jin, Z.; Zhang, W.B.; Yan, J.W. Analysis of the desertification dynamics of sandy lands in Northern China over the period 2000–2017. Geocarto. Int. 2021, 36, 1938–1959. [Google Scholar] [CrossRef]
- Zhang, C.X.; Wang, X.M.; Li, J.C.; Zhang, Z.C.; Zheng, Y. The impact of climate change on aeolian desertification in northern China: Assessment using aridity index. CATENA 2021, 207, 105681. [Google Scholar] [CrossRef]
- Austin, A.T.; Yahdjian, L.; Stark, J.M.; Belnap, J.; Porporato, A.; Norton, U.; Ravetta, D.A.; Schaeffer, S.M. Water pulses and biogeochemical cycles in arid and semiarid ecosystems. Oecologia 2004, 141, 221–235. [Google Scholar] [CrossRef]
- Seneviratne, S.I.; Corti, T.; Davin, E.L.; Hirschi, M.; Jaeger, E.B.; Lehner, I.; Orlowsky, B.; Teuling, A.J. Investigating soil moisture–climate interactions in a changing climate: A review. Earth Sci. Rev. 2010, 99, 125–161. [Google Scholar] [CrossRef]
- Hassani, A.; Azapagic, A.; Shokri, N. Global predictions of primary soil salinization under changing climate in the 21st century. Nat. Commun. 2021, 12, 6663. [Google Scholar] [CrossRef]
- Ma, X.F.; Zhao, C.Y.; Tao, H.; Zhu, J.T.; Kundzewicz, Z.W. Projections of actual evapotranspiration under the 1.5 °C and 2.0 °C global warming scenarios in sandy areas in northern China. Sci. Total Environ. 2018, 645, 1496–1508. [Google Scholar] [CrossRef]
- Bekchanov, M.; Lamers, J.P.A.; Martius, C. Pros and Cons of Adopting Water-Wise Approaches in the Lower Reaches of the Amu Darya: A Socio-Economic View. Water 2010, 2, 200–216. [Google Scholar] [CrossRef]
- Gu, Y.Y.; Pang, B.; Qiao, X.N.; Xu, D.L.; Li, W.J.; Yan, Y.; Dou, H.S.; Ao, W.; Wang, W.L.; Zou, C.X.; et al. Vegetation dynamics in response to climate change and human activities in the Hulun Lake basin from 1981 to 2019. Ecol. Indic. 2022, 136, 108700. [Google Scholar] [CrossRef]
- Ye, J.S.; Delgado-Baquerizo, M.; Soliveres, S.; Maestre, F.T. Multifunctionality debt in global drylands linked to past biome and climate. Glob. Chang. Biol. 2019, 25, 2152–2161. [Google Scholar] [CrossRef]
- Piao, S.L.; Tan, K.; Nan, H.J.; Ciais, P.; Fang, J.Y.; Wang, T.; Vuichard, N.; Zhu, B. Impacts of climate and CO2 changes on the vegetation growth and carbon balance of Qinghai-Tibetan grasslands over the past five decades. Glob. Planet. Chang. 2012, 98, 73–80. [Google Scholar] [CrossRef]
- Chen, B.X.; Zhang, X.Z.; Tao, J.; Wu, J.S.; Wang, J.S.; Shi, P.L.; Zhang, Y.J.; Yu, C.Q. The impact of climate change and anthropogenic activities on alpine grassland over the Qinghai-Tibet Plateau. Agric. For. Meteorol. 2014, 189, 11–18. [Google Scholar] [CrossRef]
- Yang, J.T.; Yang, K.; Wang, C.H. How desertification in northern China will change under a rapidly warming climate in the near future (2021–2050). Theor. Appl. Climatol. 2023, 151, 935–948. [Google Scholar] [CrossRef]
- Jin, Y.Q.; Li, J.; Liu, C.G.; Liu, Y.T.; Zhang, Y.P.; Song, Q.H.; Sha, L.Q.; Chen, A.G.; Yang, D.X.; Li, P.G. Response of net primary productivity to precipitation exclusion in a savanna ecosystem. For. Ecol. Manag. 2018, 429, 69–76. [Google Scholar] [CrossRef]
- Yue, D.X.; Zhou, Y.Y.; Guo, J.J.; Chao, Z.Z.; Guo, X.J. Relationship between net primary productivity and soil water content in the Shule River Basin. Catena 2022, 208, 105770. [Google Scholar] [CrossRef]
- Briggs, J.M.; Knapp, A.K. Interannual variability in primary production in tallgrass prairie: Climate, soil moisture, topographic position, and fire as determinants of aboveground biomass. Am. J. Bot. 1995, 82, 1024–1030. [Google Scholar] [CrossRef]
- Shi, Z.G.; Zhou, P.; Li, X.Z.; Cheng, H.; Sha, Y.Y.; Xie, X.N.; Liu, H.; Wu, J.; Liu, X.D. Distinct Holocene precipitation trends over arid Central Asia and linkages to westerlies and Asian monsoon. Quat. Sci. Rev. 2021, 266, 107055. [Google Scholar] [CrossRef]
- Feng, L.; Zhou, T.J. Water vapor transport for summer precipitation over the Tibetan Plateau: Multidata set analysis. J. Geophys. Res. Atmos. 2012, 117, D20114. [Google Scholar] [CrossRef]
- Zhang, C.; Tang, Q.H.; Chen, D.L. Recent Changes in the Moisture Source of Precipitation over the Tibetan Plateau. J. Clim. 2017, 30, 1807–1819. [Google Scholar] [CrossRef]
- Zhang, G.W.; Zeng, G.; Li, C.; Yang, X.Y. Impact of PDO and AMO on interdecadal variability in extreme high temperatures in North China over the most recent 40-year period. Clim. Dyn. 2020, 54, 3003–3020. [Google Scholar] [CrossRef]
- Chen, F.H.; Xie, T.T.; Yang, Y.J.; Chen, S.Q.; Chen, F.; Huang, W.; Chen, J. Discussion of the “warming and wetting” trend and its future variation in the drylands of Northwest China under global warming. Sci. China Earth Sci. 2023, 66, 1241–1257. [Google Scholar] [CrossRef]
- Ding, Q.H.; Wang, B. Circumglobal teleconnection in the Northern Hemisphere summer. J. Clim. 2005, 18, 3483–3505. [Google Scholar] [CrossRef]
- Huang, W.; Chen, J.H.; Zhang, X.J.; Feng, S.; Chen, F.H. Definition of the core zone of the “westerlies-dominated climatic regime”, and its controlling factors during the instrumental period. Sci. China Earth Sci. 2015, 58, 676–684. [Google Scholar] [CrossRef]
- Chen, J.; Huang, W.; Zhang, Q.; Feng, S. Origin of the spatial consistency of summer precipitation variability between the Mongolian Plateau and the mid-latitude East Asian summer monsoon region. Sci. China Earth Sci. 2020, 63, 1199–1208. [Google Scholar] [CrossRef]
- Ma, Q.R.; Zhang, J.; Game, A.T.; Chang, Y.; Li, S.S. Spatiotemporal variability of summer precipitation and precipitation extremes and associated large-scale mechanisms in Central Asia during 1979–2018. J. Hydro. X. 2020, 8, 100061. [Google Scholar] [CrossRef]
- Sang, Y.F.; Fu, Q.; Singh, V.P.; Sivakumar, B.; Zhu, Y.X.; Li, X.X. Does summer precipitation in China exhibit significant periodicities? J. Hydrol. 2020, 581, 124289. [Google Scholar] [CrossRef]
- Wu, P.; Liu, Y.J.; Ding, Y.H.; Li, X.C.; Wang, J. Modulation of sea surface temperature over the North Atlantic and Indian-Pacific warm pool on interdecadal change of summer precipitation over northwest China. Int. J. Climatol. 2022, 42, 8526–8538. [Google Scholar] [CrossRef]
- Yang, Q.; Ma, Z.G.; Fan, X.G.; Yang, Z.L.; Xu, Z.F.; Wu, P.L. Decadal Modulation of Precipitation Patterns over Eastern China by Sea Surface Temperature Anomalies. J. Clim. 2017, 30, 7017–7033. [Google Scholar] [CrossRef]
- Ding, Y.H.; Wu, P.; Liu, Y.J. Modulation of sea surface temperature in three oceans on precipitation increase over Northwest China during the past 60 years: A review. Front. Clim. 2022, 4, 1015225. [Google Scholar] [CrossRef]
- Bryan, B.A.; Gao, L.; Ye, Y.Q.; Sun, X.F.; Connor, J.D.; Crossman, N.D.; StaffordSmith, M.; Wu, J.G.; He, C.Y.; Yu, D.Y.; et al. China’s response to a national land-system sustainability emergency. Nature 2018, 559, 193–204. [Google Scholar] [CrossRef] [PubMed]
- Wang, Q.; Zhang, B.; Zhang, Z.Q.; Zhang, X.F.; Dai, S.P. The Three-North Shelterbelt Program and dynamic changes in vegetation cover. J. Resour. Ecol. 2014, 5, 53–59. [Google Scholar] [CrossRef]
- Gao, X.H.; Wang, Y.M.; Wang, J.H.; Yan, C.Z.; Li, Z.F. Analysis on desertification dynamics based on remote sensing and GIS in zone along the Great Wall in northern Shaanxi province. J. Desert Res. 2005, 25, 63–67. [Google Scholar]
- Yan, Q.L.; Zhu, J.J.; Hu, Z.B.; Sun, O.J. Environmental impacts of the shelter forests in Horqin Sandy Land, Northeast China. J. Environ. Qual. 2011, 40, 815–824. [Google Scholar] [CrossRef]
- Cao, J.J.; Zhang, X.F.; Deo, R.; Gong, Y.F.; Feng, Q. Influence of stand type and stand age on soil carbon storage in China’s arid and semi-arid regions. Land Use Policy. 2018, 78, 258–265. [Google Scholar] [CrossRef]
- Li, J.Y.; Xu, B.; Yang, X.C.; Qin, Z.H.; Zhao, L.N.; Jin, Y.X.; Zhao, F.; Guo, J. Historical grassland desertification changes in the Horqin Sandy Land, Northern China (1985–2013). Sci. Rep. 2017, 7, 3009. [Google Scholar] [CrossRef]
- Yi, Y.; Shi, M.C.; Wu, J.; Yang, N.; Zhang, C.; Yi, X.D. Spatio-Temporal Patterns and Driving Forces of Desertification in Otindag Sandy Land, Inner Mongolia, China, in Recent 30 Years. Remote Sens. 2022, 15, 279. [Google Scholar] [CrossRef]
- Li, R.; Wu, Q.; Li, X.; Sheng, Y.; Hu, G.; Cheng, G.; Wu, X. Characteristic, changes and impacts of permafrost on Qinghai-Tibet Plateau. Chin. Sci. Bull. 2019, 64, 2783–2795418. [Google Scholar] [CrossRef]
- Chang, Q.; Xie, B. Vegetation of Dynamics and Climate Change of the Loess Plateau; Science Press: Beijing, China, 2019. [Google Scholar]


| Data | Source | Spatial Resolution | Temporal Resolution |
|---|---|---|---|
| NDVI | Advanced Very High-Resolution Radiometer (AVHRR) | 1/12° | 15 days |
| Land cover | The multi-period land-use land cover remote sensing monitoring dataset for China [51] | 30 m | - |
| Solar radiation | High spatial resolution (10 km) surface solar radiation dataset with by merging sunshine hours over China [52] | 10 km | Monthly |
| Precipitation | The Global Precipitation Climatology Centre | 0.25° | Monthly |
| Evapotranspiration | The Global Land Evaporation Amsterdam Model (GLEAM) | 0.25° | Monthly |
| Wind speed | The European Centre for Medium-Range Weather Forecasts Reanalysis v5 (ERA5) | 0.25° | Monthly |
| Near-surface air temperature | |||
| Potential evapotranspiration | |||
| NPP (for validate) | The Global Land Surface Satellite (GLASS) | 500 m | 8 days |
| Pacific Decadal Oscillation (PDO) index | The National Centers for Environmental Information | - | Monthly |
| Atlantic Multidecadal Oscillation (AMO) index | |||
| Population | The Global Human Settlement Layer (GHSL) [53] | 30″ | 5 years |
| Cropland | The 30 m annual cropland dataset of China [54] | 30 m | Yearly |
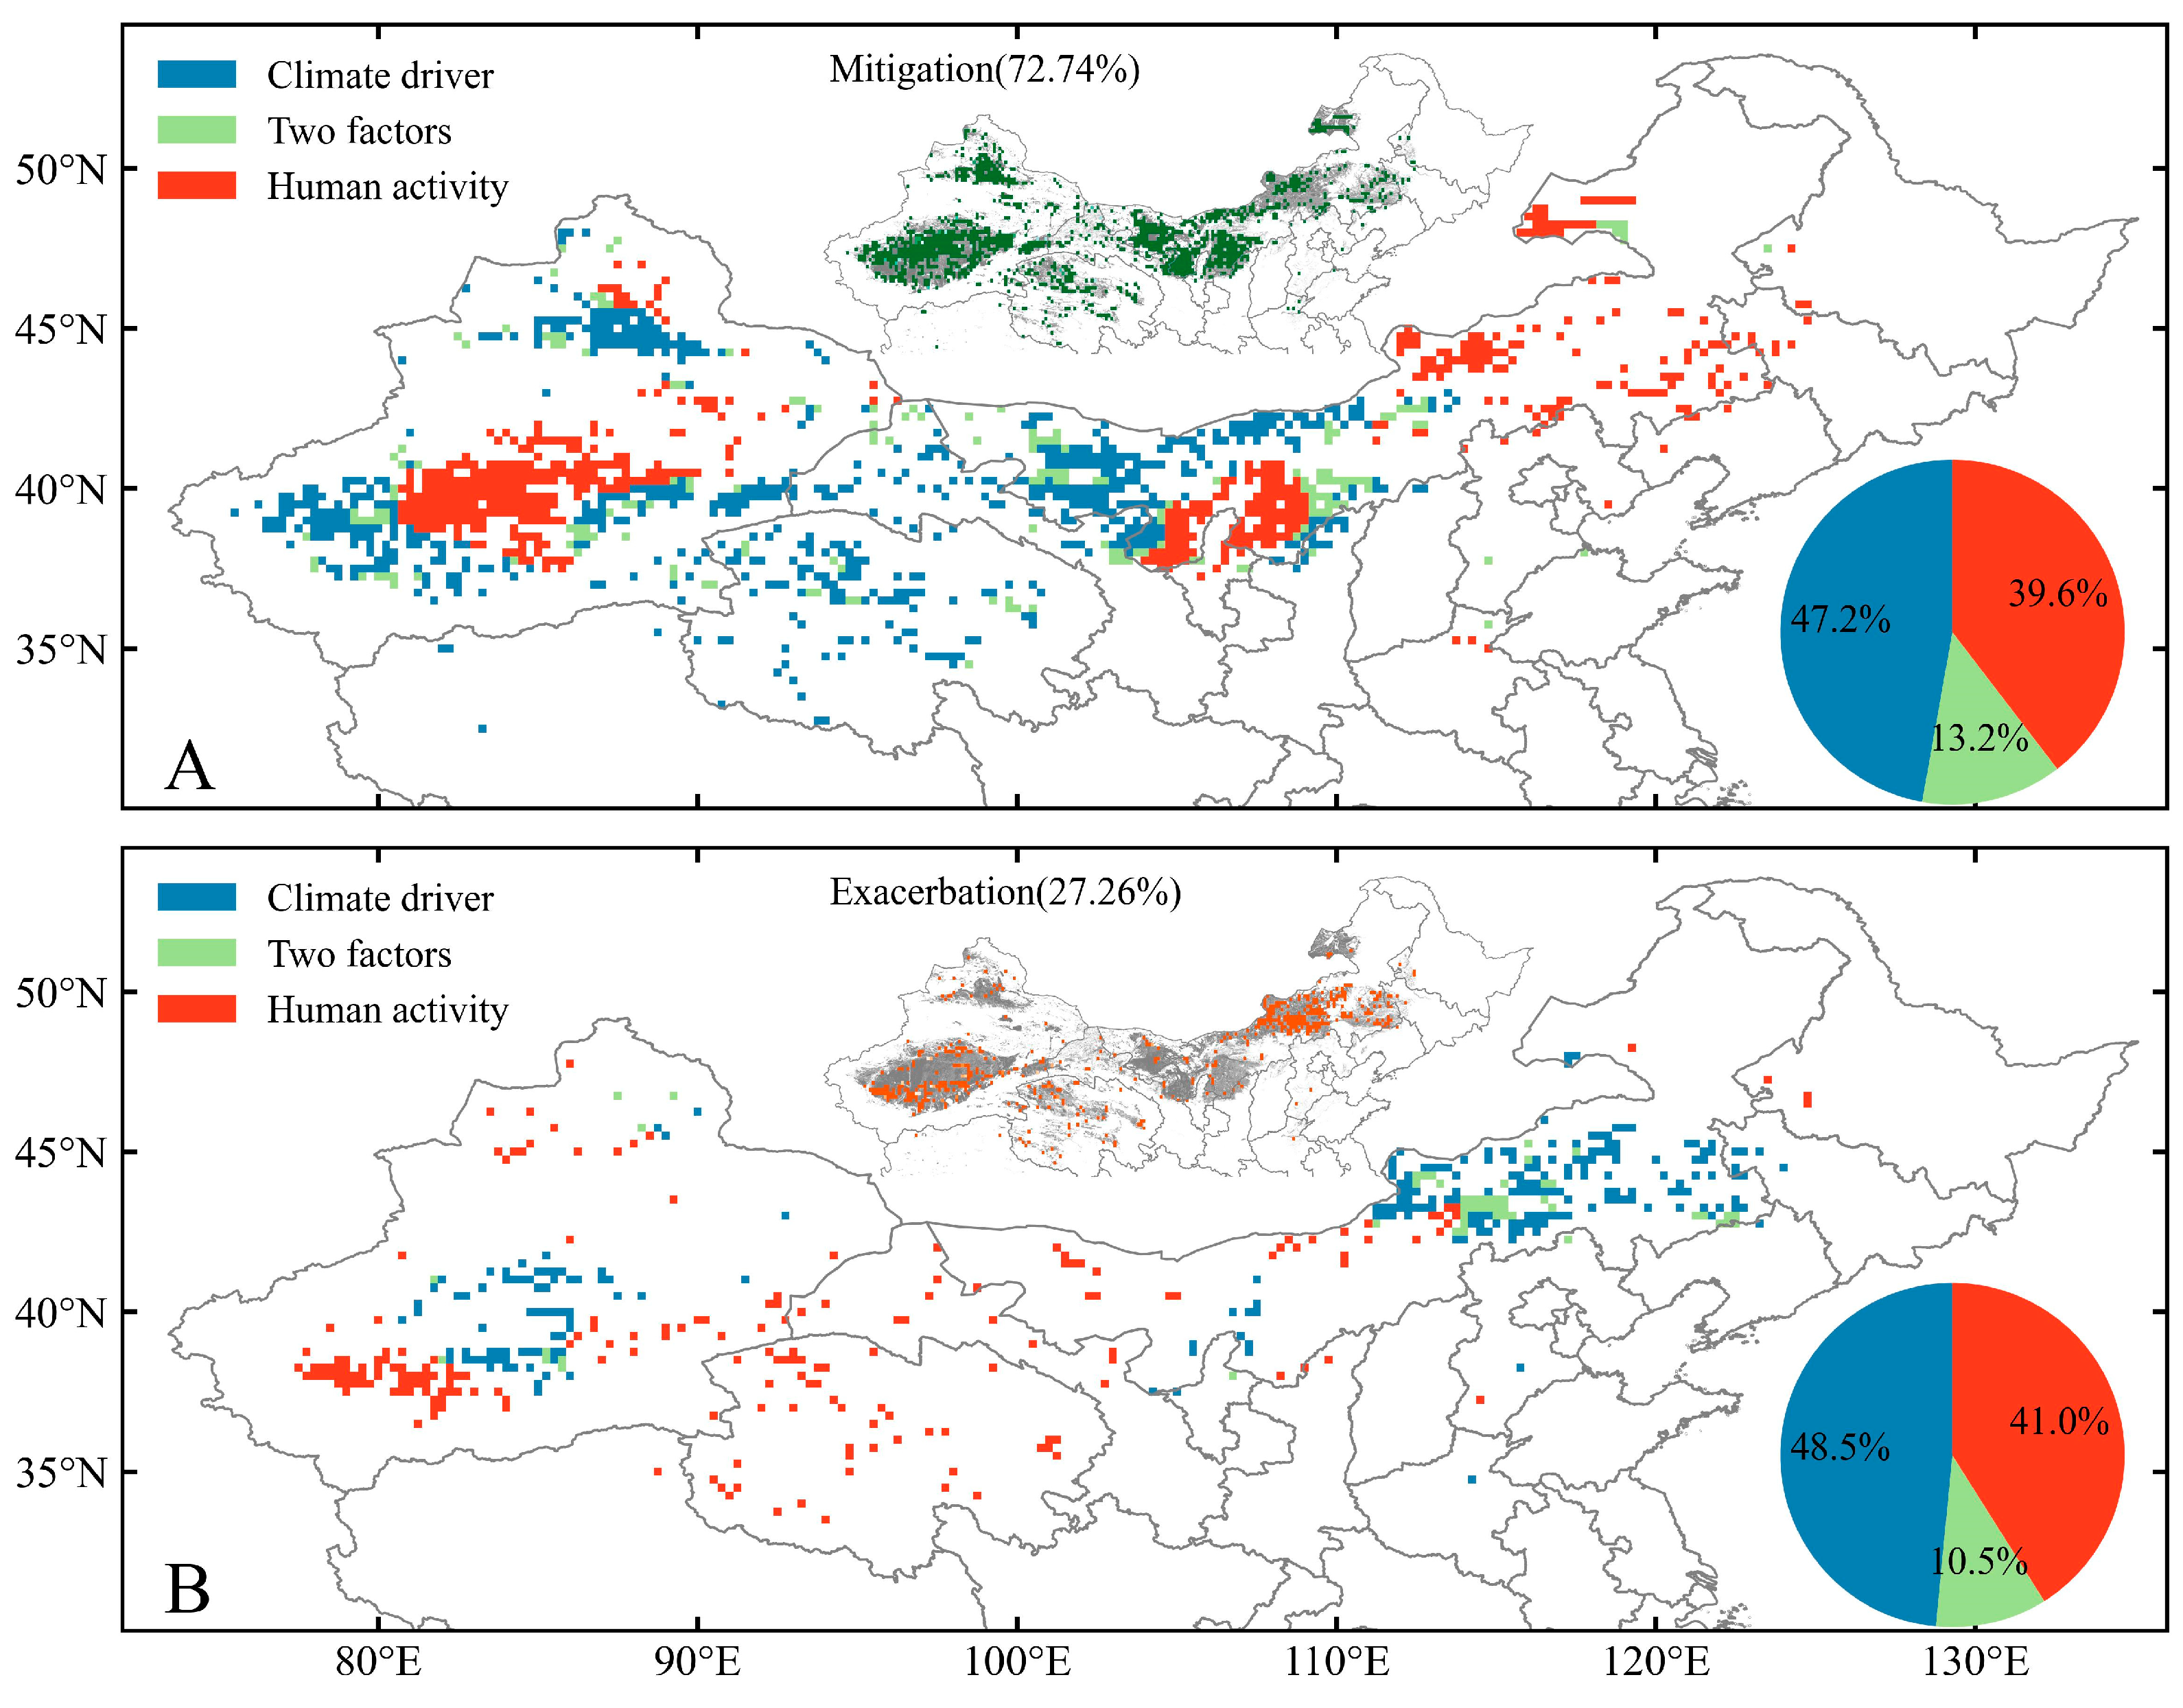
| Desertification Trend | SANPP | SPNPP | SHNPP | Dominant Factors |
|---|---|---|---|---|
| Mitigation | >0 | <0 | <0 | Human activity |
| >0 | >0 | Climate drivers | ||
| >0 | <0 | Two factors | ||
| Exacerbation | <0 | <0 | <0 | Climate drivers |
| >0 | >0 | Human activity | ||
| <0 | >0 | Two factors |
Disclaimer/Publisher’s Note: The statements, opinions and data contained in all publications are solely those of the individual author(s) and contributor(s) and not of MDPI and/or the editor(s). MDPI and/or the editor(s) disclaim responsibility for any injury to people or property resulting from any ideas, methods, instructions or products referred to in the content. |
© 2024 by the authors. Licensee MDPI, Basel, Switzerland. This article is an open access article distributed under the terms and conditions of the Creative Commons Attribution (CC BY) license (https://creativecommons.org/licenses/by/4.0/).
Share and Cite
Li, H.; Yang, K.; Cui, Y.; Ai, L.; Wang, C.; Wang, Z.; Zhang, C. Desertification Mitigation in Northern China Was Promoted by Climate Drivers after 2000. Remote Sens. 2024, 16, 3706. https://doi.org/10.3390/rs16193706
Li H, Yang K, Cui Y, Ai L, Wang C, Wang Z, Zhang C. Desertification Mitigation in Northern China Was Promoted by Climate Drivers after 2000. Remote Sensing. 2024; 16(19):3706. https://doi.org/10.3390/rs16193706
Chicago/Turabian StyleLi, Haohui, Kai Yang, Yang Cui, Lingyun Ai, Chenghai Wang, Zhenting Wang, and Caixia Zhang. 2024. "Desertification Mitigation in Northern China Was Promoted by Climate Drivers after 2000" Remote Sensing 16, no. 19: 3706. https://doi.org/10.3390/rs16193706