Article

Satellite-Based Detection of Algal Blooms in Large Alpine Lake Sevan: Can Satellite Data Overcome the Unavoidable Limitations in Field Observations?

by
Shushanik Asmaryan
1,
Anahit Khlghatyan
1,
Azatuhi Hovsepyan
1,
Vahagn Muradyan
1,
Rima Avetisyan
1,
Gor Gevorgyan
2,
Armine Hayrapetyan
2,
Mayada Mohamed Alshahat Arafat Eissa
3,4,
Hendrik Bernert
5,
Martin Schultze
4 and
Karsten Rinke
4,6,*
1
Center for Ecological-Noosphere Studies, National Academy of Sciences of the Republic of Armenia, Yerevan 0025, Armenia
2
Scientific Centre of Zoology and Hydroecology, National Academy of Sciences of the Republic of Armenia, Yerevan 0014, Armenia
3
Faculty of Spatial Planning and Infrastructure Systems, Cologne University of Applied Sciences, 50679 Cologne, Germany
4
Department Lake Research, Helmholtz Centre for Environmental Research—UFZ, 39114 Magdeburg, Germany
5
EOMAP GmbH & Co. KG, 82229 Seefeld, Germany
6
Faculty of Environment and Natural Sciences, Brandenburg University of Technology, 03046 Cottbus, Germany
*
Author to whom correspondence should be addressed.
Remote Sens. 2024, 16(19), 3734; https://doi.org/10.3390/rs16193734
Submission received: 23 July 2024 / Revised: 13 September 2024 / Accepted: 1 October 2024 / Published: 8 October 2024
(This article belongs to the Section Environmental Remote Sensing)

Abstract

:
Lake Sevan in Armenia is a unique, large, alpine lake given its surface, volume, and geographic location. The lake suffered from progressing eutrophication and, since 2018, massive cyanobacterial blooms repeatedly occurred. Although the lake is comparatively intensely monitored, the feasibility to reliably detect the algal bloom events appeared to be limited by the established in situ monitoring, mostly because algal bloom dynamics are far more dynamic than the realized monitoring frequency of monthly samplings. This mismatch of monitoring frequency and ecosystem dynamics is a notorious problem in lakes, where plankton dynamics often work at relatively short time scales. Satellite-based monitoring with higher overpass frequency, e.g., by Sentinel-3 OLCI with its daily overcasts, are expected to fill this gap. The goal of our study was therefore the establishment of a fast detection of algal blooms in Lake Sevan that operates at the time scale of days instead of months. We found that algal bloom detection in Lake Sevan failed, however, when it was only based on chlorophyll due to complications with optical water properties and atmospheric corrections. Instead, we obtained good results when true-color RGB images were analyzed or a specifically designed satellite-based HAB indicator was applied. These methods provide reliable and very fast bloom detection at a scale of days. At the same time, our results indicated that there are still considerable limitations for the use of remote sensing when it comes to a fully quantitative assessment of algal dynamics in Lake Sevan. The observations made so far indicate that algal blooms are a regular feature in Lake Sevan and occur almost always when water temperatures surpass approximately 20 °C. Our satellite-based method effectively allowed for bloom detection at short time scales and identified blooms over several years where classical sampling failed to do so, simply because of the unfortunate timing of sampling dates and blooming phases. The extension of classical in situ sampling by satellite-based methods is therefore a step towards a more reliable, faster, and more cost-effective detection of algal blooms in this valuable lake.

1. Introduction

Lake water quality is a key factor for human well-being and environmental health but is at risk due to anthropogenic activities leading to nutrient pollution and eutrophication [1,2]. Major drivers are urban and domestic wastewater inputs, agricultural land use and run-off as well as climate change. For protecting lake ecosystems and fulfilling human needs at the same time, proper management is needed, and adequate monitoring and understanding of the lake ecosystem are key prerequisites for successful management. Generally, field measurements (further on called in situ monitoring) are widely accepted as proper instruments for water quality monitoring. However, in many regions, classical monitoring capacities are limited, and in the case of large water bodies, they lack monitoring at the required spatial and temporal scales [3,4,5,6]․ In this context, remote sensing is a good complement because of the main advantage to cover vast geographical areas, which shows the great potential to be used for assessing spatiotemporal dynamics of water quality in a cost-effective and informative manner. However, remote sensing data are not a one-size-fits-all solution and require in situ data-based validation to ensure the reliability of the provided information [3,4,6,7,8,9].
When using remote sensing methods and data for inland/lake water quality assessment, it is important to define the requirements/characteristics for the remote sensing sensor (spatial, temporal, radiometric resolution, etc.) based on the research objectives [10]․ The size of the investigated lake defines the required spatial resolution of the sensors. However, due to the short generation time and life cycle of phytoplankton, in addition to other sensor characteristics, high temporal resolution is similarly important when studying lakes [11].
The Copernicus Sentinel-3 OLCI instrument, launched in February 2016, captures light across 21 spectral bands (390–1040 nm). It has been providing accessible products since 2016, which enables the monitoring of water bodies at 300 m resolution and daily scales (https://sentiwiki.copernicus.eu/web/s3-olci-instrument (accessed on 21 July 2024)). Sentinel-3 OLCI has great potential for studying spatial–temporal patterns of water optical characteristics [3,9,12,13]. Although Sentinel-3 OLCI’s main mission is defined as “to measure sea surface topography, sea and land surface temperature, and ocean and land surface color with high accuracy and reliability to support ocean forecasting systems, environmental monitoring and climate monitoring” (https://sentinels.copernicus.eu/web/sentinel/missions/sentinel-3 (accessed on 20 July 2024)), its characteristics make it similarly attractive for inland waters, especially for water bodies with large surface area so that the 300 m resolution delivers multiple grid cells and the required spatial representation. Also, the temporal resolution of Sentinel-3 OLCI as the main advantage over data from other sensors (e.g., Sentinel-2) should be highlighted, which enables us to ensure reliable time series of input data [9,12,13].
Lake Sevan is the largest freshwater lake in the Caucasus region (ca. 1278 km2, 38.1 km3) and is an ecological treasure hosting endemic species [14,15]. In the last century, Lake Sevan suffered from ecologically inadequate management, resulting in a reduction in the water level (maximum 19.24 m, currently ca. 15 m), eutrophication, cyanobacterial blooms, introduction of new fish species and almost complete extinction of two endemic fish subspecies [14,15,16,17]. Additionally, field monitoring was limited due to limited economic and infrastructural capacities in the past but has improved considerably in recent years. Current monitoring, however, of this large lake focusses on sampling at the deepest sites of the two lake basins and hence cannot cover the spatial complexity of the water body, particularly with respect to phytoplankton dynamics. Furthermore, the sampling frequency of monthly field samplings does not cover the phytoplankton dynamics and runs at risk to overlook blooming events and chlorophyll (CHL) peaks. Remote sensing is an option to overcome these limitations given the abilities of Sentinel-3 OLCI. However, previous and some current studies of Lake Sevan using remote sensing were not able to unlock this potential in eutrophication and algal dynamics monitoring [18,19,20,21,22,23,24,25]. Furthermore, Lake Sevan has some features that interfere with standard procedures in satellite-based algal monitoring: first, Lake Sevan is a high-altitude lake located about 1900 m a.s.l., and second, the lake often shows large-scale calcite precipitation (lake whitening) that heavily changes the optical water properties. Therefore, this study aimed to develop an approach of satellite-based detection of algal blooms in the reality of methodological challenges and data-scarce environments with the example of Lake Sevan. For this purpose, the following research objectives were defined:
  • Collect available monitoring information about algal blooms from in situ monitoring and expert-based assessment of algal blooms based on the visual inspection of true-color RGB satellite imagery.
  • Identify a robust remote sensing-based indicator to detect algal blooms and to enable operational monitoring.
  • Characterize the water temperature conditions during blooming phases in the lake.
  • Identify the added value of using remote sensing for monitoring algal blooms in Lake Sevan and its information value for decision makers.

2. Materials and Methods
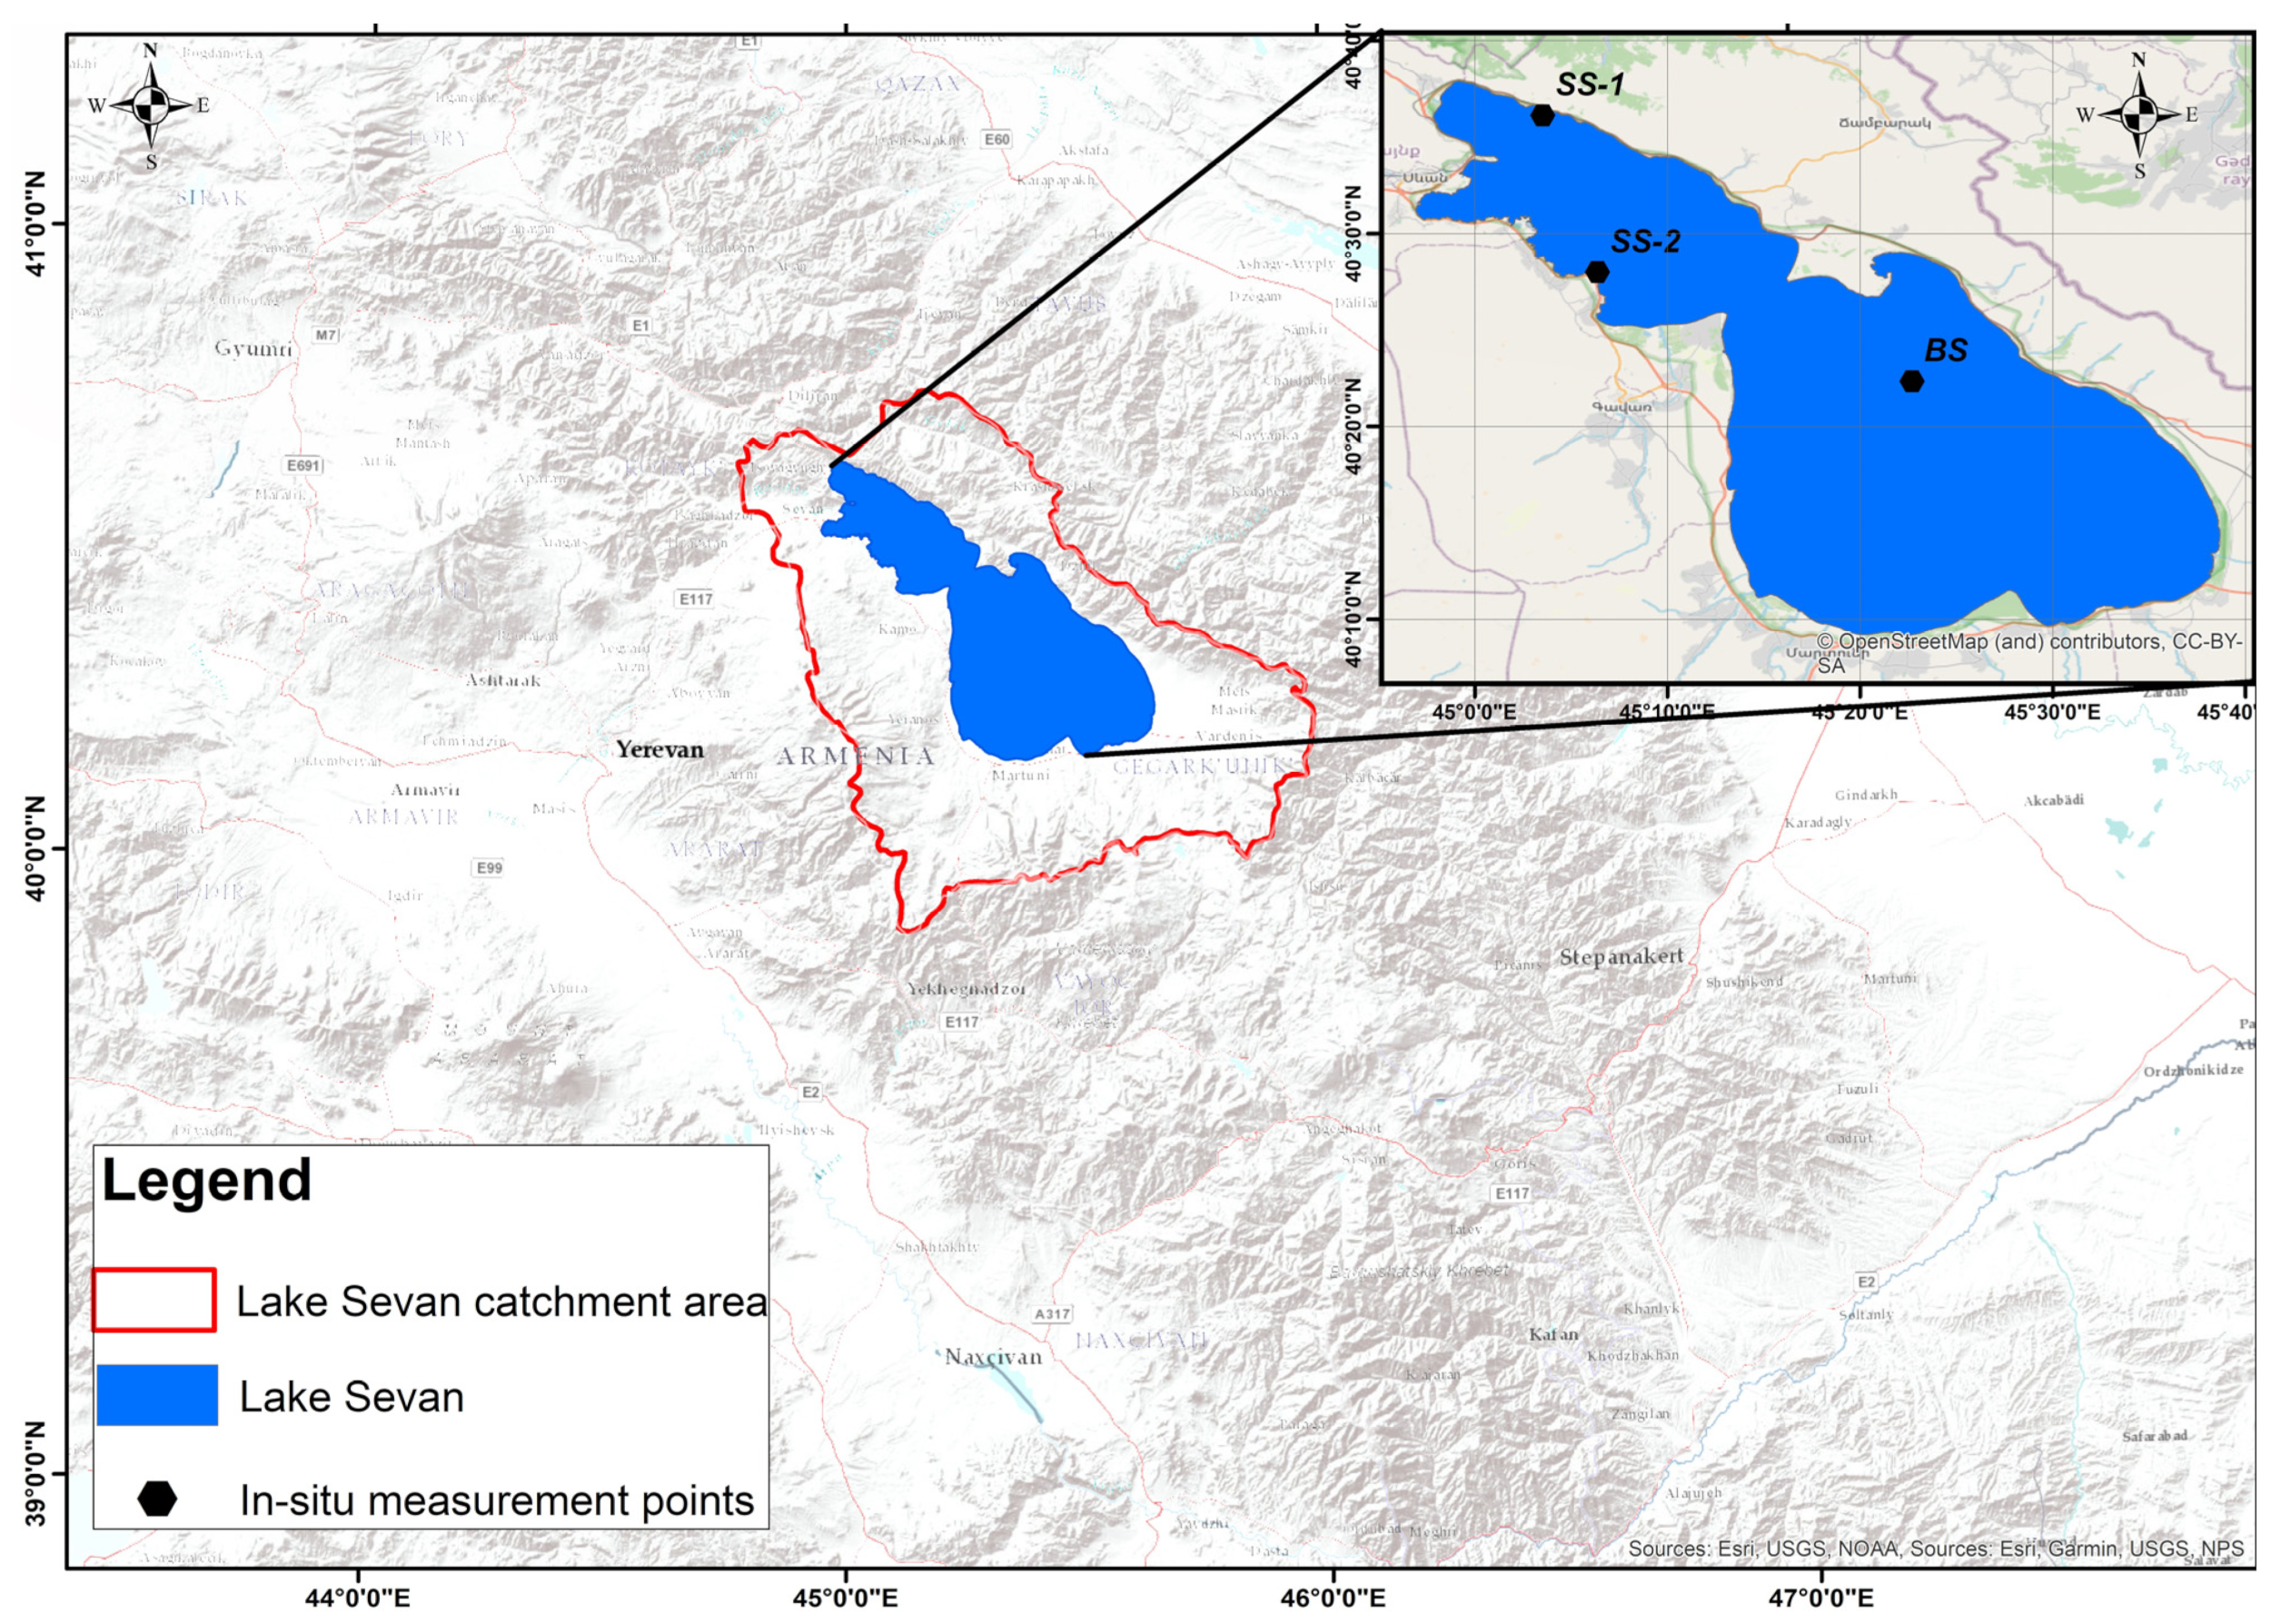
2.1. Study Area

Lake Sevan (40°23′N, 45°21′E) is a large, high mountain lake located in Gegharkunik province in Armenia (Table 1, Figure 1). It is Armenia’s largest water body and the largest freshwater resource for the Caucasian region [15]. Lake Sevan is divided into two parts by an underwater sill—Big Sevan and Small Sevan. Lake Sevan is fed by 28 rivers and streams, the Arpa–Sevan tunnel (which transfers water from neighboring catchments of the Arpa River and Vorotan River), precipitation and also, to a small extent, by groundwater. Hrazdan Rriver is the only outflow and about 84% of all inflowing water into Lake Sevan is lost by evaporation [26]. The ratio of the surfaces of Lake Sevan and its catchment basin is small and about 1:3 (1278 km2 and 3649 km2, respectively) [15]․ Most inflows enter the Big Sevan basin while the outflow is from Small Sevan.
Beginning in the 1930s, the water level of Lake Sevan was lowered in order to reduce the surface area and, thus, the evaporative water losses and to exploit the withdrawn water for hydropower and irrigation [27].
In addition to the artificial lowering of the water level, increasing population and increasing agriculture caused eutrophication [28,29,30]. In the 1970s, 1980s and in recent years, cyanobacterial blooms occurred in Lake Sevan [16,31,32,33], indicating ongoing deterioration of the water quality. For more details on Lake Sevan, see [14,15,17].

2.2. In Situ Measurements for Chlorophyll and Water Temperature
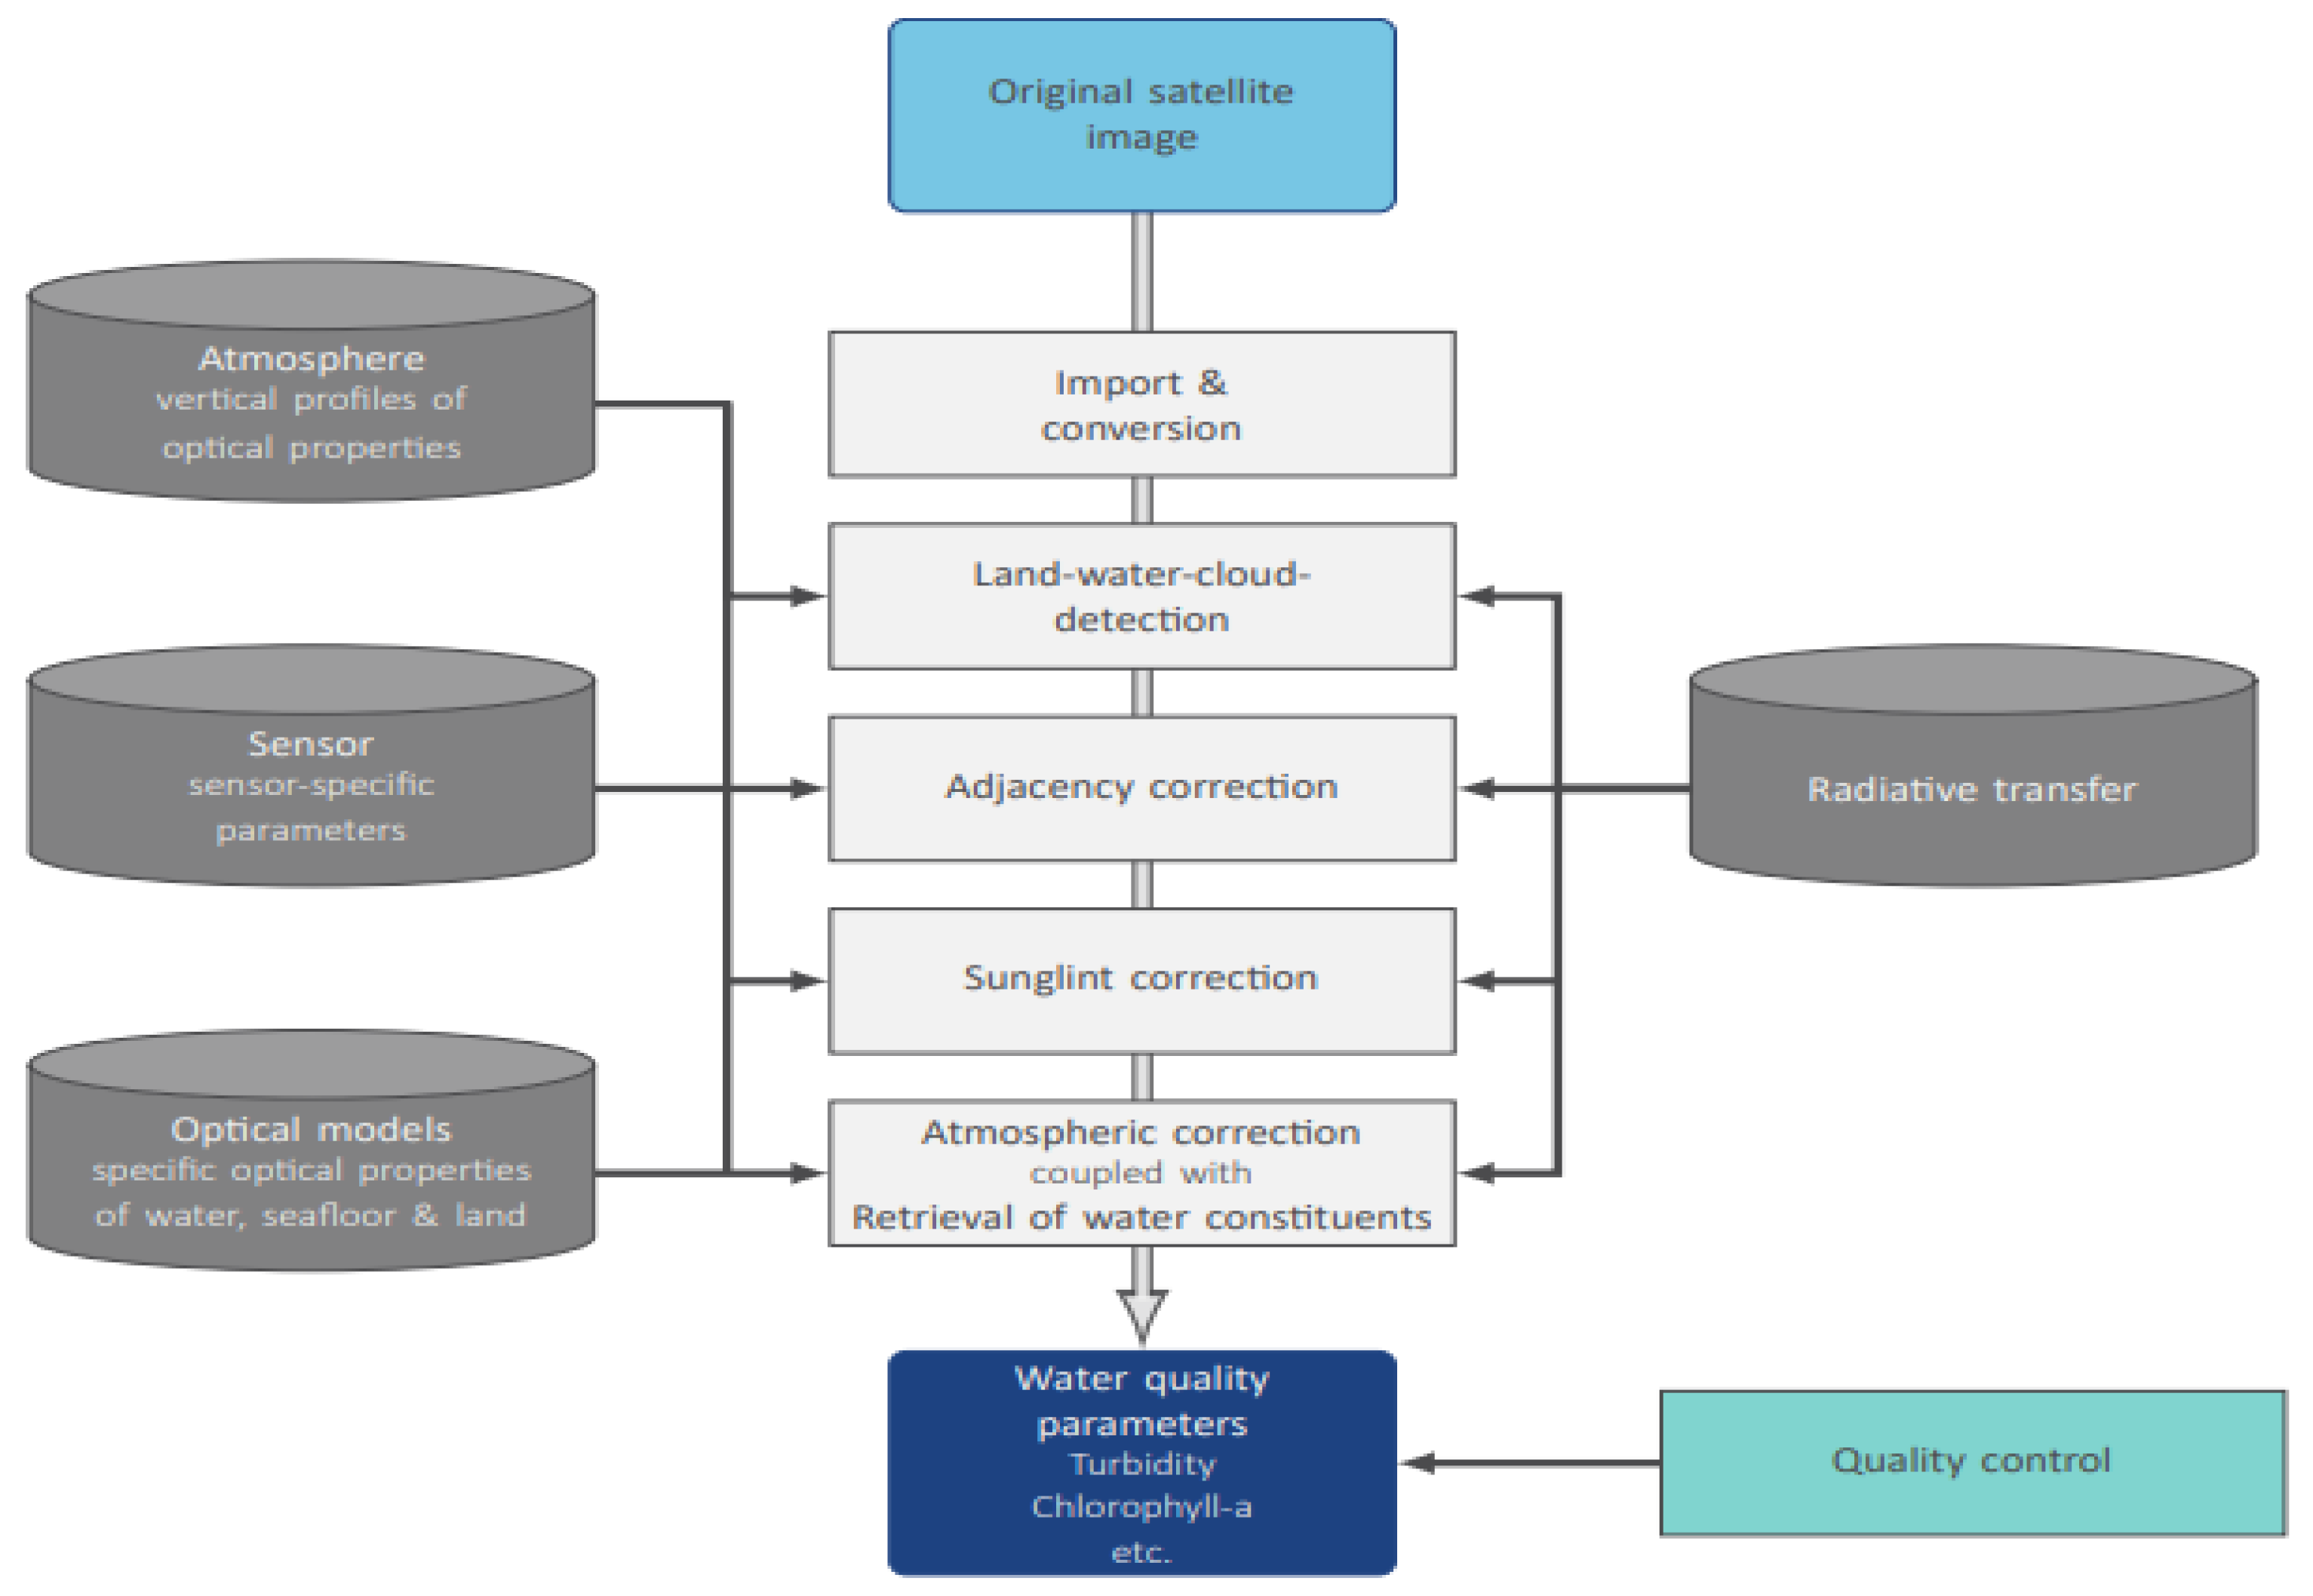
Field campaigns of in situ measurements have been conducted since 2018 on a monthly basis. In situ measurements at two locations are available for the years 2018–2020 and at three locations for 2021 (Table 2). The water samples for chlorophyll-a (CHL) analysis were collected using a Molchanov bathometer (GR-18, Gidrometpribor, Moscow, Russian Federation) at the following depths: 0, 0.5, 5, 10, and 20 m. Water was filtered through fiber filters (Whatman GF/F, Whatman, Maidstone, United Kingdom) and stored in a freezer at −20 °C until lab analysis. CHL was extracted from filters using 90% ethanol at 70 °C for 2 h and analyzed by a spectrophotometer (DV-8200; Drawell Scientific, Chongqing, China) measuring absorbance at 665 nm according to ISO10260:1992.
The in situ measurements of surface water temperature were carried out from 2018 to 2021 at a monthly scale in both sub-basins (Table 2), Big Sevan (BS) and Small Sevan (SS), at a depth of 0.5 m with digital thermometers (ST-9265; ATM Limited, Chashan, China and HI98501; Hanna Instruments, Nusfalau, Romania) immediately after water retrieval.

2.3. Remote Sensing

2.3.1. Chlorophyll Concentration, Secchi Disc Depth and Harmful Algal Bloom (HAB) Indicator

We used Sentinel-3 OLCI observations within the time period from April to November for the years 2017 to 2022 (i.e., one year more than in the in situ sampling mentioned above). Overall, in these 6 years, 1226 scenes were available but we excluded scenes with low quality due to fog or sun glint and with cloud cover of more than 20% over the area of interest (AOI). In consequence, 750 scenes with 300 m spatial resolution were considered, representing 61% of the satellite overcasts. Note, however, that during summer, i.e., when the blooms occurred, the percentage of unusable satellite scenes was far below 30% simply because of low cloud abundance.
These scenes were processed for the target parameters CHL, Secchi Disk Depth (SDD) and a qualitative harmful algal bloom (HAB) indicator using EOMAP’s Modular Inversion and Processing System (MIP) [34,35]. The MIP’s physics-based architecture includes all relevant processing steps to guarantee a robust, standardized and operational retrieval of water properties from satellite data sources. The workflow, as pictured in Figure 2, contains all the necessary steps towards a reliable retrieval of in-water constituents, such as a land–water–cloud differentiation, adjacency correction and a coupled retrieval of atmospheric and in-water properties [36]. The MIP modules were not accessed directly, but through the browser-based interface of EOMAP’s eoApp® Aqua.
CHL within the MIP environment is derived from its pigment-specific absorption spectrum, with 1 µgL−1 CHL being equal to 0.035 m−1 of pigment absorption at 440 nm. Remotely sensed CHL, as used within this context, is interpreted as total chlorophyll a. SDD, on the other hand, is calculated from the attenuation coefficient Kd, using total in-water absorption and scattering, both of which are physically derived within the MIP [37,38].
Lastly, the HAB indicator is retrieved from the residuals of the modeling procedure carried out within the MIP as outlined in [34]. Although the fingerprints of typical cyanobacterial pigments such as phycocyanin and phycoerythrin are not explicit outputs of the physics-based radiative transfer model, their absorption and scattering are visible in the different optical satellite bands. As a matter of fact, these features create notable spectral mismatches between the modeled and measured radiances, which are then translated into occurrence probability classes, ranging from 1 (no HAB) and 2 (low probability of HAB) to 3 (medium probability) and 4 (high probability). For details of the underlying algorithm, refer to [34].
MIP-processed data come with a pixel-wise quality indicator that ranges from 0 (worst) to 100 (best). It takes the most relevant influence factors into account, such as atmospheric properties, illumination intensity or sensor view angles. Pixels with a quality lower than 50 are automatically flagged and therefore not contained in the resulting raster files. Further filtering was later carried out during the statistical analysis (see Section 2.5).

2.3.2. Water Temperature

The Copernicus Global Land Operations (C-GLOPS) Lake Water provides thermal lake water products of lake surface water temperature (LSWT). LSWT is the temperature of the water at the surface skin of the water body. The products are based on observations in infrared light and visible light using The Sea and Land Surface Temperature Radiometer (SLSTR) instruments on Sentinel-3A and Sentinel-3B and they are freely available on the Copernicus Global Land Portal (https://land.copernicus.eu/en (accessed on 21 July 2024)). The parameters are provided as 10-day averages on a set grid that starts on the 1st, 11th and 21st day of each month and mapped at a resolution of 1000 m for LSWT [39]. For C-GLOPS LSWT products, the data are taken as the 10-day average to maximize spatial coverage and avoid gaps of the monitored parameter. Therefore, to obtain a time series of the same day in accordance with the in-situ measurements, we used linear interpolation to obtain the respective daily values.

2.4. Expert-Based Bloom Detection by Inspecting RGB Orthophotos

Gevorgyan et al. (2020) had already documented that algal blooms of very high intensity are well visible on the RGB images from satellites for Lake Sevan [16]. In addition to the physics-based processing of remote sensing data, we therefore defined a simple and pragmatic approach in order to identify blooming events based on the RGB orthophotos. All RGB scenes from 2017 to 2022 were inspected by two water quality experts (M. Schultze and K. Rinke) via the website https://dataspace.copernicus.eu/ (accessed on 21 July 2024); they assigned YES or NO as simple binary variables to each scene with respect to algal blooms. Scenes which appeared to have been too influenced by clouds, sun glint or whitening because of calcite precipitation were excluded by the experts, resulting in 700 scenes evaluated by YES or NO. The experts were unaware of the remote sensing-based results prior to their judgment. All scenes with a visible scum formation and a greenish color were marked as “blooming”.
We are fully aware that this judgment is subjective and other experts may decide slightly differently, so the reproducibility of the results was restricted compared to that of a completely mathematical procedure. However, all authors agreed that the massive bloom events are well recognizable on the RGB scenes and perceptions were congruent between all authors. Nevertheless, in order to make this expert knowledge more transparent to the readers, we included exemplary RGB images of Lake Sevan, showing either an algal bloom or no bloom (Figure 3). Note that expert judgment is a binary variable, i.e., if a bloom event was noticed only in some larger parts of the lake, say in most of the surface area of Big Sevan, it counted as a bloom event. In Lake Sevan, algal blooms are often spatially heterogeneous and do not necessarily affect the whole lake at the same level due to wind induced transport and the differential growth of algae. In conclusion, an expert judgment of bloom = YES may involve a bloom event that is restricted to some parts of the lake (see Figure 3) and is not detectable all over the entire lake.

2.5. Statistical Analysis

In order to understand the relationship of the data received from the different sources, we made a comparison of in situ measured and remotely retrieved CHL data. For this purpose, time series were extracted around the three stations (Small Sevan, Big Sevan and Fish Farm) using a 5 × 5 pixel box around the coordinates. Compared to smaller and larger spatial aggregations, this pixel box was found to give robust estimates, and also, a methodological study on spatial aggregations supported a 5 × 5 pixel aggregation [40]. Within these boxes, statistics and percentages of valid pixels from all pixels within the box were calculated. Then, time series were filtered for “valid pixel count” (at least 5 pixels) and for the median of total quality (QUT_med) for each box of each scene in time series (threshold: 75).
For a better comparison of in situ-measured multi-depth and remotely sensed CHL, the in situ data were weighted based on the z90 depth coming from the satellite products. z90 is the depth to which 90% of the water-leaving signal can be attributed. This weighting was conducted using all measurements between the surface and z90, and then interpolating them in steps of 0.1 m until the z90 depth was reached. The weights for each of these “layers” were then calculated based on the Lambert–Beer law, assuming exponential attenuation of light with depth [40,41] (Equation (1)):
N W = exp ( 1 · D e p t h · K d )
where NW is a normed weight, and Kd (m−1) is the spectral attenuation coefficient and is calculated as follows (Equation (2)):
K d = l n ( 0.1 ) / z 90
Afterwards, a weighted average (CHL) of all these values were calculated according to the following formula (Equation (3)):
C H L a = i = 0.1 z 90 N W i · i n t e r p o l a t e d   C H L a   ( i ) / i = 0.1 z 90 N W i ,
We compared in situ-measured and remotely derived CHL values by calculating Pearson correlation coefficients. From bloom detection, we assumed the expert-based RGB inspections as true observations of blooms and applied decision tree (DT) models in order to identify robust thresholds in remotely sensed water quality variables that can be used for a satellite-based bloom detection [42,43]. Decision trees (DTs) are effective and widely-used statistical methods in classification problems. Decision trees identify binary data-splitting criteria that maximize the explained variability. They enable to identify valuable patterns [44,45]. DT classifiers are effectively applied in a variety of fields, including radar signal classification, character recognition, remote sensing, medical diagnosis, expert systems, speech recognition, etc. [46].
In our study, in order to determine the best splitting points and to pinpoint the most significant features among the water quality parameters, we extracted decision thresholds using DT models. These thresholds represent critical points at which the DT model “decides” to split the data.
The determination of these thresholds helped us to, for example, identify a critical value of the HAB indicator that gives the best overlap with the RGB-based classification and, by which, offers a data-driven basis for identifying the conditions that might characterize blooms. Afterwards, a contingency table was applied for the validation of the classification results. All these analyses were performed on Jupiter Notebook web application using Python programing language.
Linear models and generalized models (GLM) were used for analyzing CHL, SDD, and LWST conditions in relation to blooming and non-blooming conditions. Whenever the blooming state was the response variable, i.e., a binary response variable, we applied a logistic regression using a GLM with a binomial error structure. In this case, a pseudo-R2 was computed according to McFadden (1972) based on the explained deviance compared to the null model deviance [47]. All linear models were computed in R under Version R4.4.0 [48].

3. Results

In situ data reflected the seasonal development of temperature and plankton and characterized Lake Sevan as a clear water lake as the Secchi depth ranged between 3 and 7 m and chlorophyll mostly remained below 10 µgL−1 (at 0.5 m depth). Although during the summer chlorophyll concentrations are sometimes slightly higher than in the cold season, this is not always the case. Similarly, conditions in early spring can present near zero chlorophyll or can show values up to 10 µgL−1. Water temperature is therefore a weak predictor of chlorophyll and Secchi depth and correlations among these two variables with temperature remain insignificant. As expected, Secchi depth and chlorophyll were negatively correlated, indicating that algal biomass significantly affects transparency (p < 0.001). All these conditions switch to a totally different state when a bloom is occurring, chlorophyll content exceeds far above 10 µgL−1 and Secchi depth falls below 2 m. In this blooming state, the formation of surface sums is also observed, leading to about 10 times higher chlorophyll concentrations in the topmost surface layer compared to conditions at a 0.5 m depth. However, since our in situ monitoring caught only two blooming conditions (out of 121 samplings), a statistical assessment of the blooming state was impossible based on the monitoring data.

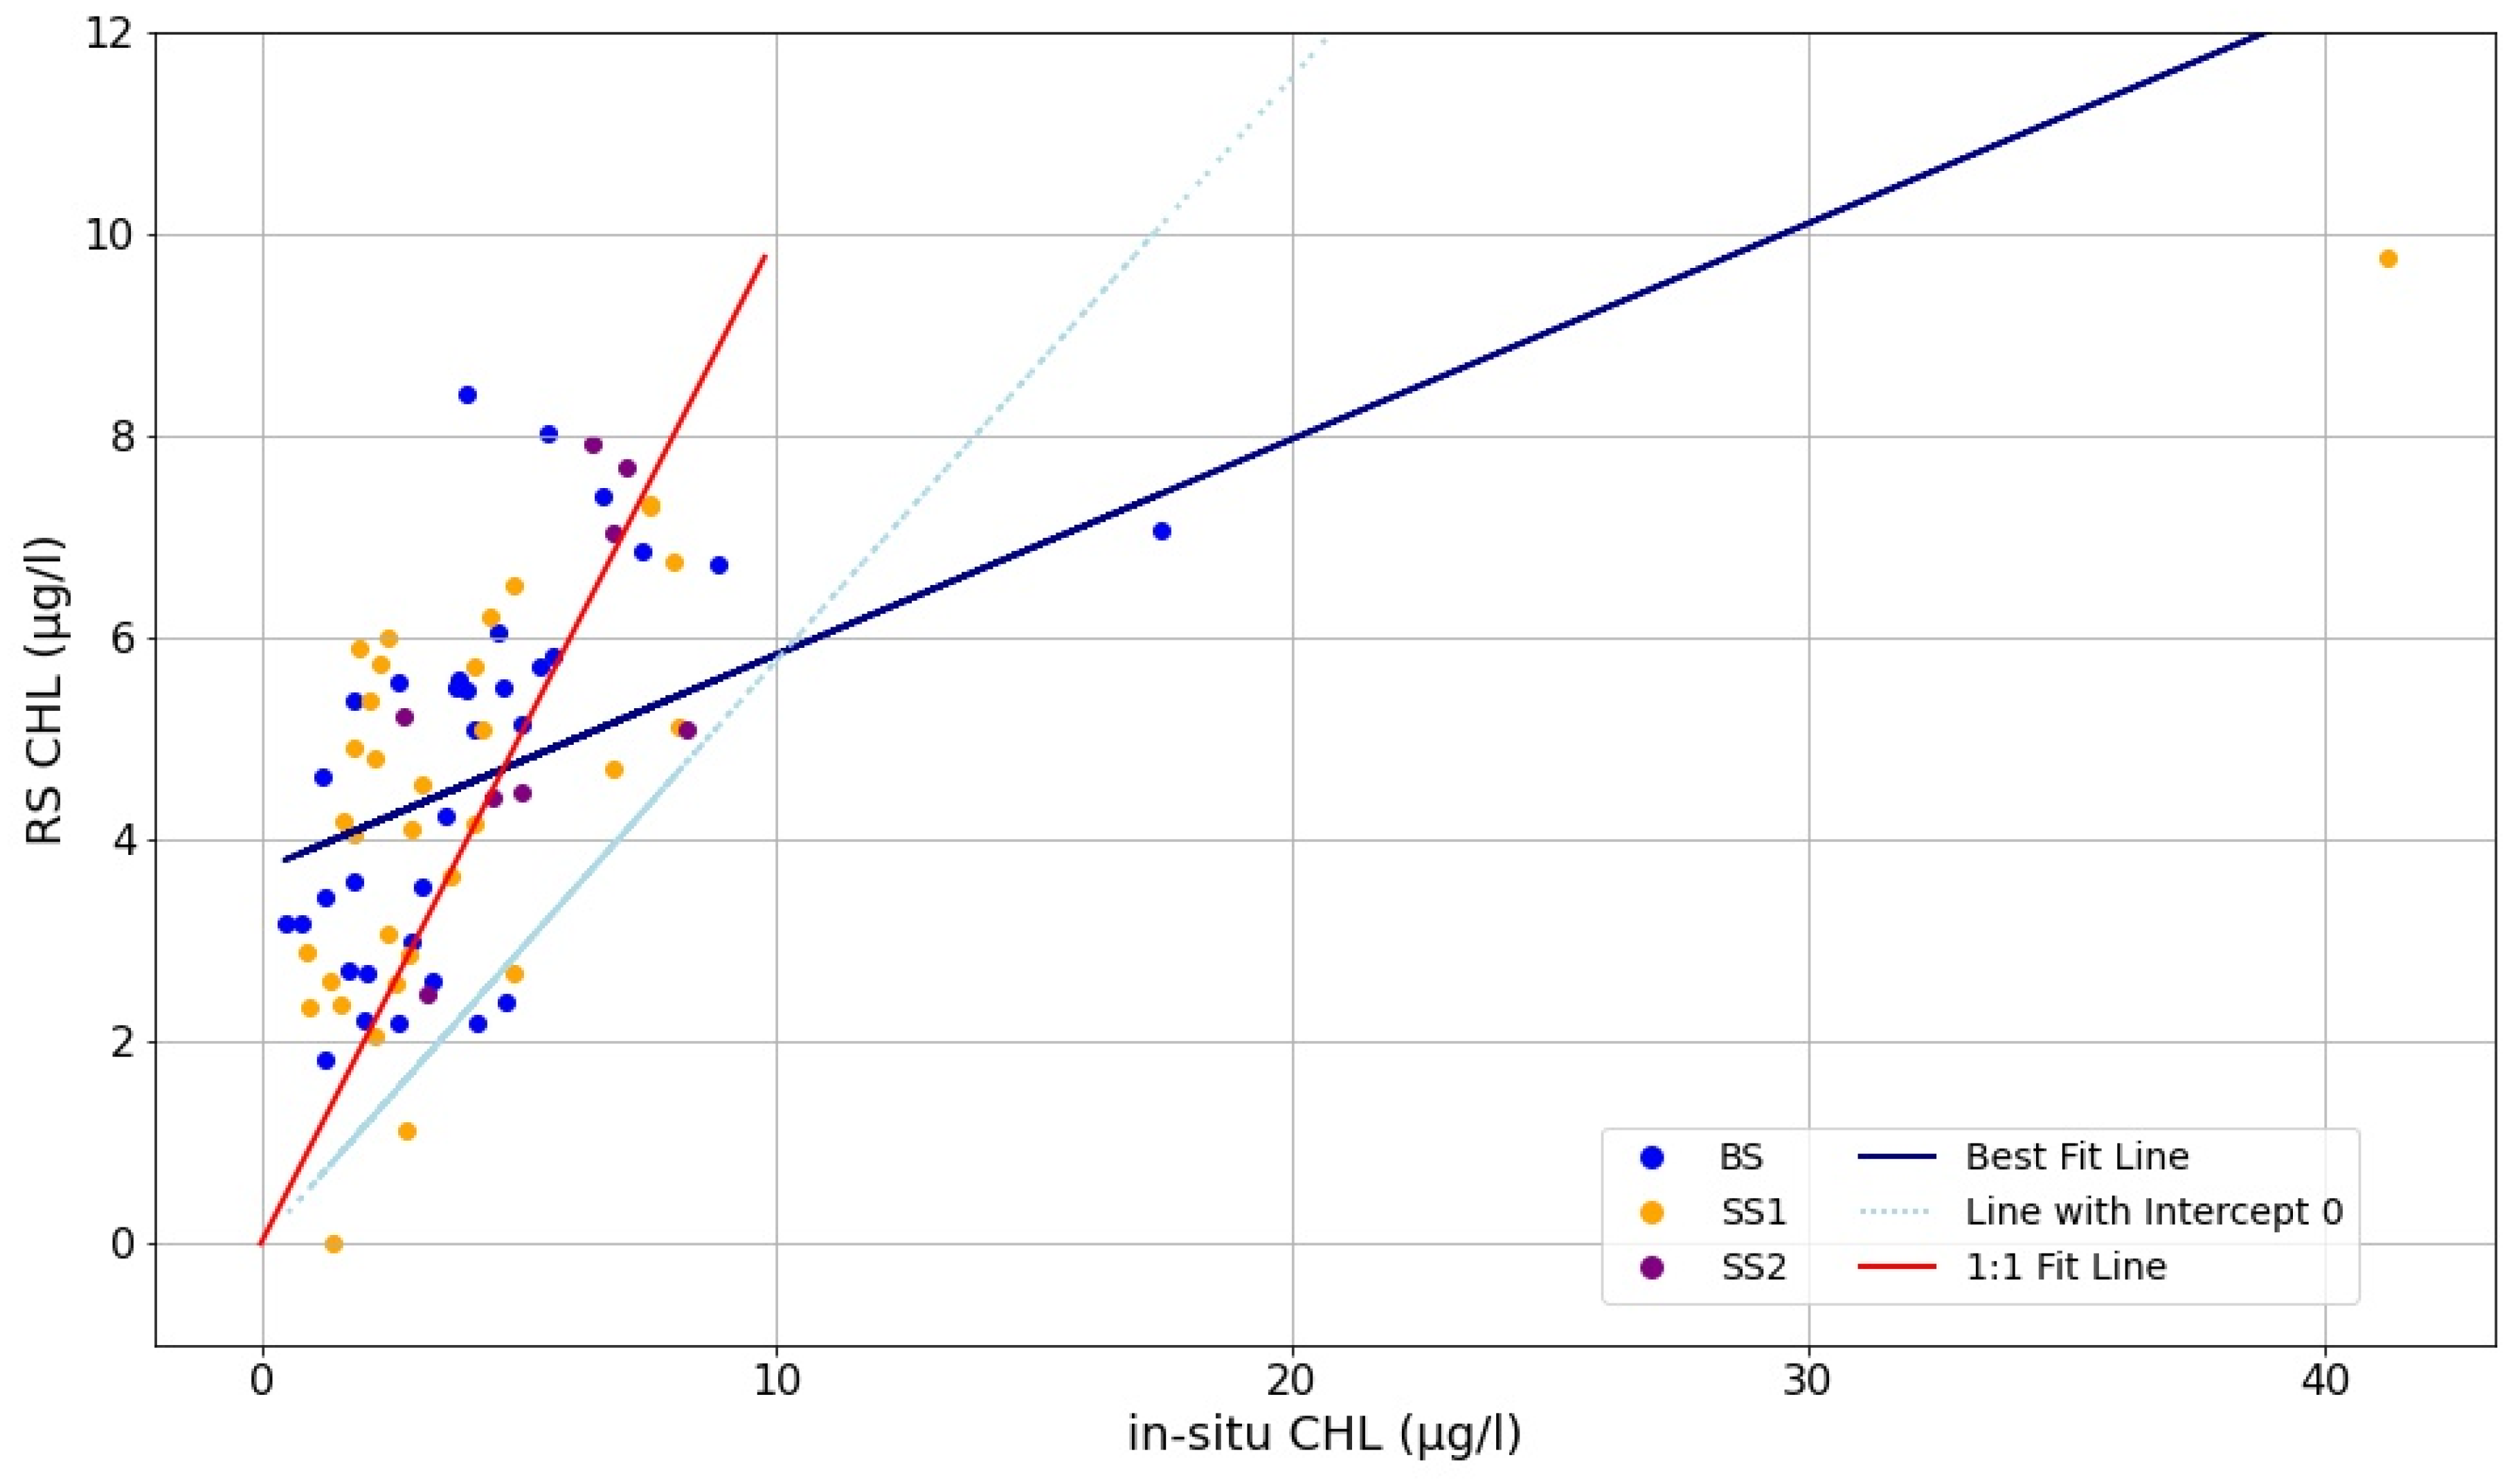
3.1. Comparison of In Situ-Measured and Remotely Retrieved Data

3.1.1. Chlorophyll

In situ CHL data in Lake Sevan mostly remained low and below 10 µgL−1. Only two observations were larger than 10 µgL−1 and only one sampling was really reported as a cyanobacterial bloom by the sampling team (in situ CHL at 41 µgL−1) measured on 25 July 2018 in Small Sevan (SS1). Another larger value at 17 µgL−1 measured on 15 July 2020 in Big Sevan (BS) was not an algal bloom as reported by the sampling team. A Grubbs outlier test indicated both values as outliers (p < 0.001), documenting that these values deviate strongly from the others. In situ and remotely sensed CHL were significantly correlated with Pearson’s r at 0.56 (Figure 4). This value, however, was largely influenced by the outliers and leaving them out improved the correlation (r = 0.63). This was particularly true for a regression forced to have the intercept at zero, which was close to the 1:1 line (Fit line) and obtained a coefficient of determination of R2 = 0.85 (Figure 4 and Figure S1).
Although the exclusion of outliers improved the statistical properties of the regression, it also points to a problem as satellite measurements were found to have not captured higher CHL values precisely enough (see the Section 4). The high CHL values may be defined as the outlier from a statistical point of view and indeed represent a different state of the lake (blooming state), but they are nevertheless true values. The visual impression to the sampling team and the RGB images clearly approved the blooming state and corresponding high in situ chlorophyll content. We therefore conclude that the satellite-based CHL value is not a powerful indicator of blooms.

3.1.2. Water Temperature

The results of satellite-derived LSWT agreed well with in situ point measurements and reproduced the seasonal cycle of surface temperature. Linear regressions showed high coefficients of determination for satellite vs. in situ-based LSWT for Big Sevan (R2 = 0.96, p < 0.001) as well as for Small Sevan (R2 = 0.96, p < 0.001) (see Figure 5). This agreement signifies the alignment of values between in situ and satellite-derived data.

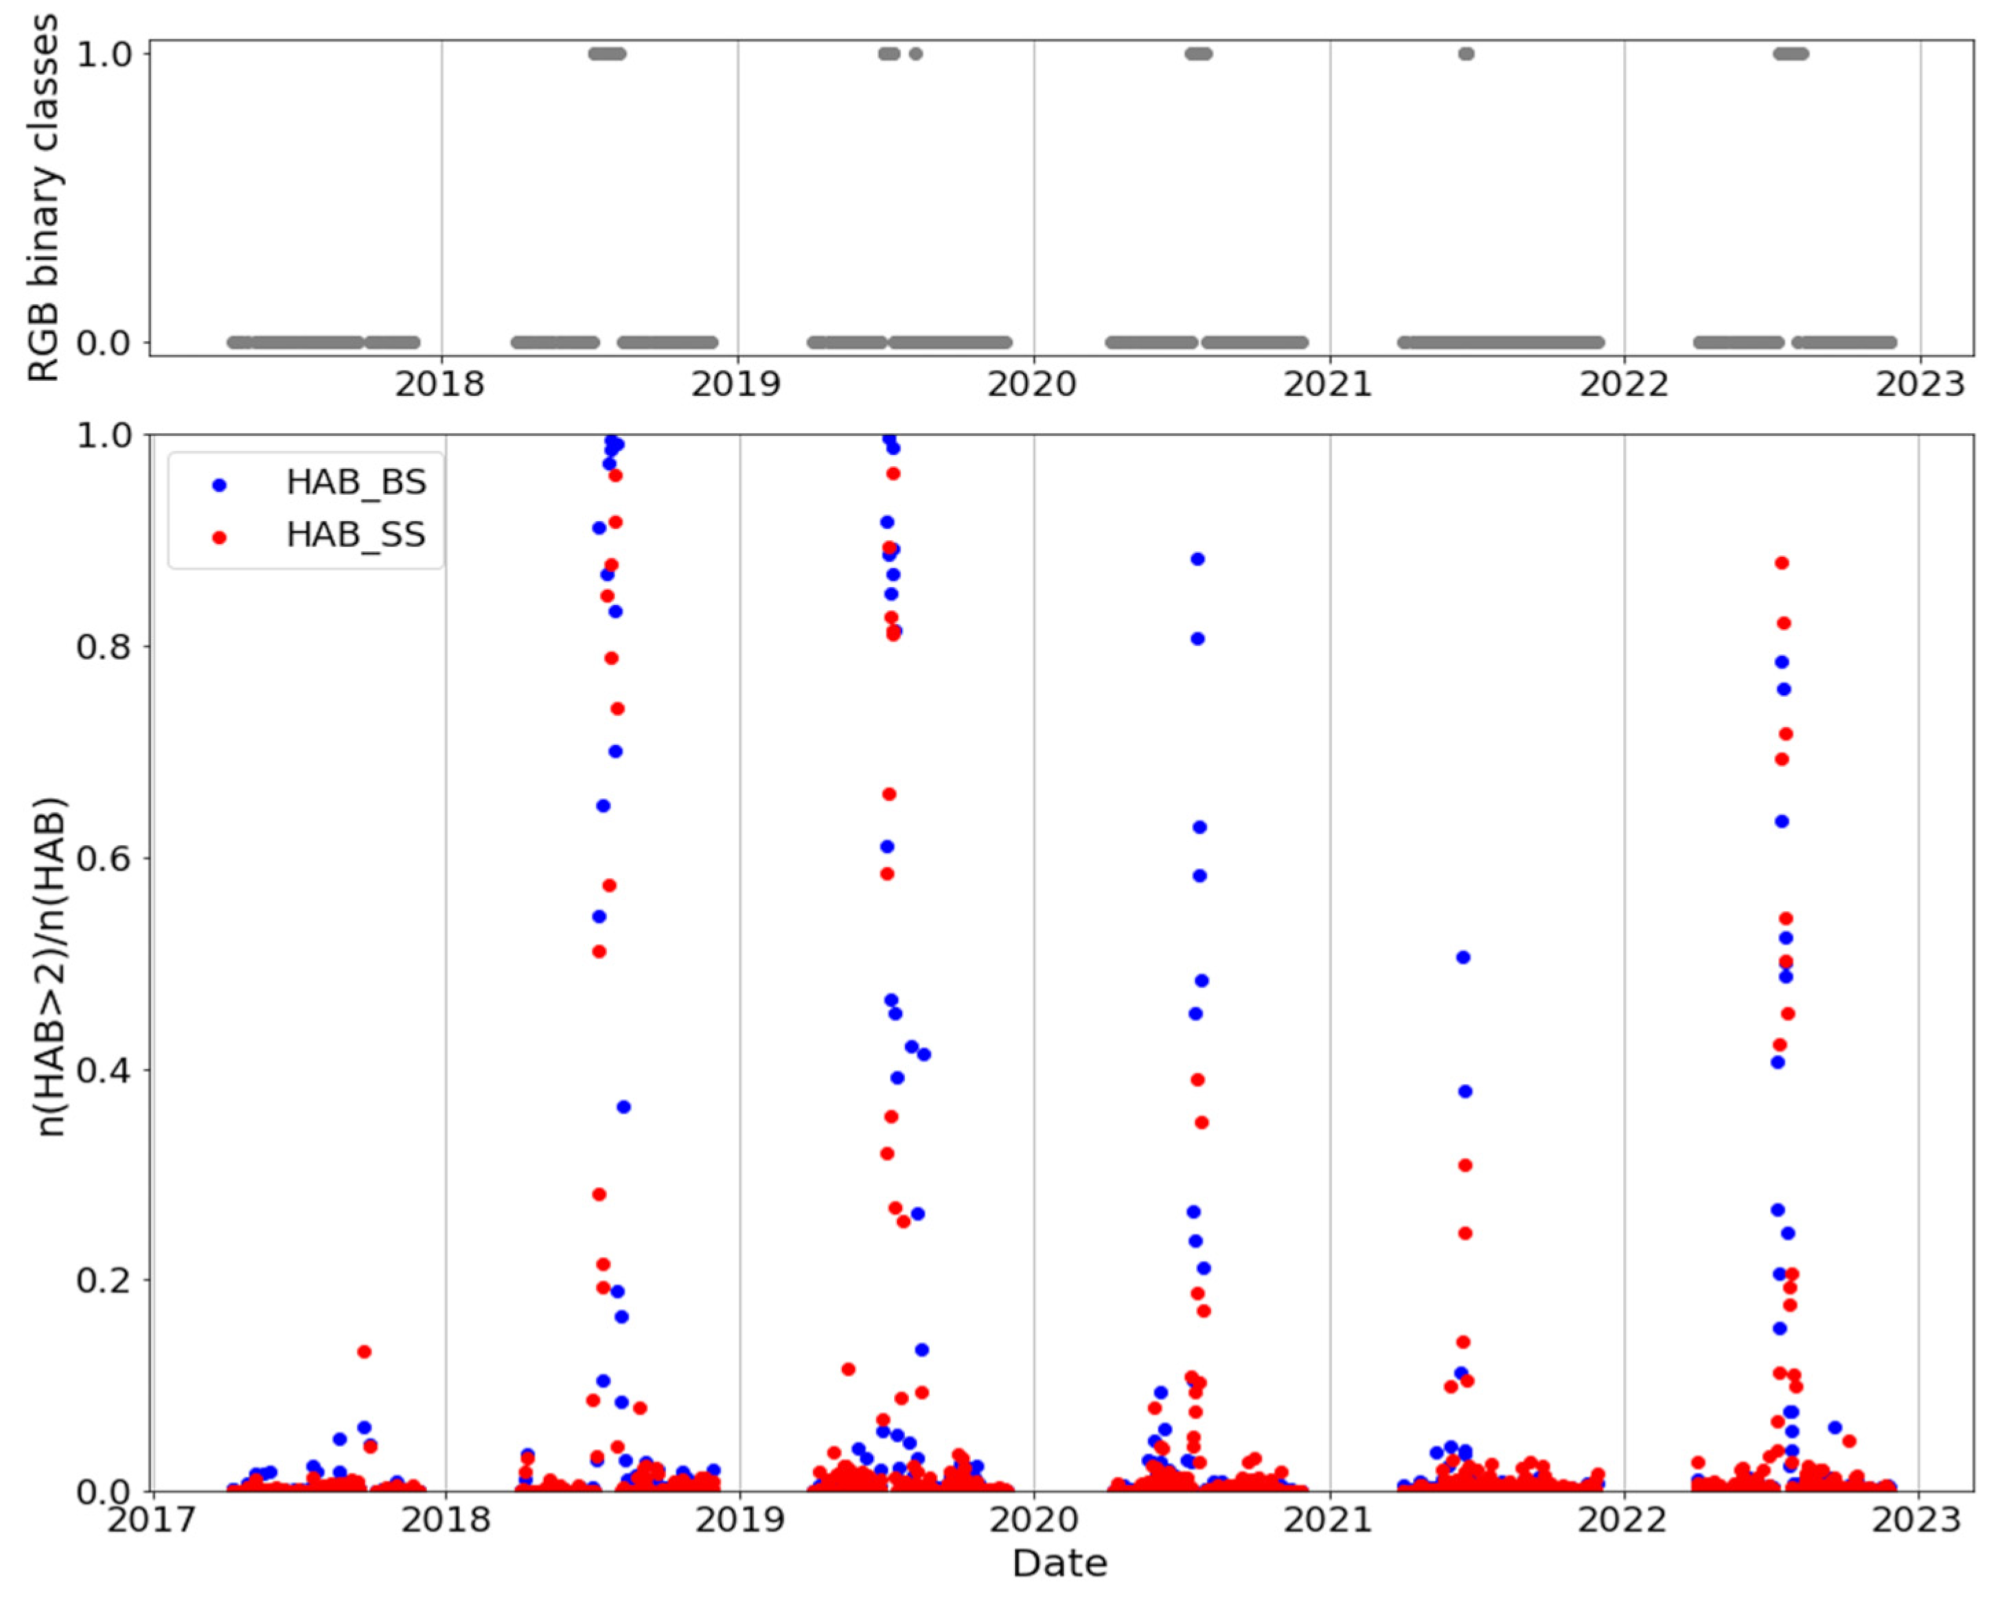
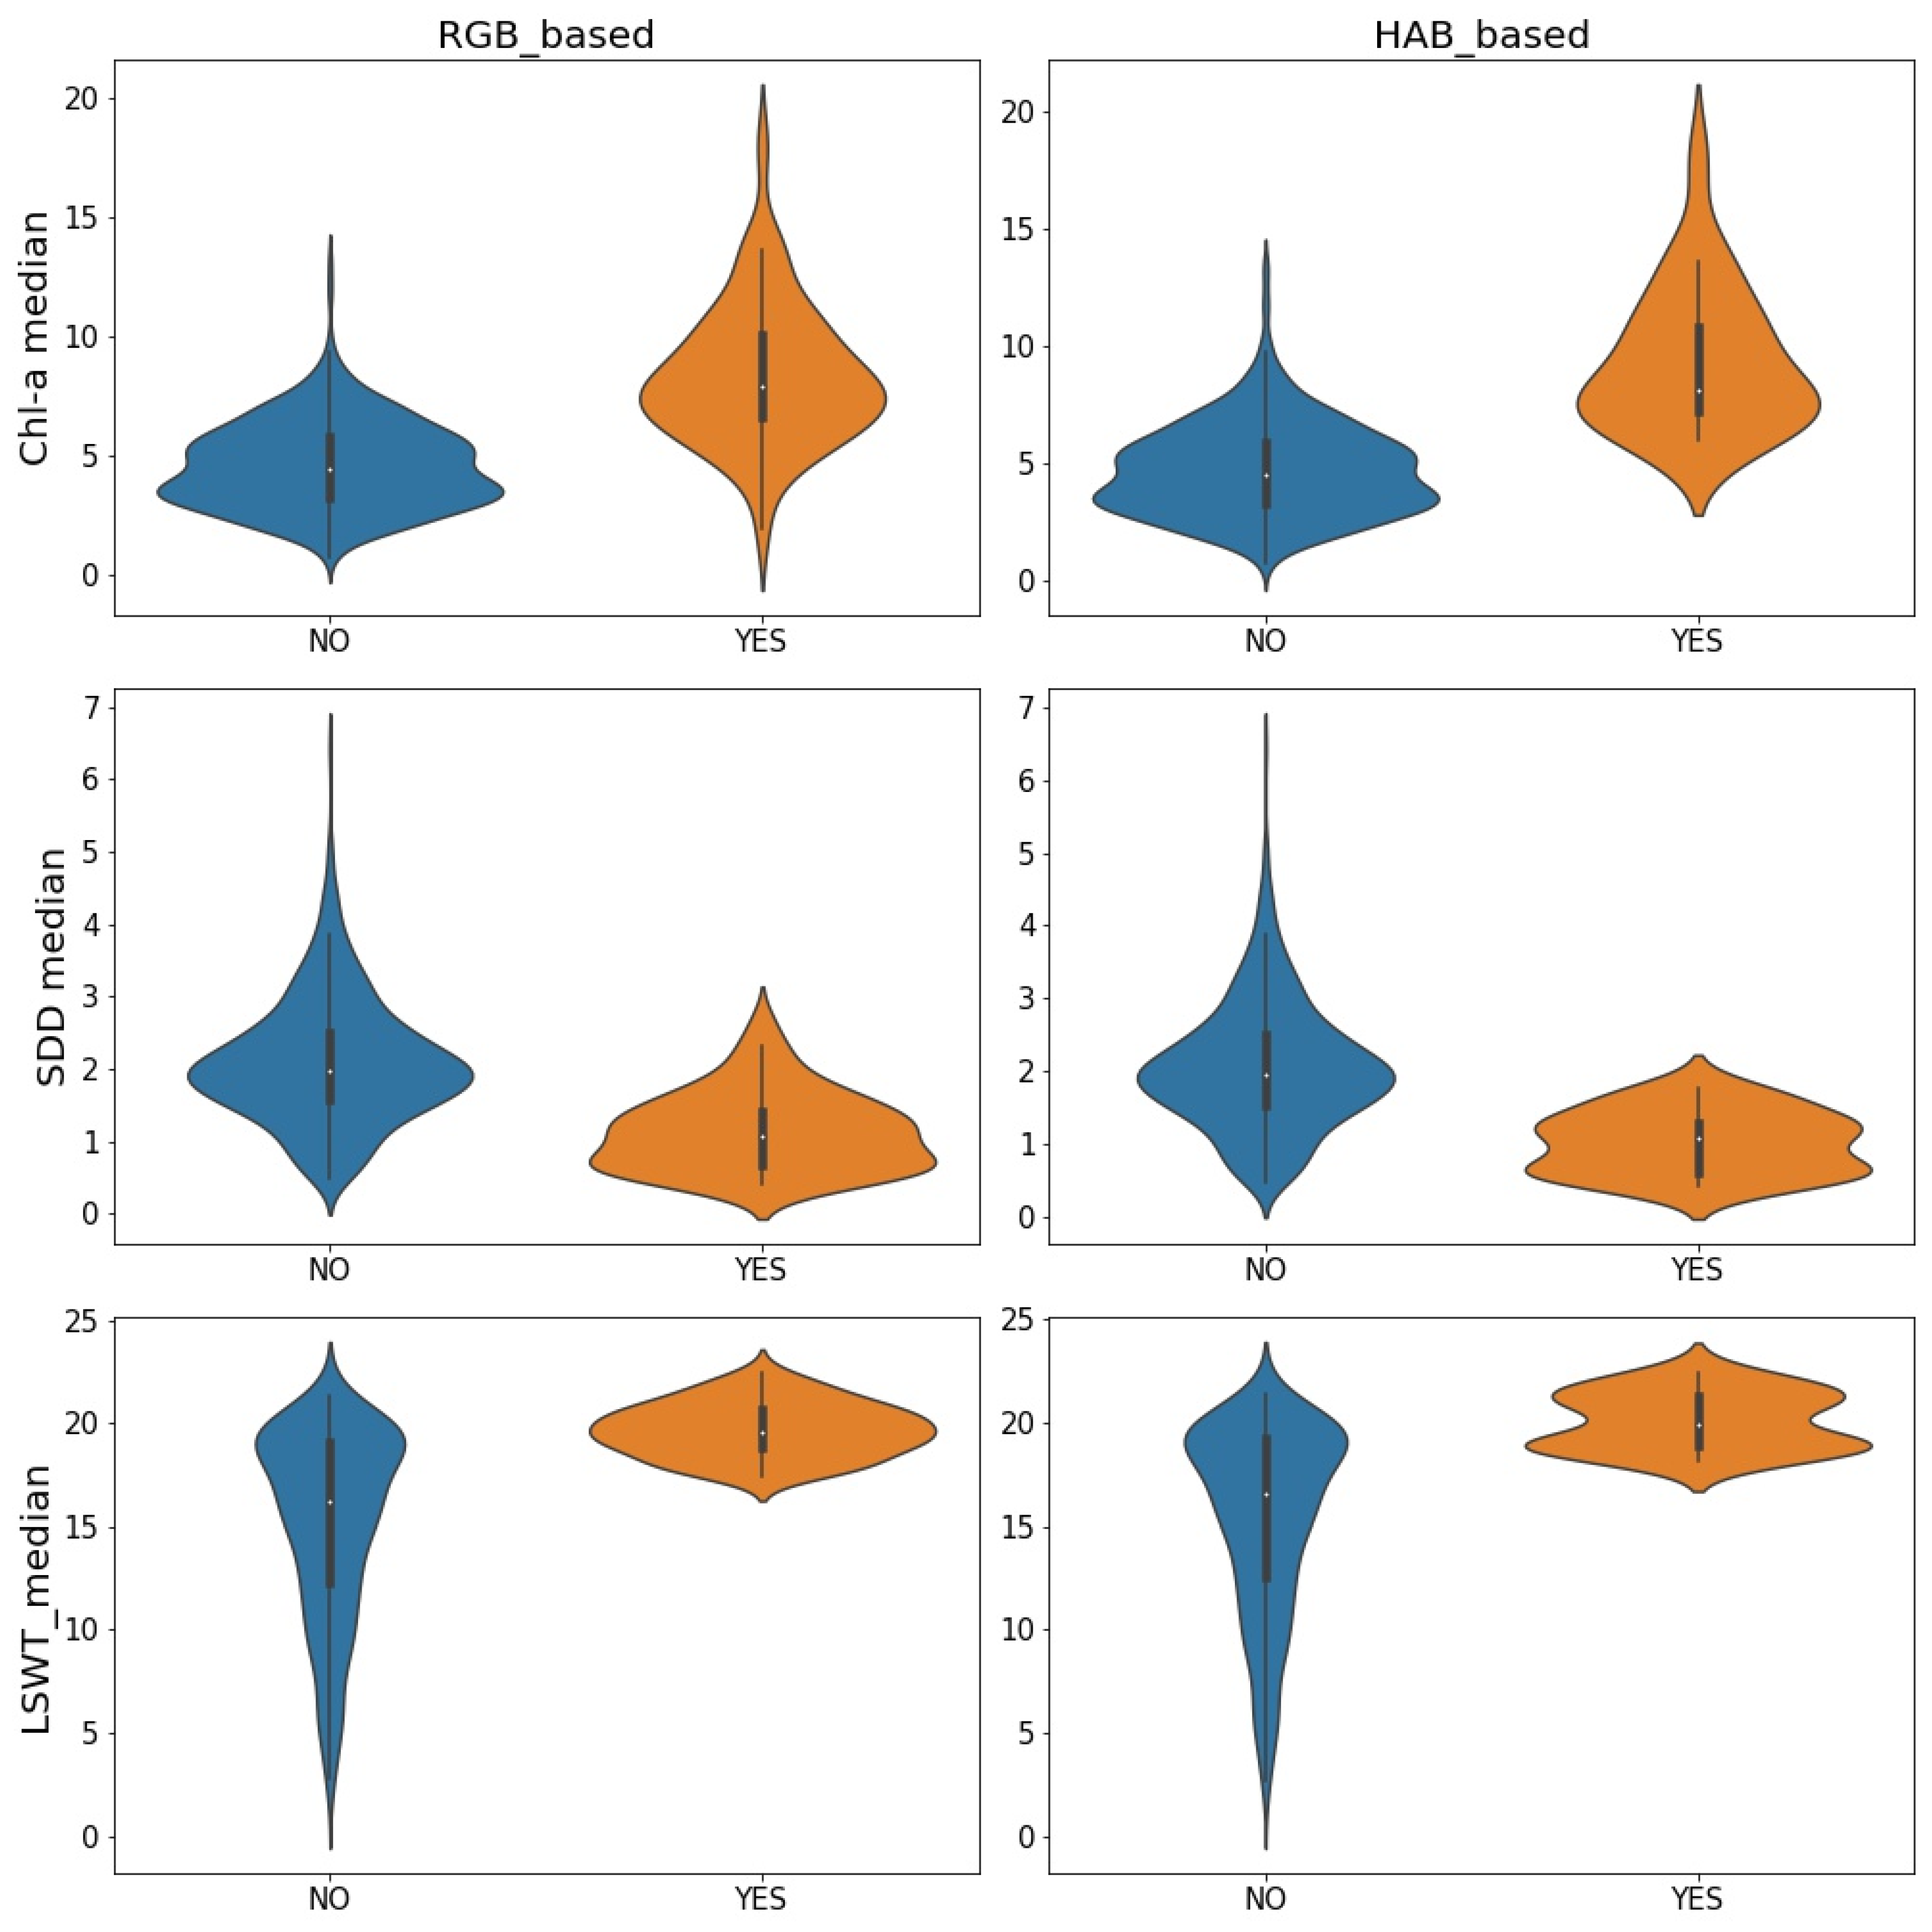
3.2. Bloom Detection by RGB Orthophoto Evaluation and Satellite-Based HAB Indicator

The expert-based evaluation of RGB scenes identified bloom events in five out of six observation years (Figure 6, no bloom in 2017). All bloom events took place in high summer. Bloom intensity was not quantified in RGB image evaluation, but the bloom in 2021 only shortly persisted and was observed only during one satellite overcast.
Since the satellite-based HAB indicator is a semi-quantitative variable (values from 1 to 4; see Methods), we used a decision tree (DT) model in order to identify a threshold HAB indicator that is best suited for reproducing bloom observations from RGB inspection. The DT provides a data-based estimate and connects the remotely sensed HAB values with the expert-based RGB inspections separating them into bloom and non-bloom conditions. In line with our expectations, values of HAB > 2 were identified as the most reliable threshold, and the fraction of pixels with HAB > 2 in each scene showed patterns that highly complied with bloom events from RGB inspections (Figure 6). Given the size of Lake Sevan, every scene has a high number of pixels (>14,000 pixels in cloud-free conditions). We defined a lake-wide bloom whenever the median HAB value, taken over all valid water pixels from a given scene, was higher than 2. This satellite-based bloom definition showed good agreement with the RGB-based indication as, from the analyzed 700 scenes, 671 were correctly classified (Table 3). No false positives were noticed, and in 29 scenes, a bloom was identified in the RGB inspection but was not detected by the HAB (i.e., false negatives). These false negatives, however, were associated with early or later phases of the blooms and none of them led to missing a full blooming phase. In other words, every year and season, a blooming phase was indicated in the RGB inspection, and at least some HAB results also indicated a bloom.
Notably, the in situ sampling, which took place at a monthly scale, overlooked algal blooms in four out of five blooming years. Only the algal bloom in 2018 was registered in the in situ monitoring (CHL at 41 µgL−1). This fact clearly points to the added value of algal bloom detection by satellite-based bloom detection, as both RGB inspections and HAB indicators also found algal blooms in 2019, 2020, 2021 and 2022. (Figure 6). This implies that the detection of blooming events per satellite imagery is more reliable than by classical in situ sampling. The processing via a visual expert inspection of RGB orthophotos has some subjective components, but the delineation of the HAB indicator enables a fully deterministic, mathematically based algorithm that can also be applied in operational mode.
Neither CHL nor SDD alone were good indicators of a bloom as both variables showed considerable overlapping value ranges between bloom and non-bloom conditions, although blooming times were characterized by often higher CHL values, reduced SDD and increased LWST (Figure 7). These patterns are clearly reflected by the statistically significant effect of CHL, SDD and LWST on the blooming state in a logistic regression (Table 4). These results clearly show that a blooming state becomes more likely at high CHL, low SDD and high LWST, irrespective of whether or not the bloom identification was realized by RGB or HAB. In case of RGB-based bloom detection, even an additive effect from warmer LWST and high CHL became significant (Table 4).
We also analyzed multiple linear models of CHL, SDD and LWST as response variables and the blooming state and detection method as explanatory variables, i.e., the complementary definition of dependent and independent variables. They also clearly showed significantly higher CHL values during the blooming state (Table 5). Similarly, SDD was significantly lower and LWST was significantly higher during blooms (Table 5). The method of bloom detection, however, was never significant, i.e., bloom detection by either RGB orthophoto evaluation or by HAB indicator delivered comparable results (Table 5). This is an important added value documenting that the bloom detections by RGB and HAB are very similar to each other.
Our analysis also pointed to the importance of temperature as a key environmental driver as blooms only occurred when surface temperatures were high (at least above approximately 20 °C). Whenever surface temperatures rose very high, e.g., higher than 20 °C, the lake almost always ended up in a blooming state, i.e., exceptionally high water temperatures were a major promoter of algal blooms.

4. Discussion

Our study targeted fast algal bloom detection by satellite-based observations. This calls for high observation frequency and made the daily overcasts of Sentinel-3 OLCI very promising. Besides daily overpass rate, the high number of spectral bands allows us to expect a good detection of bloom conditions, because a high number of spectral bands allowed for a better and more robust modeling of the water-leaving radiances and, hence, the respective contributions of in-water ingredients. This expectation was not fulfilled, however, because the detection of CHL, a key variable for algal blooms, showed only a good correlation between in situ and remote sensing-based values as long as CHL concentrations remained low (i.e., under non-bloom conditions). It is already documented in the literature that certain dissolved or suspended water constituents can hinder CHL detection by remote sensing [49]. We nevertheless identified a reliable procedure for bloom detection based on a specifically designed, semi-quantitative harmful algal bloom (HAB) index that reliably detected blooms. This HAB explicitly makes use of spectral deviations from the expected chlorophyll signal and translates it into a categorial bloom indicator that is particularly sensitive for cyanobacteria [34].
A crucial component and unconventional procedure that enabled us to validate the HAB indicator was an expert-based visual inspection of RGB images from all 700 satellite scenes selected by the experts as undisturbed by clouds, sun glint, etc., in this study. This expert inspection resulted in the detection of 57 blooming scenes. Each bloom event in Lake Sevan identified by this expert inspection was also identified by the satellite-based HAB indicator, although sometimes, experts detected more scenes (i.e., a longer persistence of the bloom) than the HAB indicator. In that sense, the expert-based assessment is more sensitive than the HAB indicator. We nevertheless believe that the RGB-based classification conducted by experts was an important and creative methodological approach for fast bloom detections given the fact that algal blooms are well recognizable by human eyes (see Figure 3). This also points to the fact that a visual inspection of RGB photos can reveal information that may become lost in automatized workflows.

4.1. Limitations of Our Approaches and Results

The lack of short-wave infrared (SWIR) bands beyond ~1000 nm in Sentinel-3 OLCI is problematic under certain circumstances in differentiating between contributions from CHL and atmospheric effects [50]. This may lead to biased estimates under conditions of haze, sun glint or blooming events. This is indeed reflected in our remote sensing-derived CHL values, which are missing high CHL values, probably due to an overestimation of atmospheric effects and therefore an underestimation of CHL under blooming conditions. Besides the technical limitations of Sentinel-3 OLCI in terms of SWIR coverage, its daily overpass rate is an invaluable advantage over other sensors for the monitoring of dynamic aquatic systems, particularly for bloom detection. For this reason, the alternative product from Sentinel-2-MSI is unsuited given its long return period of five days. Yet, Sentinel-2 can be a good compromise whenever a simple assessment of CHL concentrations in a given lake over coarse time steps is sufficient (e.g., assessment of average trophic state).
We used RGB images to separate blooming from non-blooming scenes. This was time-consuming, requires specialists, and, most importantly, is subjective. The latter is a weak point in terms of reproducibility as different experts may have ended up with different bloom recognitions. But at the same time, they provided simple and clear information. We also noted that the expert inspection of RGB images allowed for identification of more bloom satellite scenes than on the basis of the HAB (Table 2) although all RGB-based bloom events had at least one positive HAB-based detection. In other words, we never missed a bloom event when an HAB indicator was used. However, the subjective component in our expert evaluation has consequences for the sensitivity of bloom detection. While strong and widespread blooms will be evaluated uniformly by everyone, starting blooms with extensions that are still limited will probably sometimes be evaluated differently by different persons. However, high concentrations of phytoplankton biomass are easily visible, particularly when accumulating at or close to the water surface, as is often the case for cyanobacteria and even when limited to parts of a lake or when forming stripes or other patterns, as visible in Figure 3. Such conditions are often not identified when calculating the median of satellite-measured HAB or chlorophyll since the median remains below the thresholds for bloom indication. RGB images have also been used elsewhere to support results from in situ data [16,51,52,53]; their information is then also often evaluated in a qualitative setting. This is also true in our case where the RGB inspection ended up in a simple binary variable (blooming YES or NO). Our results demonstrate that the use of RGB images has the potential to identify bloom conditions and, thus, can be used to evaluate the sensitivity of the HAB indicator for bloom detection. To our best knowledge, this unconventional approach has not been used before but allows for the application of remote sensing for lakes with limited in situ data for chlorophyll or unusual water properties. Although the HAB indicator is a truly reproducible and objective indicator for algal blooms (in contrast to the RGB-based expert assessment), it remains to not be a fully quantitative measure.

4.2. Implications from This Study for Lake Management

A very important aspect of our analysis of satellite-based bloom observations was the fact that we detected blooms in almost every year except 2017 (note that 2021 had only a weak bloom). In situ sampling, however, detected only the bloom in 2018. This weak capacity of bloom detection in in situ sampling is simply the consequence of the fact that a bloom is often shorter than the in situ sampling interval (one month). In many years, blooms were taking place between samplings and had durations of roughly 2–3 weeks, i.e., in the previous sampling, they were not yet emerging, and in the following sampling, the majority of algal biomass had already disappeared from the water column; the heterogeneity of the spatial distribution of the phytoplankton in a large lake like Lake Sevan and the limited spatial coverage by three sampling sites add to this. Notably, some of these blooms that were not detected by in situ sampling but detected by satellite were also proven by citizens living on the shore of the lake.
In general, ecosystems with high dynamics also require appropriate sampling intervals [54] and a classical field sampling on a monthly basis is unable to capture these dynamics. The inclusion of remote sensing in classical monitoring programs is therefore valuable because it also allows us to track the dynamics on shorter time scales—at least as long as the size of the lake allows for the application of Sentinel-3 OLCI data. In such a combined monitoring strategy, the in situ-sampling assures the assessment by fully quantitative and real observations while the satellite data provide better spatial and temporal resolutions at a lower absolute accuracy. We see great potential in such a combined monitoring technique when it comes to early-warning systems for algal blooms where it will be essential to detect the bloom at a very early stage and where sampling intervals of several weeks are unable to realize this. In this respect, it makes sense to organize the lake monitoring in a triggering mode so that bloom detection via satellite (irrespective of whether or not it is RGB-based or HAB-based) triggers a field sampling in order to ground truth the remotely sensed information and to improve our system’s understanding.
We also see a large application area for remote sensing in water quality monitoring in the context of climate impact studies focusing on extreme events. Cyanobacterial blooms predominantly occur when it becomes very hot [55] and recently emerging heat waves support the occurrence of algal blooms [56,57]. Hence, satellite-based monitoring is an essential tool in lake management in order to assess the climate sensitivity of a given lake or to guide the design of corresponding climate-adaptive management strategies. Another advantage of remote sensing-based observation is that it can be applied to water bodies where in situ data are missing. In case of Sentinel-3 OLCI, the observational information from the satellite dates back to 2016 and hence already covers almost a decade.

4.3. Future Needs and Next Steps

The use of remote sensing for the quantification of chlorophyll failed mainly for high concentrations of chlorophyll in Lake Sevan, i.e., particularly during bloom conditions. However, the same essentially applied for the in situ monitoring. We were not able to catch the blooming phase each time and particularly at its peak. As already mentioned above, the temporal (monthly sampling) and spatial resolutions (tree sampling sites only) were not high enough. Therefore, a particularly targeted monitoring, triggered by the identification of bloom conditions via remote sensing, should be operated. Once there is an efficiently high number of in situ data available, a better understanding of the reasons for the insufficient quantification of chlorophyll by remote sensing during bloom conditions will also hopefully be possible. This will enable us to identify approaches for the improved application of remote sensing for chlorophyll quantification in Lake Sevan and other comparable lakes.
The above-mentioned triggered monitoring can even be based on HAB-based bloom detection in smaller parts of Lake Sevan, i.e., when bloom starts to develop. For this, the data evaluation needs to be performed not only by separating the data into Small and Big Sevan datasets but also into a higher number of sections, each having a surface area of, for instance, 50 to 100 km2. However, this also requires that the sampling is carried out in more than two or three locations only, as each defined section of the lake needs its representative sampling.
Finally, we asked ourselves whether the expert-based evaluation of RGB photos, which turned out to be a crucial step in setting up and validating the satellite-based bloom detection, could be converted into an automatized procedure. Machine learning in the context of image recognition may be a promising tool. In general, we realized that RGB photos can contain valuable information that add on the far more complex optical information provided by spectrally resolving sensors like OLCI. This unused potential should be exploited in the future.

5. Conclusions

We showed that algal bloom detection in Lake Sevan failed when it was just based on CHL, but we obtained good results when RGB photos were analyzed or the satellite-based HAB indicator was applied. These methods provide reliable and very fast bloom detection at the scale of days. The utilization of RGB photos as additional information turned out to be a decisive step in bloom detection given the fact that the correct quantification of chlorophyll under blooming conditions is currently not satisfactory. A weak point of the expert-based evaluation of RGB photos is its subjectivity arising from the personal evaluation performed by experts, which may reduce the reproducibility of identifications if other experts are asked to evaluate. At the same time, our results indicated that there are still considerable limitations for the use of remote sensing when it comes to a fully quantitative assessment of algal dynamics, measured as CHL, in Lake Sevan. The collection of more in situ data will assist in a better understanding of these limitations and is a prerequisite to overcoming these limitations. A triggered higher-frequency monitoring may be implemented for two to three years in order to collect targeted monitoring data during bloom conditions. This would generate a unique dataset for improving bloom detection in such water bodies. The observations made so far indicate that algal blooms are a regular feature in Lake Sevan and occur almost always when water temperatures surpass approximately 20 °C.

Supplementary Materials

The following supporting information can be downloaded at: https://www.mdpi.com/article/10.3390/rs16193734/s1, Figure S1. Relationship between in situ measured and remotely retrieved CHL (calculated with and without outliers).

Author Contributions

Conceptualization, S.A., H.B., M.S. and K.R.; methodology, S.A., G.G., A.H. (Armine Hayrapetyan), H.B., M.S. and K.R.; resources, S.A., G.G., H.B., M.S. and K.R.; writing—original draft preparation, S.A.; writing—review and editing, S.A., G.G., H.B., M.S. and K.R.; data analysis and visualization, S.A., A.K., R.A., V.M., G.G., A.H. (Armine Hayrapetyan) H.B., A.H. (Azatuhi Hovsepyan), M.M.A.A.E., M.S. and K.R.; supervision, M.S. and K.R. All authors have read and agreed to the published version of the manuscript.

Funding

This work was implemented in frames of the SEVAMOD2 project funded by the Federal Ministry for Education and Research of Germany (Project ID: 01DK20038) and co-funded by the Ministry of Environment RA. Further funding was provided by the Higher Education and Science Committee of the Ministry of Education, Science, Culture and Sport of RA, in the framework of the research projects Nos. 21T-1E252 and 23LCG-1F005․ We acknowledge the provision of data by the Hydrometeorology and Monitoring Center SNCO of the Ministry of Environment RA.

Data Availability Statement

The original contributions presented in the study are included in the article, further inquiries can be directed to the corresponding author.

Acknowledgments

The authors would like to acknowledge Department of GIS and Remote Sensing of the Center for Ecological-Noosphere Studies NAS RA (Armenia), Scientific Centre of Zoology and Hydroecology, NAS RA (Armenia), EOMAP GmbH & Co. KG (Germany) and Helmholtz Centre for Environmental Research (Germany) for the existing facilities to conduct this research.

Conflicts of Interest

Author Hendrik Bernert is employed by EOMAP GmbH & Co. KG. The remaining authors declare that the research was conducted in the absence of any commercial or financial relationships that could be construed as a potential conflict of interest.

References

  1. Ho, J.C.; Michalak, A.M.; Pahlevan, N. Widespread global increase in intense lake phytoplankton blooms since the 1980s. Nature 2019, 574, 667–670. [Google Scholar] [CrossRef] [PubMed]
  2. Politi, E.; Cutler, M.E.J.; Carvalho, L.; Rowan, J.S. A global typological approach to classify lakes based on their eutrophication risk. Aquat. Sci. 2024, 86, 52. [Google Scholar] [CrossRef]
  3. Blix, K.; Pálffy, K.; Tóth, V.R.; Eltoft, T. Remote sensing of water quality parameters over Lake Balaton by using Sentinel-3 OLCI. Water 2018, 10, 1428. [Google Scholar] [CrossRef]
  4. Rodríguez-López, L.; Duran-Llacer, I.; González-Rodríguez, L.; Abarca-del-Rio, R.; Cárdenas, R.; Parra, O.; Martínez-Retureta, R.; Urrutia, R. Spectral analysis using LANDSAT images to monitor the chlorophyll-a concentration in Lake Laja in Chile. Ecol. Inf. 2020, 60, 101183. [Google Scholar] [CrossRef]
  5. Schaeffer, B.A.; Schaeffer, K.G.; Keith, D.; Lunetta, R.S.; Conmy, R.; Gould, R.W. Barriers to adopting satellite remote sensing for water quality management. Int. J. Remote Sens. 2013, 34, 7534–7544. [Google Scholar] [CrossRef]
  6. Yang, H.; Kong, J.; Hu, H.; Du, Y.; Gao, M.; Chen, F. A Review of Remote Sensing for Water Quality Retrieval: Progress and Challenges. Remote Sens. 2022, 14, 1770. [Google Scholar] [CrossRef]
  7. Dörnhöfer, K.; Oppelt, N. Remote sensing for lake research and monitoring—Recent advances. Ecol. Indic. 2016, 64, 105–122. [Google Scholar] [CrossRef]
  8. Govedarica, M.; Jakovljevic, G. Monitoring spatial and temporal variation of water quality parameters using time series of open multispectral data. In Proceedings of the SPIE 11174, Seventh International Conference on Remote Sensing and Geoinformation of the Environment (RSCy2019), Paphos, Cyprus, 18–21 March 2019. [Google Scholar] [CrossRef]
  9. Shen, M.; Duan, H.; Cao, Z.; Xue, K.; Qi, T.; Ma, J.; Liu, D.; Song, K.; Huang, C.; Song, X. Sentinel-3 OLCI observations of water clarity in large lakes in eastern China: Implications for SDG 6.3.2 evaluation. Remote Sens. Environ. 2020, 247, 111950. [Google Scholar] [CrossRef]
  10. Palmer, S.C.J.; Kutser, T.; Hunter, P.D. Remote sensing of inland waters: Challenges, progress and future directions. Remote Sens. Environ. 2015, 157, 1–8. [Google Scholar] [CrossRef]
  11. Palmer, S.; Odermatt, D.; Hunter, P.; Brockmann, C.; Présing, M.; Balzter, H.; Tóth, V. Satellite remote sensing of phytoplankton phenology in Lake Balaton using 10years of MERIS observations. Remote Sens. Environ. 2015, 158, 441–452. [Google Scholar] [CrossRef]
  12. Rodrigues, G.; Potes, M.; Penha, A.M.; Costa, M.J.; Morais, M.M. The Use of Sentinel-3/OLCI for Monitoring the Water Quality and Optical Water Types in the Largest Portuguese Reservoir. Remote Sens. 2022, 14, 2172. [Google Scholar] [CrossRef]
  13. Soomets, T.; Uudeberg, K.; Jakovels, D.; Zagars, M.; Reinart, A.; Brauns, A.; Kutser, T. Comparison of Lake Optical Water Types Derived from Sentinel-2 and Sentinel-3. Remote Sens. 2019, 11, 2883. [Google Scholar] [CrossRef]
  14. Gabrielyan, B.; Khosrovyan, A.; Schultze, M. A review of anthropogenic stressors on Lake Sevan, Armenia. J. Limnol. 2022, 81, 2061. [Google Scholar] [CrossRef]
  15. Hovhanesyan, R.O. Lake Sevan: Yesterday, Tomorrow…; Armenian National Academy: Yerevan, Armenia, 1994. [Google Scholar]
  16. Gevorgyan, G.; Rinke, K.; Schultze, M.; Mamyan, A.; Kuzmin, A.; Belykh, O.; Sorokovikova, E.; Hayrapetyan, A.; Hovsepyan, A.; Khachikyan, T.; et al. First report about toxic cyanobacterial bloom occurrence in Lake Sevan, Armenia. Int. Rev. Hydrobiol. 2020, 105, 131–142. [Google Scholar] [CrossRef]
  17. Wilkinson, I.P. Lake Sevan: Evolution, Biotic Variability and Ecological Degradation. In Large Asian Lakes in a Changing World: Natural State and Human Impact; Springer: Cham, Switzerland, 2020; pp. 35–63. [Google Scholar] [CrossRef]
  18. Agyemang, T.K.; Sajadyan, H.; Vardanyan, L.; Heblinski, J.; Schmieder, K. The application of remote sensing and GIS techniques in assessing the effects of Lake Sevan water level fluctuation on its littoral zone. In Proceedings of the International Symphosium “Ecological Problems of Agriculture of Armenia”, Yerevan, Armenia, January 2008; Volume 21, pp. 5–9. [Google Scholar]
  19. Agyemang, T.K.; Heblinski, J.; Schmieder, K.; Sajadyan, H.; Vardanyan, L. Accuracy assessment of supervised classification of submersed macrophytes: The case of the Gavaraget region of Lake Sevan, Armenia. Hydrobiologia 2010, 661, 85–96. [Google Scholar] [CrossRef]
  20. Astsatryan, H.; Grigoryan, H.; Abrahamyan, R.; Asmaryan, S.; Muradyan, V.; Tepanosyan, G.; Guigoz, Y.; Giuliani, G. Shoreline delineation service: Using an earth observation data cube and sentinel 2 images for coastal monitoring. Earth Sci. Inf. 2022, 15, 1587–1596. [Google Scholar] [CrossRef]
  21. Ginzburg, A.I.; Kostianoy, A.G.; Sheremet, N.A.; Lavrova, O.Y. Water Dynamics and Morphometric Parameters of Lake Sevan (Armenia) in the Summer–Autumn Period According to Satellite Data. Remote Sens. 2024, 16, 2285. [Google Scholar] [CrossRef]
  22. Heblinski, J.; Schmieder, K.; Heege, T.; Agyemang, T.K.; Sayadyan, H.; Vardanyan, L. Mapping of water constituents in high mountainous Lake Sevan (Armenia). SIL Proc. 1922–2010 2010, 30, 1453–1455. [Google Scholar] [CrossRef]
  23. Heblinski, J.; Schmieder, K.; Heege, T.; Agyemang, T.K.; Sayadyan, H.; Vardanyan, L. High-resolution satellite remote sensing of littoral vegetation of Lake Sevan (Armenia) as a basis for monitoring and assessment. Hydrobiologia 2011, 661, 97–111. [Google Scholar] [CrossRef]
  24. Hovsepyan, A.; Tepanosyan, G.; Muradyan, V.; Asmaryan, S.; Medvedev, A.; Koshkarev, A. Lake Sevan Shoreline Change Assessment Using Multi-Temporal Landsat Images. Geogr. Environ. Sustain. 2019, 12, 212–229. [Google Scholar] [CrossRef]
  25. Medvedev, A.; Telnova, N.; Alekseenko, N.; Koshkarev, A.; Kuznetchenko, P.; Asmaryan, S.; Narykov, A. UAV-Derived Data Application for Environmental Monitoring of the Coastal Area of Lake Sevan, Armenia with a Changing Water Level. Remote Sens. 2020, 12, 3821. [Google Scholar] [CrossRef]
  26. Shahnazaryan, G.; Schultze, M.; Rinke, K.; Gabrielyan, B. Lake Sevan. Past, present, and future state of a unique alpine lake. J. Limnol. 2022, 81, 2168. [Google Scholar] [CrossRef]
  27. Meybeck, M.; Akopian, M.; Andréassian, V. What Happened to Lake Sevan?/Silnews 23. 1998. Available online: https://limnology.org/silnews/sil-news-23/ (accessed on 20 July 2024).
  28. Hovhanissian, R.; Gabrielyan, B. Ecological problems associated with the biological resource use of Lake Sevan, Armenia. Ecol. Eng. 2000, 16, 175–180. [Google Scholar] [CrossRef]
  29. Jenderedjian, K.; Hakobyan, S.; Stapanian, M.A. Trends in benthic macroinvertebrate community biomass and energy budgets in Lake Sevan, 1928–2004. Environ. Monit. Assess. 2012, 184, 6647–6671. [Google Scholar] [CrossRef]
  30. Legovich, N.A.; Markosian, A.G.; Meshkova, T.M.; Smolei, A.I. Physico-chemical regime and bioproductive processes in Lake Sevan (Armenia) in transition from oligotrophy to eutrophy. SIL Proc. 1922–2010 1973, 18, 1835–1842. [Google Scholar] [CrossRef]
  31. Hambaryan, L.R.; Stepanyan, L.G.; Mikaelyan, M.V.; Gyurjyan, Q.G. The bloom and toxicity of cyanobacteria in Lake Sevan. Proc. YSU B Chem. Biol. Sci. 2020, 54, 168–176. [Google Scholar] [CrossRef]
  32. Khosrovyan, A.; Avalyan, R.; Atoyants, A.; Aghajanyan, E.; Hambaryan, L.; Aroutiounian, R.; Gabrielyan, B. Tradescantia-Based Test Systems Can Be Used for the Evaluation of the Toxic Potential of Harmful Algal Blooms. Water 2023, 15, 2500. [Google Scholar] [CrossRef]
  33. Oganesian, R.O. Present state of Lake Sevan (Armenia). Verh. Int. Verein. Limnol. 1978, 20, 1103–1104. [Google Scholar] [CrossRef]
  34. Dörnhöfer, K.; Klinger, P.; Heege, T.; Oppelt, N. Multi-sensor satellite and in situ monitoring of phytoplankton development in a eutrophic-mesotrophic lake. Sci. Total Environ. 2018, 612, 1200–1214. [Google Scholar] [CrossRef]
  35. Dörnhöfer, K.; Göritz, A.; Gege, P.; Pflug, B.; Oppelt, N. Water Constituents and Water Depth Retrieval from Sentinel-2A—A First Evaluation in an Oligotrophic Lake. Remote Sens. 2016, 8, 941. [Google Scholar] [CrossRef]
  36. Kiselev, V.; Bulgarelli, B.; Heege, T. Sensor independent adjacency correction algorithm for coastal and inland water systems. Remote Sens. Environ. 2015, 157, 85–95. [Google Scholar] [CrossRef]
  37. Lee, Z.; Du, K.; Arnone, R. A model for the diffuse attenuation coefficient of downwelling irradiance. J. Geophys. Res. Oceans 2005, 110, 2275. [Google Scholar] [CrossRef]
  38. Lee, Z.; Shang, S.; Hu, C.; Du, K.; Weidemann, A.; Hou, W.; Lin, J.; Lin, G. Secchi disk depth: A new theory and mechanistic model for underwater visibility. Remote Sens. Environ. 2015, 169, 139–149. [Google Scholar] [CrossRef]
  39. Carrea, L.; Merchant, C.; Operations, C.G.L. “Cryosphere and Water” Product User Manual; 2020; Volume 1.09. Available online: https://land.copernicus.eu/en/technical-library/product-user-manual-for-snow-cover-extent-northern-hemisphere-1-km-raster (accessed on 20 July 2024).
  40. Schröder, T.; Schmidt, S.I.; Kutzner, R.D.; Bernert, H.; Stelzer, K.; Friese, K.; Rinke, K. Exploring Spatial Aggregations and Temporal Windows for Water Quality Match-Up Analysis Using Sentinel-2 MSI and Sentinel-3 OLCI Data. Remote Sens. 2024, 16, 2798. [Google Scholar] [CrossRef]
  41. Weiskerger, C.J.; Rowe, M.D.; Stow, C.A.; Stuart, D.; Johengen, T. Application of the Beer–Lambert Model to Attenuation of Photosynthetically Active Radiation in a Shallow, Eutrophic Lake. Water Resour. Res. 2018, 54, 8952–8962. [Google Scholar] [CrossRef]
  42. Krishnaraj, A.; Honnasiddaiah, R. Remote sensing and machine learning based framework for the assessment of spatio-temporal water quality in the Middle Ganga Basin. Environ. Sci. Pollut. Res. 2022, 29, 64939–64958. [Google Scholar] [CrossRef]
  43. Ma, Y.; Song, K.; Wen, Z.; Liu, G.; Shang, Y.; Lyu, L.; Du, J.; Yang, Q.; Li, S.; Tao, H.; et al. Remote Sensing of Turbidity for Lakes in Northeast China Using Sentinel-2 Images with Machine Learning Algorithms. IEEE J. Sel. Top. Appl. Earth Obs. Remote Sens. 2021, 14, 9132–9146. [Google Scholar] [CrossRef]
  44. Priyanka, N.A.; Kumar, D. Decision tree classifier: A detailed survey. Int. J. Inf. Decis. Sci. 2020, 12, 246. [Google Scholar] [CrossRef]
  45. Yang, F.-J. An Extended Idea about Decision Trees. In Proceedings of the 2019 International Conference on Computational Science and Computational Intelligence (CSCI), Las Vegas, NV, USA, 5–7 December 2019; IEEE: New York, NY, USA, 2019; pp. 349–354. [Google Scholar] [CrossRef]
  46. Safavian, S.R.; Landgrebe, D. A survey of decision tree classifier methodology. IEEE Trans. Syst. Man Cybern. 1991, 21, 660–674. [Google Scholar] [CrossRef]
  47. McFadden, D. Conditional Logit Analysis of Qualitative Choice Behavior; Frontiers in Econometrics. Academic Press: Cambridge, MA, USA, 1973; pp. 105–142. [Google Scholar]
  48. R CoreTeam. R: A Language and Environment for Statistical Computing; R Foundation for Statistical Computing: Vienna, Austria, 2023. [Google Scholar]
  49. Alikas, K.; Kangro, K.; Kõks, K.-L.; Tamm, M.; Freiberg, R.; Laas, A. Consistency of six in situ, in vitro and satellite-based methods to derive chlorophyll a in two optically different lakes. Front. Environ. Sci. 2023, 10, 989671. [Google Scholar] [CrossRef]
  50. Pahlevan, N.; Roger, J.-C.; Ahmad, Z. Revisiting short-wave-infrared (SWIR) bands for atmospheric correction in coastal waters. Opt. Express 2017, 25, 6015. [Google Scholar] [CrossRef]
  51. Hou, X.; Feng, L.; Dai, Y.; Hu, C.; Gibson, L.; Tang, J.; Lee, Z.; Wang, Y.; Cai, X.; Liu, J.; et al. Global mapping reveals increase in lacustrine algal blooms over the past decade. Nat. Geosci. 2022, 15, 130–134. [Google Scholar] [CrossRef]
  52. Michalak, A.M.; Anderson, E.J.; Beletsky, D.; Boland, S.; Bosch, N.S.; Bridgeman, T.B.; Chaffin, J.D.; Cho, K.; Confesor, R.; Daloğlu, I.; et al. Record-setting algal bloom in Lake Erie caused by agricultural and meteorological trends consistent with expected future conditions. Proc. Natl. Acad. Sci. USA 2013, 110, 6448–6452. [Google Scholar] [CrossRef] [PubMed]
  53. Sakharova, E.G.; Krylov, A.V.; Sabitova, R.Z.; Tsvetkov, A.I.; Gambaryan, L.R.; Mamyan, A.S.; Gabrielyan, B.K.; Hayrapetyan, A.H.; Khachikyan, T.G. Horizontal and Vertical Distribution of Phytoplankton in the Alpine Lake Sevan (Armenia) during the Summer Cyanoprokaryota Bloom. Contemp. Probl. Ecol. 2020, 13, 60–70. [Google Scholar] [CrossRef]
  54. Marcé, R.; George, G.; Buscarinu, P.; Deidda, M.; Dunalska, J.; de Eyto, E.; Flaim, G.; Grossart, H.-P.; Istvanovics, V.; Lenhardt, M.; et al. Automatic High Frequency Monitoring for Improved Lake and Reservoir Management. Environ. Sci. Technol. 2016, 50, 10780–10794. [Google Scholar] [CrossRef]
  55. Paerl, H.W.; Otten, T.G. Harmful Cyanobacterial Blooms: Causes, Consequences, and Controls. Microb. Ecol. 2013, 65, 995–1010. [Google Scholar] [CrossRef]
  56. Jöhnk, K.D.; Huisman, J.; Sharples, J.; Sommeijer, B.; Visser, P.M.; Stroom, J.M. Summer heatwaves promote blooms of harmful cyanobacteria. Glob. Chang. Biol. 2008, 14, 495–512. [Google Scholar] [CrossRef]
  57. Woolway, R.I.; Kraemer, B.M.; Zscheischler, J.; Albergel, C. Compound hot temperature and high chlorophyll extreme events in global lakes. Environ. Res. Lett. 2021, 16, 124066. [Google Scholar] [CrossRef]
Figure 1. Geographical location of Lake Sevan and locations of in situ measurements.
Remotesensing 16 03734 g001
Figure 2. EOMAP’s physics-based workflow steps to derive water quality parameters.
Remotesensing 16 03734 g002
Figure 3. RGB representations of selected Sentinel-3 OLCI scenes showing algae bloom/no bloom in Lake Sevan.
Remotesensing 16 03734 g003
Figure 4. Relationship between in situ-measured and remotely retrieved CHL.
Remotesensing 16 03734 g004
Figure 5. Comparison of in situ and satellite-based lake surface water temperature (LSWT) for Big Sevan (left) and Small Sevan (right).
Remotesensing 16 03734 g005
Figure 6. Overview of all 700 scenes with respect to bloom detection by RGB inspection (upper) and HAB-based classification for Lake Sevan (lower).
Remotesensing 16 03734 g006
Figure 7. Violin plots of CHL (upper), SDD (middle) and LWST (lower) values contrasting between blooming and non-blooming states. Differentiation of blooming state was either realized by RGB imagery evaluation (left) or by HAB indicator (right).
Remotesensing 16 03734 g007
Table 1. Morphometric characteristics of Lake Sevan (state of 1 January 2020; data provided by the Hydrometeorology and Monitoring Center SNCO of the Ministry of Environment RA).
Small SevanBig SevanEntire Lake Sevan
Water level [m.a.s.l.]1900.431900.431900.43
Surface area [km2]338.314939.531277.844
Volume [km3]14.064724.022838.0875
Maximum depth [m]80.530.580.5
Inflows4 rivers24 rivers + Arpa − Sevan tunnel28 rivers + Arpa − Sevan tunnel
Outflows1 (Hrazdan River)-1 (Hrazdan River)
Table 2. Geographical locations of the in situ measurements in Lake Sevan.
NSampling PeriodSampling SiteLatitudeLongitude
1April–November
2018–2021
Big Sevan (BS)40°22′21″N45°22′42.30″E
2April–November
2018–2021
Small Sevan (SS_1)40°36′8.16″N45°3′32.64″E
45.059067E
3April–November
2021
Fish Farm (SS_2)40°28′0.40″N45°6′23.10″E
Table 3. Contingency table comparing bloom detection based on RGB inspections and HAB indicators; the overall accuracy of the HAB classification (assuming the RGB-based classification as the best true indicator) was 95.8%.
RGB_Binary
NOYES
HABNO (HAB ≤ 2)64329672
YES (HAB > 2)02828
64357700
Table 4. Results of a logistic regression of the effect CHL, SDD and LSWT (explanatory variable) on the blooming state (as binary response variable). Statistics were calculated for single models (upper part) and for the best multiple model. Bloom detection was either conducted by HAB or RGB. The term “Chlorophyll/LSWT” denotes the interaction between both variables.
Single-Factor Models’
Response VariableExplanatory VariablepPseudo-R2
HAB-based bloomChlorophyll<0.0010.36
detectionSecchi Depth<0.0010.23
LSWT<0.0010.26
RGB-based bloomChlorophyll<0.0010.33
detectionSecchi Depth<0.0010.22
LSWT<0.0010.24
Best Multiple Models
HAB-based bloomChlorophyll<0.0010.59
detectionLSWT<0.001
RGB-based bloomChlorophyll0.0050.58
detectionLSWT<0.001
Chlorophyll/LSWT0.048
Table 5. Results of the statistical analyses of CHL, SDD and LSWT for different detection methods and blooming states by a multiple linear model.
(A) Chlorophyll(CHL)Concentrations
VariableEstimateStd. Errort   valuep
Intercept4.7670.08257.9<0.001
Bloom = TRUE4.0610.23617.2<0.001
Method = RGB−0.190.116−1.630.103
(B) Secchi Disc Depth (SDD)
VariableEstimateStd. Errort   valuep
Intercept2.050.03558.21<0.001
Bloom = TRUE−0.980.101−9.77<0.001
Method = RGB0.050.0460.930.354
(C) LakeWater Surface Temperature (LWST)
VariableEstimateStd. Errort   valuep
Intercept15.43140.183783.99<0.001
Bloom = TRUE4.53540.52618.621<0.001
Method = RGB−0.21190.2592−0.8170.414
Disclaimer/Publisher’s Note: The statements, opinions and data contained in all publications are solely those of the individual author(s) and contributor(s) and not of MDPI and/or the editor(s). MDPI and/or the editor(s) disclaim responsibility for any injury to people or property resulting from any ideas, methods, instructions or products referred to in the content.

