
Remote Sensing Mapping and Analysis of Spatiotemporal Patterns of Land Use and Cover Change in the Helong Region of the Loess Plateau Region (1986–2020)


Abstract
:1. Introduction
2. Materials and Methods
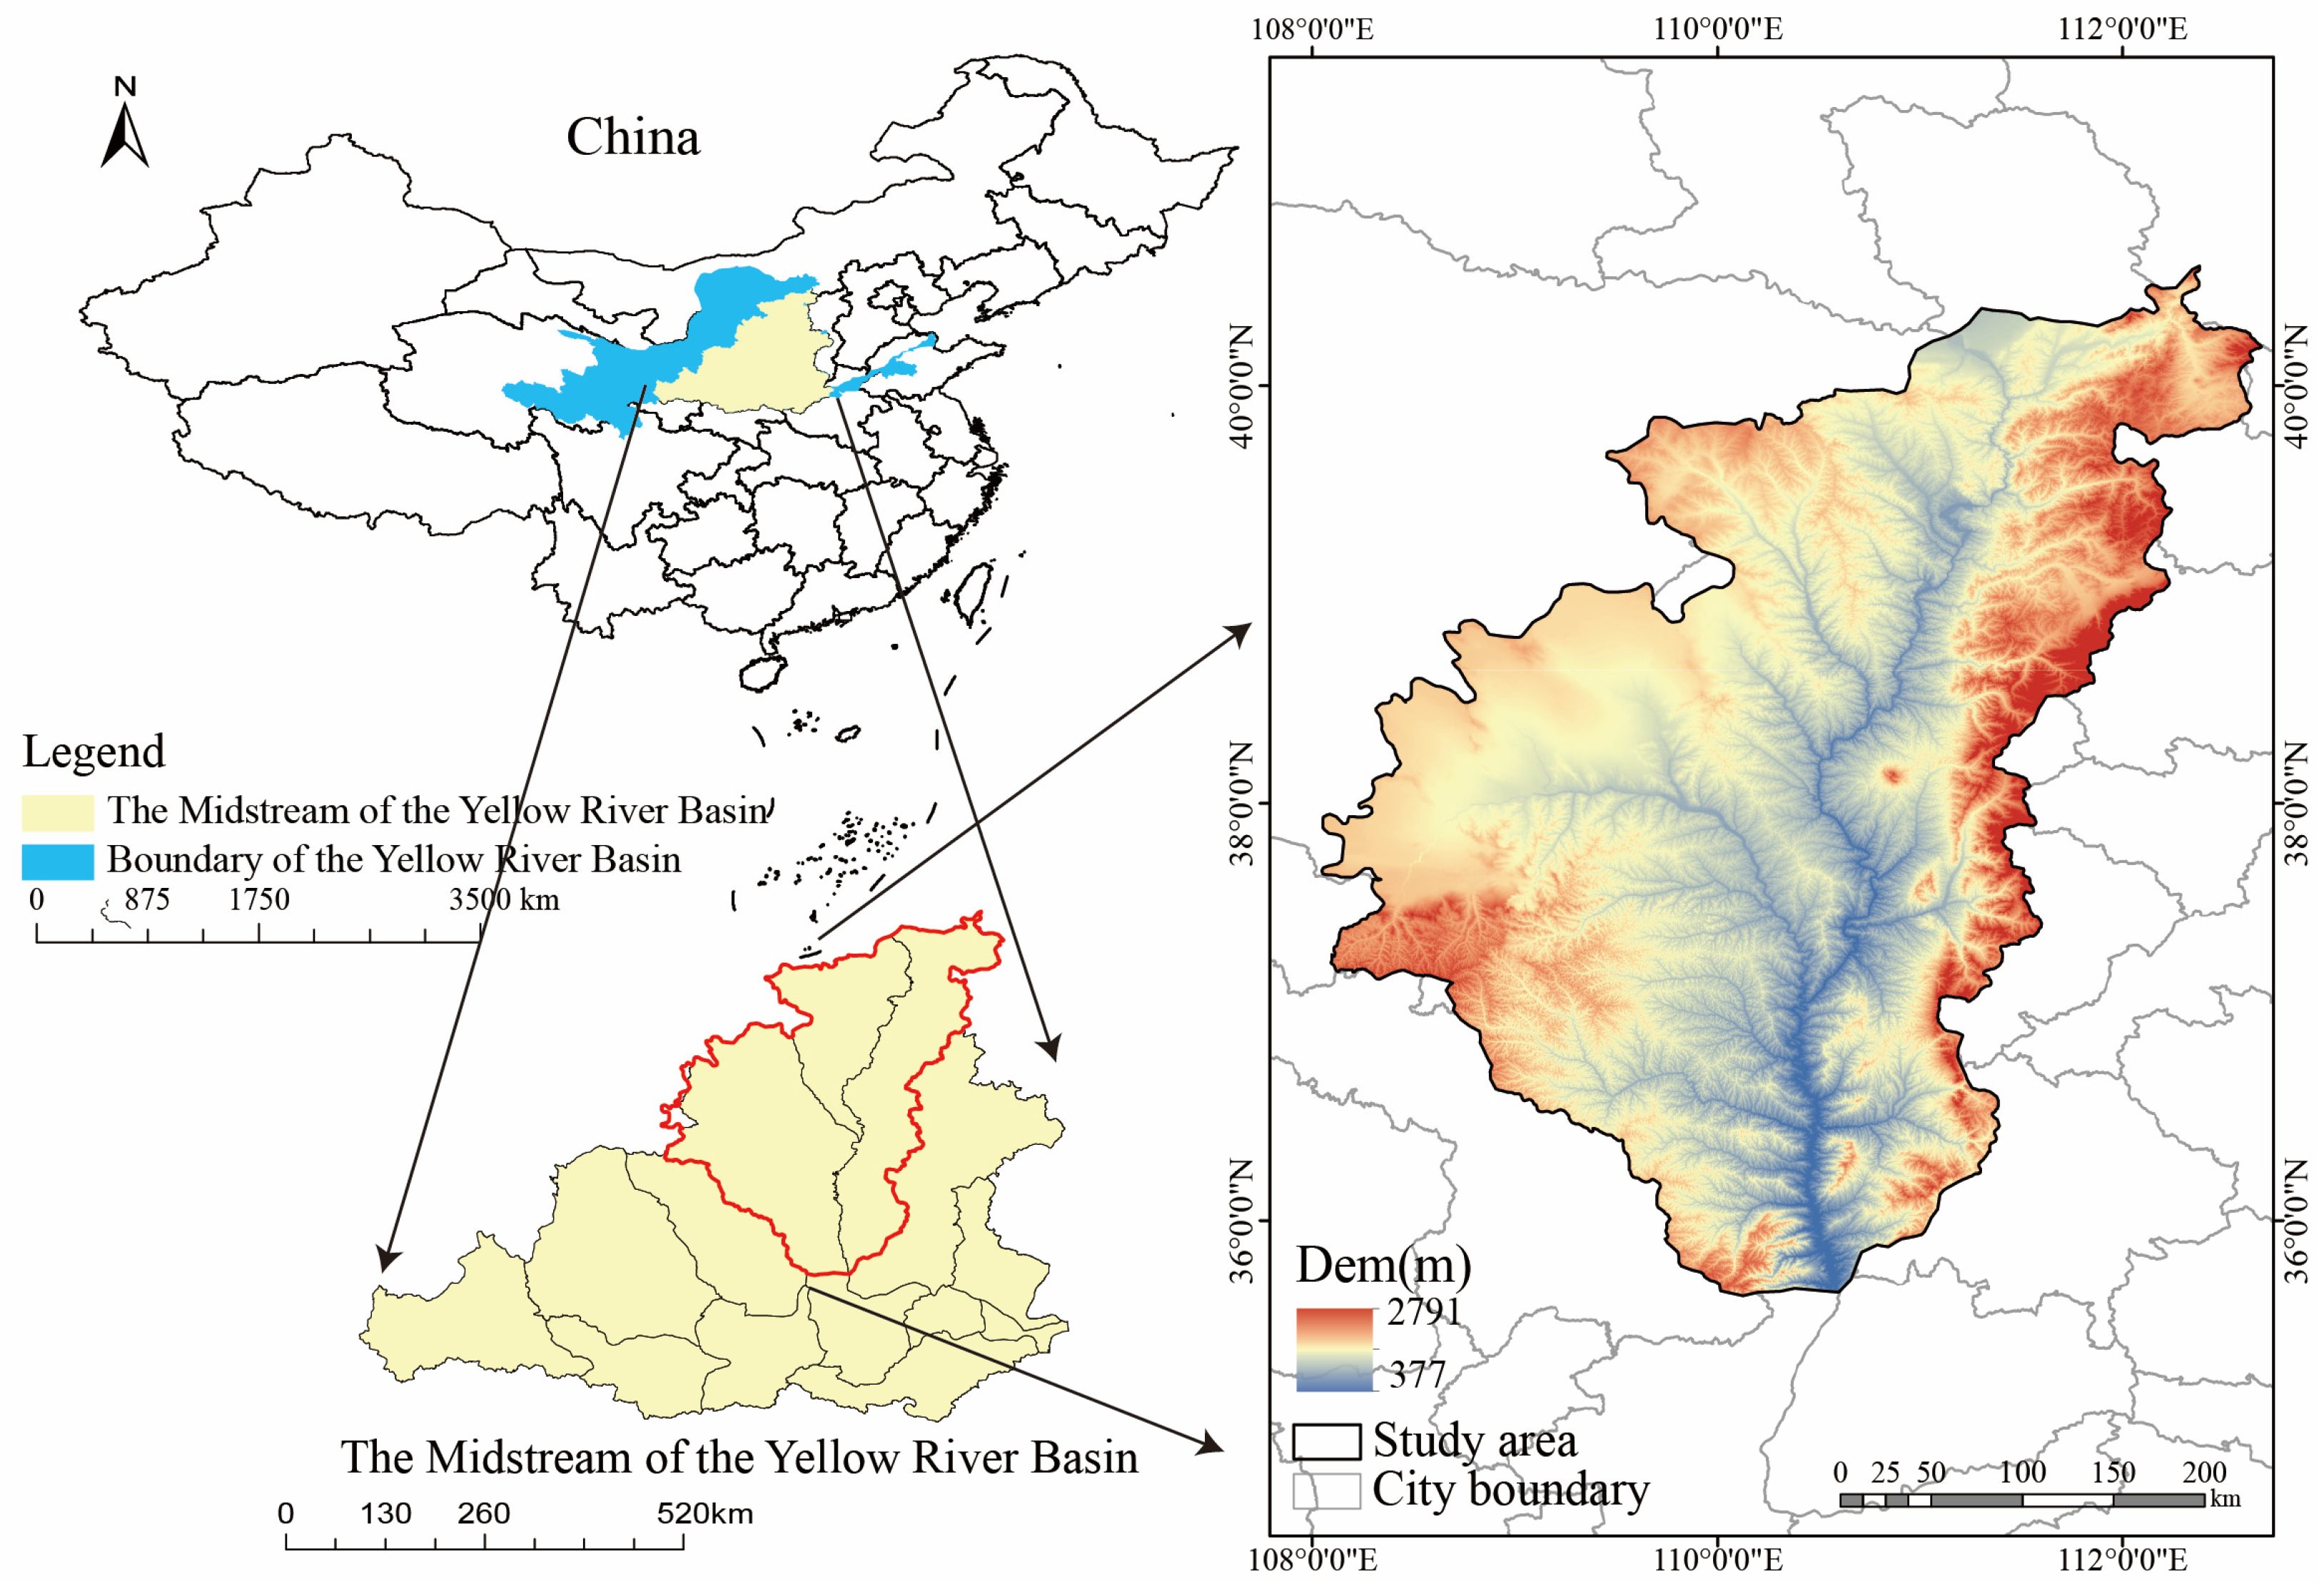
2.1. Study Area
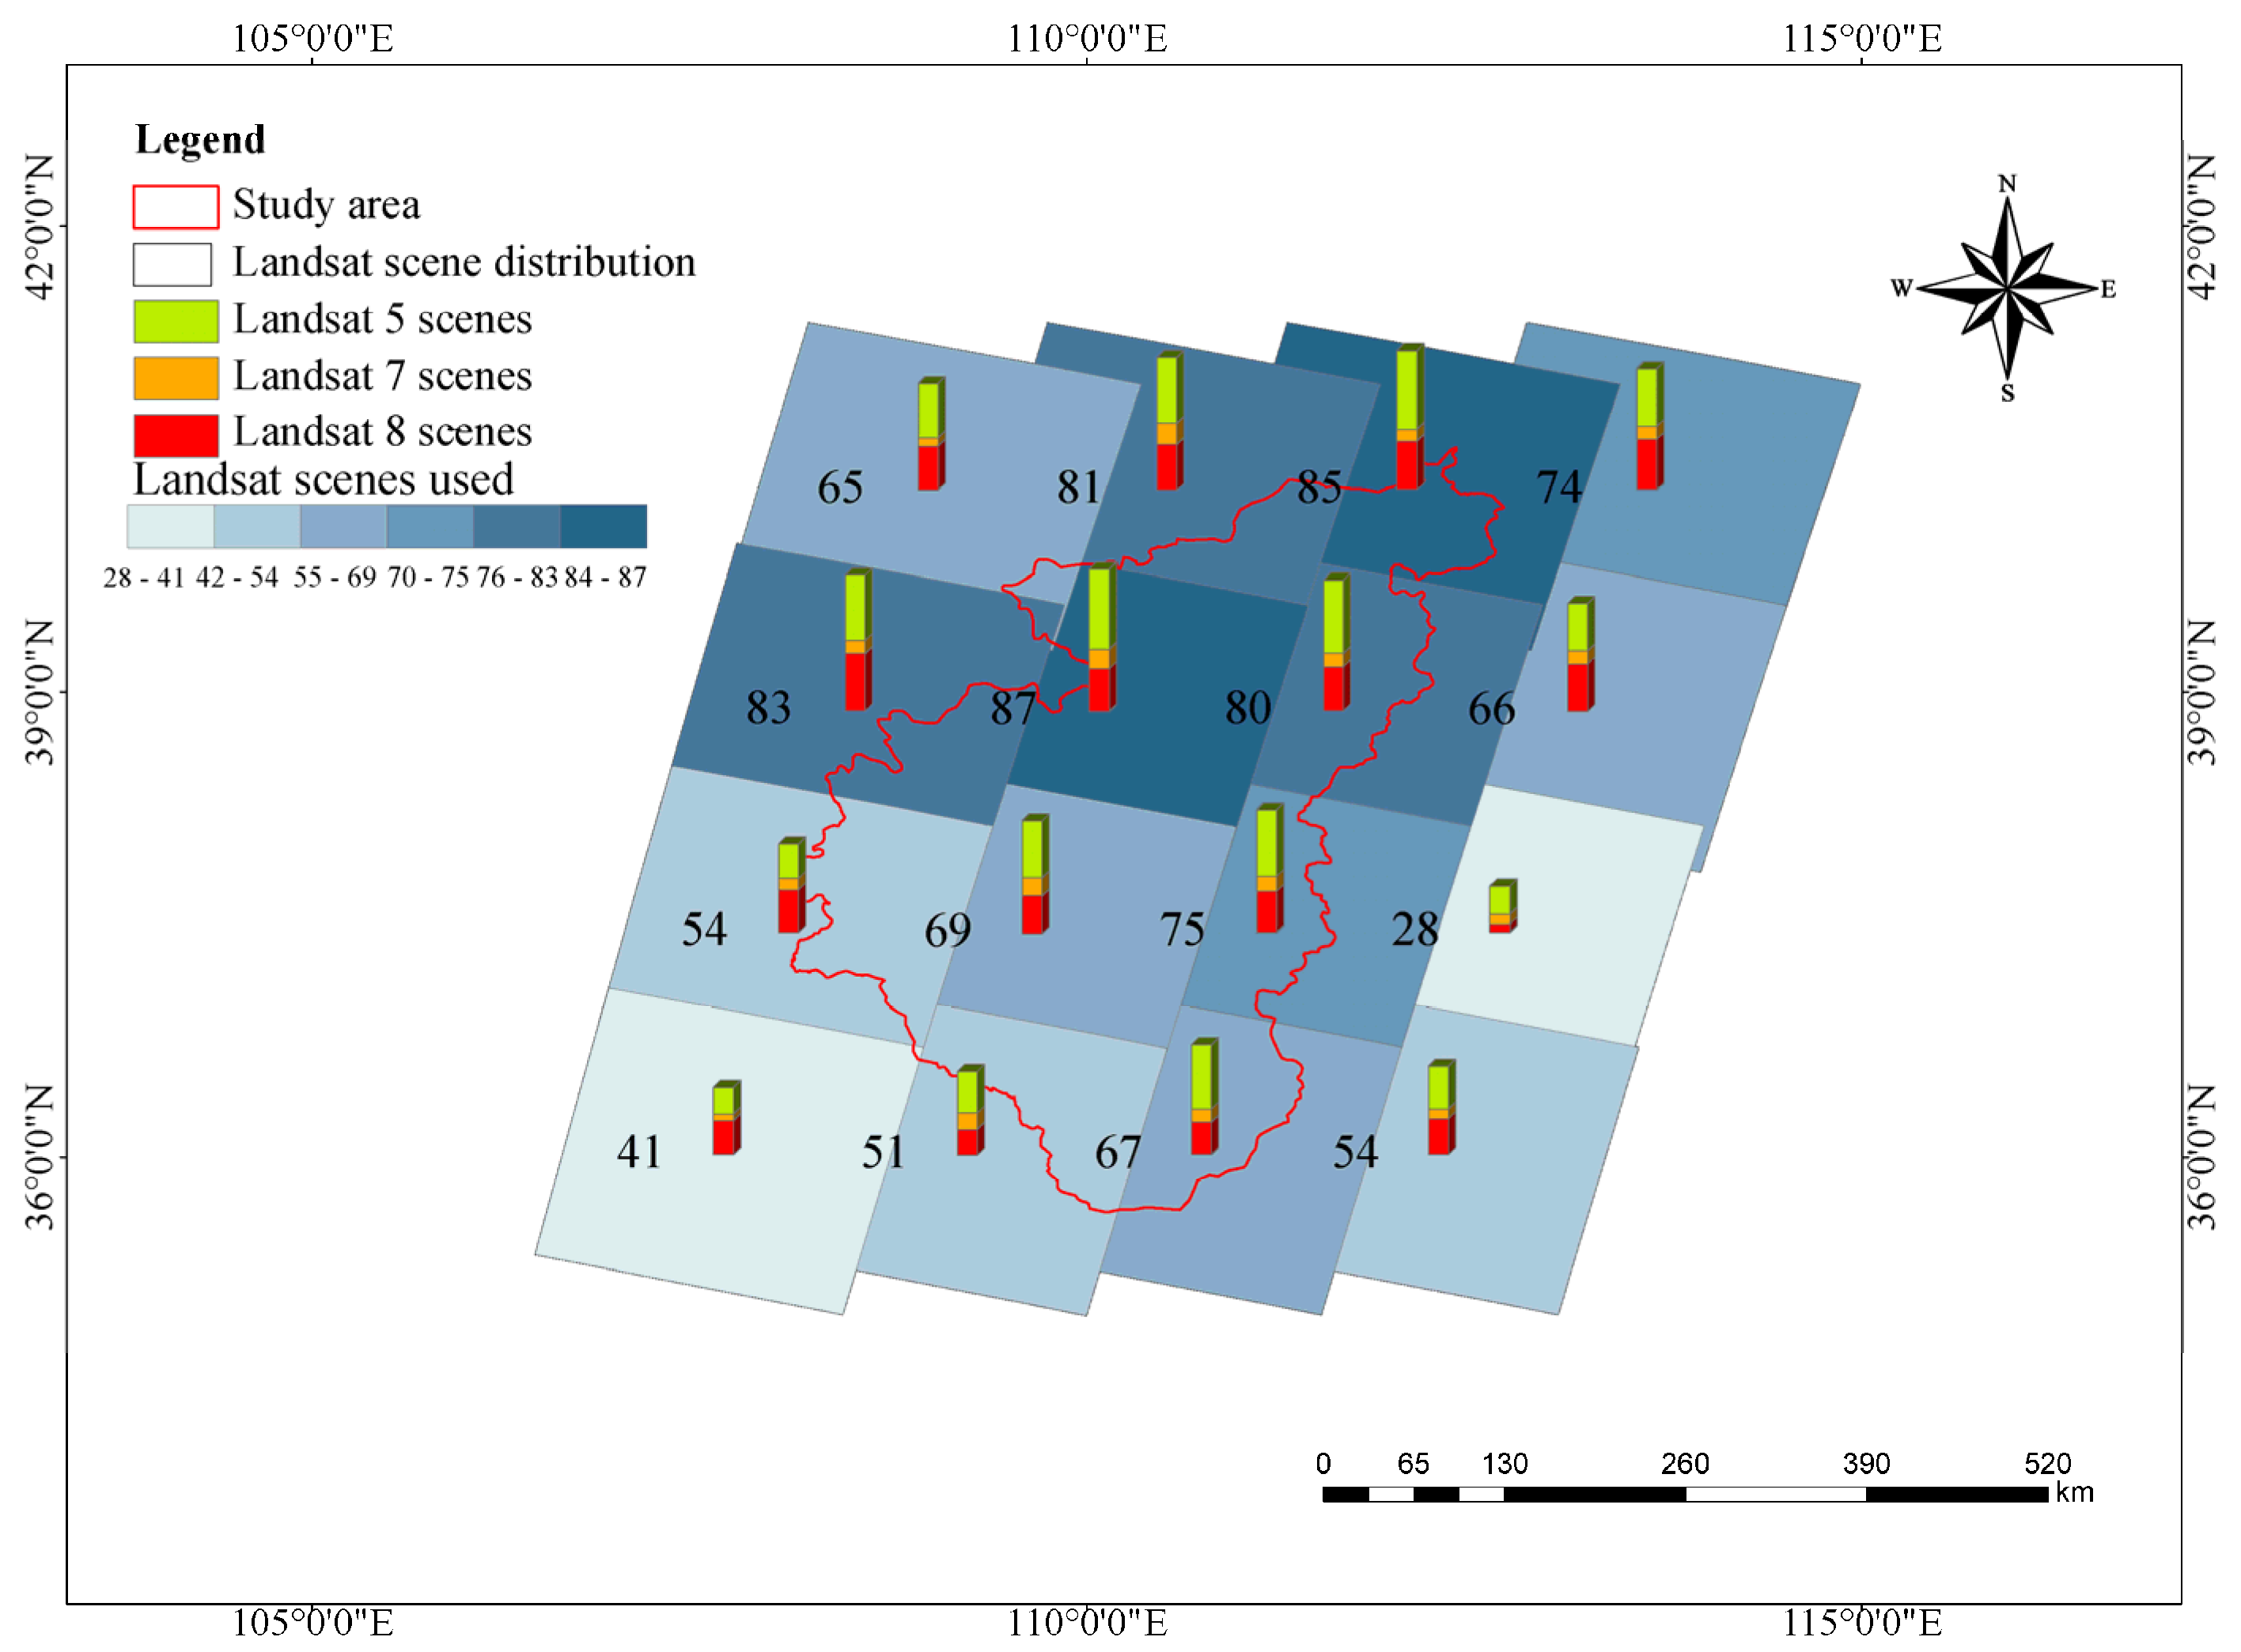
2.2. Data Source
2.3. Methodology
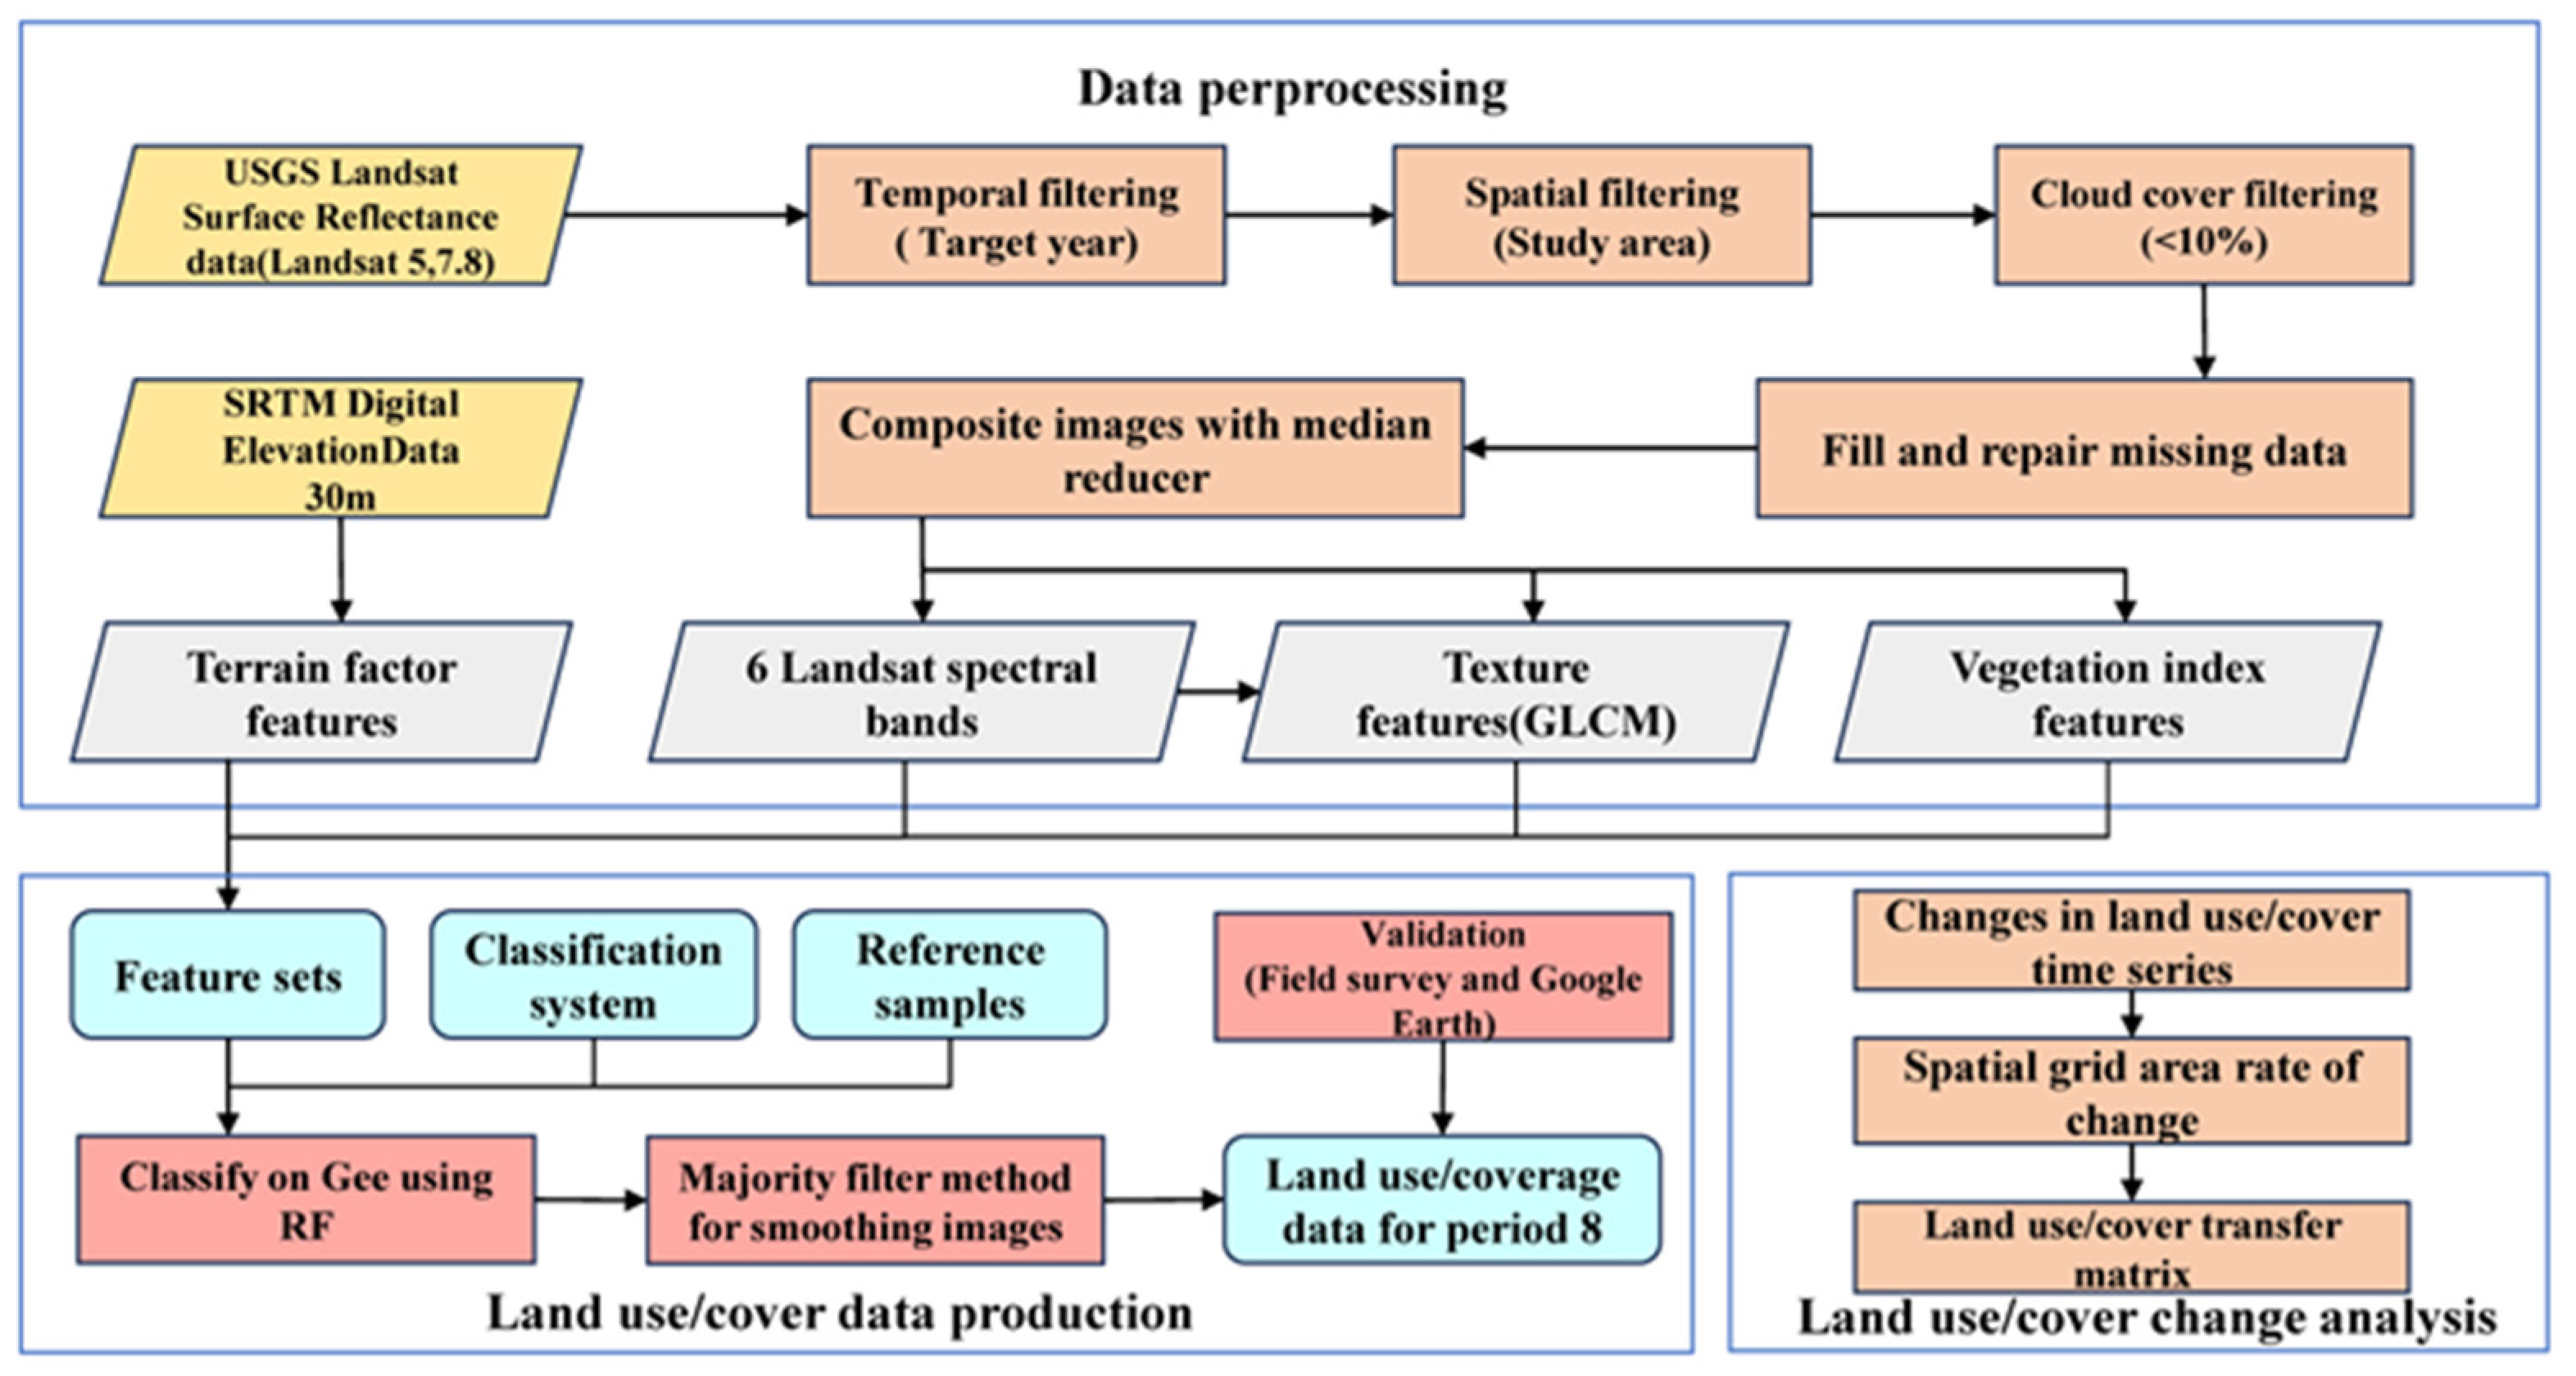
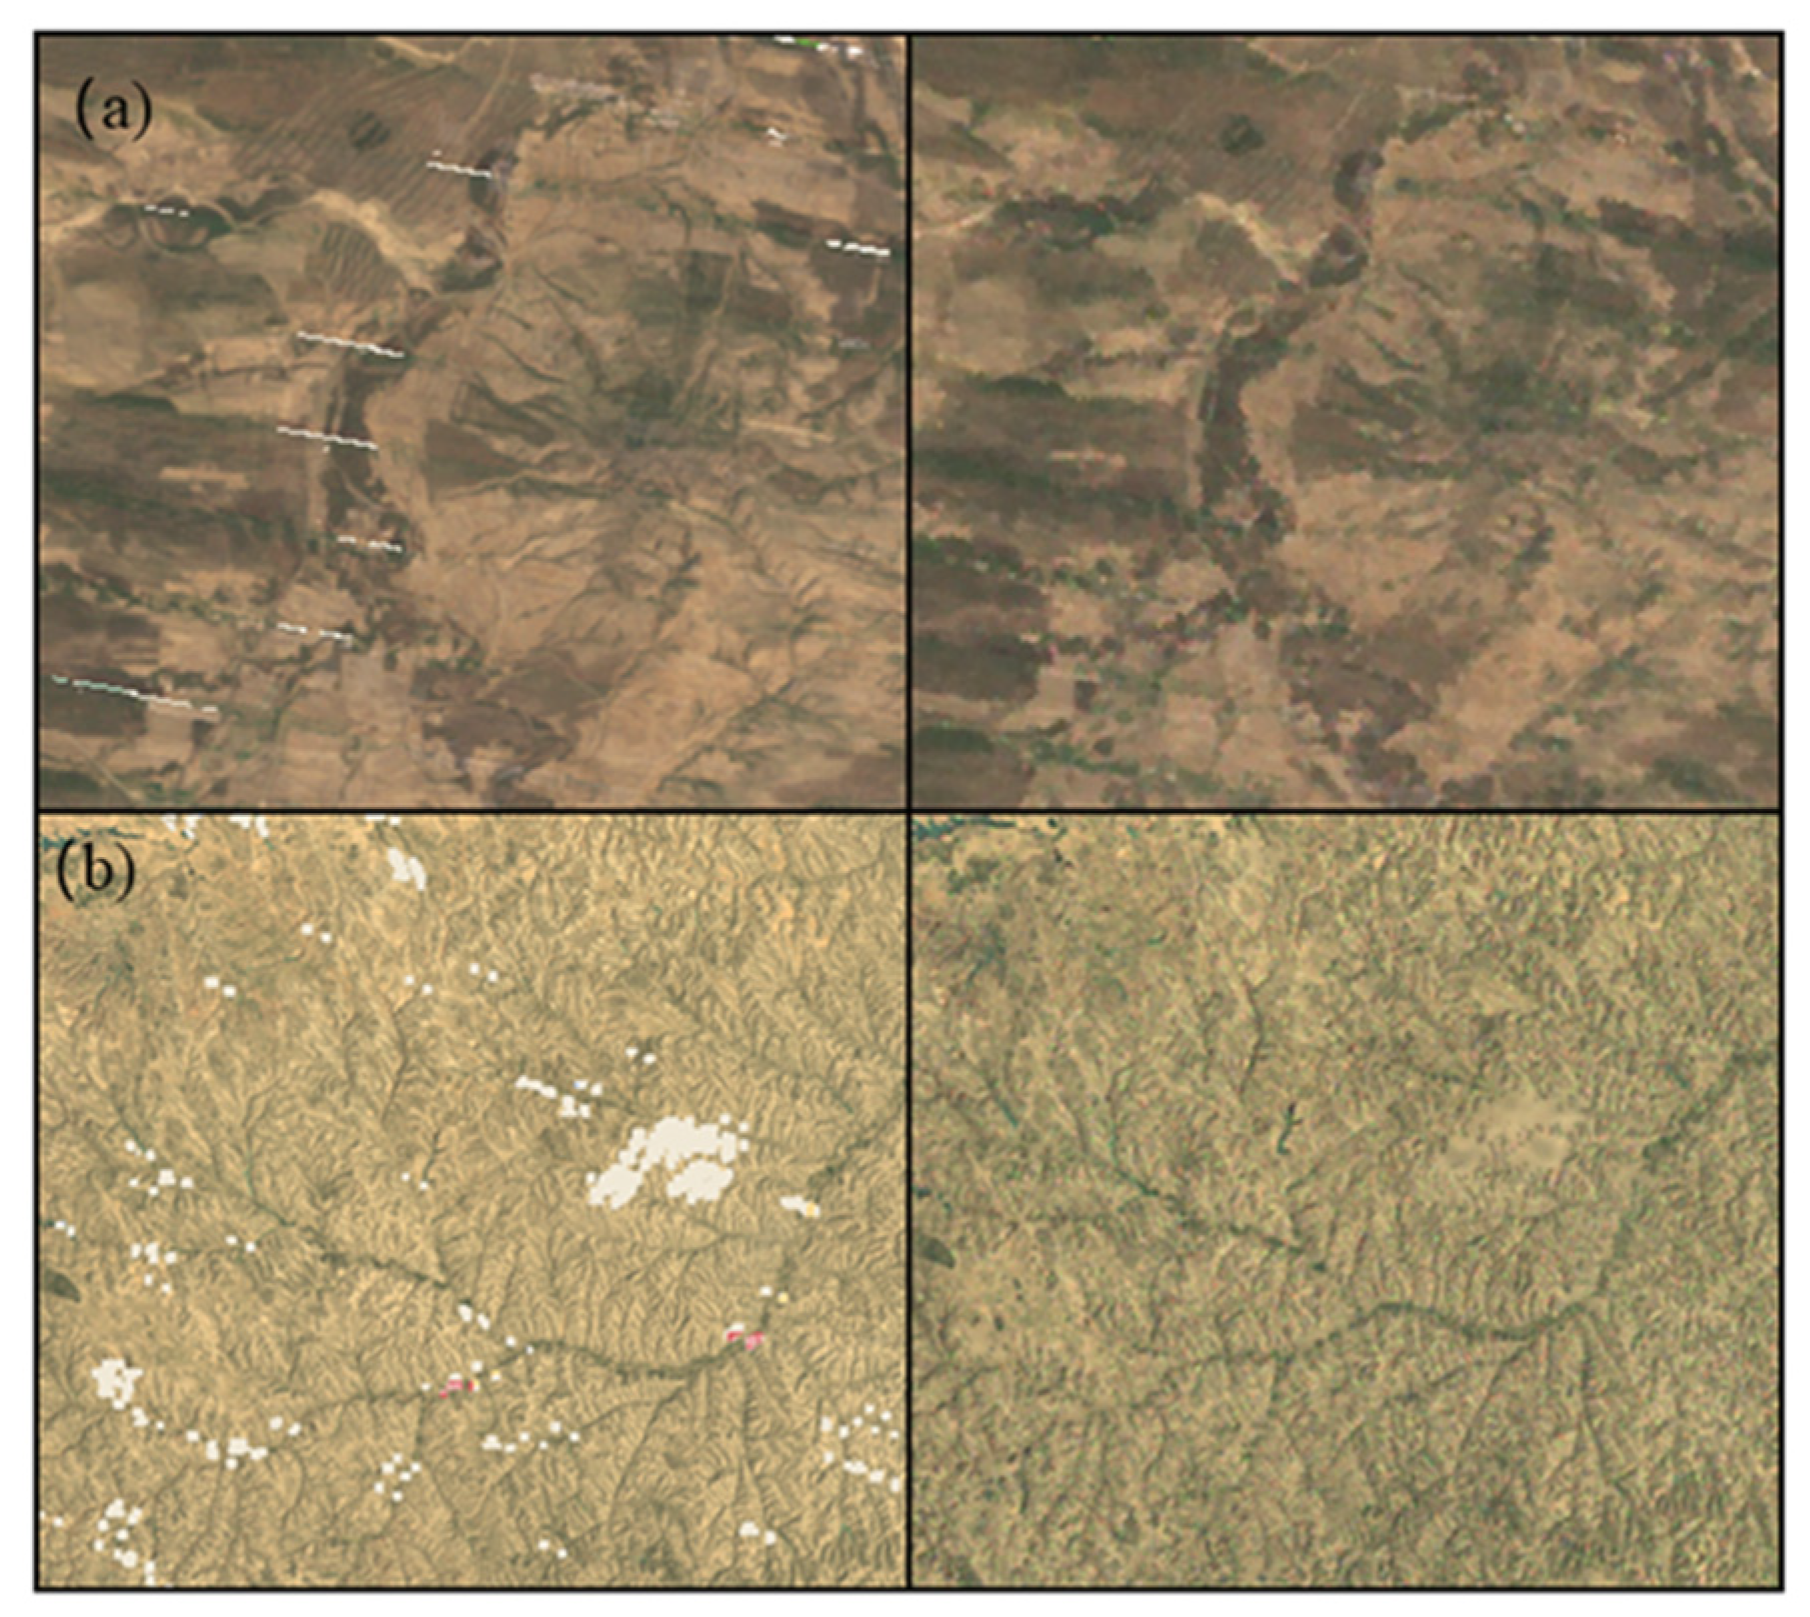
2.3.1. Data Preprocessing
2.3.2. Design of the Land Use and Cover Classification System
2.3.3. Classification Method and Strategy
3. Results
3.1. Data Validation and Evaluation
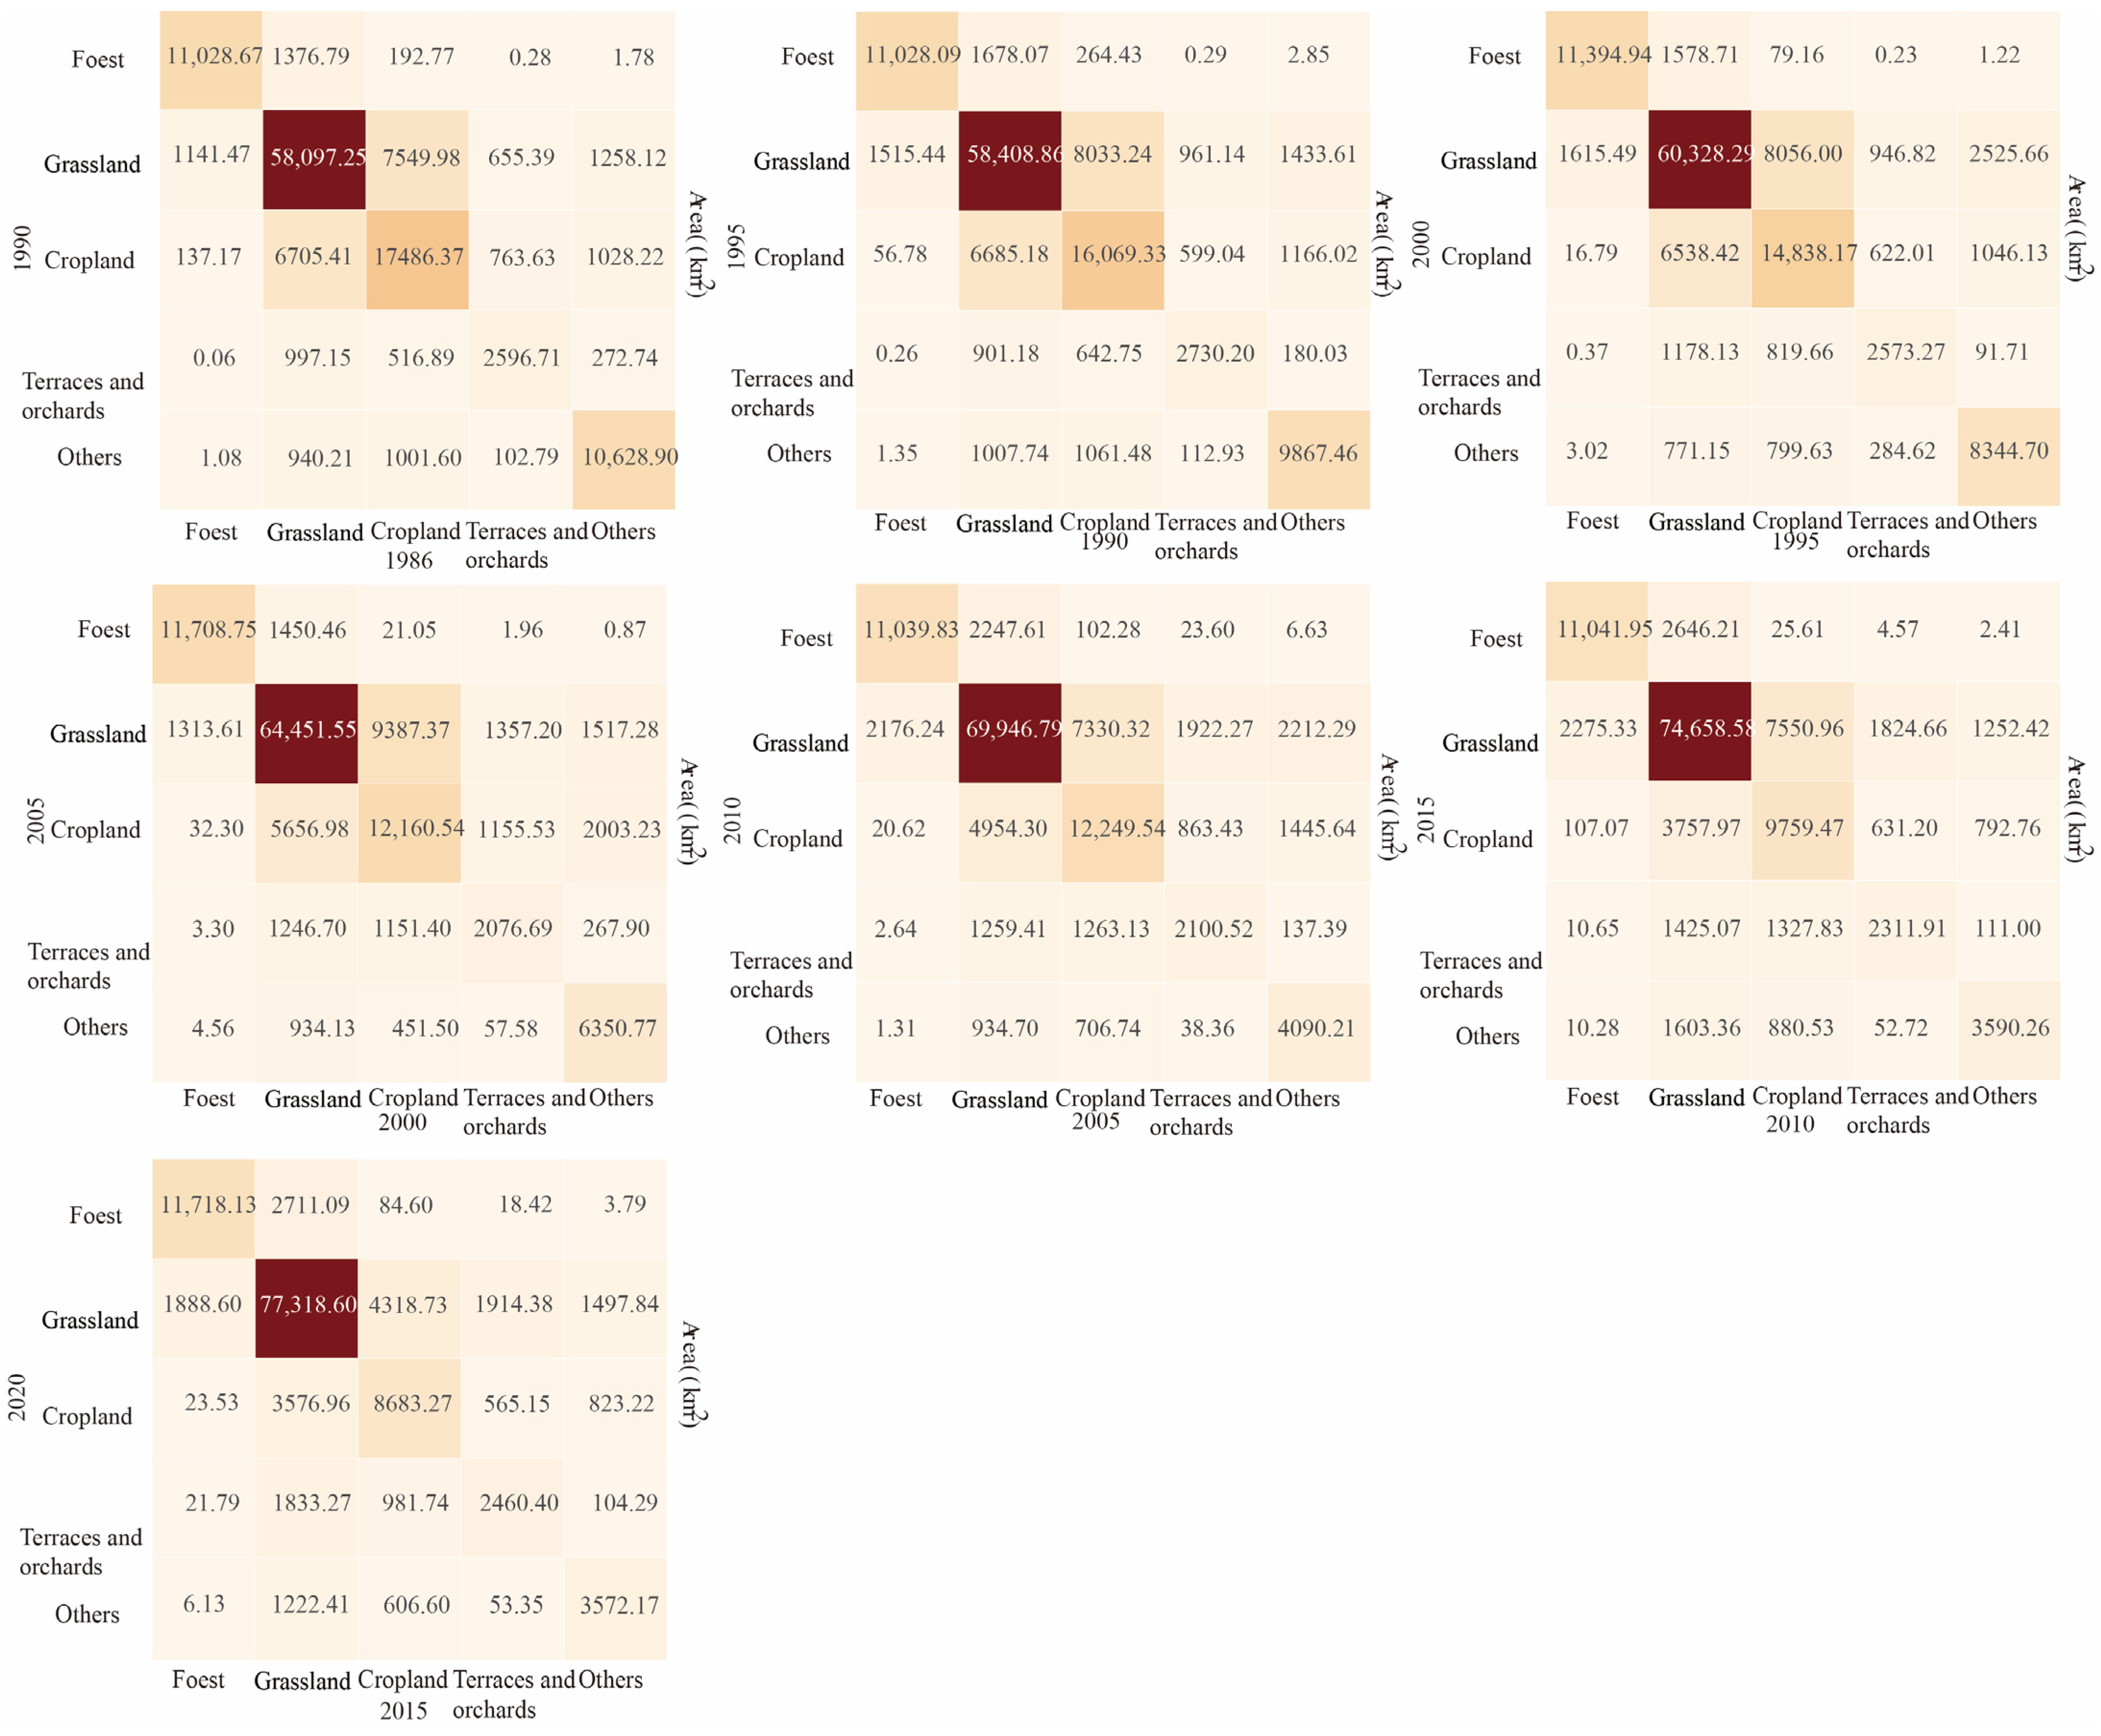
3.2. Land Use and Land Cover Change
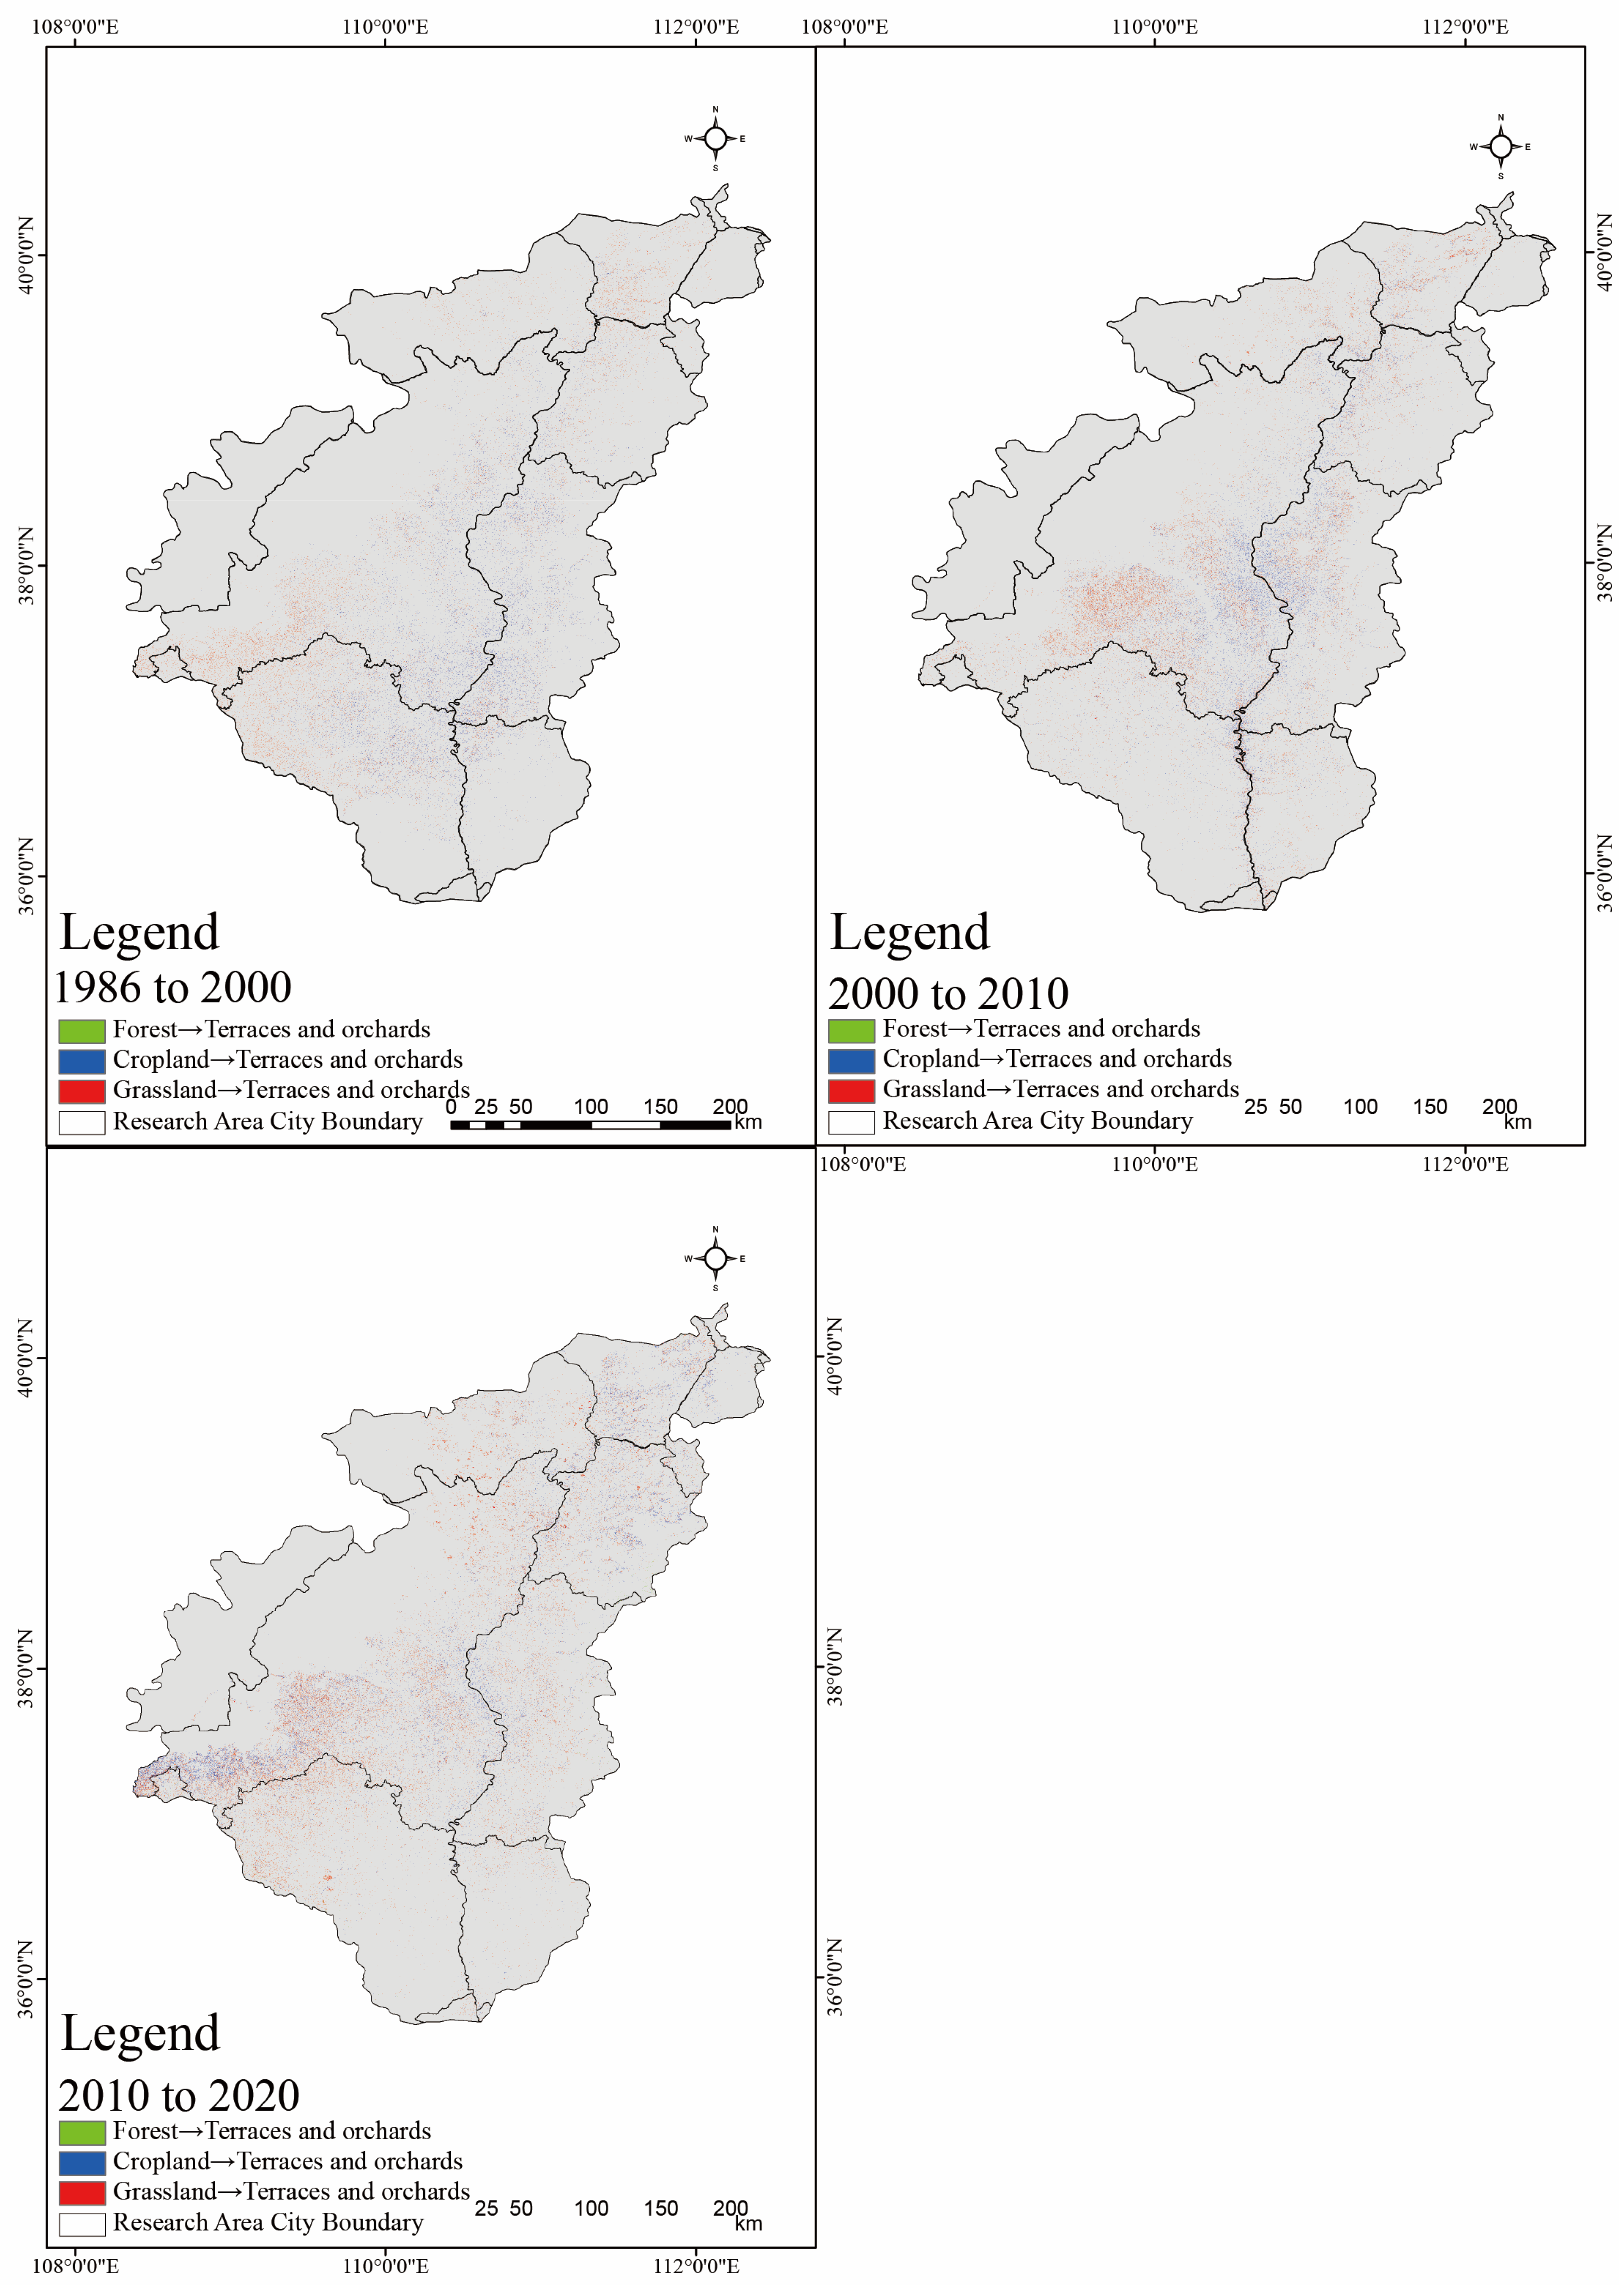
3.3. Transition From Multiple Land Use and Cover Types to Terraces and Orchards
4. Discussion
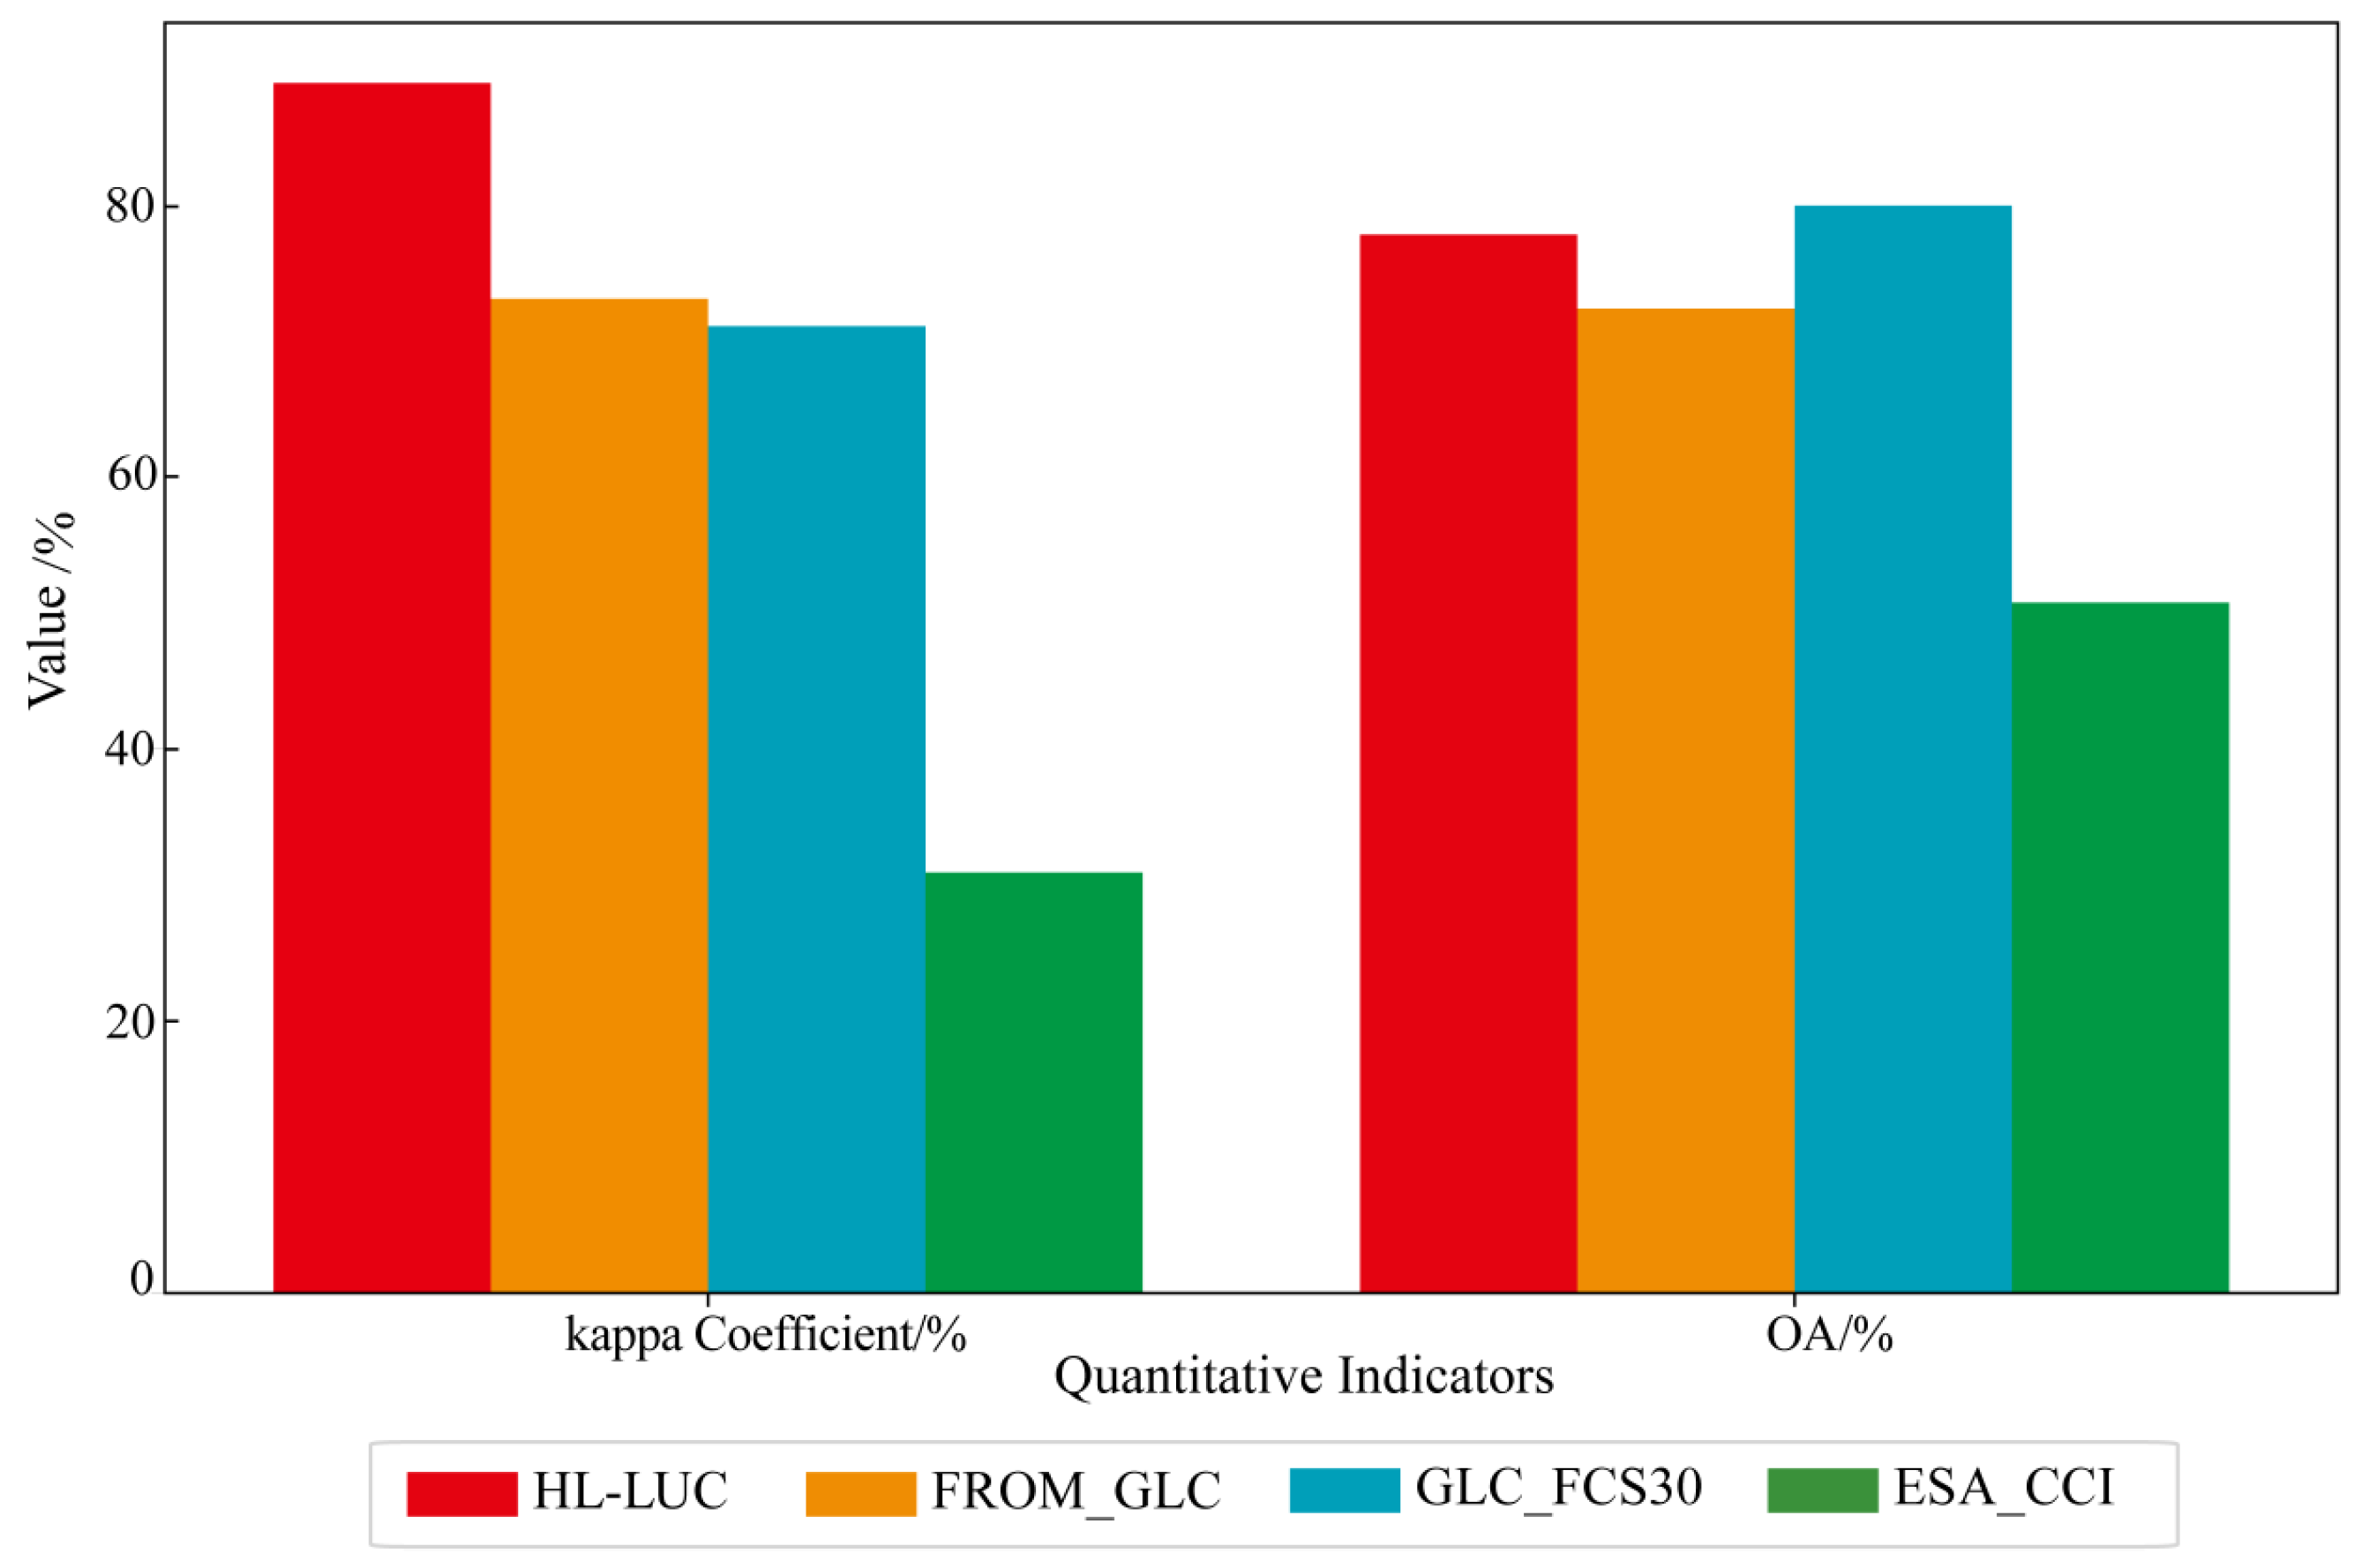
4.1. Evaluation of the Accuracy of the HL-LUC Product in Relation to that of Other Products
4.2. Comparative Analysis of Terraces and Orchard Land Use Type in HL-LUC
5. Conclusions
- (1)
- Based on the GEE platform, we obtained 1060 Landsat images with less than 10% cloud coverage and used the RF algorithm to acquire LUCC classification data for eight periods from 1986 to 2020. The results indicated an average overall accuracy of 87.54% and an average Kappa coefficient of 76.94%. In the study area, HL-LUC demonstrated a higher classification accuracy than FROM-GLC, GLC-FCS30, and ESA-CCI-LC, and only HL-LUC identified the terraces and orchards in the Helong Region, providing long-term spatial distribution data. Therefore, HL-LUC products could effectively identify terraces, orchards, and other land use types with a high accuracy.
- (2)
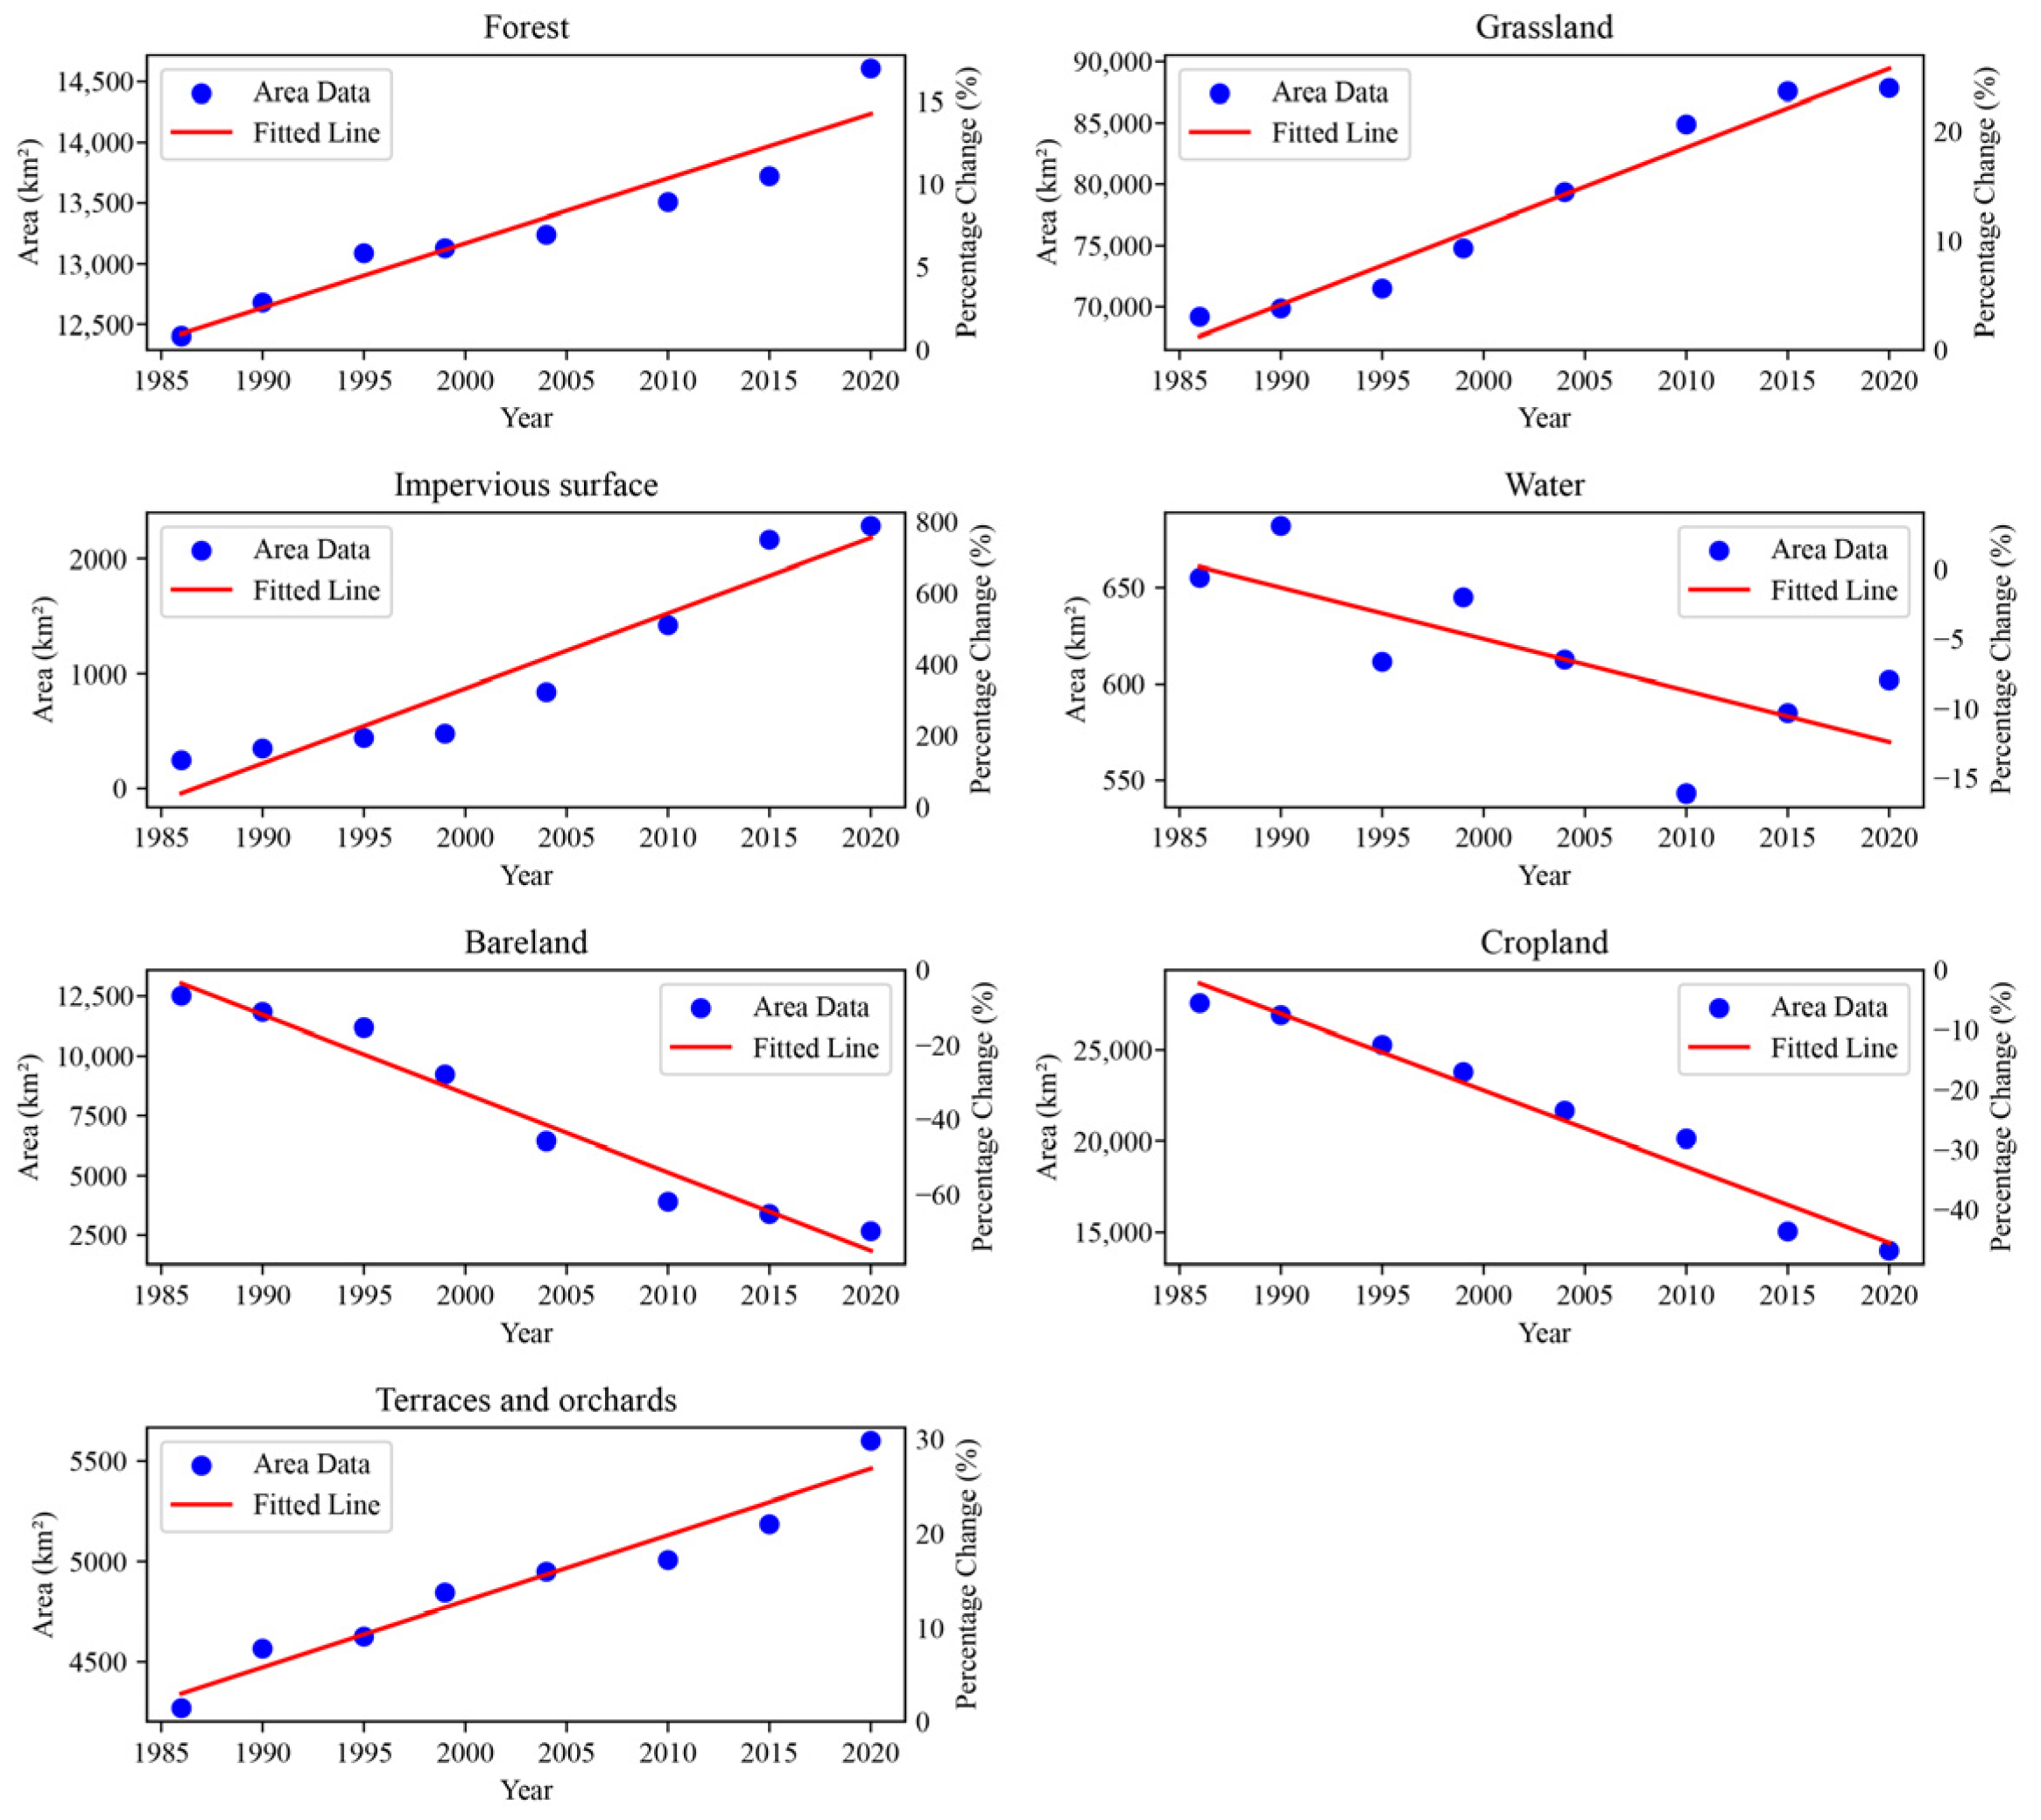
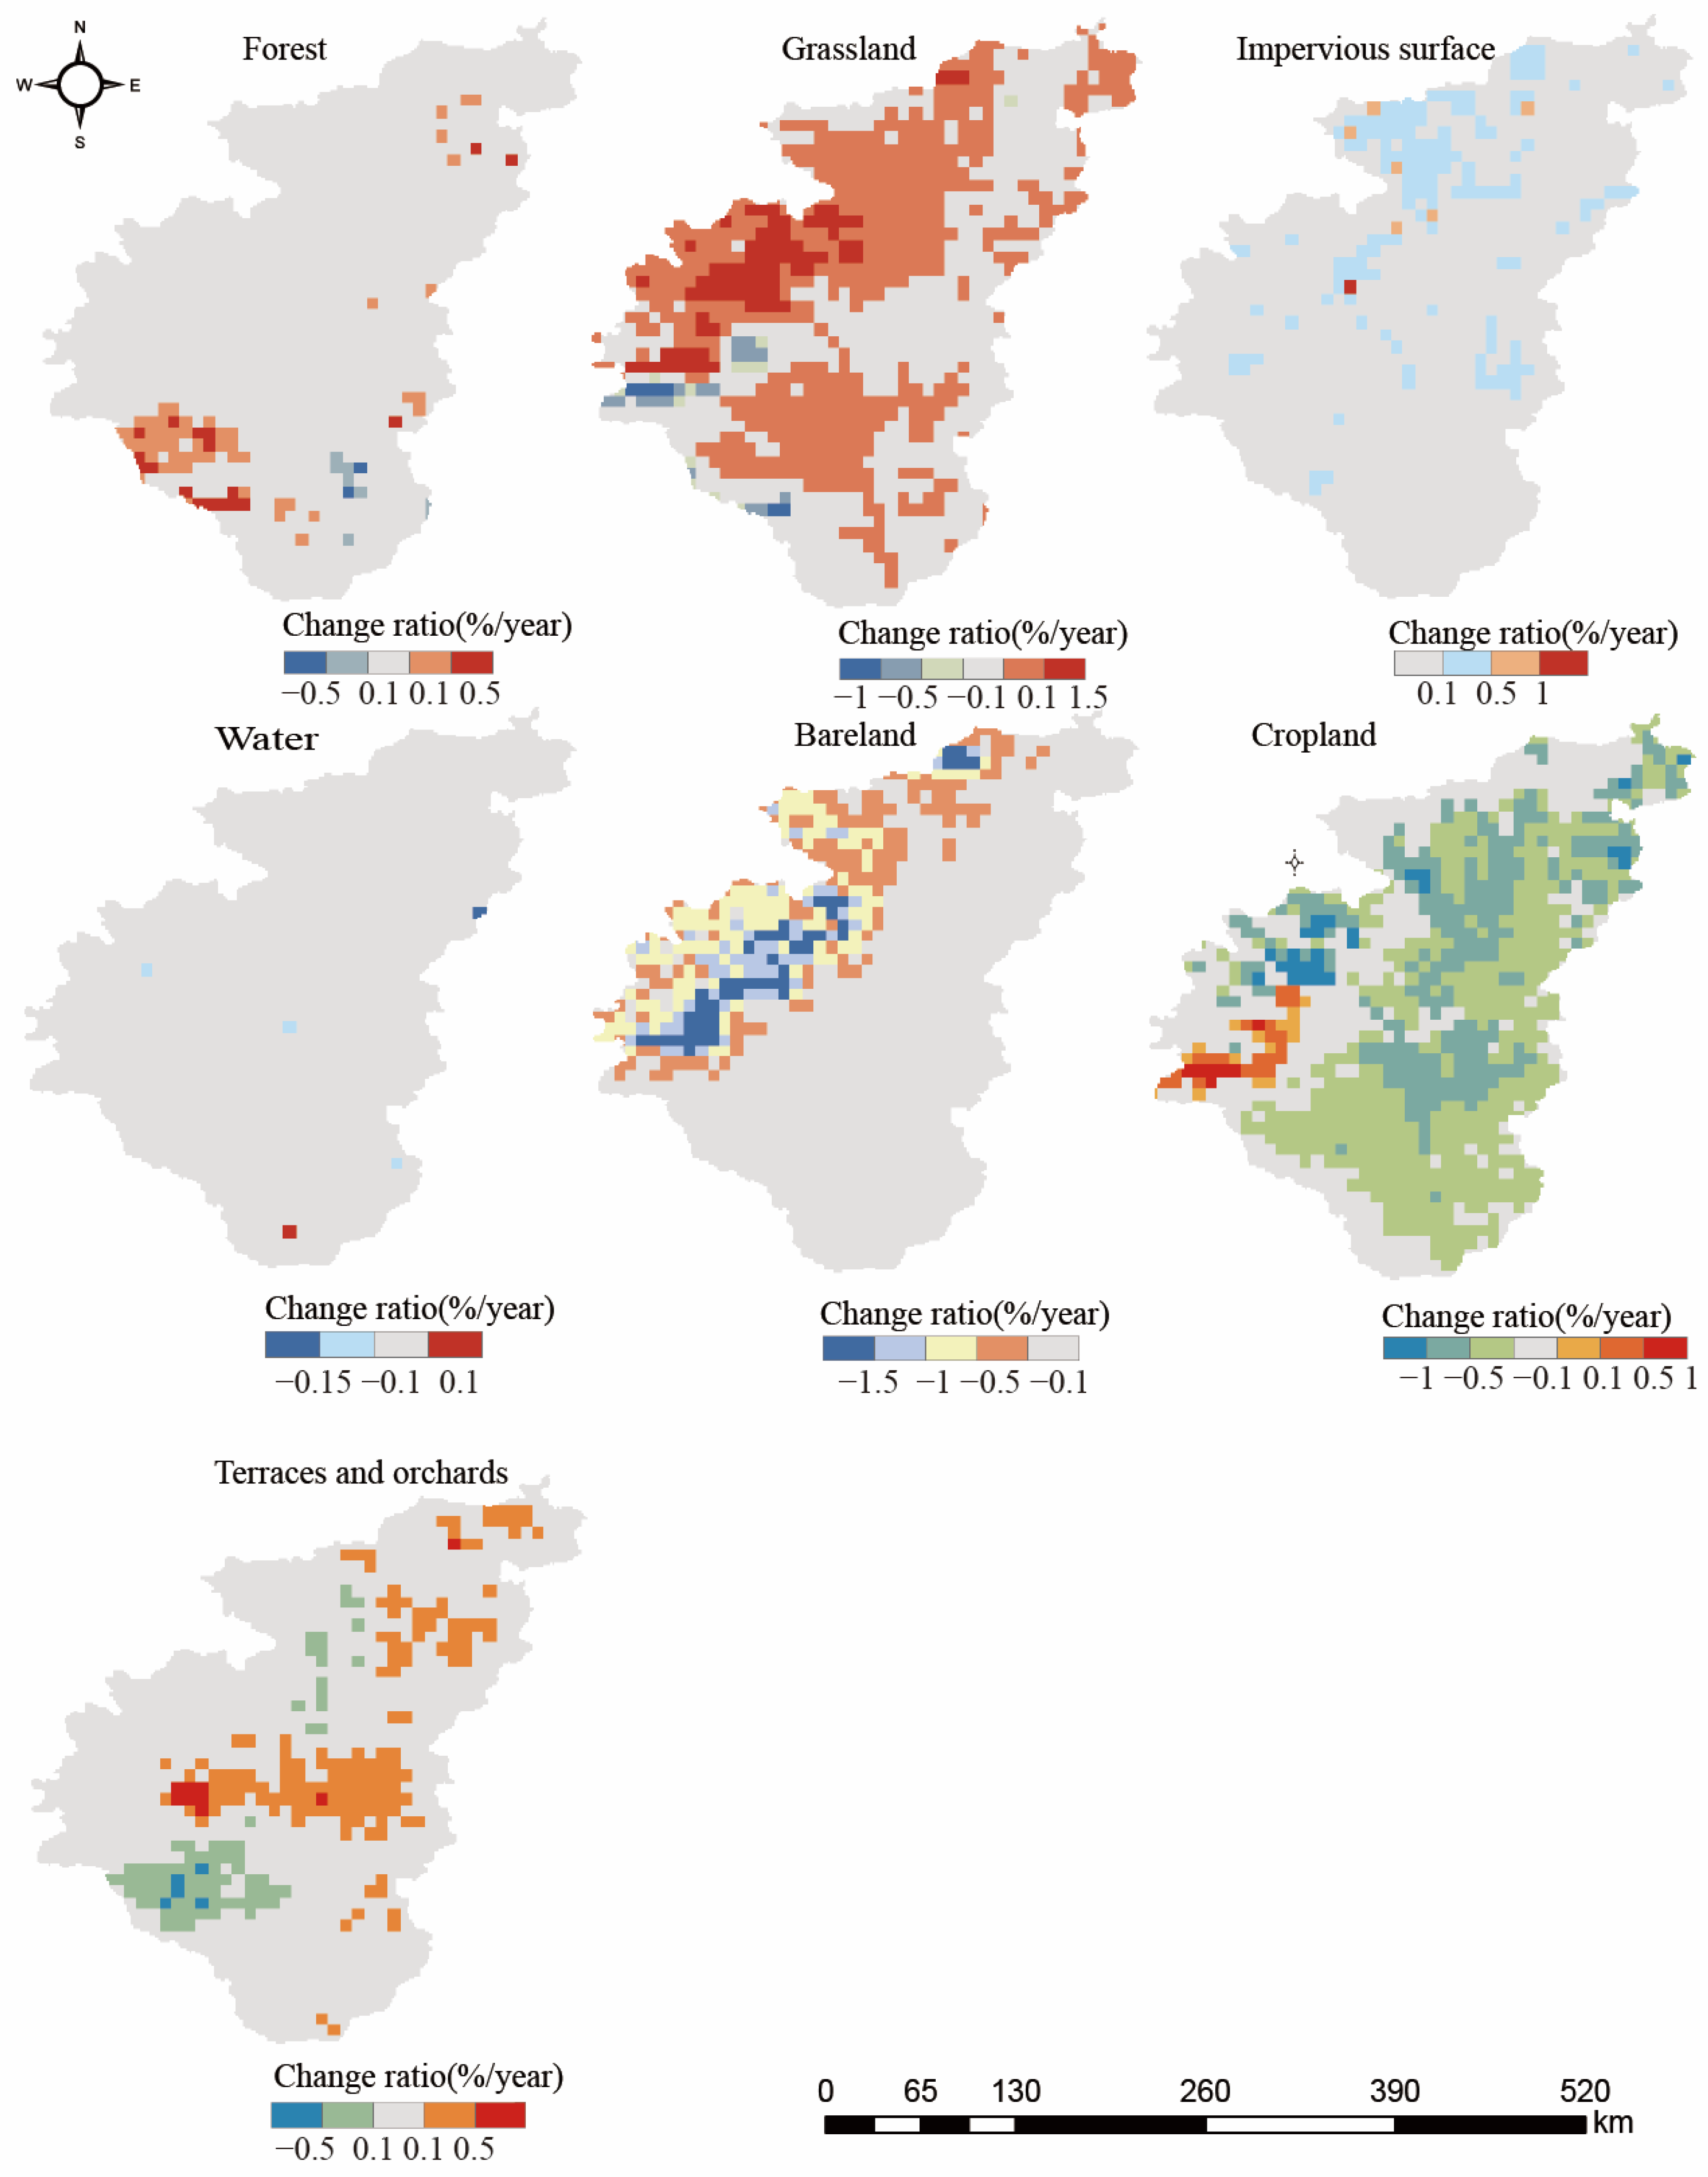
- Through a comprehensive analysis of the time series of land use types, the land use transition matrix, and the spatial distribution of area change rates, this study delved into the spatiotemporal evolution patterns of the LUC types in the Helong Region from 1986 to 2020. The results revealed a notable increase in the areas of forest and grassland. The growth of forest areas primarily stemmed from grassland and cropland conversion, while the expansion of grasslands was mainly attributed to cropland conversion. This was largely due to the implementation of the GGP and the NFCP. Additionally, the rapid increase in impervious surfaces (2038.19 km2) was primarily attributed to conversions from cropland, reflecting the implementation of the Western Development Strategy and the Rise of Central China policy.
- (3)
- Through a spatiotemporal analysis of land use transfer, we observed that the total area of terraces and orchards in the study area increased by 1334.14 km2 from 1986 to 2020. This growth was primarily due to the conversion of forest lands, grasslands, and croplands into terraces and orchards. From the late 1970s to the late 1990s, the Loess Plateau implemented a policy of constructing terraces on gentle slopes. Subsequently, the GGP was implemented, and the second phase, which started in 2014, encouraged farmers to develop economic forestry, such as planting fruit trees. These policies significantly promoted the growth of terraces and orchards during 1985–1990 and 2015–2020. The expansion of terraces and orchards not only improved the ecological environment but also enhanced economic efficiency.
Author Contributions
Funding
Data Availability Statement
Conflicts of Interest
References
- Liu, H.; Gong, P.; Wang, J.; Clinton, N.; Bai, Y.; Liang, S. Annual Dynamics of Global Land Cover and Its Long-Term Changes from 1982 to 2015. Earth Syst. Sci. Data 2020, 12, 1217–1243. [Google Scholar] [CrossRef]
- Li, J.; Chen, Y.; Zhu, Y.; Liu, J. Study of Flood Simulation in Small and Medium-Sized Basins Based on the Liuxihe Model. Sustainability 2023, 15, 11225. [Google Scholar] [CrossRef]
- Zhu, Y.; Chen, Y.; Zhao, Y.; Zhou, F.; Xu, S. Application and Research of Liuxihe Model in the Simulation of Inflow Flood at Zaoshi Reservoir. Sustainability 2023, 15, 9857. [Google Scholar] [CrossRef]
- Zhao, Y.; Chen, Y.; Zhu, Y.; Xu, S. Evaluating the Feasibility of the Liuxihe Model for Forecasting Inflow Flood to the Fengshuba Reservoir. Water 2023, 15, 1048. [Google Scholar] [CrossRef]
- Lambin, E.F.; Meyfroidt, P. Global Land Use Change, Economic Globalization, and the Looming Land Scarcity. Proc. Natl. Acad. Sci. USA 2011, 108, 3465–3472. [Google Scholar] [CrossRef]
- Jones, K.R.; Venter, O.; Fuller, R.A.; Allan, J.R.; Maxwell, S.L.; Negret, P.J.; Watson, J.E.M. One-Third of Global Protected Land Is under Intense Human Pressure. Science 2018, 360, 788–791. [Google Scholar] [CrossRef]
- Marques, A.; Martins, I.S.; Kastner, T.; Plutzar, C.; Theurl, M.C.; Eisenmenger, N.; Huijbregts, M.A.J.; Wood, R.; Stadler, K.; Bruckner, M.; et al. Increasing Impacts of Land Use on Biodiversity and Carbon Sequestration Driven by Population and Economic Growth. Nat. Ecol. Evol. 2019, 3, 628–637. [Google Scholar] [CrossRef] [PubMed]
- Han, X.; Tsunekawa, A.; Tsubo, M.; Li, S. Effects of Land-Cover Type and Topography on Soil Organic Carbon Storage on Northern Loess Plateau, China. Acta Agric. Scand. Sect. B—Soil Plant Sci. 2010, 60, 326–334. [Google Scholar] [CrossRef]
- Douangsavanh, L.; Polthanee, A.; Katawatin, R. Food Security of Shifting Cultivation Systems: Case Studies from Luang Prabang and Oudomxay Provinces, Lao PDR. J. Mt. Sci. 2006, 3, 48–57. [Google Scholar] [CrossRef]
- Tang, G.; Ge, S.; Li, F.; Zhou, J. Review of Digital Elevation Model (DEM) Based Research on China Loess Plateau. J. Mt. Sci. 2005, 2, 265–270. [Google Scholar] [CrossRef]
- Xu, Y.; Yang, B.; Tang, Q.; Liu, G.; Liu, P. Analysis of Comprehensive Benefits of Transforming Slope Farmland to Terraces on the Loess Plateau: A Case Study of the Yangou Watershed in Northern Shaanxi Province, China. J. Mt. Sci. 2011, 8, 448–457. [Google Scholar] [CrossRef]
- Gong, P.; Wang, J.; Yu, L.; Zhao, Y.; Zhao, Y.; Liang, L.; Niu, Z.; Huang, X.; Fu, H.; Liu, S.; et al. Finer Resolution Observation and Monitoring of Global Land Cover: First Mapping Results with Landsat TM and ETM+ Data. Int. J. Remote Sens. 2013, 34, 2607–2654. [Google Scholar] [CrossRef]
- Chen, J.; Chen, J.; Liao, A.; Cao, X.; Chen, L.; Chen, X.; He, C.; Han, G.; Peng, S.; Lu, M.; et al. Global Land Cover Mapping at 30 m Resolution: A POK-Based Operational Approach. ISPRS J. Photogramm. Remote Sens. 2015, 103, 7–27. [Google Scholar] [CrossRef]
- Zhang, X.; Liu, L.; Chen, X.; Gao, Y.; Xie, S.; Mi, J. GLC_FCS30: Global Land-Cover Product with Fine Classification System at 30 m Using Time-Series Landsat Imagery. Earth Syst. Sci. Data 2021, 13, 2753–2776. [Google Scholar] [CrossRef]
- Xu, Y.; An, X.; Yang, B.; Liu, P. Synthetic analyses of effects of famland terracing on the Loess Plateau:A case study of Yangou Watershed. Sci. Soil Water Conserv. 2010, 8, 1–5+12. [Google Scholar] [CrossRef]
- Hill, R.D.; Peart, M.R. Land Use, Runoff, Erosion and Their Control: A Review for Southern China. Hydrol. Process. 1998, 12, 2029–2042. [Google Scholar] [CrossRef]
- Gao, P.; Deng, J.; Chai, X.; Mu, X.; Zhao, G.; Shao, H.; Sun, W. Dynamic Sediment Discharge in the Hekou–Longmen Region of Yellow River and Soil and Water Conservation Implications. Sci. Total Environ. 2017, 578, 56–66. [Google Scholar] [CrossRef]
- Kumar, L.; Mutanga, O. Google Earth Engine Applications Since Inception: Usage, Trends, and Potential. Remote Sens. 2018, 10, 1509. [Google Scholar] [CrossRef]
- Perilla, G.A.; Mas, J.-F. Google Earth Engine—GEE: A Powerful Tool Linking the Potential of Massive Data and the Efficiency of Cloud Processing. Investig. Geográficas 2020, n.101, e59929. [Google Scholar] [CrossRef]
- Goward, S.N.; Williams, D.L.; Arvidson, T.; Rocchio, L.E.P.; Irons, J.R.; Russell, C.A.; Johnston, S.S. Landsat’s Enduring Legacy: Pioneering Global Land Observations from Space. Photogramm. Eng. Remote Sens. 2022, 88, 357–358. [Google Scholar] [CrossRef]
- Masek, J.G.; Wulder, M.A.; Markham, B.; McCorkel, J.; Crawford, C.J.; Storey, J.; Jenstrom, D.T. Landsat 9: Empowering Open Science and Applications through Continuity. Remote Sens. Environ. 2020, 248, 111968. [Google Scholar] [CrossRef]
- Gorelick, N.; Hancher, M.; Dixon, M.; Ilyushchenko, S.; Thau, D.; Moore, R. Google Earth Engine: Planetary-Scale Geospatial Analysis for Everyone. Remote Sens. Environ. 2017, 202, 18–27. [Google Scholar] [CrossRef]
- Rabus, B.; Eineder, M.; Roth, A.; Bamler, R. The Shuttle Radar Topography Mission—A New Class of Digital Elevation Models Acquired by Spaceborne Radar. ISPRS J. Photogramm. Remote Sens. 2003, 57, 241–262. [Google Scholar] [CrossRef]
- Cao, B.; Yu, L.; Naipal, V.; Ciais, P.; Li, W.; Zhao, Y.; Wei, W.; Chen, D.; Liu, Z.; Gong, P. A 30 m Terrace Mapping in China Using Landsat 8 Imagery and Digital Elevation Model Based on the Google Earth Engine. Earth Syst. Sci. Data 2021, 13, 2437–2456. [Google Scholar] [CrossRef]
- Clausi, D.A.; Jernigan, M.E. A Fast Method to Determine Co-Occurrence Texture Features. IEEE Trans. Geosci. Remote Sens. 1998, 36, 298–300. [Google Scholar] [CrossRef]
- Zhang, Y.; Yang, H.; Xin, Z.; Lu, L. Extraction of Small Watershed Terraces in the Hilly Areas of LoessPlateau Through UAV Images with Object-oriented Approach. J. Soil Water Conserv. 2023, 37, 139–146. [Google Scholar] [CrossRef]
- Teluguntla, P.; Thenkabail, P.S.; Oliphant, A.; Xiong, J.; Gumma, M.K.; Congalton, R.G.; Yadav, K.; Huete, A. A 30-m Landsat-Derived Cropland Extent Product of Australia and China Using Random Forest Machine Learning Algorithm on Google Earth Engine Cloud Computing Platform. ISPRS J. Photogramm. Remote Sens. 2018, 144, 325–340. [Google Scholar] [CrossRef]
- KIM, K.E. Adaptive Majority Filtering for Contextual Classification of Remote Sensing Data. Int. J. Remote Sens. 1996, 17, 1083–1087. [Google Scholar] [CrossRef]
- Ma, H.; Gao, X.; Gu, X. Random Forest Classification of Landsat 8 Imagery for the Complex Terrain Area based on the Combination of Spectral, Topographic and Texture Information. J. Geo-Inf. Sci. 2019, 21, 359–371. [Google Scholar] [CrossRef]
- Flood, N. Seasonal Composite Landsat TM/ETM+ Images Using the Medoid (a Multi-Dimensional Median). Remote Sens. 2013, 5, 6481–6500. [Google Scholar] [CrossRef]
- Azzari, G.; Lobell, D.B. Landsat-Based Classification in the Cloud: An Opportunity for a Paradigm Shift in Land Cover Monitoring. Remote Sens. Environ. 2017, 202, 64–74. [Google Scholar] [CrossRef]
- Louwagie, G.; Gay, S.H.; Sammeth, F.; Ratinger, T. The Potential of European Union Policies to Address Soil Degradation in Agriculture. Land Degrad. Dev. 2011, 22, 5–17. [Google Scholar] [CrossRef]
- Li, X.H.; Yang, J.; Zhao, C.Y.; Wang, B. Runoff and sediment from orchard terraces in southeastern China. Land Degrad. Dev. 2014, 25, 184–192. [Google Scholar] [CrossRef]
- Hua, G. Study on Coordination and Quantification of Ecological Protection and High Quality Development in the Yellow River Basin. IOP Conf. Ser. Earth Environ. Sci. 2021, 647, 012168. [Google Scholar] [CrossRef]
- Sheykhmousa, M.; Mahdianpari, M.; Ghanbari, H.; Mohammadimanesh, F.; Ghamisi, P.; Homayouni, S. Support Vector Machine Versus Random Forest for Remote Sensing Image Classification: A Meta-Analysis and Systematic Review. IEEE J. Sel. Top. Appl. Earth Obs. Remote Sens. 2020, 13, 6308–6325. [Google Scholar] [CrossRef]
- Tassi, A.; Vizzari, M. Object-Oriented LULC Classification in Google Earth Engine Combining SNIC, GLCM, and Machine Learning Algorithms. Remote Sens. 2020, 12, 3776. [Google Scholar] [CrossRef]
- Rong, W.; Li, Z.; Zhang, W.; Sun, L. An Improved Canny Edge Detection Algorithm. In Proceedings of the 2014 IEEE International Conference on Mechatronics and Automation, Tianjin, China, 3–6 August 2014; pp. 577–582. [Google Scholar]
- Gonenc, A.; Ozerdem, M.S.; Acar, E. Comparison of NDVI and RVI Vegetation Indices Using Satellite Images. In Proceedings of the 2019 8th International Conference on Agro-Geoinformatics (Agro-Geoinformatics), Istanbul, Turkey, 16–19 July 2019; pp. 1–4. [Google Scholar]
- Huang, S.; Tang, L.; Hupy, J.P.; Wang, Y.; Shao, G. A Commentary Review on the Use of Normalized Difference Vegetation Index (NDVI) in the Era of Popular Remote Sensing. J. For. Res. 2021, 32, 1–6. [Google Scholar] [CrossRef]
- Galvão, L.S.; dos Santos, J.R.; Roberts, D.A.; Breunig, F.M.; Toomey, M.; de Moura, Y.M. On Intra-Annual EVI Variability in the Dry Season of Tropical Forest: A Case Study with MODIS and Hyperspectral Data. Remote Sens. Environ. 2011, 115, 2350–2359. [Google Scholar] [CrossRef]
- Gao, B. NDWI—A Normalized Difference Water Index for Remote Sensing of Vegetation Liquid Water from Space. Remote Sens. Environ. 1996, 58, 257–266. [Google Scholar] [CrossRef]
- Zhang, Y.; Odeh, I.O.A.; Han, C. Bi-Temporal Characterization of Land Surface Temperature in Relation to Impervious Surface Area, NDVI and NDBI, Using a Sub-Pixel Image Analysis. Int. J. Appl. Earth Obs. Geoinf. 2009, 11, 256–264. [Google Scholar] [CrossRef]
- Ma, X.; Li, C.; Tong, X.; Liu, S. A New Fusion Approach for Extracting Urban Built-up Areas from Multisource Remotely Sensed Data. Remote Sens. 2019, 11, 2516. [Google Scholar] [CrossRef]
- Xiu, L.; Yan, C.; Li, X.; Qian, D.; Feng, K. Monitoring the Response of Vegetation Dynamics to Ecological Engineering in the Mu Us Sandy Land of China from 1982 to 2014. Environ. Monit. Assess. 2018, 190, 543. [Google Scholar] [CrossRef] [PubMed]
- Huang, L.; Zhou, W.; Li, H.; Zhou, F.; Yang, H. Effect of land use/cover change on grassland NPP in grassland ccosystem of Ordos City. Bull. Soil Water Conserv. 2018, 38, 46–52+59+2. [Google Scholar] [CrossRef]
- Guo, S. Research on the Coupled Coordination of Ecosystem Health and Urbanization in the Yellow River Basin. Ph.D. Thesis, Jilin University, Changchun, China, 2023. [Google Scholar]
- Gao, Y.; Zhang, Z.; Wei, S.; Wang, Z. The Impact of Urbanization on Food Security in China: An Empirical Analysis Based on Provincial and Regional Panel Data. Resour. Sci. 2019, 41, 1462–1474. [Google Scholar]
- Chen, X.; Li, R.; Zhao, J. China’s food security policy: Evolutionary trajectory, internal logic and strategic orientation. Economist 2020, 117–128. [Google Scholar] [CrossRef]
- Wang, J.; Liu, J.; Song, Z.; Huang, L.; Fang, Y.; Li, Z. Strategies of ecosystem protection and territory spatial utilization for high-quality development in the Yellow River Basin. J. Nat. Resour. 2022, 37, 2930–2945. [Google Scholar] [CrossRef]
- Qin, Y.; Yang, D.; Gao, B.; Wang, T.; Chen, J.; Chen, Y.; Wang, Y.; Zheng, G. Impacts of Climate Warming on the Frozen Ground and Eco-Hydrology in the Yellow River Source Region, China. Sci. Total Environ. 2017, 605–606, 830–841. [Google Scholar] [CrossRef]
- Song, X.; Yang, G.; Yan, C.; Duan, H.; Liu, G.; Zhu, Y. Driving Forces behind Land Use and Cover Change in the Qinghai-Tibetan Plateau: A Case Study of the Source Region of the Yellow River, Qinghai Province, China. Environ. Earth Sci. 2009, 59, 793–801. [Google Scholar] [CrossRef]
- Li, R. Review and Enlightenments of Soil and Water Conservation on Loess Plateau in Past 70 Years. Bull. Soil Water Conserv. 2019, 39, 298–301. [Google Scholar] [CrossRef]
- Pi, H.; Zhang, M.; Xia, J. Ecological Compensation Standards of the Grain for Green Project: Based on the survey data of farmers in Jingyuan County of Ningxia. Issues For. Econ. 2018, 38, 39–44+104. [Google Scholar] [CrossRef]
- Li, J.; Peng, S.; Li, Z. Detecting and Attributing Vegetation Changes on China’s Loess Plateau. Agric. For. Meteorol. 2017, 247, 260–270. [Google Scholar] [CrossRef]
- Shi, S.; Zhang, M.; Ru, K. Research on Agroforestry-Grassland Composite Model for Slope Terraces in Loess Hills Gully Area. Hanxi Waterre Sources 2000, 31–32. [Google Scholar]
- Li, W.; MacBean, N.; Ciais, P.; Defourny, P.; Lamarche, C.; Bontemps, S.; Houghton, R.A.; Peng, S. Gross and Net Land Cover Changes in the Main Plant Functional Types Derived from the Annual ESA CCI Land Cover Maps (1992–2015). Earth Syst. Sci. Data 2018, 10, 219–234. [Google Scholar] [CrossRef]


| Platform | Sensor | Dataset | Spatial Resolution (m) | Acquisition Year |
|---|---|---|---|---|
| Landsat 5 | TM | Landsat Collection1 Tier1 surface reflectance | 30 | 1986, 1990, 1995, 2000, 2005 |
| Landsat 7 | ETM+ | Landsat Collection1 Tier1 surface reflectance | 30 | 2010 |
| Landsat 8 | OLI | Landsat Collection1 Tier1 surface reflectance | 30 | 2015, 2020 |
| Code | Category | Meaning and Interpretation of Symbols for Various Land Use and cover Types | Remote Sensing Image |
|---|---|---|---|
| 1 | Forest | Forest with a canopy density exceeding 30%. Forest in the study area is primarily distributed in the southern part of the Yanhe River, in Shiwangchuan, on the Lvliang Mountain, and near the eastern boundary. There are also scattered distributions in the moist and well-watered Liangmao gullies. In false-color composite images, colors appear as deep red, bright red, and brownish-red, with hues or directions consistent with the terrain orientation. Moreover, there is a slight difference in hue between the shady and sunny slopes of mountains. In particular, the shrub forest at the edges of the forested areas in this study are classified as forest, and they have a lighter hue than the forested areas. | 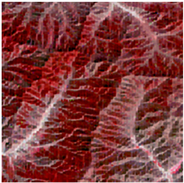 |
| 2 | Grassland | Various types of grassland with vegetation coverage above 20%. Mainly distributed in plains, on steeper slopes, and within valleys. Showing as brown-red, dark red, light red, etc. | 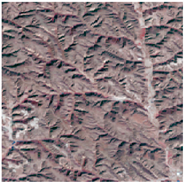 |
| 3 | Impervious Surface | The land surface formed by human construction activities, including various types of residential areas such as towns, industrial and mining areas, and transportation roads. It is primarily characterized by a grayish-white color, with clear boundaries, regular shapes, and rough textures. |  |
| 4 | Water | Including rivers, lakes, reservoirs, and ponds, located in open channels and ravines. Mainly dark blue and black, as well as blue and light blue, with a uniform and smooth texture. | 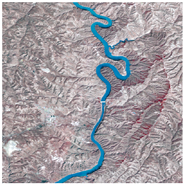 |
| 5 | Bare land | At least 60% of the area is low-vegetation land with less than 10% vegetation coverage, such as bare rocks and sandy land. Bare rocks are primarily located on both sides of the Yellow River Basin. They appear as black or brown in color, with irregular shapes. Sandy land is mainly located in the northwest of the study area, appearing as gray or brown in color. | 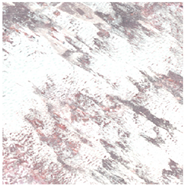 |
| 6 | Cropland | Land used for cultivating crops, including paddy fields, vegetable plots, pasturelands, and greenhouse land. It is distributed on slopes and flat terrain, appearing in shades of magenta, light green, and dark red. |  |
| 7 | Terraces and Orchards | A mixture of artificial vegetation grown for agricultural purposes with a slope greater than 3°, mainly in the loess table district, including terraces and orchards. They exhibit dark red, light green, grayish-white, and blue-yellow colors. |  |
| Classification Method | 2010 | |
|---|---|---|
| Overall Accuracy (%) | Kappa Coefficient (%) | |
| Classification and Regression Tree (CART) | 86.07 | 80.86 |
| Random Forest | 90.16 | 86.37 |
| Naive Bayes | 48.51 | 37.72 |
| Minimum Distance | 43.15 | 32.40 |
| k-Nearest Neighbor (KNN) | 86.48 | 81.36 |
| Feature Attribute | Feature Name | Feature Description |
|---|---|---|
| Spectral features | 6 Landsat spectral bands | Blue, green, red, near-infrared, shortwave infrared 1, and shortwave infrared 2 |
| Texture features (Blue Nir) | ASM | Angular Second Moment (ASM) expresses the texture fineness and the uniformity of gray level distribution. |
| Contrast | Contrast expresses the texture depth and image sharpness | |
| Corr | Correlation expresses the consistency of texture | |
| Idm | Inverse Difference Moment (IDM) expresses the homogeneity of texture | |
| Ent | Entropy expresses the non-uniformity or complexity of texture. | |
| Diss | Dissimilarity expresses the degree of difference in texture within an image | |
| Canny | Canny edge detection helps identify boundaries of different land cover types | |
| Vegetation index features | NDVI | |
| NDMI | ||
| NDBI | ||
| EVI | ||
| MNDWI | ||
| BSI | ||
| Terrain factor features | elevation | Elevation refers to the height of a location above a reference point. |
| slope | Slope refers to the steepness or incline of the terrain | |
| aspect | Aspect refers to the orientation or direction that a slope faces on the terrain surface | |
| TopDiversity | TopDiversity refers to the variability in terrain elevation within a specific area, indicating the degree of variation in elevation across the landscape |
| Year | OA/% | Kappa Coefficient/% | Forest | Grassland | Impervious Surface | Water | Bare Land | Cropland | Terraces and Orchards |
|---|---|---|---|---|---|---|---|---|---|
| 2005 | 86.08 | 76.14 | 0.91 | 0.91 | 0.8 | 0.91 | 0.91 | 0.68 | 0.69 |
| 2010 | 85.11 | 72.89 | 0.87 | 0.92 | 0.69 | 0.91 | 0.91 | 0.61 | 0.68 |
| 2015 | 89.32 | 79.82 | 0.95 | 0.95 | 0.84 | 0.8 | 0.83 | 0.67 | 0.65 |
| 2020 | 89.64 | 78.89 | 0.89 | 0.94 | 0.75 | 0.77 | 0.94 | 0.75 | 0.76 |
| 1986–2020 | Forest | Grassland | Impervious Surface | Water | Bare Land | Cropland | Terraces and Orchards |
|---|---|---|---|---|---|---|---|
| Forest | 9415.24 | 1321.23 | 2.67 | 1.76 | 0.051 | 35.98 | 13.68 |
| Grassland | 2631.84 | 50,413.96 | 626.47 | 57.51 | 388.46 | 2698.81 | 2263.94 |
| Impervious surface | 0.71 | 70.92 | 74.30 | 8.37 | 1.32 | 47.97 | 2.71 |
| Water | 1.49 | 51.25 | 56.72 | 341.57 | 2.65 | 92.33 | 10.85 |
| Bare land | 0.46 | 6750.35 | 275.97 | 23.90 | 1613.48 | 1641.38 | 262.50 |
| Cropland | 550.80 | 13,469.17 | 857.03 | 75.87 | 247.54 | 6951.09 | 1001.67 |
| Terraces and Orchards | 30.03 | 2167.56 | 11.49 | 1.54 | 3.73 | 275.91 | 1116.77 |
| Dataset | Time Range | Spatial Resolution | Data Source | Data Provider |
|---|---|---|---|---|
| HL-LUC | 1986-2020 (every 4 or 5 years) | 30 m | Landsat | This study |
| FROM-GLC | 2010, 2015, 2017 | 30 m | Landsat | [12] |
| GLC-FCS30 | 1985–2022 | 30 m | Landsat | [14] |
| ESA-CCI-LC | Yearly from 1992 to 2020 | 300 m | PROBA-V, Sentinel-3, and other multi-source data | [56] |
Disclaimer/Publisher’s Note: The statements, opinions and data contained in all publications are solely those of the individual author(s) and contributor(s) and not of MDPI and/or the editor(s). MDPI and/or the editor(s) disclaim responsibility for any injury to people or property resulting from any ideas, methods, instructions or products referred to in the content. |
© 2024 by the authors. Licensee MDPI, Basel, Switzerland. This article is an open access article distributed under the terms and conditions of the Creative Commons Attribution (CC BY) license (https://creativecommons.org/licenses/by/4.0/).
Share and Cite
Li, J.; Chen, Y.; Gu, Y.; Wang, M.; Zhao, Y. Remote Sensing Mapping and Analysis of Spatiotemporal Patterns of Land Use and Cover Change in the Helong Region of the Loess Plateau Region (1986–2020). Remote Sens. 2024, 16, 3738. https://doi.org/10.3390/rs16193738
Li J, Chen Y, Gu Y, Wang M, Zhao Y. Remote Sensing Mapping and Analysis of Spatiotemporal Patterns of Land Use and Cover Change in the Helong Region of the Loess Plateau Region (1986–2020). Remote Sensing. 2024; 16(19):3738. https://doi.org/10.3390/rs16193738
Chicago/Turabian StyleLi, Jingyu, Yangbo Chen, Yu Gu, Meiying Wang, and Yanjun Zhao. 2024. "Remote Sensing Mapping and Analysis of Spatiotemporal Patterns of Land Use and Cover Change in the Helong Region of the Loess Plateau Region (1986–2020)" Remote Sensing 16, no. 19: 3738. https://doi.org/10.3390/rs16193738