
Unrecorded Tundra Fires in Canada, 1986–2022
 , ,
, ,
Abstract
:1. Introduction
2. Materials and Methods
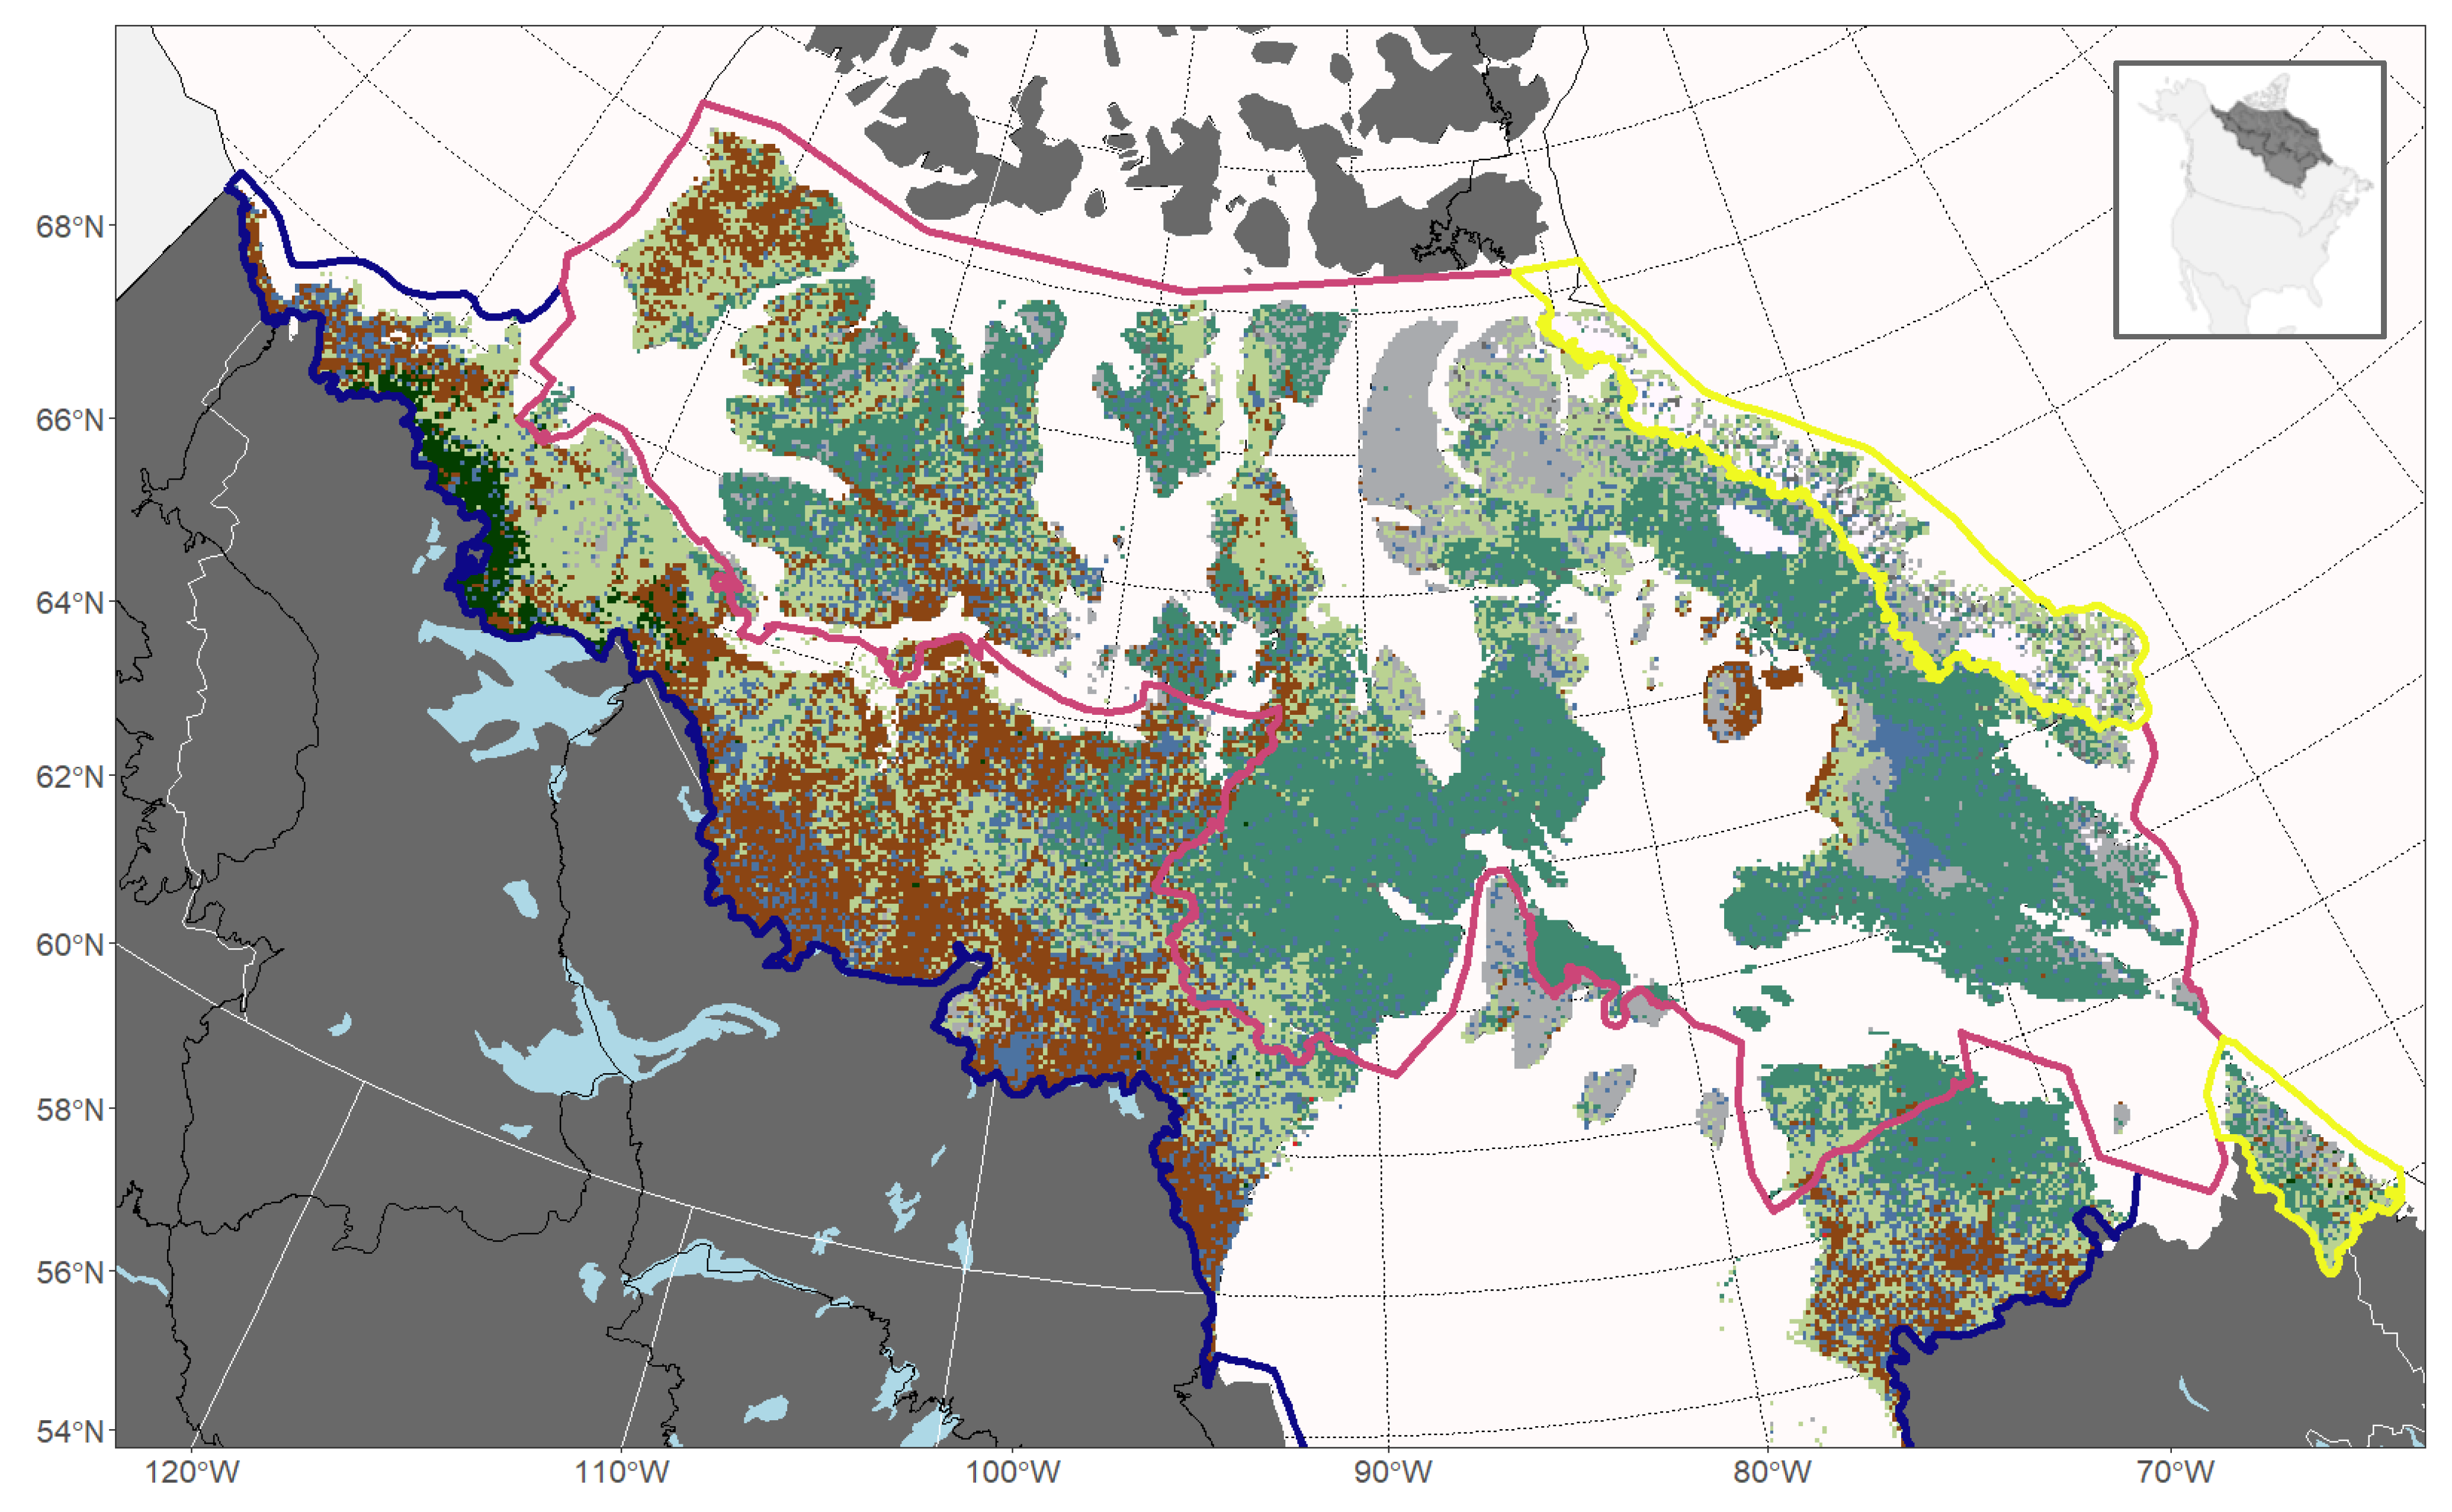
2.1. Study Area
2.2. Detecting Fires
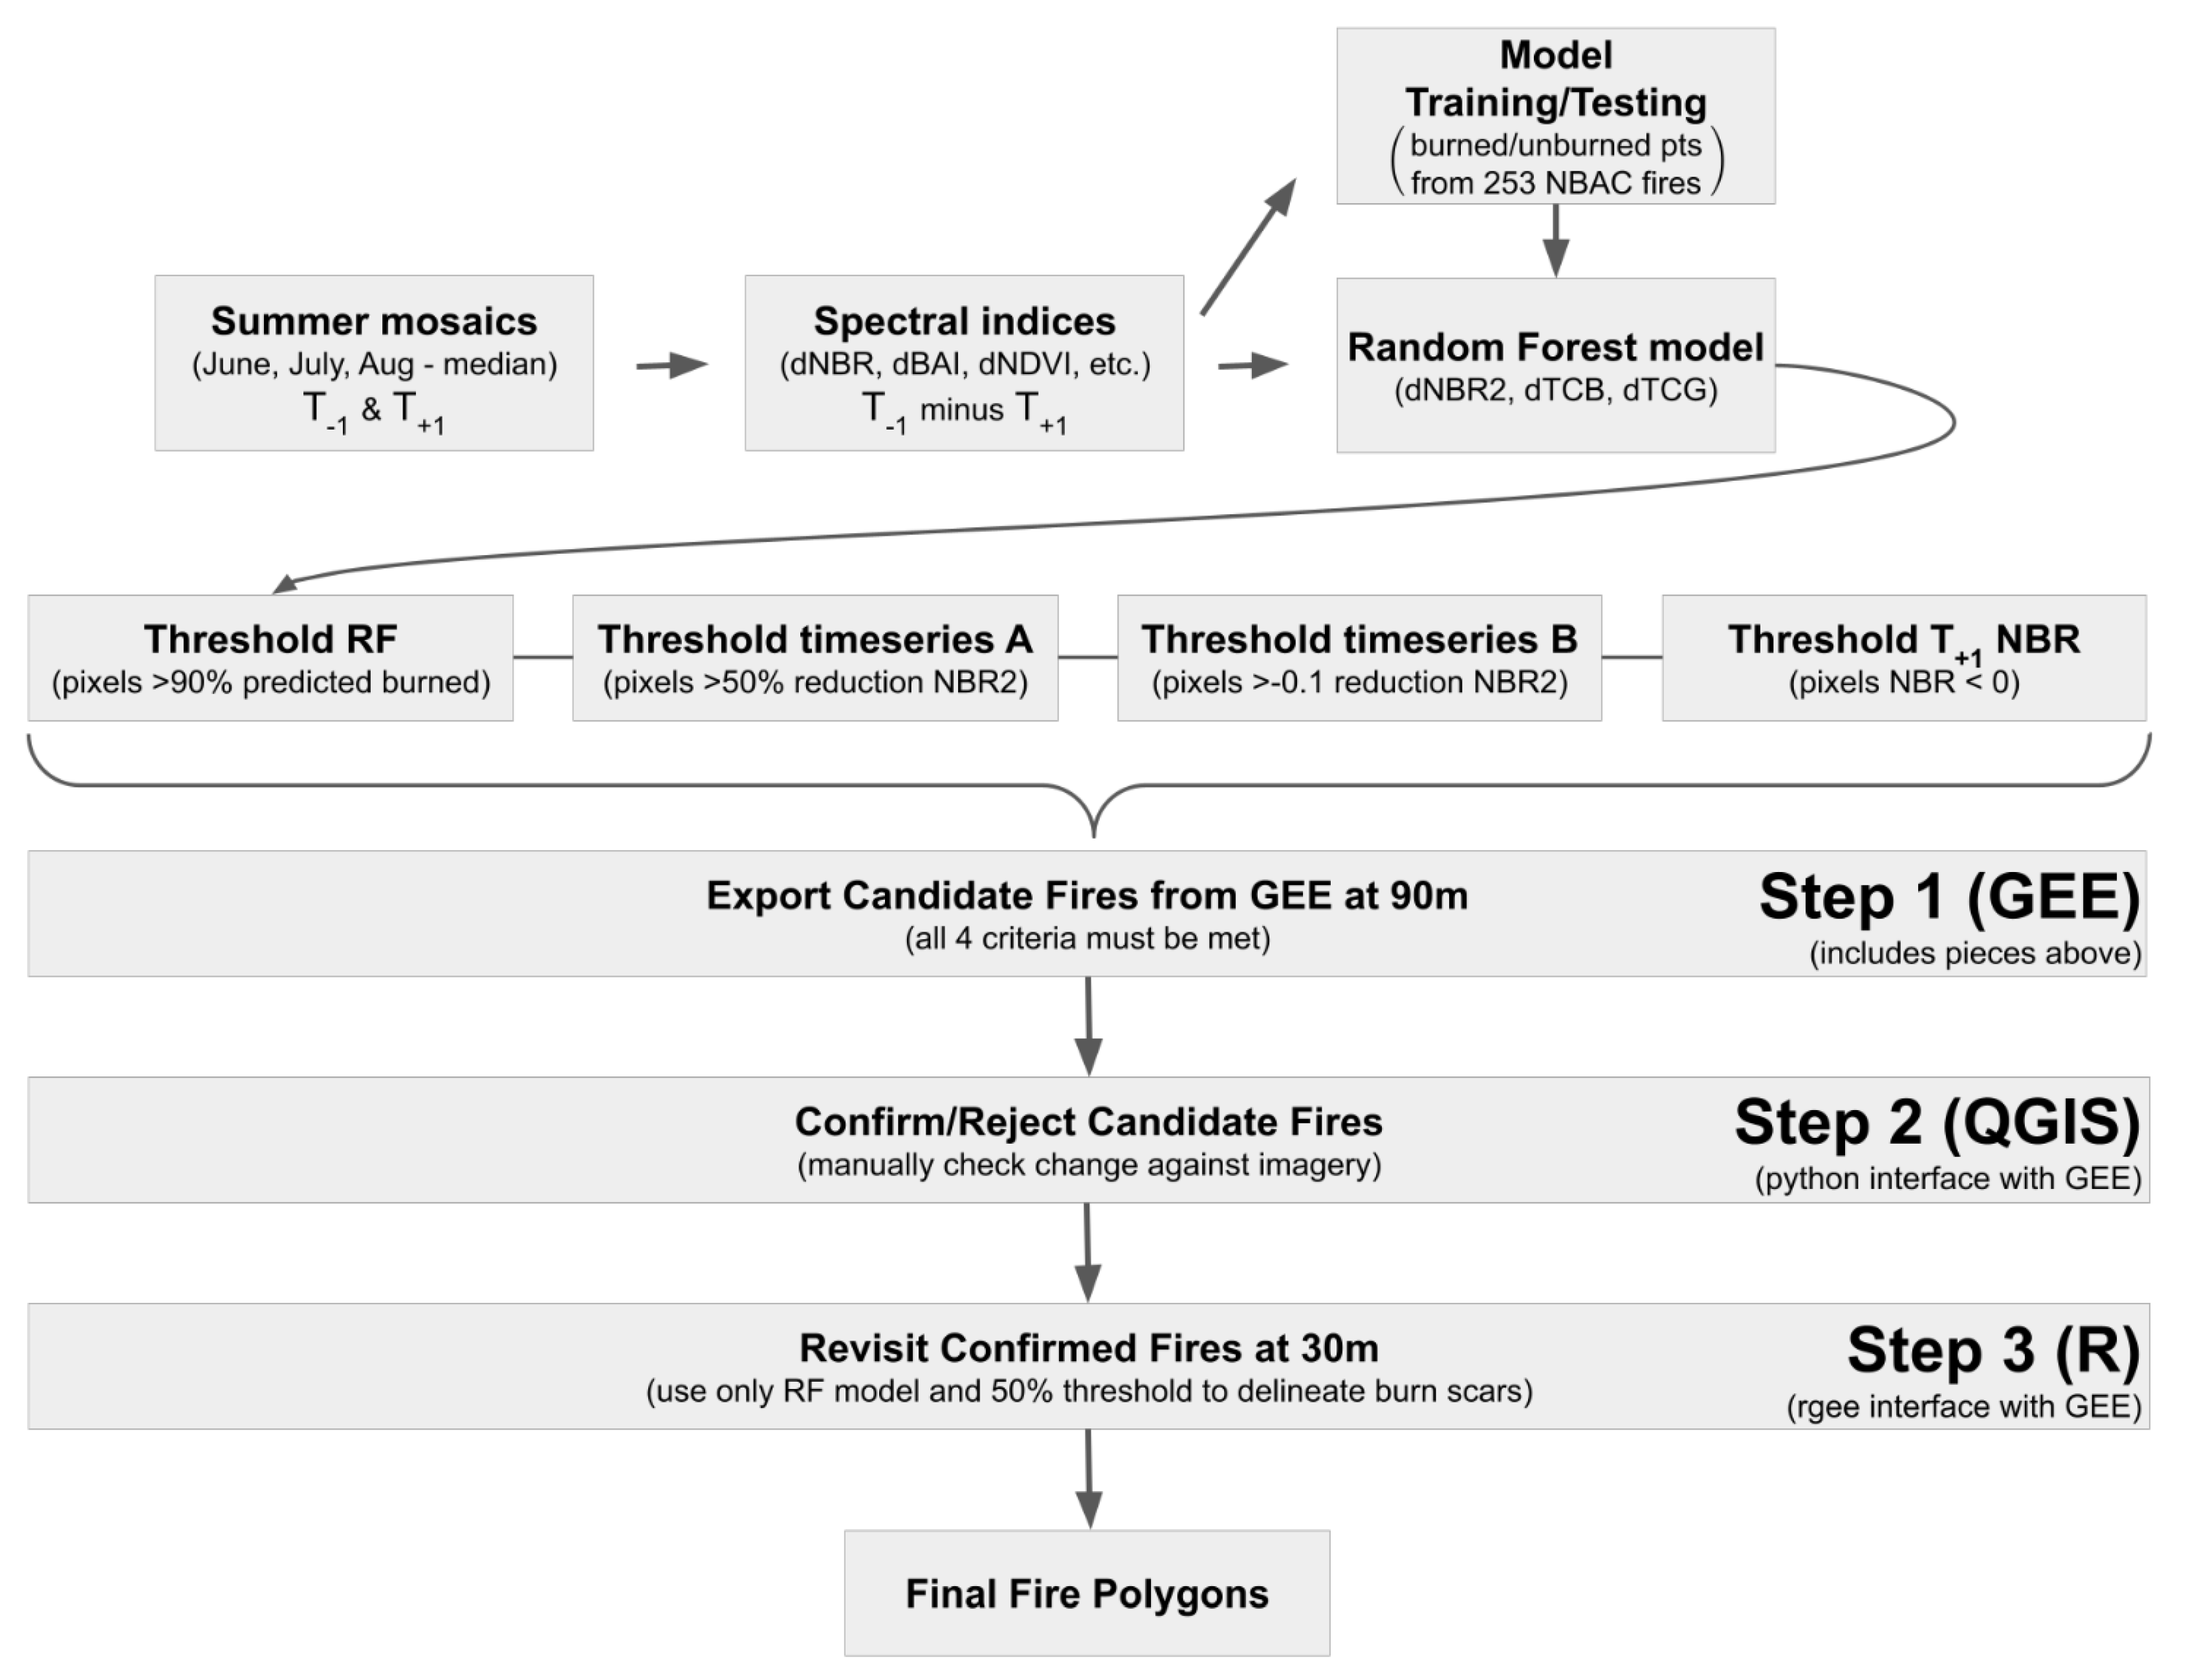
2.2.1. Datasets, Satellite Imagery, and Initial Modeling
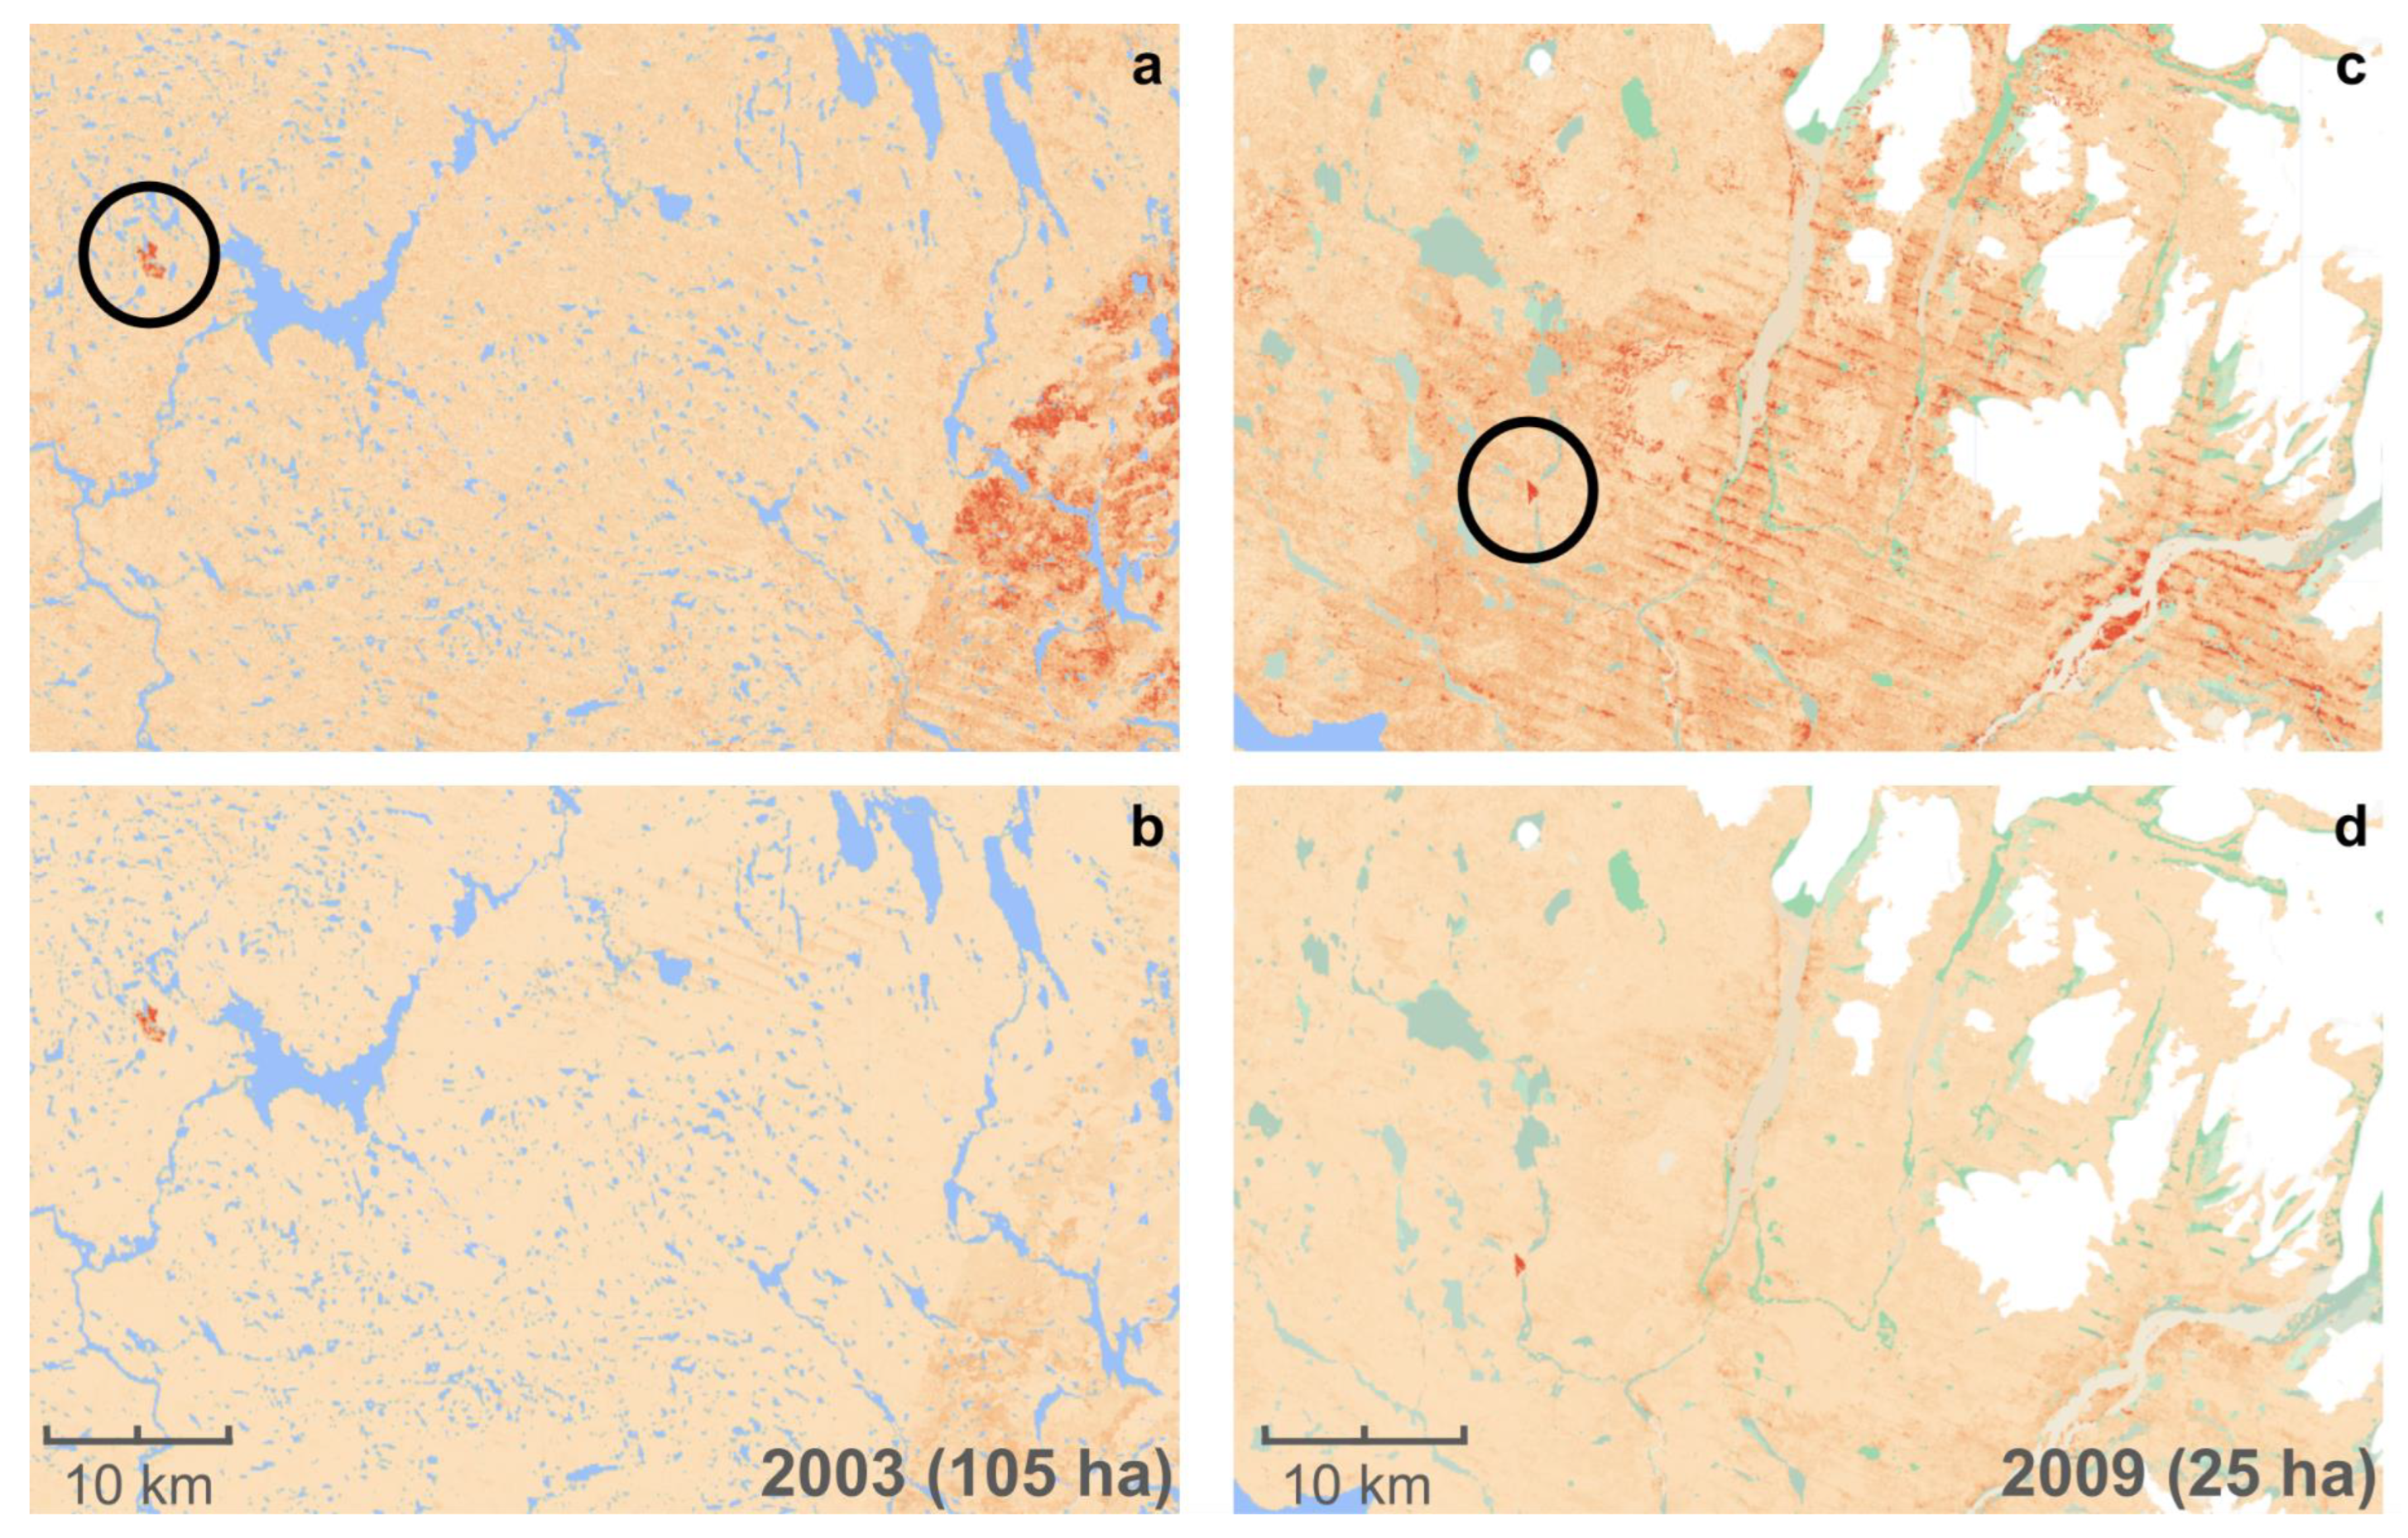
2.2.2. Fire Detection
2.3. Validation
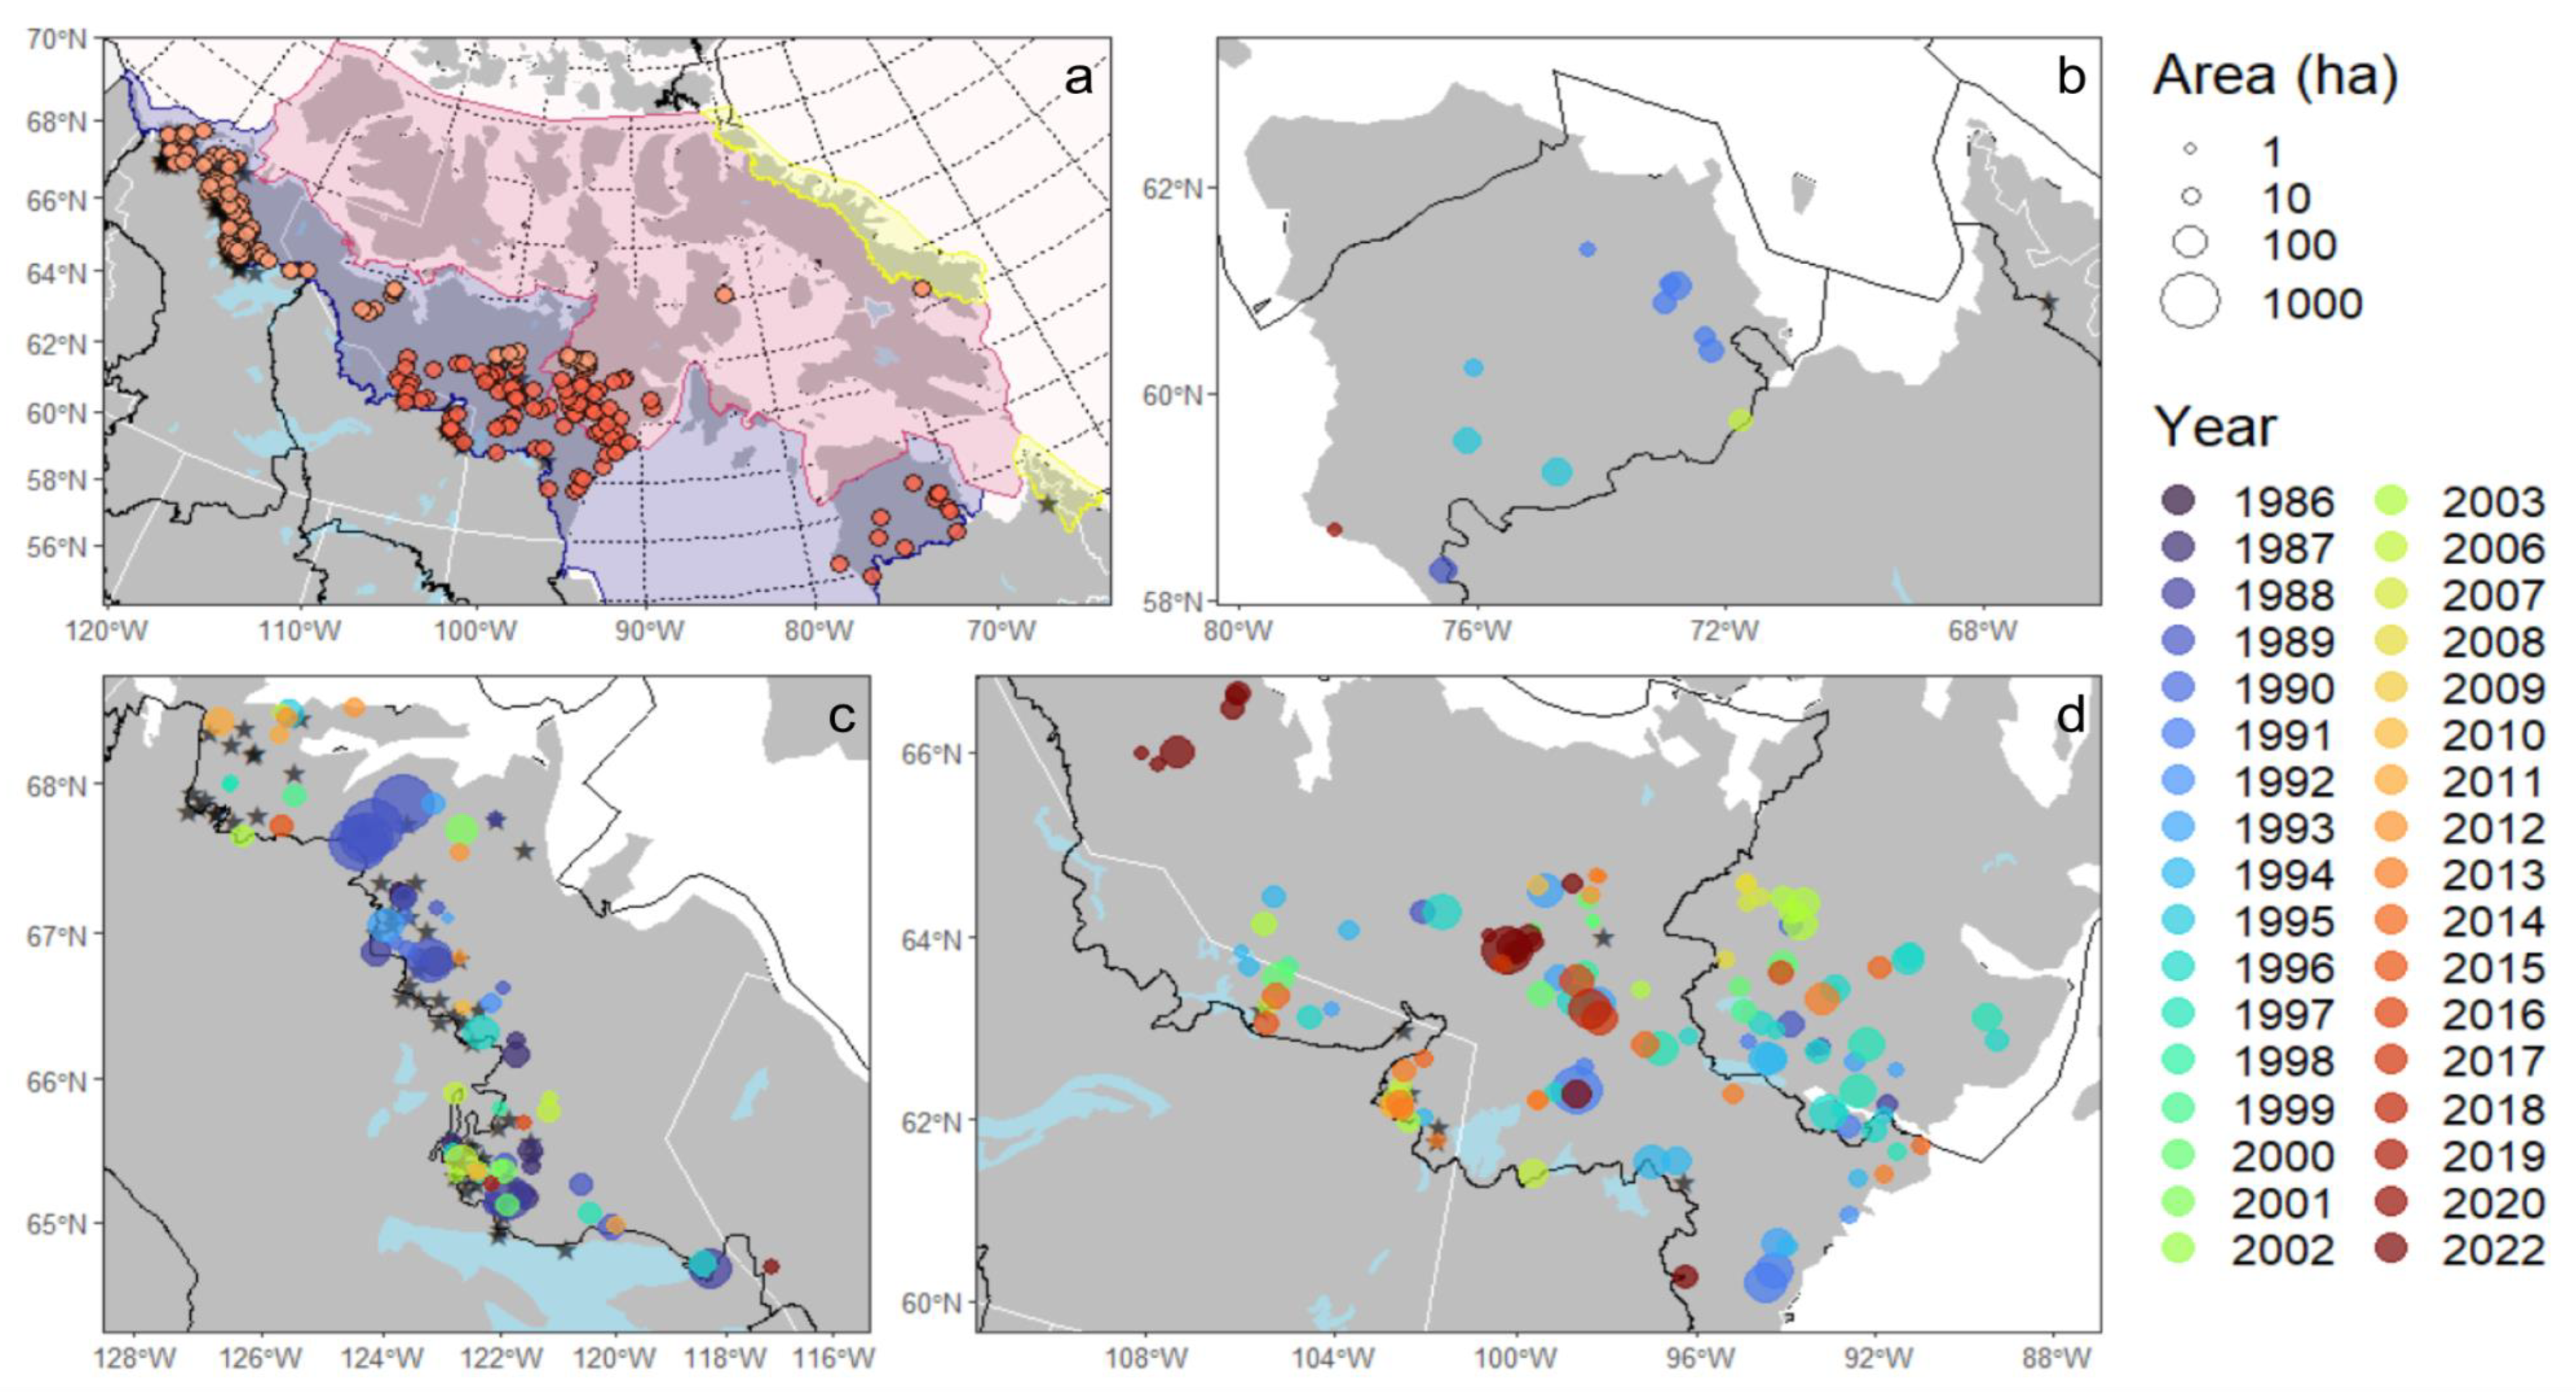
3. Results
4. Discussion
5. Limitations
6. Conclusions
Author Contributions
Funding
Data Availability Statement
Acknowledgments
Conflicts of Interest
Appendix A

| Band Name | Band Abbreviation | Spectral Range (nm) | Band Number Landsat-89 | Band Number Landsat-457 |
|---|---|---|---|---|
| Blue | B | 450–530 | B2 | B1 |
| Green | G | 510–600 | B3 | B2 |
| Red | R | 620–690 | B4 | B3 |
| NIR | N | 760–900 | B5 | B4 |
| SWIR 1 | S1 | 1550–1750 | B6 | B5 |
| SWIR 2 | S2 | 2080–2350 | B7 | B7 |
| Index Name | Equation |
|---|---|
| Bare Soil Index (BSI) | ((R + S1) − (N + B))/((R + S1) + (N + B)) |
| Burned Area Index (BAI) | 1/((0.1 − R)**2 + (0.06 − N)**2) |
| Burned Area Index Modified SWIR (BAIMs) | 1/((N − 0.05 * N)**2 + (S1 − 0.2 * S1)**2) |
| Char Soil Index (CSI) | N/S1 |
| Enhanced Vegetation Index (EVI) | 2.5 * ((N − R)/(N + (6 * R) − (7.5 * B) + 1)) |
| Mid-Infrared Burn Index (MIRBI) | ((10 * S2) − (9.8 * S1) + 2) |
| Modified Soil-Adjusted Vegetation Index (MSAVI) | (2 * N + 1 − sqrt((2 * N + 1) ** 2 − 8 * (N − R)))/2 |
| Normalized Burn Ratio (NBR) | (N − S2)/(N + S2) |
| Normalized Burn Ratio 2 (NBR2) | (S1 − S2)/(S1 + S2) |
| Normalized Difference Moisture Index (NDMI) | (N − S1)/(N + S1) |
| Normalized Difference Vegetation Index (NDVI) | (N − R)/(N + R) |
| Normalized Difference Water Index (NDWI) | (G − N)/(G + N) |
| Relativized Burn Ratio (RBR) | dNBR/(NBRprefire + 1.001) |
| Relativized delta Normalized Burn Ratio (RdNBR) | dNBR/|(NBRprefire)|**0.5 |
| Tasseled Cap Brightness (TCB) | 0.2043 * B + 0.4158 * G + 0.5524 * R + 0.5741 * N + 0.3124 * S1 + 0.2303 * S2 |
| Tasseled Cap Greenness (TCG) | −0.1603 * B − 0.2819 * G − 0.4934 * R + 0.7940 * N − 0.0002 * S1 − 0.1446 * S2 |
| Tasseled Cap Wetness (TCW) | 0.0315 * B + 0.2021 * G + 0.3102 * R + 0.1594 * N − 0.6806 * S1 − 0.6109 * S2 |
Appendix B
| Model Set | Variables |
|---|---|
| All variables | All indices from Table A2 |
| Reduced variable set | dBAI, dBAIMs, dBSI, dCSI, dMSAVI, dNBR, dNBR2, dNDVI, dNDWI, dTCB, RBR, RdNBR |
| 3 Best variables | dNBR, RBR, RdNBR |
| Tundra variables | dNBR2, dTCB, dTCG |
| Final hyperparameters | n_estimators = 100, min_samples_leaf = 1, max_samples = 0.7, max_leaf_nodes = 580, max_features = ‘sqrt’ |
| Model Set | Precision | Recall | Overall Accuracy |
|---|---|---|---|
| All variables, 800 trees | 0.94131 | 0.85997 | 0.89370 |
| All variables, 100 trees | 0.94095 | 0.85917 | 0.89309 |
| Reduced variable set, 800 trees | 0.93953 | 0.86082 | 0.89318 |
| Reduced variable set, 100 trees | 0.93820 | 0.86026 | 0.89217 |
| 3 Best variables, 800 trees | 0.90695 | 0.83494 | 0.86239 |
| 3 Best variables, 100 trees | 0.90565 | 0.83514 | 0.86176 |
| Tundra variables, 800 trees | 0.90068 | 0.83451 | 0.85865 |
| Tundra variables, 100 trees | 0.90001 | 0.83425 | 0.85769 |
References
- Descals, A.; Gaveau, D.L.A.; Verger, A.; Sheil, D.; Naito, D.; Peñuelas, J. Unprecedented Fire Activity above the Arctic Circle Linked to Rising Temperatures. Science 2022, 378, 532–537. [Google Scholar] [CrossRef] [PubMed]
- Walsh, J.E.; Ballinger, T.J.; Euskirchen, E.S.; Hanna, E.; Mård, J.; Overland, J.E.; Tangen, H.; Vihma, T. Extreme Weather and Climate Events in Northern Areas: A Review. Earth-Sci. Rev. 2020, 209, 103324. [Google Scholar] [CrossRef]
- McCarty, J.L.; Aalto, J.; Paunu, V.-V.; Arnold, S.R.; Eckhardt, S.; Klimont, Z.; Fain, J.J.; Evangeliou, N.; Venäläinen, A.; Tchebakova, N.M.; et al. Reviews and Syntheses: Arctic Fire Regimes and Emissions in the 21st Century. Biogeosciences 2021, 18, 5053–5083. [Google Scholar] [CrossRef]
- Berner, L.T.; Massey, R.; Jantz, P.; Forbes, B.C.; Macias-Fauria, M.; Myers-Smith, I.; Kumpula, T.; Gauthier, G.; Andreu-Hayles, L.; Gaglioti, B.V.; et al. Summer Warming Explains Widespread but Not Uniform Greening in the Arctic Tundra Biome. Nat. Commun. 2020, 11, 4621. [Google Scholar] [CrossRef] [PubMed]
- Leipe, S.C.; Carey, S.K. Rapid Shrub Expansion in a Subarctic Mountain Basin Revealed by Repeat Airborne LiDAR. Environ. Res. Commun. 2021, 3, 071001. [Google Scholar] [CrossRef]
- York, A.; Bhatt, U.S.; Gargulinski, E.; Grabinski, Z.; Jain, P.; Soja, A. Wildland Fire in High Northern Latitudes; Arctic Report Card, 2020, Thoman, R.L., Richter-Menge, J., Druckenmiller, M.L., Eds.; NOAA: Silver Spring, MD, USA, 2020. [Google Scholar]
- Kasischke, E.S.; Verbyla, D.L.; Rupp, T.S.; McGuire, A.D.; Murphy, K.A.; Jandt, R.; Barnes, J.L.; Hoy, E.E.; Duffy, P.A.; Calef, M.; et al. Alaska’s Changing Fire Regime—Implications for the Vulnerability of Its Boreal forests. Can. J. For. Res. 2010, 40, 1313–1324. [Google Scholar] [CrossRef]
- Hanes, C.C.; Wang, X.; Jain, P.; Parisien, M.-A.; Little, J.M.; Flannigan, M.D. Fire-Regime Changes in Canada over the Last Half Century. Can. J. For. Res. 2019, 49, 256–269. [Google Scholar] [CrossRef]
- Jones, M.W.; Abatzoglou, J.T.; Veraverbeke, S.; Andela, N.; Lasslop, G.; Forkel, M.; Smith, A.J.P.; Burton, C.; Betts, R.A.; van der Werf, G.R.; et al. Global and Regional Trends and Drivers of Fire Under Climate Change. Rev. Geophys. 2022, 60, e2020RG000726. [Google Scholar] [CrossRef]
- Tyukavina, A.; Potapov, P.; Hansen, M.C.; Pickens, A.H.; Stehman, S.V.; Turubanova, S.; Parker, D.; Zalles, V.; Lima, A.; Kommareddy, I.; et al. Global Trends of Forest Loss Due to Fire From 2001 to 2019. Front. Remote Sens. 2022, 3, 825190. [Google Scholar] [CrossRef]
- Wooster, M.J.; Roberts, G.J.; Giglio, L.; Roy, D.P.; Freeborn, P.H.; Boschetti, L.; Justice, C.; Ichoku, C.; Schroeder, W.; Davies, D.; et al. Satellite Remote Sensing of Active Fires: History and Current Status, Applications and Future Requirements. Remote Sens. Environ. 2021, 267, 112694. [Google Scholar] [CrossRef]
- Talucci, A.C.; Loranty, M.M.; Alexander, H.D. Siberian Taiga and Tundra Fire Regimes from 2001–2020. Environ. Res. Lett. 2022, 17, 025001. [Google Scholar] [CrossRef]
- Skakun, R.; Castilla, G.; Metsaranta, J.; Whitman, E.; Rodrigue, S.; Little, J.; Groenewegen, K.; Coyle, M. Extending the National Burned Area Composite Time Series of Wildfires in Canada. Remote Sens. 2022, 14, 3050. [Google Scholar] [CrossRef]
- Hall, R.J.; Skakun, R.S.; Metsaranta, J.M.; Landry, R.; Fraser, R.H.; Raymond, D.; Gartrell, M.; Decker, V.; Little, J.; Hall, R.J.; et al. Generating Annual Estimates of Forest Fire Disturbance in Canada: The National Burned Area Composite. Int. J. Wildland Fire 2020, 29, 878–891. [Google Scholar] [CrossRef]
- Kurz, W.A.; Apps, M.J. Developing Canada’s National Forest Carbon Monitoring, Accounting and Reporting System to Meet the Reporting Requirements of the Kyoto Protocol. Mitig. Adapt. Strateg. Glob. Chang. 2006, 11, 33–43. [Google Scholar] [CrossRef]
- Metsaranta, J.M.; Shaw, C.H.; Kurz, W.A.; Boisvenue, C.; Morken, S. Uncertainty of Inventory-Based Estimates of the Carbon Dynamics of Canada’s Managed Forest (1990–2014). Can. J. For. Res. 2017, 47, 1082–1094. [Google Scholar] [CrossRef]
- Tymstra, C.; Stocks, B.J.; Cai, X.; Flannigan, M.D. Wildfire Management in Canada: Review, Challenges and Opportunities. Prog. Disaster Sci. 2020, 5, 100045. [Google Scholar] [CrossRef]
- Hermosilla, T.; Wulder, M.A.; White, J.C.; Coops, N.C.; Hobart, G.W.; Campbell, L.B. Mass Data Processing of Time Series Landsat Imagery: Pixels to Data Products for Forest Monitoring. Int. J. Digit. Earth 2016, 9, 1035–1054. [Google Scholar] [CrossRef]
- Nelson, P.R.; Maguire, A.J.; Pierrat, Z.; Orcutt, E.L.; Yang, D.; Serbin, S.; Frost, G.V.; Macander, M.J.; Magney, T.S.; Thompson, D.R.; et al. Remote Sensing of Tundra Ecosystems Using High Spectral Resolution Reflectance: Opportunities and Challenges. J. Geophys. Res. Biogeosci. 2022, 127, e2021JG006697. [Google Scholar] [CrossRef]
- Canadian Interagency Forest Fire Centre (CIFFC). Available online: https://ciffc.ca/ (accessed on 20 October 2023).
- Ecological Stratification Working Group. A National Ecological Framework for Canada; Centre for Land and Biological Resources Research: Hull, QC, Canada, 1996. [Google Scholar]
- Walker, D.A.; Raynolds, M.K.; Daniëls, F.J.A.; Einarsson, E.; Elvebakk, A.; Gould, W.A.; Katenin, A.E.; Kholod, S.S.; Markon, C.J.; Melnikov, E.S.; et al. The Circumpolar Arctic Vegetation Map. J. Veg. Sci. 2005, 16, 267–282. [Google Scholar] [CrossRef]
- Natural Resources Canada 2020 Land Cover of Canada. Available online: https://open.canada.ca/data/en/dataset/ee1580ab-a23d-4f86-a09b-79763677eb47 (accessed on 16 December 2023).
- Gorelick, N.; Hancher, M.; Dixon, M.; Ilyushchenko, S.; Thau, D.; Moore, R. Google Earth Engine: Planetary-Scale Geospatial Analysis for Everyone. Remote Sens. Environ. 2017, 202, 18–27. [Google Scholar] [CrossRef]
- Pekel, J.-F.; Cottam, A.; Gorelick, N.; Belward, A.S. High-Resolution Mapping of Global Surface Water and Its Long-Term Changes. Nature 2016, 540, 418–422. [Google Scholar] [CrossRef] [PubMed]
- Bisong, E. Google Colaboratory. In Building Machine Learning and Deep Learning Models on Google Cloud Platform: A Comprehensive Guide for Beginners; Bisong, E., Ed.; Apress: Berkeley, CA, USA, 2019; pp. 59–64. ISBN 978-1-4842-4470-8. [Google Scholar]
- Pedregosa, F.; Varoquaux, G.; Gramfort, A.; Michel, V.; Thirion, B.; Grisel, O.; Blondel, M.; Prettenhofer, P.; Weiss, R.; Dubourg, V. Scikit-Learn: Machine Learning in Python. J. Mach. Learn. Res. 2011, 12, 2825–2830. [Google Scholar]
- R Core Team. R: A Language and Environment for Statistical Computing; R Foundation for Statistical Computing: Vienna, Austria, 2022. [Google Scholar]
- Aybar, C.; Qiusheng, W.; Bautista, L.; Yali, R.; Barja, A. rgee: An R package for interacting with Google Earth Engine. J. Open Source Softw. 2020, 5, 2272. [Google Scholar] [CrossRef]
- Hermosilla, T.; Wulder, M.A.; White, J.C.; Coops, N.C.; Hobart, G.W. An Integrated Landsat Time Series Protocol for Change Detection and Generation of Annual Gap-Free Surface Reflectance Composites. Remote Sens. Environ. 2015, 158, 220–234. [Google Scholar] [CrossRef]
- Healey, S.; Cohen, W.; Zhiqiang, Y.; Krankina, O. Comparison of Tasseled Cap-Based Landsat Data Structures for Use in Forest Disturbance Detection. Remote Sens. Environ. 2005, 97, 301–310. [Google Scholar] [CrossRef]
- Fraser, R.H.; Olthof, I.; Kokelj, S.V.; Lantz, T.C.; Lacelle, D.; Brooker, A.; Wolfe, S.; Schwarz, S. Detecting Landscape Changes in High Latitude Environments Using Landsat Trend Analysis: 1. Visualization. Remote Sens. 2014, 6, 11533–11557. [Google Scholar] [CrossRef]
- Loboda, T.V.; French, N.H.F.; Hight-Harf, C.; Jenkins, L.; Miller, M.E. Mapping Fire Extent and Burn Severity in Alaskan Tussock Tundra: An Analysis of the Spectral Response of Tundra Vegetation to Wildland Fire. Remote Sens. Environ. 2013, 134, 194–209. [Google Scholar] [CrossRef]
- Trigg, S.; Flasse, S. An Evaluation of Different Bi-Spectral Spaces for Discriminating Burned Shrub-Savannah. Int. J. Remote Sens. 2001, 22, 2641–2647. [Google Scholar] [CrossRef]
- French, N.H.F.; Graham, J.; Whitman, E.; Bourgeau-Chavez, L.L. Quantifying Surface Severity of the 2014 and 2015 Fires in the Great Slave Lake Area of Canada. Int. J. Wildland Fire 2020, 29, 892–906. [Google Scholar] [CrossRef]
- Marcos, B.; Gonçalves, J.; Alcaraz-Segura, D.; Cunha, M.; Honrado, J.P. Assessing the Resilience of Ecosystem Functioning to Wildfires Using Satellite-Derived Metrics of Post-Fire Trajectories. Remote Sens. Environ. 2023, 286, 113441. [Google Scholar] [CrossRef]
- Olthof, I.; Fraser, R.H. Detecting Landscape Changes in High Latitude Environments Using Landsat Trend Analysis: 2. Classification. Remote Sens. 2014, 6, 11558–11578. [Google Scholar] [CrossRef]
- Miller, E.A.; Jones, B.M.; Baughman, C.A.; Jandt, R.R.; Jenkins, J.L.; Yokel, D.A. Unrecorded Tundra Fires of the Arctic Slope, Alaska USA. Fire 2023, 6, 101. [Google Scholar] [CrossRef]
- Roteta, E.; Bastarrika, A.; Padilla, M.; Storm, T.; Chuvieco, E. Development of a Sentinel-2 Burned Area Algorithm: Generation of a Small Fire Database for Sub-Saharan Africa. Remote Sens. Environ. 2019, 222, 1–17. [Google Scholar] [CrossRef]
- Zhang, Z.; Wang, L.; Xue, N.; Du, Z. Spatiotemporal Analysis of Active Fires in the Arctic Region during 2001–2019 and a Fire Risk Assessment Model. Fire 2021, 4, 57. [Google Scholar] [CrossRef]
- Lizundia-Loiola, J.; Franquesa, M.; Khairoun, A.; Chuvieco, E. Global Burned Area Mapping from Sentinel-3 Synergy and VIIRS Active Fires. Remote Sens. Environ. 2022, 282, 113298. [Google Scholar] [CrossRef]
- Ramo, R.; Roteta, E.; Bistinas, I.; van Wees, D.; Bastarrika, A.; Chuvieco, E.; van der Werf, G.R. African Burned Area and Fire Carbon Emissions Are Strongly Impacted by Small Fires Undetected by Coarse Resolution Satellite Data. Proc. Natl. Acad. Sci. USA 2021, 118, e2011160118. [Google Scholar] [CrossRef]
- Coogan, S.C.P.; Daniels, L.D.; Boychuk, D.; Burton, P.J.; Flannigan, M.D.; Gauthier, S.; Kafka, V.; Park, J.S.; Wotton, B.M. Fifty Years of Wildland Fire Science in Canada. Can. J. For. Res. 2021, 51, 283–302. [Google Scholar] [CrossRef]
- Stocks, B.J.; Mason, J.A.; Todd, J.B.; Bosch, E.M.; Wotton, B.M.; Amiro, B.D.; Flannigan, M.D.; Hirsch, K.G.; Logan, K.A.; Martell, D.L.; et al. Large Forest Fires in Canada, 1959–1997. J. Geophys. Res. Atmos. 2002, 107, FFR 5-1–FFR 5-12. [Google Scholar] [CrossRef]
- Waigl, C.F.; Stuefer, M.; Prakash, A.; Ichoku, C. Detecting High and Low-Intensity Fires in Alaska Using VIIRS I-Band Data: An Improved Operational Approach for High Latitudes. Remote Sens. Environ. 2017, 199, 389–400. [Google Scholar] [CrossRef]
- Fu, Y.; Li, R.; Wang, X.; Bergeron, Y.; Valeria, O.; Chavardès, R.D.; Wang, Y.; Hu, J. Fire Detection and Fire Radiative Power in Forests and Low-Biomass Lands in Northeast Asia: MODIS versus VIIRS Fire Products. Remote Sens. 2020, 12, 2870. [Google Scholar] [CrossRef]
- Ju, J.; Roy, D.P. The Availability of Cloud-Free Landsat ETM+ Data over the Conterminous United States and Globally. Remote Sens. Environ. 2008, 112, 1196–1211. [Google Scholar] [CrossRef]
- Comiso, J.C.; Hall, D.K. Climate Trends in the Arctic as Observed from Space. WIREs Clim. Chang. 2014, 5, 389–409. [Google Scholar] [CrossRef] [PubMed]
- Li, F.; Zhang, X.; Kondragunta, S.; Csiszar, I. Comparison of Fire Radiative Power Estimates From VIIRS and MODIS Observations. J. Geophys. Res. Atmos. 2018, 123, 4545–4563. [Google Scholar] [CrossRef]
- Giglio, L.; Descloitres, J.; Justice, C.O.; Kaufman, Y.J. An Enhanced Contextual Fire Detection Algorithm for MODIS. Remote Sens. Environ. 2003, 87, 273–282. [Google Scholar] [CrossRef]
- Giglio, L.; Boschetti, L.; Roy, D.P.; Humber, M.L.; Justice, C.O. The Collection 6 MODIS Burned Area Mapping Algorithm and Product. Remote Sens. Environ. 2018, 217, 72–85. [Google Scholar] [CrossRef] [PubMed]
- NASA-FIRMS. Available online: https://firms.modaps.eosdis.nasa.gov/map/ (accessed on 23 November 2023).
- Environment and Climate Change Canada Lightning Density Data. Available online: https://open.canada.ca/data/en/dataset/75dfb8cb-9efc-4c15-bcb5-7562f89517ce (accessed on 18 December 2023).
- Qu, Y.; Miralles, D.G.; Veraverbeke, S.; Vereecken, H.; Montzka, C. Wildfire Precursors Show Complementary Predictability in Different Timescales. Nat. Commun. 2023, 14, 6829. [Google Scholar] [CrossRef] [PubMed]
- Rantanen, M.; Karpechko, A.Y.; Lipponen, A.; Nordling, K.; Hyvärinen, O.; Ruosteenoja, K.; Vihma, T.; Laaksonen, A. The Arctic Has Warmed Nearly Four Times Faster than the Globe since 1979. Commun. Earth Environ. 2022, 3, 168. [Google Scholar] [CrossRef]
- Myers-Smith, I.H.; Kerby, J.T.; Phoenix, G.K.; Bjerke, J.W.; Epstein, H.E.; Assmann, J.J.; John, C.; Andreu-Hayles, L.; Angers-Blondin, S.; Beck, P.S.A.; et al. Complexity Revealed in the Greening of the Arctic. Nat. Clim. Chang. 2020, 10, 106–117. [Google Scholar] [CrossRef]
- Jain, P.; Castellanos-Acuna, D.; Coogan, S.C.P.; Abatzoglou, J.T.; Flannigan, M.D. Observed Increases in Extreme Fire Weather Driven by Atmospheric Humidity and Temperature. Nat. Clim. Chang. 2022, 12, 63–70. [Google Scholar] [CrossRef]
- Young, A.M.; Higuera, P.E.; Abatzoglou, J.T.; Duffy, P.A.; Hu, F.S. Consequences of Climatic Thresholds for Projecting Fire Activity and Ecological Change. Glob. Ecol. Biogeogr. 2019, 28, 521–532. [Google Scholar] [CrossRef]
- Mack, M.C.; Bret-Harte, M.S.; Hollingsworth, T.N.; Jandt, R.R.; Schuur, E.A.G.; Shaver, G.R.; Verbyla, D.L. Carbon Loss from an Unprecedented Arctic Tundra Wildfire. Nature 2011, 475, 489–492. [Google Scholar] [CrossRef] [PubMed]
- Stow, D.A.; Hope, A.; McGuire, D.; Verbyla, D.; Gamon, J.; Huemmrich, F.; Houston, S.; Racine, C.; Sturm, M.; Tape, K.; et al. Remote Sensing of Vegetation and Land-Cover Change in Arctic Tundra Ecosystems. Remote Sens. Environ. 2004, 89, 281–308. [Google Scholar] [CrossRef]
- Chen, Y.; Romps, D.M.; Seeley, J.T.; Veraverbeke, S.; Riley, W.J.; Mekonnen, Z.A.; Randerson, J.T. Future Increases in Arctic Lightning and Fire Risk for Permafrost Carbon. Nat. Clim. Chang. 2021, 11, 404–410. [Google Scholar] [CrossRef]
- Bintanja, R.; van der Wiel, K.; van der Linden, E.C.; Reusen, J.; Bogerd, L.; Krikken, F.; Selten, F.M. Strong Future Increases in Arctic Precipitation Variability Linked to Poleward Moisture Transport. Sci. Adv. 2020, 6, eaax6869. [Google Scholar] [CrossRef]
- Yoseph, E.; Hoy, E.; Elder, C.D.; Ludwig, S.M.; Thompson, D.R.; Miller, C.E. Tundra Fire Increases the Likelihood of Methane Hotspot Formation in the Yukon–Kuskokwim Delta, Alaska, USA. Environ. Res. Lett. 2023, 18, 104042. [Google Scholar] [CrossRef]
- DeVries, B.; Pratihast, A.K.; Verbesselt, J.; Kooistra, L.; Herold, M. Characterizing Forest Change Using Community-Based Monitoring Data and Landsat Time Series. PLoS ONE 2016, 11, e0147121. [Google Scholar] [CrossRef]


| Hotspots Present | NBAC Fire | New Fire |
|---|---|---|
| Yes | 23 | 29 |
| No | 15 | 66 |
| Detected by | Count | Sizes (ha) |
|---|---|---|
| Both | 25 | [3.4, 21.4, 25.2, 25.8, 32.0] |
| MODIS only | 7 | [1.9 a, 8.6 a, 12.4, 15.0, 26.8 t, 38.8 t, 66.3] |
| VIIRS only | 2 | [10.1, 12.3] |
| Neither | 46 | [45.1, 102.5, 109.2, 130.3, 131.5] |
Disclaimer/Publisher’s Note: The statements, opinions and data contained in all publications are solely those of the individual author(s) and contributor(s) and not of MDPI and/or the editor(s). MDPI and/or the editor(s) disclaim responsibility for any injury to people or property resulting from any ideas, methods, instructions or products referred to in the content. |
© 2024 by the authors. Licensee MDPI, Basel, Switzerland. This article is an open access article distributed under the terms and conditions of the Creative Commons Attribution (CC BY) license (https://creativecommons.org/licenses/by/4.0/).
Share and Cite
Hethcoat, M.G.; Jain, P.; Parisien, M.-A.; Skakun, R.; Rogic, L.; Whitman, E. Unrecorded Tundra Fires in Canada, 1986–2022. Remote Sens. 2024, 16, 230. https://doi.org/10.3390/rs16020230
Hethcoat MG, Jain P, Parisien M-A, Skakun R, Rogic L, Whitman E. Unrecorded Tundra Fires in Canada, 1986–2022. Remote Sensing. 2024; 16(2):230. https://doi.org/10.3390/rs16020230
Chicago/Turabian StyleHethcoat, Matthew G., Piyush Jain, Marc-André Parisien, Rob Skakun, Luka Rogic, and Ellen Whitman. 2024. "Unrecorded Tundra Fires in Canada, 1986–2022" Remote Sensing 16, no. 2: 230. https://doi.org/10.3390/rs16020230
APA StyleHethcoat, M. G., Jain, P., Parisien, M.-A., Skakun, R., Rogic, L., & Whitman, E. (2024). Unrecorded Tundra Fires in Canada, 1986–2022. Remote Sensing, 16(2), 230. https://doi.org/10.3390/rs16020230