Article

Monitoring Suspended Sediment Transport in the Lower Yellow River using Landsat Observations

1
School of Transportation and Geomatics Engineering, Shenyang Jianzhu University, Shenyang 110168, China
2
Key Laboratory of Watershed Geographic Sciences, Nanjing Institute of Geography and Limnology, Chinese Academy of Sciences, Nanjing 210008, China
3
College of Urban and Environmental Sciences, Northwest University, Xi’an 710127, China
4
State Key Laboratory of Satellite Ocean Environment Dynamics, Second Institute of Oceanography, Ministry of Natural Resources, Hangzhou 310012, China
*
Author to whom correspondence should be addressed.
These authors contributed equally to this work.
These authors also contributed equally to this work.
Remote Sens. 2024, 16(2), 229; https://doi.org/10.3390/rs16020229
Submission received: 30 October 2023 / Revised: 22 December 2023 / Accepted: 4 January 2024 / Published: 6 January 2024

Abstract

:
The spatiotemporal variations in suspended sediment concentration (SSC) in the lower reaches of the Yellow River exhibit significant variability and are influenced by reservoir operations. Understanding the spatiotemporal distribution characteristics of SSC in water holds crucial implications for environmental protection and reservoir operation management. Based on daily-scale SSC monitoring data from four hydrological stations in the lower Yellow River, this study established an SSC remote sensing model applicable to Landsat series satellite data. The independent variable of the model, Rrs(NIR)/(Rrs(G) + Rrs(R) + Rrs(SWIR)), demonstrated sensitivity to water bodies with different SSC values. Distinctive spatiotemporal characteristics in sediment transport were observed across the lower Yellow River. Spatially, the SSC values in the Sanmenxia and Xiaolangdi reservoirs were notably lower than those in other river sections, averaging 1008.42 ± 602.83 mg/L and 1177.89 ± 627.95 mg/L, respectively. Over time, the majority of the river sections (96%) exhibited decreasing trends in SSC during 1984–2022, particularly in the downstream Xiaolangdi reservoir, with average SSC values of 4265.58 ± 1101.77 mg/L in the 1980s and 1840.80 ± 2255.15 mg/L in the 2020s. Seasonal variations in SSC were prominent, with higher summer concentrations, averaging 5536.43 ± 2188.77 mg/L (2020s summer) and 814.11 ± 158.27 mg/L (2020s winter). Reductions in SSC during 1984–2022 primarily occurred in summer, weakening its seasonal variability in the lower Yellow River. Water discharge emerged as a critical factor influencing suspended sediment transport, with SSC increasing in high-water-flow months. Following the construction of the Xiaolangdi reservoir, the relationship between SSC and water discharge at different stations underwent notable alterations. This study enhances our understanding of the spatiotemporal dynamics of suspended sediment transport in the lower Yellow River, providing valuable insights for utilizing long-term Landsat series data in the dynamic monitoring of river sediment transport.

1. Introduction

In the global geochemical cycle, rivers serve as primary connectors between terrestrial and marine ecosystems, representing the primary pathway for transporting terrestrial materials to the oceans [1]. Riverine sediment transport refers to the process by which suspended sediments within rivers are transported downstream by the flowing water. It encompasses the collective influence of various natural factors and human activities within a watershed. Consequently, riverine sediment transport not only provides a record of the natural processes occurring within the watershed, such as hydrological and ecological processes [2], but also serves as a reflection of human activities within the watershed, including activities such as the construction of reservoirs/dams, land use changes, sand/mineral mining, etc. [3,4]. Moreover, suspended sediment concentration (SSC; refer to Table S1 for subsequent acronyms) is a principal factor controlling light availability in aquatic systems, affecting the growth of aquatic plants and algae. SSC plays a pivotal role in determining the suitability of aquatic ecosystems as habitats and can also serve as a carrier for substances such as carbon, nutrients, and pollutants [5]. Suspended sediments transported into the ocean by rivers can significantly impact the water quality and environmental characteristics of estuaries and coastal areas [6]. Riverine SSC exhibits pronounced spatiotemporal variability influenced by various factors, including natural variations and human activities. This variability complicates efforts to comprehend the broad-scale fluctuations in riverine SSC through conventional hydrological monitoring. Field-based SSC sampling is time-consuming and costly, and time-series analyses using in situ data are limited by the number of sampling stations, the monitoring frequency, and their spatial representation. In addition, in situ data might be unavailable for some years; for example, data were unavailable for the 1990–2005 period for the four hydrological stations adopted in this study (Section 2.2). Therefore, it becomes imperative to employ satellite remote sensing data with comprehensive spatial coverage and long-term observational records to monitor the spatiotemporal dynamics of riverine SSC.
The specific absorptive and scattering characteristics of suspended sediments in water bodies alter the remote sensing reflectance (Rrs), making it possible to monitor SSC using satellite data [7]. Since the 1970s, numerous remote sensing algorithms have been developed for monitoring SSC based on the relationship between SSC and Rrs [8]. However, previous research has predominantly focused on large river estuaries, lakes, or marine areas using remote sensing data with a spatial resolution of 500–1000 m [6,9,10]. For instance, in the case of the Pearl River estuary, Luo et al. [6] utilized Moderate-Resolution Imaging Spectrometry (MODIS) data with red and green spectral bands as independent variables for SSC retrieval. For Tana Lake, Womber et al. [9] employed MODIS data with near-infrared spectral bands. In the context of the East China Seas, Wang et al. [10] used Sea-Viewing Wide-Field-of-View Sensor (SeaWiFS) data with blue and green spectral bands. However, the SSC levels in these previously studied water bodies are considerably lower than those found in the Yellow River, and the remote sensing data used may not be suitable for river cases. Therefore, it is imperative to construct an SSC remote sensing model that is applicable to high-resolution remote sensing data for the Yellow River, which exhibits a wide range of SSC concentrations.
The construction of dams can have complex effects on suspended sediment transport in rivers, with these impacts depending on factors such as the dam’s location, scale, management practices, and surrounding environmental conditions [11]. It is crucial to carefully assess these effects to facilitate the implementation of effective measures to mitigate the negative impacts of reservoir construction and protect the health of riverine ecosystems. Reports indicate that human activities such as reservoir construction have altered the spatiotemporal characteristics of global riverine suspended sediment transport in the past few decades [12]. Typically, after the construction of a reservoir, the flow velocity of the river may decrease, leading to the gradual settling of suspended gravel particles on the riverbed [13]. Consequently, downstream river channels may experience erosion due to the lack of these suspended sediments.
Asia is considered to contribute significantly to the input of suspended sediments into the ocean [14], and riverine sediment transport in Asian rivers exhibits distinct seasonal variability [2]. The Yellow River, renowned for its high sediment load, contributes significantly to China’s transportation of sediment to the ocean [15]. The riverbed rises continuously due to severe sediment deposition in the lower Yellow River channel. It is now up to 10 m higher than the surrounding land surface in some places, forming an “overhanging river” [16]. In response, the Chinese government has successively constructed the Sanmenxia and Xiaolangdi reservoirs in the downstream Yellow River. In 2002, water and sediment regulation (WSR) strategies were implemented for these two reservoirs to regulate water and sediment transport in the downstream Yellow River [17]. Still, the specific impacts of the Sanmenxia and Xiaolangdi reservoirs on suspended sediment transport in the different river segments of the downstream Yellow River have not been researched to date.
To quantitatively analyze the impact of reservoir construction on suspended sediment transport, this study first established a remote sensing model for riverine SSC that is applicable to Landsat series data and explored the uncertainties associated with SSC retrieval. Based on satellite-derived SSC from 1984 to 2022, the spatiotemporal variability in SSC in the downstream Yellow River was analyzed. We also assessed the influence of Xiaolangdi reservoir construction on SSC in different downstream river segments. This study contributes to filling the gaps in the spatiotemporal monitoring of suspended sediment transport in the downstream Yellow River, enhancing our understanding of how human activities can alter riverine suspended sediment transport.

2. Materials and Methods

2.1. Study Area

As shown in Figure 1, the Yellow River, the world’s fifth-longest river, spans a total length of 5464 km and covers a basin area of approximately 795 × 103 km2 [18]. Most of the Yellow River basin is located in arid and semi-arid regions, with an annual average temperature of 8–14 °C [3]. The basin experiences considerable spatial variations in average yearly precipitation, with the upstream region receiving 368 mm, the midstream region receiving 530 mm, and the downstream area receiving 670 mm [3]. After flowing through the Loess Plateau, the Yellow River carries a substantial amount of sediment, making it one of the world’s most renowned rivers, with a high sediment load relative to its water volume [19]. As reported by Chu et al. [20], the annual average water discharge at the Lijin hydrological station on the Yellow River (1950–2007) was only 31.60 km3, while the sediment transport reached 0.76 Gt, resulting in an average SSC of 24.1 kg/m3. The downstream section of the Yellow River is typically defined as the stretch below Taohuayu in Henan Province to its estuary, traversing the North China Plain [21]. Due to its broad and flat topography with gentle slopes, the downstream Yellow River experiences significant sediment accumulation. Approximately 4 × 10⁸ kg of sediment is deposited on the riverbed annually, forming “overhanging rivers” in specific segments, where the sediment buildup elevates the riverbed by nearly ten meters compared to the surrounding areas [22].
To mitigate the elevation of the riverbed in the downstream Yellow River, the Chinese government initiated several large-scale dam projects in the 1950s, leading to the construction of the Sanmenxia and Xiaolangdi reservoirs. The Sanmenxia reservoir was completed and operational by 1961, and has since become a crucial component of the flood control system in the lower Yellow River. Its multifaceted development objectives encompass flood control, ice jam prevention, irrigation, power generation, and water supply. The Xiaolangdi reservoir began impounding water in October 1999, which was indispensable in reducing sediment deposition and flood control in the downstream Yellow River. However, the substantial sediment transported from the upper reaches of the Yellow River into the reservoirs resulted in a rapid decrease in their storage capacity. To address the sedimentation issues in the Sanmenxia and Xiaolangdi reservoirs, a joint water and sediment regulation program, known as the WSR, was initiated in June each year, lasting approximately 20 days and starting in 2002 [20]. Specifically, during this time, sediment discharged from the reservoir(s) upstream and scoured from the riverbed downstream was delivered to the sea where possible by designed flood waves [20]. WSR has proven effective in reducing sedimentation within the Sanmenxia and Xiaolangdi reservoirs and reshaping the downstream riverbed, significantly altering the sediment transport dynamics in the lower Yellow River [20].

2.2. Hydrological Data

The lower reaches of the Yellow River are strategically monitored by four pivotal hydrological stations: Sanmenxia, Xiaolangdi, Huayuankou, and Lijin. The Sanmenxia and Xiaolangdi hydrological stations are located downstream of the Sanmenxia and Xiaolangdi reservoirs, respectively. Huayuankou hydrological station is the initial station, where the Yellow River transitions to an overhanging river above the ground. Lijin hydrological station is the final station; it is unaffected by tidal influences, and the sediment flux measured at this station typically represents the riverine discharge into the ocean [23]. For this study, we sourced daily water flow (1984–1989, 2001–2022) and daily sediment transport data (1984–1989, 2006–2012) from these four hydrological stations through the Loess Plateau Subcenter, National Earth System Science Data Center, China (http://loess.geodata.cn/, accessed on 25 November 2022). These data provide valuable insights into the hydrological dynamics and sediment transport in the lower Yellow River, contributing to our understanding of this crucial river system. Based on the daily data, this study calculated the daily and the monthly averaged SSC for the four hydrological stations.
Due to the discontinuity in hydrological monitoring data, this study supplemented the water discharge data by acquiring daily-scale water flow data from 1990 to 2000 (version 4.0) provided by the Global Flood Awareness System (GloFAS). These data were sourced from the Copernicus Climate Datastore (https://cds.climate.copernicus.eu/cdsapp#!/dataset/cems-glofas-historical?tab=overview, accessed on 27 July 2023) and possess a spatial resolution of 0.05° [24]. Furthermore, this study accessed the Global Surface Water (GSW) dataset from the Joint Research Centre (https://global-surface-water.appspot.com, accessed on 04 June 2023) to delineate the boundaries of water bodies in the lower Yellow River region. Since the GSW data are only available for the 1984–2021 period and data are lacking for some years, we supplemented the water extent by referring to the water body extraction algorithm proposed by Zou et al. [25].

2.3. Landsat Series Data

The downstream part of the Yellow River is only 100–300 m in width. In comparison, traditional ocean-color sensors (like OLCI and MODIS) have spatial resolutions ranging from 300 to 1000 m, making them unsuitable for SSC monitoring in this case. Alternatively, numerous studies have shown that the Landsat series data, with a spatial resolution of 30 m, can be effectively applied for monitoring riverine turbidity and SSC, and can also provide long-term time series monitoring records dating back to 1984 [26]. Therefore, in this study, we selected data obtained from the Thematic Mapper carried on the Landsat-5 satellite (TM/Landsat-5), the Enhanced Thematic Mapper plus carried on the Landsat-7 satellite (ETM+/Landsat-7), and the Operational Land Imager carried on the Landsat-8 satellite (OLI/Landsat-8) to determine SSC in the downstream Yellow River, covering the period from 1984 to 2022.
The atmospherically corrected reflectance data of the Landsat series used in this study were obtained from the “USGS Surface Reflectance Tier 1” dataset provided by the Google Earth Engine (GEE). The Landsat 8 OLI and Landsat 5 TM/7 ETM+ data have been atmospherically corrected using the Land Surface Reflectance Code (LaSRC) and the Landsat Ecosystem Disturbance Adaptive Processing System (LEDAPS), respectively [27]. This study primarily utilized the blue (B), green (G), red (R), near-infrared (NIR), and short-wave infrared (SWIR) bands, with similar ground resolution settings across different sensors, while there are differences in the band settings between OLI/Landsat-8 and the other two sensors [28].

2.4. Statistical Analysis and Accuracy Assessment

This study used the Origin 2018 software platform for analyses like linear regression, scatter plot visualization, and significance testing. ArcGIS 10.3 software was utilized to create geographically referenced maps. The quality of model fitting was evaluated using the coefficient of determination (R2), with a significance level of p < 0.01 (2-tailed test) indicating statistical significance. To assess the accuracy of remotely derived SSC, the mean absolute percent difference (MAPD, %), root-mean-square error (RMSE, mg/L), and relative bias (RB, %) were employed, and were calculated as follows:
MAPD = [ X i m o d e l e d X i i n - s i t u ] X i in - situ × 100 / N R M S E = X i m o d e l e d X i in - situ 2 N 1 / 2 R B = 1 / N × X i m o d eled X i in - situ m e a n X i in - situ × 100
where X i i n - s i t u and X i m o d e l e d represent the in situ and retrieved SSC, respectively; m e a n X i i n - s i t u denotes the average of in situ SSC; and N represents the total number of samples. Additionally, based on the annual mean SSC, the coefficient of variation (CV) was calculated (Equation (2)) to characterize the spatial heterogeneity of SSC distribution in the downstream Yellow River over the 39-year period from 1984 to 2022.
C V = 1 N S S C i S S C ¯ 2 S S C ¯
where S S C i represents the annual averaged SSC for the year i, which ranges from 1984 to 2022; S S C ¯ represents the climatological mean SSC during 1984–2022; and N denotes the total years analyzed (N = 39).

3. Algorithm for Remotely Monitoring SSC

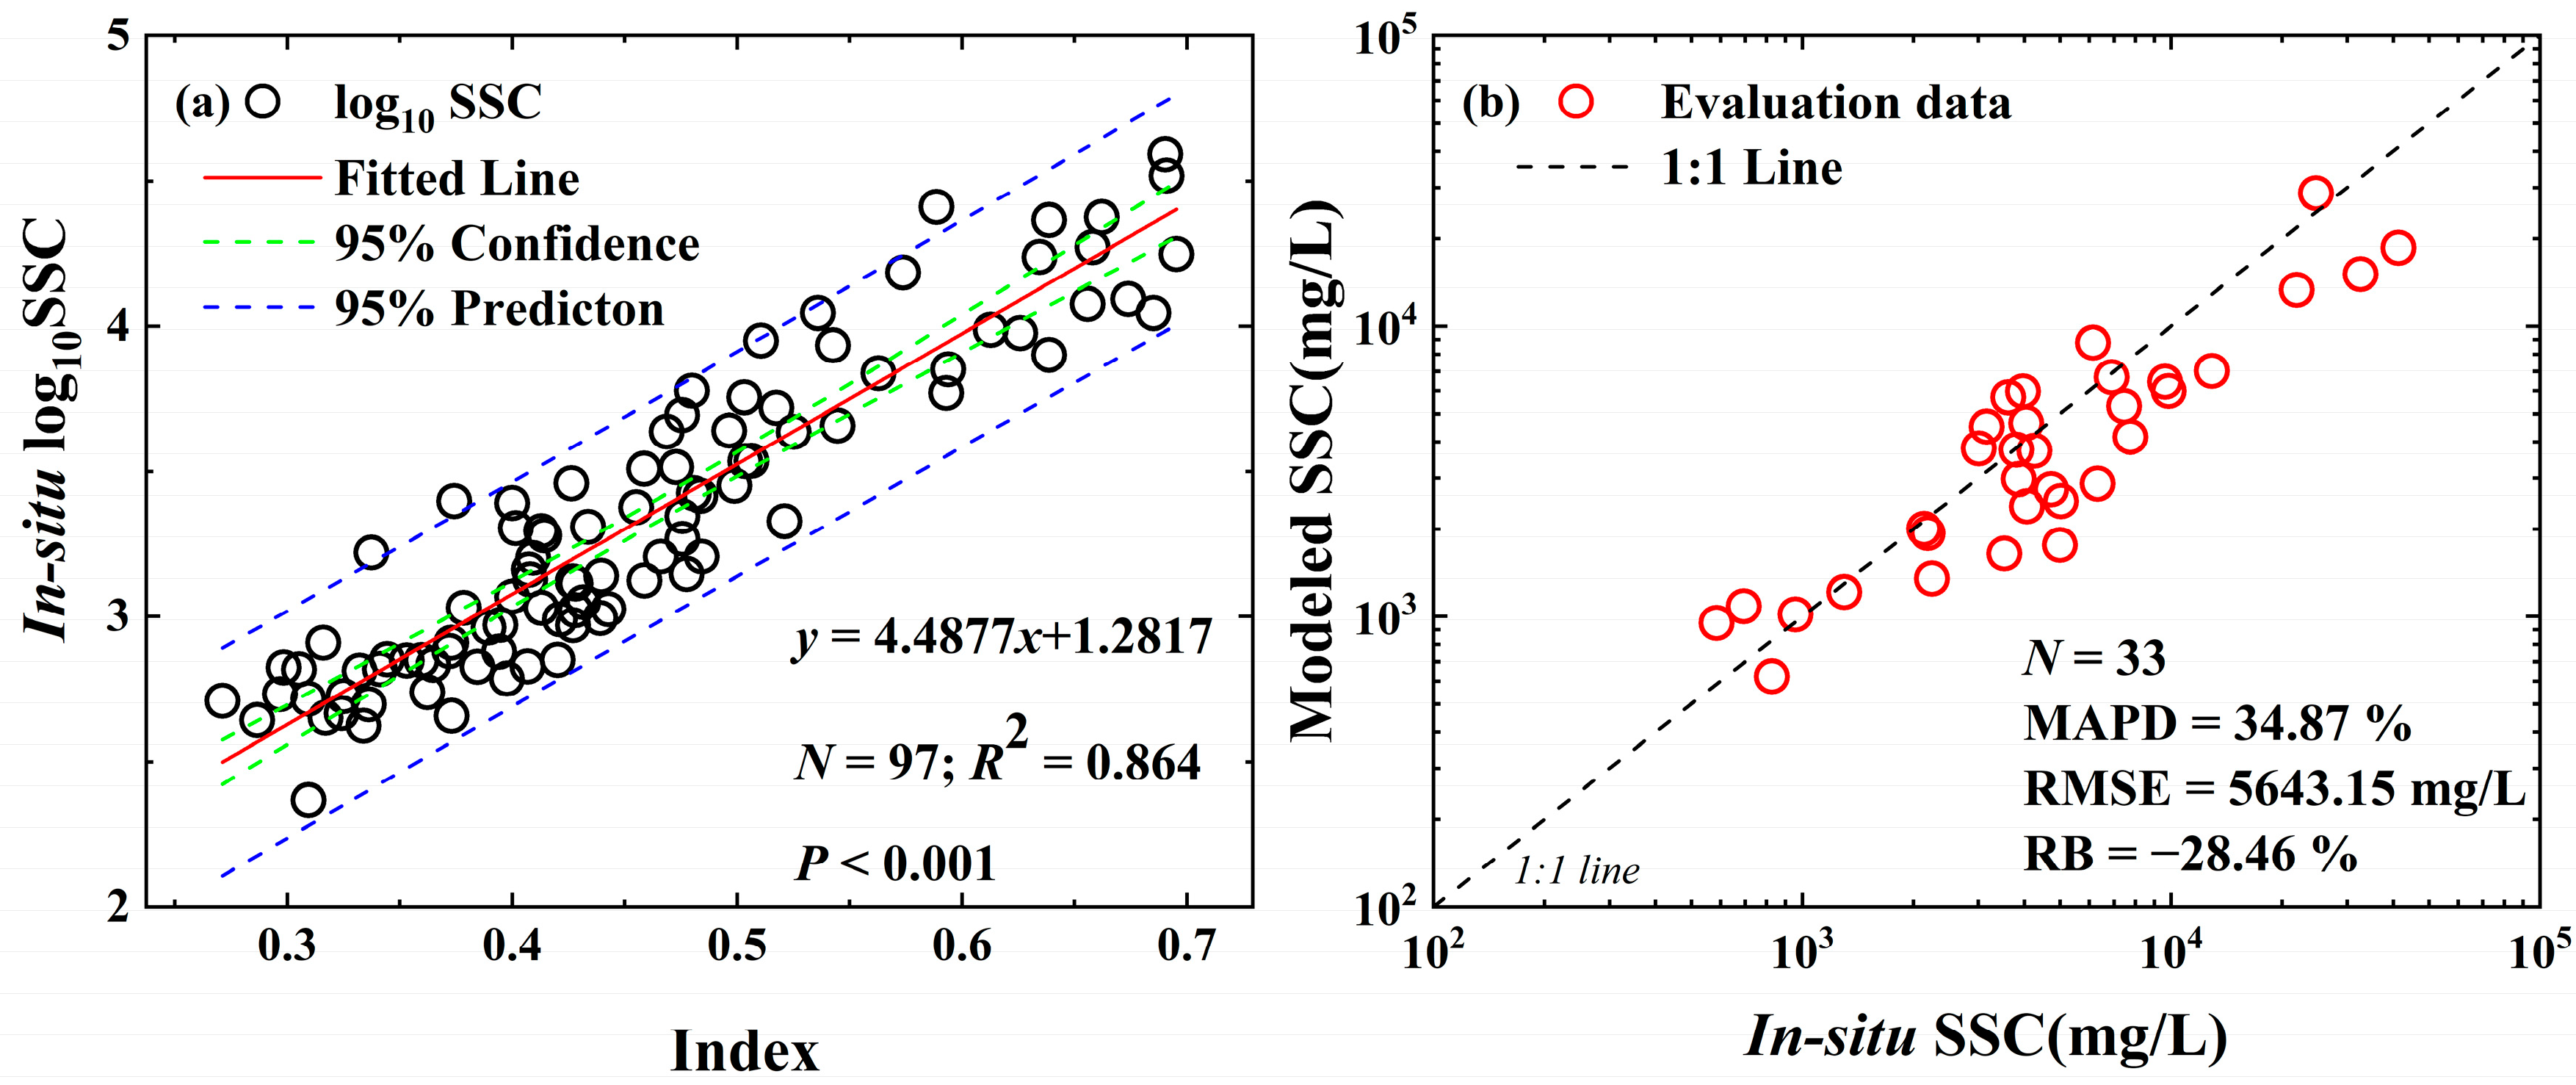
3.1. Algorithm Development

The remote sensing reflectance (Rrs) of water bodies is collectively determined based on the optical properties of various optically active substances, including their radiative, absorptive, and scattering characteristics [29]. Pure water exhibits an exponentially decreasing reflectance curve from high reflectance in the blue region to low reflectance in the red region [30]. When water contains other substances, its spectral reflectance curve exhibits troughs or peaks, which serve as the physical basis for the remote sensing inversion of water constituents [31]. Water bodies with different suspended sediment concentrations will have differences in their inherent optical properties, including absorption and scattering. Therefore, the reflectance spectra of water bodies with different SSCs vary. In typical scenarios, Rrs peaks in the red-green band as the SSC increases. As the concentration increases, the reflectance peak in the red-green band saturates and shifts towards longer wavelengths, namely “red shift” [32]. Figure 2 illustrates the spectral Rrs of TM/Landsat-5 corresponding to different in situ SSCs, ranging from 233 to 39,100 mg/L. When the SSC is low, the Rrs in all five bands (blue, green, red, near-infrared, and short-wave infrared) is low, with the reflectance peak occurring in the green band. As the SSC increases, the reflectance in the first four bands significantly increases, while the reflectance in the short-wave infrared band (SWIR) exhibits fluctuating changes, with most reflectance peak values appearing in the near-infrared band (NIR, Figure 2). This indicates that Landsat Rrs can be used for the remote sensing inversion of river SSC, especially the NIR band, which is most sensitive to changes in SSC.
For the Landsat series data (Section 2.3), this study first utilized the CFMASK algorithm on the GEE platform to identify cloud-covered pixels. Images with cloud cover of <20% were selected, and visual inspection was conducted to ensure that the water areas of the four hydrological stations were not covered by clouds, thereby improving the quality of the data used for modeling. Next, we matched the Rrs data with the daily-scale SSC data of the four hydrological stations (Section 2.2). In total, 130 pairs of high-quality match-ups were obtained. Then, we randomly selected 75% of them as the development data (N = 97), while the remaining 25% were used as the evaluation data (N = 33).
Previous studies using Landsat data for river SSC inversion have shown that the optimal bands or band combinations vary with differences in SSC between rivers (Table 1). By applying the existing models with the match-ups mentioned above, it is found that these models are less accurate for SSC retrieval in the lower Yellow River, with R2 values ranging from 0.20 to 0.68. There are two potential reasons: first, the lower Yellow River exhibits extremely high SSC that far exceeds the ranges of data used for constructing these models; second, when the SSC varies, the sensitive remote sensing bands may differ. Additionally, there may even be non-negligible water-leaving signals in the short-wave infrared (SWIR) bands [33]; thus, it is necessary to consider the SWIR bands when building models for monitoring SSC in the lower reaches of the Yellow River.
Based on the training dataset and the reflectance characteristics for different waters in the lower Yellow River (Figure 2), this study developed a remote sensing algorithm for SSC retrieval: (1) The SSC values were logarithmically transformed, and Pearson’s correlation coefficient (r) between the Rrs in different bands and log10(SSC) was calculated. This process identified the high sensitivity of Rrs(NIR) to variations in log10(SSC) (Figure 2). (2) Various combinations of Rrs were used as the denominator, and Rrs(NIR) was used as the numerator to calculate an index for SSC estimation. The indexes were then fitted against log10(SSC) to identify the optimal band combination, (Rrs(NIR)/(Rrs(G) + Rrs(R) + Rrs(SWIR))). (3) Linear, exponential, logarithmic, and power functions were used to fit log10(SSC) with the optimal index to determine the best model for estimating SSC. Finally, we obtained the SSC model (Equation (3)):
log 10 S S C = 4.4877 × I n d e x + 1.2817 I n d e x = R rs ( NIR ) R rs ( G ) + R rs ( R ) + R rs ( SWIR )
where Rrs(NIR), Rrs(G), Rrs(R), and Rrs(SWIR) correspond to the Rrs in the near-infrared, green, red, and short-wave infrared bands, respectively (R2 = 0.86, Figure 3a).

3.2. Algorithm Validation

The model validation demonstrated that it could be applied for remotely estimating SSC using Landsat data. As depicted in Figure 3b, all data points were scattered along the 1:1 line, indicating good estimation results for both high and low levels of SSC in the lower Yellow River. The MAPD was 36.97% for the development dataset, the RMSE was 3621.47 mg/L, and the RB was −9.40%. The MAPD was 34.87% for the evaluation dataset, the RMSE was 5643.15 mg/L, and the RB was −28.46% (Figure 3b).
Due to the limited number of ground-truth samples, we further compared the monthly average SSC sourced through hydrological monitoring and remote estimation. Overall, there was a consistent trend in the monthly SSC changes, especially at the Huayuankou and Lijin hydrological stations. For these two stations, the MAPD values of the remotely estimated SSC were 38.44% and 39.78%; the RMSE values were 1922.43 mg/L and 3891.32 mg/L; and the RB values were −37.84% and −23.50% (Figure 4). There were some differences for the Sanmenxia and Xiaolangdi hydrological stations, although the remotely estimated SSC exhibited similar temporal variations to those we observed. The MAPD values for the satellite-derived SSC were 50.68% and 51.96%; the RMSE values were 6518.27 mg/L and 6024.80 mg/L; and the RB values were −47.38% and −40.34%, respectively. This discrepancy can be attributed to the fact that these two stations are located downstream in close vicinity to the Sanmenxia and Xiaolangdi reservoir outlets, where the WSR activities of these two reservoirs can cause significant short-term fluctuations in SSC. However, the Landsat data with a temporal resolution of 16 days may not be able to capture the frequent changes in SSC at these two hydrological stations. In addition, we compared the monthly average Landsat-derived SSC to the hydrological monitoring data at the Sunkou and Luokou hydrological stations, whose data were not used in developing the algorithm. For the Sunkou and Luokou hydrological stations, the MAPD values of the remotely estimated SSC were 43.89% and 41.44%, respectively; the RMSE values were 2979.51 mg/L and 3603.90 mg/L, respectively; and the RB values were −48.69% and −37.09%, respectively (Figure S1). Namely, a consistent trend of change existed between the Landsat-derived SSC and hydrological monitoring data.

3.3. Mutual Calibrations for Landsat Series Data

To achieve long-term monitoring of SSC, this study required the simultaneous use of Rrs obtained from TM/Landsat-5, ETM+/Landsat-7, and OLI/Landsat-8. The band settings of TM/Landsat-5 are similar to those of ETM+/Landsat-7, especially in the red and near-infrared bands, but differ from those of OLI/Landsat-8 [28]. This study conducted mutual calibration on SSC data derived from various sensors to mitigate the SSC estimation discrepancies caused by different sensor settings. Considering the temporal coverage of TM/Landsat-5 (1984–2011), ETM+/Landsat-7 (1999–2022), and OLI/Landsat-8 (2013–2022), we used the Rrs from respective channels and the band ratio index derived from ETM+/Landsat-7 as the standard for mutual calibration. Since images from various sensors on the same day in the lower Yellow River were unavailable, the data acquired within the one-day interval were used for mutual calibration. The averaged values within a 3 × 3 pixel window for the overlapping areas were compared to further reduce the potential effects of noise or atmosphere. The results showed deviations in the inter-calibration of respective channels (with R2 = 0.93–0.99, 0.92–0.96, Figure S2), while there was high consistency between the index values of ETM+/Landsat-7 and both TM/Landsat-5 and OLI/Landsat-8 (with R2 = 0.99, 0.97, Figure 5). So, the band ratio index could implicitly compensate for the failure of the atmospheric correction in Rrs and the deviations in the individual channels. Therefore, we used the band ratio index from the Landsat series to derive the SSC (Equation (4)):
I n d e x ETM + / Landsat - 7 = 1 . 0008 × I n d e x TM / Landsat - 5 + 0.0082 I n d e x ETM + / Landsat - 7 = 0.9434 × I n d e x OLI / Landsat - 8 + 0.0227
where Index(TM/Landsat-5), Index(ETM+/Landsat-7), and Index(OLI/Landsat-8) are calculated based on Equation (3). For ETM+/Landsat-7 and TM/Landsat-5, the linear regression yielded an R2 of 0.99 (N = 7164, Figure 5a). For ETM+/Landsat-7 and OLI/Landsat-8, the linear regression yielded an R2 of 0.97 (N = 5772, Figure 5b). Then, we calibrated the satellite-derived SSC data from TM/Landsat-5 and OLI/Landsat-8 to those from ETM+/Landsat-7 using the corresponding linear regression equations.

4. Results

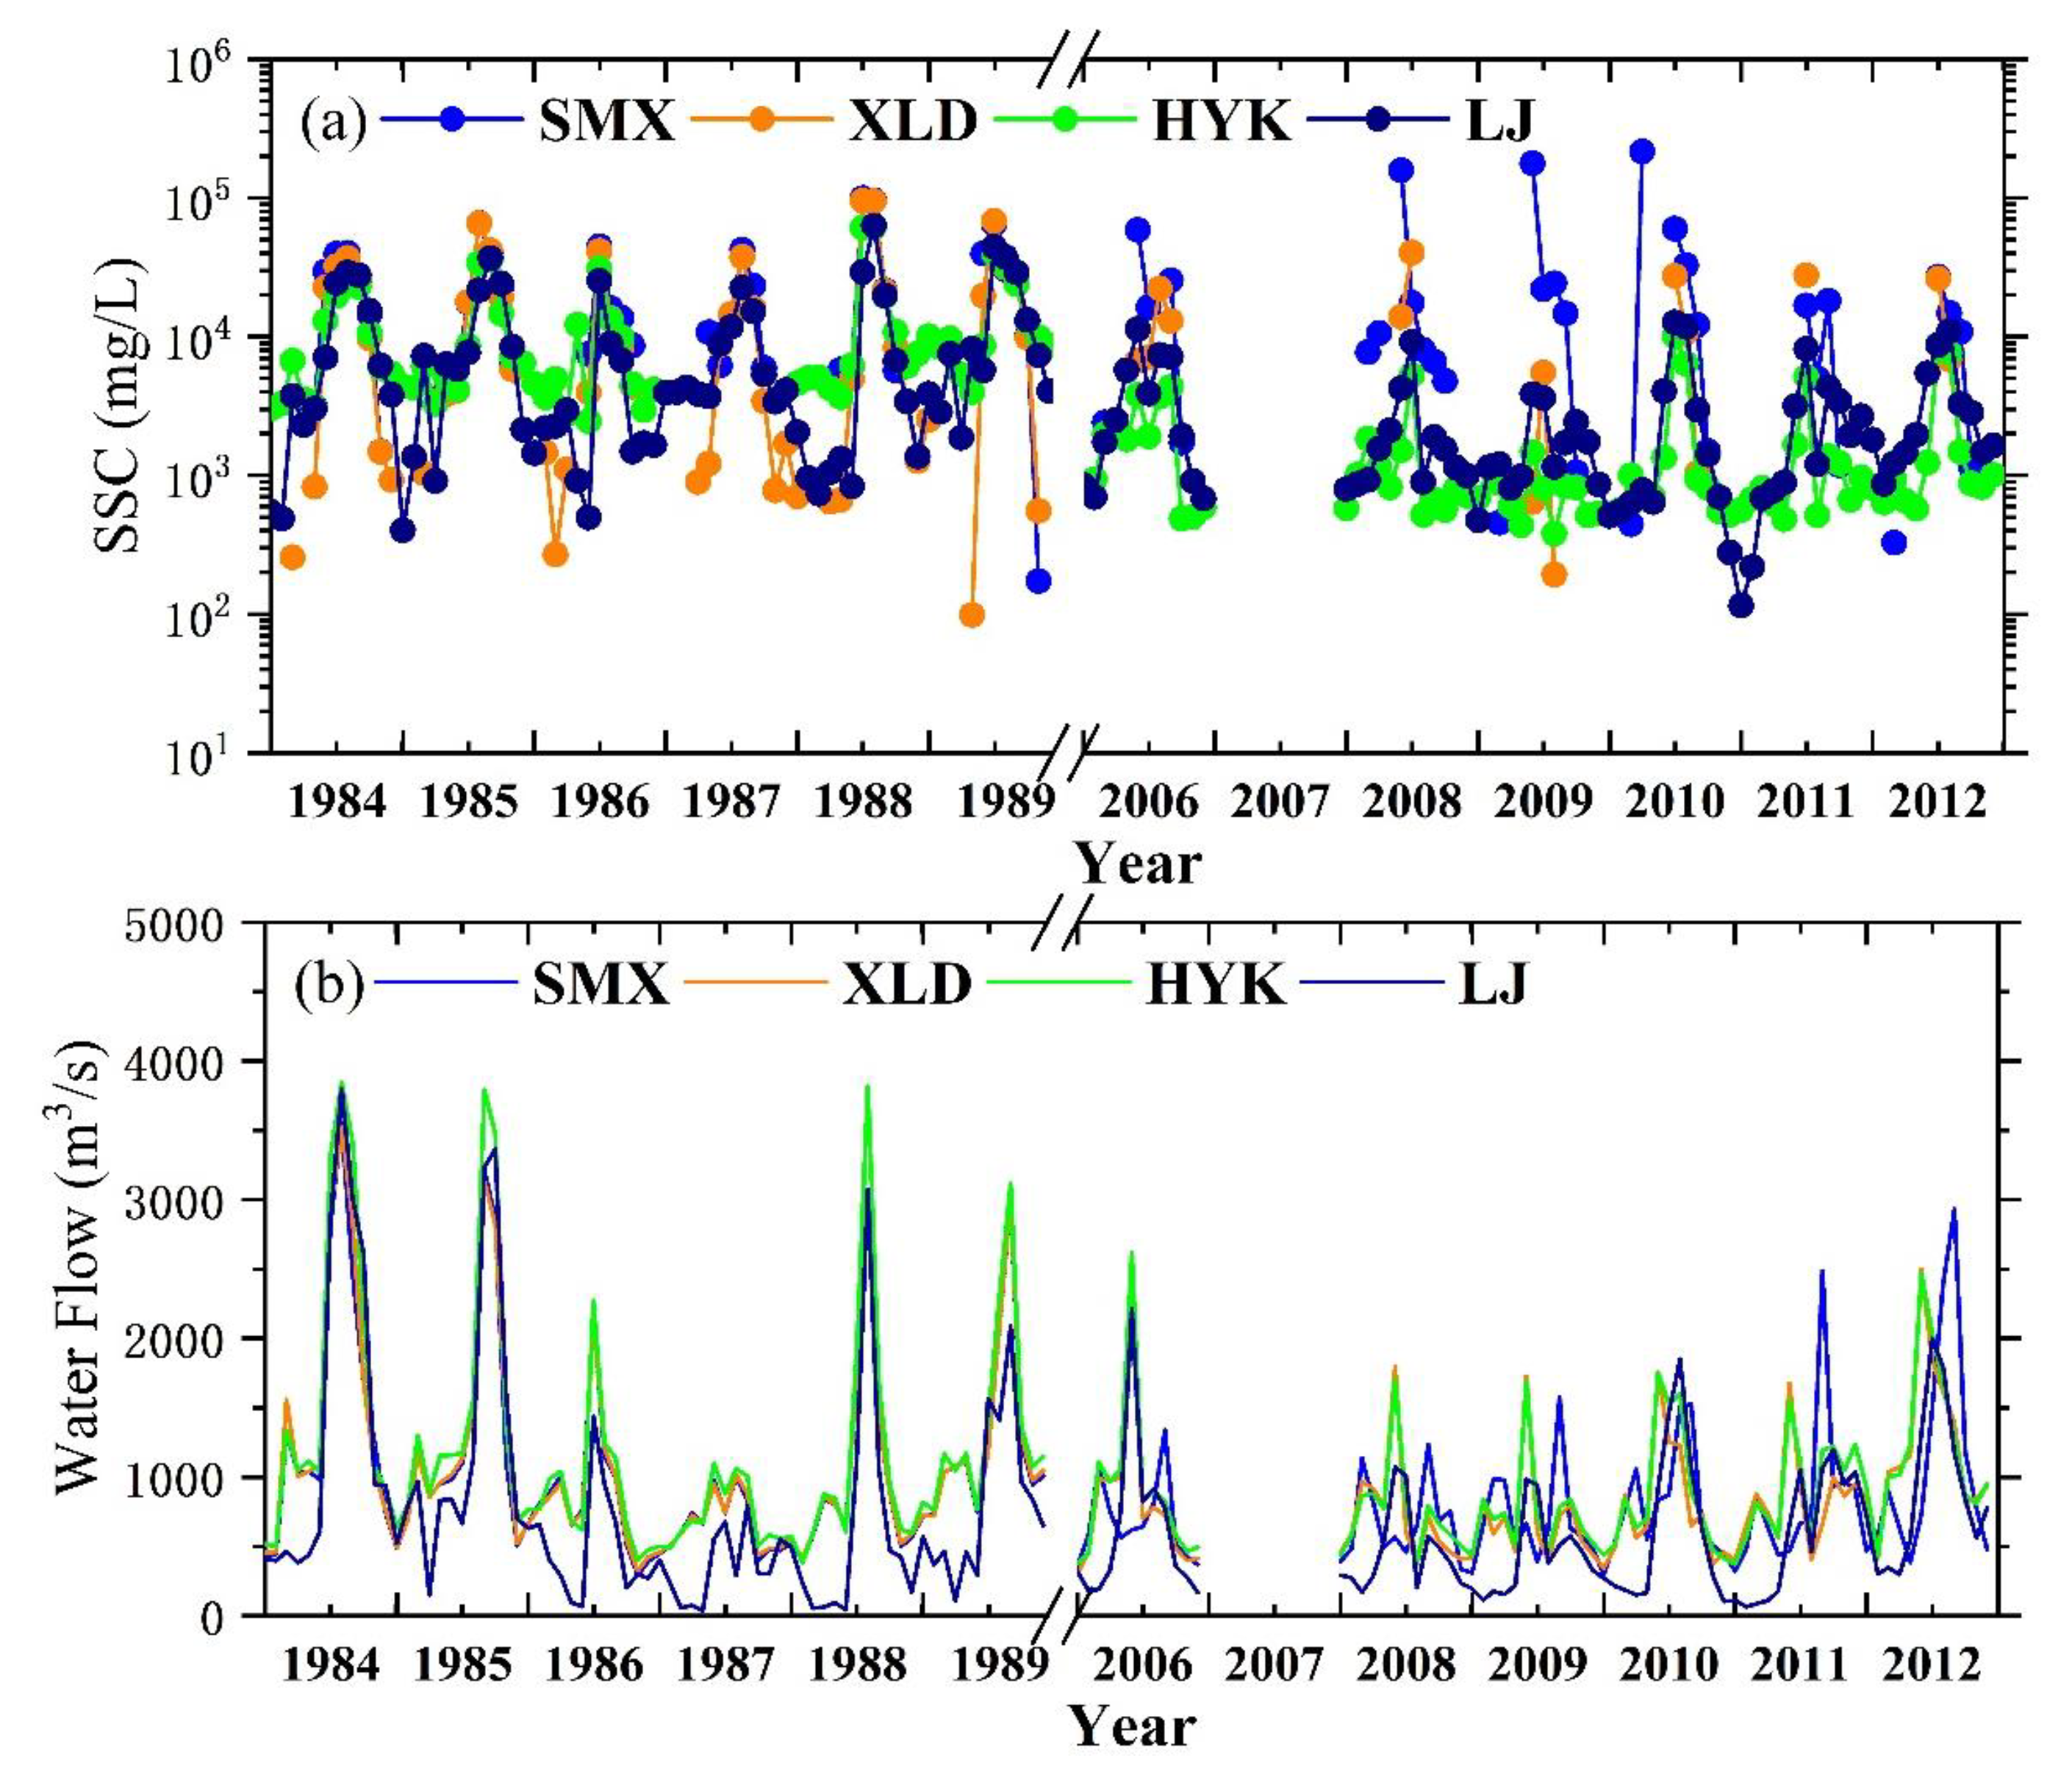
4.1. SSC Comparisons for Different Stations

The SSC in the lower Yellow River exhibited significant variations, and the operation of Xiaolangdi WSR induced a decrease in SSC. The operation of Xiaolangdi WSR started in 2002, based on which the SSC data were divided into two periods (Section 2.2): pre-WSR operation (1984–1989) and post-WSR operation (2006–2012). The monthly in situ SSCs for the four hydrological stations during these two periods are shown in Figure 6 and Table S2. For the Sanmenxia station, the SSC range before WSR operation was 172.86– 99,793.55 mg/L, with an average of 24,719.04 ± 24,341.31 mg/L. After WSR operation, the SSC range was 327.67–215,813.60 mg/L, with an average of 28,559.36 ± 50,874.09 mg/L. For the Xiaolangdi station, the SSC before WSR operation ranged from 98.83 to 95,414.84 mg/L, averaging 16,094.19 ± 22,713.97 mg/L. After WSR operation, the SSC ranged from 193.00 to 40,400.00 mg/L, averaging 13,171.10 ± 12,100.94 mg/L. For the Huayuankou station, the SSC range before WSR operation was 2471.67–61,322.58 mg/L, averaging 11,301.60 ± 12,180.83 mg/L. After WSR operation, the SSC range was 379.68–10,121.81 mg/L, averaging 1552.63 ± 1945.08 mg/L. For the Lijin station, the SSC before WSR operation ranged from 402.26 to 63,203.23 mg/L, averaging 9583.38 ± 12,148.50 mg/L. After WSR operation, the SSC ranged from 115.35 to 12,670.65 mg/L, averaging 2737.53 ± 2989.98 mg/L.
The Xiaolangdi WSR also altered the correlation between SSC and water flow at different stations, and generally weakened the relationship between SSC and water flow. Before WSR operation, both SSC and water flow exhibited pronounced seasonal variations, with high SSC in summer when water flow was high and low SSC in winter when water flow was low. For the Sanmenxia, Xiaolangdi, Huayuankou, and Lijin hydrological stations, the linear regression for SSC and water flow exhibited R2 values of 0.660, 0.726, 0.811, and 0.866, respectively (Figure 6). However, after WSR operation, the seasonal variability in both SSC and water flow weakened, and the correlation between SSC and water flow decreased. During WSR operation, high SSC was even observed during low-flow months. For the Sanmenxia, Xiaolangdi, Huayuankou, and Lijin hydrological stations, the R2 values for the linear regression between SSC and water flow were 0.171, 0.044, 0.189, and 0.873, respectively (Figure 6).

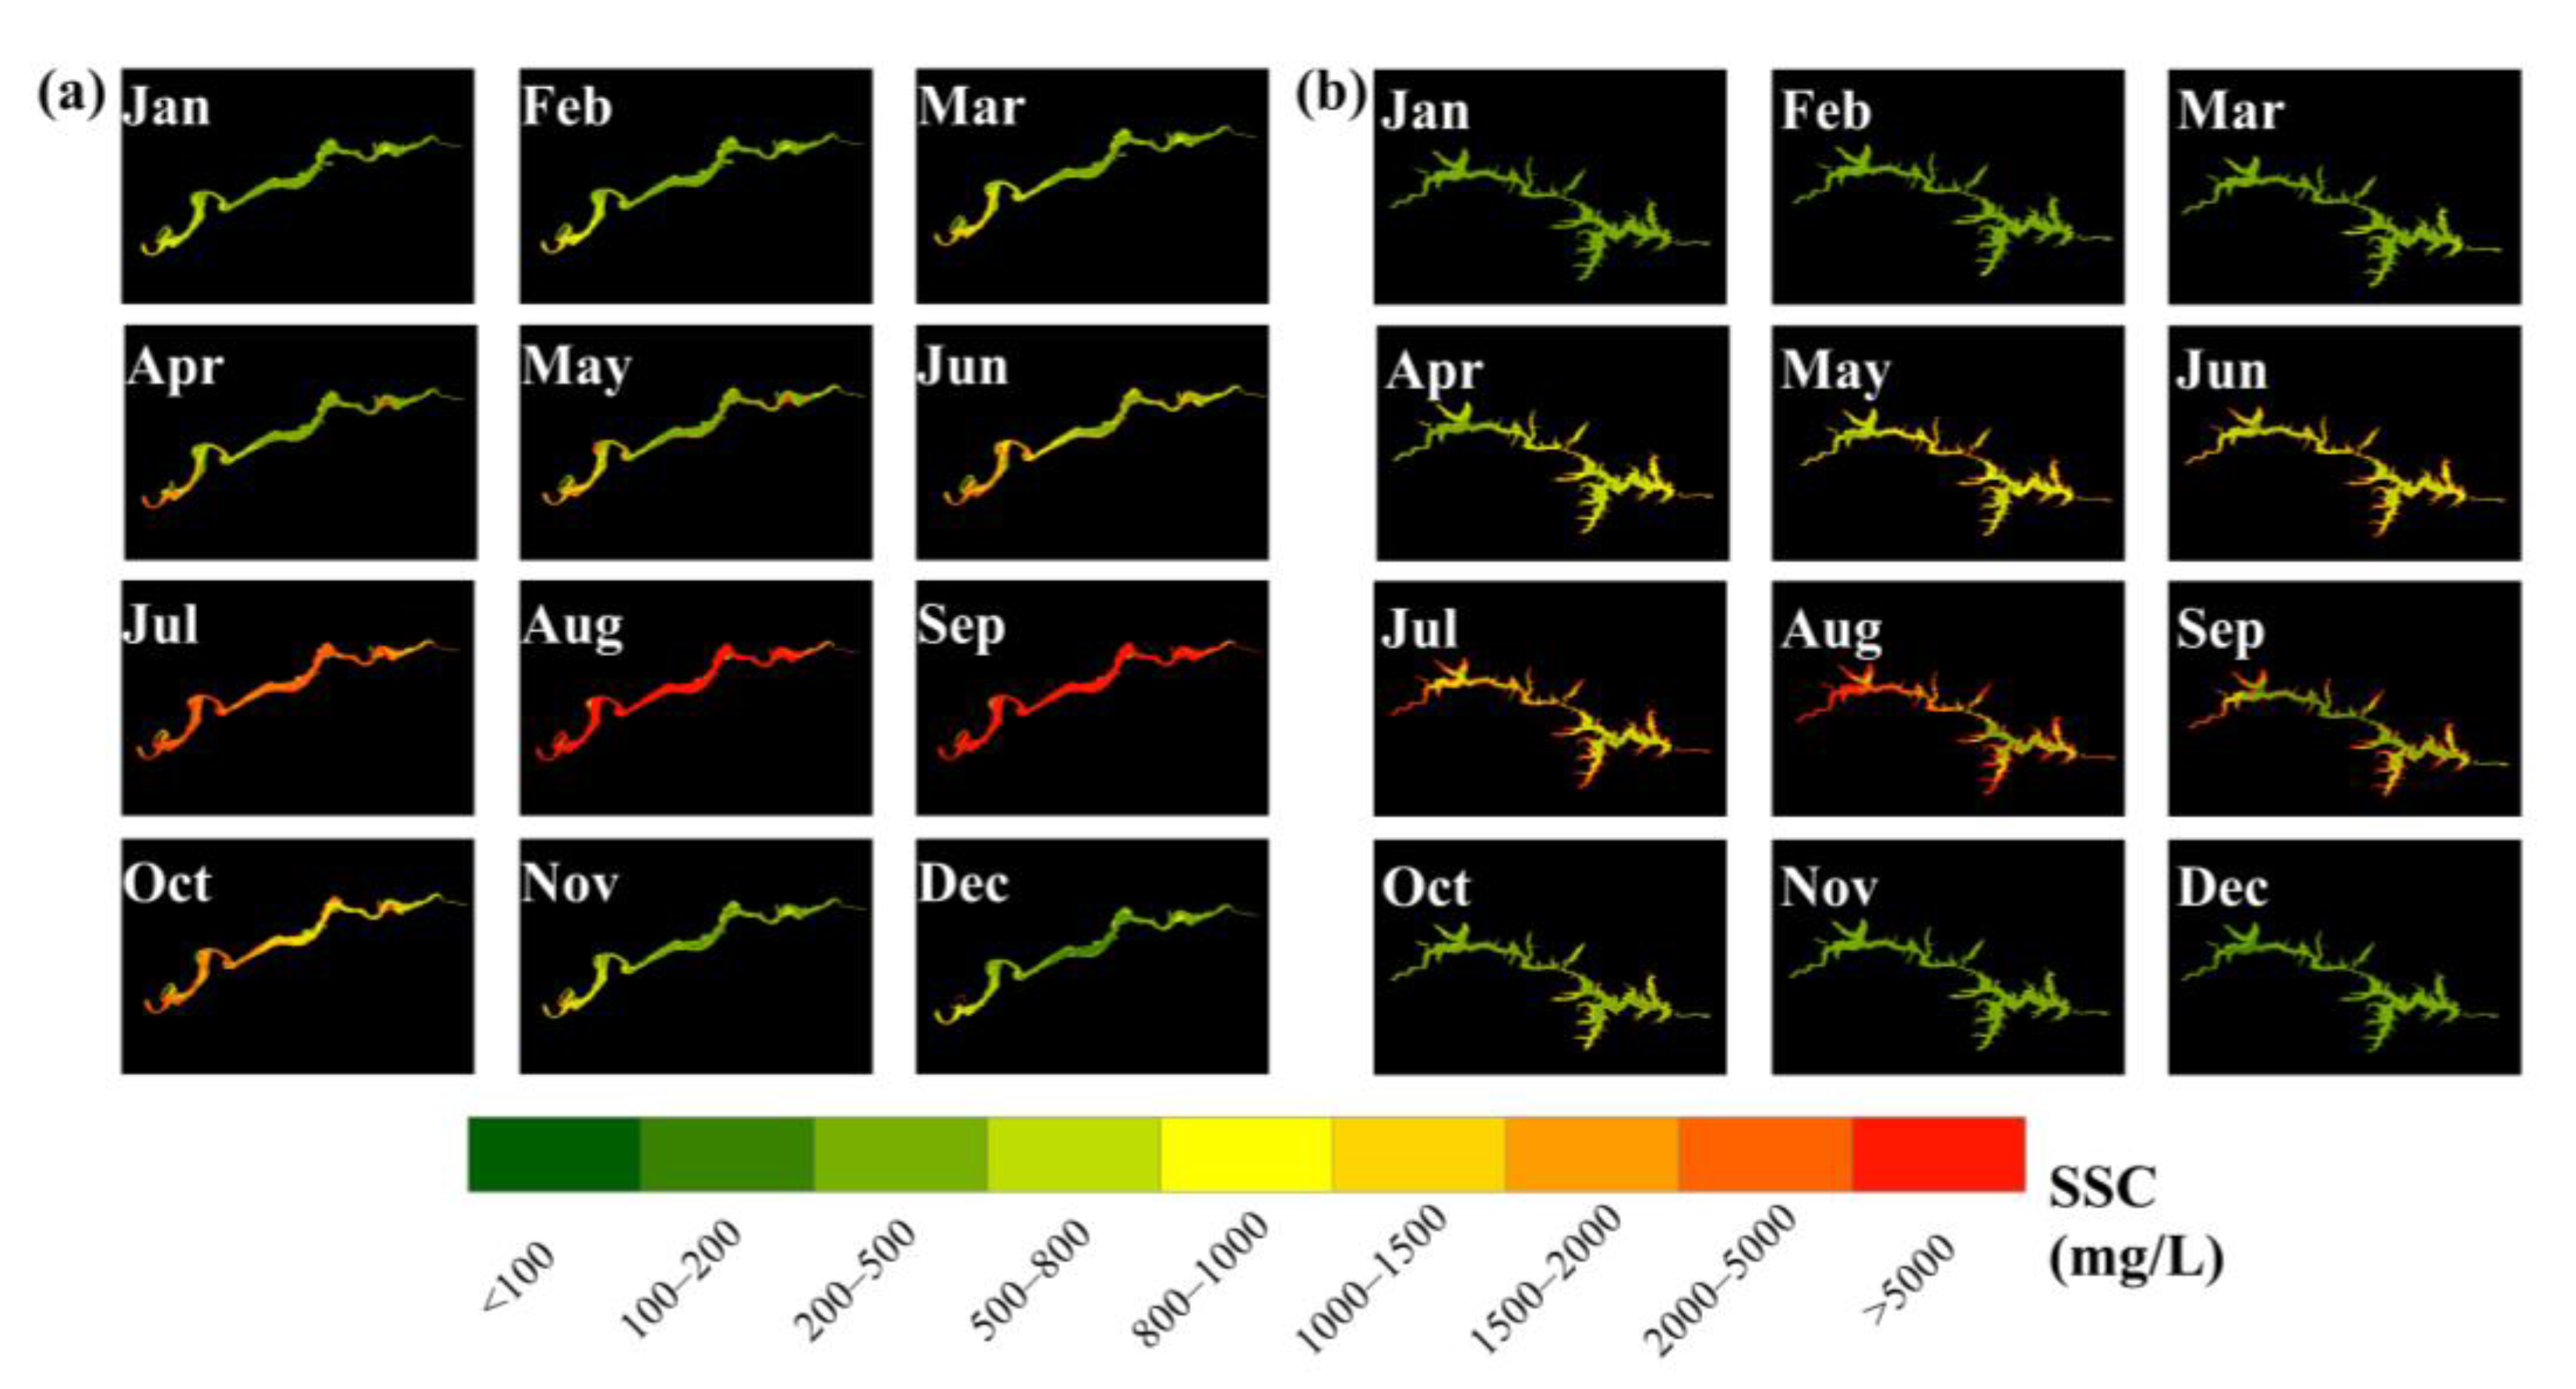
4.2. Sediment Transport along the Mainstream

Applying Equation (3) to the Landsat data enabled us to determine the SSC in the downstream Yellow River from 1984 to 2022. The arithmetic mean value was then calculated to obtain the climatological SSC (Figure 7a, Table S3). The SSC showed apparent spatial variability, and then, gradually decreased as the river flowed from the upper reaches to the reservoirs. After flowing out of the reservoir, the SSC increased and maintained a high value until it entered the ocean. At the upstream Sanmenxia station, the SSC was 2998.33 ± 1221.41 mg/L. The flow velocity significantly decreased after entering the Sanmenxia and Xiaolangdi reservoirs, leading to substantial sediment deposition on the riverbed. As a result, the Landsat-derived SSC gradually decreased from the upstream to downstream reservoir areas, with SSC values at the Sanmenxia and Xiaolangdi hydrological stations of only 1008.42 ± 602.83 mg/L and 1177.89 ± 627.95 mg/L, respectively. However, after flowing out of the Xiaolangdi reservoir, the velocity increased again, causing a large amount of sediment on the riverbed to be resuspended, leading to a rapid increase in SSC. The SSCs at the Huayuankou and Lijin hydrological stations were 1580.63 ± 758.18 mg/L and 2424.38 ± 1561.25 mg/L, respectively.
The coefficient of variation (CV) of SSC had roughly the opposite pattern to that of climatological SSC. The CV was low in the upstream Sanmenxia reservoir and downstream Xiaolangdi reservoir, while it was high in the interval between the Sanmenxia and Xiaolangdi reservoirs (Figure 7b). The spatial distribution of climatological SSC and its CV indicated that the construction of the Sanmenxia and Xiaolangdi reservoirs had an essential impact on sediment transport in the downstream Yellow River.

4.3. Temporal Variations in Sediment Transport

Figure 8 shows the annual and seasonal mean SSC in the downstream Yellow River. We divided the downstream Yellow River into 300 reaches, each with a length of 4.5 km. From 1984 to 2022, the SSC exhibited a significant decrease. The annual mean SSC decreased in 288 river reaches (96%), of which 236 exhibited statistical significance (p < 0.05, Figure 8a). Specifically, the decrease in SSC in the upstream reaches reflected a reduction in the amount of sediment that flowed out of the Loess Plateau. The mean SSCs in the 1980s and the 2020s in this area were 3580.53 ± 2051.45 mg/L and 1563.75 ± 271.36 mg/L, respectively (Table S4). The decrease in the downstream Xiaolangdi hydrological station indicates a significant reduction in the SSC of the downstream Yellow River, especially in the reaches from the Huayuankou to the Lijin hydrological stations. For the Lijin station, the mean Landsat-derived SSCs in the 1980s (1984–1989) and the 2020s (2020–2022) were 3952.90 ± 911.03 mg/L and 1529.14 ± 199.60 mg/L, respectively (Table S4).
Seasonal variation in SSC in the downstream area of the Yellow River was evident, and decreased SSC from 1984 to 2022 mainly occurred in summer and autumn (Figure 8b, Table S5). For the entire downstream Yellow River, the average SSCs in the spring of the 1990s and 2010s were 4795.40 ± 2282.57 mg/L and 2438.83 ± 4212.89 mg/L, respectively. The average SSCs in the summer of the 1990s and 2010s were 9556.65 ± 3512.06 mg/L and 5536.43 ± 2188.77 mg/L, respectively. The average SSCs in the autumn of the 1990s and 2010s were 8791.17 ± 3422.69 mg/L and 1851.59 ± 2495.81 mg/L, respectively. Lastly, the average SSCs in the winter of the 1990s and 2010s were 2794.15 ± 917.43 mg/L and 814.11 ± 158.27 mg/L, respectively. Therefore, with the significant decrease in SSC during summer and autumn, the seasonal variation in SSC in the downstream area of the Yellow River was weakened.
The spatiotemporal variations in SSC in the Sanmenxia and Xiaolangdi reservoirs were inconsistent. For the Sanmenxia reservoir, SSC was lower in winter and spring (December to April), with an average SSC of 1113.94 ± 184.90 mg/L, and significantly higher in summer and autumn (May to October), with an average of 1579.66 ± 213.77 mg/L (Table S6). Moreover, the upstream inflow reach had significantly higher SSC than the downstream outflow reach, with averages of 2729.49 ± 923.19 mg/L and 858.84 ± 235.06 mg/L, respectively (Figure 9). For the Xiaolangdi reservoir, SSC was also lower in winter and spring compared to summer and autumn, with averages of 919.182 ± 297.92 mg/L and 1391.83 ± 222.53 mg/L, respectively (Table S6). The reservoir maintained low SSC in summer and autumn, with high SSC observed only in the reservoir bays (Figure 9). These spatiotemporal variations in SSC reflected different impacts of the Sanmenxia and Xiaolangdi reservoirs on sediment transport in the Yellow River.

5. Discussion

5.1. Uncertainties in Remote SSC Estimation

Only ~10% of the signals received by the satellite sensors were from water bodies; the rest originated mainly from atmospheric scattering. Hence, atmospheric correction is crucial in quantitatively retrieving color-related water parameters [36]. Inland water bodies, such as rivers and lakes, exhibit high turbidity and complex optical characteristics, which no longer satisfy the assumption in standard atmospheric correction algorithms that the water-leaving radiance in the near-infrared band is zero [37]. Although atmospheric correction based on the short-wave infrared band can partly address this issue, there is still a non-negligible water-leaving signal in the short-wave infrared band in extremely turbid water bodies [33]. Moreover, land adjacency effects will significantly impact the total signal in the short-wave infrared band, even in cases where the water-leaving radiance is zero [36]. The water-leaving radiance can be difficult to observe due to the reflection of direct sunlight at the air–water interface (sunglint) in the direction of the satellite’s field of view [38]. These challenges often lead to uncertainties in Rrs after atmospheric correction, which further affects the results of SSC retrieval.
Differences in sediment particle size may contribute to the uncertainties in SSC retrieval. Forget et al. [39] showed that particle size and distribution could influence the Rrs by altering the backscattering coefficient. Shen et al. [40] found that the Rrs in the visible and near-infrared bands for water with small particles (<40 μm) was approximately twice as high as that for water with large particles (>40 μm) with the same SSC, and this difference increased with increasing wavelength. From 1984 to 2022, there have been significant variations in sediment particle size in the downstream Yellow River. The median suspended sediment particle sizes at various stations exhibited low distribution upstream and high distribution downstream; they were around 20 μm before the operation of the Xiaolangdi reservoir, but dramatically decreased to about 6 μm after its operation [41]. Hence, to enhance the accuracy of SSC retrieval in the Yellow River, it is imperative to consider the distribution of sediment particle sizes and its influence on remote sensing models in future studies.
The Rrs products derived from Landsat have been reported to be highly consistent with the measured spectrum of the Amazon and Orinoco rivers, and are available for SSC retrieval [42]. This study used several processes to reduce the influence of atmospheric correction errors on SSC retrieval. On the one hand, the SSC model used was the band ratio, which could implicitly compensate for some uncertainty in Rrs [43]. Since the spectral variation in the backscattering coefficient of suspended sediments is smooth, band ratios can mitigate the impact of differences in sediment particle size on Rrs [44]. On the other hand, we employed the retrieved SSCs of center pixels in each river reach to minimize the impact of land adjacency on Rrs. Moreover, the influence of uncertainty in Rrs was further reduced when the annual and seasonal averages were calculated (Section 4.2 and Section 4.3).

5.2. Driving Forces of Spatiotemporal Variations in SSC Transport

Water flow is a crucial factor influencing sediment transport in the downstream Yellow River. When the water flow is high, sediments are flushed and resuspended, increasing the SSC. Conversely, suspended sediments settle and accumulate, resulting in a decrease in SSC. Globally, SSC in rivers is usually positively correlated with water discharge. Yang et al. [45] and Dai et al. [46] showed a strong positive correlation between SSC and water flow in the middle reach of the Changjiang River, China. Singh et al. [47] also found a significant positive correlation between these two factors in the Tandi segment of the Chandra River, India. For different hydrological stations in the downstream Yellow River, monthly SSC and water flow were both high in summer and autumn, and low in winter and spring (Section 4.3). Moreover, SSC and water discharge exhibited significant correlations during all the seasons, especially at the upstream Sanmenxia hydrological station (Figure 10). However, after the construction of the Xiaolangdi reservoir, the correlation between these two factors decreased at several hydrological stations. At the Xiaolangdi hydrological station, the linear fitting R2 decreased from 0.83 in 1984–1999 to 0.29 in 2000–2022 (Figure 10).
It is reported that the Xiaolangdi reservoir has a minor impact on annual water flow but a significant impact on sediment transport in the downstream Yellow River, leading to a substantial decrease in SSC [48]. The effect of WSR on SSC at Sanmenxia station is relatively minor. During the initial operation of the Xiaolangdi reservoir, it rapidly intercepted 2.40 km3 of sediment, which accumulated in the reservoir and resulted in rapid and pronounced erosion of the downstream riverbed [20]. From 1984 to 2022, the SSC values in the downstream reaches of the Sanmenxia reservoir were lower than those in the upstream reaches, with average values of 1008.42 ± 602.83 mg/L at Sanmenxia, 1177.89 ± 627.95 mg/L at Xiaolangdi, and 2998.33 ± 1221.41 mg/L at upstream Sanmenxia (Figure 11 and Figure 12). Before the construction of the Xiaolangdi reservoir (1984–1999), the SSC at the Xiaolangdi hydrological station was generally higher than that at the Sanmenxia hydrological station. However, after the construction of the Xiaolangdi reservoir (2000–2022), the SSC at the Xiaolangdi hydrological station was generally lower than that at the Sanmenxia hydrological station (Figure 11 and Figure 12), which is consistent with the fact that this reservoir has experienced severe sediment accumulation since its operation, with a total sediment interception of 32.47 × 10⁸ t during 1997–2007 [49]. In comparison, WSR operation reduced sediment accumulation in the downstream channel and facilitated sediment transport in the reservoir area [20].
In addition to the effects of water flow and dam construction, the sediment yield from the Loess Plateau to the downstream Yellow River has significantly decreased in recent decades, influenced by factors such as reduced precipitation and water conservation measures [50]. However, the reduction in sediment yield from the Loess Plateau has a negligible impact on sediment transport in the downstream Yellow River. It has been reported that the regulation of the Xiaolangdi reservoir can explain 90% of the SSC variation [22]. Therefore, the Xiaolangdi reservoir is the key controlling factor in the spatiotemporal variation in SSC transport in the downstream Yellow River.

6. Conclusions

Based on historical hydrological monitoring data, this study constructed a remote sensing model for observing highly turbid SSC in the lower Yellow River, with an MADP of 34.87% and an RMSE of 5643.15 mg/L. Then, the model was applied to Landsat series data from 1984 to 2022. The SSC concentrations in the Sanmenxia and Xiaolangdi reservoirs were low (1008.42 ± 602.83 mg/L and 1177.89 ± 627.95 mg/L, respectively), but the CV values were high. In contrast, the SSC concentrations at the Huayuankou and Lijin stations were high (1580.63 ± 758.18 and 2424.38 ± 1561.25 mg/L), and the CV values were low. During 1984–2022, the SSC values of most reaches (96%) of the lower Yellow River showed decreasing trends, especially from the Xiaolangdi reservoir to the estuary. Moreover, decreased SSC mainly occurred in summer and autumn when SSC values were high, which weakened the seasonal variations in SSC. The Xiaolangdi reservoir also considerably changed sediment transport in the lower Yellow River. This study provides essential references for the spatiotemporal monitoring of sediment dynamics in rivers using long-term archived Landsat data.

Supplementary Materials

The following supporting information can be downloaded at: https://www.mdpi.com/article/10.3390/rs16020229/s1, Figure S1: Comparison of time series data of in situ (in blue) and satellite-derived (in red) SSC at the (a) Sunkou and (b) Luokou Hydrological Stations. Please refer to Figure 1 for the geographical locations of the stations. Figure S2: The inter-calibration of Landsat for the individual channels. Rrs(NIR), Rrs(R), Rrs(G) and Rrs(SWIR) correspond to the Rrs in the near-infrared, red, green, and short-wave infrared bands, respectively. Table S1: Index table of main acronyms. Table S2: The monthly in situ SSC for the four hydrological stations during two periods. The table shows the arithmetic mean values of the measured SSC (Section 2.2). Table S3: Mean Landsat-derived SSC for five stations during 1984-2022. Table S4: Decadal mean Landsat-derived SSC at two stations on the Yellow River. Table S5: Seasonal mean SSC in the entire downstream Yellow River. Table S6: Semiannual mean SSC retrieved from Landsat in two reservoirs.

Author Contributions

Conceptualization, M.D., Z.Q. and D.L.; formal analysis, M.D. and Z.Q.; investigation, M.D., Z.Q., R.L. and K.L.; writing—original draft preparation, M.D. and S.Y.; writing—review and editing, M.D., S.Y. and D.L.; funding acquisition, D.L. All authors have read and agreed to the published version of the manuscript.

Funding

This study was supported by the National Natural Science Foundation of China (Grants, #U2243205, #42271376, and #41901299), the Natural Science Foundation of Jiangsu Province (Grants #BK20220018, and #BK20181102), the Youth Innovation Promotion Association CAS (Grant #2021313), and the NIGLAS Foundation (Grant #E1SL002).

Data Availability Statement

The authors do not have permission to share the data used in this study.

Conflicts of Interest

The authors declare no conflicts of interest.

References

  1. Wang, H.; Yang, Z.; Saito, Y.; Liu, J.P.; Sun, X.; Wang, Y. Stepwise Decreases of the Huanghe (Yellow River) Sediment Load (1950–2005): Impacts of Climate Change and Human Activities. Glob. Planet. Chang. 2007, 57, 331–354. [Google Scholar] [CrossRef]
  2. Pham, Q.; Ha, N.; Pahlevan, N.; Oanh, L.; Nguyen, T.; Nguyen, N. Using Landsat-8 Images for Quantifying Suspended Sediment Concentration in Red River (Northern Vietnam). Remote Sens. 2018, 10, 1841. [Google Scholar] [CrossRef]
  3. Xia, X.; Dong, J.; Wang, M.; Xie, H.; Xia, N.; Li, H.; Zhang, X.; Mou, X.; Wen, J.; Bao, Y. Effect of Water-Sediment Regulation of the Xiaolangdi Reservoir on the Concentrations, Characteristics, and Fluxes of Suspended Sediment and Organic Carbon in the Yellow River. Sci. Total Environ. 2016, 571, 487–497. [Google Scholar] [CrossRef] [PubMed]
  4. Dethier, E.N.; Sartain, S.L.; Lutz, D.A. Heightened Levels and Seasonal Inversion of Riverine Suspended Sediment in a Tropical Biodiversity Hot Spot Due to Artisanal Gold Mining. Proc. Natl. Acad. Sci. USA 2019, 116, 23936–23941. [Google Scholar] [CrossRef] [PubMed]
  5. Gardner, J.; Pavelsky, T.; Topp, S.; Yang, X.; Ross, M.R.V.; Cohen, S. Human Activities Change Suspended Sediment Concentration along Rivers. Environ. Res. Lett. 2023, 18, 064032. [Google Scholar] [CrossRef]
  6. Luo, X.; Wang, J.; Chen, G.; Zhu, S.; Huo, Z.; Liu, X.; Deng, W. Research on Distribution of Suspended Sediment Concentration in Long Time Series Based on Mid-Resolution Imaging Spectrometer Data and Quantile Trend Analysis. Reg. Stud. Mar. Sci. 2020, 39, 101399. [Google Scholar] [CrossRef]
  7. Zhang, C.; Liu, Y.; Chen, X.; Gao, Y. Estimation of Suspended Sediment Concentration in the Yangtze Main Stream Based on Sentinel-2 MSI Data. Remote Sens. 2022, 14, 4446. [Google Scholar] [CrossRef]
  8. Klemas, V.; Bartlett, D.; Philpot, W.; Rogers, R.; Reed, L. Coastal and Estuarine Studies with ERTS-1 and Skylab. Remote Sens. Environ. 1974, 3, 153–174. [Google Scholar] [CrossRef]
  9. Womber, Z.R.; Zimale, F.A.; Kebedew, M.G.; Asers, B.W.; DeLuca, N.M.; Guzman, C.D.; Tilahun, S.A.; Zaitchik, B.F. Estimation of Suspended Sediment Concentration from Remote Sensing and In Situ Measurement over Lake Tana, Ethiopia. Adv. Civ. Eng. 2021, 2021, 9948780. [Google Scholar] [CrossRef]
  10. Wang, W.; Jiang, W. Study on the Seasonal Variation of the Suspended Sediment Distribution and Transportation in the East China Seas Based on SeaWiFS Data. J. Ocean Univ. China 2008, 7, 385–392. [Google Scholar] [CrossRef]
  11. Charoenlerkthawin, W.; Namsai, M.; Bidorn, K.; Rukvichai, C.; Panneerselvam, B.; Bidorn, B. Effects of Dam Construction in the Wang River on Sediment Regimes in the Chao Phraya River Basin. Water 2021, 13, 2146. [Google Scholar] [CrossRef]
  12. Syvitski, J.P.M.; Vörösmarty, C.J.; Kettner, A.J.; Green, P. Impact of Humans on the Flux of Terrestrial Sediment to the Global Coastal Ocean. Science 2005, 308, 376–380. [Google Scholar] [CrossRef]
  13. Gierszewski, P.J.; Habel, M.; Szmańda, J.; Luc, M. Evaluating Effects of Dam Operation on Flow Regimes and Riverbed Adaptation to Those Changes. Sci. Total Environ. 2020, 710, 136202. [Google Scholar] [CrossRef] [PubMed]
  14. Milliman, J.D.; Meade, R.H. World-Wide Delivery of River Sediment to the Oceans. J. Geol. 1983, 91, 1–21. [Google Scholar] [CrossRef]
  15. Liu, S.M.; Li, L.W.; Zhang, G.L.; Liu, Z.; Yu, Z.; Ren, J.L. Impacts of Human Activities on Nutrient Transports in the Huanghe (Yellow River) Estuary. J. Hydrol. 2012, 430–431, 103–110. [Google Scholar] [CrossRef]
  16. Wu, B.; Wang, G.; Xia, J.; Fu, X.; Zhang, Y. Response of Bankfull Discharge to Discharge and Sediment Load in the Lower Yellow River. Geomorphology 2008, 100, 366–376. [Google Scholar] [CrossRef]
  17. Miao, C.; Kong, D.; Wu, J.; Duan, Q. Functional Degradation of the Water–Sediment Regulation Scheme in the Lower Yellow River: Spatial and Temporal Analyses. Sci. Total Environ. 2016, 551–552, 16–22. [Google Scholar] [CrossRef] [PubMed]
  18. He, J.; Zhang, P.; Jing, W.; Yan, Y. Spatial Responses of Net Ecosystem Productivity of the Yellow River Basin under Diurnal Asymmetric Warming. Sustainability 2018, 10, 3646. [Google Scholar] [CrossRef]
  19. Wu, Z.; Zhao, D.; Syvitski, J.P.M.; Saito, Y.; Zhou, J.; Wang, M. Anthropogenic Impacts on the Decreasing Sediment Loads of Nine Major Rivers in China, 1954–2015. Sci. Total Environ. 2020, 739, 139653. [Google Scholar] [CrossRef] [PubMed]
  20. Chu, Z. The Dramatic Changes and Anthropogenic Causes of Erosion and Deposition in the Lower Yellow (Huanghe) River since 1952. Geomorphology 2014, 216, 171–179. [Google Scholar] [CrossRef]
  21. Hou, C.; Yi, Y.; Song, J.; Zhou, Y. Effect of Water-Sediment Regulation Operation on Sediment Grain Size and Nutrient Content in the Lower Yellow River. J. Clean. Prod. 2021, 279, 123533. [Google Scholar] [CrossRef]
  22. Lu, M.; Zhao, Q.; Ding, S.; Wang, S.; Hong, Z.; Jing, Y.; Wang, A. Hydro-Geomorphological Characteristics in Response to the Water-Sediment Regulation Scheme of the Xiaolangdi Dam in the Lower Yellow River. J. Clean. Prod. 2022, 335, 130324. [Google Scholar] [CrossRef]
  23. Liu, M.; Fan, D.; Bi, N.; Sun, X.; Tian, Y. Impact of Water-Sediment Regulation on the Transport of Heavy Metals from the Yellow River to the Sea in 2015. Sci. Total Environ. 2019, 658, 268–279. [Google Scholar] [CrossRef] [PubMed]
  24. Harrigan, S.; Zsoter, E.; Alfieri, L.; Prudhomme, C.; Salamon, P.; Wetterhall, F.; Barnard, C.; Cloke, H.; Pappenberger, F. GloFAS-ERA5 Operational Global River Discharge Reanalysis 1979–Present. Earth Syst. Sci. Data 2020, 12, 2043–2060. [Google Scholar] [CrossRef]
  25. Zou, Z.; Xiao, X.; Dong, J.; Qin, Y.; Doughty, R.B.; Menarguez, M.A.; Zhang, G.; Wang, J. Divergent Trends of Open-Surface Water Body Area in the Contiguous United States from 1984 to 2016. Proc. Natl. Acad. Sci. USA 2018, 115, 3810–3815. [Google Scholar] [CrossRef] [PubMed]
  26. Martinez, M.J.; Cox, A.L. Remote-Sensing Method for Monitoring Suspended-Sediment Concentration on the Middle-Mississippi and Lower-Missouri Rivers. Contemp. Water Res. 2023, 177, 17–30. [Google Scholar] [CrossRef]
  27. Luo, J.; Ni, G.; Zhang, Y.; Wang, K.; Shen, M.; Cao, Z.; Qi, T.; Xiao, Q.; Qiu, Y.; Cai, Y.; et al. A New Technique for Quantifying Algal Bloom, Floating/Emergent and Submerged Vegetation in Eutrophic Shallow Lakes Using Landsat Imagery. Remote Sens. Environ. 2023, 287, 113480. [Google Scholar] [CrossRef]
  28. Han, X.; Chen, X.; Feng, L. Four Decades of Winter Wetland Changes in Poyang Lake Based on Landsat Observations between 1973 and 2013. Remote Sens. Environ. 2015, 156, 426–437. [Google Scholar] [CrossRef]
  29. Sagan, V.; Peterson, K.T.; Maimaitijiang, M.; Sidike, P.; Sloan, J.; Greeling, B.A.; Maalouf, S.; Adams, C. Monitoring Inland Water Quality Using Remote Sensing: Potential and Limitations of Spectral Indices, Bio-Optical Simulations, Machine Learning, and Cloud Computing. Earth-Sci. Rev. 2020, 205, 103187. [Google Scholar] [CrossRef]
  30. Morel, A.; Gentili, B.; Claustre, H.; Babin, M.; Bricaud, A.; Ras, J.; Tièche, F. Optical Properties of the “Clearest” Natural Waters. Limnol. Oceanogr. 2007, 52, 217–229. [Google Scholar] [CrossRef]
  31. Yang, H.; Kong, J.; Hu, H.; Du, Y.; Gao, M.; Chen, F. A Review of Remote Sensing for Water Quality Retrieval: Progress and Challenges. Remote Sens. 2022, 14, 1770. [Google Scholar] [CrossRef]
  32. Wang, F.; Zhou, B.; Liu, X.; Zhou, G.; Zhao, K. Remote-Sensing Inversion Model of Surface Water Suspended Sediment Concentration Based on in Situ Measured Spectrum in Hangzhou Bay, China. Environ. Earth Sci 2012, 67, 1669–1677. [Google Scholar] [CrossRef]
  33. Zhang, M.; Ma, R.; Li, J.; Zhang, B.; Duan, H. A Validation Study of an Improved SWIR Iterative Atmospheric Correction Algorithm for MODIS-Aqua Measurements in Lake Taihu, China. IEEE Trans. Geosci. Remote Sens. 2014, 52, 4686–4695. [Google Scholar] [CrossRef]
  34. Islam, M.R.; Yamaguchi, Y.; Ogawa, K. Suspended Sediment in the Ganges and Brahmaputra Rivers in Bangladesh: Observation from TM and AVHRR Data. Hydrol. Process. 2001, 15, 493–509. [Google Scholar] [CrossRef]
  35. Wang, J.-J.; Lu, X.X.; Liew, S.C.; Zhou, Y. Retrieval of Suspended Sediment Concentrations in Large Turbid Rivers Using Landsat ETM+: An Example from the Yangtze River, China. Earth Surf. Process. Landf. 2009, 34, 1082–1092. [Google Scholar] [CrossRef]
  36. Feng, L.; Hu, C. Land Adjacency Effects on MODIS A qua Top-of-atmosphere Radiance in the Shortwave Infrared: S Tatistical Assessment and Correction. JGR Ocean. 2017, 122, 4802–4818. [Google Scholar] [CrossRef]
  37. Greb, S.; Dekker, A.; Binding, C. Earth Observations in Support of Global Water Quality Monitoring; International Ocean Colour Coordinating Group: Dartmouth, NS, Canada, 2018; ISBN 978-1-896246-67-3. [Google Scholar]
  38. Fell, F. A Contrast Minimization Approach to Remove Sun Glint in Landsat 8 Imagery. Remote Sens. 2022, 14, 4643. [Google Scholar] [CrossRef]
  39. Forget, P.; Ouillon, S.; Lahet, F.; Broche, P. Inversion of Reflectance Spectra of Nonchlorophyllous Turbid Coastal Waters. Remote Sens. Environ. 1999, 68, 264–272. [Google Scholar] [CrossRef]
  40. Shen, F.; Zhou, Y.-X.; Li, J.-F.; Liu, X.-L. Theoretical analysis and experimental observation for the effect of suspended sediment particle size on remote-sensing reflectance: Theoretical analysis and experimental observation for the effect of suspended sediment particle size on remote-sensing reflectance. J. Infrared Millim. Waves 2009, 28, 168–172. [Google Scholar] [CrossRef]
  41. Wang, H.; Bi, N.; Saito, Y.; Wang, Y.; Sun, X.; Zhang, J.; Yang, Z. Recent Changes in Sediment Delivery by the Huanghe (Yellow River) to the Sea: Causes and Environmental Implications in Its Estuary. J. Hydrol. 2010, 391, 302–313. [Google Scholar] [CrossRef]
  42. Dethier, E.N.; Renshaw, C.E.; Magilligan, F.J. Toward Improved Accuracy of Remote Sensing Approaches for Quantifying Suspended Sediment: Implications for Suspended-Sediment Monitoring. JGR Earth Surf. 2020, 125, e2019JF005033. [Google Scholar] [CrossRef]
  43. Hou, X.; Feng, L.; Duan, H.; Chen, X.; Sun, D.; Shi, K. Fifteen-Year Monitoring of the Turbidity Dynamics in Large Lakes and Reservoirs in the Middle and Lower Basin of the Yangtze River, China. Remote Sens. Environ. 2017, 190, 107–121. [Google Scholar] [CrossRef]
  44. Doxaran, D.; Froidefond, J.-M.; Lavender, S.; Castaing, P. Spectral Signature of Highly Turbid Waters Application with SPOT Data to Quantify Suspended Particulate Matter Concentrations. Remote Sens. Environ. 2002, 81, 149–161. [Google Scholar] [CrossRef]
  45. Yang, S.; Ding, P.; Chen, S. Temporal Change in Bed Level of a River Mouth Channel, Yangtze River Mouth: With Emphasis on the Response to River Discharge and Storm. J. Coast. Res. 2001, 297–308. [Google Scholar]
  46. Dai, Z.; Fagherazzi, S.; Mei, X.; Gao, J. Decline in Suspended Sediment Concentration Delivered by the Changjiang (Yangtze) River into the East China Sea between 1956 and 2013. Geomorphology 2016, 268, 123–132. [Google Scholar] [CrossRef]
  47. Singh, A.T.; Sharma, P.; Sharma, C.; Laluraj, C.M.; Patel, L.; Pratap, B.; Oulkar, S.; Thamban, M. Water Discharge and Suspended Sediment Dynamics in the Chandra River, Western Himalaya. J. Earth Syst. Sci. 2020, 129, 206. [Google Scholar] [CrossRef]
  48. Zhang, X.; Qiao, W.; Lu, Y.; Huang, J.; Xiao, Y. Quantitative Analysis of the Influence of the Xiaolangdi Reservoir on Water and Sediment in the Middle and Lower Reaches of the Yellow River. Int. J. Environ. Res. Public Health 2023, 20, 4351. [Google Scholar] [CrossRef]
  49. Peng, J.; Chen, S.; Dong, P. Temporal Variation of Sediment Load in the Yellow River Basin, China, and Its Impacts on the Lower Reaches and the River Delta. Catena 2010, 83, 135–147. [Google Scholar] [CrossRef]
  50. Kong, D.; Miao, C.; Gou, J.; Zhang, Q.; Su, T. Sediment Reduction in the Middle Yellow River Basin over the Past Six Decades: Attribution, Sustainability, and Implications. Sci. Total Environ. 2023, 882, 163475. [Google Scholar] [CrossRef]
Figure 1. Maps of hydrological monitoring stations in the Yellow River basin and downstream area (Sanmenxia: 111.37°E, 34.82°N; Xiaolangdi: 112.41°E, 34.92°N; Huayuankou: 113.67°E, 34.91°N; Lijin: 118.30°E, 37.52°N). The 30 m spatial resolution DEM data of the Space Shuttle Radar Terrain Observation Mission (DEM/SRTM) were obtained from NASA (https://www.earthdata.nasa.gov/, accessed on 22 May 2023). The Yellow River mainstream and watershed boundary data were obtained from the National Basic Geographic Information Center (http://www.ngcc.cn/ngcc/, accessed on 13 February 2023). The base maps in the four sub-panels are true color composite images of OLI/Landsat-8 data (R: Band 4; G: Band 3; B: Band 2).
Remotesensing 16 00229 g001
Figure 2. TM/Landsat-5 spectral curves of waters with different SSCs. The filled rectangles show the bandwidths of five bands (B: blue; G: green; R: red; NIR: near-infrared; and SWIR: short-wave infrared).
Remotesensing 16 00229 g002
Figure 3. Construction and validation of the SSC model. (a) Correlation between log10(SSC) and remote sensing index. (b) Comparison between in situ and satellite-retrieved SSC.
Remotesensing 16 00229 g003
Figure 4. Comparison of time series data of in situ (in blue) and satellite-derived (in red) SSCs at four hydrological stations: Sanmenxia, Xiaolandi, Huayuankou, and Lijin. Please refer to Figure 1 for the geographical locations of the stations.
Remotesensing 16 00229 g004
Figure 5. Comparison and linear fitting of index values from different sensors. (a) ETM+/Landsat-7 vs. TM/Landsat-5. Synchronous images were obtained for the Lijin reach on 3–4 December 2000 and 1–2 September 2001, and for the Sanmenxia reach on 16–17 November 2001 and 3–4 January 2002. (b) ETM+/Landsat-7 vs. OLI/Landsat-8. Synchronous images were obtained for the Lijin reach on 25–26 April 2015 and 17–18 June 2017, and for the Sanmenxia reach on 25–26 December 2015 and 18–19 November 2019.
Remotesensing 16 00229 g005
Figure 6. Monthly mean SSC and water flow from 1984 to 2012 at four hydrological stations (Section 2.2). (a) The arithmetic mean values of the measured SSC. (b) The arithmetic mean values of the measured water flow.
Remotesensing 16 00229 g006
Figure 7. Spatial distribution of Landsat-derived SSC in the lower Yellow River. (a) Climatological SSC along the Yellow River. (b) CV of SSC along the Yellow River. (cf) Climatological SSC at four hydrological stations. Climatological SSC is the arithmetic mean value of Landsat-derived SSC from 1984 to 2022.
Remotesensing 16 00229 g007
Figure 8. Annual and seasonal mean SSC in the downstream Yellow River. (a) Annual mean SSC. (b) Seasonal mean SSC. Each grid refers to a river reach with a length of 4.5 km. SMX, XLD, HYK, and LJ refer to the Sanmenxia, Xiaolangdi, Huayuankou, and Lijin hydrological stations, respectively (Figure 1).
Remotesensing 16 00229 g008
Figure 9. Climatological monthly SSC retrieved from Landsat in two reservoirs located in the lower Yellow River: (a) Sanmenxia reservoir and (b) Xiaolangdi reservoir. The climatological monthly SSC refers to the arithmetic mean of the monthly SSC from 2002 to 2022 retrieved through remote sensing.
Remotesensing 16 00229 g009
Figure 10. The climatological monthly SSC and water flow at the four hydrological stations before and after the construction of the Xiaolangdi reservoir. Climatological SSC is the arithmetic mean value of daily SSC.
Remotesensing 16 00229 g010
Figure 11. Comparison of SSC in the upstream Sanmenxia, the Sanmenxia, and the Xiaolangdi reservoirs. “SSC difference” denotes the difference in SSC values at the inlet and outlet stations of a specific reservoir. The upstream Sanmenxia station is located upstream of the Sanmenxia reservoir. Sanmenxia and Xiaolangdi stations are located downstream of the dams of the two reservoirs, respectively (Figure 1). Specifically, for the Sanmenxia reservoir, the inlet and outlet stations are the upstream Sanmenxia and Sanmenxia stations, respectively; the inlet and outlet stations of the Xiaolangdi reservoir are Sanmenxia and Xiaolangdi stations, respectively.
Remotesensing 16 00229 g011
Figure 12. Landsat-derived average SSCs of hydrological stations in four time periods. The upstream Sanmenxia station is located upstream of the Sanmenxia reservoir. Sanmenxia and Xiaolangdi stations are located downstream of the dams of the two reservoirs, respectively. Please refer to Figure 1 for the geographical locations.
Remotesensing 16 00229 g012
Table 1. The inversion model for river SSC based on Landsat (NIR, G, R, and SWIR represent the Rrs of Landsat series data in the near-infrared, green, red, and short-wave near-infrared bands, respectively).
ReferenceStudy Area
(SSC, mg/L)
Sensor/SatelliteFormulasCoefficientR2
a0a1
[34]Ganges and
Brahmaputra
(0–1200)
TM/Landsat-5SSC = a0 + a1 × G−14,997100,0260.20
[35]Middle–upper Changjiang River (22.0–2610)ETM+/Landsat-7ln (SSC) = a0 + a1 × ln (NIR)12.722.900.68
[2]Northern Vietnam
(22.4–178.0)
OLI/Landsat-8SSC = a0 × exp (a1 × (G/B))0.267.460.44
This StudyDownstream
Yellow River
(233.0–39,100)
TM/Landsat-5log10 (SSC) = a0 + a1 × NIR/(G + R + SWIR)4.491.280.86
Disclaimer/Publisher’s Note: The statements, opinions and data contained in all publications are solely those of the individual author(s) and contributor(s) and not of MDPI and/or the editor(s). MDPI and/or the editor(s) disclaim responsibility for any injury to people or property resulting from any ideas, methods, instructions or products referred to in the content.

