Article

Assessment of Radio Frequency Compatibility for New Radio Navigation Satellite Service Signal Design in the L6-Band

1
Autonomous Navigation Laboratory, Department of Electrical and Computer Engineering, Inha University, Incheon 22212, Republic of Korea
2
Satellite Navigation Research Section, Electronic and Telecommunications Research Institute, Daejeon 34129, Republic of Korea
3
Department of Electrical Engineering, Inha University, Incheon 22212, Republic of Korea
*
Author to whom correspondence should be addressed.
Remote Sens. 2024, 16(2), 319; https://doi.org/10.3390/rs16020319
Submission received: 14 November 2023 / Revised: 4 January 2024 / Accepted: 7 January 2024 / Published: 12 January 2024
(This article belongs to the Special Issue Multi-GNSS: Methods, Challenges, and Applications)

Abstract

:
The L- and S-bands are becoming increasingly congested with the modernization of radio navigation satellite service (RNSS) systems and the development of a new satellite navigation system. In order to solve the problem of frequency band congestion, compatibility performance assessment is essential when designing a new RNSS signal. This paper proposes a three-step compatibility assessment methodology for the design of new RNSS signals and evaluates the compatibility performance of L6-band signals based on the proposed methodology. The open signals of Galileo, the BeiDou Navigation Satellite System (BDS), and the Quasi-Zenith Satellite System (QZSS), as well as the three candidate signals of the new RNSS, are considered for the compatibility assessment. Based on the assessment results, this paper shows that the interference caused by the introduction of a new RNSS signal in the L6-band is tolerable.

1. Introduction

The importance of positioning, navigation, and timing (PNT) information provided by satellite-based navigation systems is increasing, and the dependency of modern human life on that is also growing. As a result, many space powerhouses, such as the United States, Russia, the European Union, and China, are striving to operate and modernize their global navigation satellite systems (GNSSs). In addition, Japan and India are operating regional satellite navigation systems. Following this trend, South Korea has also begun to develop a Korean Positioning System (KPS), which is composed of eight satellites in two types of orbits, for full operational capability from 2035 as a goal, to provide precise PNT information to the Korean Peninsula and neighboring regions [1,2].
These satellite navigation systems should operate only in frequency bands allocated to radio navigation satellite service (RNSS) or radio determination satellite service (RDSS) regulated by the International Telecommunication Union (ITU) [3]. Most of the navigation signals are transmitted in the L-band (1164–1300 MHz, 1559–1610 MHz), and only Navigation with Indian Constellation (NavIC) uses the S-band (2483.5–2500 MHz) [4,5].
Meanwhile, the L- and S-bands are becoming increasingly congested because of the modernization of existing RNSS and the development of new satellite navigation systems, which can affect service performance by increasing the amount of interference between navigation signals. Therefore, interoperability and compatibility are essential in developing and modernizing navigation satellite systems. This means that when designing a new navigation signal, the signal design should be performed carefully so that the PNT service can be used independently or together without interfering with the existing RNSS signals.
The ITU provides an interference coordination methodology through radio regulations to share limited frequency resources. The detailed descriptions of the performance index and compatibility assessment methodology that can be used when evaluating the compatibility performance between RNSS signals is provided by the ITU [6]. Several studies were conducted based on ref. [6], and the interference assessment was performed using analytical approaches in these studies [7,8,9,10]. Field tests are challenging because the compatibility assessment is usually performed in the signal design phase rather than the system operation phase.
The analytical approach allows us to quickly examine the results of different scenarios. It is effective for assessing the approximate impact before evaluating the actual numerical interference. However, it cannot provide the same level of accuracy in comparison to actual results. For example, the power spectral density (PSD) calculated though the analytical approach is derived based on the assumption that the pseudo random noise (PRN) code of the signal is an ideal random code of infinite length. In the case of L1C/A, the PSD of the actual signal shows periodic spectral lines because of the 1023 chip length and the 20 ms periodic navigation messages, which make it different from the ideal case. If there is a difference between the analytical PSD and the actual PSD, the compatibility performance assessment results calculated based on the analytical PSD will yield different results from those calculated based on the actual one [11,12,13]. This limitation of the analytical approach can be resolved through a numerical approach, but this has the disadvantage of requiring significant computation and time. This is because the simulation must be performed by generating realistic navigation signals. In addition, it still has the disadvantage of not being able to reflect the effects of satellite payload and channels.
To overcome the limitations of the analytical and numerical approaches commonly used in compatibility assessments, ref. [14] proposed a step-by-step procedure for compatibility assessments, consisting of three stages, i.e., analytical simulation, numerical simulation, and software/hardware integration testing. The last step, software/hardware integration testing, involves the use of hardware devices for signal transmission and reception. It is significant in that it is the first approach to actually design and exploit a single-channel RNSS receiver, even in the signal design phase, thereby being able to test the tracking performance of the designed signal candidates. Early works in this regard [15,16] performed compatibility assessments using the step-by-step procedure to select navigation signal candidates for the new RNSS in the L6-band that was originally designed to cover the Korean Peninsular region. However, there are still limitations, in that the compatibility assessments were performed without considering satellite orbits, and the impact of existing RNSSs on the new RNSS cannot be assessed.
This paper extends the works in refs [14,15,16] for analytical and numerical compatibility analyses by performing a compatibility assessment considering satellite orbits. In addition, to evaluate the impact of existing RNSSs on the new RNSS in the software/hardware integration test, the evaluation is performed using a AutoNav software-defined radio (SDR) (Version 6) with high reconfigurability [17]. This paper aims to supplement the compatibility evaluation methodology of previous studies and assess the impact of interference between existing RNSS signals and new RNSS signal candidates.
This paper is organized as follows. First, the step-by-step compatibility evaluation methodology is described. Then, the set-up for the compatibility experiments is described, followed by an evaluation of the results. Finally, the paper is concluded in the Section 5.

2. Methodology

Figure 1 briefly shows the step-by-step radio frequency (RF) compatibility assessment methodology used in this paper. The first step in the compatibility assessment is to analyze the compatibility performance of RNSS signals through an analytical approach. The RF compatibility methodology follows ref. [6] provided by the ITU.
The second step is to apply a numerical approach, which involves comparing the compatibility results of the different approaches. For this purpose, the RNSS signals that are considered in the assessment are generated in a numerical way. The numerical figures of merit (FoMs) can be calculated based on the generated signals, and these numerical FoM results are compared with the analytical FoM results, which allows us to see the differences derived from the analytical and numerical PSDs.
The signals generated in the second step are not only used to calculate the numerical FoMs but are also used in the final step, i.e., the software/hardware integration test. This step assesses the compatibility performance by simulating the environment between a satellite and a receiver using software and hardware. Because of the limitations of the hardware specification and the single channel effects, it is not possible to fully simulate the payload and channel effects, but it is still beneficial that these effects can be roughly evaluated. The following subsections describe each approach applied in this paper in more detail.

2.1. Analytical Simulation

The ITU recommends an effective carrier-to-noise density ratio ( C / N 0 , e f f ) as an FoM for the compatibility assessment performance between RNSS signals [6], where C / N 0 , e f f is the signal-to-noise density ratio measured at the receiver input and is an indicator for measuring the receiver’s operating performance by considering the receiver’s RF front-end bandwidth and the influence of interference signals. Higher values indicate a better signal quality, defined as follows [6]:
C / N 0 , e f f = C N 0 + I x ,
where C is the received power of the desired signal (in watts) over infinite bandwidth, N 0 is the PSD of the thermal noise (in W/Hz), and I x   ( I I n t r a   o r   I I n t e r ) is the equivalent noise PSD of the interference signals. If there is only interference from the same system, I x is expressed as I I n t r a . However, if interference from the other system is the only presence, I x is expressed as I I n t e r . When both systems transmit interference, I x is expressed as I I n t r a + I I n t e r .
C / N 0 , e f f by itself is not a good indicator of the degree of degradation because of interference. Therefore, it is usually analyzed in conjunction with the amount of C / N 0 , e f f degradation ( C / N 0 , e f f ) , where C / N 0 , e f f can be obtained as the difference between the C / N 0 , e f f values in the absence and presence of interference from other systems, according to Equation (2). The amount of C / N 0 , e f f used to evaluate the effect of interference caused by the intersystem is expressed as follows [6]:
C / N 0 , e f f = C N 0 + I I n t r a C N 0 + I I n t r a + I I n t e r = 1 + I I n t e r N 0 + I I n t r a
The interference PSD I x depends on the location of the i -th receiver at time t and is defined as follows [6]:
I i , x ( t ) = n = 1 N β n P i , n R ( t ) L n ,
where I i , x ( t ) is the aggregate interference PSD to a desired signal from all the signals within a x -type system (intersystem or intrasystem) at the location of the i -th receiver at time t , N is the total number of interference signals in the x -type system, β n is the spectral separation coefficient (SSC) between the desired signal and the n -th interference signal, P i , n R ( t ) is the received power of the n -th interference signal at the location of the i -th receiver at time t , and L n is the processing loss for the n -th interference signal.
β n are the FoMs representing the degree of separation between the desired signal and the interference signal, and smaller values indicate less of an interference effect on the desired signal. Assuming that the receiver filter is an ideal band pass filter with bandwidth B r , the SSC is defined as follows [6]:
β n = B r / 2 B r / 2 S ¯ s f S ¯ n f d f ,
with:
S ¯ f = S f B t / 2 B t / 2 S f d f f B t 2 0 e l s e w h e r e
where S ¯ s f and S ¯ n f are the PSDs of the desired signal and interference signal, respectively, normalized by the transmission bandwidth, B t , of each signal, and S f is the PSD of the unfiltered signal normalized over an infinite bandwidth.
P i , n R t is defined as shown in Equation (6) and consists of the transmitted power, antenna gain pattern, and various loss terms [6].
P i , n R ( t ) = P n T m = 1 M i ( t ) G i , m T ( t ) G i , m R ( t ) L d i s t ,   i , m ( t ) L a t m L p o l ,
where P n T is the transmitted power of the n -th interference signal; M i ( t ) is the number of visible satellites at the location of the i -th receiver at time t ; G i , m T ( t ) , and G i , m R ( t ) are the transmit-antenna gain and the receive-antenna gain to the location of the i -th receiver at time t , respectively; L d i s t ,   i , m t is the path loss from the m -th satellite to the i -th receiver; L a t m is the atmospheric loss; and L p o l is the polarization mismatch loss.
Meanwhile, as shown in Equation (3), the compatibility evaluation results depend on the geometric arrangement of the receiver and the satellites. Hence, the simulation considering all the locations and times will take significant computation time. Therefore, ref. [6] proposes an aggregate gain factor ( G a g g , n ) to avoid repetitive calculations. G a g g , n is defined as follows [6]:
G a g g , n = m a x a l l   i [ m a x a l l   t ( P i , n R ( t ) ) ] P n ,   m a x R ,
where P n ,   m a x R is the maximum signal power of the n -th interference signal from any single satellite at all the locations and times considered in the simulation.
The proposed factor, G a g g , n , is the worst-case result for all receiver locations and times considered in the simulation. Re-writing Equation (3) to reflect Equation (7), the interference PSD from all interference signals can be limited as follows:
I x , m a x = n = 1 N G a g g , n β n P n ,   m a x R L n
The result of Equation (8) is finally substituted into Equation (2), and the result of Equation (2) is the maximum C / N 0 , e f f that can be experienced at any simulation time and at any receiver location.

2.2. Numerical Simulation

The numerical simulation refers to the process of generating signals numerically and calculating the FoM using the generated signals. In this paper, a MATLAB-based signal generation tool introduced in ref. [18] is used for numerical simulations. The simulator considers the geometric arrangement of the satellites and the receiver to generate the signals, and for this purpose, it uses the RNSS orbit information, the user’s location, and the surrounding environmental conditions as input parameters. Based on the input parameters, the final output is an intermediated frequency (IF) signal file that considers the satellite orbit and timing information, and a baseband signal file is also obtained as an intermediate result. The baseband signal file generated by the simulator is used to calculate the numerical FoM. Then, the numerical FoM calculation is performed based on the PSD of the generated baseband signal, and the calculated FoM is compared to the theoretical FoM obtained through an analytical approach. This allows us to see the differences in the results obtained using the two approaches. The final result of the simulator, the IF numerical signal, is used as an input to the transmission hardware in the software/hardware integrated test, which is discussed in the following section.

2.3. Software/Hardware Integration Test

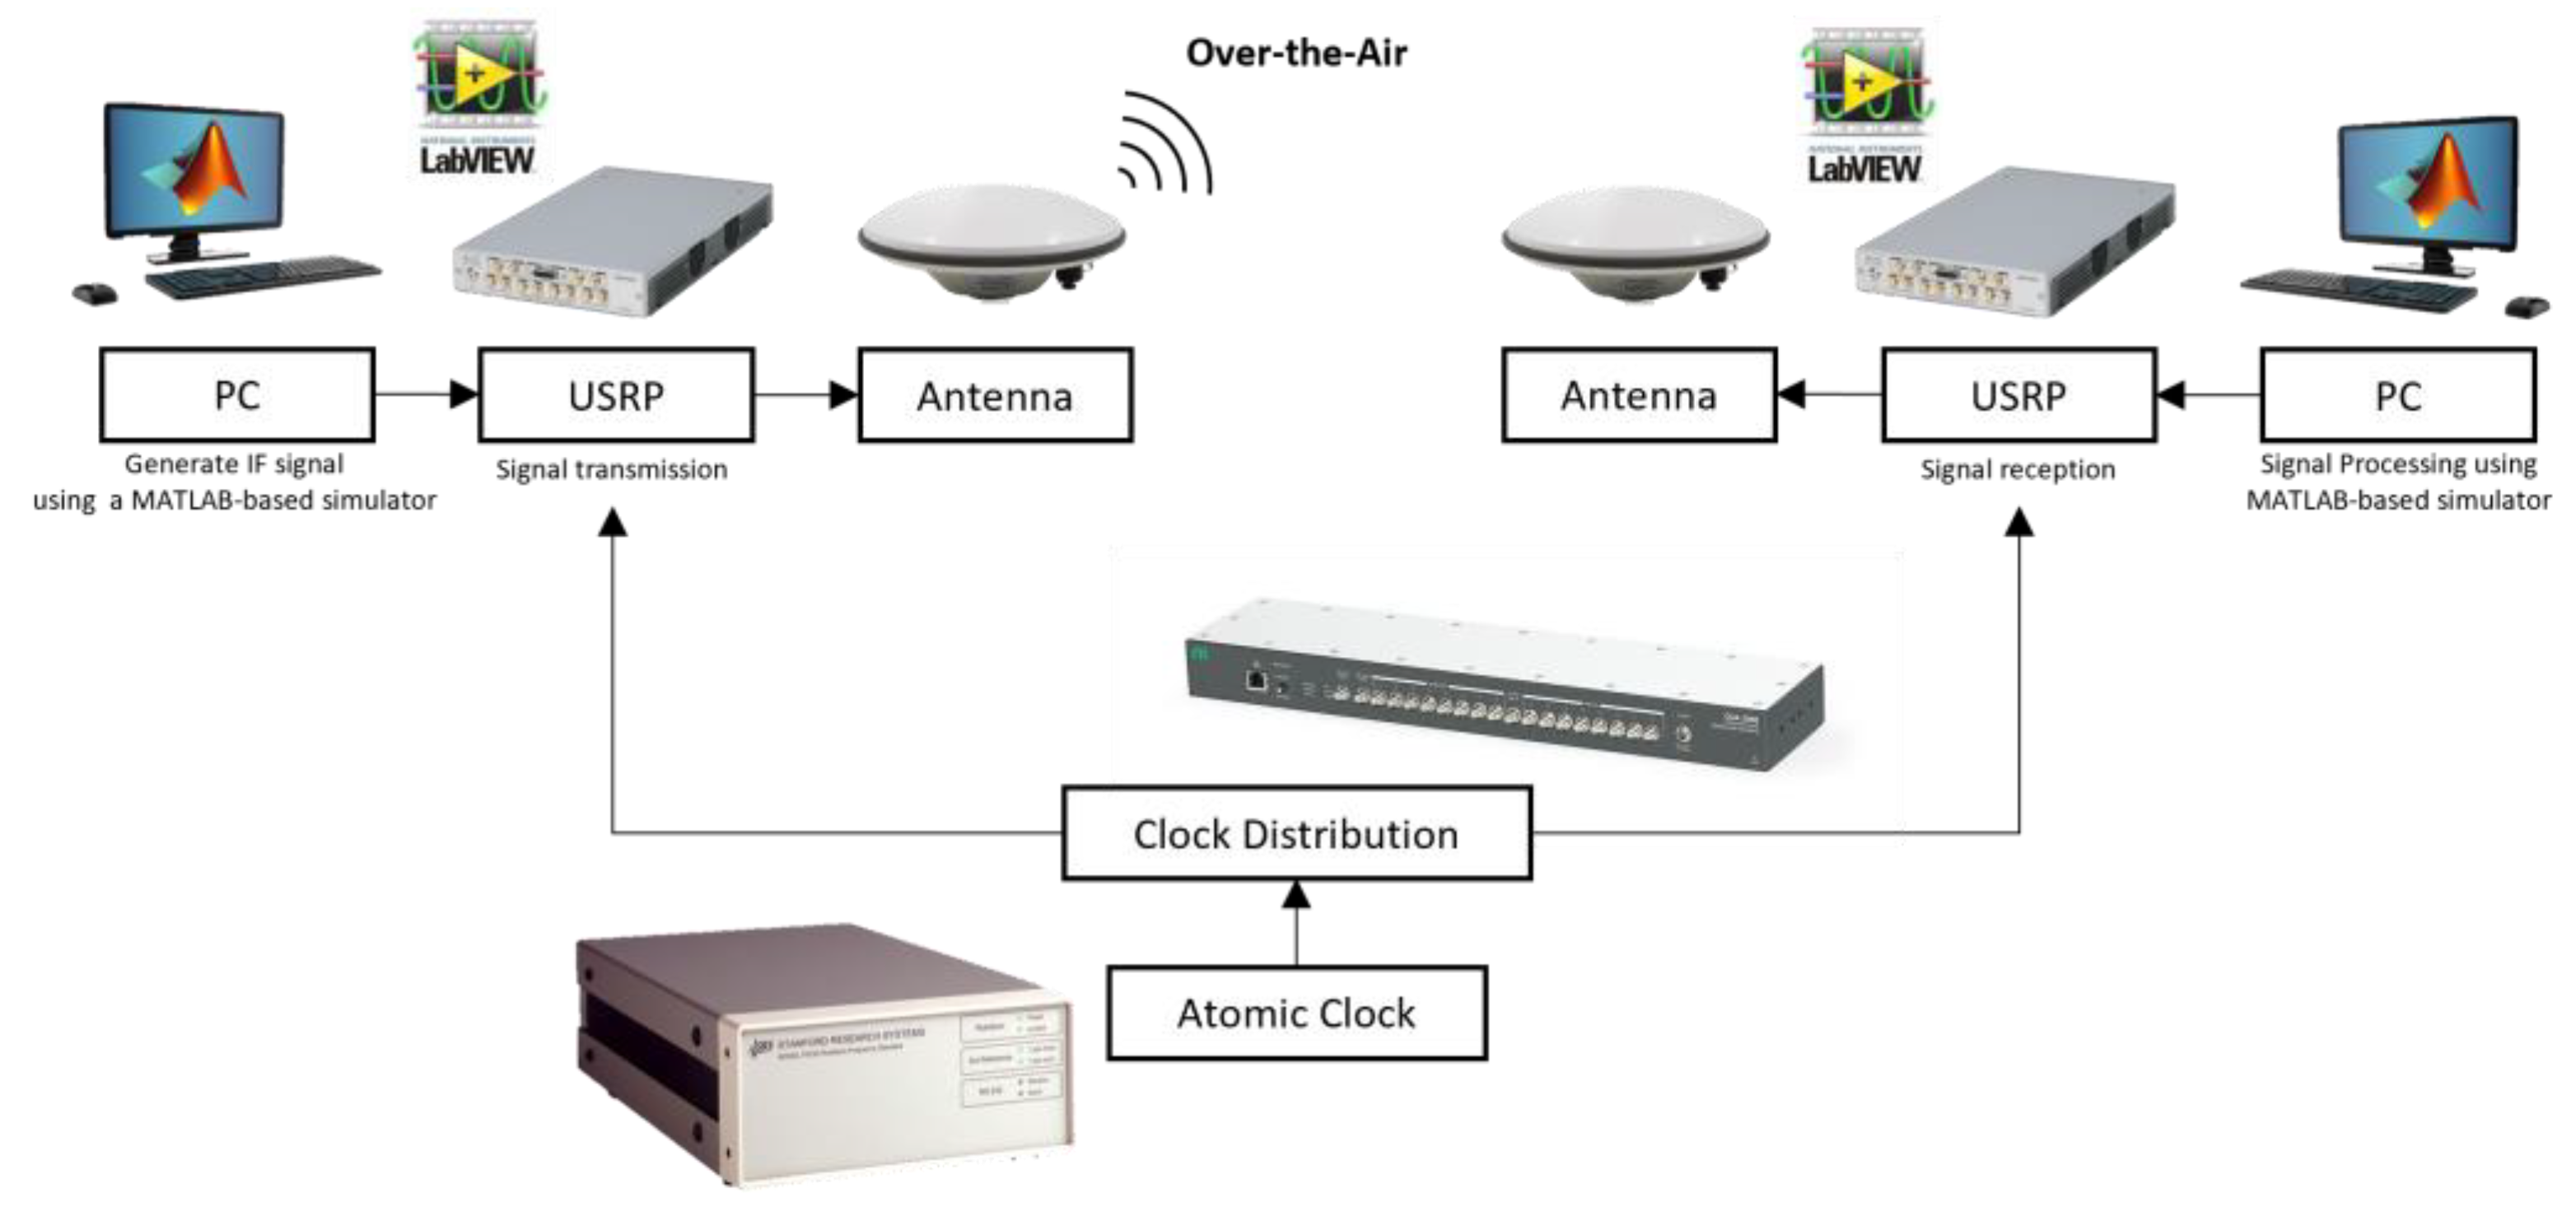
The software/hardware integration test is the step of using software and hardware to evaluate the compatibility performance of signals. Figure 2 shows the software/hardware integrated test environment in the laboratory configured for assessment in this paper. As shown in the figure, the basic method of testing is to transmit and receive signals generated by the simulator through hardware and to process the received signals through the simulator again. The RF signal transmission and reception are carried out using a pair of universal software radio peripherals (USRPs), specifically the 2944R model, due to their flexibility in terms of center frequency and sampling rate. An atomic clock imitates a high-quality satellite on-board clock. All the required signals, including both new and legacy signals, are combined at the IF level (i.e., after being generated by the simulator) and transmitted through a single path. The signals are transmitted and received over the air by a pair of antennas. As the test set was configured within the laboratory, the distance between the antennas was only a few meters. However, it is still meaningful as an initial test environment because the signals pass through the actual RF components and the air, which affect the signals and create more realistic testing conditions.
The use of commercial software receivers is challenged by the need to work for new RNSS signals that have not yet been designed. Therefore, a fully reconfigurable SDR, which is designed to be freely tunable by letting the user’s arbitrary settings directly determine the SDR behavioral characteristics, is employed in this paper [17].
In order to perform the compatibility assessment of the desired signal, the experiment shown in Figure 2 must be performed twice. This is because C / N 0 , e f f can be obtained as the difference between C / N 0 , e f f in the absence of interference and C / N 0 , e f f in the presence of interference. Then, we can intuitively see how much the interfering signal degrades the signal quality of the desired signal.

3. Simulation Parameters

3.1. L6-Band Signals

Table 1 shows the characteristics of the signals considered for the compatibility assessment in the L6-band. Therefore, the legacy open service signals existing in the L6-band, such as Galileo, the BeiDou Navigation Satellite System (BDS), the Quasi-Zenith Satellite System (QZSS), and the three candidate signals (CS) of the new RNSS are used for the compatibility assessment, where the characteristics of the legacy signals were referred to in the interface control document (ICD) provided in refs [19,20,21]. It is noted that in this paper, only open service signals such as binary phase shift keying (BPSK) (1), sine-phased binary offset carriers (BOCs) (1,1), and BPSK (5) are taken into account for the candidate signals of new RNSS, where the numbers in parenthesis represent the code chip rate in multiples of 1.023 MHz for BPSK, and the primary code chip rate and the subcarrier frequency in the same manner for BOCs. Since the PRN code generation algorithm of the new RNSS has not been determined, a random sequence with a length of 10,230 chips is generated. The PRN length is the main parameter for determining the shape of the PSD. The short length of the PRN code dominantly affects the difference between the analytical and numerical PSDs. Therefore, to eliminate this effect, the code length of the new RNSS signals is set to 10,230 chips, which is the longest code length used in modernized navigation signals.

3.2. Space Constellation

Table 2 shows the satellite orbit parameters of Galileo, BDS, and QZSS, together with the new RNSS. We used the almanac information provided in refs [22,23,24] for the legacy RNSS system. For QZSS, we used the almanac to reflect the satellite constellation expansion plan [25]. And the orbital parameters of the new RNSS system given in refs [1,26,27,28] are used in this paper.

4. Results

4.1. Analytical Simulations

Analytical simulations in the L6 band are performed for combinations of the three legacy signals and three CS in 12 scenarios. Table 3 summarizes these 12 scenarios, where the desired signal and the interference signal are indicated correspondingly. We evaluate the interference effect of the legacy systems on the candidate signals of the new RNSS and vice versa.
To calculate the C / N 0 , e f f for the compatibility assessment, calculating the interference PSD according to Equation (1) is essential. The interference PSD is derived depending on the SSC according to Equation (3). Table 4 shows the SSC results between the signals considered in the compatibility assessment. The transmission bandwidth, B t , of Galileo, BDS, and QZSS use the reference bandwidths provided by the ICD; the values are 40 MHz, 20.46 MHz, and 42 MHz, respectively. In the case of new RNSS, it is set to 40 MHz. The receiver bandwidth, B r , is set to 20.46 MHz; that is, the minimum bandwidth where the main lobe of all the signals considered for the compatibility assessment can be received.
The SSC has a lower value as the spectral separation between the desired and interference signals increases. Therefore, the interference source with the most significant influence on the desired signal is the same signal transmitted from another satellite of the same system. Most navigation signals have a higher self-SSC value than SSCs between other system signals. Accordingly, the diagonal components of Table 4 generally have large values in each row and column. However, if the interference signal has a narrow bandwidth compared to the bandwidth of the desired signal, it may have a larger SSC than the self-SSC. When the jamming signal is present in the main peak of the navigation signal, this is the same reason why the pulse wave has a more significant interference effect than the band-limited white noise (BLWN). Assuming that the amount of interference power between the two jamming signals is the same within a limited bandwidth, the pulse wave (narrowband interference), compared to the BLWN (i.e., broadband interference) intensively affects the main peak of the navigation signal PSD. This is confirmed when the desired signal is E6-B/C or L62, and the interference signal is CS1 or CS2 of the new RNSS.
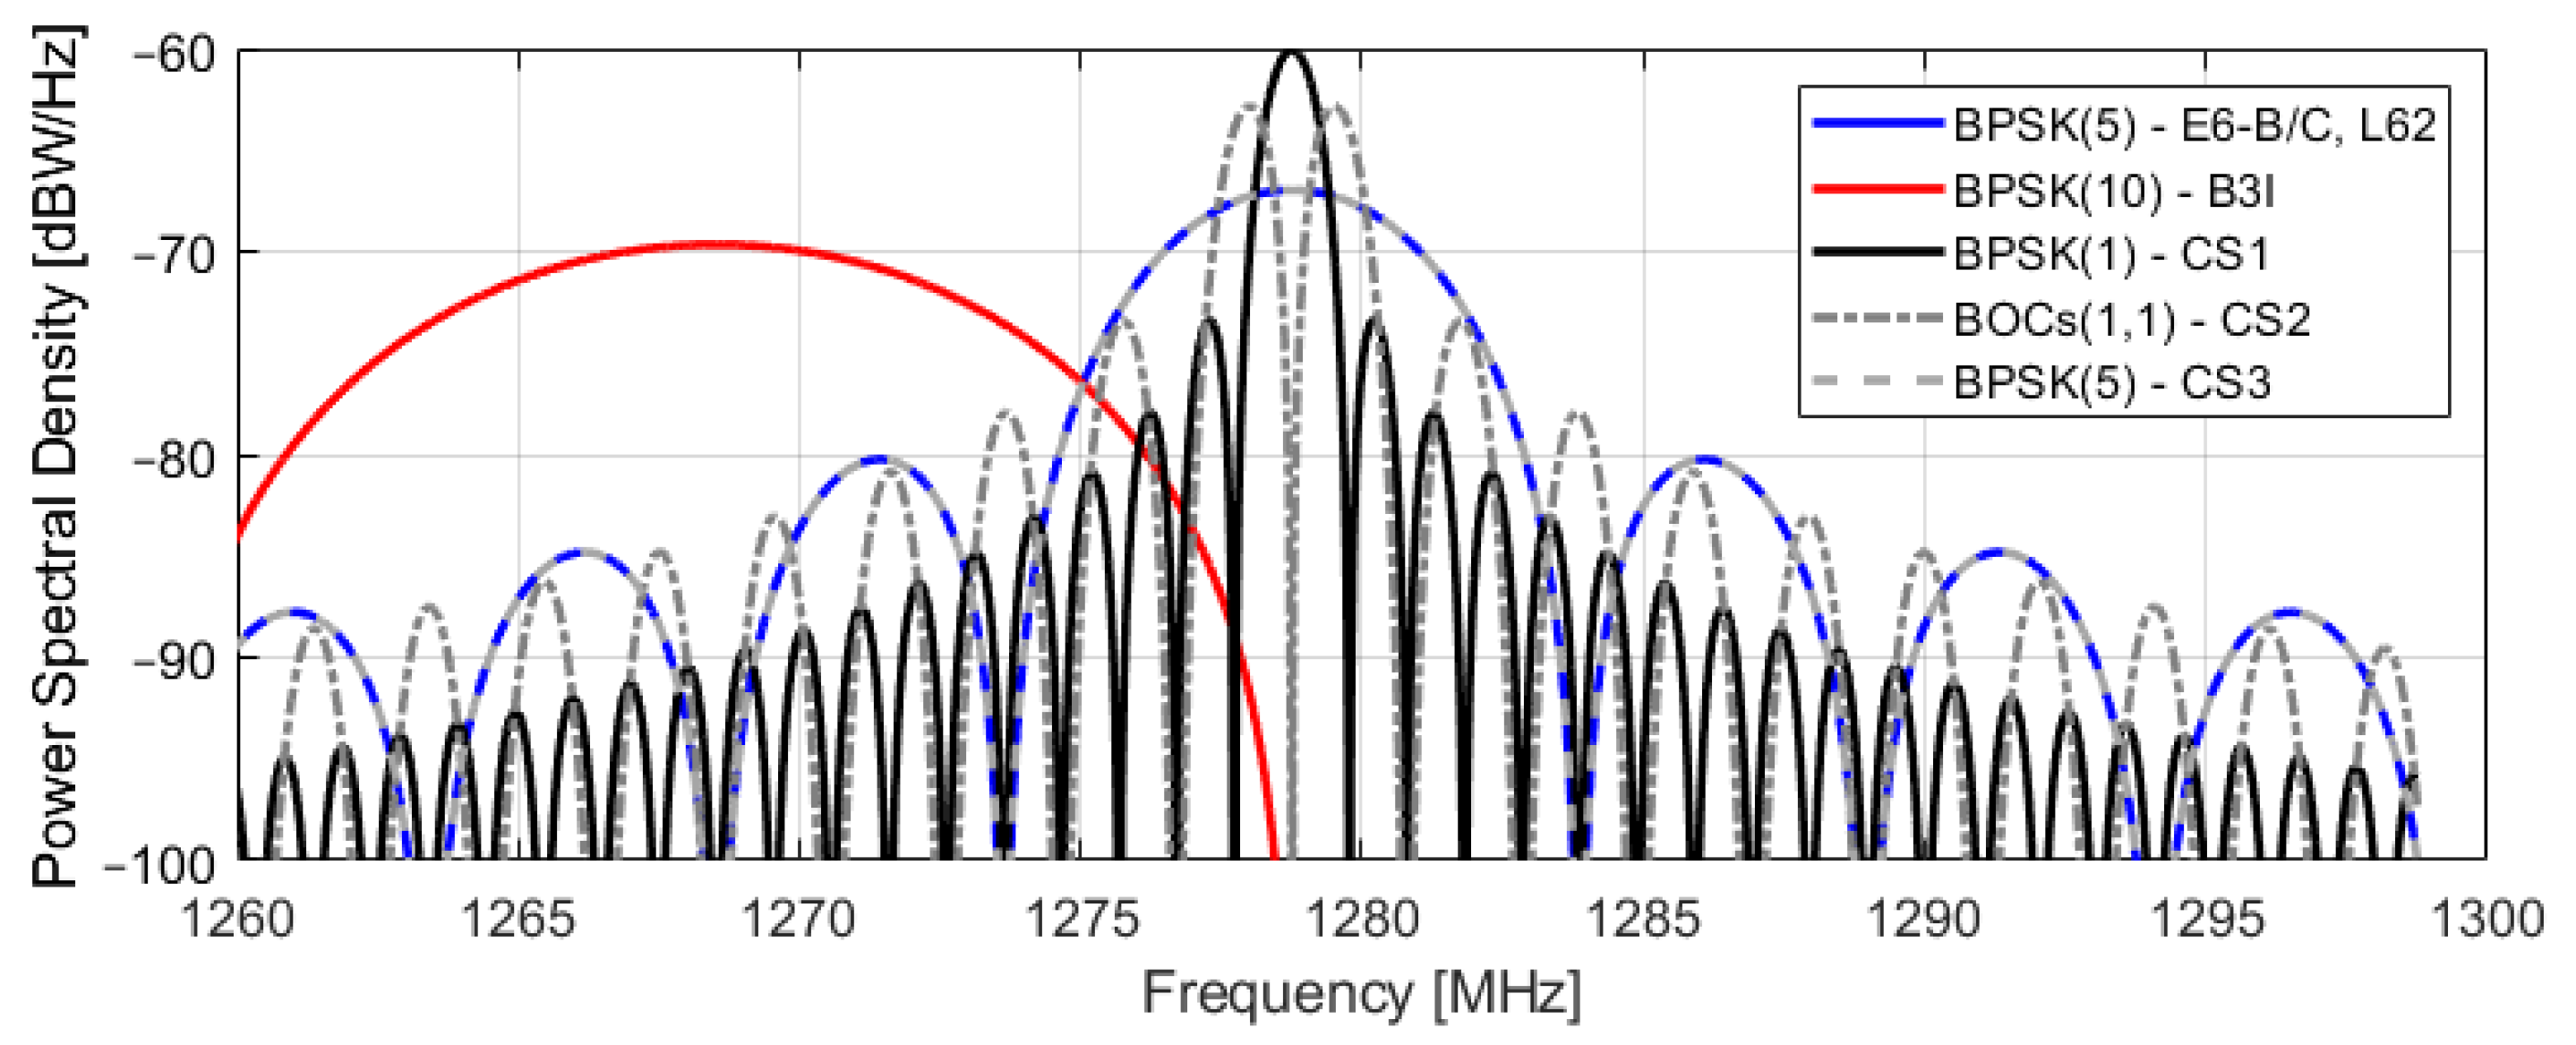
It can also be seen that there is a difference in the values of the self-SSC, even though the waveforms of E6-B/C and L62 are same, because the B t of the two signals is set differently. The SSC between B3I and the other signals is relatively low because it has a center frequency that is different from that of other systems in the same frequency band. Figure 3 shows the analytical PSD of the signals considered in the compatibility assessment, showing the spectral separation between the signals visually.
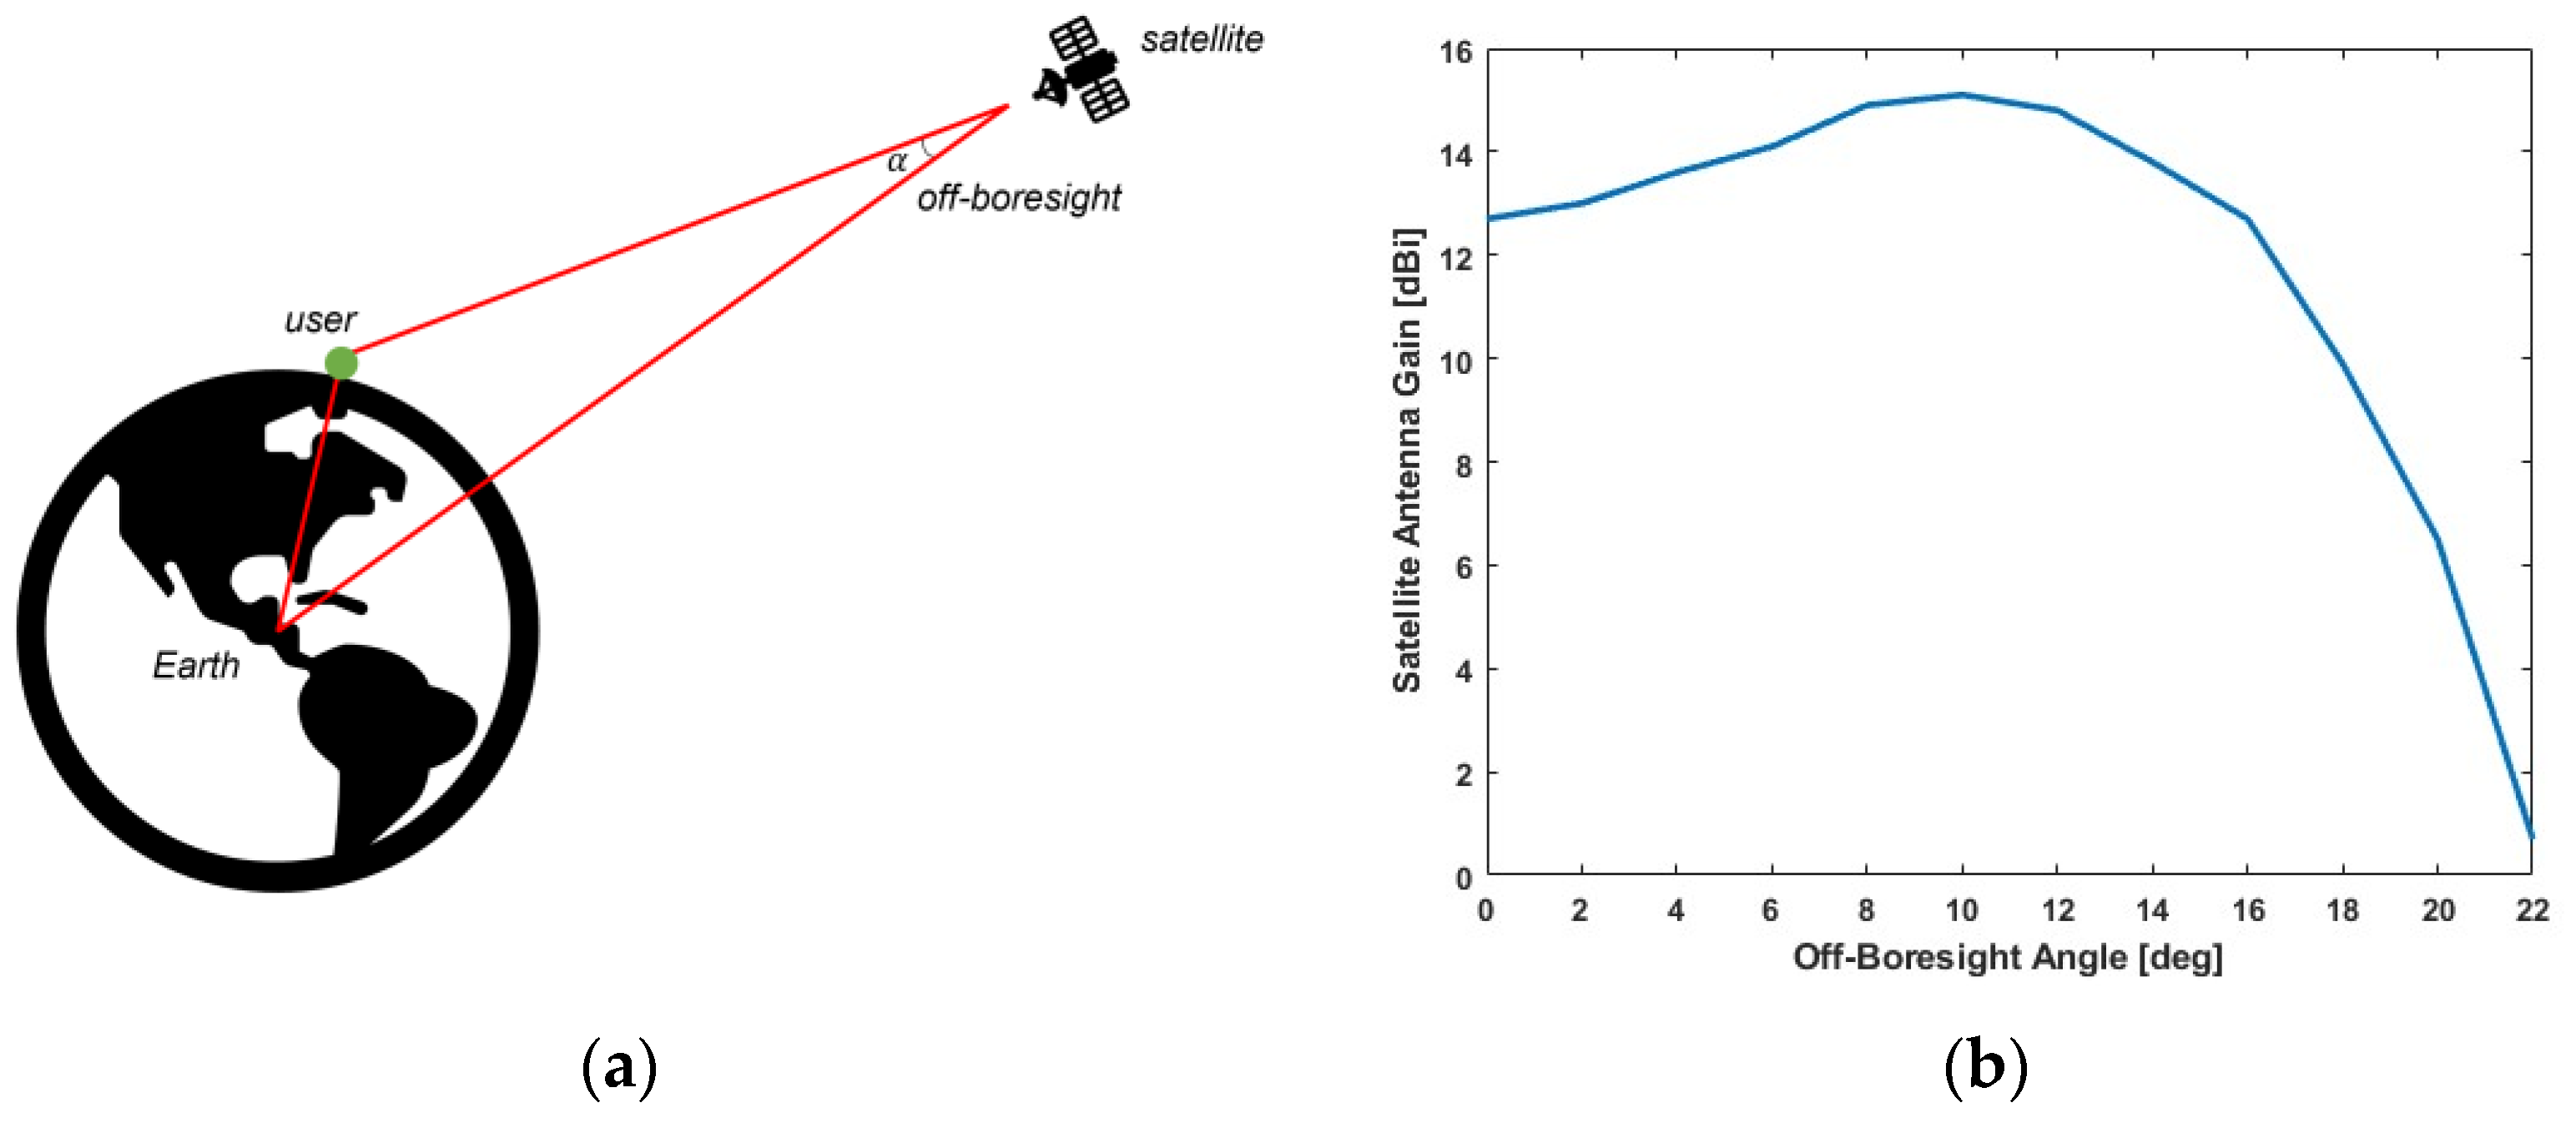
Table 5 shows the simulation settings for calculating the maximum aggregate gain factor in Equation (7). The simulation is performed every 10 min for a day at each receiver position with a latitude/longitude resolution of 1 degree, and the elevation mask angle is set to 5 degrees. The satellite antenna gains of all Galileo satellites and the medium earth orbit (MEO) satellites of BDS for global services are set according to the off-boresight angle to have a uniform receiving power on the ground, as shown in Figure 4 [12], whereas those of the geostationary orbit (GEO)/inclined geosynchronous orbit (IGSO) satellites of BDS, QZSS, and the new RNSS for regional services are set to a constant of 16 dBi for all off-boresight angles.
The distance loss, L d i s t , is obtained using a well-known equation as follows [28]:
L d i s t = 10 log 10 c 4 π d f c 2 ,
where c is the speed of light, d is the distance between the satellite and the receiver, and f c is the center frequency. The remaining loss terms, such as polarization, atmosphere, and processing losses, are set appropriately [29,30]. Finally, the transmission power of each signal is obtained from the minimum received power through link budget calculations. For legacy systems, the minimum received power given in refs [19,20,21] is used, and for the new RNSS, the minimum received signal power of −157 dBW is used.
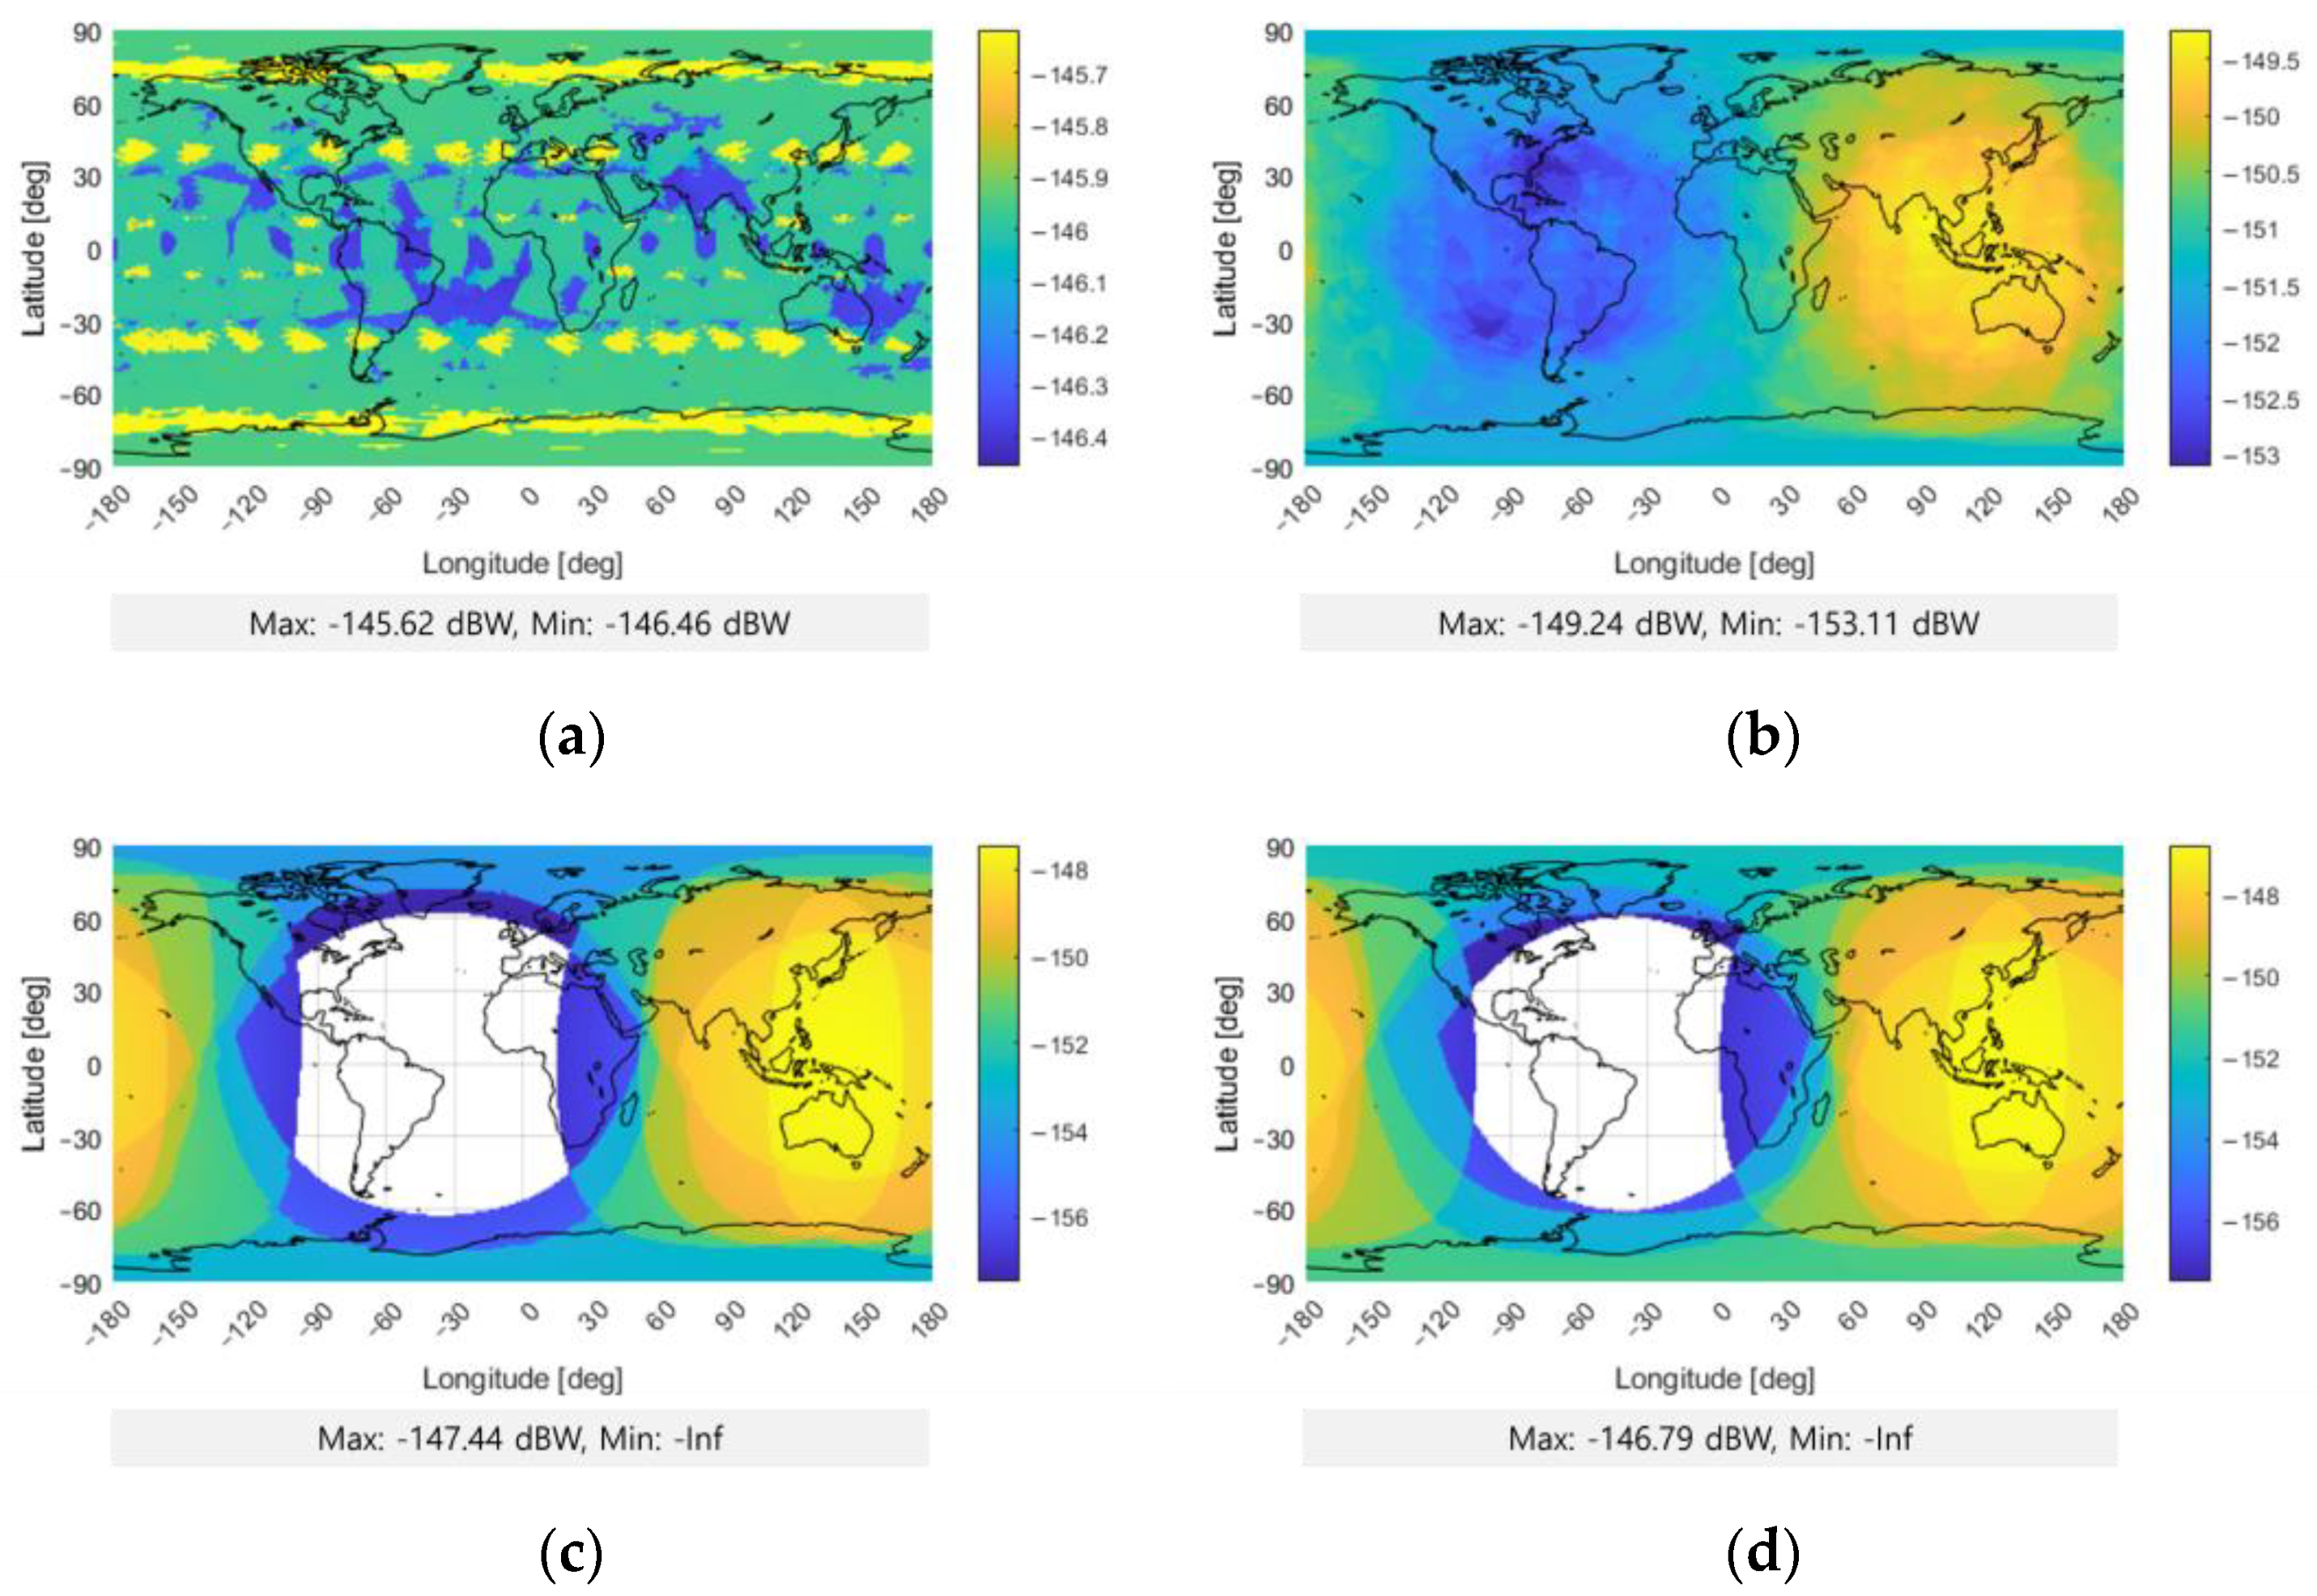
Figure 5 shows the maximum aggregate power of each system according to the receiver location. The patterns in the figure show that the Galileo satellites are evenly distributed across the globe, and QZSS and new RNSS satellites are concentrated in their service areas, as expected. In the case of BDS, having evolved from a local to a global system, it has the characteristics of both systems.
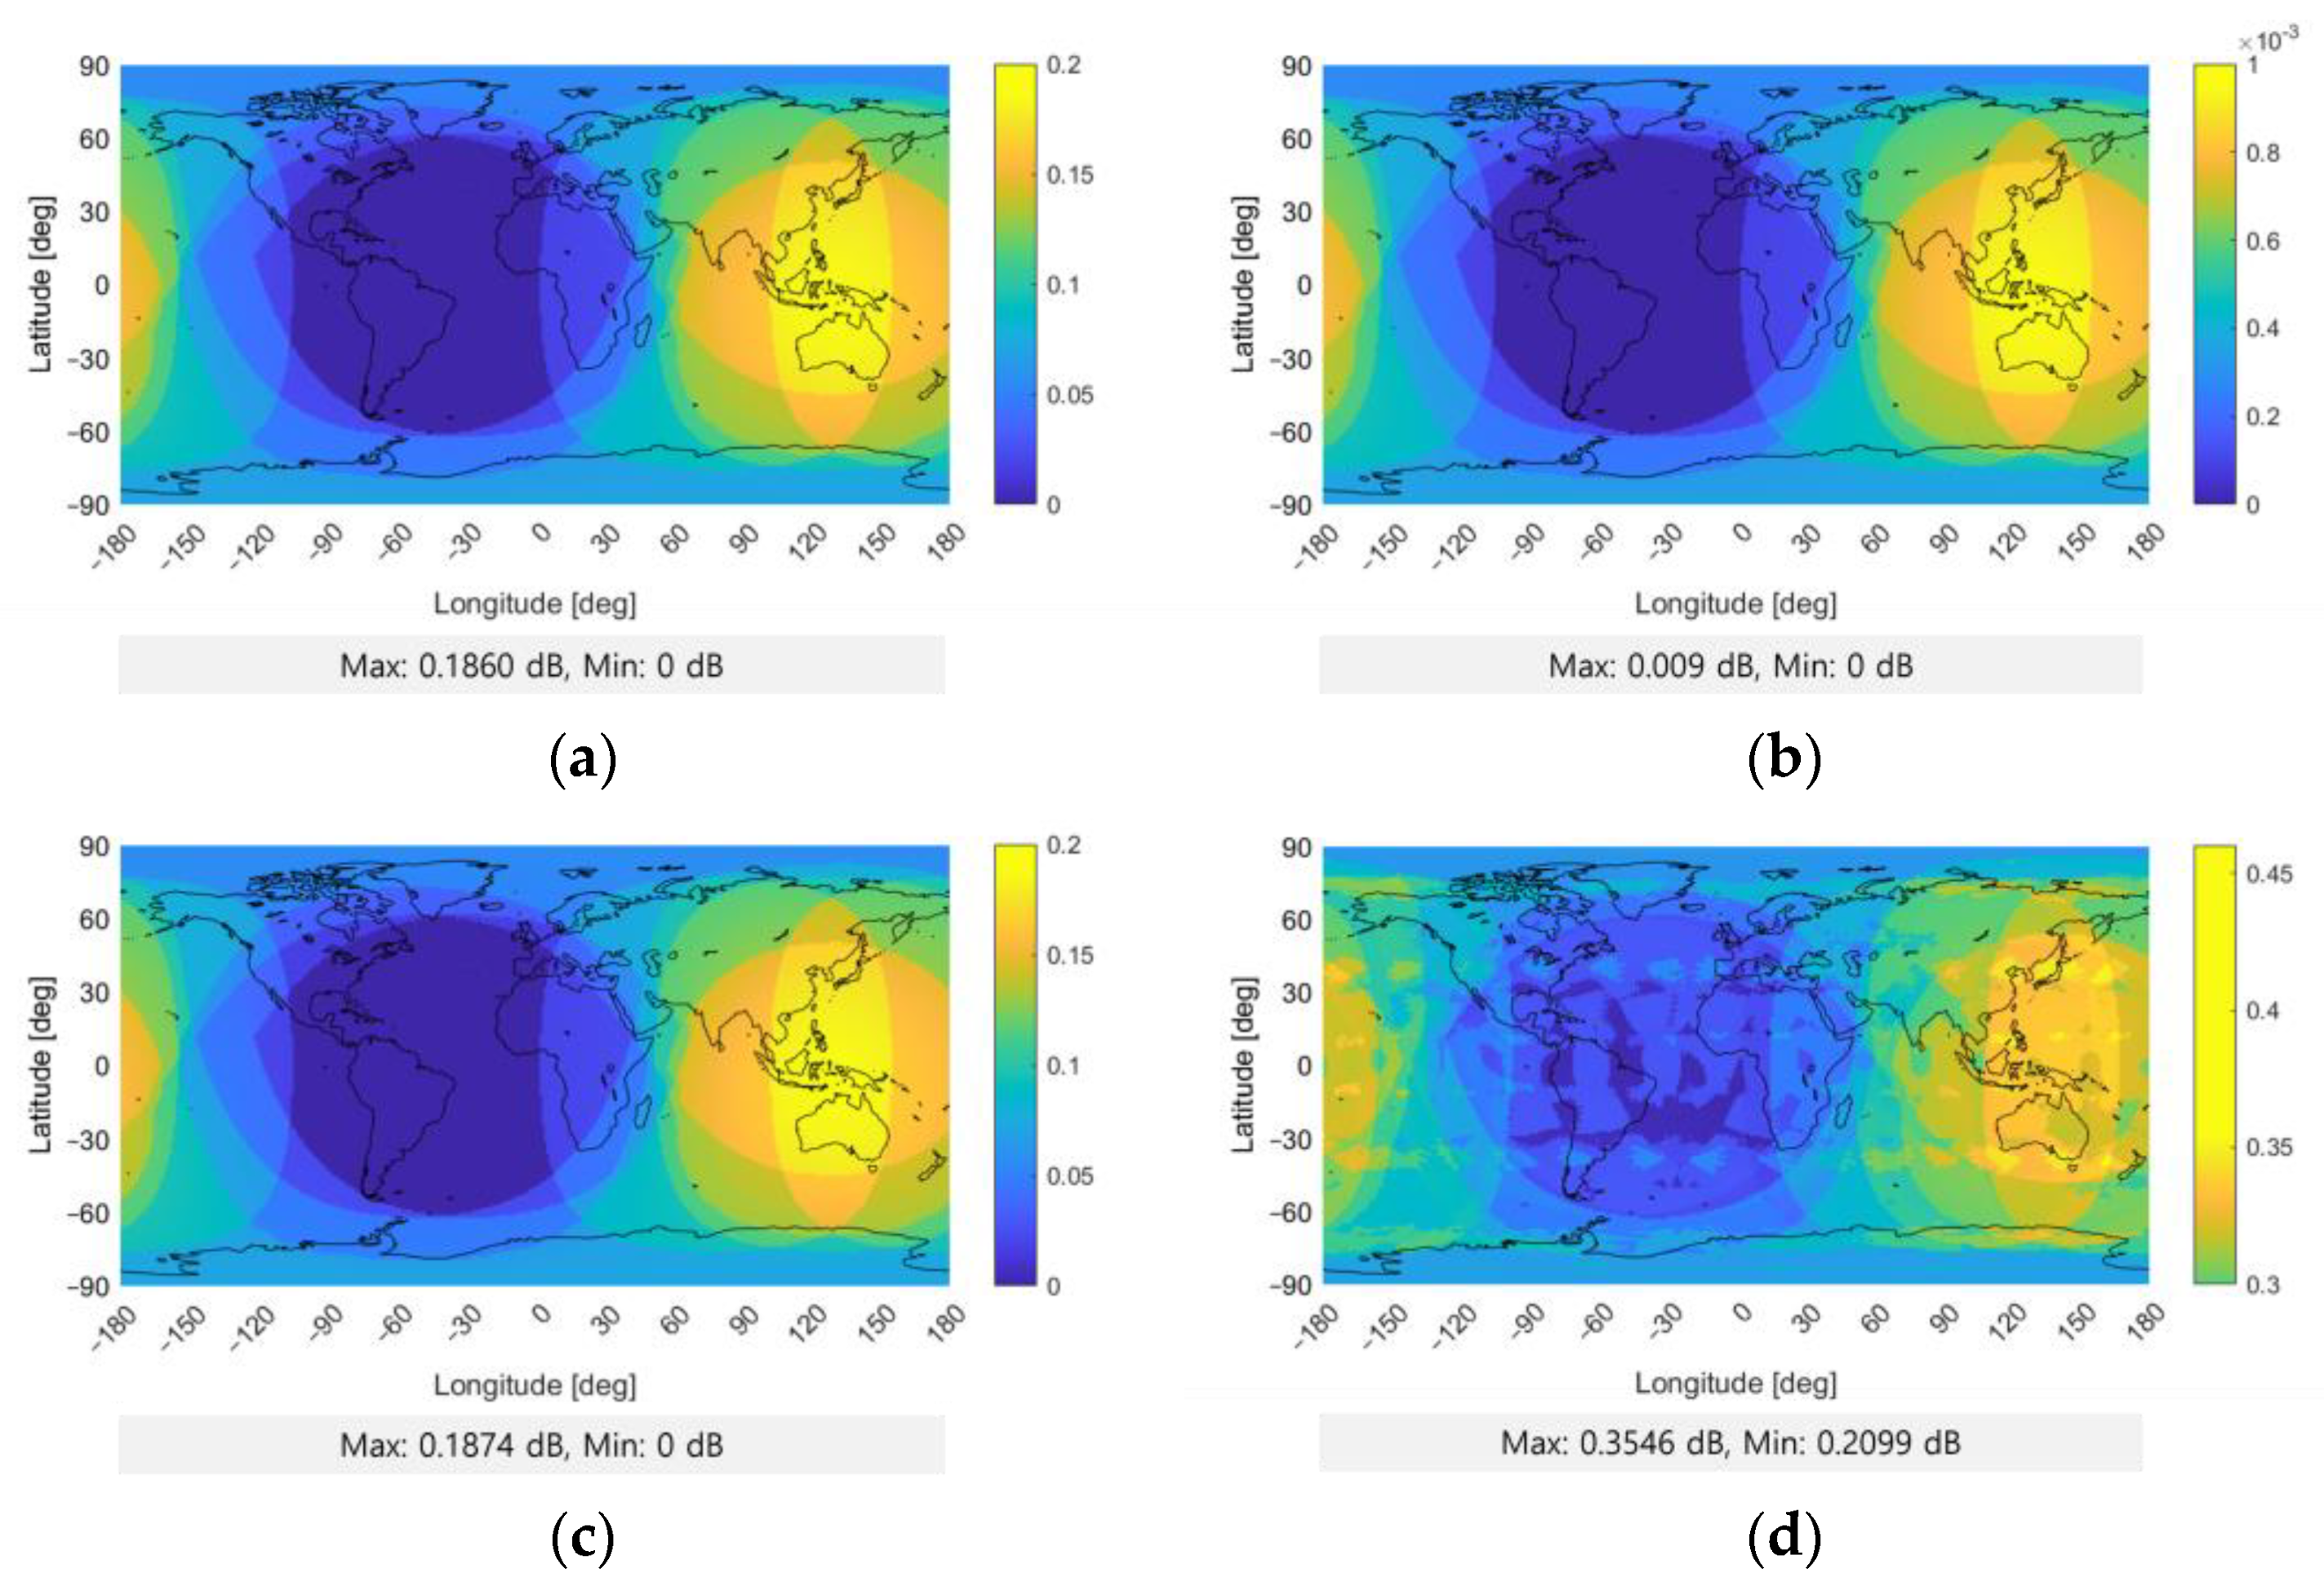
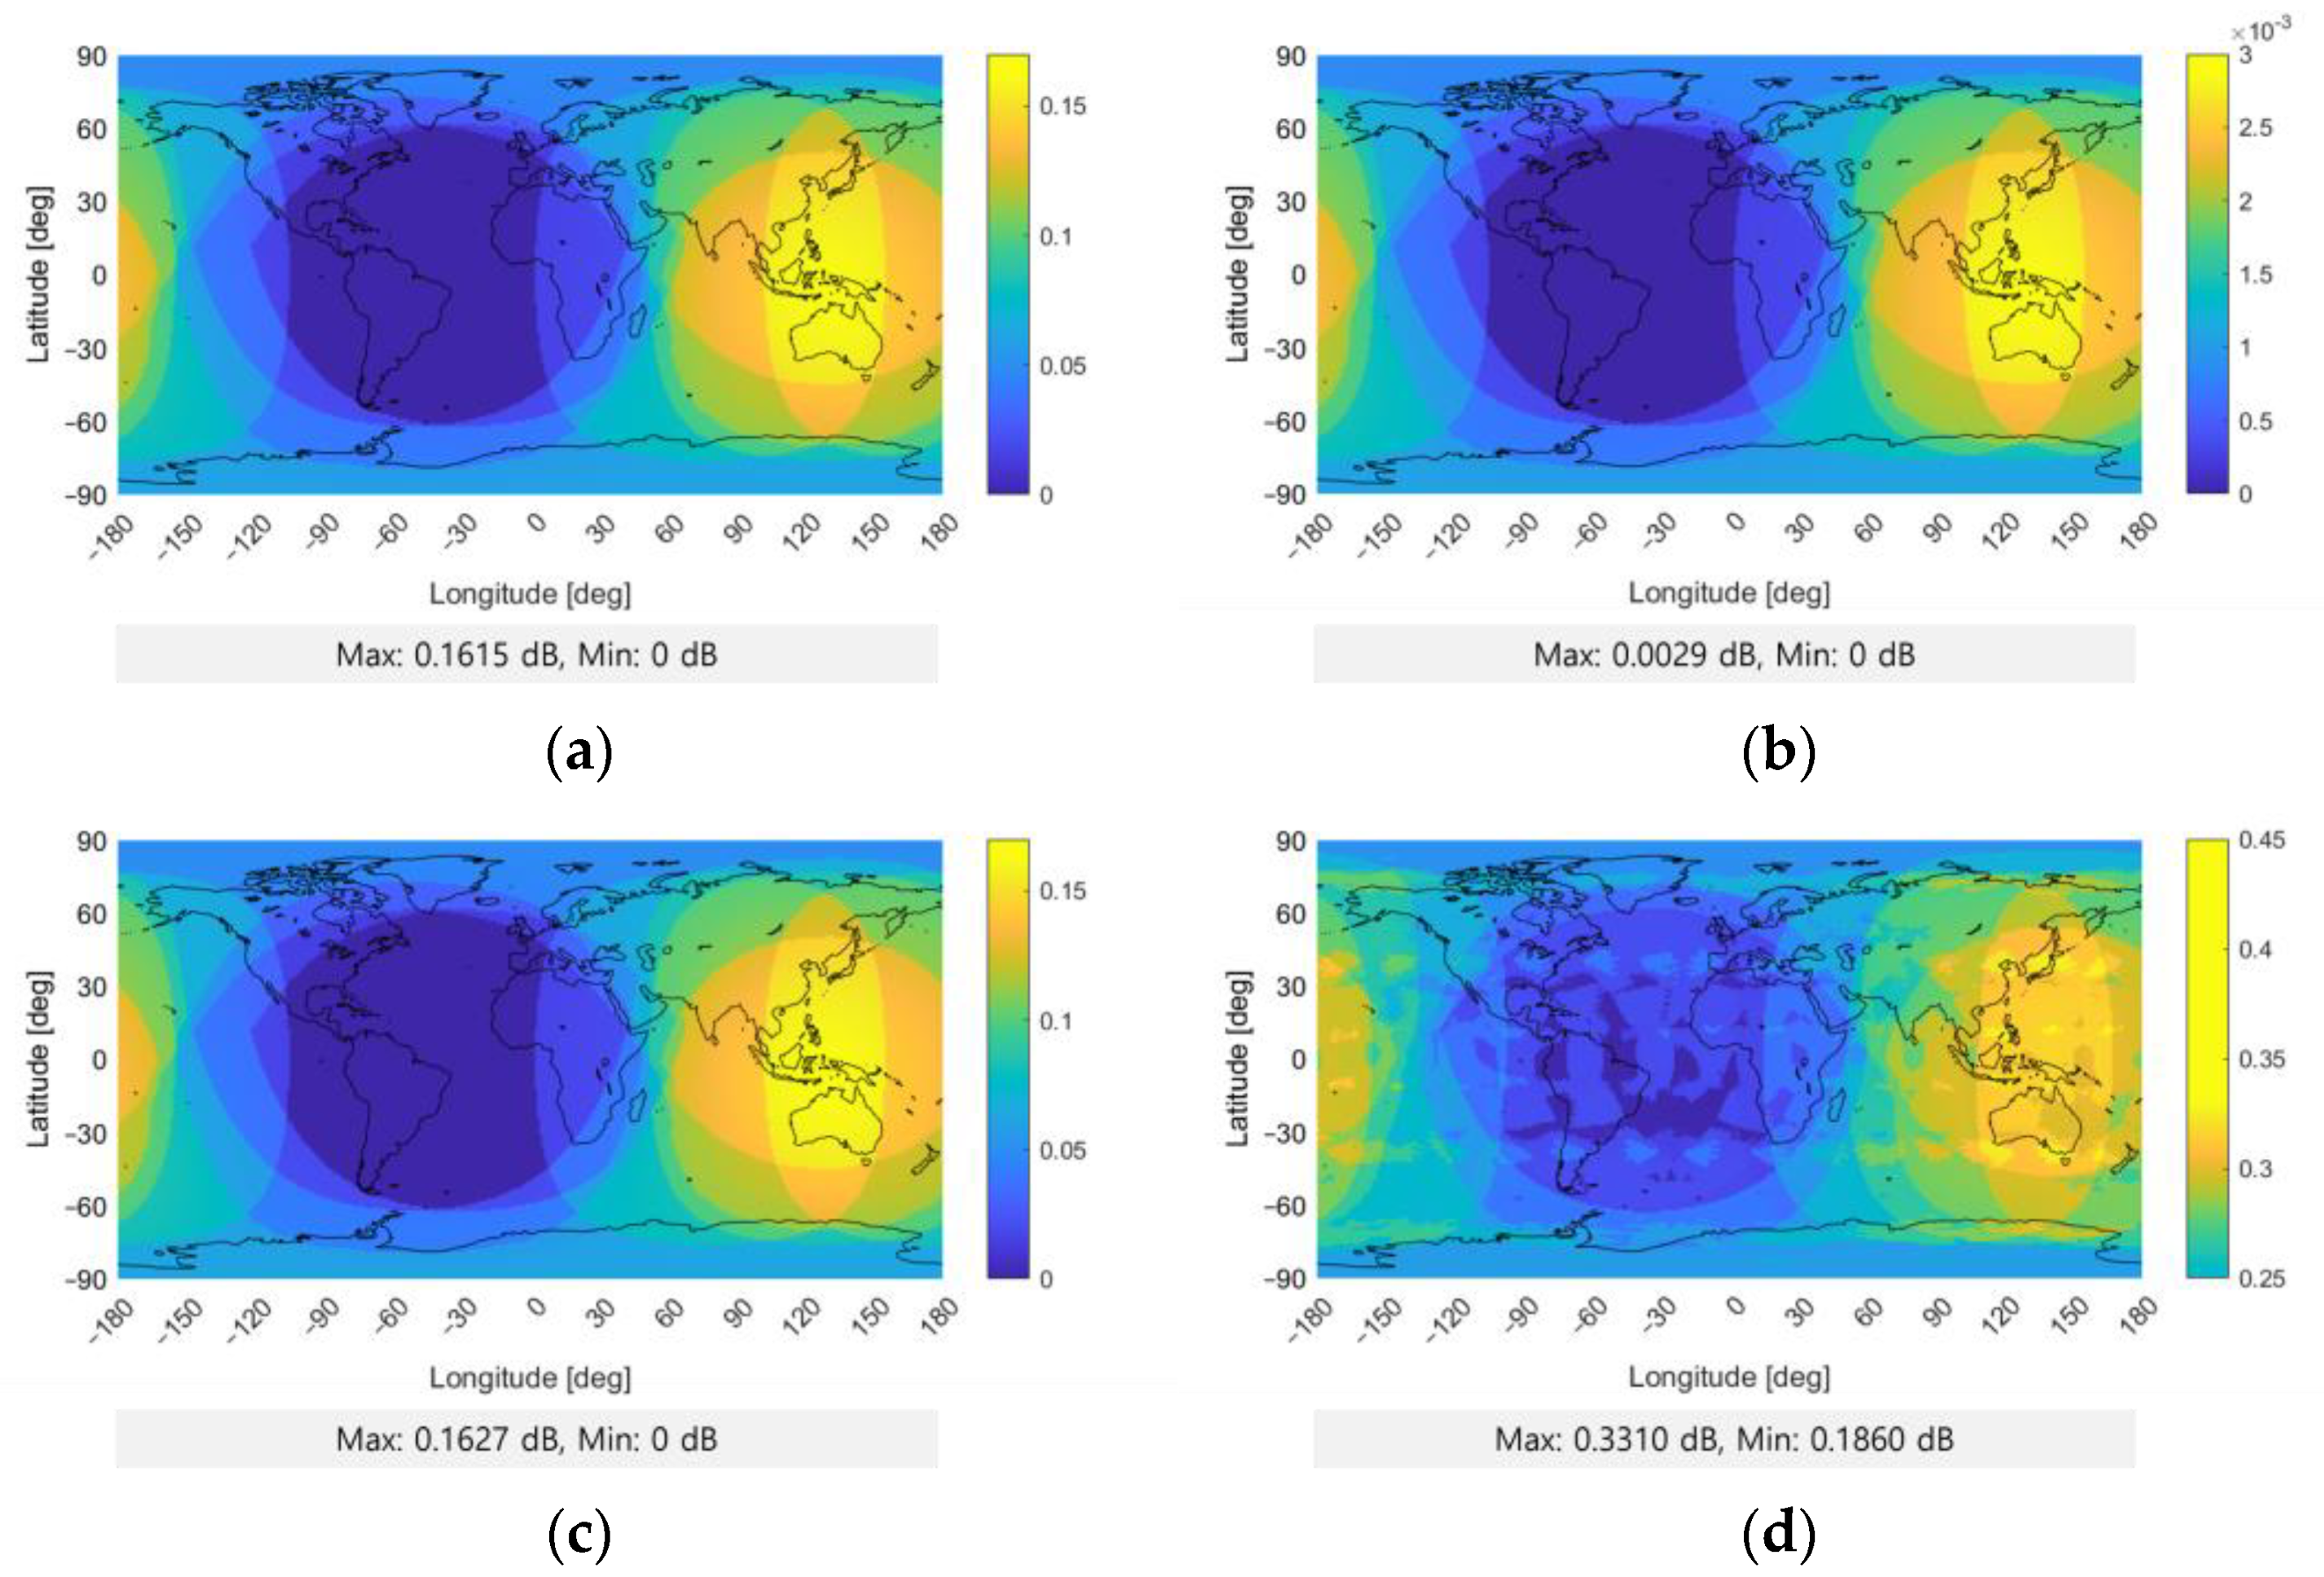
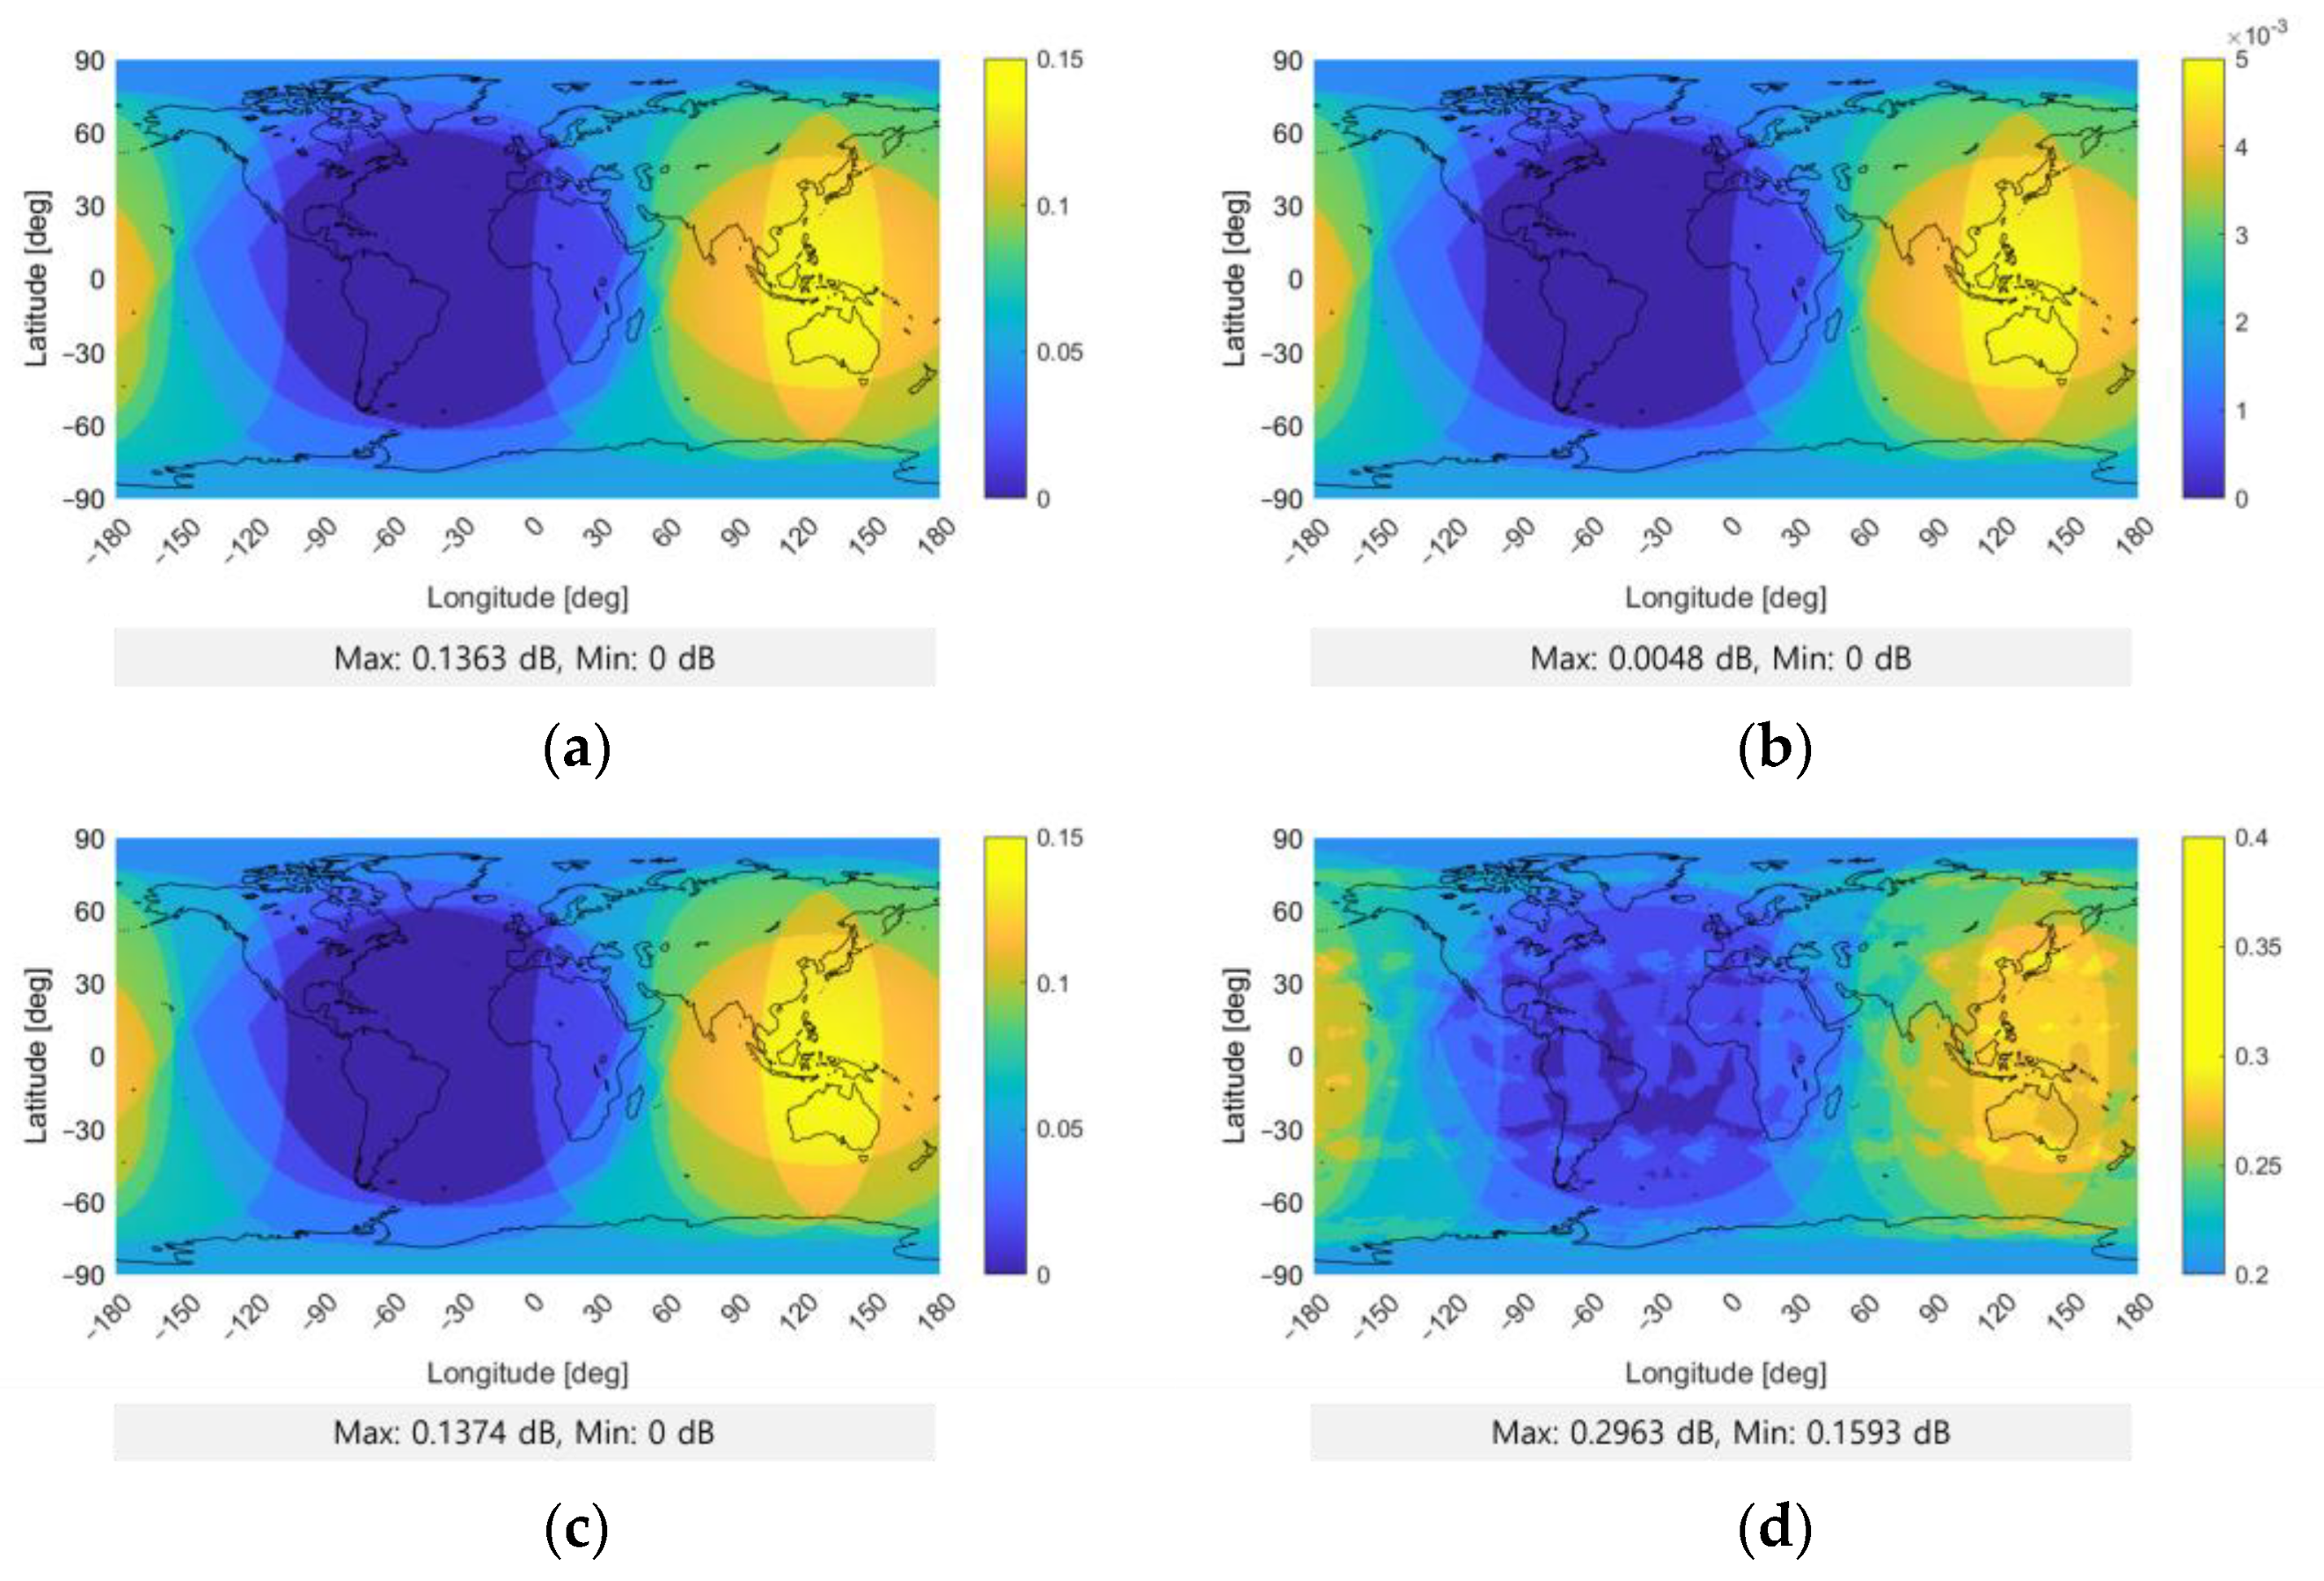
The SSC and maximum aggregate power results in Table 4 and Figure 5 are used to calculate the interference PSD in Equation (8). Then, the computed interference PSD is used as an input parameter to calculate C / N 0 , e f f . Figure 6, Figure 7 and Figure 8 show the results of C / N 0 , e f f for CS1 to CS3 according to the scenarios in Table 3, where (a) to (c) show the interference effect of the new RNSS on three legacy signals such as Galileo, BDS, and QZSS, respectively, and (d) is vice versa.
The results of the Figure 6, Figure 7 and Figure 8 show the following common characteristics. First, the C / N 0 , e f f patterns shown in the figures reflect the maximum aggregate power of the interference signals, which is proportional to the SSC results shown in Table 4. This means that the high C / N 0 , e f f results are derived when the SSC is high, and the low C / N 0 , e f f results are derived when the SSC is low. For example, Figure 6b shows the effect of the new RNSS interfering with BDS, and it has a relatively low C / N 0 , e f f compared to the other figures. This is because the BDS system has a relatively low SSC compared with the other signals, as it uses a different center frequency from other systems in the same frequency band. For the same reason, it can be predicted from Figure 6d that the interference effect of the BDS system on the new RNSS will be less than that of Galileo and/or QZSS. Second, a-c of the Figure 6, Figure 7 and Figure 8 have a minimum C / N 0 , e f f of 0 dB. This is because the new RNSS, which is an interference system, only serves some areas. On the other hand, d of the Figure 6, Figure 7 and Figure 8 has a minimum C / N 0 , e f f of approximately 0.2 dB. This is because some of the interference systems affecting the new RNSS provide services to users around the world to provide the PNT information at all times. Finally, the maximum C / N 0 , e f f in d of the Figure 6, Figure 7 and Figure 8 is relatively high compared to a-c of the Figure 6, Figure 7 and Figure 8 because, unlike the other scenarios, the three systems act as interference.
Meanwhile, the analysis for each figure is as follows. As mentioned earlier, Figure 6 shows the results of scenarios 1 to 4. Among the results where the new RNSS affects other systems, we see a maximum C / N 0 , e f f of 0.19 dB for Figure 6a,c, while for Figure 6b, the new RNSS is expected to have little impact. It is proportional to the SSC results between CS1 and E6-B/C, B3I, and L62 shown in Table 4. The C / N 0 , e f f of Figure 6a,c does not exceed 0.2 dB, and these results suggest that the signal power attenuation because of the new RNSS would be very small. The impact of other systems on the new RNSS has a maximum C / N 0 , e f f of 0.35 dB. As all three systems have an effect, they have a higher value than Figure 6a–c.
Figure 7 shows the results for scenarios 5 to 8, where the results and trends are similar to Figure 6, but the values are approximately 0.03 dB lower overall. This is because the SSC value is lower when the candidate signal of the new RNSS is CS2 rather than CS1. Figure 8 also shows the same trends, and since the SSC value between CS3 and other signals is the lowest among the other candidate signals, it has the lowest C / N 0 , e f f among Figure 6, Figure 7 and Figure 8. It can be predicted that the effect of interference experienced by other systems will be insignificant because of the introduction of the new RNSS.

4.2. Numerical Simulations

In the previous section, SSC and C / N 0 , e f f were assessed based on an analytical approach. In this section, SSC and C / N 0 , e f f are calculated by generating realistic signals to compensate for the limitations of the analytical approach.
Figure 9 shows the PSD of the generated numerical signal, and Table 6 shows the SSC results calculated from the numerical PSD. Figure 3 has a very smooth PSD, while Figure 9 shows a spectral line because of the influence of PRN codes and navigation data. In addition, the two PSDs have different power levels, and this difference affects the SSC results. Table 4 and Table 6 have different values due to the difference between the analytical and numerical PSDs. Therefore, Table 6 also summarizes the absolute value ( β d i f f ) of the difference in the SSC results according to the approach. The β d i f f has a value of at least 0.02 to at most 10.89, and the smaller value means that the difference in the results according to the approach is negligible. Most elements, except for the diagonal elements in the table, have small β d i f f , and there are exceptional cases where they have exceptionally high values. The β d i f f in the diagonal elements are the highest in the rows and columns containing diagonal elements, meaning that the actual self-SSC effect may be greater than the predicted effect using the analytical approach.
Meanwhile, the results of the self-SSC of the desired signal and the SSC between the interference signal and the desired signal are used as inputs to calculate C / N 0 , e f f . Therefore, the difference in the SSC results according to the approach also affects the C / N 0 , e f f results, and Table 7 shows this effect. The first column in Table 7 represents the scenario number, and the second column is for the maximum C / N 0 , e f f of the analytical approach. The third column shows the maximum C / N 0 , e f f of the numerical approach calculated using the SSC results in Table 6. The fourth column shows the difference between the second and third columns.
As seen from Table 6, in the case of self-SSC, it always has a high value, regardless of the signal. Therefore, the difference in the C / N 0 , e f f results according to the approach is predominantly affected by the β d i f f of the SSC between the desired signal and the interference signal. In other words, the larger the β d i f f of SSC between the desired signal and the interference signal, the greater the difference in C / N 0 , e f f according to the approach. In Table 6, most of the elements except the diagonal elements have small β d i f f ; thereore, the C / N 0 , e f f according to the approach in Table 7 has an almost similar value. Exceptionally, however, the β d i f f of the SSC between CS3 and L62 is 4.94 dB, which is the highest among the remaining elements except for the diagonal element in Table 6. For the results, the C / N 0 , e f f difference according to the approach of scenarios 11 and 12 calculated using the SSCs between CS3 and L62 as inputs is high compared to the other scenarios. At this point, it can be seen that although the β d i f f of the SSC between CS3 and B3I has a high value of 4.94 dB, there is little difference in C / N 0 , e f f according to the approach. This is because the intrasystem influence is more dominant than the intersystem influence due to the use of a different center frequency from the other systems in the same frequency bands.

4.3. Software/Hardware Integration Test

In order to validate the results obtained using the analytical and numerical approaches described in the previous sections, we need to assess the compatibility performance, taking into account the influence of hardware and channels. The experimental setup for the software/hardware integration test is shown in Figure 2, and the parameters that require additional definition are summarized in Table 8. The software/hardware test takes a long time to assess the compatibility for the location and time range considered in the analytical and numerical simulations. Therefore, in this paper, the evaluation is carried out by setting a specific receiver position and time for scenario 4 as an example of the assessment.
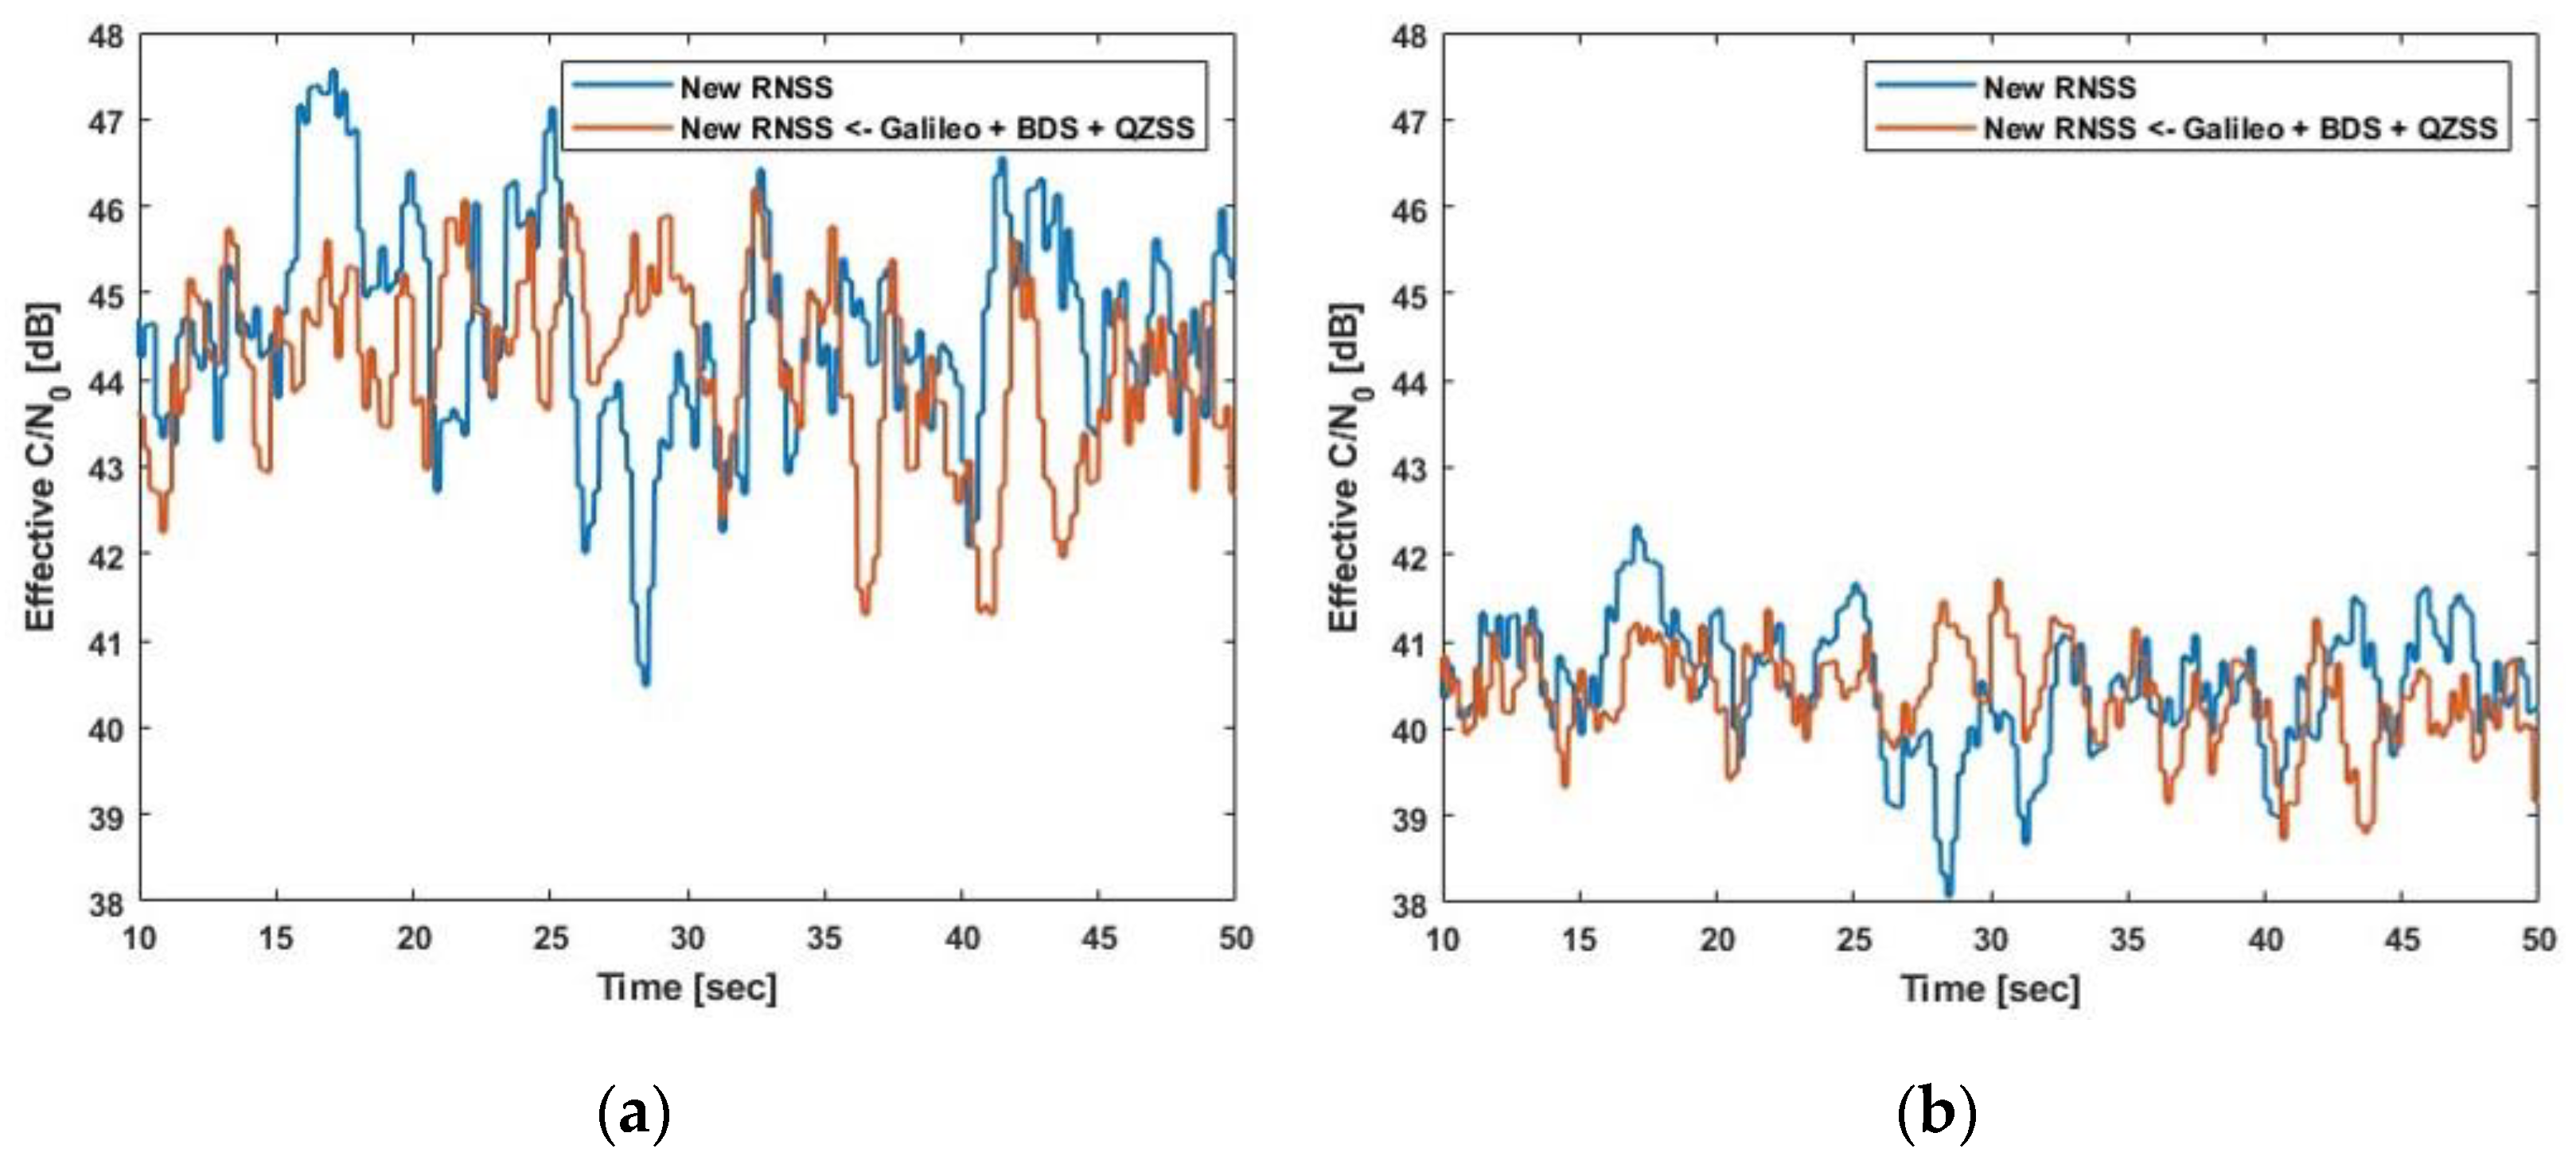
During the simulation run at a given receiver position, the number of visible satellites of the new RNSS is eight, and Figure 10 and Table 9 summarize the results for PRN 4 and 6, as an example, among the visible satellites. Figure 10 shows the results for the middle 50 s of the total simulation time. The C / N 0 , e f f shows some degradation when the interference is present, but it is difficult to confirm the degradation from the figures alone. The difference in the C / N 0 , e f f level between the two satellites depends on the geometric arrangement between the satellite and the receiver. Table 9 shows the average values for the results in Figure 10. As a result of the signal processing, the PRN 4 satellite has a C / N 0 , e f f of approximately 44 dB, regardless of the presence or absence of interference, and shows a decrease of approximately 0.46 dB in the presence of interference. The PRN 6 satellite has a C / N 0 , e f f of approximately 40 dB with or without interference and showed a degradation of approximately 0.14 dB in the presence of interference. It can be seen that the C / N 0 , e f f of each satellite is within the range expected from Table 7.
However, the experiment carried out in this paper may not be representative, as it is carried out at a specific receiver location and over a specific period of time. In addition, the results may vary depending on the hardware specifications. Therefore, it may have a larger or smaller C / N 0 , e f f . In addition, in Table 7, for scenarios where C / N 0 , e f f does not exceed 0.2 dB, it is expected that it will be difficult to confirm the interference effect in the over-the-air (OTA) experiment. For the remaining scenarios, such as scenarios 8 to 12, we expect the results to show a similar trend to scenario 4.

5. Conclusions

This paper proposed a three-step compatibility assessment methodology for the design of new RNSS signals in the L6-band. The proposed methodology consists of analytical simulations, numerical simulations, and software/hardware integration tests. Each step complements the previous step of the assessment methodology. The open signals of Galileo, BDS, QZSS, and the three candidate signals of the new RNSS were used for the compatibility assessment. Twelve interference scenarios were evaluated, and the assessment analysis was performed based on the compatibility FoMs such as SSC, C / N 0 , e f f , and C / N 0 , e f f .
As a result of the analytical simulation analysis, the introduction of a new RNSS increased the interference between the systems, but the effect was insignificant for C / N 0 , e f f values less than 0.2 dB. In particular, in the case of the BDS, the maximum C / N 0 , e f f due to the new RNSS was close to 0.0 dB. The effects of the other systems on the new RNSS were not high, at approximately 0.4 dB.
The SSCs and C / N 0 , e f f at levels similar to the analytical simulations were derived as a result of the numerical simulations. However, the self-SSC showed relatively large differences, confirming that the actual self-SSC effect may be greater than that predicted by the analytical approach.
The software/hardware integration test was only carried out for scenario 4, and the results were within the range predicted by the results obtained through the analytical and numerical approaches. However, the experiment carried out in this paper has limitations, in that the results cannot be representative, as it was performed at a specific receiver location and time. Nevertheless, the results of each stage of the compatibility assessment carried out in this paper are all of a similar order of magnitude, which means that the analytical and numerical simulations alone can confirm the effects of similar interference levels with the real thing. Therefore, even if the experimental composition of the software/hardware integration test changes, the results are expected to be similar to the analytical or numerical simulations.
Taken together, the results of the three-stage compatibility assessment show that the introduction of the new RNSS will increase inter-system interference, but its effect is acceptable and is expected to be beneficial in terms of interoperability and multi-RNSS.

Author Contributions

Conceptualization, S.L. and J.-H.W.; methodology, S.L., K.H. and J.-H.W.; software, S.L. and K.H.; validation, S.L. and J.-H.W.; formal analysis, S.L.; investigation, S.L.; resources, J.-H.W.; data curation, S.L.; writing—original draft preparation, S.L.; writing—review and editing, J.-H.W.; visualization, S.L.; supervision, J.-H.W.; project administration, J.-H.W.; funding acquisition, J.-H.W. All authors have read and agreed to the published version of the manuscript.

Funding

This work was supported by the INHA UNIVERSITY Research Grant (2023).

Data Availability Statement

Data are contained within the article.

Conflicts of Interest

The authors declare no conflicts of interest.

References

  1. Kim, T. Korean Positioning System (KPS) and Korean Augmentation Satellite System (KASS) Update. In Proceedings of the Fifteenth Meeting of the International Committee on Global Navigation Satellite Systems (ICG-15), Vienna, Austria, 27 September–1 October 2021. [Google Scholar]
  2. Satellite Navigation System More Accurately. Available online: https://www.kari.re.kr/eng/sub03_08_01.do (accessed on 2 January 2023).
  3. ITU. Radio Regulations, 2020 ed; ITU: Geneva, Switzerland, 2020; Volume 1, pp. 96–126. ISBN 978-92-61-30301-3. [Google Scholar]
  4. ITU. Description of Systems and Networks in the Radionavigation-Satellite Service (Space-to-Earth and Space-to-Space) and Technical Characteristics of Transmitting Space Stations Operating in the Bands 1 164-1 215 MHz, 1 215-1 300 MHz and 1 559-1 610 MHz (Recommendation ITU-R M.1787-4); ITU: Geneva, Switzerland, 2022. [Google Scholar]
  5. Indian Space Research Organization. IRNSS Signal-in-Space Interface Control Document (ISRO-IRNSS-ICD-SPS-1.1); Indian Space Research Organization: Bengaluru, India, 2017. [Google Scholar]
  6. ITU. A Coordination Methodology for Radionavigation-Satellite Service Inter-System Interference Estimation (Recommendation ITU-R M.1831-1); ITU: Geneva, Switzerland, 2015. [Google Scholar]
  7. Betz, J.W. Effect of Partial-Band Interference on Receiver Estimation of C/N0: Theory. In Proceedings of the 2001 National Technical Meeting of the Institute of Navigation (ION NTM 2001), Long Beach, CA, USA, 22–24 January 2001. [Google Scholar]
  8. Betz, J.W.; Goldstein, D.B. Candidate Designs for an Additional Civil Signal in GPS Spectral Bands. In Proceedings of the 2002 National Technical Meeting of the Institute of Navigation (ION NTM 2002), San Diego, CA, USA, 28–30 January 2002. [Google Scholar]
  9. Liu, W.; Zhai, C.R.; Zhan, X.Q.; Zhang, Y.H. Assessment and analysis of radio frequency compatibility among several global navigation satellite systems. IET Radar Sonar Navig. 2011, 5, 128–136. Available online: https://digital-library.theiet.org/content/journals/10.1049/iet-rsn.2009.0241 (accessed on 20 October 2023). [CrossRef]
  10. Sun, Y.; Xue, R.; Zhao, D.; Wang, D. Radio Frequency Compatibility Evaluation of S Band Navigation Signals for Future BeiDou. Sensors 2017, 17, 1039. [Google Scholar] [CrossRef] [PubMed]
  11. Liu, W.; Zhai, C.; Zhang, Y.; Zhan, X. Simulation Analysis of GPS/Galileo/Compass Radio Frequency Compatibility. In Proceedings of the 22nd International Technical Meeting of the Satellite Division of the Institute of Navigation (ION GNSS 2009), Savannah, GA, USA, 22–25 September 2009. [Google Scholar]
  12. Wallner, S.; Hein, G.W.; Pany, T.; Avila-Rodriguez, J.A.; Posfay, A. Interference computations between GPS and Galileo. In Proceedings of the 18th International Technical Meeting of the Satellite Division of The Institute of Navigation (ION GNSS 2005), Long Beach, CA, USA, 13–16 September 2005. [Google Scholar]
  13. Wallner, S.; Hein, G.W.; Avila-Rodriguez, J.A. Interference computations between several GNSS systems. ESA Navitec 2006, 11–13. Available online: https://www.researchgate.net/profile/Stefan-Wallner-7/publication/229047833_Interference_computations_between_several_GNSS_systems/links/54b38b970cf220c63cd284a3/Interference-computations-between-several-GNSS-systems.pdf (accessed on 20 October 2023).
  14. Han, K.; Shin, H.; Won, J.H. A Method of GNSS RF Compatibility Assessment for KPS Signal Design. In Proceedings of the ISGNSS 2019 in Conjunction with IPNT Conference, Jeju, Republic of Korea, 29 October–1 November 2019; Available online: http://ipnt.or.kr/2019proc/22 (accessed on 20 October 2023).
  15. Lee, S.; Han, K.; Won, J.H. A High-Level RF Compatibility Analysis for RNSS Signal Design. In Proceedings of the 34th International Technical Meeting of the Satellite Division of The Institute of Navigation (ION GNSS+ 2021), St. Louis, MI, USA, 20–24 September 2021. [Google Scholar] [CrossRef]
  16. Lee, S.; Han, K.; Won, J.H. RF Compatibility Analysis of GNSS and KPS Signals at L6/S-band. J. Position. Navig. Timing 2021, 10, 21–28. [Google Scholar] [CrossRef]
  17. Akos, D.; Arribas, J.; Bhuiyan, M.Z.H.; Closas, P.; Dovis, F.; Fernandez-Hernandez, I.; Fernández–Prades, C.; Gunawardena, S.; Humphreys, T.; Kassas, Z.M.; et al. GNSS Software Defined Radio: History, Current Developments, and Standardization Efforts. In Proceedings of the 35th International Technical Meeting of the Satellite Division of The Institute of Navigation (ION GNSS+ 2022), Denver, CO, USA, 19–23 September 2022. [Google Scholar] [CrossRef]
  18. Choi, B.H.; Song, Y.J.; Lee, S.; Won, J.H. Design of a Fully Reconfigurable Multi-Constellation and Multi-Frequency GNSS Signal Generator. J. Position. Navig. Timing 2023, 12, 295–306. [Google Scholar] [CrossRef]
  19. European Union. Galileo—Open Service—Signal in Space Interface Control Document (OS SIS ICD v2.0). January 2021. Available online: https://www.gsc-europa.eu/sites/default/files/sites/all/files/Galileo_OS_SIS_ICD_v2.0.pdf (accessed on 2 January 2023).
  20. China Satellite Navigation Office. BeiDou Navigation Satellite System Signal in Space Interface Control Document Open Service Signal B3I (Version 1.0). February 2018. Available online: http://en.beidou.gov.cn/SYSTEMS/ICD/201806/P020180608516798097666.pdf (accessed on 2 January 2023).
  21. Cabinet Office. Quasi-Zenith Satellite System Interface Specification Centimeter Level Augmentation Service (IS-QZSS-L6-005). September 2022. Available online: https://qzss.go.jp/en/technical/download/pdf/ps-is-qzss/is-qzss-l6-005.pdf?t=1682599378664 (accessed on 2 January 2023).
  22. Orbital and Technical Parameters. Available online: https://www.gsc-europa.eu/system-service-status/orbital-and-technical-parameters (accessed on 2 January 2023).
  23. Constellation Status. Available online: http://www.csno-tarc.cn/en/system/constellation (accessed on 2 January 2023).
  24. United Nations. The Interoperable Global Navigation Satellite Systems Space Service Volume, 2nd ed.; United Nations Office for Outer Space Affairs: Vienna, Austria, 2018; pp. 109–114. ISBN 9789211304367. [Google Scholar]
  25. Kogure, S. Update of QZSS. In Proceedings of the 34th International Technical Meeting of the Satellite Division of The Institute of Navigation (ION GNSS+ 2021), St. Louis, MI, USA, 20–24 September 2021. [Google Scholar] [CrossRef]
  26. Choi, B.K.; Roh, K.M.; Ge, H.; Ge, M.; Joo, J.; Heo, M.B. Performance Analysis of the Korean Positioning System Using Observation Simulation. Remote Sens. 2020, 12, 3365. [Google Scholar] [CrossRef]
  27. Shin, M.; Lim, D.W.; Chun, S.; Heo, M.B. A Study on the Satellite Orbit Design for KPS Requirements. J. Position. Navig. Timing 2019, 8, 215–223. [Google Scholar] [CrossRef]
  28. Misra, P.; Enge, P. Global Positioning System: Signals, Measurements and Performance, 2nd ed.; Ganga-Jamuna Press: Lincoln, MA, USA, 2006; pp. 393–427. ISBN 13:978-0970954411. [Google Scholar]
  29. Betz, J.W.; Titus, B.M. Intersystem and intrasystem interference with signal imperfections. In Proceedings of the PLANS 2004. Position Location and Navigation Symposium (IEEE Cat. No.04CH37556), Monterey, CA, USA, 26–29 April 2004. [Google Scholar] [CrossRef]
  30. Titus, B.M.; Betz, J.; Hegarty, C.; Owen, R. Intersystem and Intrasystem Interference Analysis Methodology. In Proceedings of the 16th International Technical Meeting of the Satellite Division of The Institute of Navigation (ION GPS/GNSS 2003), Portland, OR, USA, 9–12 September 2003. [Google Scholar]
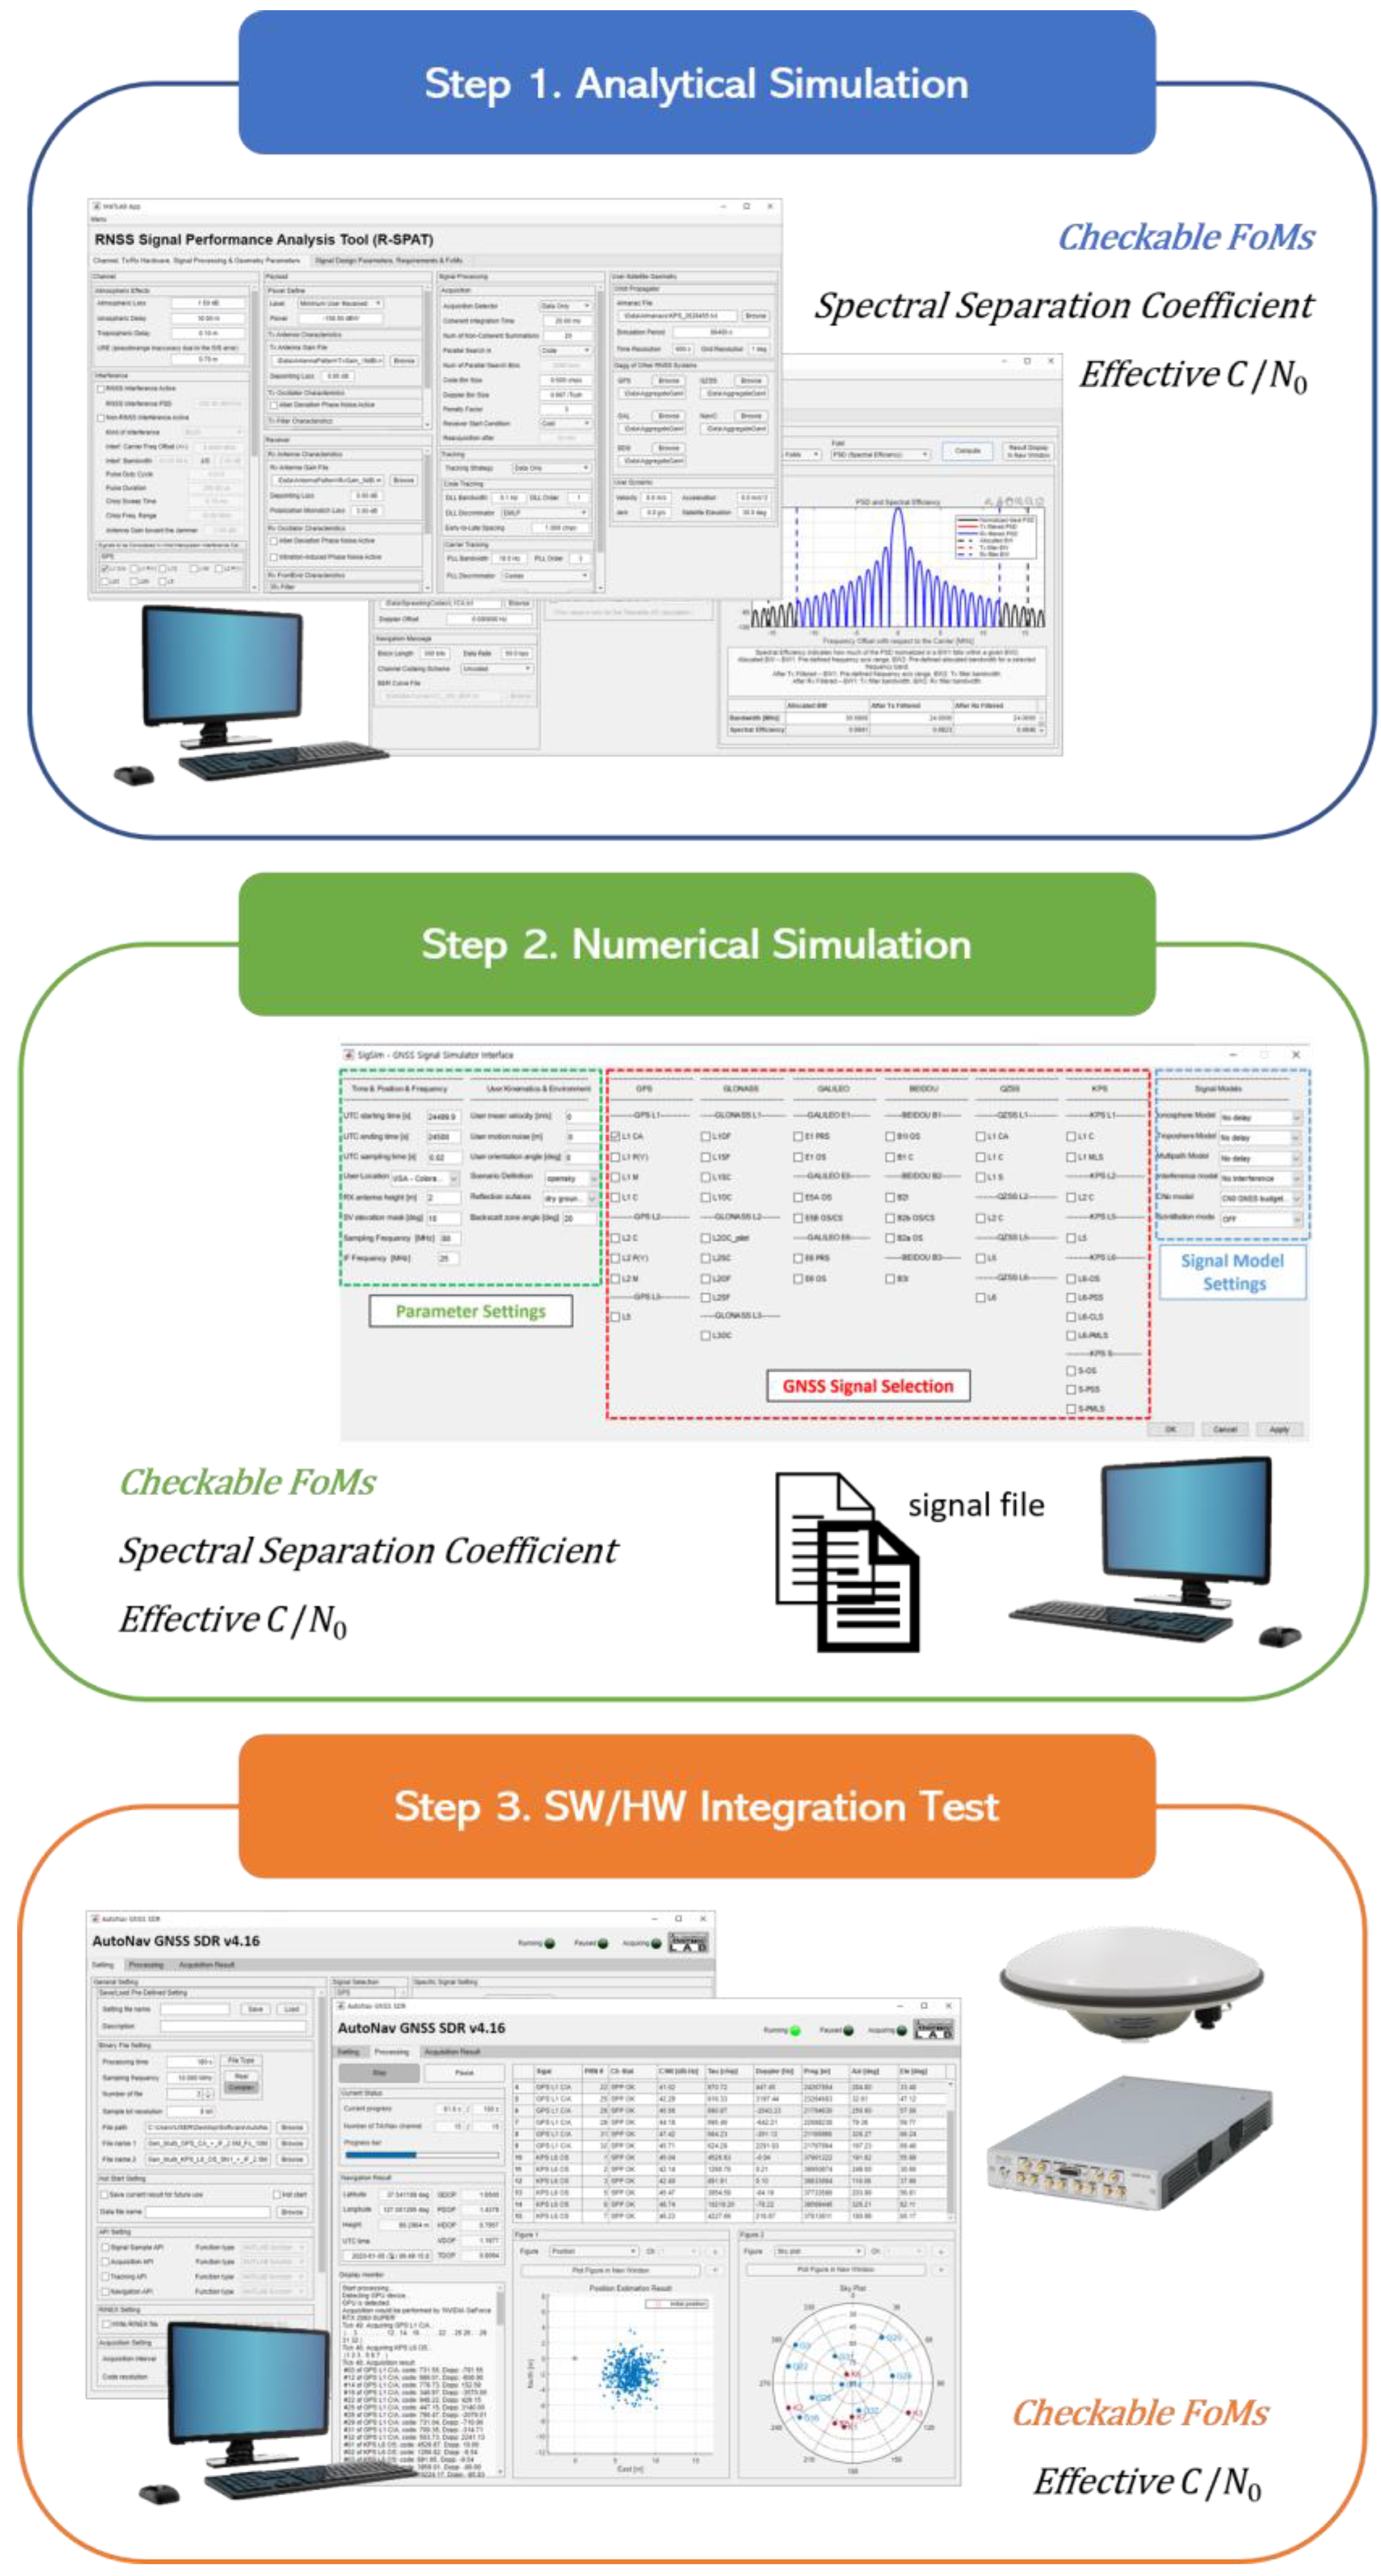
Figure 1. Step-by-step radio frequency (RF) compatibility assessment methodology.
Remotesensing 16 00319 g001
Figure 2. The procedure used for the software/hardware integration test.
Remotesensing 16 00319 g002
Figure 3. Analytical power spectral density (PSD) of the navigation signals considered in this study.
Remotesensing 16 00319 g003
Figure 4. Satellite antenna gain according to the off-boresight angle for global navigation satellite systems (GNSSs): (a) definition of off-boresight angle; (b) typical antenna gain curve.
Remotesensing 16 00319 g004
Figure 5. Maximum aggregate power of each system: (a) Galileo; (b) BeiDou Navigation Satellite System (BDS); (c) Quasi-Zenith Satellite System (QZSS); (d) new radio navigation satellite service (RNSS).
Remotesensing 16 00319 g005
Figure 6. The effective carrier-to-noise ratio degradation ( C / N 0 , e f f ) due to intersystem interference for scenarios 1 to 4: (a) scenario 1; (b) scenario 2; (c) scenario 3; (d) scenario 4.
Remotesensing 16 00319 g006
Figure 7. C / N 0 , e f f due to intersystem interference for scenarios 5 to 8: (a) scenario 5; (b) scenario 6; (c) scenario 7; (d) scenario 8.
Remotesensing 16 00319 g007
Figure 8. C / N 0 , e f f due to intersystem interference for scenarios 9 to 12: (a) scenario 9; (b) scenario 10; (c) scenario 11; (d) scenario 12.
Remotesensing 16 00319 g008
Figure 9. Numerical PSD of the navigation signals considered in this study.
Remotesensing 16 00319 g009
Figure 10. The effective carrier-to-noise ratio ( C / N 0 , e f f ): (a) PRN 4; (b) PRN 6.
Remotesensing 16 00319 g010
Table 1. Signal characteristics parameters considered in this study.
SystemCenter
Frequency
[MHz]
Signal
Name
ModulationPrimary
Code Family
(Length)
Secondary
Code Family
(Length)
Data Rate
[bps]
Galileo1278.75E6-B/CE6-BBPSK (5)Memory(5115)-500
E6-CBPSK (5)Memory(5115)CS 100(100)-
BDS1268.52B3IBPSK (10)Gold(10230)-50 *
500 **
QZSS1278.75L62code1BPSK (2.5)Kasami(10320)-2000
code2BPSK (2.5)Kasami(10320)-2000
New
RNSS
1278.75CS1BPSK (1)Random(10320)-50
CS2BOCs (1,1)Random(10320)-50
CS3BPSK (5)Random(10320)-50
* D1 navigation message data rate (medium earth orbit (MEO)/inclined geosynchronous orbit (IGSO) satellite use D1 message type). ** D2 navigation message data rate (geostationary orbit (GEO) satellite use D2 message type).
Table 2. Space constellation parameters considered in this study.
ParameterGalileoBDSQZSSNew RNSS
Constellation22 MEO7GEO + 10IGSO
+ 27MEO
2GEO + 1QGEO
+ 4QZO
3GEO + 5IGSO
Inclination56°GEO: 0°
IGSO/MEO: 55°
GEO: 0°
QGEO: 3°
QZO: 41°
GEO: 0°
IGSO: 43°
Eccentricity00.003GEO: 0
QGEO: 0.008
QZO: 0.075
GEO: 0
IGSO: 0.075
Table 3. Summary of the 12 scenarios. (○: desired signal, ●: interference signal).
SignalScenario
#1#2#3#4#5#6#7#8#9#10#11#12
E6-B/C
B3I
L62
CS1
CS2
CS3
Table 4. Analytical spectral separation coefficient (SSC).
Interference
Signal
SSC (dB/Hz)
E6-B/C
(BPSK (5))
B3I
(BPSK (10))
L62
(BPSK (5))
CS1
(BPSK (1))
CS2
(BOCs (1,1))
CS3
(BPSK (5))
E6-B/C−68.63−83.19−68.63−67.25−67.88−68.63
B3I−83.97−70.98−83.97−91.13−86.30−83.97
L62−68.63−83.19−68.63−67.25−67.88−68.63
CS1−67.25−90.30−67.25−61.81−67.79−67.25
CS2−67.88−85.48−67.88−67.79−64.74−67.88
CS3−68.63−83.19−68.63−67.25−67.88−68.63
Table 5. Simulation parameters for calculating the maximum aggregate gain factor.
ClassificationParameterValueUnit
SimulationTime1day
Time resolution10min
Grid resolution1 × 1deg
Elevation mask5deg
Antenna gainSatelliteGlobal: Figure 4b
Regional: 16
dBi
Receiver3dBi
LossDistanceEquation (9)dB
Polarization3dB
Atmosphere1.5dB
Processing1dB
Received
signal power
Minimum
received power
Galileo: −155.25
BDS: −163
QZSS: −156.82
New RNSS: −157
dBW
Table 6. Numerical SSC. ( β d i f f = |analytical SSC results—numerical SSC results|).
Interference
Signal
SSC [dB/Hz] (βdiff)
E6-B/CB3IL62CS1CS2CS3
(BPSK (5))(BPSK (10))(BPSK (5))(BPSK (1))(BOCs (1,1))(BPSK (5))
E6-B/C−63.58−82.92−70.02−67.27−67.92−69.68
(5.05)(0.27)(1.39)(0.02)(0.04)(1.05)
B3I−83.87−60.09 −90.04 −91.83 −86.80 −89.07
(0.10)(10.89)(6.07)(0.70)(0.50)(5.10)
L62−70.02−89.12 −60.36−67.13−67.80−63.69
(1.39)(5.93)(8.27)(0.12)(0.08)(4.94)
CS1−67.27−90.86 −67.13−59.12−65.21−67.04
(0.02) (0.56)(0.12)(2.69)(2.58)(0.21)
CS2−67.92−85.82 −67.80−65.21−61.87−67.77
(0.04)(0.34)(0.08)(2.58)(2.87)(0.11)
CS3−69.68−88.13−63.69−67.04−67.77−61.16
(1.05).(4.94)(4.94)(0.21)(0.11)(7.47)
Table 7. Maximum C / N 0 , e f f according to analytical approach and numerical approach.
Scenario Max .   C / N 0 , e f f [dB] | r e s A r e s N |
Analytical
( r e s A )
Numerical
( r e s N )
10.190.170.02
2<0.01<0.01 0.00
30.190.170.02
40.350.330.02
50.160.150.01
6<0.01<0.01 0.00
70.160.140.02
80.330.310.02
90.140.100.04
10<0.01<0.01 0.00
110.140.360.22
120.300.430.13
Table 8. Software/hardware integration test parameter settings.
ClassificationParameterValueUnit
SimulationTime60s
Start time of week24,492s
User latitude37.4505deg
User longitude126.6575deg
User height113.2995m
TxUSRP modelNI-2944R-
Analog gain30dB
Digital gain50dB
Sapling rate40MHz
IF10MHz
RxUSRP modelNI-2950R-
Analog gain0dB
Digital gain0dB
Sampling rate40MHz
IF10MHz
Table 9. Mean of C / N 0 , e f f for PRN 4 and PRN 6.
Case Mean   of   C / N 0 , e f f [dB]Blue–Orange
No Interference Signal
(Blue)
With Interference Signal
(Orange)
PRN 444.599044.13860.4604
PRN 640.509840.37330.1365
Disclaimer/Publisher’s Note: The statements, opinions and data contained in all publications are solely those of the individual author(s) and contributor(s) and not of MDPI and/or the editor(s). MDPI and/or the editor(s) disclaim responsibility for any injury to people or property resulting from any ideas, methods, instructions or products referred to in the content.