Article

Joint Panchromatic and Multispectral Geometric Calibration Method for the DS-1 Satellite

1
Harbin Institute of Technology, Harbin 150001, China
2
Zhuhai Aerospace Microchips Science & Technology Co., Ltd., Zhuhai 519000, China
3
School of Remote Sensing and Information Engineering, Wuhan University, Wuhan 430072, China
4
China Electronic System Technology Co., Ltd., Wuhan 430015, China
*
Author to whom correspondence should be addressed.
Remote Sens. 2024, 16(2), 433; https://doi.org/10.3390/rs16020433
Submission received: 30 October 2023 / Revised: 15 January 2024 / Accepted: 15 January 2024 / Published: 22 January 2024
(This article belongs to the Special Issue Remote Sensing Satellites Calibration and Validation)

Abstract

:
The DS-1 satellite was launched successfully on 3 June 2021 from the Taiyuan Satellite Launch Center. The satellite is equipped with a 1 m panchromatic and a 4 m multispectral sensor, providing high-resolution and wide-field optical remote sensing imaging capabilities. For satellites equipped with panchromatic and multispectral sensors, conventional geometric processing methods in the past involved separate calibration for the panchromatic sensor and the multispectral sensor. This method produced distinct internal and external calibration parameters in the respective bands, and also resulted in nonlinear geometric misalignments between the panchromatic and multispectral images due to satellite chattering and other factors. To better capitalize on the high spatial resolution of panchromatic imagery and the superior spectral resolution of multispectral imagery, it is necessary to perform registration on the calibrated panchromatic and multispectral images. When registering separately calibrated panchromatic and multispectral images, poor consistency between panchromatic and multispectral images leads to a small number of corresponding points, resulting in poor accuracy and registration effects. To address this issue, we propose a joint panchromatic and multispectral calibration method to register the panchromatic and multispectral images. Before geometric calibration, it is necessary to perform corresponding points matching. When matching, the small interval between the panchromatic and multispectral Charge-Coupled Devices (CCDs) results in a small intersection angle of the corresponding points between the panchromatic and multispectral images. As a result of this, the consistency between the spectral bands significantly improves, and the corresponding points match to have a more uniform distribution and a wider coverage. The technique enhances the consistent registration accuracy of both the panchromatic and multispectral bands. Experiments demonstrate that the joint calibration method yields a registration accuracy of panchromatic and multispectral bands exceeding 0.3 pixels.

1. Introduction

On 3 June 2021, the DS-1 satellite was launched flawlessly from the Taiyuan Satellite Launch Center aboard the Long March 2-D launch vehicle. It is currently flying in a Sun-synchronous orbit at an orbital altitude of 535 km and has a mass of roughly 45 kg. The satellite is equipped to perform an optical splicing technique, utilizing three pieces of Charge-Coupled Devices (CCDs), allowing it to capture high-resolution and wide-field optical remote sensing imagery. The satellite covers an area of 17.4 km under the satellite. The positions of the satellite arrangements for each sensor band are displayed in Figure 1. The pixel size of the panchromatic band is 4.5 μm, and the single CCD has 6496 effective pixels with an overlapping pixel count of approximately 850. The pixel size of the multispectral band is 18 μm, and the single CCD has 1624 effective pixels with an overlapping pixel count of approximately 200. The multispectral bands include red, green, blue, and infrared. The thickness of a single CCD is 1.152 mm, and the distance between CCD slices of different spectral bands is 1.62 mm.
As shown in Figure 1, the panchromatic CCD array is positioned centrally in the multispectral four-band array, with narrow intervals between each band. If the registration of both panchromatic and multispectral bands is achieved during calibration, the high-resolution and rich spectral information benefits of the satellite data can be fully harnessed. In recent years, many research groups have dedicated much effort and resources to enhancing the registration accuracy of multispectral sensors via geometric calibration. Foreign studies on the consistency accuracy of satellite multispectral image products have proposed targeted methods. Hayder Dibs et al. employed control point first- and second-order polynomial models to enhance the registration accuracy of RazakSAT satellite images [1]; Grzegorz Miecznik et al. achieved high-precision registration between bands in WorldView-3 satellite images using mutual information [2]; Mark A. Gofortl applied derivative algorithms to achieve sub-pixel accuracy in the alignment of four bands in Quickbird and IKONOS satellite images [3]; Issam Boukerch et al. achieved sub-pixel registration accuracy using a non-central cross-correlation algorithm for Alsat-2 (A and B) satellites, significantly improving the quality of multispectral images [4]. In China, Wang et al. have proposed a satellite multispectral automatic registration method based on geospatial positioning consistency, which enables the automatic registration of multispectral images at the sub-pixel level without requiring image matching [5]. Aiming to address the common field-of-view scanning imaging characteristics of each band in Resource Satellite 3’s multispectral images, Jiang Yonghua et al. developed a virtual CCD re-imaging technique that is founded on the in-orbit calibration of the internal calibration parameters. This technique achieves seamless splicing of single-band CCD images and high-precision band registration of multispectral band. The accuracy of the registration exceeds 0.2 image pixels [6]. Wu Hongyu et al., taking advantage of the imaging characteristics of a large-scale wide-area super multi-detector mechanically interleaved stitching camera, employed a step-by-step iterative method with inter-strip geometric positioning consistency constraints to solve calibration coefficients. The multispectral band-to-band registration accuracy obtained from the Jilin-1 experiment exceeded 0.3 pixels [7]. Pan Hongbo et al. proposed a polynomial-based co-registration method to model the inter-band registration error of the visible and infrared scanning radiometer. Experiments on FY-1C and FY-1D indicated an RMSE mismatch between the thermal and reflective bands of approximately 0.2 to 0.4 pixels [8]. However, the lack of effective research on the registration of panchromatic and multispectral bands greatly hinders the use of high-resolution satellites and leads to significant data redundancy. Therefore, there is an urgent need for high-precision geometric processing of such satellite data.
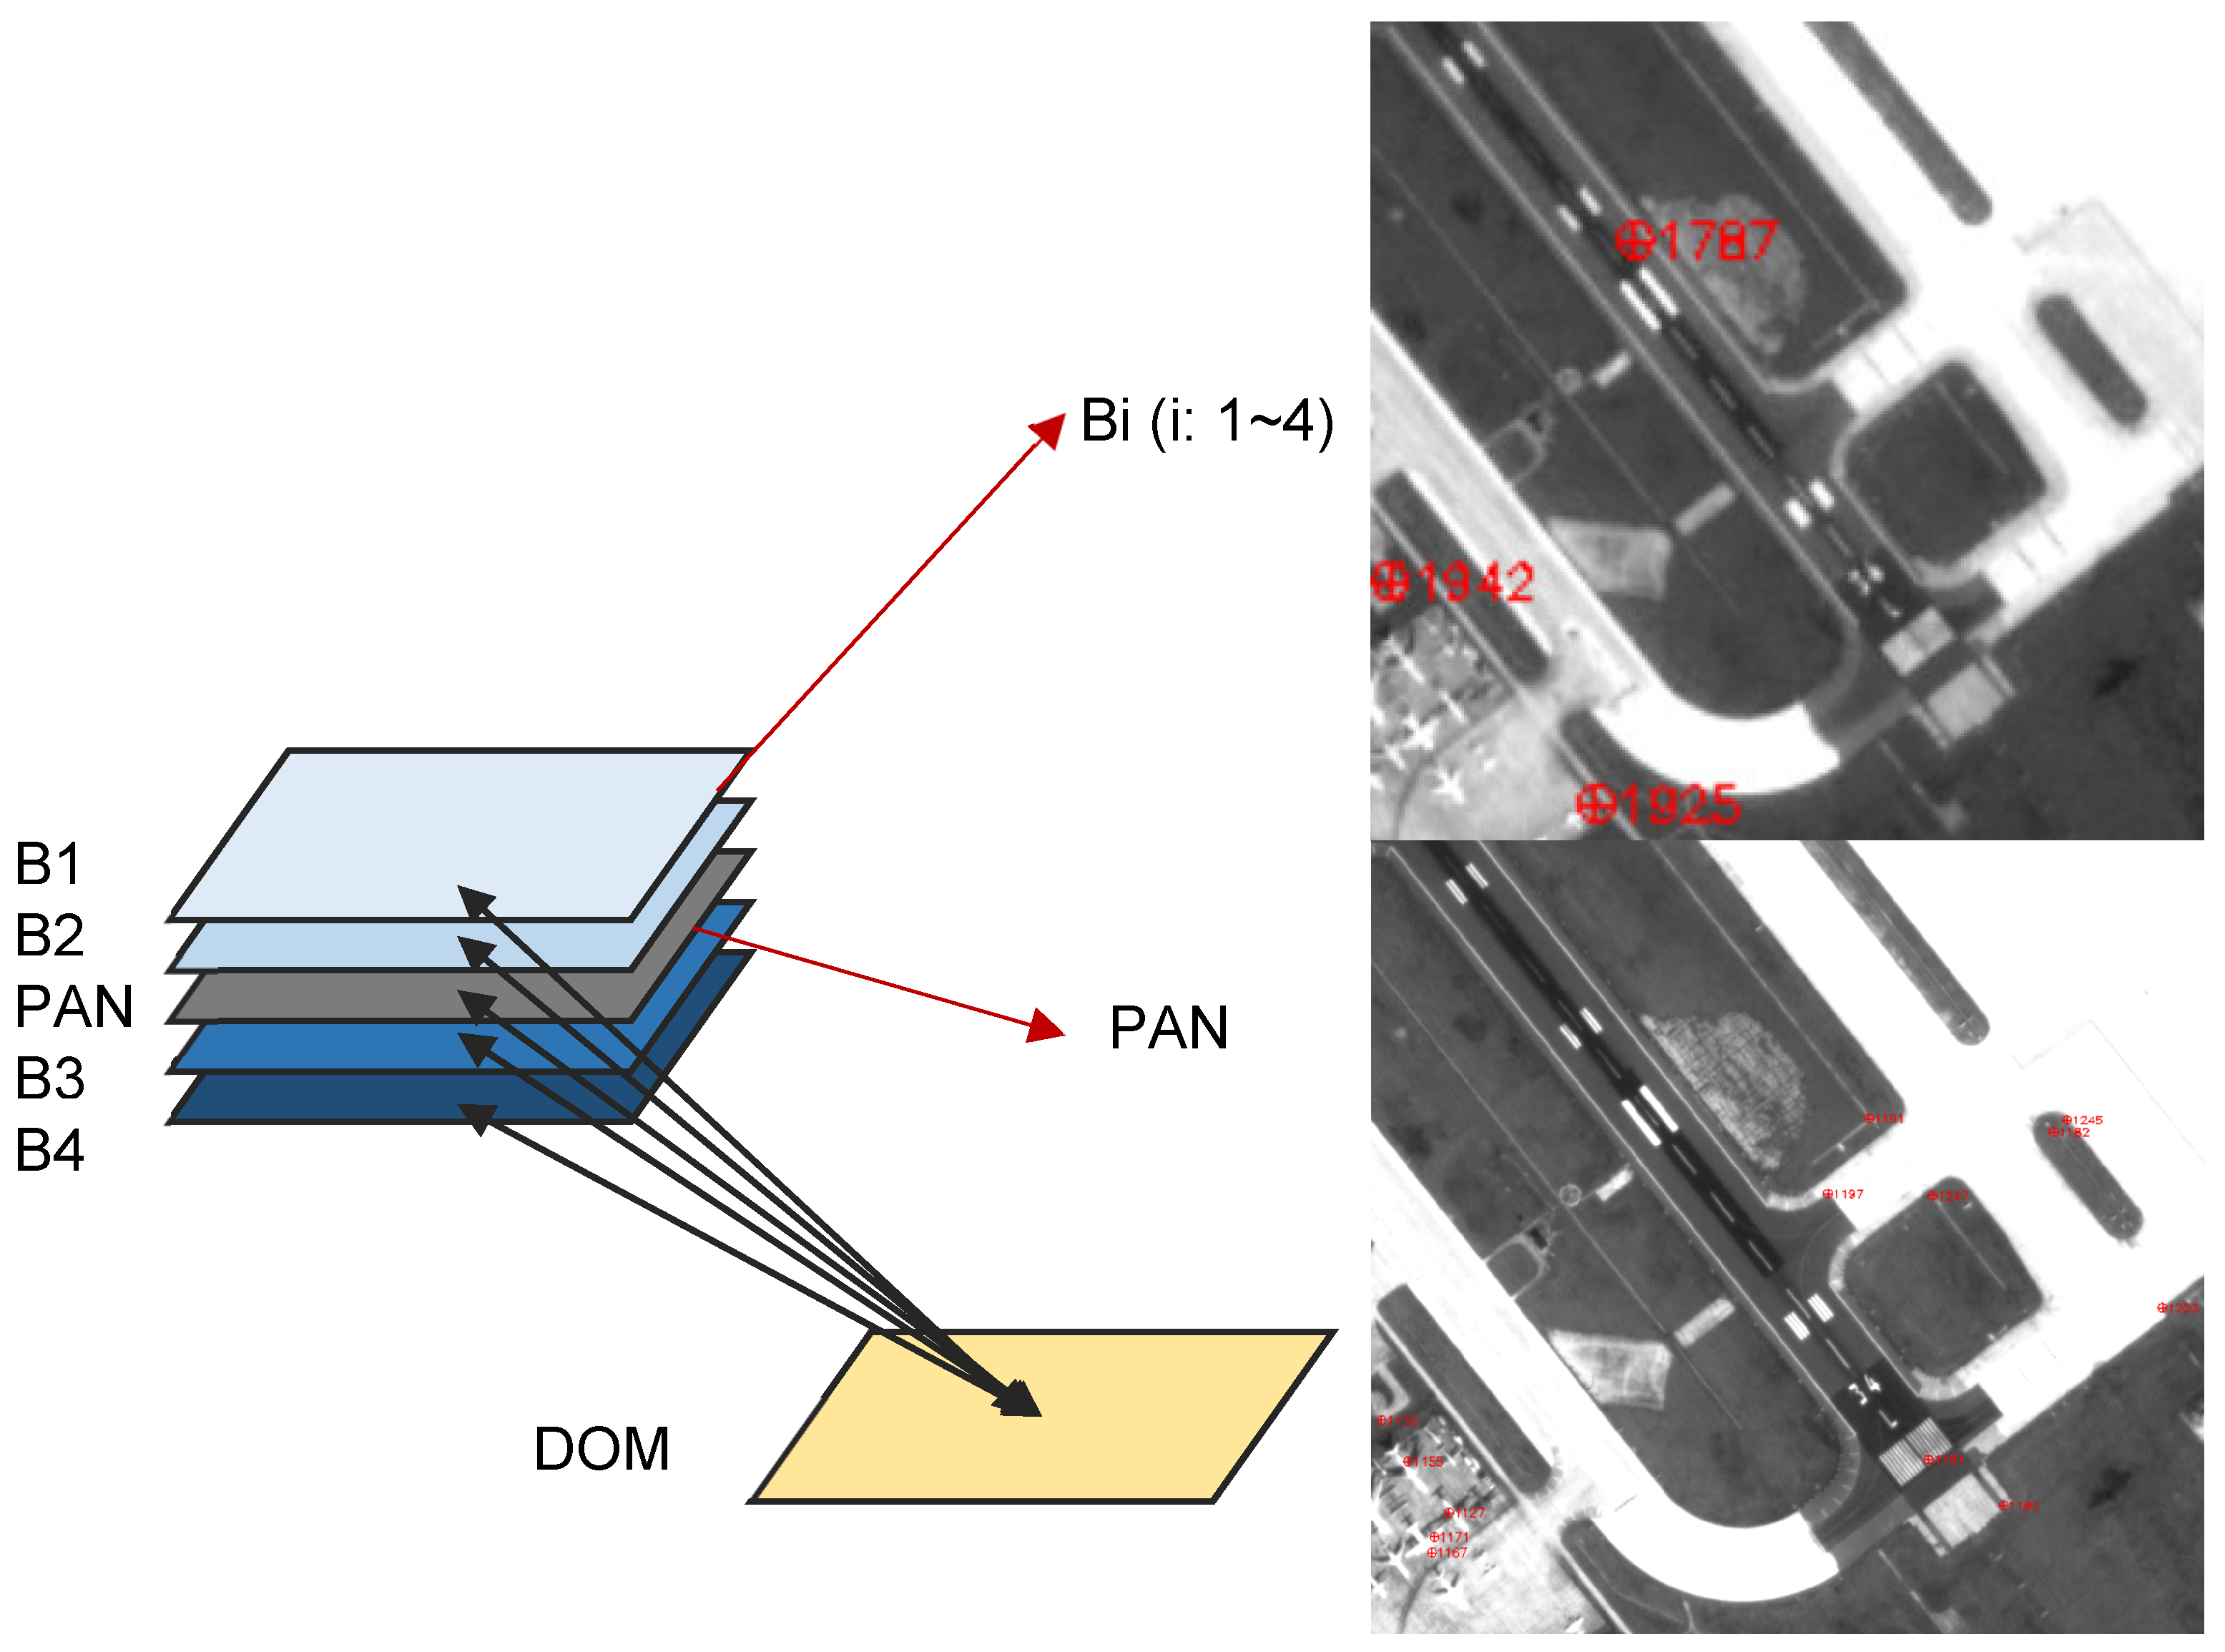
The DS-1 satellite features one panchromatic and four multispectral bands. Geometric misregistration between the panchromatic and multispectral images frequently occurs due to factors such as CCD placement accuracy and lens aberration in both optical sensors, external calibration parameters errors, and satellite platform vibrations. When performing separate single-band geometric calibration, the control points matched to the multispectral band and control data Digital Elevation Model(DEM) have lower precision, are fewer in number, and have uneven distribution due to the lower resolution of the multispectral band compared to the panchromatic band, as shown in Figure 2. This results in different internal and external calibration parameters obtained from calibration and lower geometric positioning accuracy of the multispectral band. Due to the lack of consistency between calibrated panchromatic and multispectral images, they exhibit fewer matched tie points and lower accuracy during registration. Additionally, this matching process is time-consuming and significantly hinders the productivity and effectiveness of subsequent fusion images.
This paper utilizes both panchromatic and multispectral images for geometric calibration based on the DS-1 star’s traits. The panchromatic image can match control point data with greater precision and more consistent distribution thanks to its higher resolution. Meanwhile, the multispectral image can match numerous uniformly distributed and highly accurate corresponding points with the panchromatic image thanks to its brief shooting interval, minimal feature changes, and good spectral segment consistency. The relationship between panchromatic and multispectral images is utilized to minimize the error in intersection caused by elevation error by shooting the same feature with a small intersection angle. This approach ensures that the intersection error accurately represents the error of the positioning model, thus achieving the objective of calibrating the geometric positioning model. Experiments demonstrate that the joint calibration method yields a CCD splicing accuracy superior to 0.3 pixels, while the registration accuracy of panchromatic and multispectral bands exceeds 0.3 pixels. The controlled positioning accuracy is also better than 1.5 m, and the uncontrolled positioning accuracy is superior to 40 m. The paper illustrates the effectiveness of the method.

2. Proposed Method

In this paper, we propose a joint panchromatic and multispectral geometric calibration method and validate it using DS-1 star data. The method flow is illustrated in Figure 3.

2.1. Camera Model and Coordinate System Conversion

The DS-1 satellite features a panchromatic and multispectral camera that employs push-scan imaging while in motion. Each line image conforms to the principle of central projection, enabling the construction of a line array push-scan geometric positioning model [9,10] which is shown in Formula (1).
X Y Z = X S Y S Z S t + m R J 2000 W G S 84 R b o d y J 2000 t R u R c a m e r a b o d y f t a n ψ y i y 0 λ c c d f
where X Y Z T represents the ground point’s coordinates in the WGS84 coordinate system. The position vector of the GPS phase center in the WGS84 coordinate system at the moment t is denoted as X S Y S Z S t T . The scaling coefficient is represented by m. The transformation matrix of the J2000 coordinate system concerning the WGS84 coordinate system at the moment t is symbolized as R J 2000 W G S 84 t . Additionally, the satellite body coordinate system concerning the J2000 coordinate system at the moment t is represented as R b o d y J 2000 t . Additionally, the bias matrix is R u and the camera mounting matrix R c a m e r a b o d y refers to the transformation matrix of the camera coordinate system relative to the satellite body coordinate system. Lastly, the coordinate of the point in the camera coordinate system is expressed as f t a n ψ y i y 0 λ c c d f T .
Based on the effects of errors on the geometric positioning model, the above model divides errors into two categories for compensation. The first category includes external parameters errors that affect light pointing and consist of orbit position errors, on-board attitude system errors, and equipment installation errors. The bias matrix R u compensates for these errors. The external parameters error is attributed to the sum of three angles: the pitch angle φ rotated around the Y-axis, the roll angle ω rotated around the X-axis, and the yaw angle κ rotated around the Z-axis. The composition of R u is shown in Formula (2).
R u = c o s φ 0 s i n φ 0 1 0 s i n φ 0 c o s φ 1 0 0 0 c o s ω s i n ω 0 s i n ω c o s ω c o s κ s i n κ 0 s i n κ c o s κ 0 0 0 1
Internal image distortion errors arise from internal parameters errors, such as principal point position offset error, focal length error, CCD size errors, CCD rotation errors, and lens distortions. These errors are addressed through compensation via the pointing angle polynomial model. In this model, light rays are decomposed in the camera coordinate system along the X and Y axes to obtain pointing angles φ x and φ y . After compensating for the internal and external parameters, the geometric positioning model is shown in Formula (3).
X Y Z = X S Y S Z S t + m R J 2000 W G S 84 R b o d y J 2000 t R u R c a m e r a b o d y t a n φ x t a n φ y 1
Fitting these two pointing angles with a polynomial with line number s as the independent variable is shown [11] in Formula (4):
t a n φ x = a 0 + a 1 s + a 2 s 2 + a i s i i 5 t a n φ y = b 0 + b 1 s + b 2 s 2 + b j s j j 5
Substituting Formula (4) into Formula (3) yields the geometric positioning model for a single band of the DS-1 satellite, as shown in Formula (5).
X Y Z = X S Y S Z S t + m R J 2000 W G S 84 R b o d y J 2000 t R u R c a m e r a b o d y a 0 + a 1 x + a 2 x 2 + a i x i b 0 + b 1 x + b 2 x 2 + b j x j 1
The potential impact of the correlation between R u coefficients and the pointing angle polynomial model on the results can be minimized through iterative solutions of both coefficients. The high-precision control point’s image point coordinates and ground point coordinates are acquired by matching images between a single band and the control data Digital Orthophoto Map(DOM). The image point coordinates of corresponding points between neighboring CCDs of a single band serve as known values, and they are resolved via error equation squaring. Consequently, the internal and external calibration parameters of a single band can be derived.

2.2. Multi-Class Corresponding Point Calibration Solving

Matching the four multispectral bands with the panchromatic image can result in high-precision inter-band corresponding points, due to the brief time interval for imaging between bands. By calibrating the joint inter-band corresponding points alongside control points matched to the panchromatic image and the inter-CCD corresponding points matched to each band, further alignment accuracy is achieved.
When integrating inter-CCD and inter-band corresponding points into the joint calibration process, it is important to first solve for the ground point coordinates of these corresponding points. Due to the brief imaging time interval between the corresponding points of CCDs and bands, the angle of intersection between said corresponding points is small. Therefore, using the DEM to facilitate the extraction of the initial value of the elevation of corresponding points is advisable. Applying the ellipsoid equation and utilizing the initial elevation value, we express the ground coordinate Z of a given point as a function of X and Y. By then solving for the least-squares adjustment, we can determine the ground point coordinates of the corresponding points. The process of solving is outlined below.
The ground point coordinates of the point of the same name are labeled X l Y l Z l T , which is substituted into Formula (3), and Formula (3) is deformed to Formula (6):
R J 2000 W G S 84 R B o d y J 2000 R u 1 X l X s Y l Y s Z l Z s = m t a n φ x t a n φ y 1
Denote R J 2000 W G S 84 R B o d y J 2000 R u 1 as r 0 r 1 r 2 r 3 r 4 r 5 r 6 r 7 r 8 , r 0 r 9 , all known values; let X Y Z = R J 2000 W G S 84 R B o d y J 2000 R u 1 X l X s Y l Y s Z l Z s to get the Formula (7):
X = r 0 X l X s + r 1 Y l Y s + r 2 Z l Z s Y = r 3 X l X s + r 4 Y l Y s + r 5 Z l Z s Z = r 6 X l X s + r 7 Y l Y s + r 8 Z l Z s
Substituting Formula (7) into Formula (6) yields Formula (8):
X = m   t a n φ x Y = m   t a n φ y Z = m
Establishing the equation by eliminating m from the above equation, let f x = X Z t a n φ x , f y = Y Z t a n φ y . Only X l , Y l , Z l among f x and f y are unknowns. From the elevation h obtained through the DEM intersection and the ellipsoid equation Formula (9), the relationship between Z l and X l , Y l can be obtained in Formula (10):
X 2 + Y 2 a + h 2 + Z 2 b + h 2 = 1
Z l = ± b + h 2 b + h 2 a + h 2 X l 2 + Y l 2
At this point, there are only two independent variables in the equation, X l and Y l . This is obtained by expanding f x and f y according to the Taylor series, and retaining the primary term, we can get Formula (11):
f x = f x 0 + f x X l d X l + f x Y l d Y l f y = f y 0 + f y X l d X l + f y Y l d Y l
According to Formula (11), the ground point coordinates X l Y l Z l T can be solved by least-squares adjustment for the corresponding point.
After obtaining the ground point coordinates of the corresponding points, the error equation for joint calibration can be written. The ground point coordinates of the panchromatic image and the high-precision control points matching the DOM are labeled as X c Y c Z c T . The ground point coordinates of the corresponding points are still noted as X l Y l Z l T , and they are brought into the push-scan geometric localization model Formula (5) in X Y Z T . Let R u = r 1 r 2 r 3 r 4 r 5 r 6 r 7 r 8 r 9 , and Formula (5) can be simplified to Formula (12):
X b Y b Z b = m R u x b y b z b
Further,
x b y b z b = R c a m e r a b o d y a 0 + a 1 s + a 2 s 2 + a i s i b 0 + b 1 s + b 2 s 2 + b i s i 1
X b Y b Z b = R J 2000 W G S 84 R B o d y J 2000 1 X c X s Y c Y s Z c Z s C o n t r o l   p o i n t X b Y b Z b = R J 2000 W G S 84 R B o d y J 2000 1 X l X s Y l Y s Z l Z s c o r r e s p o n d i n g   p o i n t
obtained Formula (15) by eliminating m:
f x = X b Z b r 1 x b + r 2 y b + r 3 z b r 7 x b + r 8 y b + r 9 z b f y = Y b Z b r 4 x b + r 5 y b + r 6 z b r 7 x b + r 8 y b + r 9 z b
The above equation is linearized and solved by least-squares adjustment. where the control point error equation is linearized as Formula (16):
f x = f x 0 + f x φ u d φ u + f x ω u d ω u + f x κ u d κ u + f x a 0 d a 0 + + f x a i d a i + f x b 0 d b 0 + + f x b i d b i f y = f y 0 + f y φ u d φ u + f y ω u d ω u + f y κ u d κ u + f y a 0 d a 0 + + f y a i d a i + f y b 0 d b 0 + + f y b i d b i
The corresponding point error equation is linearized as Formula (17):
f x = f x 0 + f x φ u d φ u + f x ω u d ω u + f x κ u d κ u + f x a 0 d a 0 + + f x a i d a i + f x b 0 d b 0 + + f x b i d b i + f x X l d X l + f x Y l d Y l f y = f y 0 + f y φ u d φ u + f y ω u d ω u + f y κ u d κ u + f y a 0 d a 0 + + f y a i d a i + f y b 0 d b 0 + + f y b i d b i + f y X l d X l + f y Y l d Y l
Join Formulas (16) and (17) to construct the error equation, Formula (18):
v = A x l , p
where p represents the weight matrix, which is the prior error of the observation value; A is the coefficient matrix expressed as Formula (19):
A = E D 0 D 1 D 2 D 3 D 4 F
where E represents the matrix of bias angle coefficients, specifically contained in Formula (20):
E = f 1 _ x φ u f 1 _ x ω u f 1 _ x κ u f 1 _ y φ u f 1 _ y ω u f 1 _ y κ u f n _ x φ u f n _ x ω u f n _ x κ u f n _ y φ u f n _ y ω u f n _ y κ u
where f n _ x , f n _ y represents the two equations established by each pair of observations, and each term in E is the partial derivative of f n _ x , f n _ y with respect to the three bias angles φ u , ω u ,   a n d   κ u , respectively, in R u , which can be obtained according to Equation (14).
The bias coefficient values of f n _ x , f n _ y for the bias angle can be obtained separately by taking the initial value of the bias angle into Equation (21). Since the panchromatic and multispectral bands are located on the same camera, the same bias matrix is used to correct the external calibration parameters for each band.
In Equation (19), D 0 D 1 D 2 D 3 D 4 represents the matrix of the bias coefficients of f n _ x , f n _ y with respect to the pointing angle coefficients for the panchromatic and multispectral bands, respectively. Take D 0 as an example; the D 0 matrix is specified as Formula (21):
D 0 = f 1 _ x a 0 f 1 _ x a i f 1 _ x b 0 f 1 _ x b i f 1 _ y a 0 f 1 _ y a i f 1 _ y b 0 f 1 _ y b i f n _ x a 0 f n _ x a i f n _ x b 0 f n _ x b i f n _ y a 0 f n _ y a i f n _ y b 0 f n _ y b i
where f n _ x , f n _ y represents the two equations established through each pair of observations, respectively. Let R c a m e r a b o d y = θ 1 θ 2 θ 3 θ 4 θ 5 θ 6 θ 7 θ 8 θ 9 . Substituting into Equation (13) yields Formula (22):
x b y b z b = θ 1 a 0 + a 1 x + a 2 x 2 + a i x i + θ 2 b 0 + b 1 x + b 2 x 2 + b j x j + θ 3 θ 4 a 0 + a 1 x + a 2 x 2 + a i x i + θ 5 b 0 + b 1 x + b 2 x 2 + b j x j + θ 6 θ 7 a 0 + a 1 x + a 2 x 2 + a i x i + θ 8 b 0 + b 1 x + b 2 x 2 + b j x j + θ 9
Then each term of D 0 is calculated as Formula (23):
f n _ x a 0 = θ 1 z b θ 7 x b z b 2 f n _ x a i = θ 1 x i z b θ 7 x i x b z b 2 f n _ x b 0 = θ 2 z b θ 8 x b z b 2 f n _ x b i = θ 2 x i z b θ 8 x i x b z b 2 ,   f n _ y a 0 = θ 4 z b θ 7 y b z b 2 f n _ y a i = θ 4 x i z b θ 7 x i y b z b 2 f n _ y b 0 = θ 5 z b θ 8 y b z b 2 f n _ y b i = θ 5 x i z b θ 8 x i y b z b 2
D 1 D 4 is solved in the same way as D 0 .
In Equation (19), F represents the matrix of partial derivatives of f n _ x , f n _ y with respect to the ground point coordinates of the point of the same name, denoted as Formula (24):
F = f 1 _ x X l 1 f 1 _ x Y l 1 0 0 f 1 _ y X l 1 f 1 _ y Y l 1 0 0 0 0 0 0 0 f n _ x X l 1 f n _ x Y l 1 0 0 0 f n _ y X l n f n _ y Y l n
where X l n   Y l n   represents the 3D coordinates of the ground point corresponding to the n-th pair of corresponding points. According to the second equation of Equation (14), let R J 2000 W G S 84 R B o d y J 2000 1 ϕ 1 ϕ 2 ϕ 3 ϕ 4 ϕ 5 ϕ 6 ϕ 7 ϕ 8 ϕ 9 . Substitution gives Formula (25):
X b Y b Z b = ϕ 1 X l X s + ϕ 2 Y l Y s + ϕ 3 Z l Z s ϕ 4 X l X s + ϕ 5 Y l Y s + ϕ 6 Z l Z s ϕ 7 X l X s + ϕ 8 Y l Y s + ϕ 9 Z l Z s
According to the ellipsoid model mentioned above, Z l can be represented by X l and Y l ; then the only independent variables in the equation are X l and Y l . The values of the coefficient matrix F are obtained in Formula (26) by calculation:
f x X l = ϕ 1 + ϕ 3 Z l X l Z b ϕ 7 + ϕ 9 Z l X l X l Z b 2 f x Y l = ϕ 2 + ϕ 3 Z l Y l Z b ϕ 8 + ϕ 9 Z l Y l Y l Z b 2 f y X l = ϕ 4 + ϕ 6 Z l X l Z b ϕ 7 + ϕ 9 Z l X l X l Z b 2 f y Y l = ϕ 5 + ϕ 6 Z l Y l Z b ϕ 8 + ϕ 9 Z l Y l Y l Z b 2
where Z l X l = ± b + h 2 a + h 2 1 b + h 2 b + h 2 a + h 2 X l 2 + Y l 2 X l ; Z l Y l = ± b + h 2 a + h 2 1 b + h 2 b + h 2 a + h 2 X l 2 + Y l 2 Y l where a and b represent the ellipsoid long and short semi-axes, respectively; and h represents elevation. For the WGS84 ellipsoid, there are a = 6,378,137.0 m and b = 6,356,752.3 m.
In Equation (25), the least-squares adjustment parameter x (Formula (27)) corresponding to the coefficient matrix A is:
x = d φ u d ω u d κ u d a 0 _ 0 d a 0 _ i d b 1 _ 0 d b 1 _ i d a 4 _ 0 d a 4 _ i d b 4 _ 0 d b 4 _ i d X l 1 d Y l 1 d X l n d Y l n T
where a n _ i , b n _ i represent the n-th band pointing angle model coefficients, and X l n , Y l n represent the geographic coordinates corresponding to the n-th pair of corresponding points. P represents the observation weight matrix. L represents the initial value f x 0 f y 0 T , which is calculated based on the individual observations. According to the principle of least squares, x = A T P A 1 A T P L can be calculated by utilizing the given values in the formula. The calculated initial values are then updated through iterative processes, and the joint calibration parameter is obtained once the result is less than a specific threshold value.

3. Results and Discussion

3.1. Data Sources

The calibration fields of Tianjin, Songshan, and Taiyuan were selected as the control data, and the images of the three calibration fields captured by the DS-1 satellite were used as the calibration scenes for the joint panchromatic and multispectral calibration, and the internal and external calibration parameters obtained were used to correct the DS-1 positioning model. The DS-1 images of Tianjin, Fangshan in Beijing, Taihangshan, Zhanjiang in Guangdong, Songshan in Henan, and Taiyuan in Shanxi were selected as the validation scenes for the sensor calibration, which was to further validate the robustness of the present methodology.
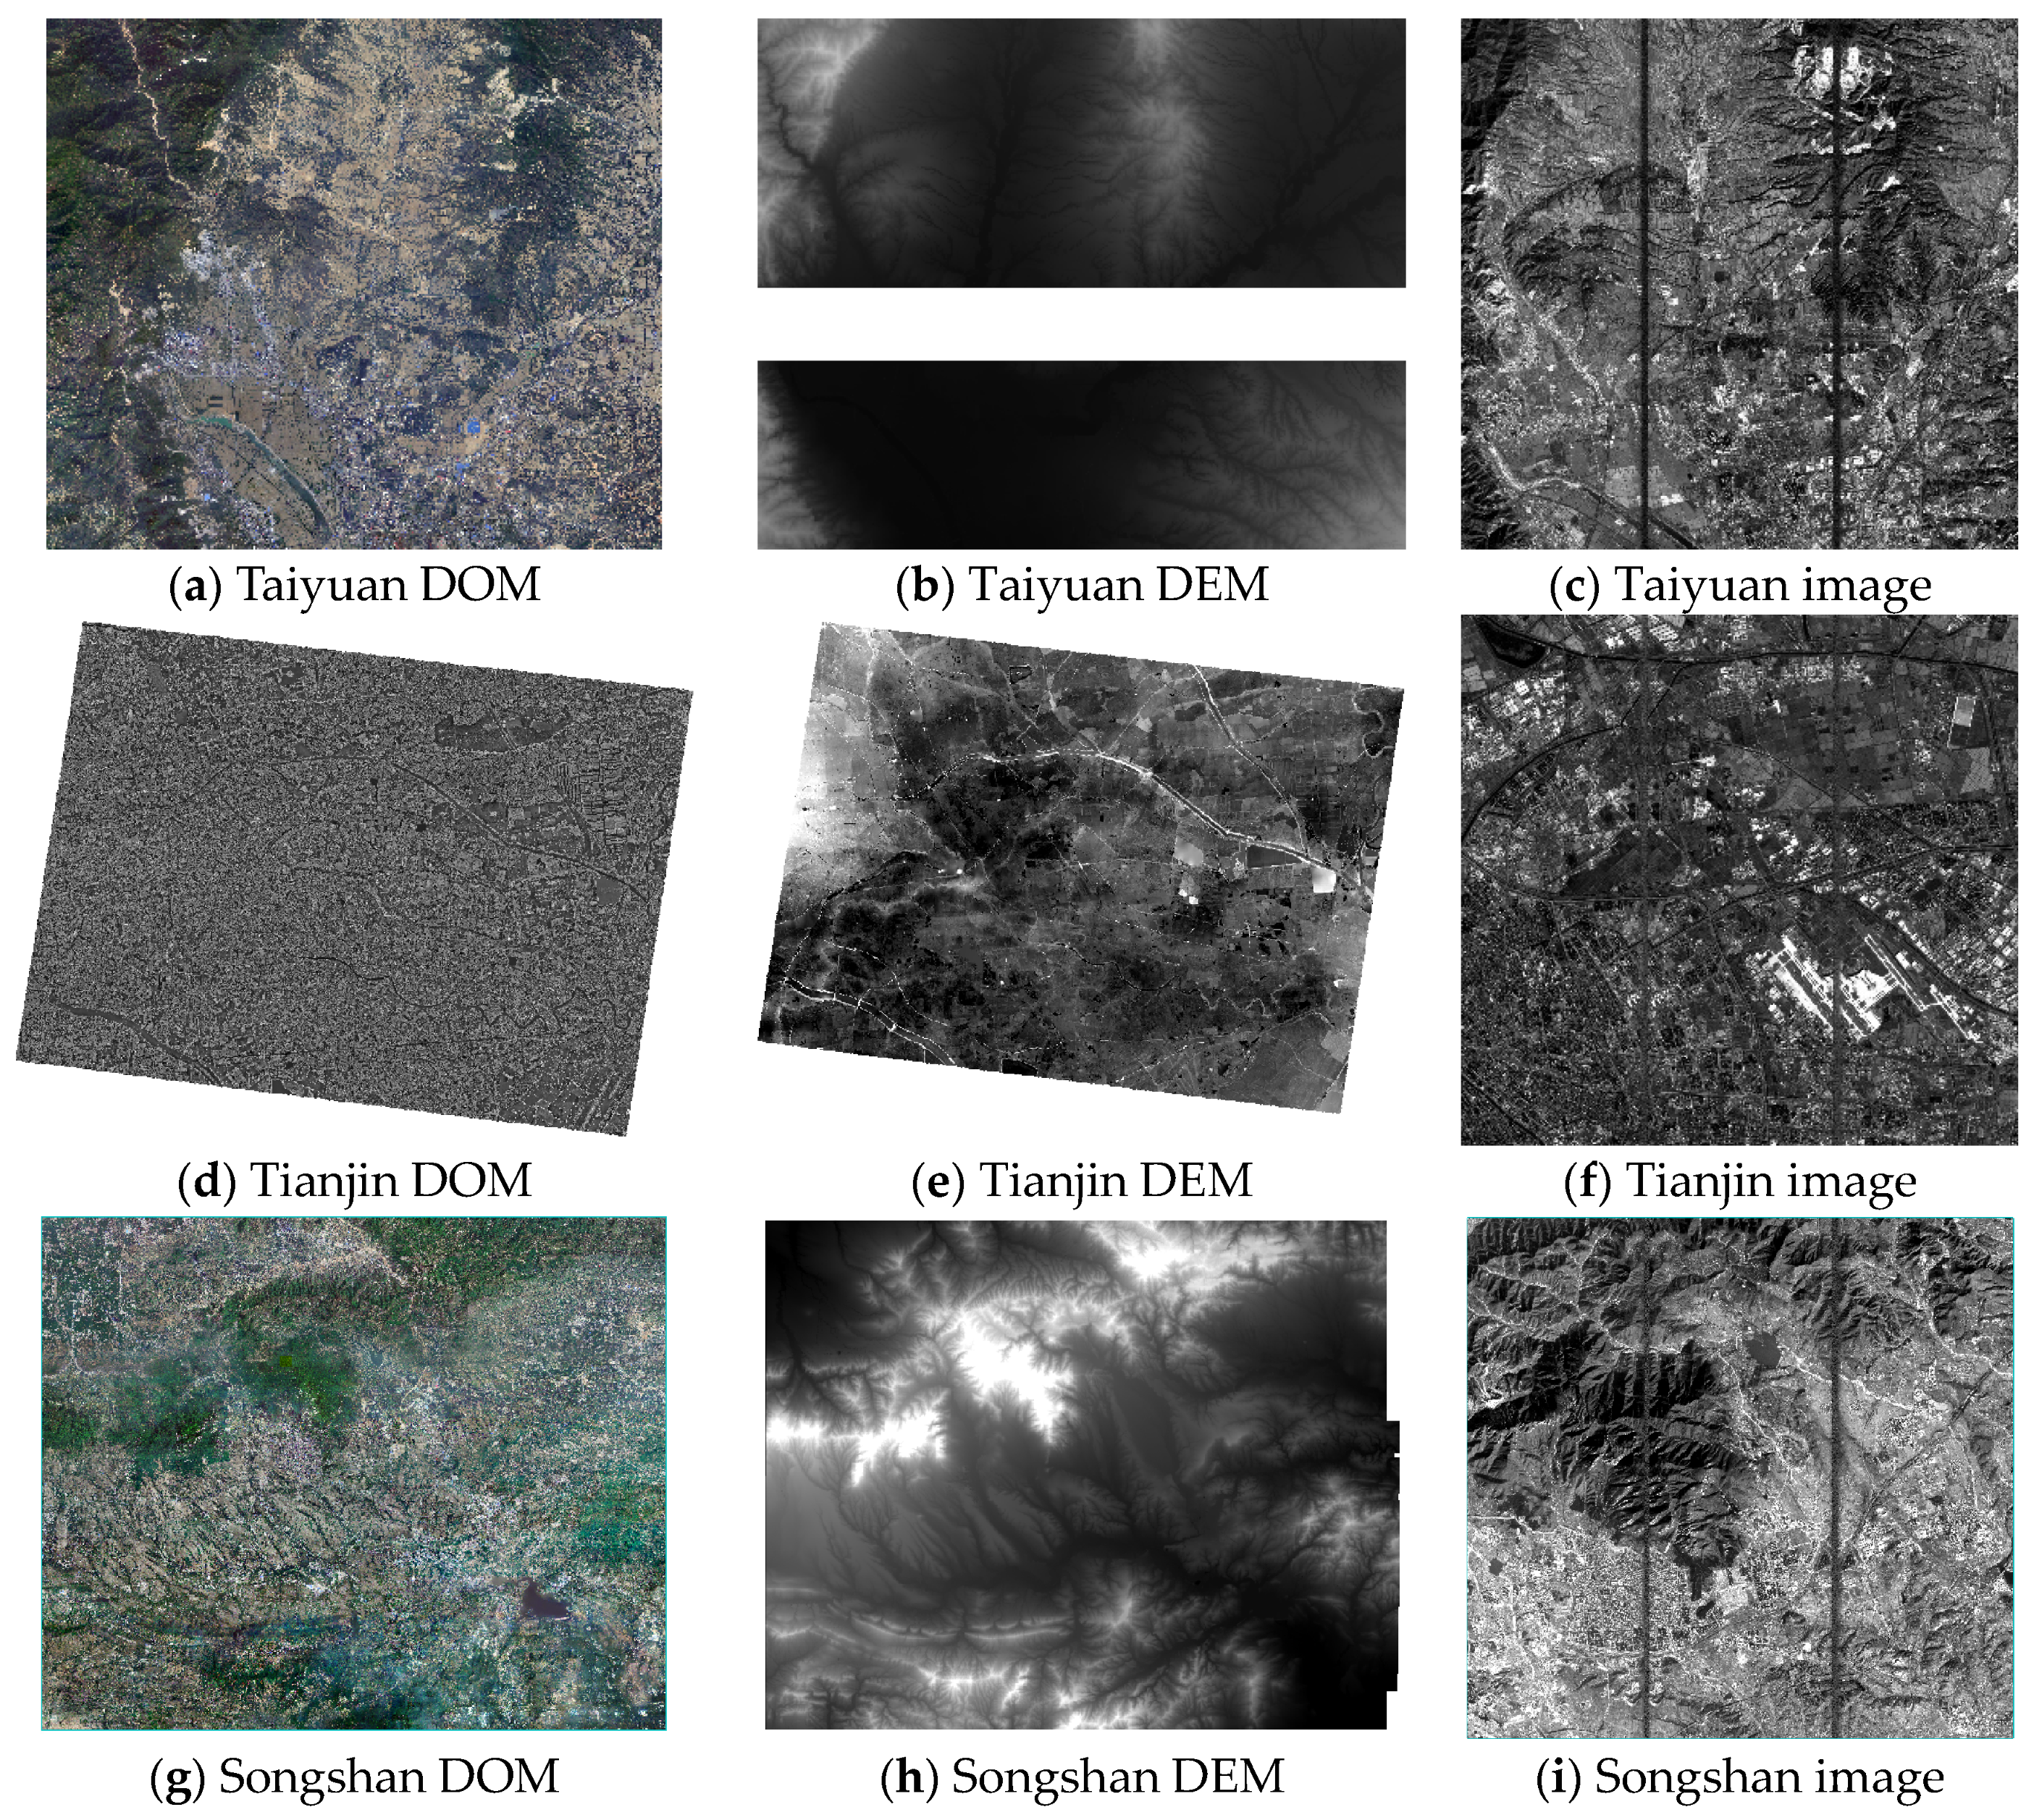
The control data information is as follows: the terrain of Taiyuan, Shanxi is a combination of mountains and plains, and the DOM of the Taiyuan calibration field meets the scale of 1:5000 with a resolution of 0.5 m and the DEM resolution of 3 m. The topography of Tianjin is dominated by plains, and the DOM of the Tianjin calibration scene meets the scale of 1:2000 with a resolution of 0.2 m and a DEM resolution of 5.5 m. The terrain of Songshan, Henan is a combination of mountains and plains, and the DOM of the Songshan calibration scene meets the scale of 1:2000 with a resolution of 0.2 m and a DEM resolution of 2 m. The corresponding and control points during the calibration are automatically acquired with a scale-invariant feature transform (SIFT) [12] and least-squares matching [13]. The control data and image thumbnails are shown in Figure 4. The control image information is shown in Table 1.
As presented in Table 2, six sets of image data, which include the Tianjin calibration field, were selected for verification. Out of these, four sets, Fangshan, Beijing, Taihangshan, Beichen, Tianjin, and Zhanjiang, Guangdong, were gathered through GPS external measurement and manual visualization to obtain check data with the accuracy of object-square coordinate measurement better than 0.1 m and the accuracy of image-square coordinate point selection better than 0.3 pixels. Songshan, Henan and Taiyuan, Shanxi utilize a high-precision DOM and the matching method to gather checkpoints, resulting in a substantial amount of data. The images captured in Tianjin and Zhanjiang of Guangdong Province display mainly plains, whereas Taihangshan comprises mainly mountains. Images of Taiyuan in Shanxi Province, Fangshan in Beijing, and Songshan in Henan Province depict a combination of mountains and plains. The experimental data encompass all types of terrain from November 2021 to January 2022.

3.2. CCD Splicing Accuracy Verification

The joint panchromatic and multispectral geometric calibration model matches single-band inter-CCD corresponding points, eliminating nonlinear geometric misalignments between the CCDs and internal image distortions, and seamlessly stitches multiple CCDs to compose an integrated image in a predetermined order. Despite the intricate nature of the corresponding point types, the joint least-squares adjustment solution for inter-CCD corresponding points and other corresponding points ensures robust inter-slice splicing accuracy. The positioning error of corresponding points was used to quantify the CCD splicing accuracy. Table 3 indicates that the CCD splicing accuracies of image products have a difference of fewer than 0.3 pixels, resulting in seamless image products, as illustrated in Figure 5. Additionally, the CCD splicing accuracies for the products of the joint panchromatic and multispectral calibration, the panchromatic separate calibration, and the separate calibration of the multispectral image are consistent. The accuracy of the Taihangshan image’s splicing is comparatively lower than that of the other images in each scene, which can be attributed to the mountain’s higher altitude.
Figure 5 displays the DS-1 image before and after image stitching in the calibration field area of Tianjin. The figure on the upper right depicts the original image, while the figure on the lower right portrays the sensor-corrected image. The image provided indicates that the sensor-corrected image exhibits a more satisfactory splicing effect than the original image, with no discernible splicing seam. The corrective product’s splicing effect is good when viewed as a whole, in accordance with the previously tested splicing accuracy results.

3.3. Geometric Positioning Accuracy Verification

The checkpoints for the verification view image were obtained during the verification process. The geometric positioning accuracy of the calibration results, which is categorized as uncontrolled and controlled positioning accuracy, can be calculated by using these checkpoints. The Rational Polynomial Coefficients (RPCs) model calculates the geographic coordinates to which the image point coordinates correspond. The resulting error between those coordinates and the actual geographic coordinates determines the uncontrolled positioning accuracy of the sensor-corrected product. The existing checkpoints were utilized as control points to correct the RPC of the sensor-corrected image. The updated RPC was then calculated utilizing these checkpoints as the controlled positioning accuracy of the sensor-corrected product. The uncontrolled positioning accuracy can indicate whether the calibration coefficient’s range is precise or not, while the controlled positioning accuracy can demonstrate the removal of internal aberrations in calibration coefficients and validate the internal accuracy of calibration results. From Table 4, Positioning accuracy statistics for sensor calibration products, it is evident that when comparing the geometric positioning accuracy of joint calibration with individual calibration, the uncontrolled and controlled positioning accuracy levels of joint calibration and panchromatic individual calibration remain the same. However, this is better than the results of multispectral individual calibration.
According to Table 4’s experimental data on sensor calibration product positioning accuracy statistics, the calibration positioning accuracy of the panchromatic image alone is superior to that of the calibration of the multispectral image alone. The uncontrolled positioning accuracy between the two is within a range of 1–3 m, while the controlled positioning accuracy has a difference of 0.5 m. The panchromatic multispectral joint calibration product and the calibration product of the panchromatic image alone have a positioning accuracy within 2 m, with the controlled positioning accuracy at the same level. The discrepancy in positioning accuracy between panchromatic–multispectral joint calibration and panchromatic-image-separate calibration is around 2 m, while the variation in controlled positioning accuracy is comparable.
Upon evaluating the outcomes of panchromatic–multispectral joint calibration, the uncontrolled positioning accuracy is within 40 m. Tianjin (calibrated images) provided the most accurate uncontrolled positioning, with a variation of only 1 m. The high-precision DOM of Songshan in Henan and Taiyuan in Shanxi serve as accurate check images, enabling the matching of control points with greater precision. As a result, the positioning accuracy calculations for these scenes are more exact. Analyzing the results reveals that the uncontrolled positioning accuracies of the panchromatic image, multispectral image, and panchromatic–multispectral joint calibrated image are all within 5 m. The time gap between the capture of the images of Fangshan in Beijing and Taihangshan and the calibrated images is significant, leading to a relatively low positioning accuracy, within 20 m. The satellite’s side oscillation angle in Beichen, Tianjin was recorded as −13.62°, a significant deviation from the calibrated view’s side oscillation angle. The decrease in positioning accuracy of this view is influenced by the satellite’s side oscillation angle. The joint calibration method effectively corrects the external calibration parameters of the image products, ensuring the accuracy of the positioning of the image products.
The addition of control significantly enhances the positioning accuracy of individual images compared to those without control. The internal accuracy of image products is notably high, with the positioning accuracy of panchromatic multispectral joint calibration reaching within 1 m. The error resulting from uncontrolled positioning is mainly due to systematic bias caused by external calibration parameters. The use of control points effectively eliminates systematic errors in the image, leading to a substantial improvement in the image’s positioning accuracy. The joint calibration method has a significant impact on correcting the internal calibration parameters of image products, thereby ensuring the accurate elimination of their internal distortion.
The experiment results indicate no notable decrease in the calibration accuracy of joint calibration products relative to the individual calibration of specific images. The joint calibration method has effectively eliminated internal calibration parameter errors, contributing to the improved positioning accuracy of the image products of various bands. The accuracy between panchromatic and multispectral images and the joint calibration product exhibits minimal error. Additionally, the controlled positioning accuracy has significantly improved compared to the uncontrolled positioning accuracy.

3.4. Consistent Registration Accuracy Validation for Different Spectral Bands

The primary benefit of conducting joint panchromatic multispectral calibration as opposed to individual calibration is the enhancement of uniformity between the panchromatic and multispectral bands. One can assess the accuracy of the products by evaluating the consistency of the sensor calibration through the use of the RPC, which calculates the corresponding point positioning error derived from the matching of different bands [14]. Table 5 illustrates the registration accuracy of panchromatic and multispectral points and between multispectral bands for the joint panchromatic–multispectral calibration products. The results indicate that after the joint calibration, the registration accuracy between panchromatic and multispectral points with the same name and between multispectral bands reaches the same level.
Table 5 documents the consistency accuracies of the sensor calibration products’ different bands. The average registration accuracy between panchromatic and multispectral bands is calculated based on the consistency accuracies between panchromatic images and multispectral images for each band. Registration accuracies for panchromatic and multispectral images are measured in panchromatic image pixels and those for the registration accuracies between multispectral bands are measured in multispectral image pixels. The registration accuracy between the panchromatic and multispectral bands is approximately 0.1 to 0.3 pixels, while the accuracy between the bands within the multispectral image is approximately 0.1 pixels. The registration accuracy between the panchromatic image and the multispectral image is at the same level as the registration accuracy between the bands within the multispectral image. This is confirmed by the panchromatic image pixel being four times larger than the multispectral image pixel. The joint calibration method has increased the registration accuracy between the panchromatic and the multispectral images.
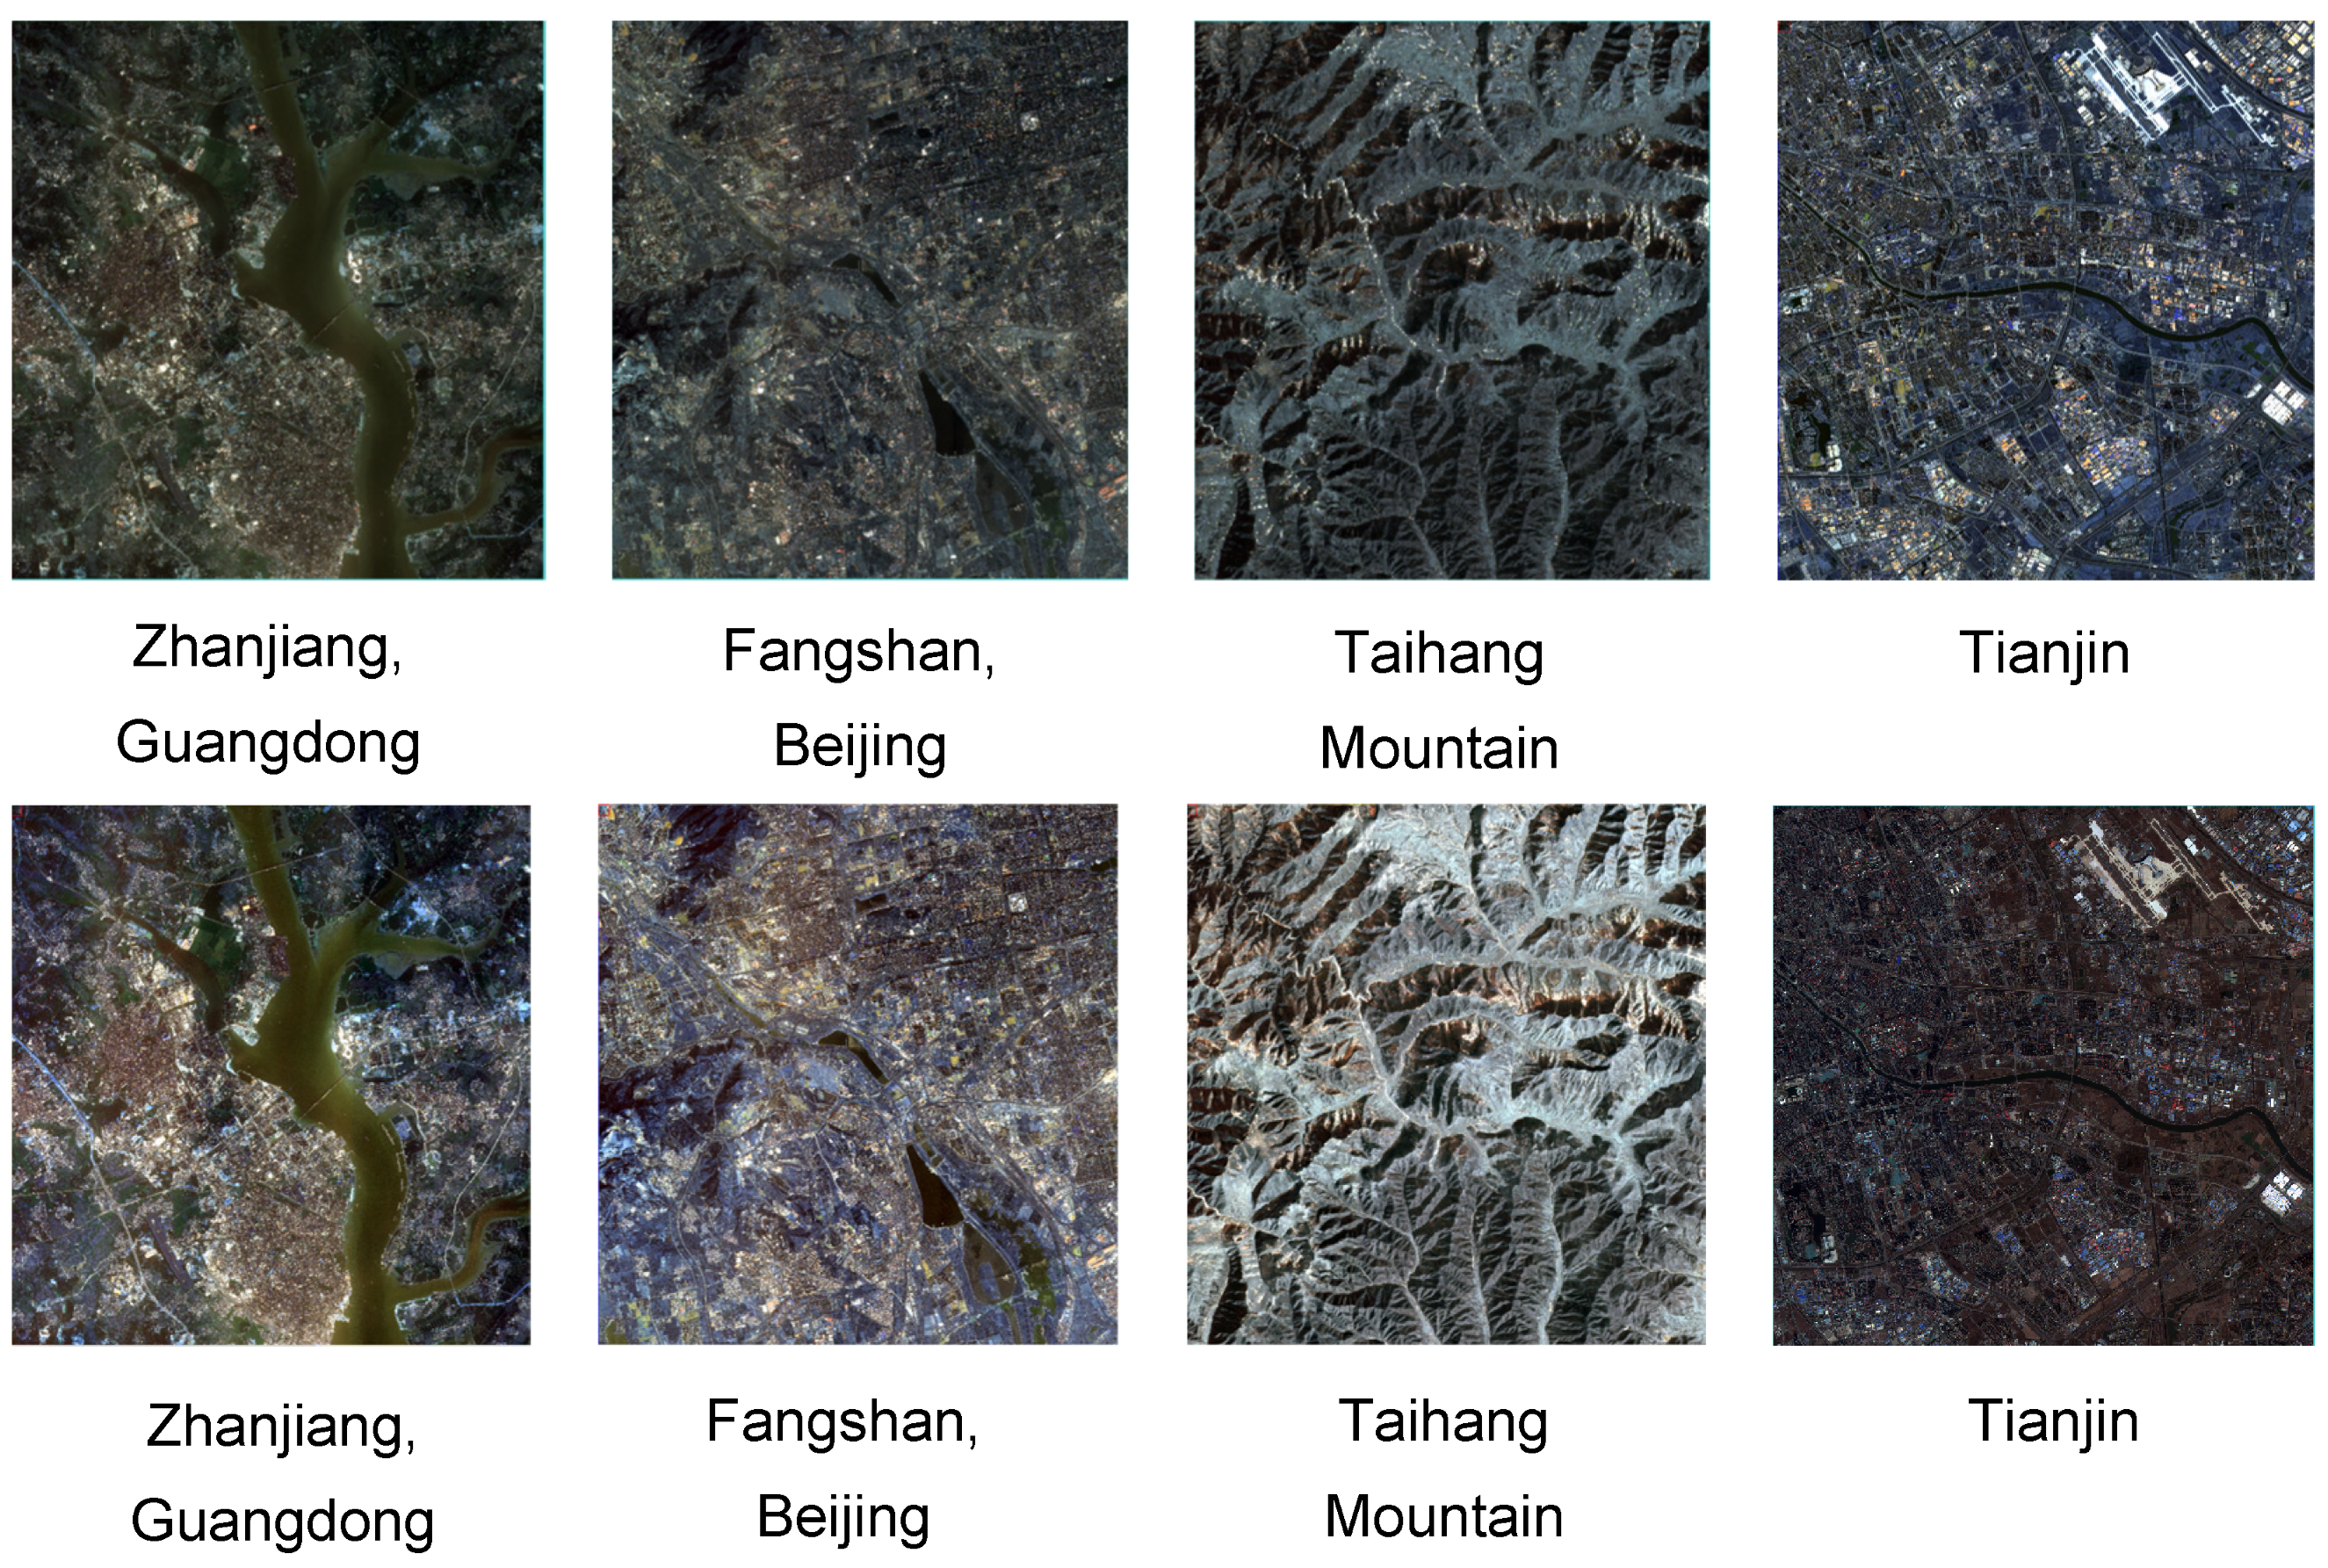
False-color images were created using the panchromatic, B1, and B2 bands found in the joint calibration products of the panchromatic–multispectral sensor. Due to the precise registration of the panchromatic and multispectral images, fusion based on the image’s pixel–position relationship can be directly carried out to obtain high-precision geometric processing products of the DS-1 satellite. As shown in Figure 6.
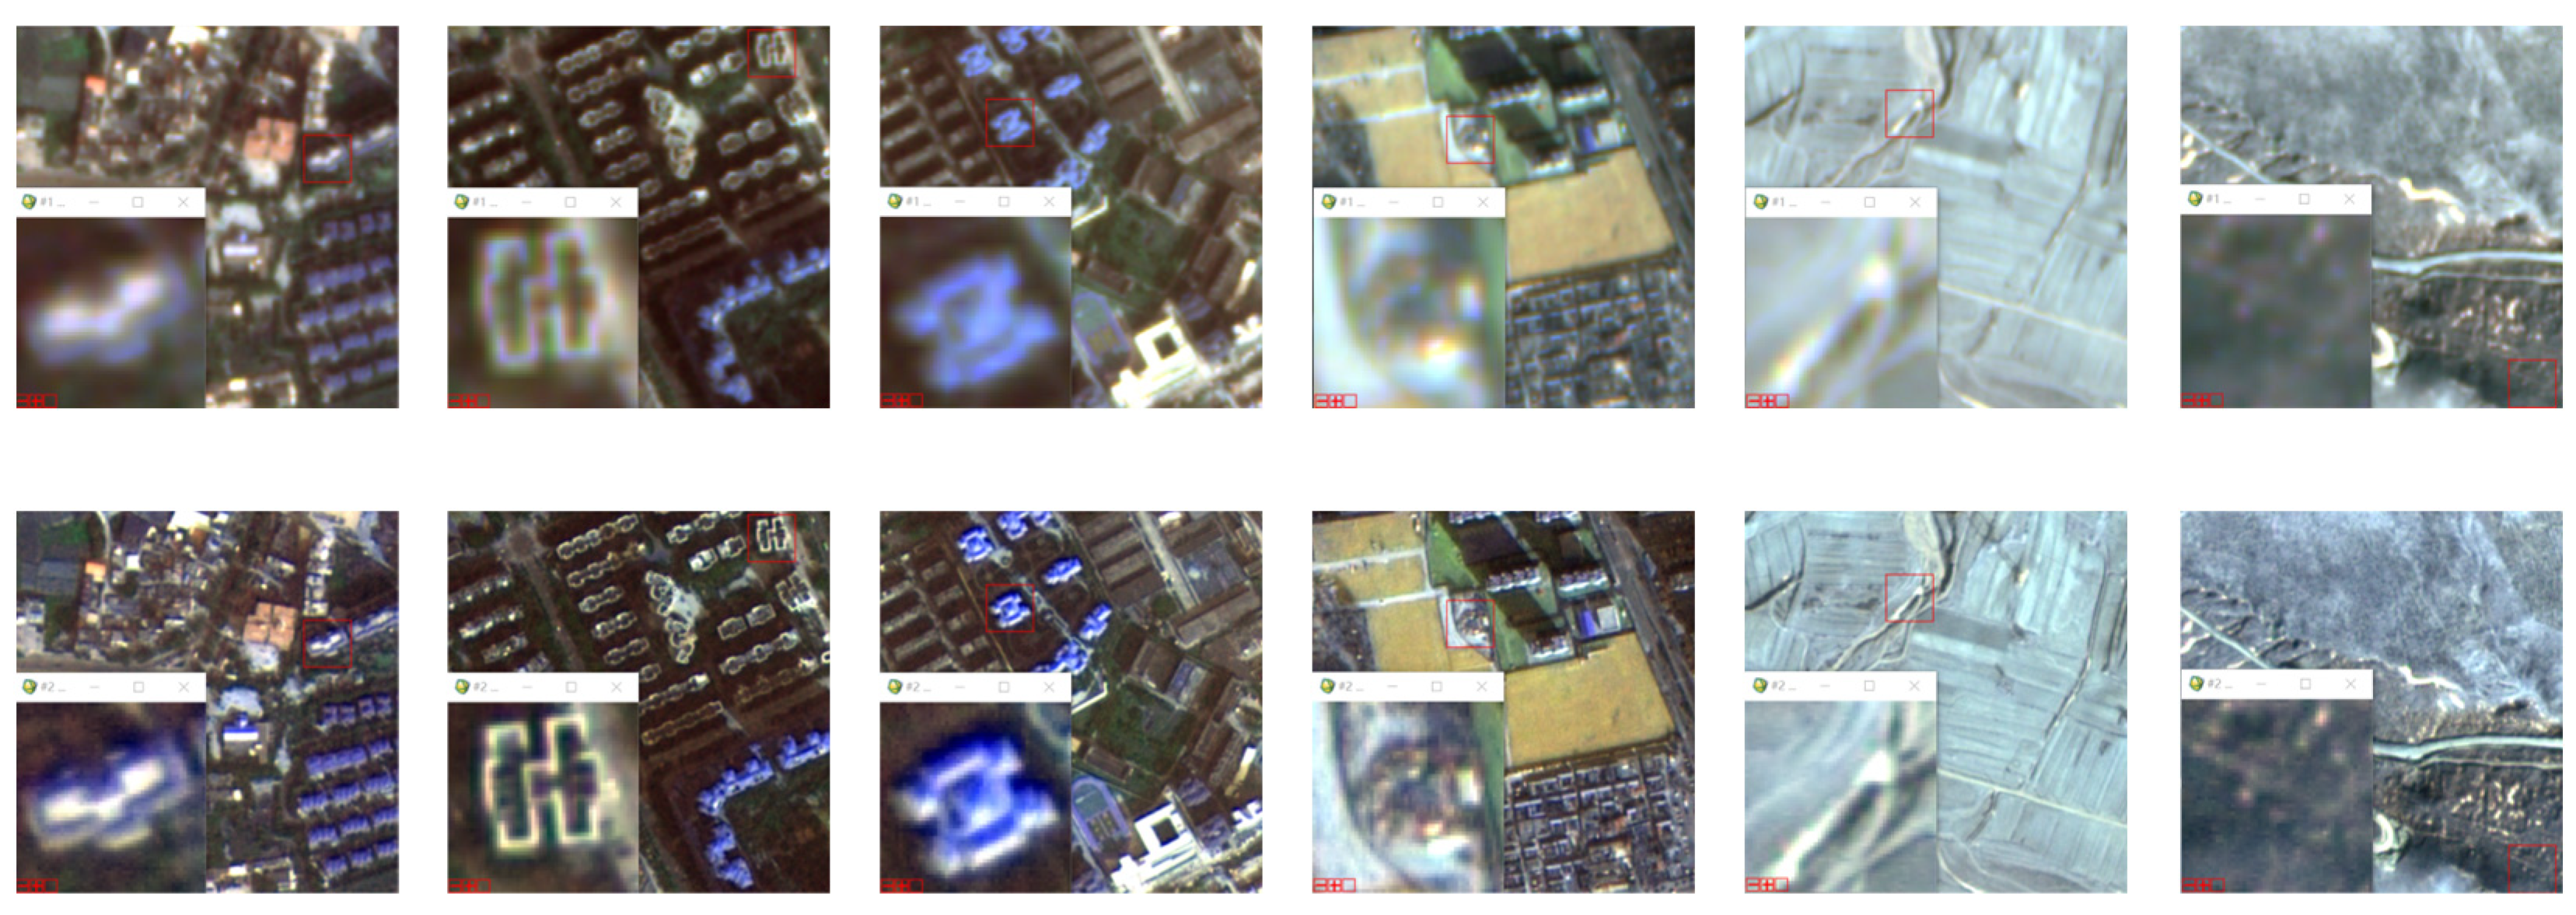
The fused image product is compared to the joint product through the selection of local positions and zooming in. Results, depicted in Figure 7, comprise buildings, mountains, and cultivated lands. The fused image product, based on the pixel position relationship of the joint calibration products, exhibits a clear boundary, high resolution, and good color. There is no discernible ghosting before or after merging, suggesting that the joint calibration approach maintains a high level of consistency across the various bands that is consistent with the spectral registration accuracy observed above. As an added bonus, the merging process avoids the need for time-consuming point matching to yield excellent results—further evidence of the excellent consistency between the panchromatic and multispectral images.
The first row displays the panchromatic multispectral joint calibration product, while the second row depicts the fusion product based on the former. This product highlights various features such as buildings, mountains, and cultivated land.

4. Conclusions

Panchromatic and multispectral images are combined to perform geometric calibration simultaneously based on the characteristics of the arrangement of panchromatic and multispectral CCD arrays within the sensor of the DS-1 satellite. The panchromatic images, with their high spatial resolution, can be matched to control data with high-precision, uniformly distributed, and widely available control points. A multitude of corresponding points with uniform distribution and high accuracy can subsequently be identified between multispectral and panchromatic images, allowing for these corresponding points to serve as a bridge between the two types of images. This link between images controls the characteristics of a small intersection angle to reduce errors caused by elevation differences when photographing the same feature in both panchromatic and multispectral images. By utilizing corresponding points as the connecting pixels between panchromatic and multispectral images, and taking advantage of the small intersection angle when capturing the same feature in both types of images, the resulting error caused by elevation discrepancies is effectively minimized. This ensures that the intersection error accurately reflects the errors in the positioning model, thereby achieving the goal of validating and adjusting the geometric positioning model. To enhance the accuracy of the geometric positioning model in each band of the remote sensing image, this study considers the consistency accuracy between different bands.
Our experiments demonstrate that the CCD splicing accuracy of the joint calibration method for a single band in our paper surpasses 0.3 pixels, and remains consistent with the individually calibrated results. This indicates that the joint calibration method can address the geometric misalignment between adjacent CCDs within a single band, ensuring internal accuracy at the stitching line of CCDs in a single-band image. The uncontrolled geometric positioning accuracy is superior to 40 m, which is consistent with the results of panchromatic separate calibration and surpasses the uncontrolled positioning accuracy of individually calibrated multispectral images. This indicates that the joint calibration method, leveraging high-quality control points from the panchromatic imagery, enhances the external positioning accuracy of multispectral images. Moreover, the controlled positioning accuracy surpasses 1 m, which is consistent with the results of panchromatic separate calibration and surpasses the uncontrolled positioning accuracy of individually calibrated multispectral images, demonstrating that the method improves the internal positioning accuracy of the entire multispectral image. The registration accuracy between panchromatic and multispectral bands is comparable to that between multispectral spectral bands and exceeds 0.3 pixels. The joint calibration method is capable of eliminating misalignment between panchromatic and multispectral images during the geometric calibration phase. The correction products obtained through the joint calibration method for panchromatic and multispectral sensors can be directly utilized for pixel-based image fusion, providing convenience for the fusion process.

Author Contributions

Conceptualization, X.J. and X.Z.; methodology, X.Z. and J.T.; writing—original draft preparation, X.Z.; writing—review and editing, X.J., X.Z. and M.L.; supervision, M.L.; funding acquisition, M.L. All authors have read and agreed to the published version of the manuscript.

Funding

This work was supported by the National Natural Science Foundation of China (Grant No. 41971412).

Data Availability Statement

The authors confirm that the data supporting the findings of this study are available within the article.

Conflicts of Interest

Authors Xiaohua Jiang and Jie Tian were employed by the company Zhuhai Aerospace Microchips Science & Technology Co., Ltd. and China Electronic System Technology Co., Ltd. The remaining authors declare that the research was conducted in the absence of any commercial or financial relationships that could be construed as a potential conflict of interest.

References

  1. Dibs, H.; Mansor, S.; Ahmad, N.; Pradhan, B. Band-to-band registration model for near-equatorial Earth observation satellite images with the use of automatic control point extraction. Int. J. Remote Sens. 2015, 36, 2184–2200. [Google Scholar] [CrossRef]
  2. Miecznik, G.; Shafer, J.; Baugh, W.M.; Bader, B.; Karspeck, M.; Pacifici, F. Mutual information registration of multi-spectral and multi-resolution images of DigitalGlobe’s WorldView-3 imaging satellite. In Proceedings of the Algorithms and Technologies for Multispectral, Hyperspectral, and Ultraspectral Imagery XXIII, Anaheim, CA, USA, 5 May 2017; pp. 328–339. [Google Scholar]
  3. Goforth, M.A. Sub-pixel registration assessment of multispectral imagery. In Proceedings of the SPIE Optics + Photonics, San Diego, CA, USA, 1 September 2006. [Google Scholar]
  4. Boukerch, I.; Farhi, N.; Karoui, M.S.; Djerriri, K.; Mahmoudi, R. A Dense Vector Matching Approach for Band to Band Registration of Alsat-2 Images. In Proceedings of the IGARSS 2018—2018 IEEE International Geoscience and Remote Sensing Symposium, Valencia, Spain, 22–27 July 2018; pp. 3401–3404. [Google Scholar]
  5. Wang, M.; Yang, B.; Jin, S. A registration method based on object-space positioning consistency for satellite multi-spectral image. J. Wuhan Univ. 2013, 38, 765–769. [Google Scholar]
  6. Jiang, Y.; Zhang, G.; Tang, X.; Zhu, X.; Huang, W.; Pan, H.; Qin, Q. Research on the high accuracy band-to-band registration method of ZY-3 multispectral image. Acta Geod. Cartogr. Sin. 2013, 42, 884–897. [Google Scholar]
  7. Wu, H.; Bai, Y.; Wang, L. On-orbit geometric calibration and accuracy verification of Jilin1-KFO1A WF camera. Opt. Precis. Eng. 2021, 29, 1769–1781. [Google Scholar] [CrossRef]
  8. Pan, H.; Tian, J.; Wang, T.; Wang, J.; Liu, C.; Yang, L. Band-to-Band Registration of FY-1C/D Visible-IR Scanning Radiometer High-Resolution Picture Transmission Data. Remote Sens. 2022, 14, 411. [Google Scholar] [CrossRef]
  9. Zhang, G.; Wang, J.; Jiang, Y.; Zhou, P.; Zhao, Y.; Xu, Y. On-orbit geometric calibration and validation of Luojia 1-01 night-light satellite. Remote Sens. 2019, 11, 264. [Google Scholar] [CrossRef]
  10. Zhang, Y.; Wang, T.; Zheng, T.; Zhang, Y.; Li, L.; Yu, Y.; Li, L. On-Orbit Geometric Calibration and Performance Validation of the GaoFen-14 Stereo Mapping Satellite. Remote Sens. 2023, 15, 4256. [Google Scholar] [CrossRef]
  11. Jiang, Y.; Xu, K.; Zhao, R.; Zhang, G.; Cheng, K.; Zhou, P. Stitching images of dual-cameras onboard satellite. ISPRS J. Photogramm. Remote Sens. 2017, 128, 274–286. [Google Scholar] [CrossRef]
  12. Lowe, D.G. Distinctive image features from scale-invariant keypoints. Int. J. Comput. Vis. 2004, 60, 91–110. [Google Scholar] [CrossRef]
  13. Gruen, A. A Powerful image matching technique, South African Journal of Photogrammetry. Remote Sens. Cartogr. 1985, 14, 175–187. [Google Scholar]
  14. Wang, T.; Zhang, G.; Li, D.; Zhao, R.; Deng, M.; Zhu, T.; Yu, L. Planar block adjustment and orthorectification of Chinese spaceborne SAR YG-5 imagery based on RPC. Int. J. Remote Sens. 2018, 39, 640–654. [Google Scholar] [CrossRef]
Figure 1. Schematic diagram of sensor splicing; B1, B2, P, B3, B4 are red, green, panchromatic, blue, infrared bands in turn; each band has 3 Charge-Coupled Devices(CCDs), as shown in the figure: CMOS1, CMOS2, CMOS3. The distance between the CCDs between the two bands is 1.62 mm. A CCD in one band is 29.23 mm wide and 1.152 mm high. The overlap area of two adjacent CCDs is about 3.825 mm.
Remotesensing 16 00433 g001
Figure 2. Control point distribution map from image and Digital Orthophoto Map(DOM) matching; the blue image in the figure represents the multispectral image, the gray image represents the panchromatic image, and the yellow image represents the DOM. The control point distribution map of the multispectral image is located in the top right corner of this figure, while the control point distribution map of the panchromatic image is located in the bottom right corner.
Remotesensing 16 00433 g002
Figure 3. The solution process of joint panchromatic and multispectral geometric calibration method.
Remotesensing 16 00433 g003
Figure 4. Calibration scene data information; this image compares the Digital Orthophoto Map (DOM), Digital Elevation Model (DEM), and satellite images taken at three calibration fields in Tianjin, Songshan, and Taiyuan.
Remotesensing 16 00433 g004
Figure 5. Comparison picture of the image before and after CCD splicing in Tianjin area. Among them, the upper right corner is the CCD and CCD connection before stitching, and the lower right corner is the CCD and CCD connection after joint calibration.
Remotesensing 16 00433 g005
Figure 6. Display diagram of joint calibration products and fusion products. The first row shows the panchromatic band and synthetic false-color images for bands B1 and B2. The second row shows the fusion image. The columns are in order from Zhanjiang, Fangshan, Taihangshan, and Tianjin.
Remotesensing 16 00433 g006
Figure 7. Display of partial enlarged diagram of joint calibration products and fusion products, with selected tall buildings, short houses, roads, mountains, farmland, etc. from images of Zhanjiang, Fangshan, and Tianjin for comparison.
Remotesensing 16 00433 g007
Table 1. Information sheet on calibration scenes.
LocationDateSatellite Side Swing (°)Average Elevation (m)
Tianjin
(Calibrated images)
23 November 20210.2−3
Songshan in Henan
(Calibrated images)
2 December 20217.04526
Taiyuan in Shanxi
(Calibrated images)
21 November 20211.24323
The calibration scenes are used to construct a geometric positioning model and obtain the calibration parameters of the satellite. The table lists the basic information for obtaining calibration scenes, including the shooting time of the calibration scenes, the satellite side swing angle during shooting, and the average elevation of the calibration field. This information can be used to determine whether a scene image is suitable for calibration.
Table 2. Information sheet on validation scenes.
LocationDateSatellite Side Swing (°)Average Elevation (m)
Tianjin Calibration Field21 November 20210.2−3
Fangshan, Beijing4 January 2022−4.83202
Taihangshan3 January 20223.131076
Zhanjiang, Guangdong13 December 20213.294
Beichen, Tianjin15 December 2021−13.62−2
The validation scenes are used to validate the robustness of the calibration parameters of the satellite. The table lists the basic information for obtaining validation scenes, including the shooting time of the validation scenes, the satellite side swing angle during shooting, and the average elevation of the validation field. These pieces of information can help analyze “validation accuracy”.
Table 3. Sensor calibration product CCD Splicing Accuracy Statistics.
LocationType of CalibrationNeighboring CCD Connection Point Accuracy (Pixels)
Tianjin
(Calibration Field)
Panchromatic individual calibration0.082
Multispectral individual calibration0.083
Joint panchromatic and multispectral calibration0.083
Fangshan,
Beijing
Panchromatic individual calibration0.12
Multispectral individual calibration0.14
Joint panchromatic and multispectral calibration0.15
TaihangshanPanchromatic individual calibration0.23
Multispectral individual calibration0.27
Joint panchromatic and multispectral calibration0.26
Zhanjiang,
Guangdong
Panchromatic individual calibration0.094
Multispectral individual calibration0.1
Joint panchromatic and multispectral calibration0.13
The table compares the CCD splicing accuracy of four images under three conditions: individual calibration for panchromatic images, individual calibration for multispectral images, and joint calibration for panchromatic and multispectral images.
Table 4. Positioning accuracy statistics for sensor calibration products.
LocationType of CalibrationPositioning Accuracy (m)
Without ControlWith ControlNumber of Checkpoints
Tianjin
(Calibrated field)
Panchromatic individual calibration0.69\\
Multispectral individual calibration1.12\\
Joint panchromatic and multispectral calibration0.71\\
Fangshan,
Beijing
Panchromatic individual calibration18.730.9618
Multispectral individual calibration21.631.1618
Joint panchromatic and multispectral calibration18.820.9818
TaihangshanPanchromatic individual calibration19.831.026
Multispectral individual calibration21.101.436
Joint panchromatic and multispectral calibration19.851.126
Zhanjiang,
Guangdong
Panchromatic individual calibration4.280.7321
Multispectral individual calibration5.981.2321
Joint panchromatic and multispectral calibration4.320.8921
Beichen,
Tianjin
Panchromatic individual calibration34.140.9211
Multispectral individual calibration37.031.4611
Joint panchromatic and multispectral calibration35.120.9711
Songshan,
Henan
Panchromatic individual calibration3.860.85843
Multispectral individual calibration4.131.43432
Joint panchromatic and multispectral calibration3.890.93843
Taiyuan,
Shanxi
Panchromatic individual calibration3.630.65876
Multispectral individual calibration3.741.06412
Joint panchromatic and multispectral calibration3.680.79876
The table compares the positioning accuracy of seven images under three conditions: individual calibration for panchromatic images, individual calibration for multispectral images, and joint calibration for panchromatic and multispectral images. As a calibration scene, the positioning accuracy of Tianjin images is obtained through high-precision control points, so the controlled positioning accuracy of the scene image is not counted. The controlled positioning accuracy of Tianjin calibration scenes and checkpoints in the table are represented by "/".
Table 5. Sensor calibration product band-to-band registration accuracy statistics.
LocationType of BandBand-to-Band Registration Accuracy (Pixels)
MinMaxRMSE
TianjinPan–Multi0.0010.350.14
Multi–Multi0.0010.270.08
Fangshan,
Beijing
Pan–Multi0.0040.320.21
Multi–Multi0.0020.170.12
TaihangshanPan–Multi0.0040.560.23
Multi–Multi0.0010.310.11
Zhanjiang,
Guangdong
Pan–Multi0.0040.430.16
Multi–Multi0.0020.530.10
Songshan,
Henan
Pan–Multi0.0030.570.20
Multi–Multi0.0020.460.13
Taiyuan,
Shanxi
Pan–Multi0.0030.530.24
Multi–Multi0.0020.240.12
The table compares the band-to-band registration accuracy of six images under two conditions: individual calibration for single calibration for multispectral images and joint calibration for panchromatic and multispectral images.
Disclaimer/Publisher’s Note: The statements, opinions and data contained in all publications are solely those of the individual author(s) and contributor(s) and not of MDPI and/or the editor(s). MDPI and/or the editor(s) disclaim responsibility for any injury to people or property resulting from any ideas, methods, instructions or products referred to in the content.