

Time-Series Cross-Radiometric Calibration and Validation of GF-6/WFV Using Multi-Site
by
 ,
,
Yingxian Wang
1,2,
Yaokai Liu
1,*,
Weiwei Zhao
3,
Jian Zeng
4,
Huixian Wang
1,
Renfei Wang
1,
Zhaopeng Xu
4 and
Qijin Han
4 1
National Engineering Laboratory for Satellite Remote Sensing Applications, Aerospace Information Research Institute, Chinese Academy of Sciences, Beijing 100094, China
2
School of Electronic, Electrical and Communication Engineering, University of Chinese Academy of Sciences, Beijing 100049, China
3
Institute of Beijing Remote Sensing Information, Beijing 100011, China
4
China Centre for Resources Satellite Data and Application, Beijing 100094, China
*
Author to whom correspondence should be addressed.
Remote Sens. 2024, 16(7), 1287; https://doi.org/10.3390/rs16071287
Submission received: 26 December 2023
/
Revised: 30 March 2024
/
Accepted: 1 April 2024
/
Published: 5 April 2024
(This article belongs to the Special Issue Remote Sensing Satellites Calibration and Validation)
Abstract
:The GaoFen6 (GF-6) satellite, equipped with a wide full-swath (WFV) sensor, offers high spatial resolution and extensive coverage, making it widely utilized in agricultural and forestry classification, land resource monitoring, and other fields. Accurate on-orbit radiometric calibration of GF-6/WFV is crucial for these quantitative applications. Currently, the absolute radiometric calibration of GF-6/WFV relies primarily on vicarious calibration conducted by the China Center for Resources Satellite Data and Application (CRESDA). However, annual vicarious calibration may not adequately capture the radiometric performance of GF-6/WFV due to performance degradation. Therefore, increasing the frequency of on-orbit radiometric calibration throughout the lifetime of GF-6/WFV is essential. This study proposes a method for conducting long-term cross-radiometric calibrations of GF-6/WFV by taking the multispectral imager (MSI) onboard the Sentinel-2 satellite as a reliable reference sensor and the sites from RadCalNet as reference ground targets. Firstly, we conducted 62 on-orbit cross-radiometric calibrations of GF-6/WFV since its launch by tracking with the Sentinel-2/MSI sensor after correcting the discrepancy spectrum and solar zenith angle. Then, validation of cross-radiometric calibration results against RadCalNet products indicated an average absolute relative error between 3.55% and 4.64%. Cross-validation with additional reference sensors, including Landsat-8/OLI and MODIS, confirmed the reliability of calibration, demonstrating relative differences from GF-6/WFV of less than 5%. Furthermore, the overall uncertainty of the cross-radiometric calibration was estimated to be from 4.08% to 4.89%. Finally, trend analysis of the time-series radiometric performance was also conducted and revealed an annual degradation rate ranging from 0.57% to 2.31%. This degradation affects surface reflectance retrieval, introducing a bias of approximately 0.0073 to 0.0084. Our findings highlight the operational effectiveness of the proposed method in achieving long-time-series on-orbit radiometric calibration and degradation monitoring of GF-6/WFV. The study also demonstrates that the radiometric performance of GF-6/WFV is relatively stable and suitable for further quantitative applications, especially for long-term monitoring applications.
1. Introduction
The GaoFen6 satellite (GF-6) was successfully launched on 2 June 2018, featuring a wide full-swath (WFV) sensor possessing high spatial resolution and broad imaging coverage. GF-6/WFV images have been instrumental in diverse applications, such as forestry and agriculture monitoring, disaster investigation, and urban development [1,2,3,4]. Achieving absolute radiometric calibration is imperative for the accurate quantitative application of GF-6/WFV images. This calibration involves two primary phases: pre-launch laboratory calibration and post-launch on-orbit calibration. Pre-launch laboratory calibration entails evaluating the sensor’s radiometric performance using laboratory equipment before the satellite’s launch, serving as a crucial reference for assessing the sensor’s radiometric capabilities on orbit [5]. However, over time, the radiometric performance of satellites tends to degrade due to environmental changes and sensor aging. For instance, EO-1/Hyperion exhibited an 8% drift in the visible–near-infrared (VNIR) band within the first two years after launch and an average annual variation of over 1% in the subsequent 10 years [6]. Changes in the radiometric performance of GF-6/WFV can significantly impact the inversion of image data to derive the physical parameters of targets. Even slight calibration deviations resulting from sensor radiometric property changes can affect or mislead the final analysis, particularly in the context of time-series vegetation index products [7]. Thus, periodic evaluation and monitoring of changes in the radiometric performance of GF-6/WFV are crucial.
Currently, numerous satellite sensors are equipped with onboard calibration systems. The technique employs calibrator sources, such as the sun, lamps, and blackbodies, to derive on-orbit radiometric calibration coefficients for the sensors [8,9]. This approach enables real-time radiometric calibration of sensors while in orbit. However, like most Chinese optical satellites, GF-6 does not carry onboard calibration equipment. Instead, calibration coefficients are provided by CRESDA, and vicarious calibration is performed annually. Traditional vicarious calibration relies on synchronous measurement experiments to obtain surface and atmospheric parameters during satellite overpasses. This method is constrained by factors such as calibration sites and atmospheric conditions, making it challenging to achieve high-frequency calibrations [10,11,12]. To overcome these limitations, ground-based automatic radiometric calibration has been introduced. This approach leverages automated observational equipment to autonomously collect ground and atmospheric parameters, facilitating calibration without the need for manual synchronous measurement experiments. Several units and organizations have conducted extensive research on automatic radiometric calibration. For instance, in 2014, the Working Group on Calibration and Validation (WGCV) of the Committee on Earth Observation Systems (CEOS) launched the Global Autonomous Radiometric Calibration Network (RadCalNet) program. This program selected various calibration sites, including the Railroad Valley Playa (RVP) site in the United States, the La Crau site in France, the Gobabeb site in Namibia, and the Baotou National Calibration site (the Baotou site) in China. RadCalNet provides automated ground and atmospheric data and has been widely used for on-orbit radiometric calibration of optical sensors, such as Landsat 8/OLI, Sentinel-2/MSI, GF series, EO-1/Hyperion, and ZY series sensors [13,14]. Despite the advancements, the availability of automated radiometric calibration sites remains limited, necessitating further investigation into the accuracy and stability of long-term observational data and the sustainability of these automatic systems in field environments.
In view of the drawbacks of ground-based automatic radiometric calibration, cross-radiometric calibration has been developed as an alternative method for tracking the radiometric performance of sensors without onboard calibration facilities. Cross-radiometric calibration for sensors lacking onboard calibration equipment has been studied abroad since the early 1990s. Teillet et al. calculated NOAA-9 and NOAA-10 AVHRR calibration coefficients based on the cross-calibration method using Landsat-5 and SPOT HRV (SPOT Satellite High-Resolution Multiband Scanner) imagery acquired on the same day over White Sands Proving Ground, New Mexico, USA [15]. Liu et al. conducted a comprehensive long-term cross-calibration between Terra MODIS and the HJ-1A CCD from 2009 to 2019. The cross-calibration results indicated attenuation rates of 23.51%, 21.89%, 8.11%, and 13.37% by the end of 2019 [16]. Yang et al. proposed a radiometric cross-calibration method for on-orbit time-series calibration of GF-6/WFV. The core of their method involves simulating surface reflectance at the GF-6/WFV viewing angle using a BRDF model, calculated based on the Landsat-8/OLI and ZY-3/Three-Line Camera (TLC) datasets for the Badain Jaran Desert. With the aid of the MODIS AOD and water vapor products, the TOA radiance values of GF-6/WFV were predicted using a 6S code. Subsequently, the cross-radiometric calibration coefficients were determined by fitting the simulated TOA radiance values and observed digital values (DNs) of GF-6/WFV. The accuracy of the results was verified using ground-synchronized measurement data, with the relative error being less than 5%, affirming the reliability of the cross-calibration [17].
It can be concluded that cross-radiometric calibration has significant advantages, including a high calibration frequency, a low cost, and the capacity to calibrate historical images. These benefits are instrumental in facilitating the long-term series calibration of sensors. Taking account of the advantages of the cross-radiometric calibration approach, this study focuses on long-time cross-radiometric calibrations of GF-6/WFV at RadCalNet sites by taking Sentinel-2/MSI as a reliable reference sensor. The spectral response functions, solar and sensor viewing geometries, and atmospheric differences between GF-6/WFV and Sentinel-2/MSI were corrected. Trend analysis of the time-series radiometric calibration results was carried out to characterize the radiometric performance changes since the satellite’s launch. Validation of radiometric cross-calibration results was carried out by comparing them with RadCalNet radiometric products, and the uncertainty of the calibration results was also estimated.
2. Description of Sites and Datasets
2.1. RadCalNet Sites
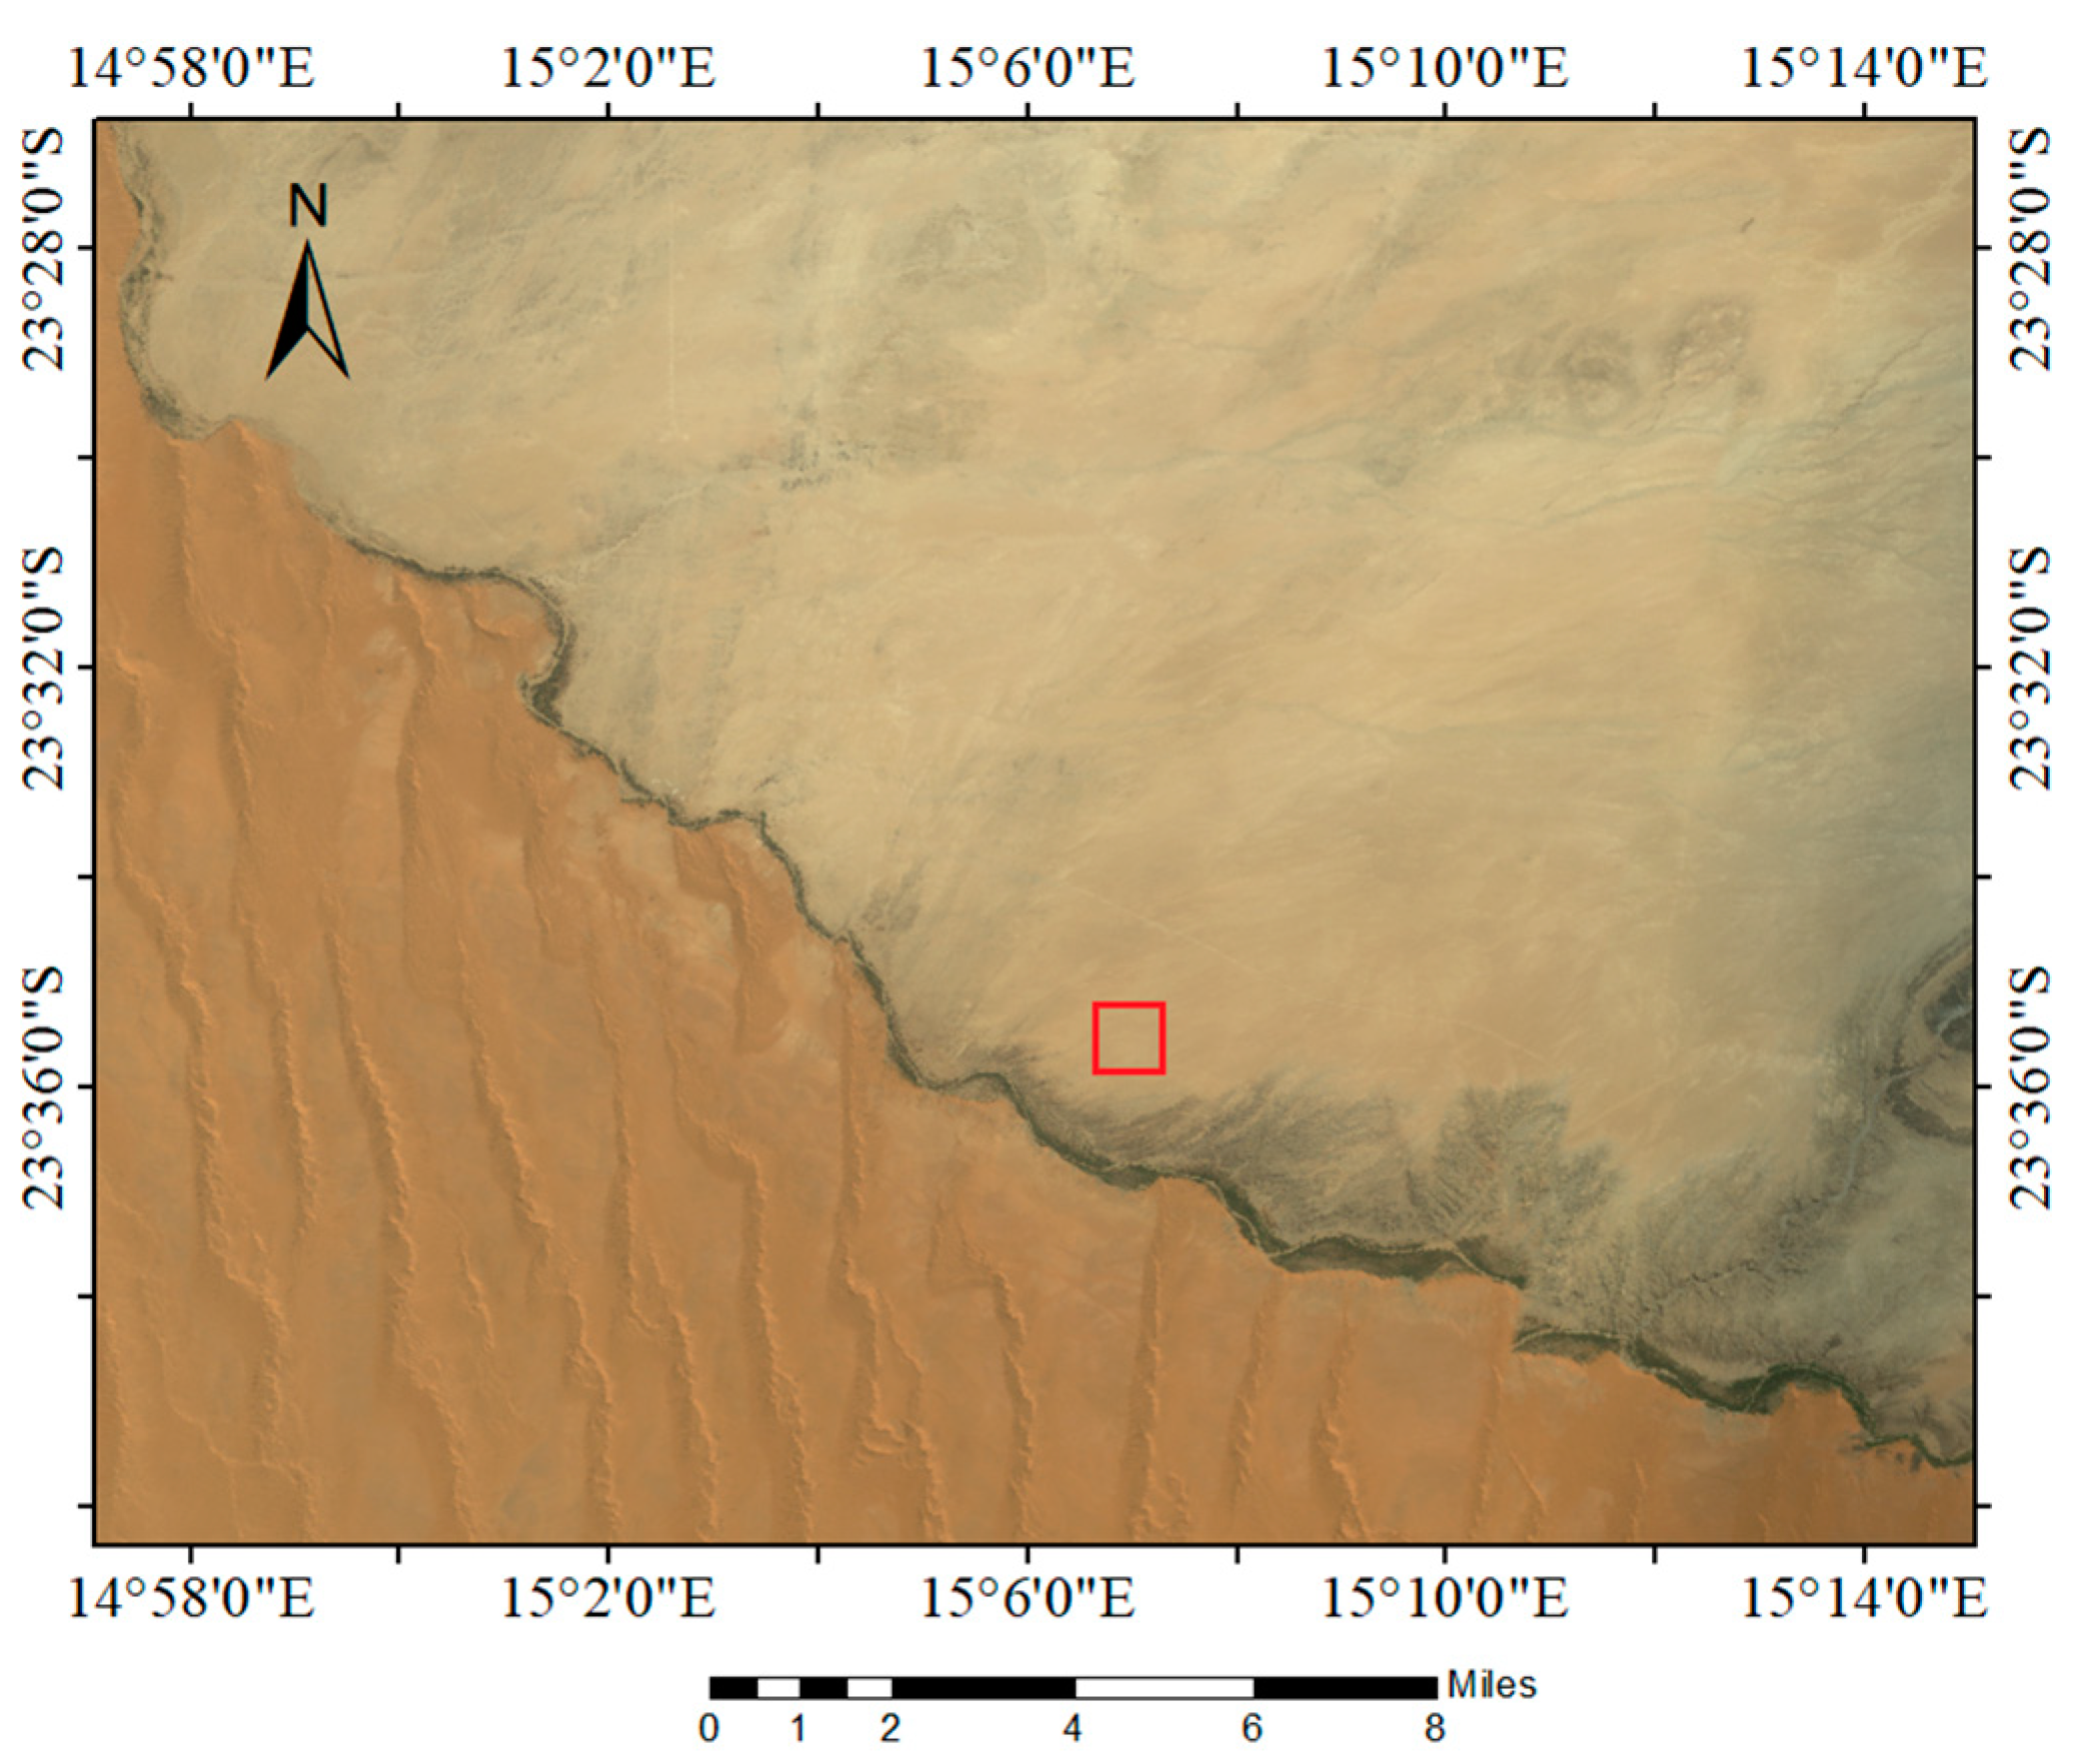
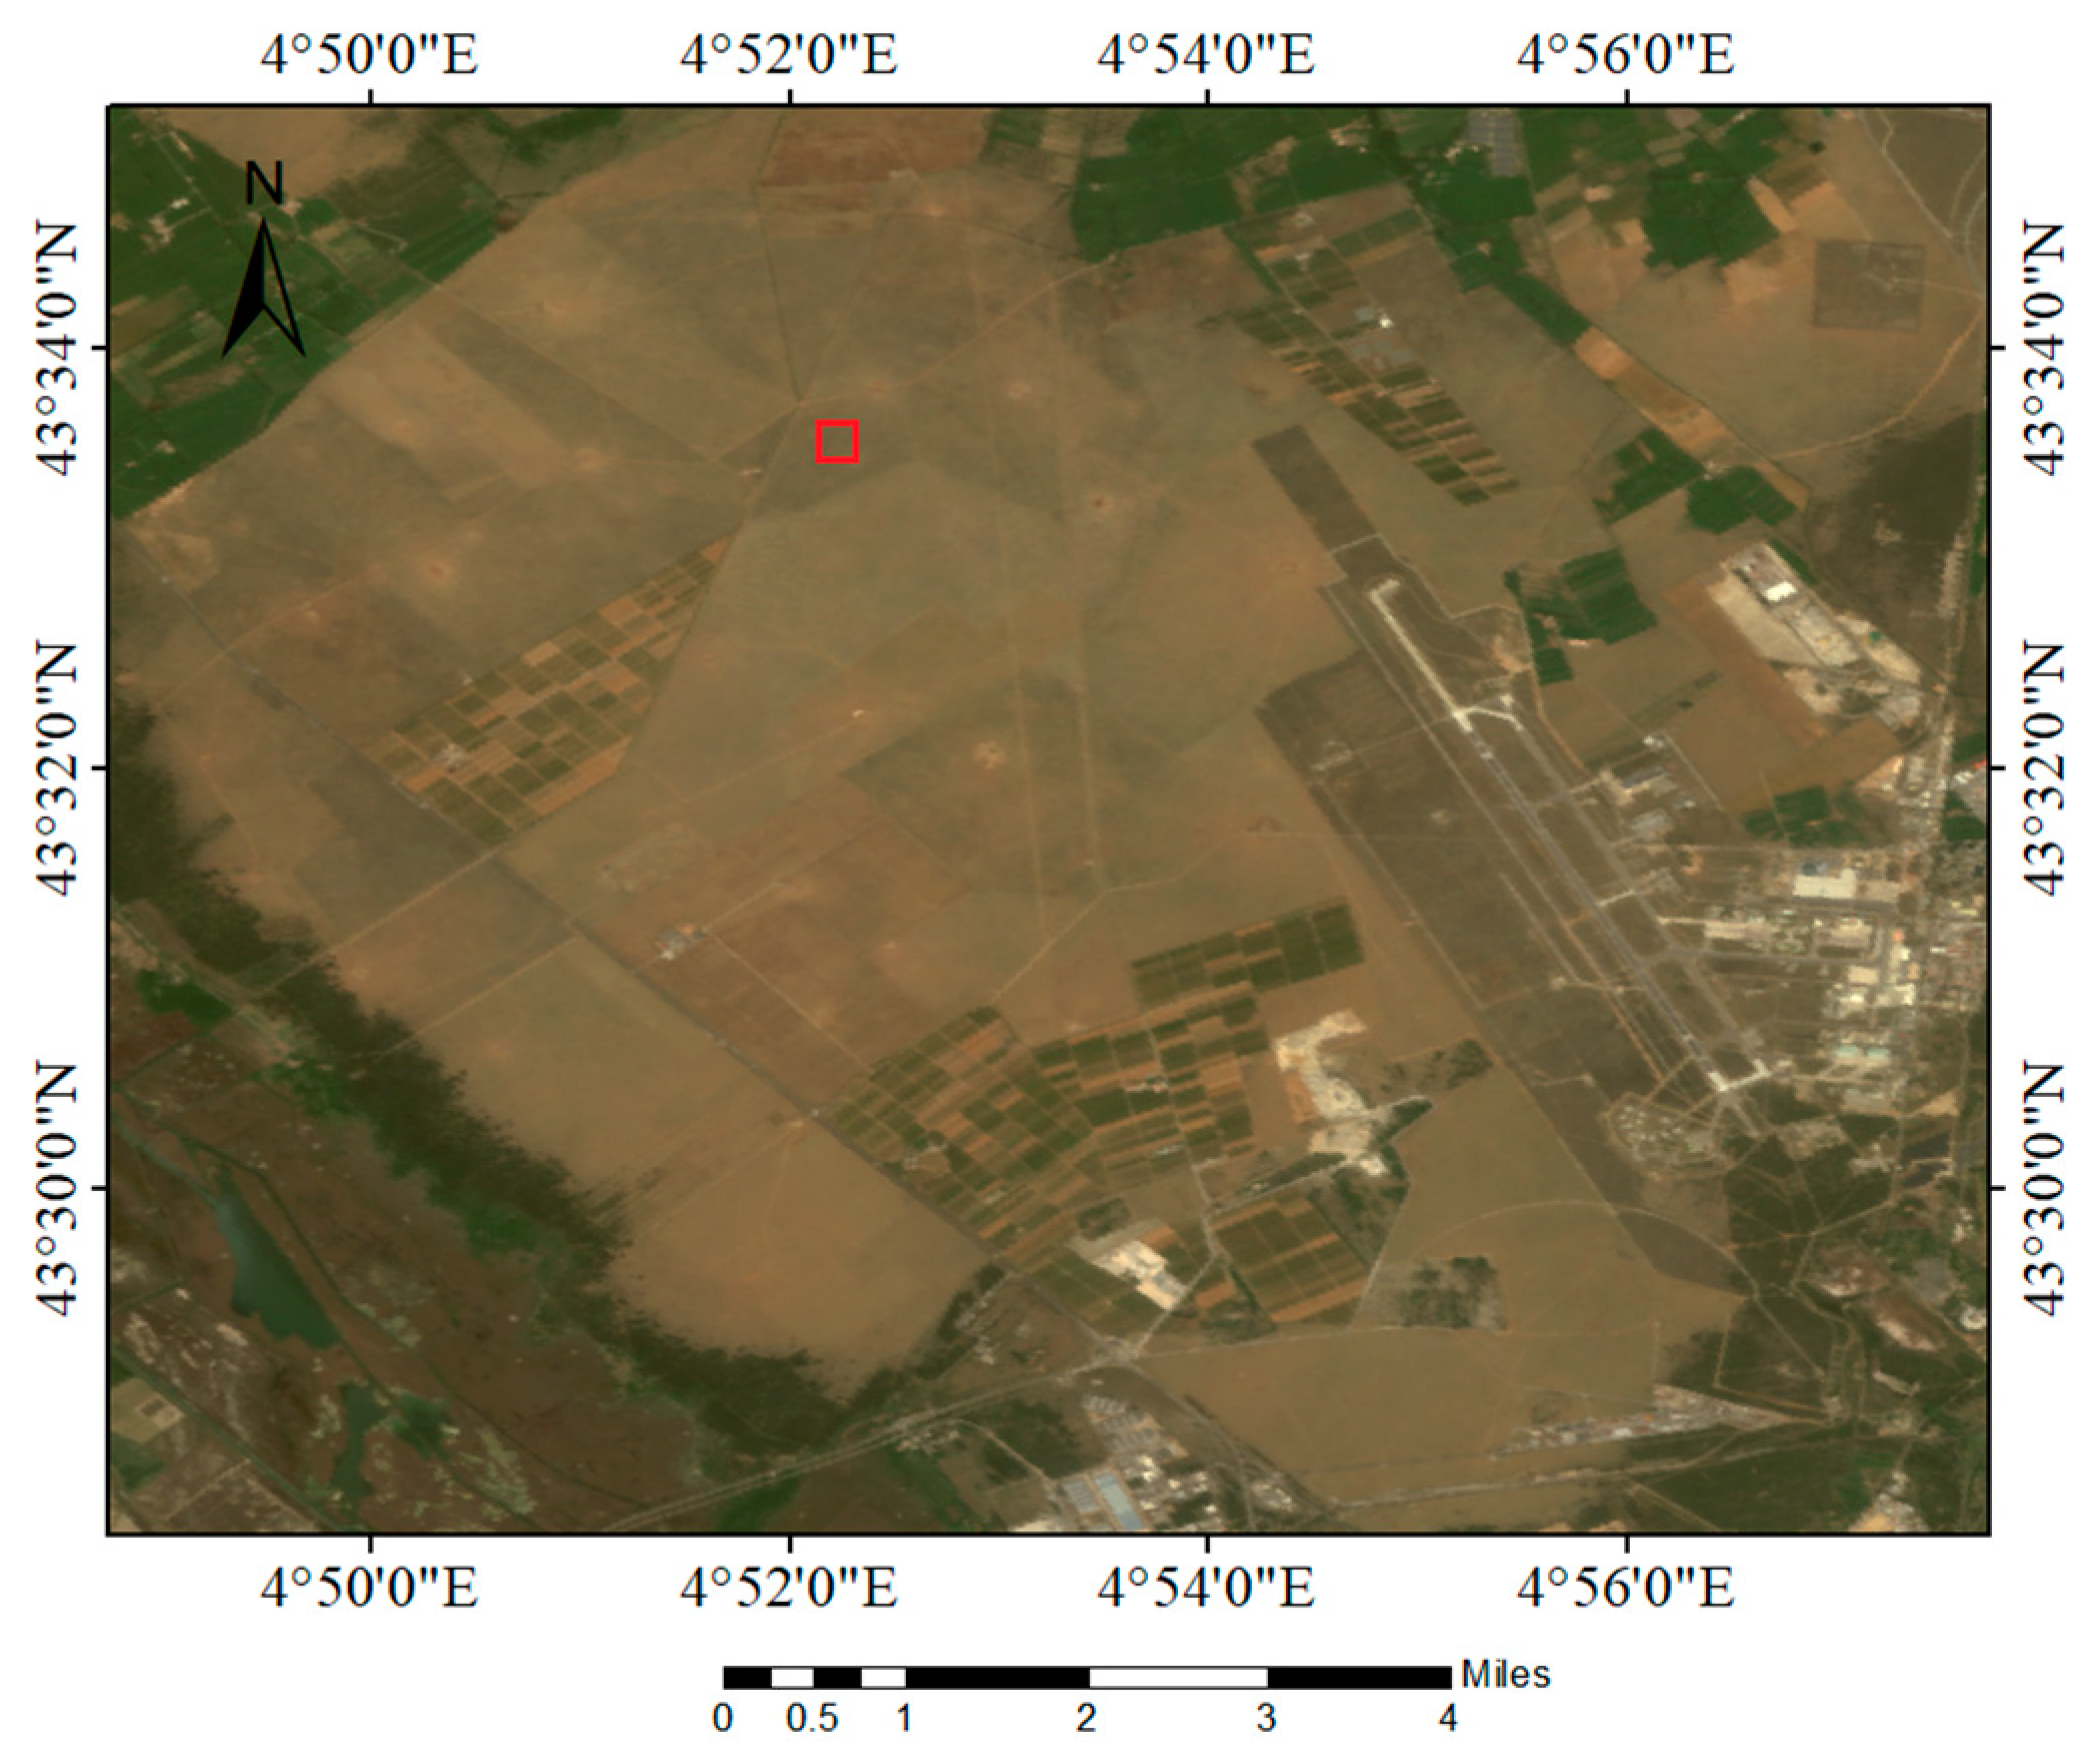
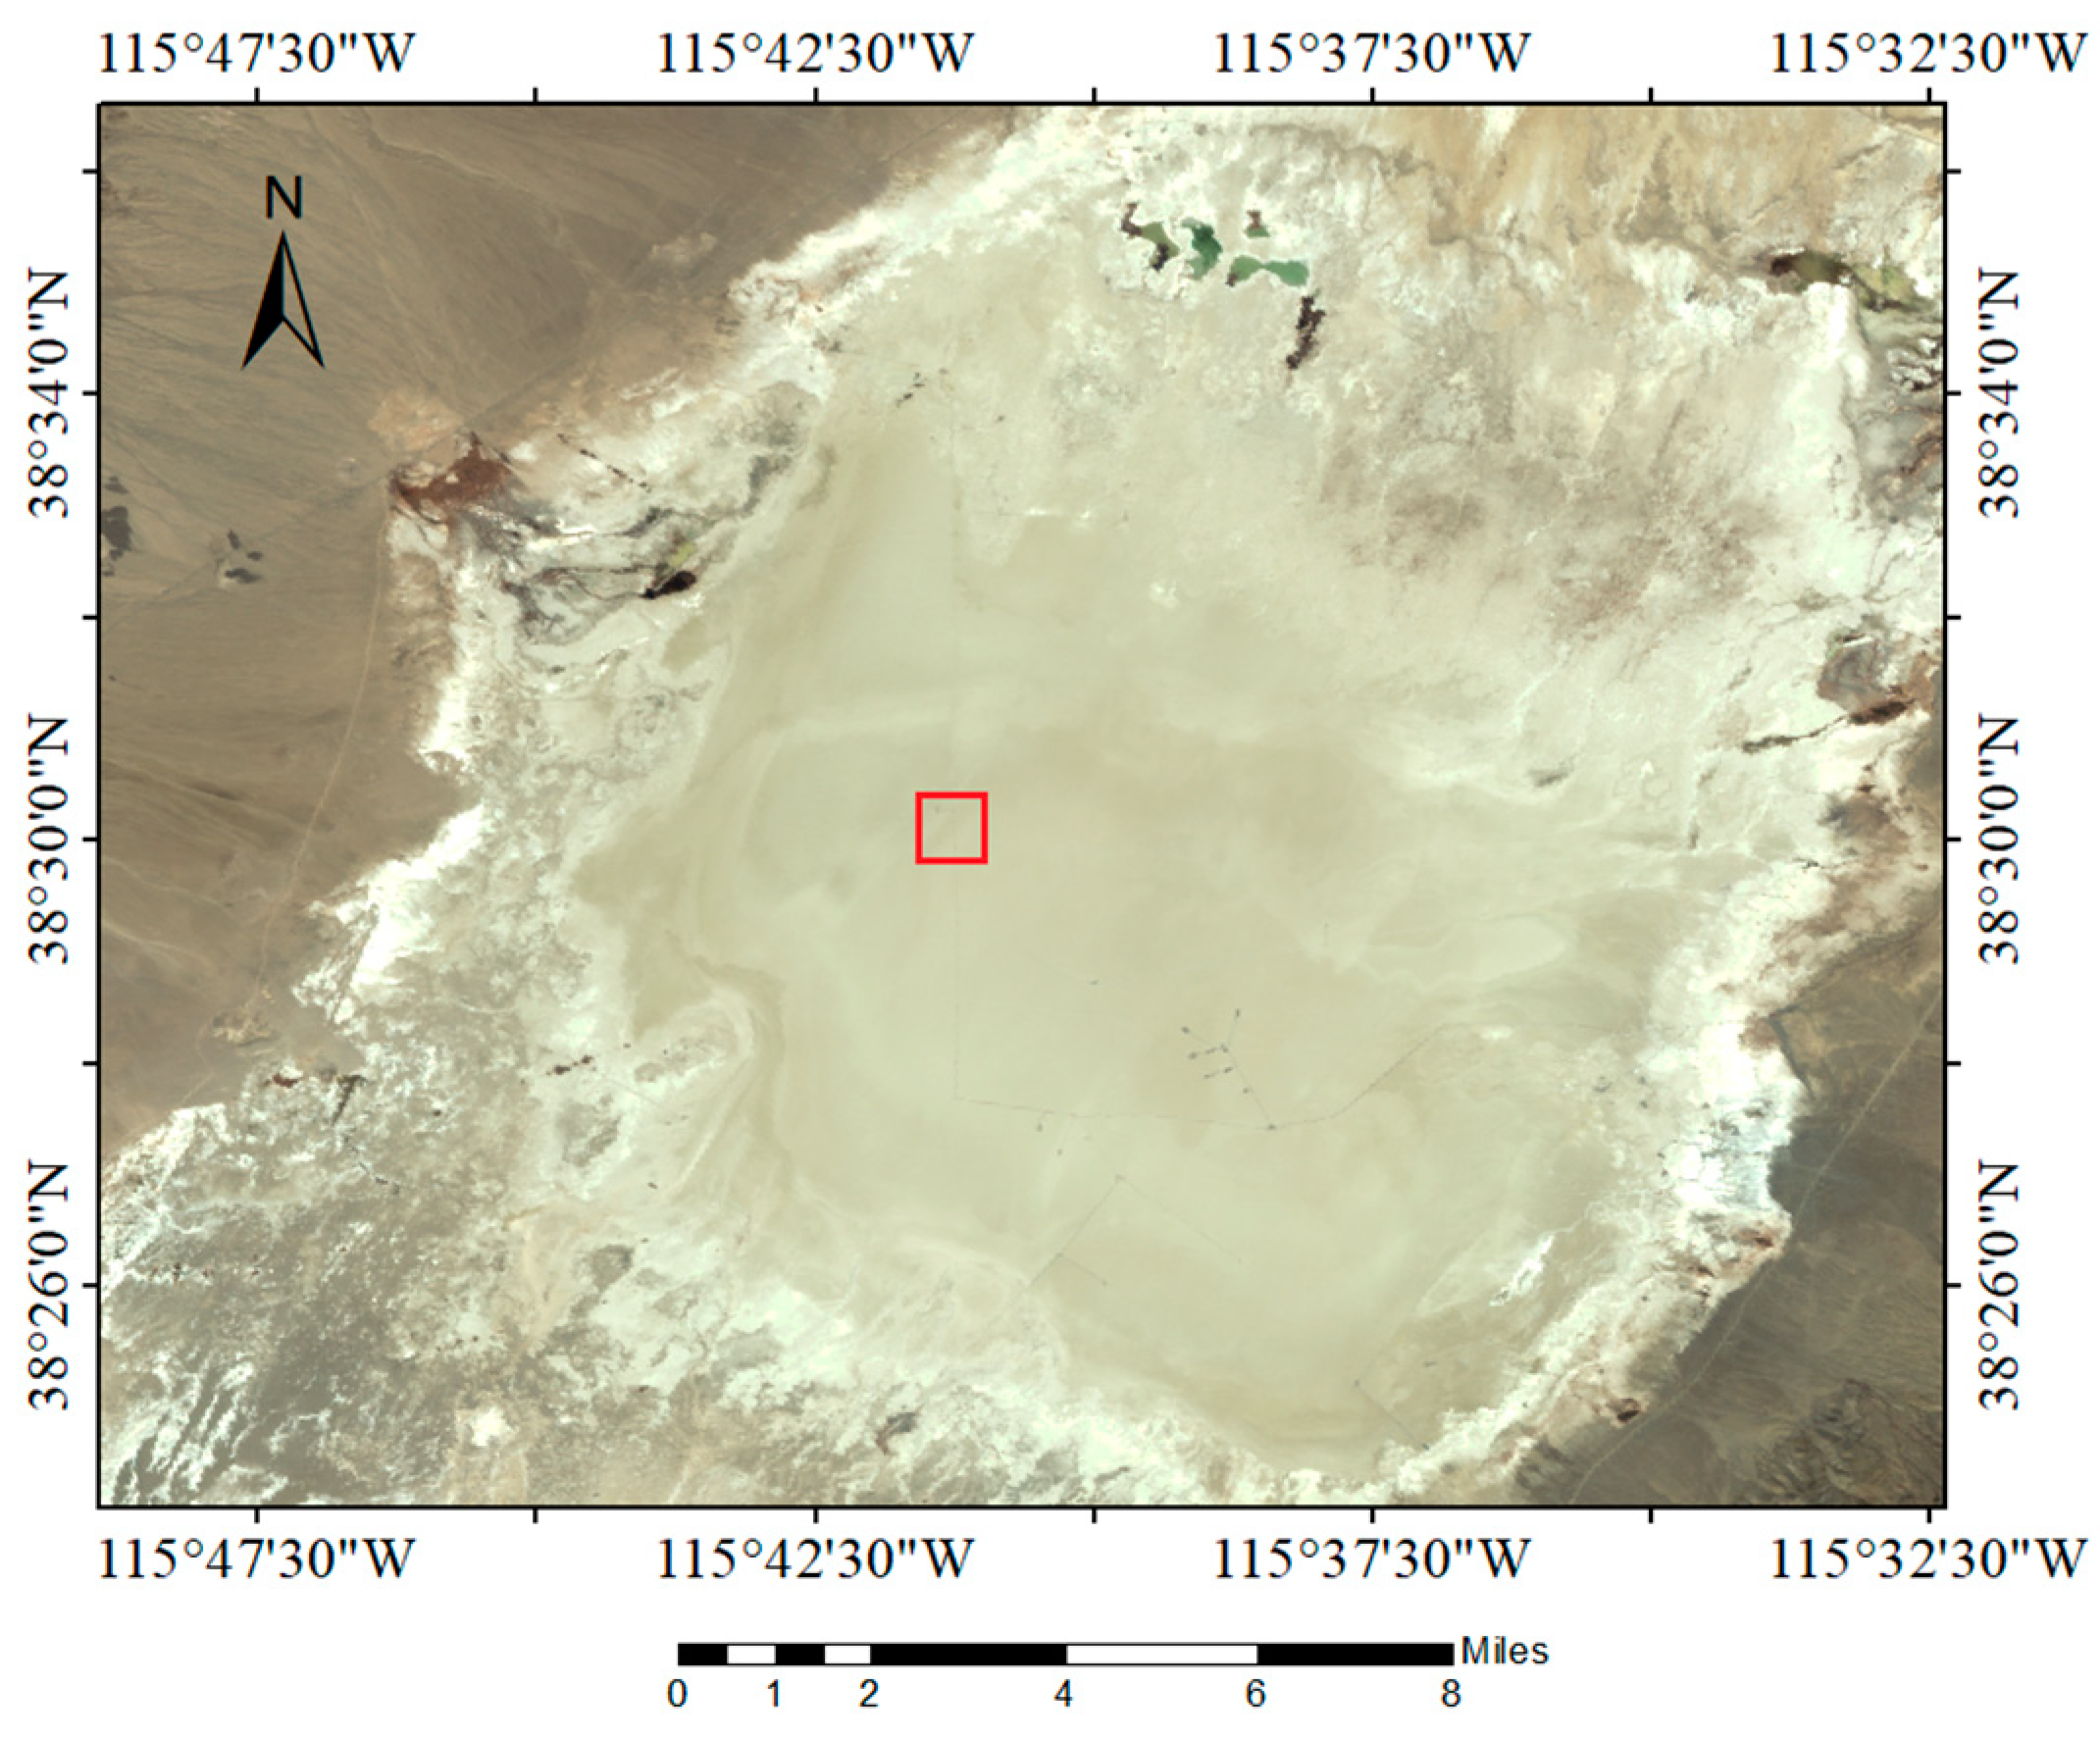
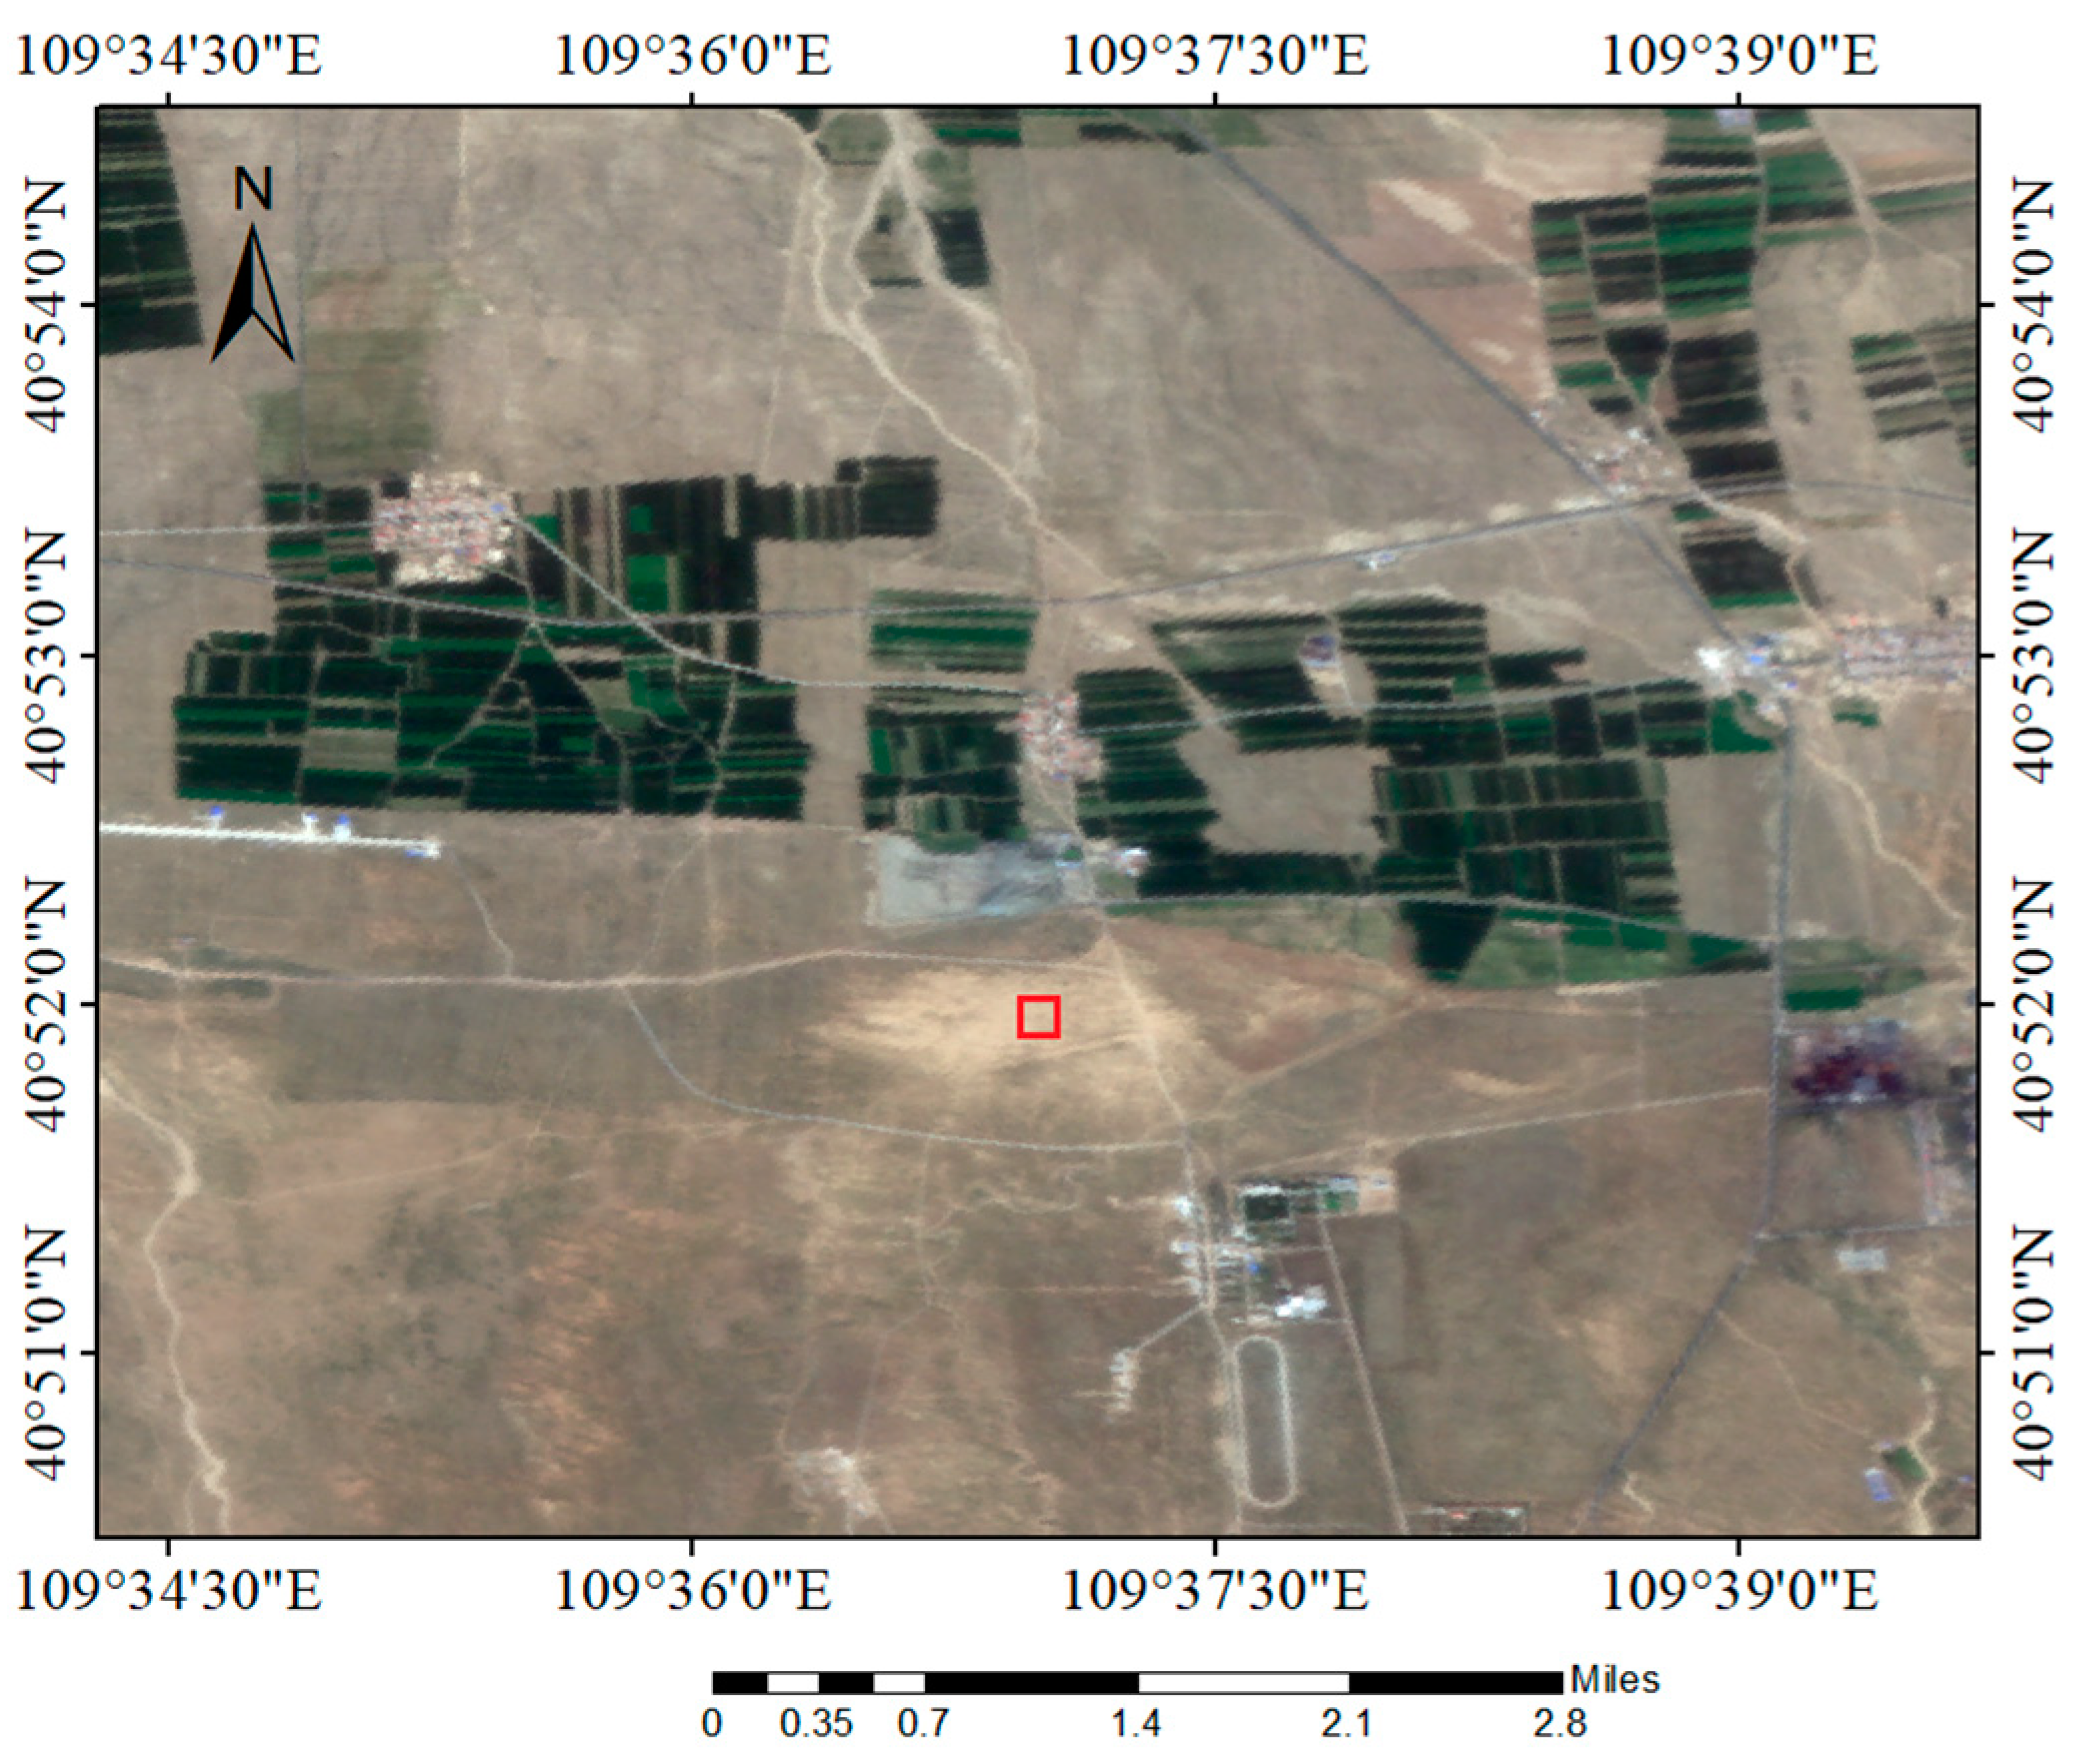
The RadCalNet program, established in 2014 by WGCV, encompasses four calibration sites: Gobabeb in Namibia, La Crau in France, RVP in the United States, and Baotou in China. Each of these sites represents diverse surface types, including sand and gravel with dry grass, sparsely vegetated areas with scattered soil and pebbles, dry riverbeds, and artificial targets. These four sites were specifically chosen as the calibration targets for this analysis [18,19,20]. Figure 1, Figure 2, Figure 3 and Figure 4 show true-color composite images of the GF-6/WFV over Gobabeb on 4 April 2021, over the La Crau site on 24 April 2021, over the RVP site on 3 April 2021, and over Baotou on 10 September 2020, respectively.
2.2. Satellite Images
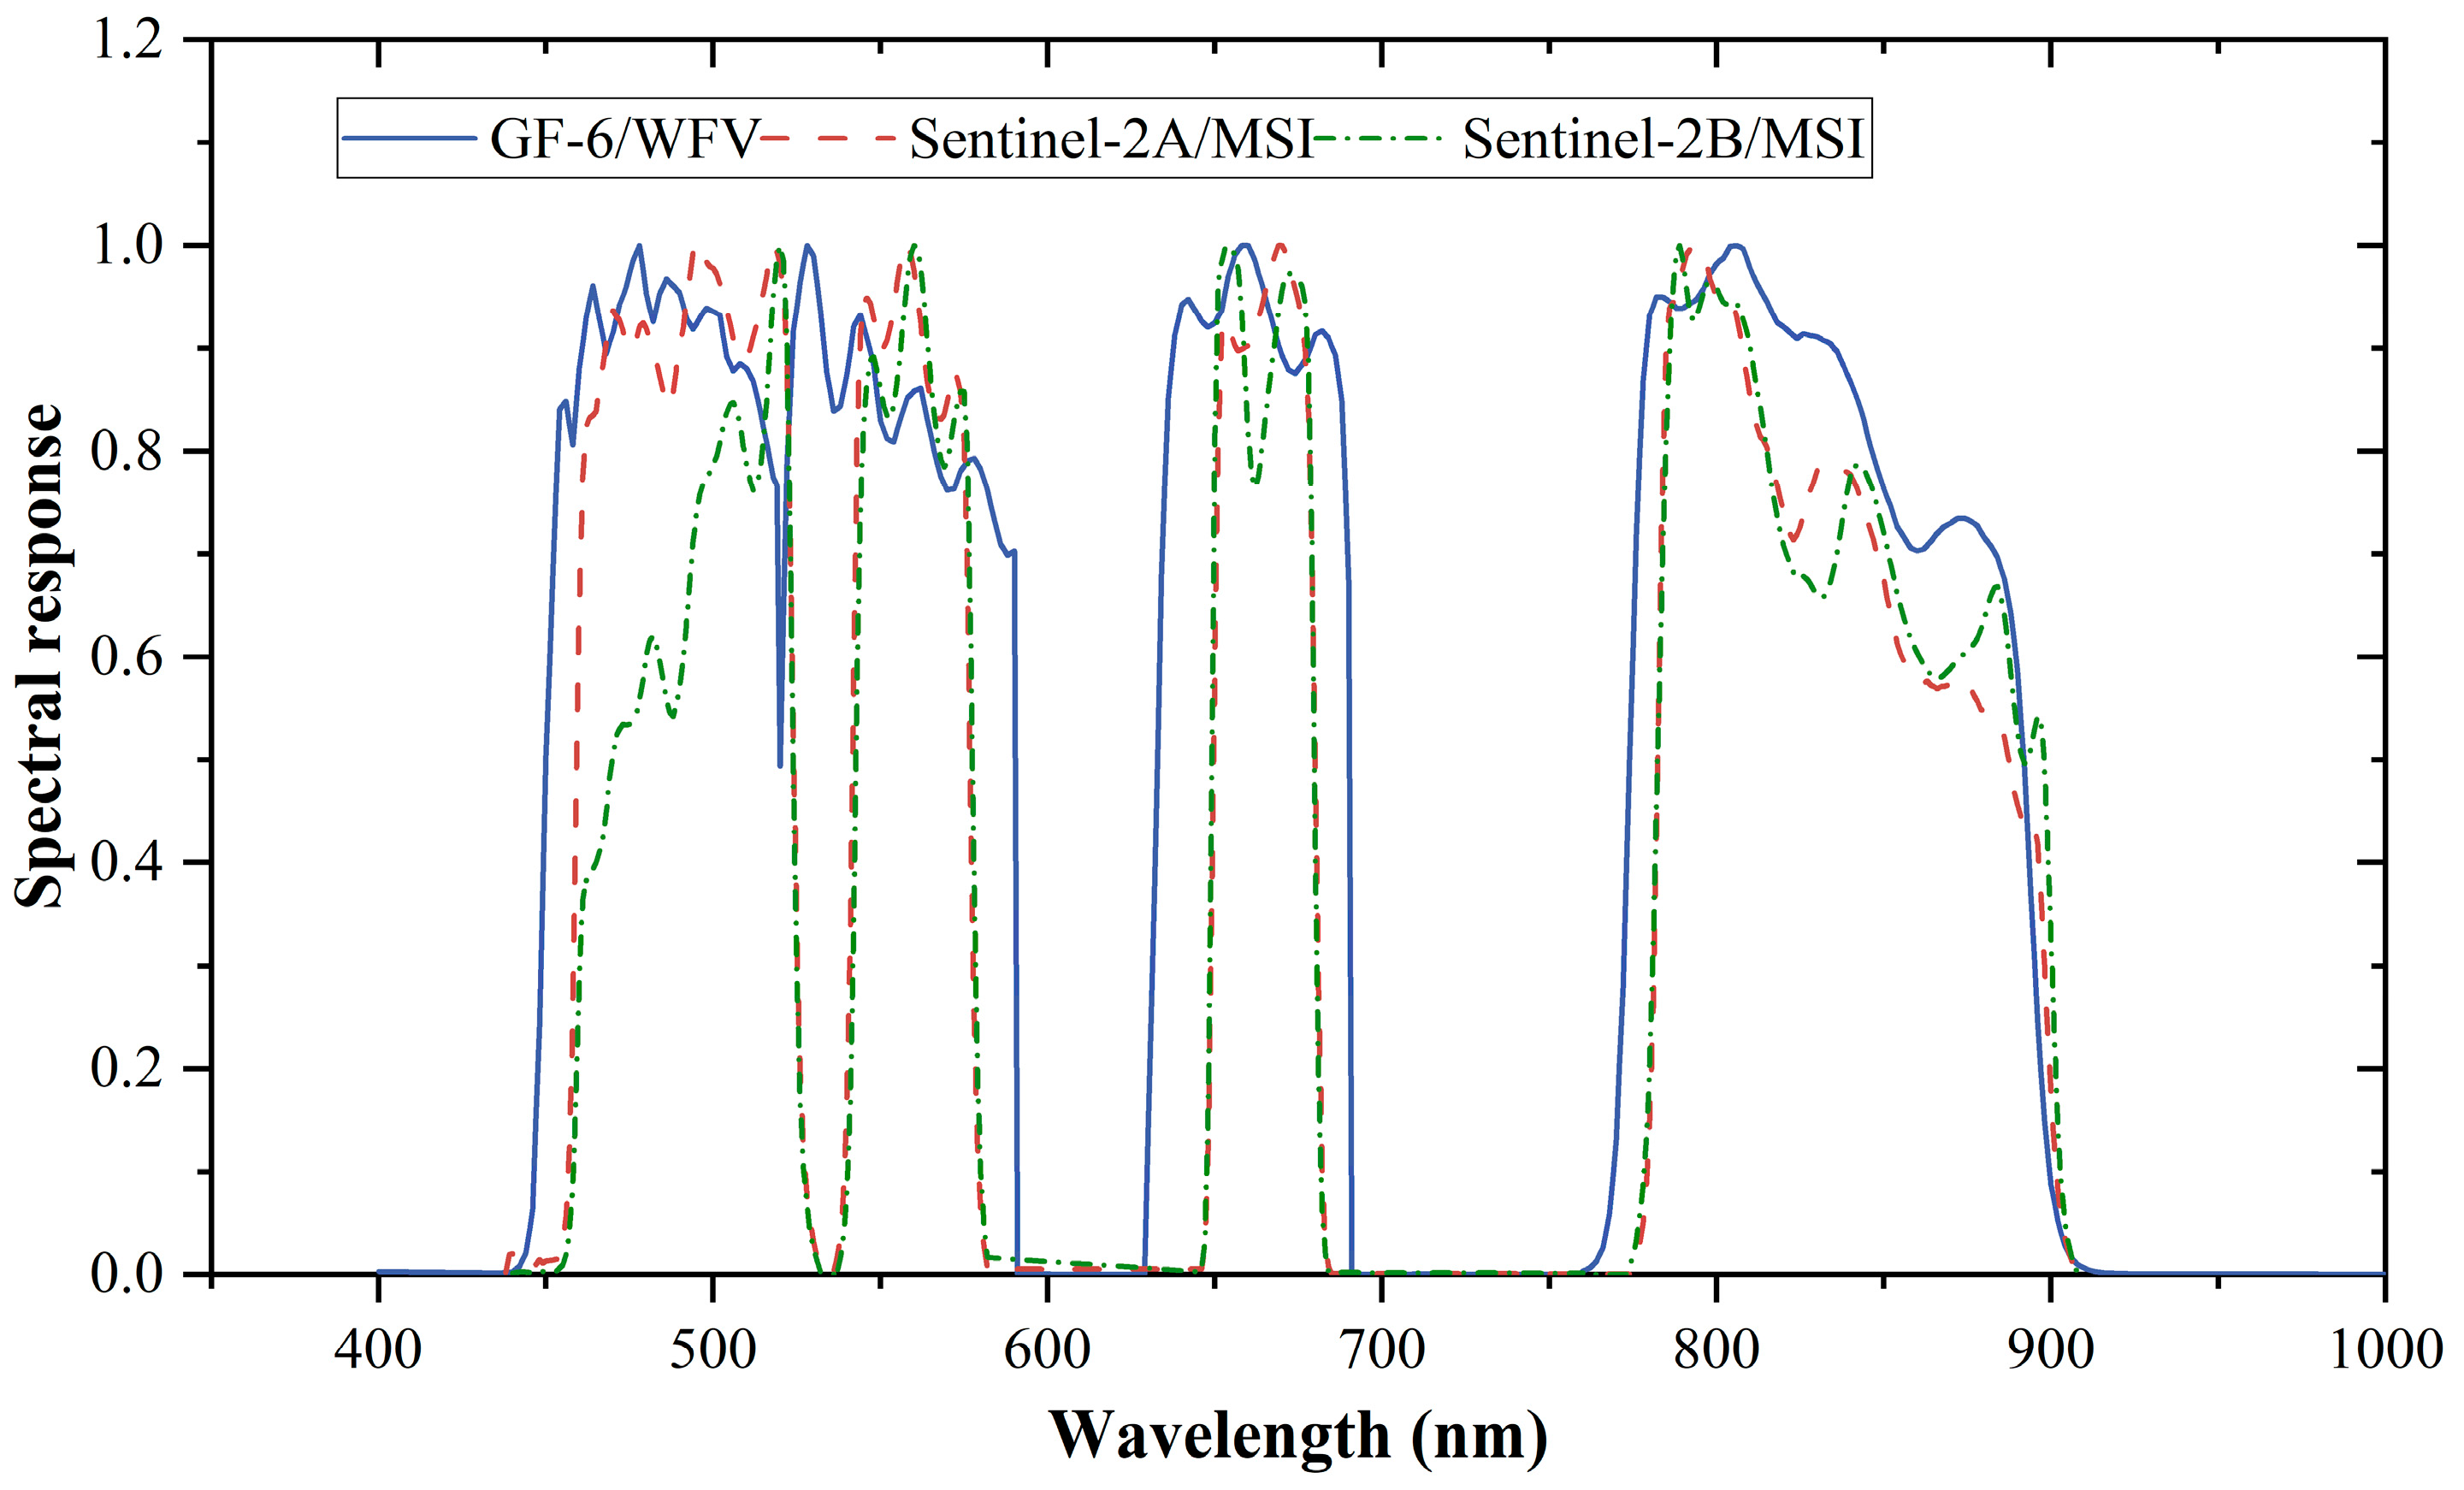
A GF-6/WFV image comprises eight multispectral bands covering the VNIR spectrum, with a spatial resolution of 16 m and a swath width of about 860 km. In this study, bands 2, 3, 4, and 8 of Sentinel-2/MSI were implemented in the cross-calibration of GF-6/WFV bands 1–4, corresponding to the blue, green, red, and near-infrared spectrum bands. Sentinel-2 consists of two multi-spectral satellites, namely, Sentinel-2A and Sentinel-2B. With an on-orbit radiometric calibration accuracy of up to 3% and a wide spectral radiance range, Sentinel-2/MSI has often been used as a reference sensor for radiometric calibration studies of many medium- and high-resolution satellite sensors. Sentinel-2/MSI has a spatial resolution of 10 m in the visible and near-infrared bands and is available for download from the ESA website [21]. Due to the disparity in spatial resolution between GF-6/WFV and Sentinel-2/MSI, the Sentinel-2/MSI images were downscaled to 16 m to match the resolution of the GF-6/WFV images. Table 1 and Figure 5 show the characteristics and spectral response functions of the selected bands for GF-6/WFV and Sentinel-2/MSI.
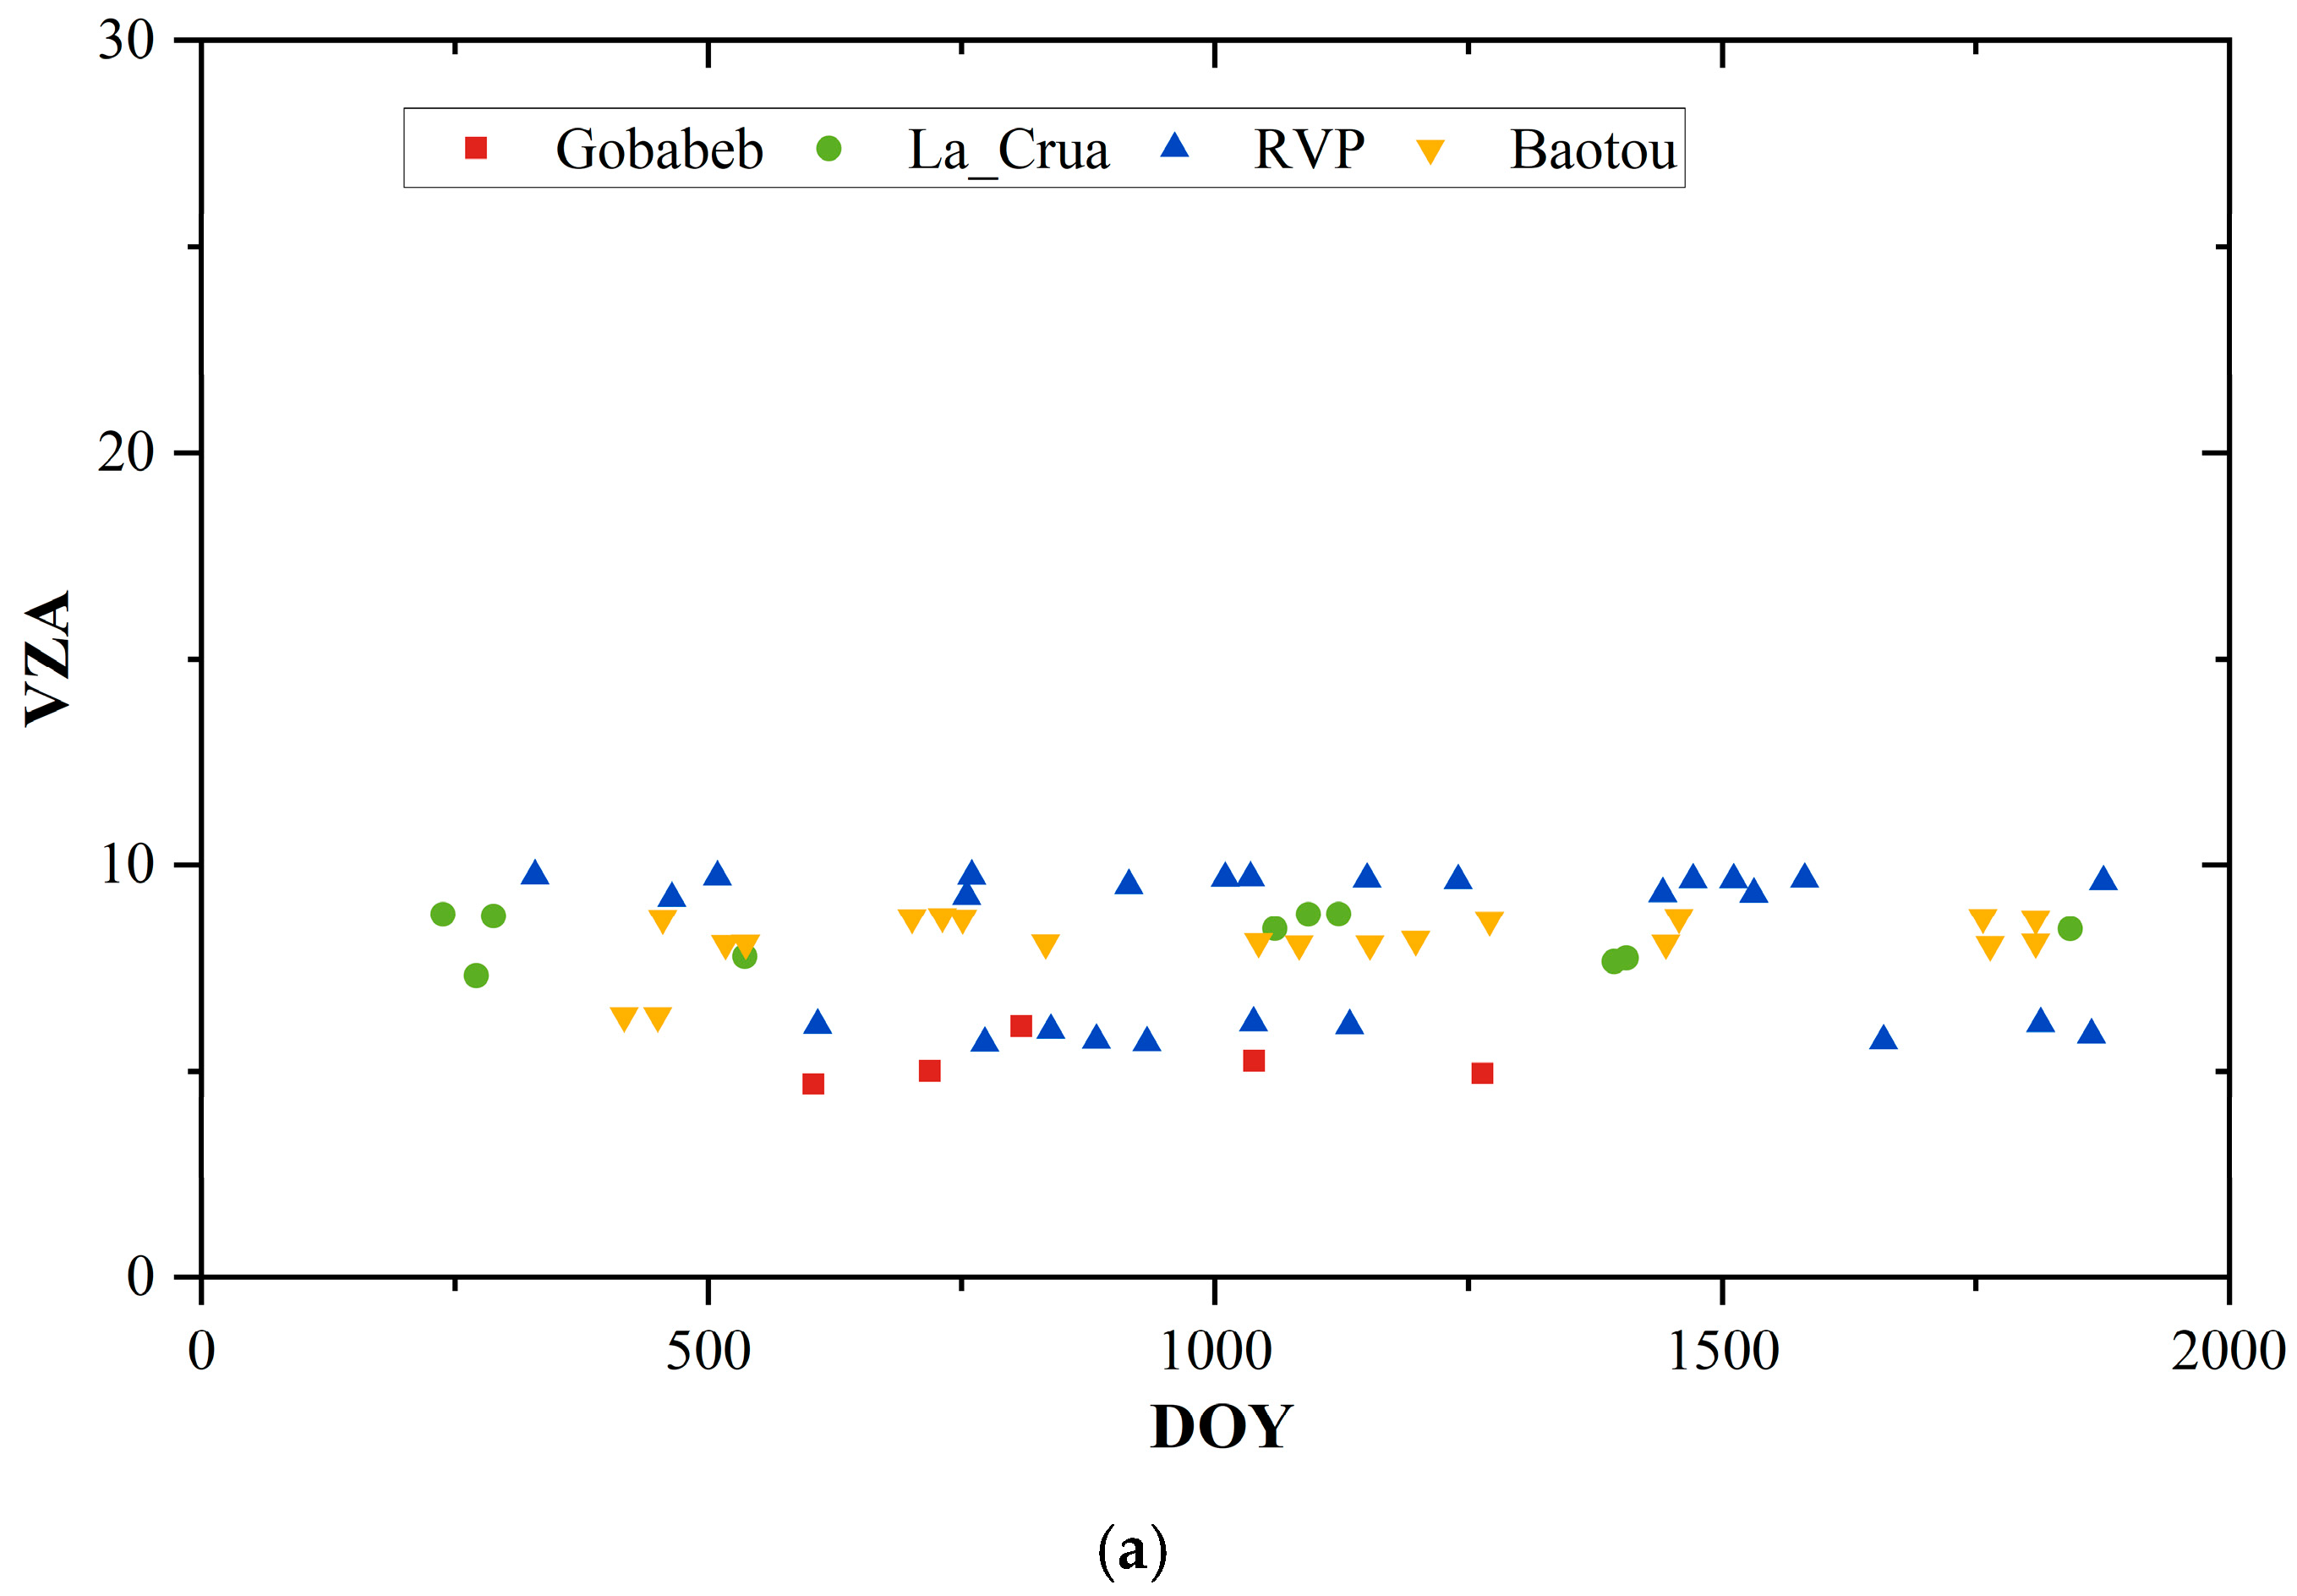
Taking into account the impact of cloud cover, a total of 62 GF-6/WFV images were collected between January 2019 and July 2023. These include 5 images from the Gobabeb site, 10 images from the La Crau site, 26 images from the RVP site, and 21 images from the Baotou site. Figure 6 displays the viewing zenith and relative azimuth angles of Sentinel-2/MSI and GF-6/WFV during satellite overpasses at RadCalNet sites.
2.3. Atmospheric Datasets
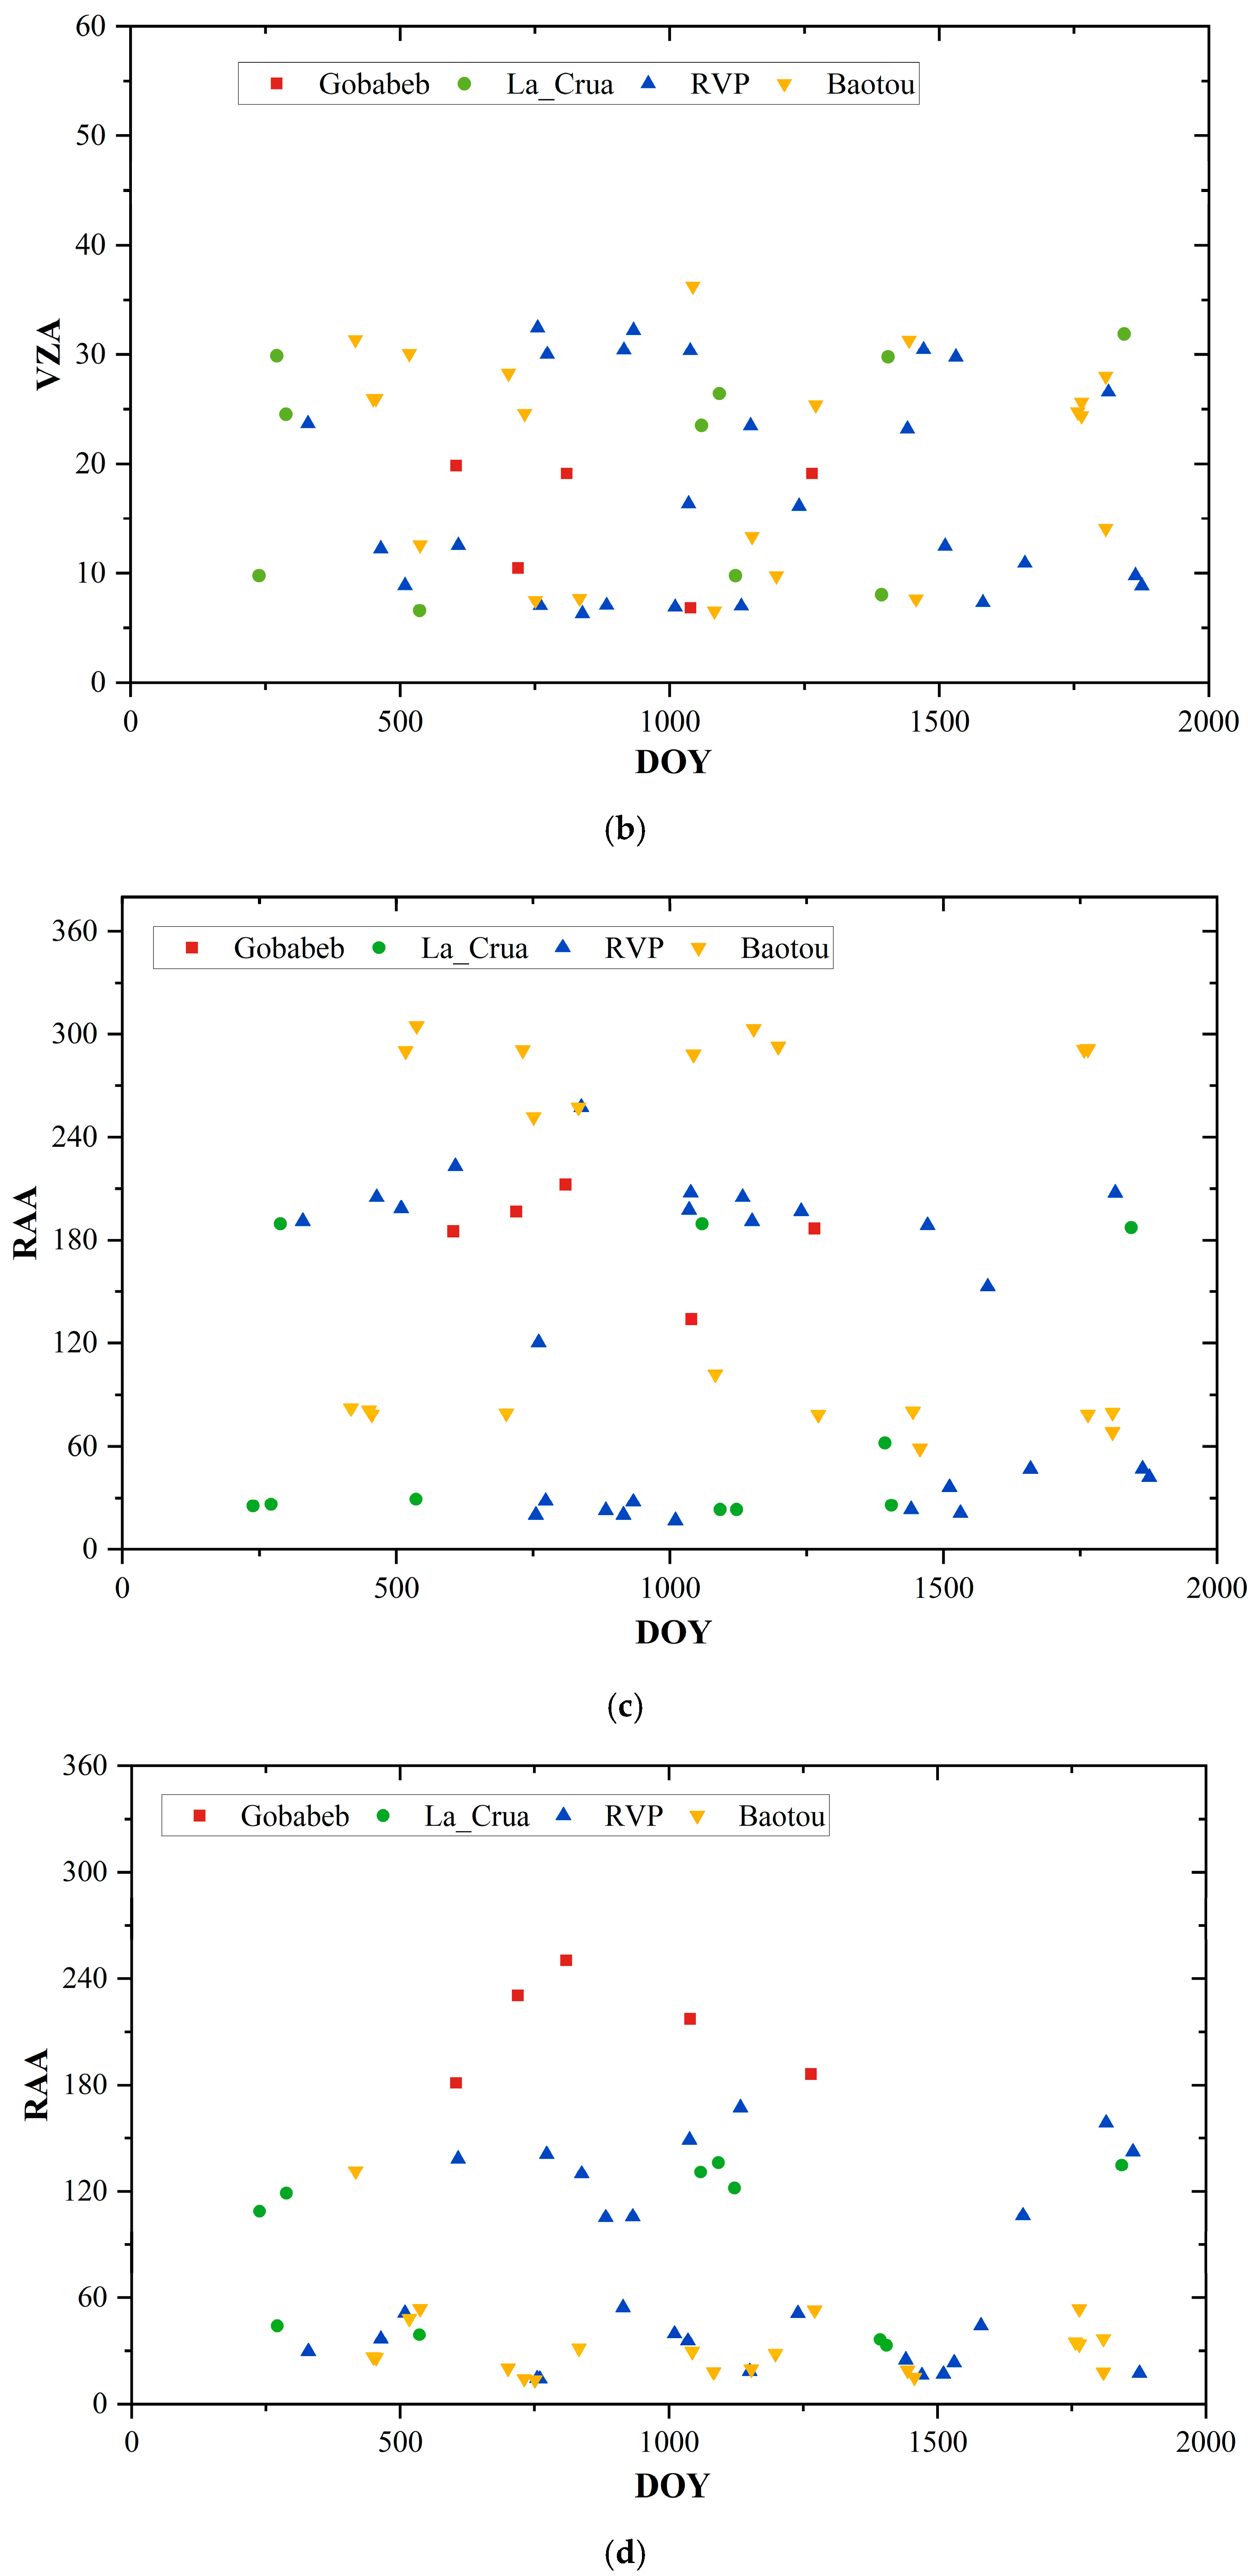
Aerosol optical thickness (AOT) and columnar water vapor (CWV) data were obtained from the AERONET website. The AOT values in the 440, 670, 870, and 1020 nm bands were derived using the Langley algorithm from direct solar irradiance measurements. Subsequently, the AOT at 550 nm was calculated through logarithmic interpolation of the AOT values obtained at 440, 670, 870, and 1020 nm. The CWV data were inverted from AERONET direct solar irradiance measurements in the water vapor absorption band around 940 nm [22]. Figure 7 displays the AOT at 550 nm and CWV. It is noteworthy that the maximum AOT at 550 nm is less than 0.4 and the CWV is less than 3 g/cm2.
3. Methodology
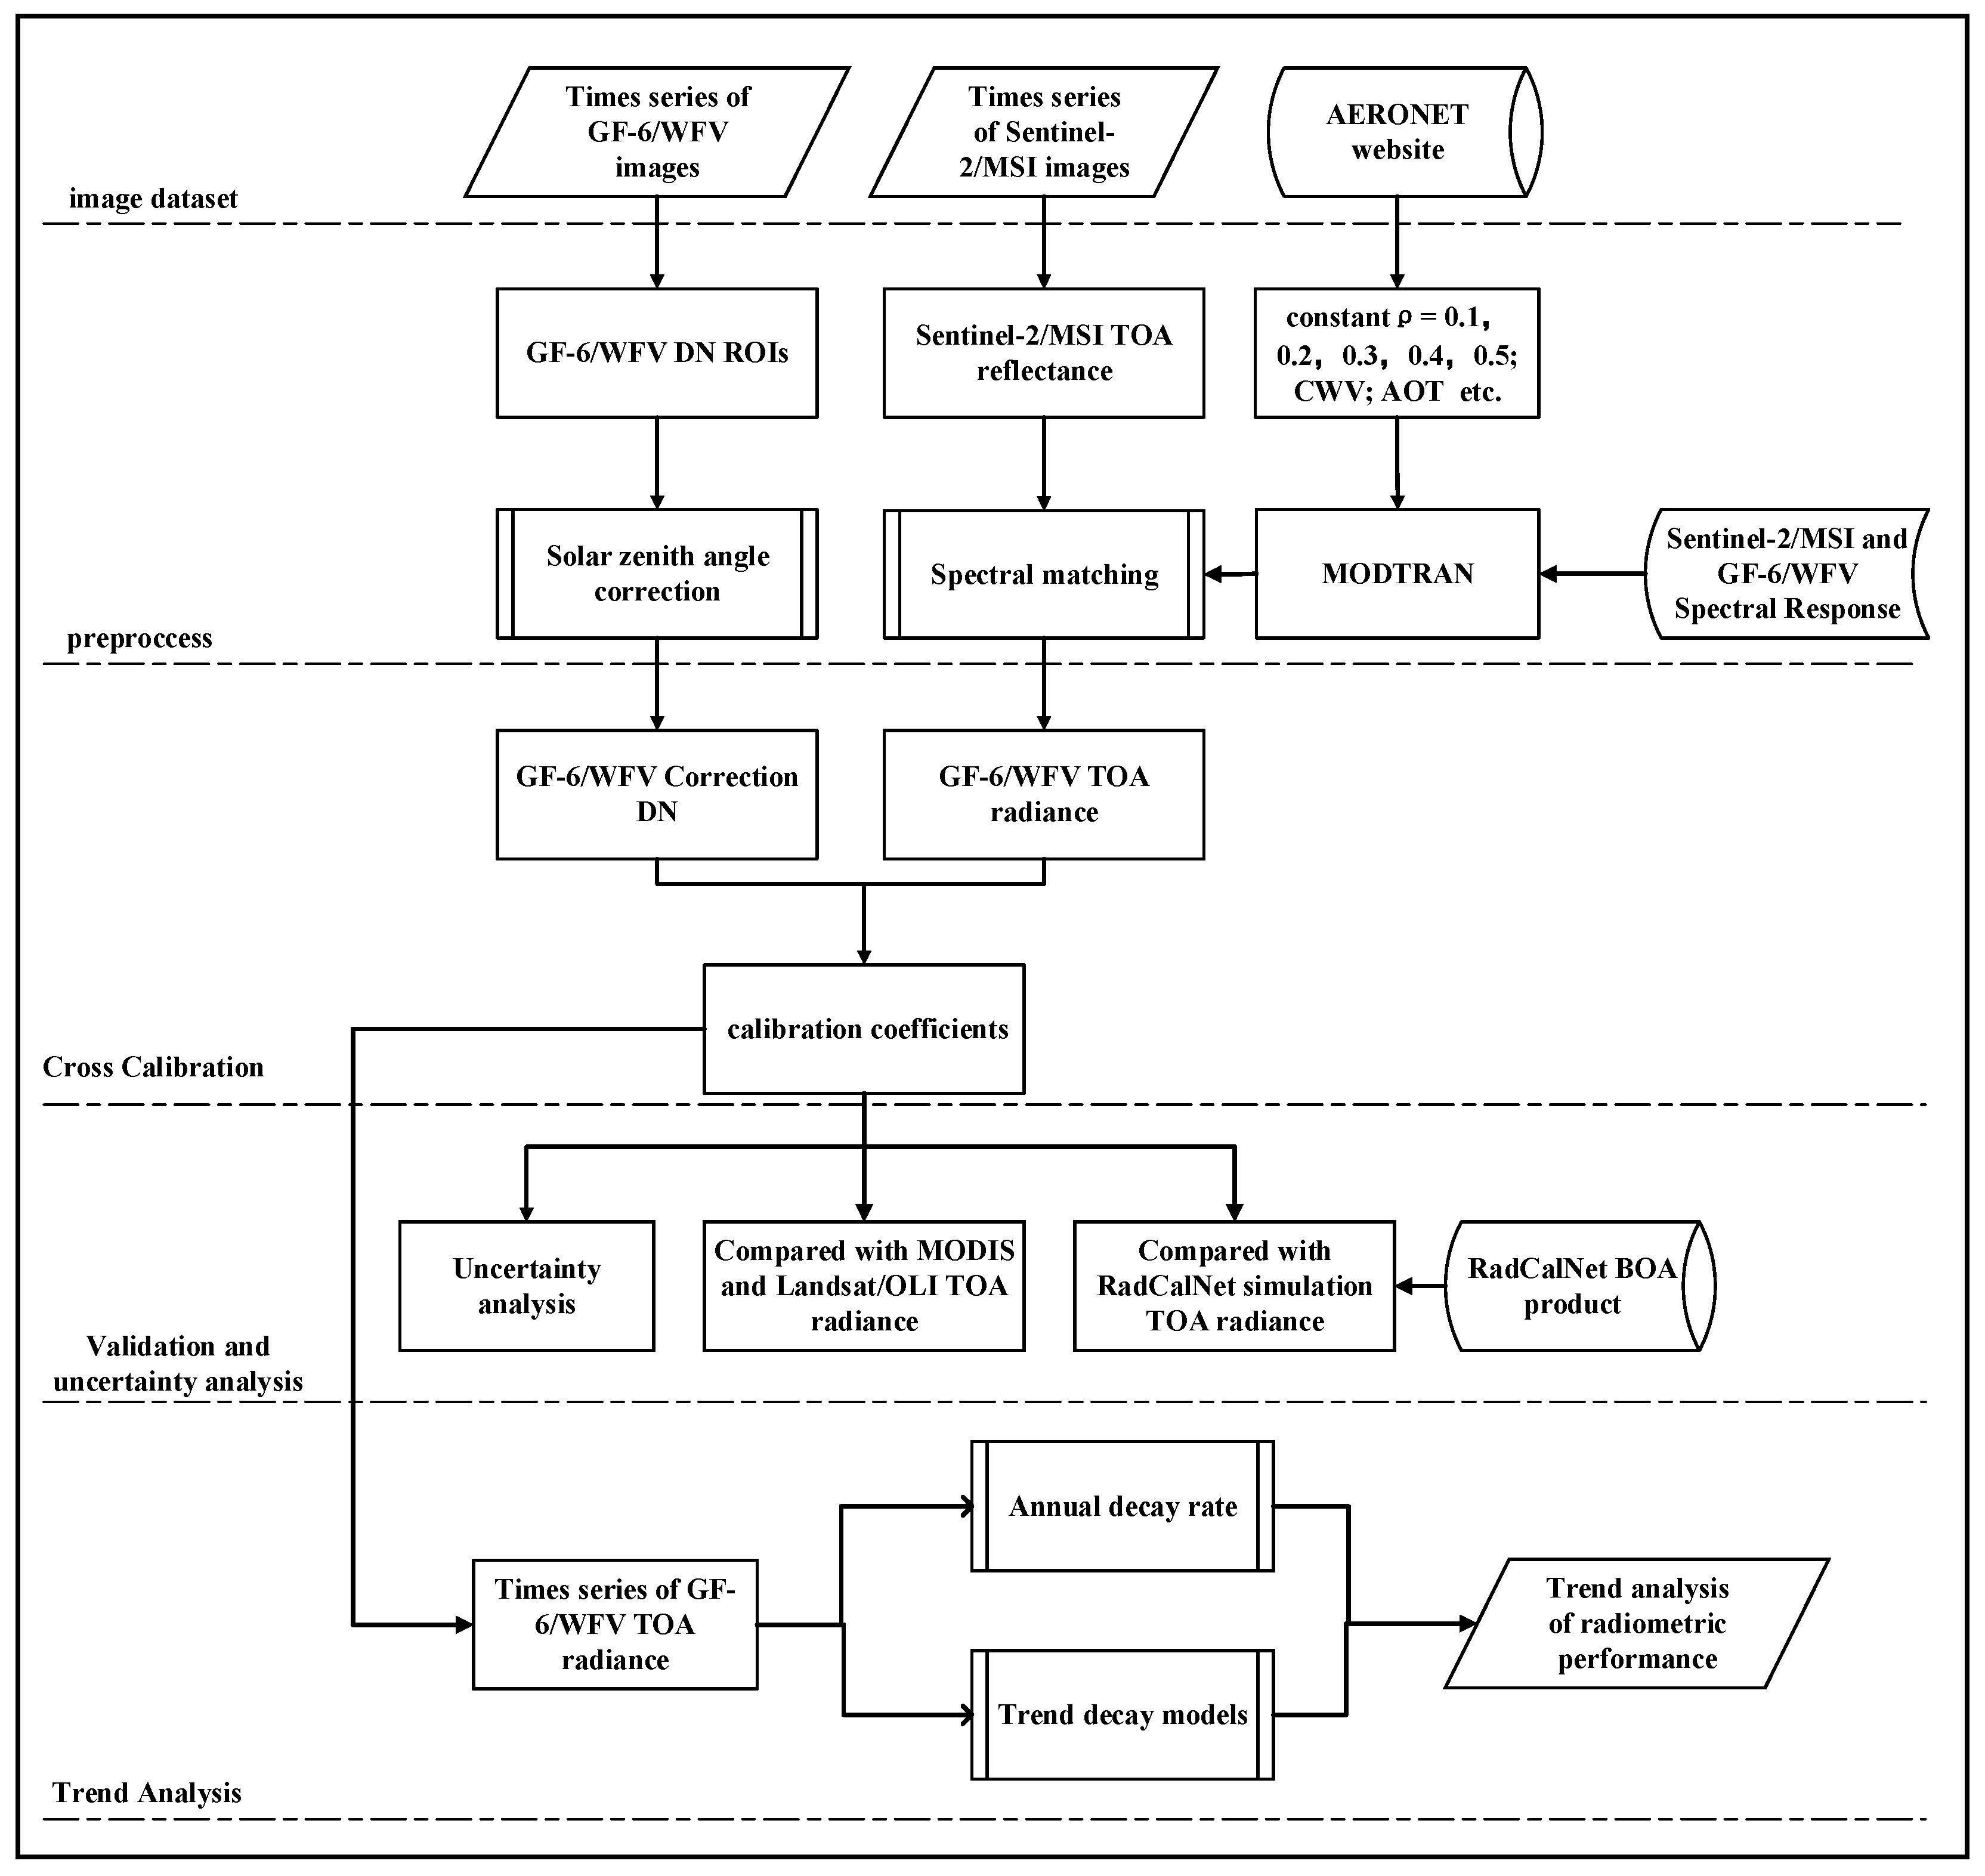
The core of cross-radiometric calibration is the selection of reference and target sensors to acquire images of the same area simultaneously or of areas nearby. This process involves establishing a radiometric relationship between the reference and target sensors by matching their spectral responses. Subsequently, the absolute on-orbit radiometric calibration of the target sensors is achieved based on the highly accurate calibration coefficients of the reference sensors [23]. The main challenge of cross-radiometric calibration is to eliminate the differences between the two sensors associated with spectral responses, geometry angles, and atmospheric profiles. In this study, the cross-radiometric calibration for GF-6/WFV was performed via spectral matching based on the normalized TOA reflectance using Sentinel-2/MSI as the reference sensor. The flowchart of the time-series cross-radiometric calibration and validation of GF-6/WFV at RadCalNet sites is shown in Figure 8.
As depicted in Figure 8, the specific process for cross-calibration includes the following steps: match-up of the GF-6/WFV and Sentinel-2/MSI images at the RadCalNet sites, spectral matching, correction for the solar zenith angle, and calculation of radiometric calibration coefficients. Firstly, image pairs with a time difference of less than 30 min and no cloud cover were selected. For these matched image pairs, the TOA reflectance and DN values for the calibration points were extracted from Sentinel-2/MSI and GF-6/WFV images separately. Subsequently, the extracted TOA reflectance values underwent spectral matching and were converted to TOA radiance values, and the extracted DN values were corrected for the solar zenith angle. Using the preprocessed TOA radiance and DN values, the on-orbit radiometric calibration coefficients for GF-6/WFV were calculated. Then, the cross-calibration results were validated using products from RadCalNet and comparisons with Landsat/OLI and MODIS data. Furthermore, the overall uncertainty of the cross-radiometric calibration was also estimated. Finally, trend analysis of the time-series radiometric performance was also conducted. Detailed descriptions of the key steps of the cross-radiometric calibration are given below, while the validation and uncertainty analysis as well as the trend analysis are described in the Section 4.
3.1. Spectral Matching
The spectral response functions (SRFs) between the Sentinel-2/MSI and GF-6/WFV sensors exhibit notable differences, as shown in Figure 5. Therefore, spectral matching using spectral band adjustment factors (SBAFs) is the key step when carrying out cross-radiometric calibration of the target sensor with a reference sensor. In this study, the SBAFs are defined as the fitting coefficients of the TOA reflectance between the GF-6/WFV and Sentinel-2/MSI sensors, as expressed in Equation (1). The SBAFs not only take into account the differences in the SRFs but also the variations in the sun–target–sensor geometries (), AOT, and CWV atmospheric parameters in GF-6/WFV and Sentinel-2/MSI imaging at the RadCalNet sites [24].
where and are the SBAFs between the GF-6/WFV and Sentinel-2/MSI sensors, and and , calculated with Equations (2) and (3), represent the values of TOA reflectance of the GF-6/WFV and Sentinel-2/MSI sensors, respectively.
where is the equivalent solar irradiance at the Earth–Sun distance of GF-6/WFV and Sentinel-2/MSI; and are the solar zenith angles at the imaging moments of WFV and MSI, respectively; is the mean distance between the Earth and the Sun; is the spectral bands corresponding to GF-6/WFV and Sentinel-2/MSI; and and represent the TOA radiance values of GF-6/WFV and Sentinel-2/MSI.
To determine the SBAFs of and in Equation (1), the TOA radiance of GF-6/WFV () and Sentinel-2/MSI () were simulated with the MODTRAN-5 transfer radiative code by setting the surface reflectance to 0.1, 0.2, 0.3, 0.4, and 0.5. For each simulation, the differences in SRFs, the sun–target–sensor geometries, AOT, and CWV atmospheric parameters between GF-6/WFV and Sentinel-2/MSI were considered, as described in Section 2. The atmospheric profiles used in the input parameters of MODTRAN-5 were the standard atmospheric profile models established by the U.S. Air Force Geophysical Laboratory. The rural aerosol model was used in this study according to the recommendation of the RadCalNet sites. It allowed for the spectral matching factors to be calculated by linearly fitting the simulated sets of TOA reflectance of GF-6/WFV and Sentinel-2/MSI. It should be pointed out that the BRDF was not corrected in the time-series cross-radiometric calibration of GF-6/WFV. The reason is that the variations in the sun–target–sensor geometries were considered in the simulation of the values of TOA radiance of GF-6/WFV and Sentinel-2/MSI when fitting the SBAFs according to Equation (1). The viewing angles of Sentinel-2/MSI used as reference are smaller than 10 degrees. Therefore, the large viewing angles of GF-6/WFV were corrected to the approximate nadir viewing angles of Sentinel-2/MSI when conducting the cross-radiometric calibration using the SBAFs.
3.2. Solar Zenith Angle Correction
To perform time-series calibration of GF-6/WFV, remote sensing images captured over a significant period, spanning various months and acquired at different solar zenith angles, were selected in this study. Then, solar zenith angle correction was carried out according to Equation (4) for the corrected GF-6/WFV images to eliminate radiometric differences between images captured at different periods.
where is the digital counts corrected via the solar zenith angle, is the extracted digital counts over the RadCalNet sites from GF-6/WFV images, and SZA is the solar zenith angle at the moment of imaging. The solar zenith angle is influenced by the satellite’s overpassing time, latitude, and longitude [6].
3.3. Radiometric Cross-Calibration
Firstly, the reference time-series TOA reflectance values () over the RadCalNet sites were extracted from the Sentinel-2/MSI L1C level images. Then, the time-series TOA reflectance of GF-6/WFV () was determined according to Equation (5) based on the calculated SBAFs using Equation (1). Next, the time-series TOA reflectance of GF-6/WFV was converted to TOA radiance () values with Equation (6). Finally, based on the time-series TOA radiance and collected DNs of GF-6/WFV, the time-series radiometric calibration coefficients of GF-6/WFV were calculated according to Equation (7).
where is the radiometric calibration coefficients at each band with the unit of W/m2/sr/μm.
4. Results and Discussion
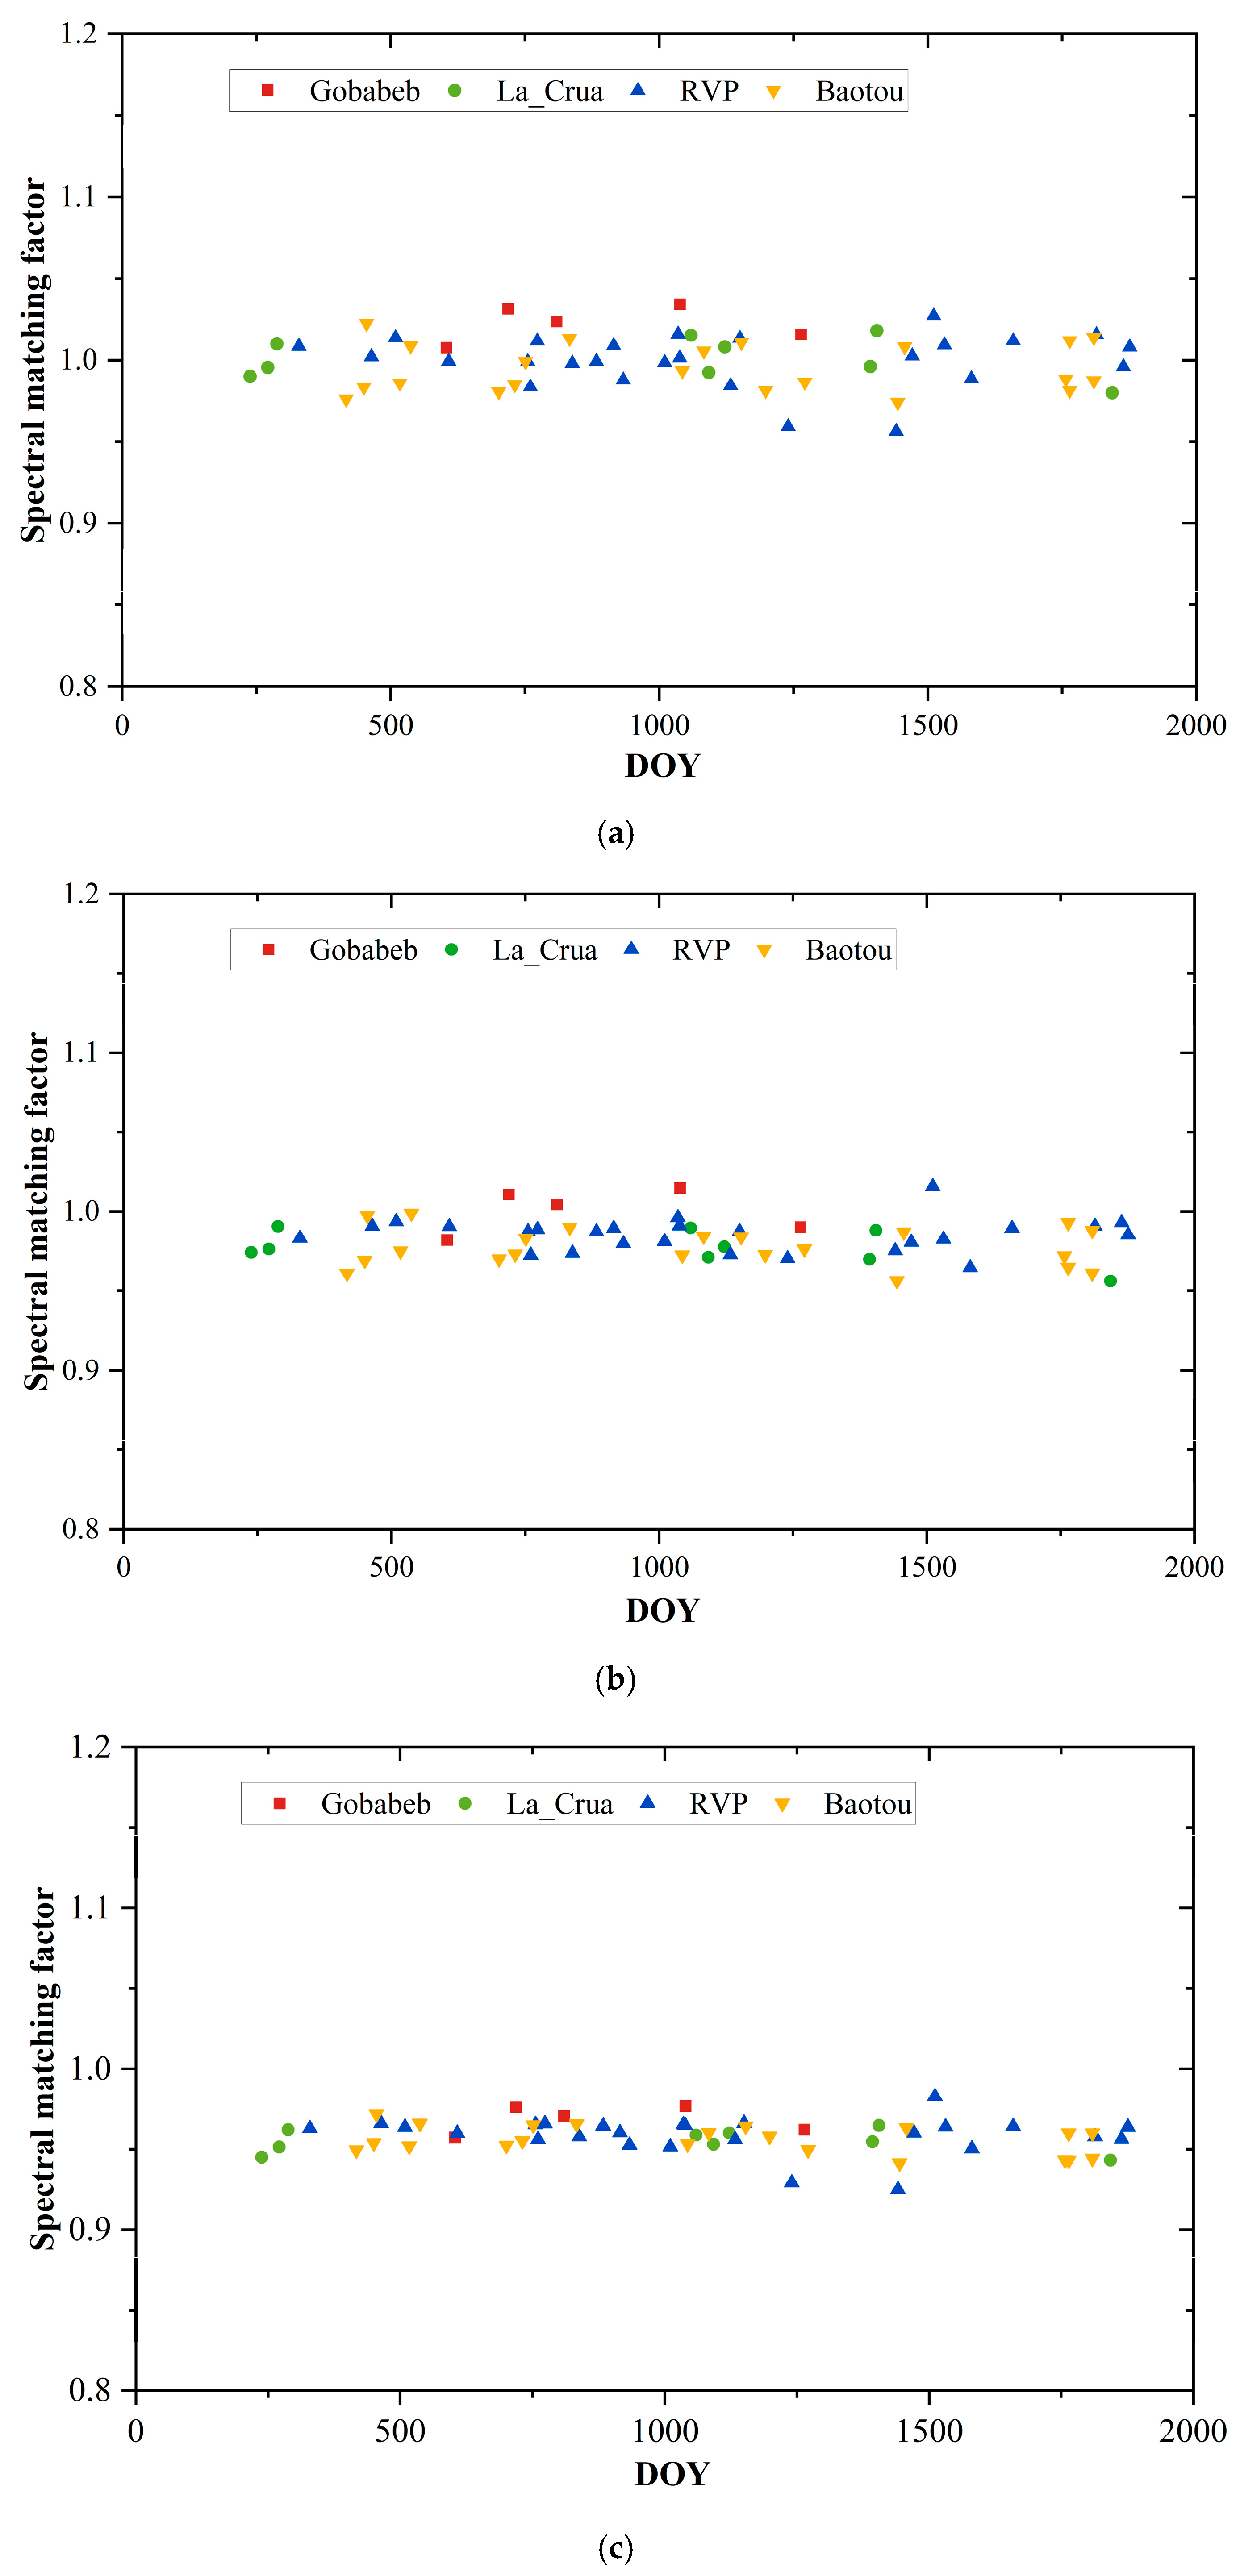
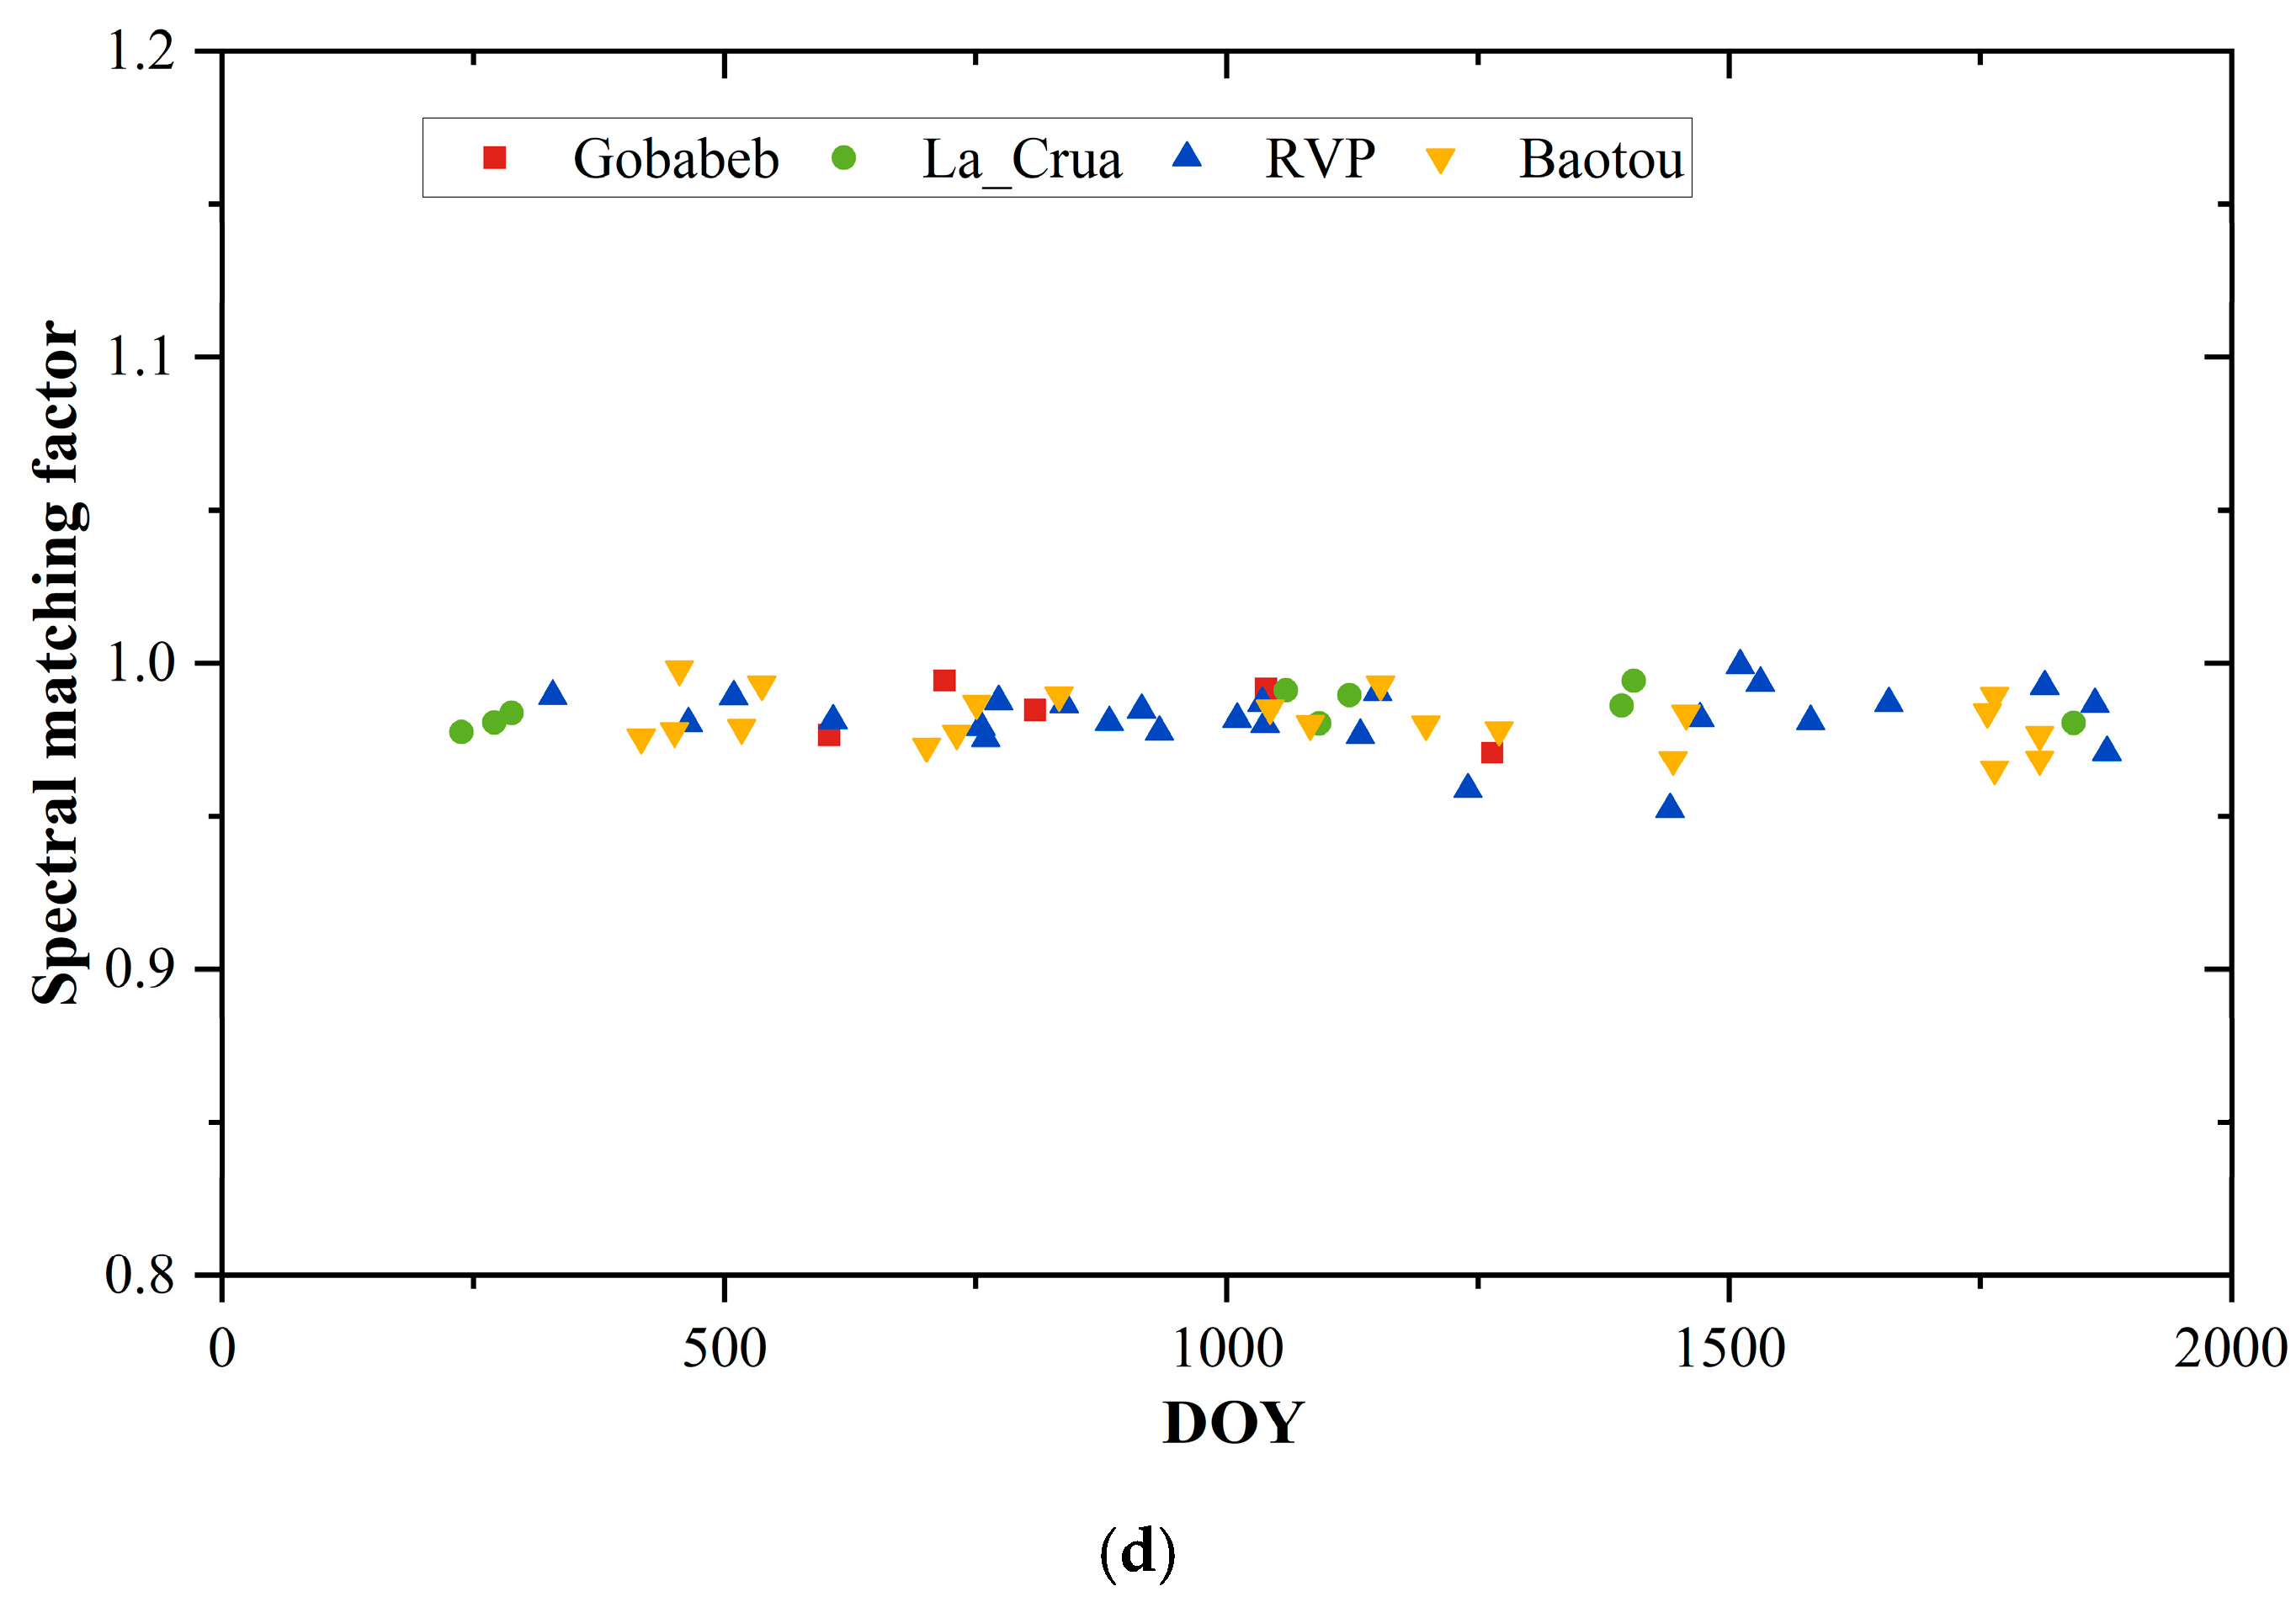
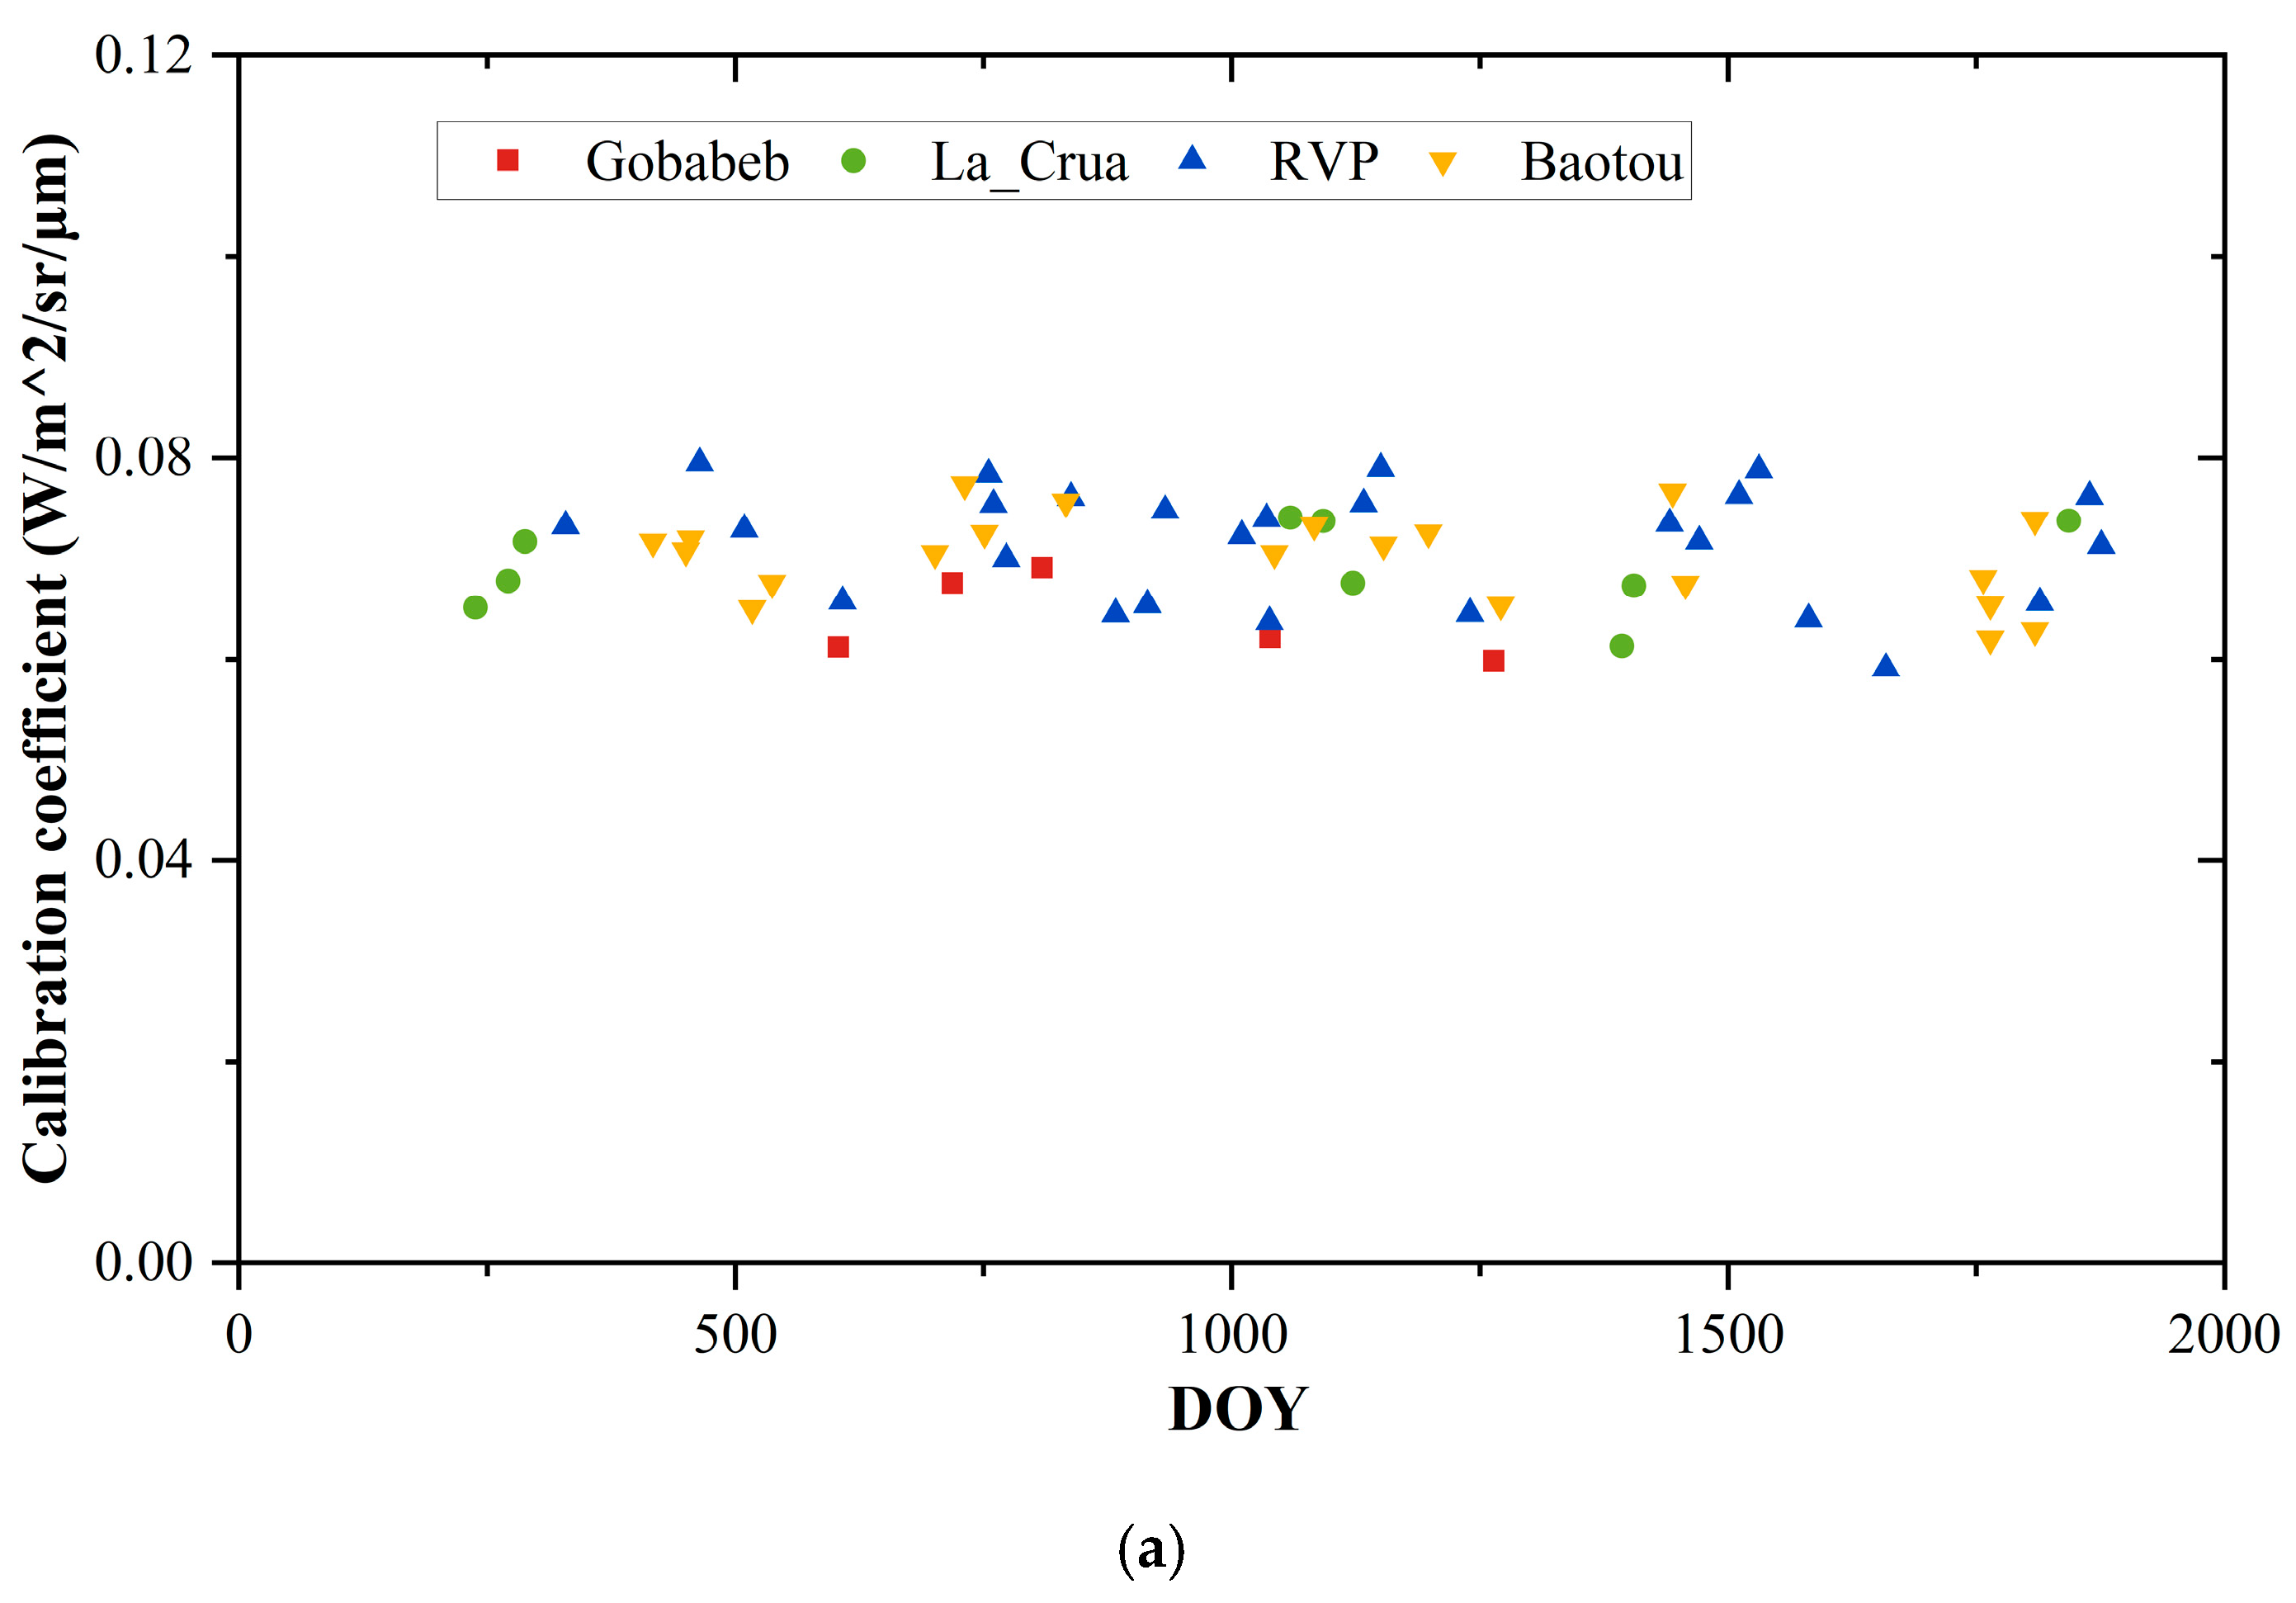
4.1. Cross-Radiometric Calibration Results
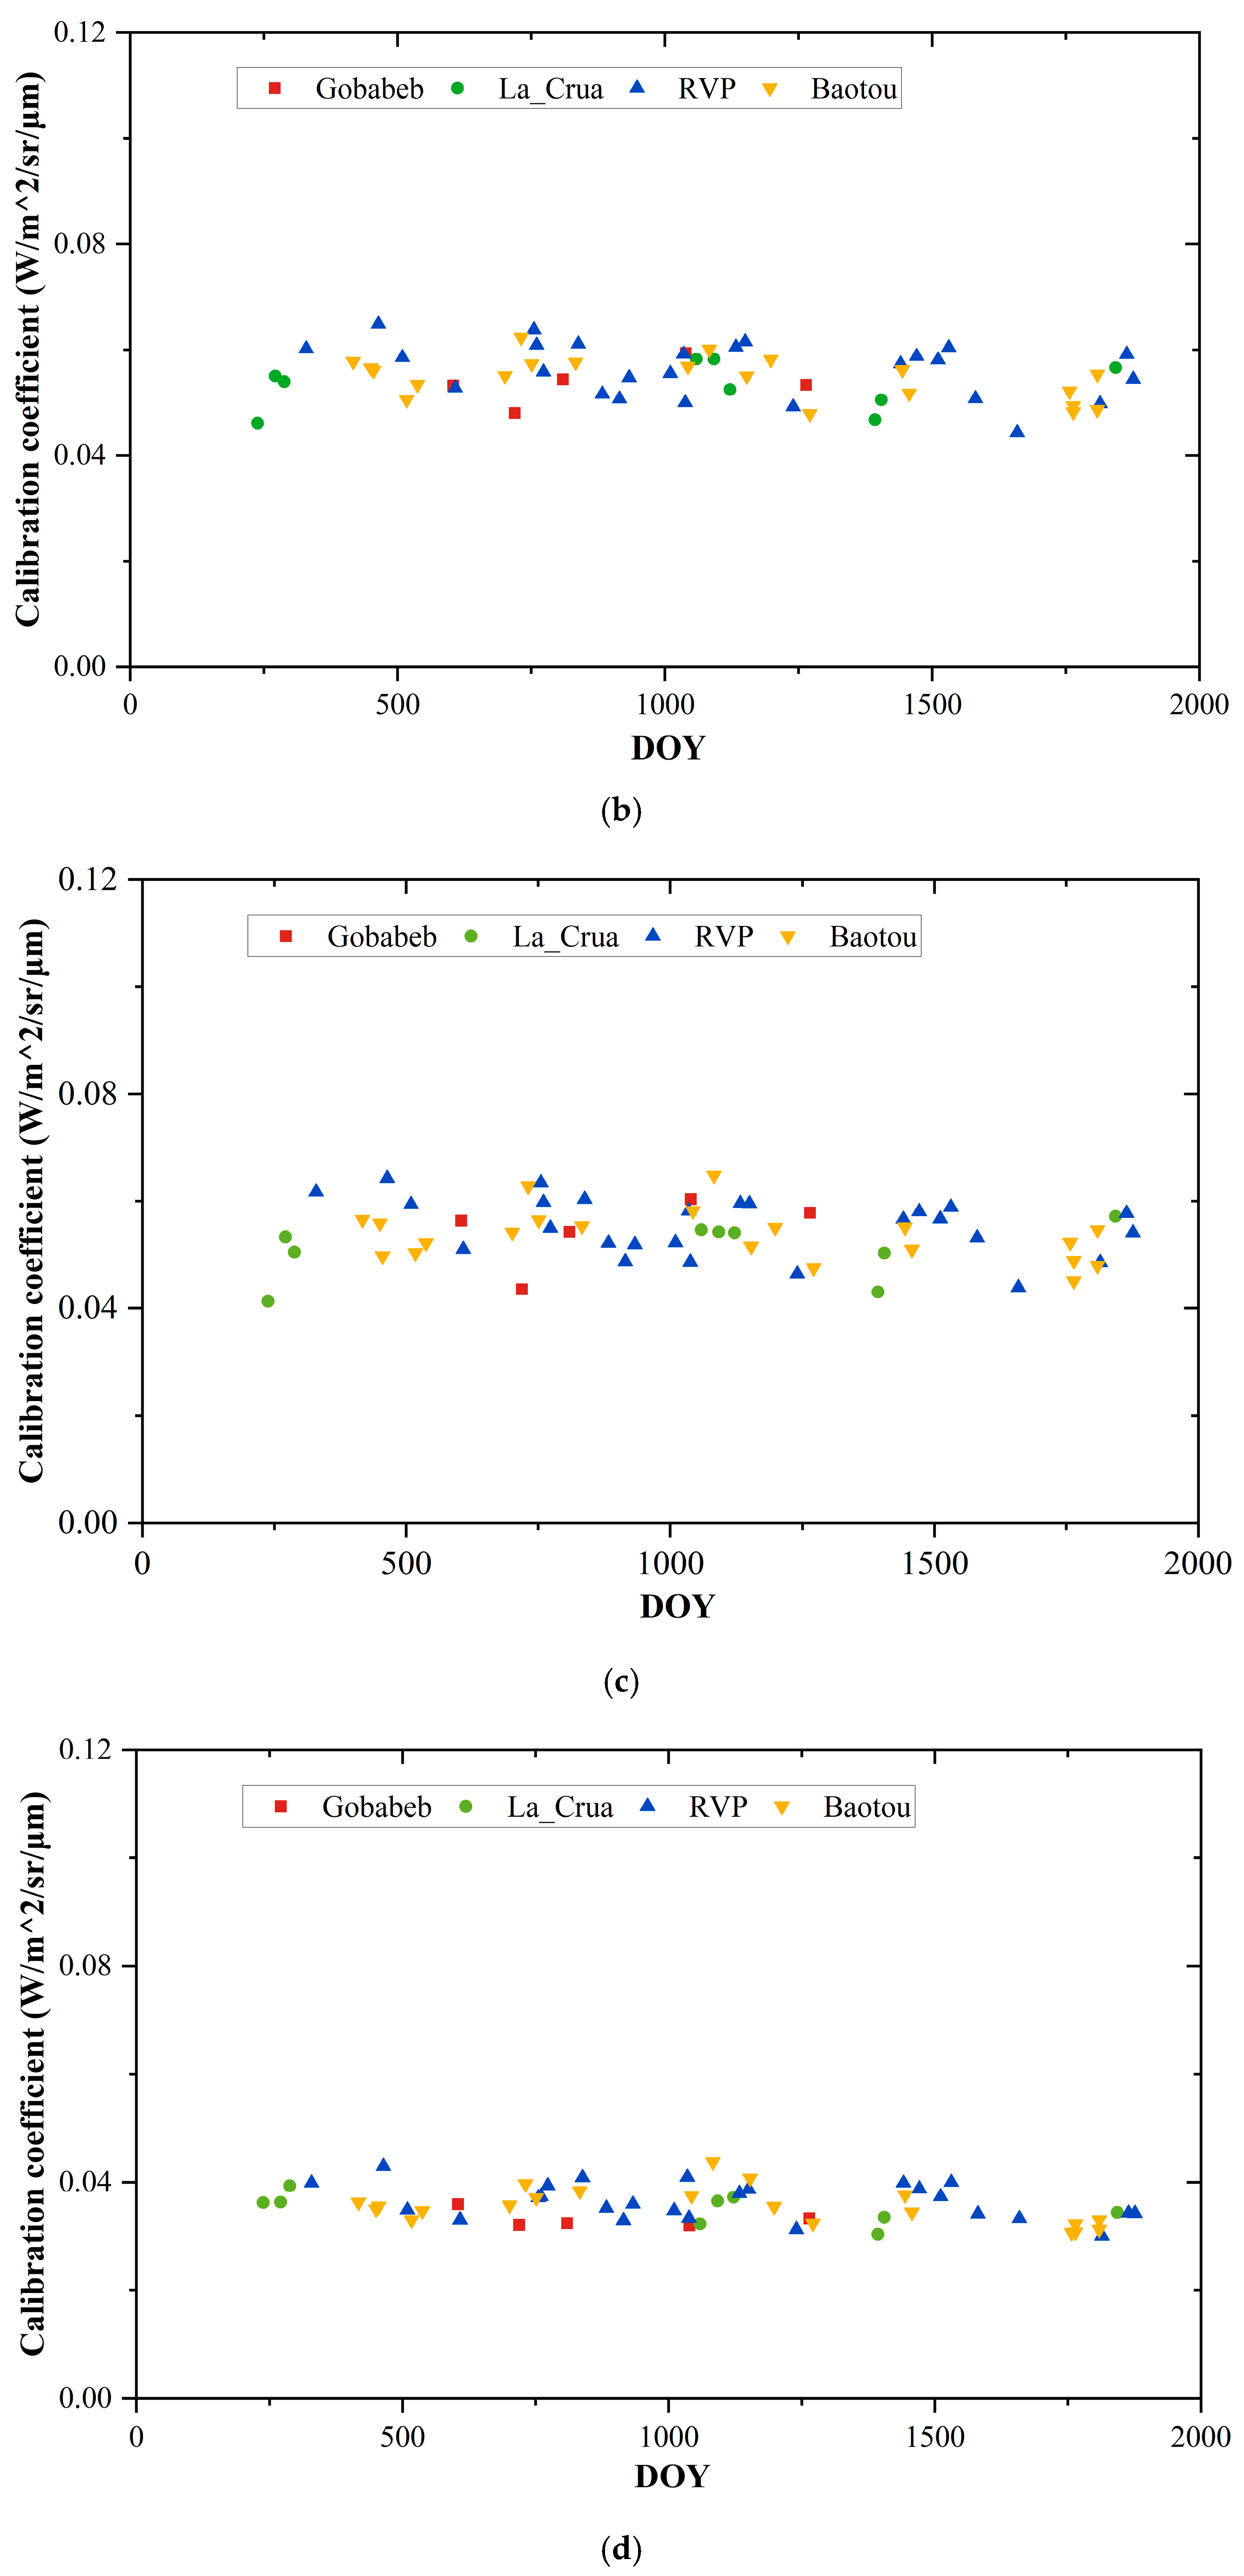
Based on the cross-radiometric calibration method and datasets introduced in Section 2 and Section 3, the time-series on-orbit radiometric calibration coefficients of GF-6/WFV in the four matched VNIR bands were calculated with reference to Sentinel-2/MSI. Firstly, the spectral matching factors, SBAFs, were calculated based on the method described in Section 3.1, and the results are illustrated in Figure 9. It is worth noting that only the gains () of SBAFs are shown in Figure 9, since the offsets () of the SBAFs were near zero. Then, the time-series cross-radiometric calibration coefficients of GF-6/WFV were determined and are depicted in Figure 10, where the x-axis represents the day of the year (DOY) after the launch of GF-6/WFV and the y-axis illustrates the corresponding cross-radiometric calibration coefficients. Based on the findings presented in Figure 10, it is evident that the cross-calibration coefficients of the four bands exhibit sinusoidal trend patterns, which are likely attributable to the periodic variations in solar elevation in GF-6/WFV imaging over RadCalNet sites.
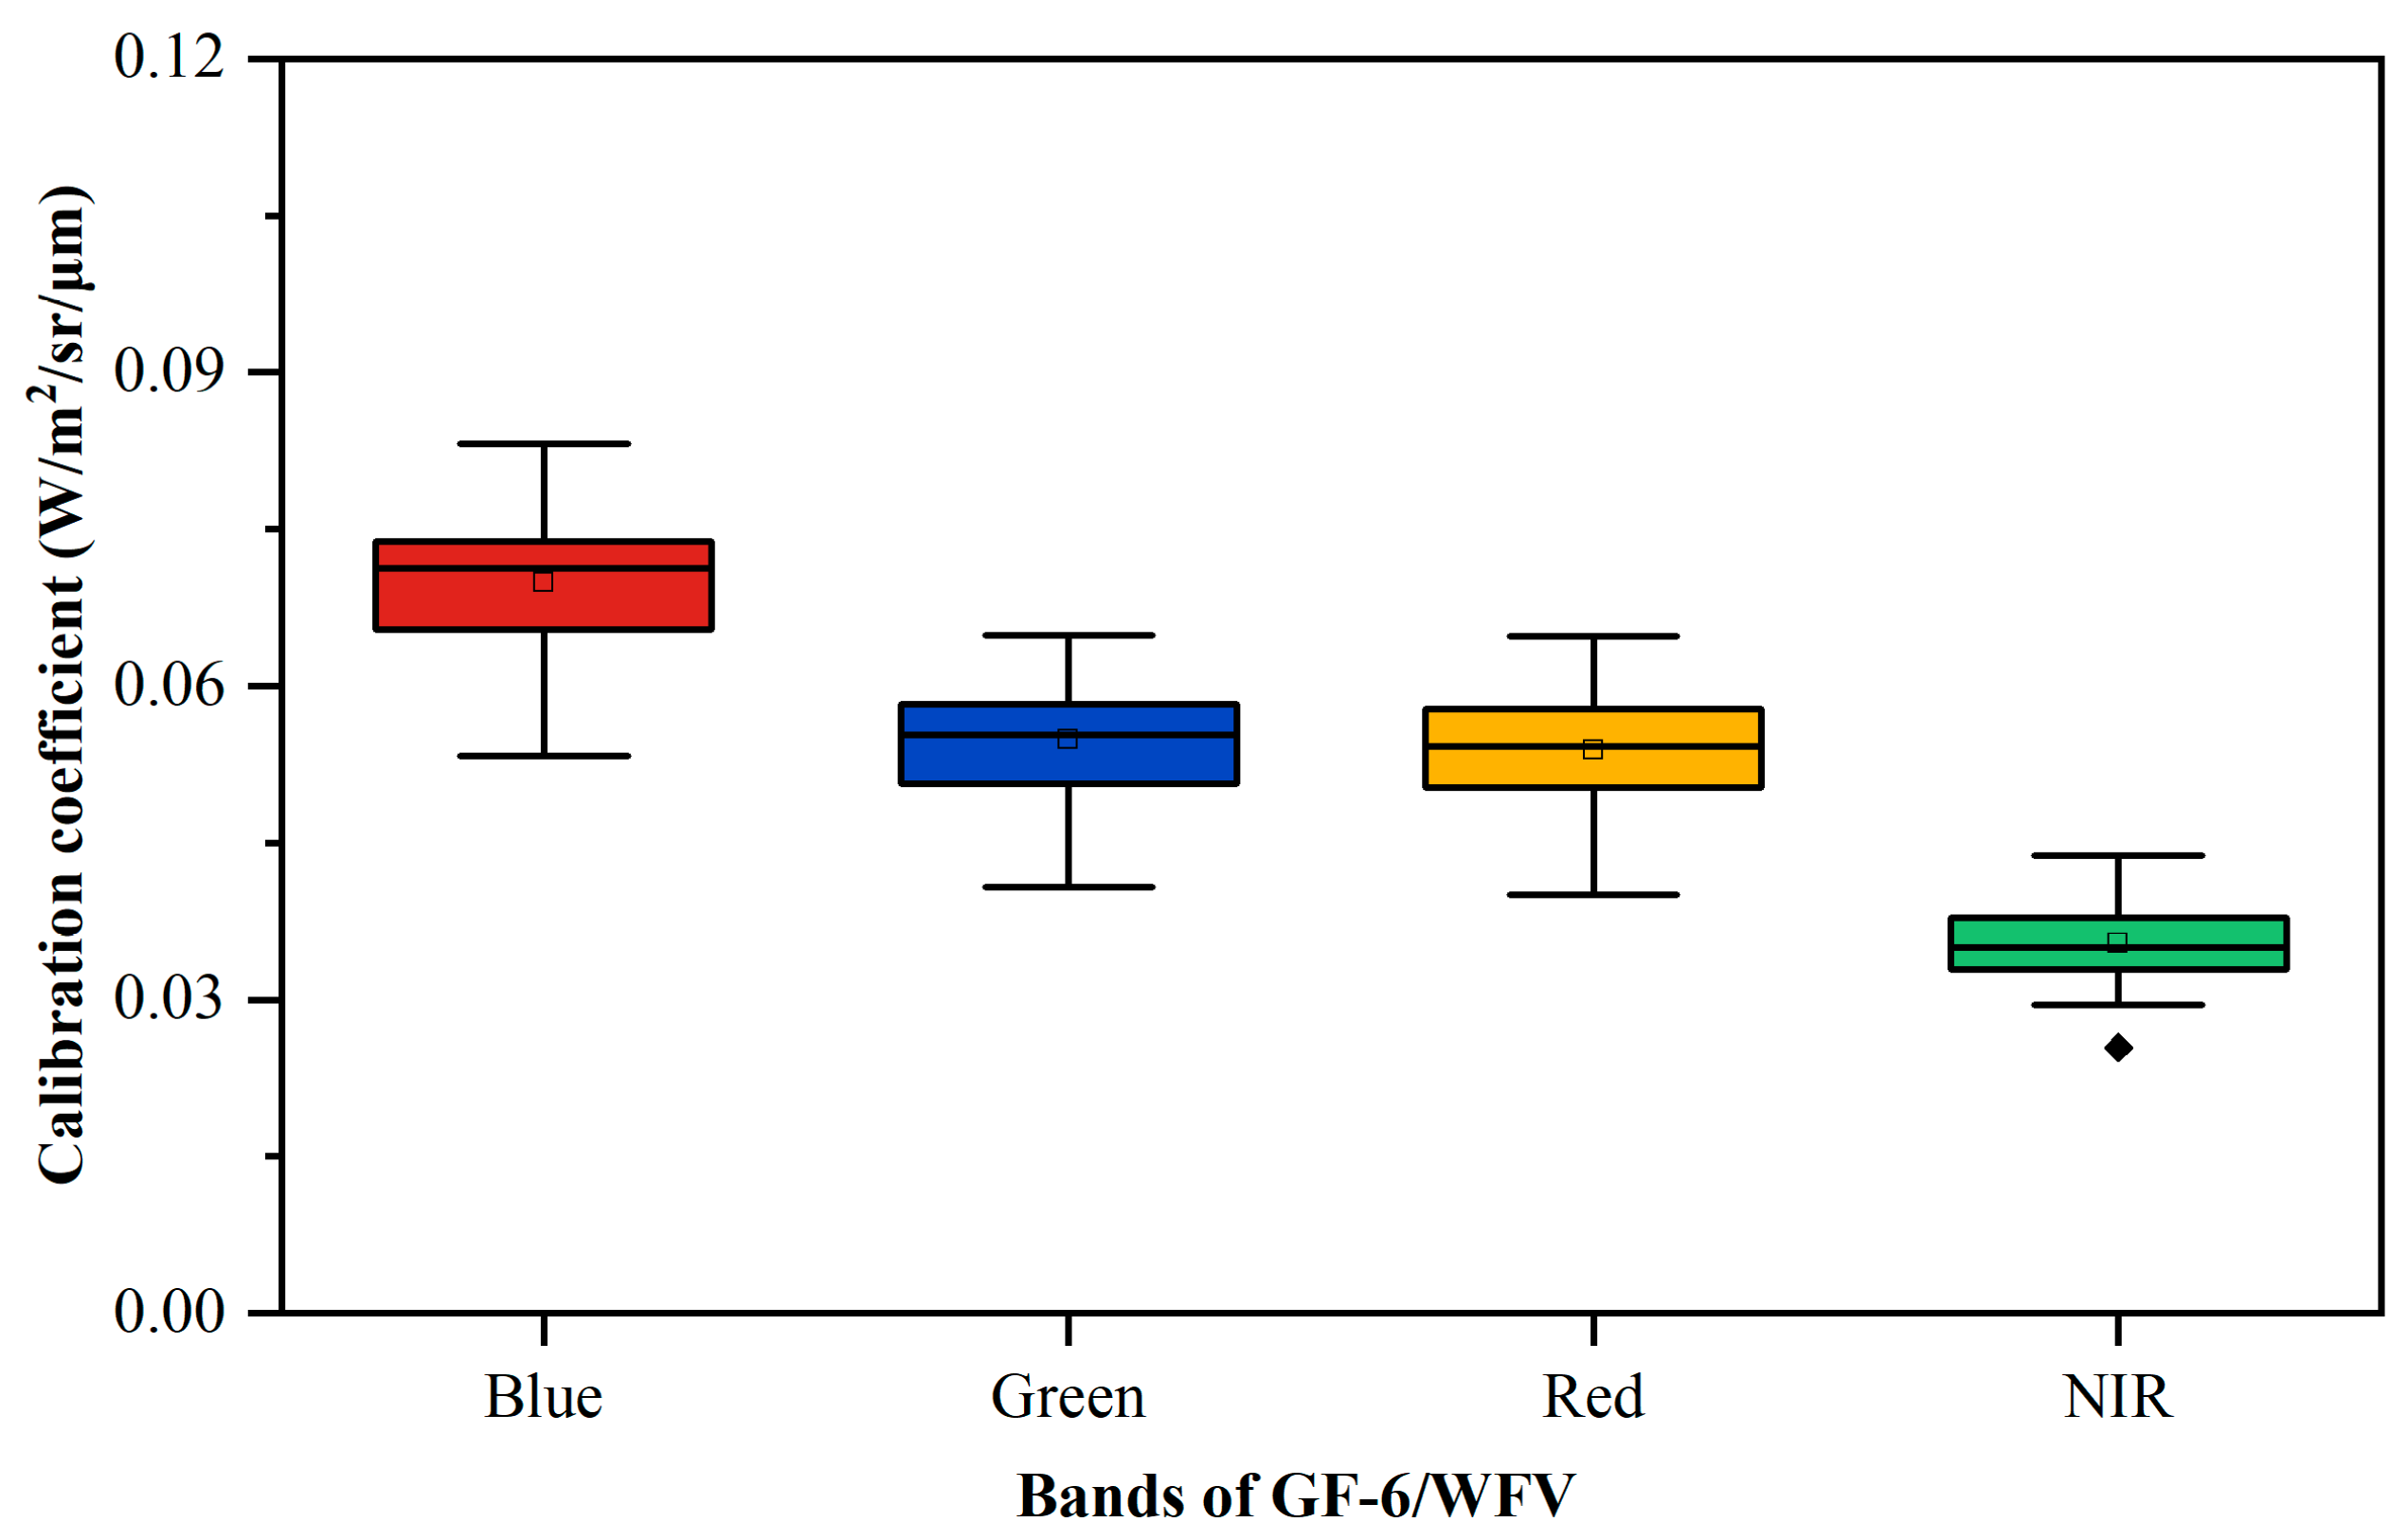
Furthermore, the analysis method employed to evaluate the dispersion of the time-series calibration coefficients was a boxplot analysis. As shown in Figure 11, this boxplot illustrates the distribution and extreme outliers of the time-series calibration coefficients. The widths of the boxes in the plot signify the variation ranges of the calibration coefficients. The plot highlights the median radiometric calibration coefficients for each spectral band as square markers along the time series. Outliers are represented by diamond-shaped markers, with the mean values for each band recorded as 0.0699, 0.0549, 0.0538, and 0.0354, respectively. According to the insights drawn from Figure 11, the radiometric calibration coefficients for the GF-6/WFV VNIR bands exhibit minimal fluctuation, indicating a generally stable radiometric performance. Notably, the near-infrared bands demonstrate the most consistent performance, while the calibration coefficients for the blue band show relatively higher variability. Except for the near-infrared band, which displays a low-level anomaly, no significant anomalies were observed in the other bands. This anomaly in the near-infrared band is attributed to a notably low phenomenon likely caused by the presence of vegetation at the La Crau site. This vegetative cover impacted the accuracy of the radiometric calibration, resulting in the observed anomalous values in the near-infrared band.
4.2. Validation Analysis of Calibration Results
To validate the accuracy of the GF-6/WFV time-series radiometric calibration outcomes derived from the cross-radiometric calibrations, a comprehensive validation analysis was carried out. For this purpose, select sites from RadCalNet, namely, Gobabeb, La Crau, RVP, and Baotou, were chosen for analysis. The RadCalNet portal (https://www.radcalnet.org, (accessed on 10 August 2023)) provides BOA products (the input files) and TOA products (the output files) to users. In this study, we used the BOA instead of the TOA products as the input datasets for validation of the cross-radiometric calibration results. The reasons are explained from two aspects as follows. First of all, the TOA reflectance from the RadCalNet output file was simulated for nadir observations. However, as we can see from Figure 6b, the viewing zenith angles are not for nadir observations. To reduce the effect due to the viewing zenith angles’ difference, we predicted the TOA radiance with the MODTRAN radiative transfer code by configuring the GF-6/WFV viewing zenith angles as well as the BOA reflectance and atmospheric parameters from the RadCalNet input files. On the other hand, RadCalNet provides the TOA reflectance, which should be converted to TOA radiance to compare it with the cross-radiometric calibrated TOA radiance. Both the solar irradiance and cosine values of solar zenith angles should be given when converting the TOA reflectance to radiance. Nevertheless, solar irradiance data are not given by RadCalNet, and the selection of different sources of solar irradiance data may introduce additional errors. Taking into account the factors as explained, we predicted the TOA radiance with the MODTRAN radiative transfer code based on the BOA products from RadCalNet and the viewing zenith angles of GF-6/WFV.
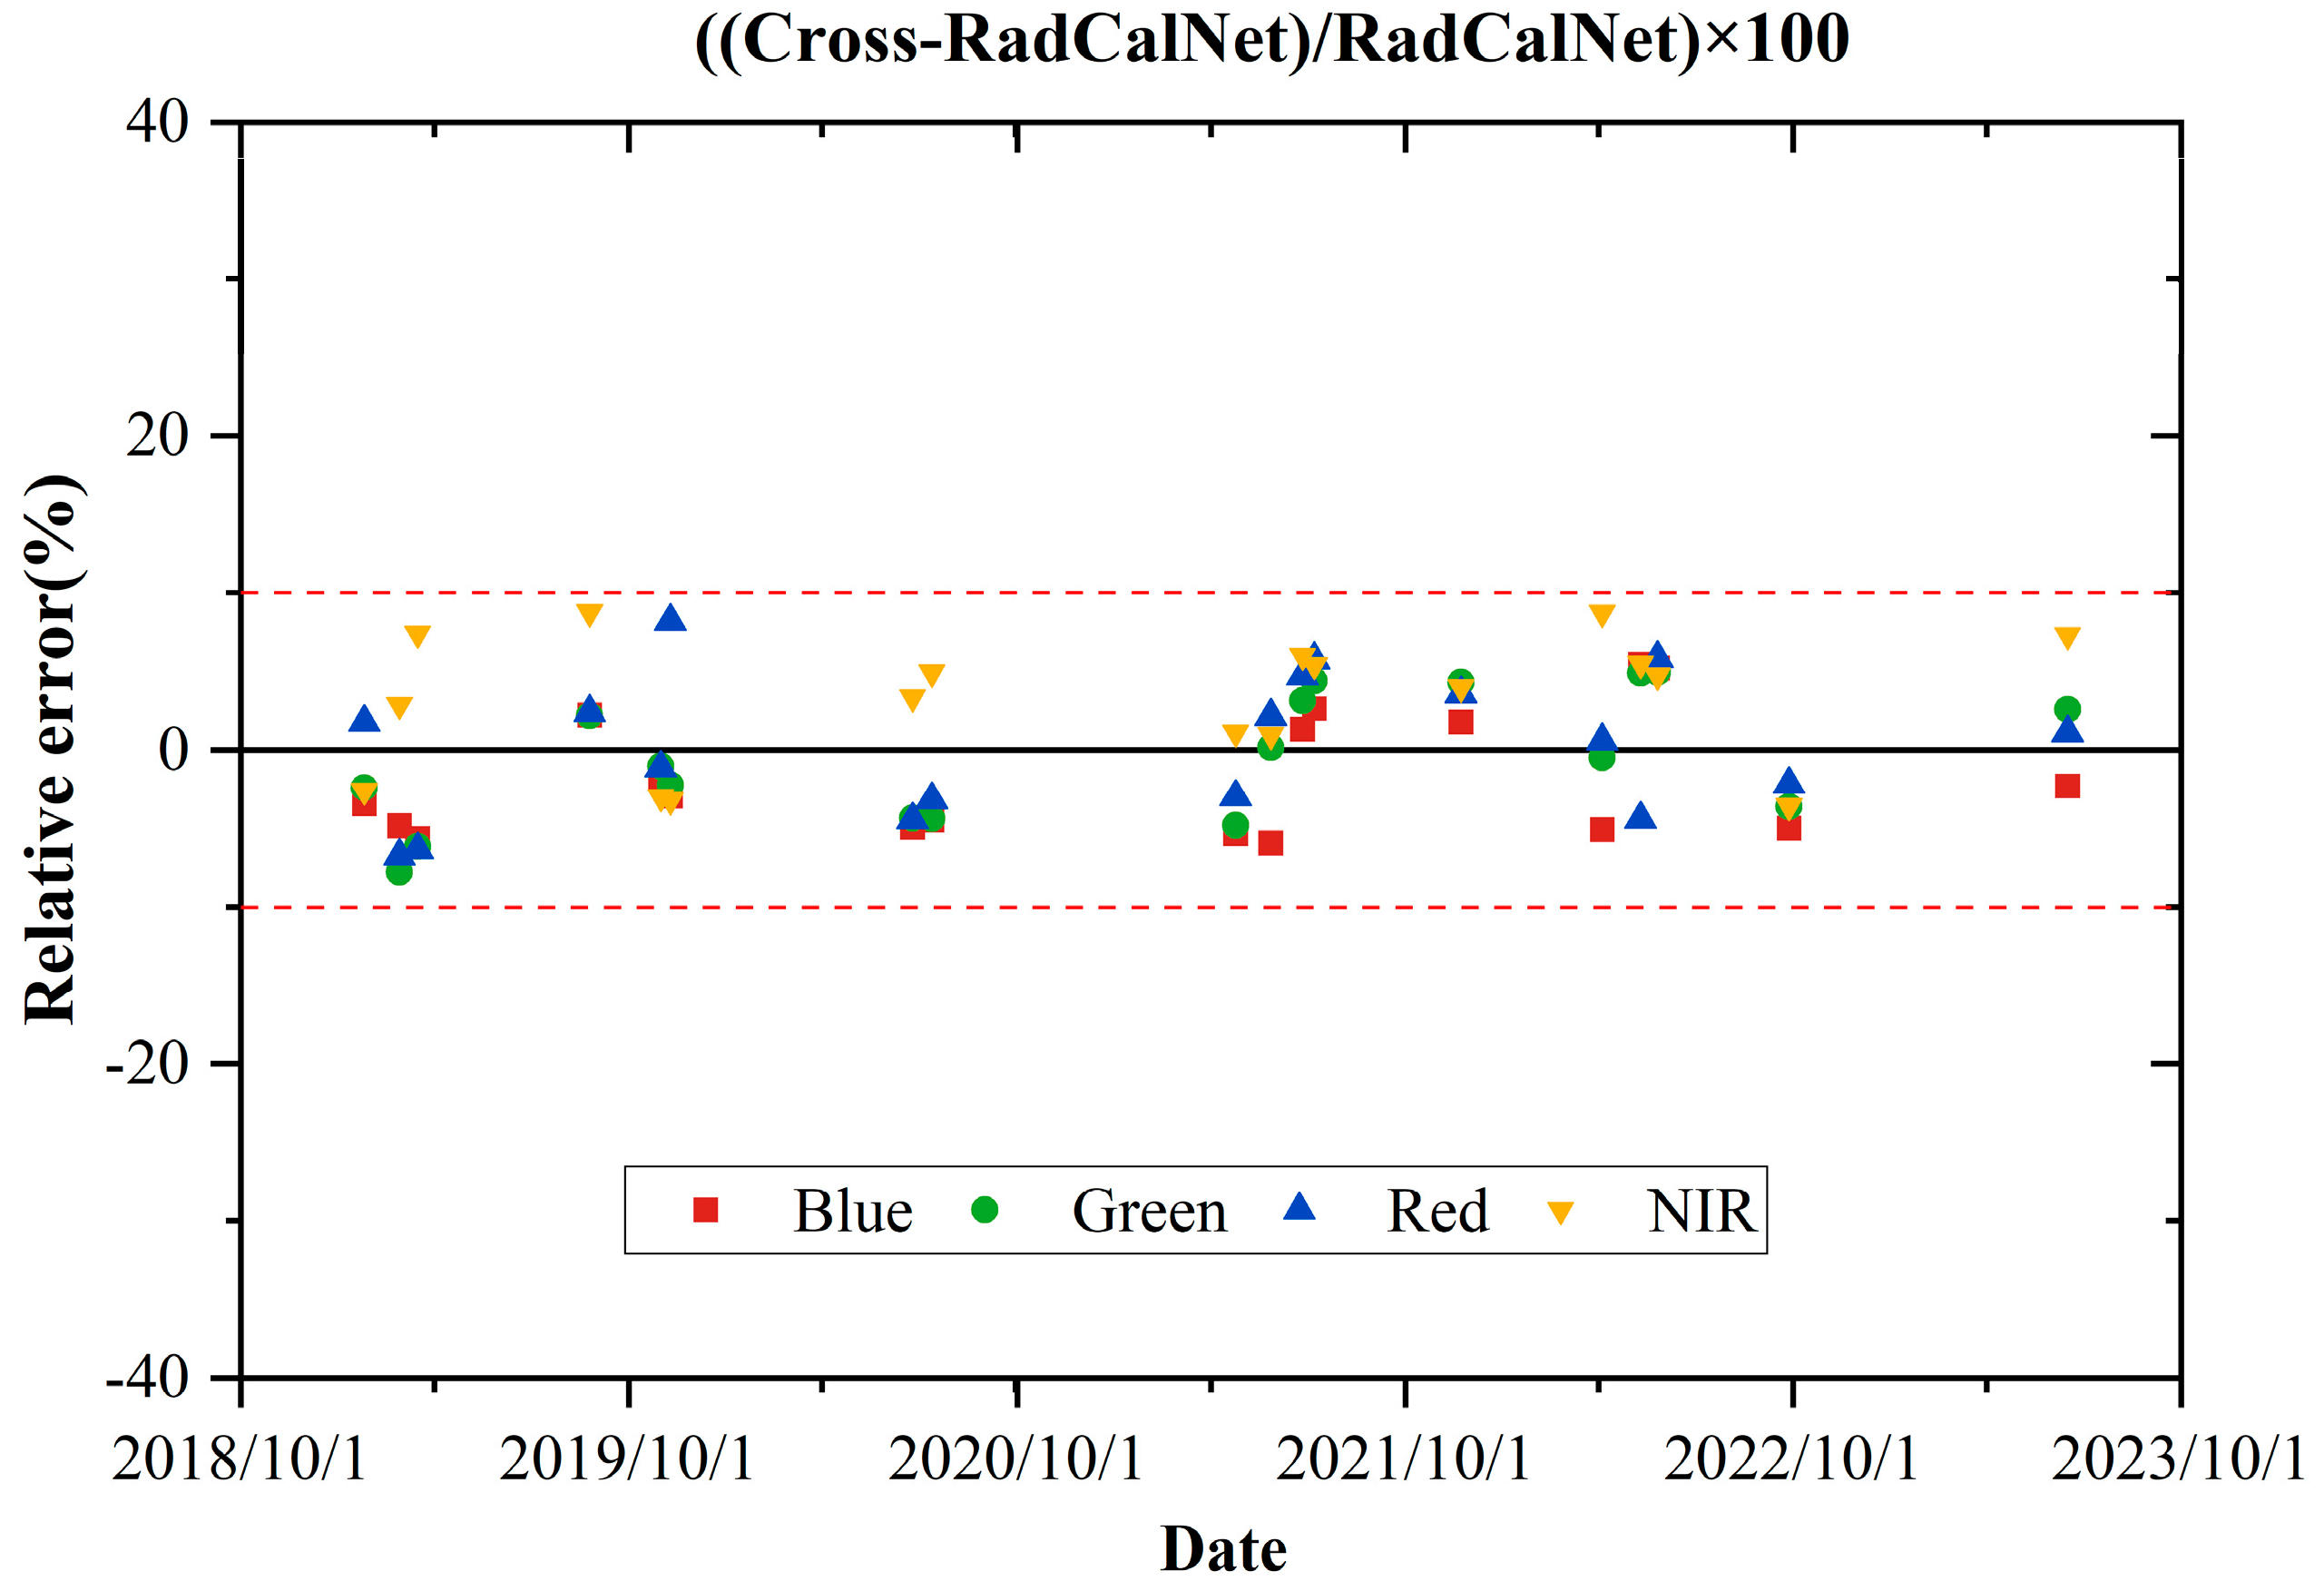
A total of 18 matchups from the RadCalNet input files, made available through the RadCalNet portal, were utilized. Each selected RadCalNet input file encompasses atmospheric and surface parameters meticulously measured by the automated observation systems deployed in the RadCalNet sites. The RadCalNet products have been evaluated to provide a reliable dataset for vicarious calibration and validation [25]. Furthermore, to minimize errors due to time differences, we selected RadCalNet products within 30 min of the GF-6/WFV overpassing time. Based on the parameters from the RadCalNet input files and the viewing zenith angles of GF-6/WFV, the TOA radiance was simulated using the MODTRAN-5 radiative transfer code. The simulated TOA radiance values were then used as a reference to validate the cross-calibrated TOA radiance produced in this study. The relative errors were calculated and are shown in Figure 12. It can be seen from Figure 12 that the relative errors of all 18 matchups between the cross-calibration and RadCalNet TOA radiance values were within ±10%. The average absolute relative errors for all 18 validation results are 3.91%, 3.55%, 3.75%, and 4.64% in the blue, green, red, and NIR bands, respectively. These findings demonstrate the precision and accuracy of the time-series cross-radiometric calibration coefficients of the GF-6/WFV in this study.
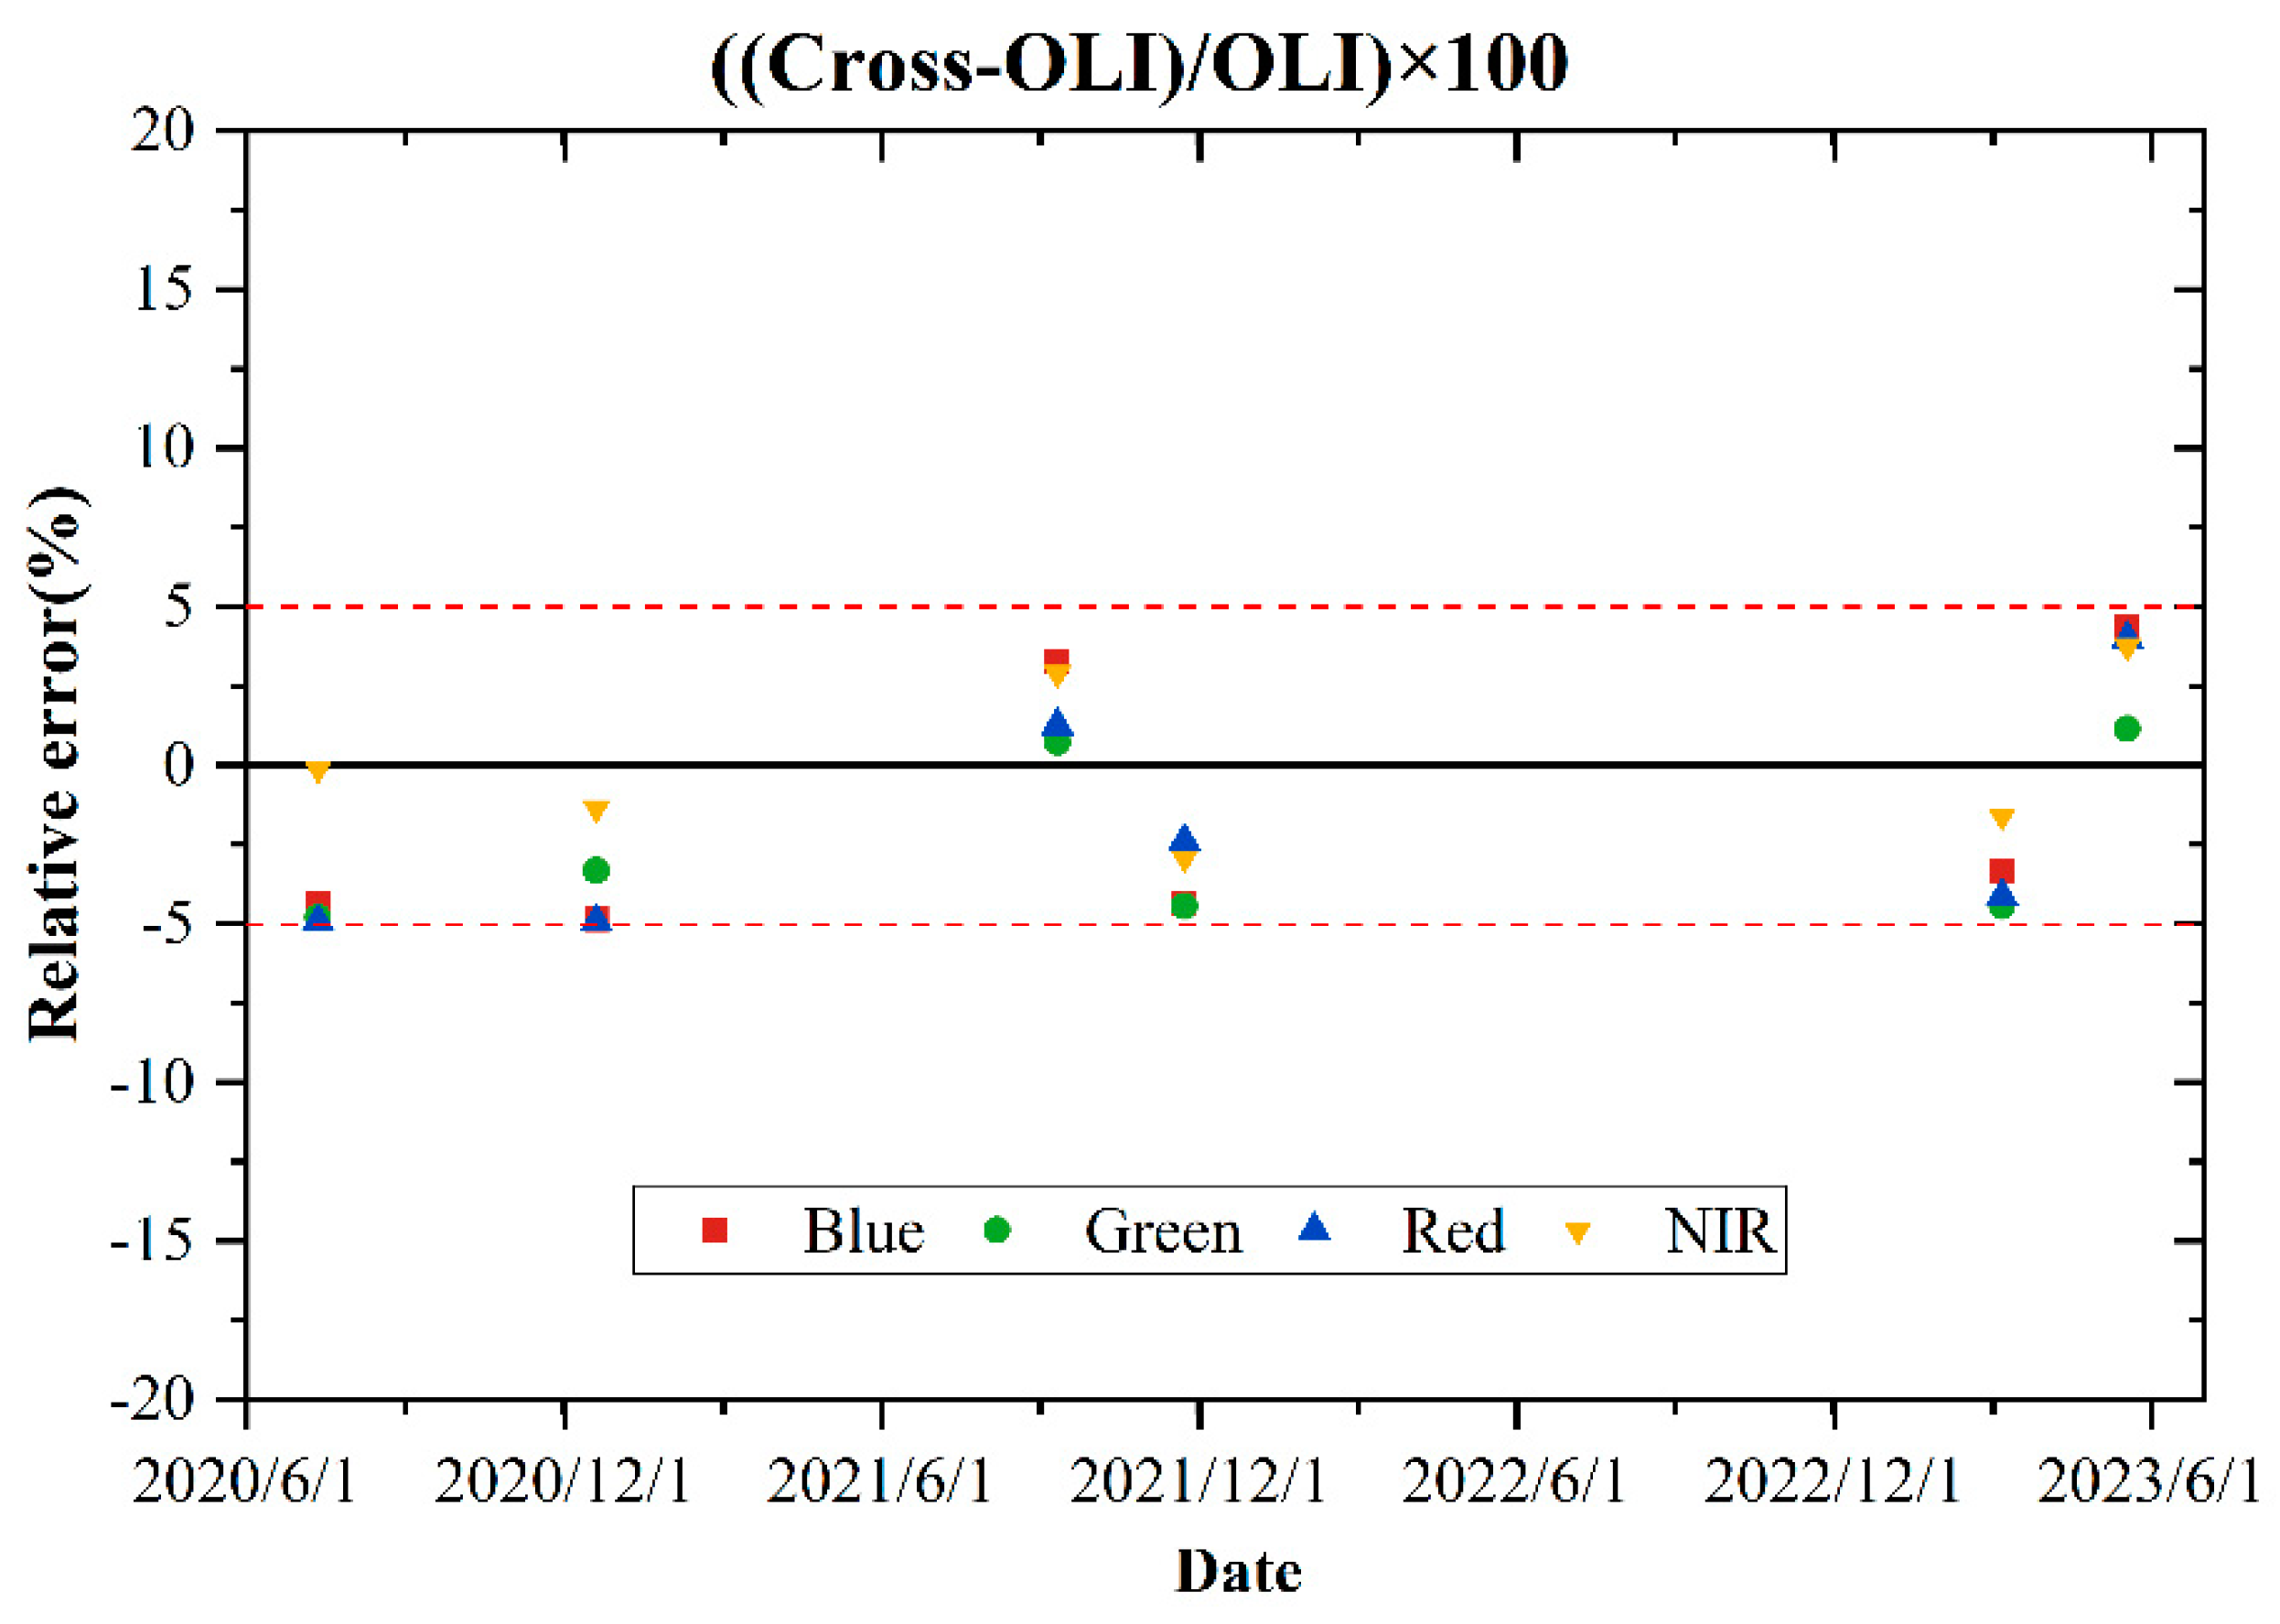
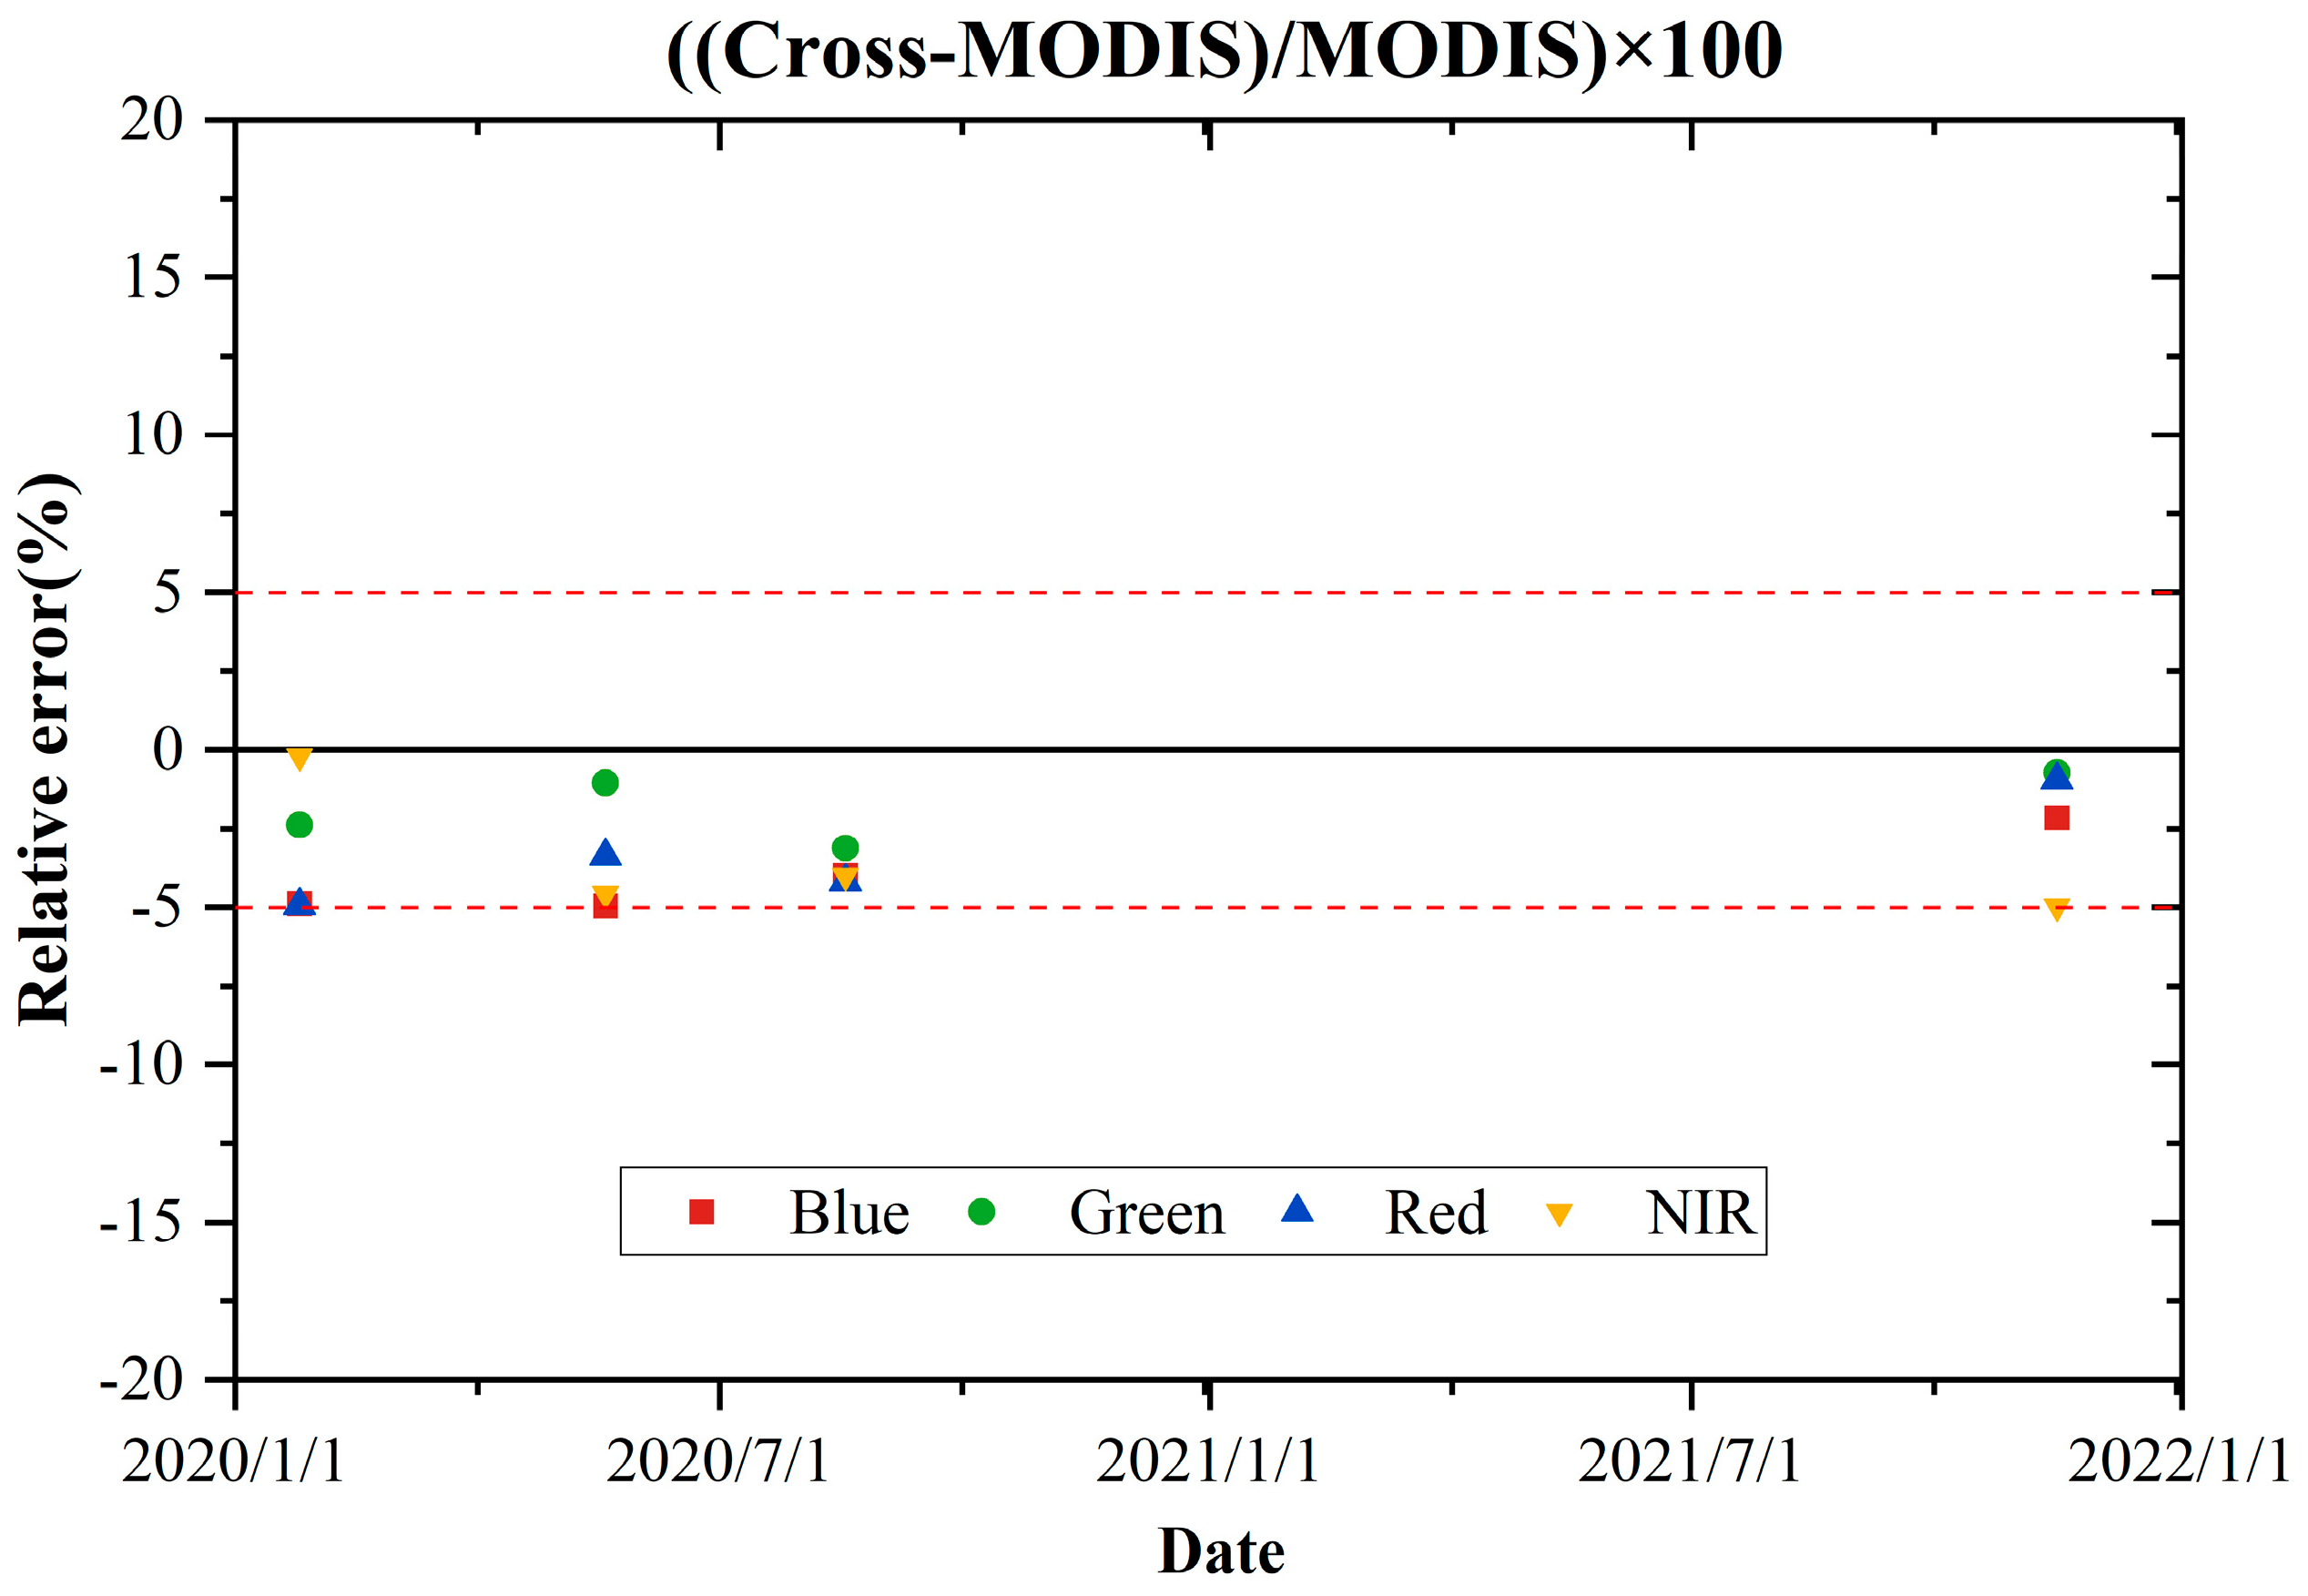
To further verify the reliability of the cross-radiometric calibration results, we selected Landsat8/OLI and MODIS, which are internationally recognized for their high accuracy, for comparisons with the GF-6/WFV radiometric calibration results. Ground reference scenes from Gobabeb, La Crau, RVP, and Baotou were selected. Matchups were chosen where the differences in the times between the target and additional reference sensors were under one hour. In total, six Landsat-8/OLI matchups and four MODIS matchups were analyzed. By applying the spectral matching technique described in Section 3.1, the Landsat8/OLI and MODIS observations were converted to TOA radiance values for each GF-6/WFV band, with the relative error serving as the evaluation index. The results are shown in Figure 13 and Figure 14. From the results, it can be seen that the relative errors are less than 5% with Landsat-8/OLI and MODIS as the reference sensor, which further proves the reliability of the radiometric calibration results.
4.3. Uncertainty Analysis
In this study, the factors that contributed to the total uncertainty of the GF-6/WFV time-series cross-radiometric calibration results include the uncertainties of image co-registration (denoted as ), the MODTRAN-5 radiative transfer code (denoted as ), referenced sensor calibrations (denoted as ), spectral matching (denoted as ), solar irradiance (denoted as ), AOT at 550 nm (denoted as ), and CWV (denoted as ). As to the uncertainty of image co-registration, a sliding-window analysis showed that the maximum uncertainty was less than 0.79%. In this study, MODTRAN-5 was used as a radiative transfer code and contributed to an uncertainty of 2% for the time-series calibration coefficients according to published references [26]. The uncertainty contributed by the referenced sensor Sentinel-2/MSI to the time-series cross-radiometric calibration coefficients was 3% [27]. According to Reference [28], the uncertainty contributed by solar irradiance to the calibration results was less than 1.5%, which was also taken as the uncertainty contribution to the cross-radiometric calibration results. According to a previously published paper [29], the absolute uncertainty of the AOT at 550 nm and the relative uncertainty of the CWV were estimated as 0.01 and 10%, respectively. The GF-6/WFV TOA reflectance was simulated using MODTRAN-5 before and after the uncertainties of AOT at 550 nm and CWV were added, and the relative errors were calculated as the uncertainty. It can be seen from Table 2, Table 3, Table 4 and Table 5 that the maximum uncertainty due to AOT at 550 nm and CWV was less than 0.5%.
Uncertainty in surface reflectance primarily influenced the spectral matching factors. The main errors originated from the surface reflectance values used in calculating these factors. The actual spectral matching factors were calculated using MODTRAN-5, based on the true surface reflectance data provided by RadCalNet. The uncertainty contribution from spectral matching factors was assessed by comparing the actual spectral matching factors with those utilized in this study, revealing that the maximum uncertainty generally did not exceed 3%.
Based on the error propagation theory, the overall uncertainty of the cross-radiometric calibration, encompassing image co-registration, the MODTRAN-5 code, the referenced sensor calibrations, spectral matching, and solar irradiance, was computed with Equation (8) as follows.
The overall uncertainties of the cross-radiometric calibration based on the RadCalNet sites, as determined from the sources of uncertainty described above, are listed in Table 2, Table 3, Table 4 and Table 5. The results of the time-series uncertainty analysis were statistically analyzed, and the overall uncertainty range was from 4.08% to 4.89%. The averaged overall uncertainty of the cross-radiometric calibration in the blue, green, red, and near-infrared bands of GF-6/WFV was calculated to be 4.64%, 4.42%, 4.43%, and 4.16%, respectively. Additionally, the study explored the impact of cross-calibration uncertainty on the precision of quantitative applications of GF-6/WFV images on surface reflectance retrieval. The findings revealed that the radiometric calibration uncertainty resulted in a deviation of approximately 0.0119, 0.0123, 0.0136, and 0.0137 in the inversion of surface reflectance in the blue, green, red, and near-infrared bands of GF-6/WFV, respectively. Consequently, improving the outcomes of radiometric calibration and enhancing the precision of on-orbit radiometric calibration is important for the quantitative application of remote sensing images.
4.4. Trend Analysis of Radiometric Performance
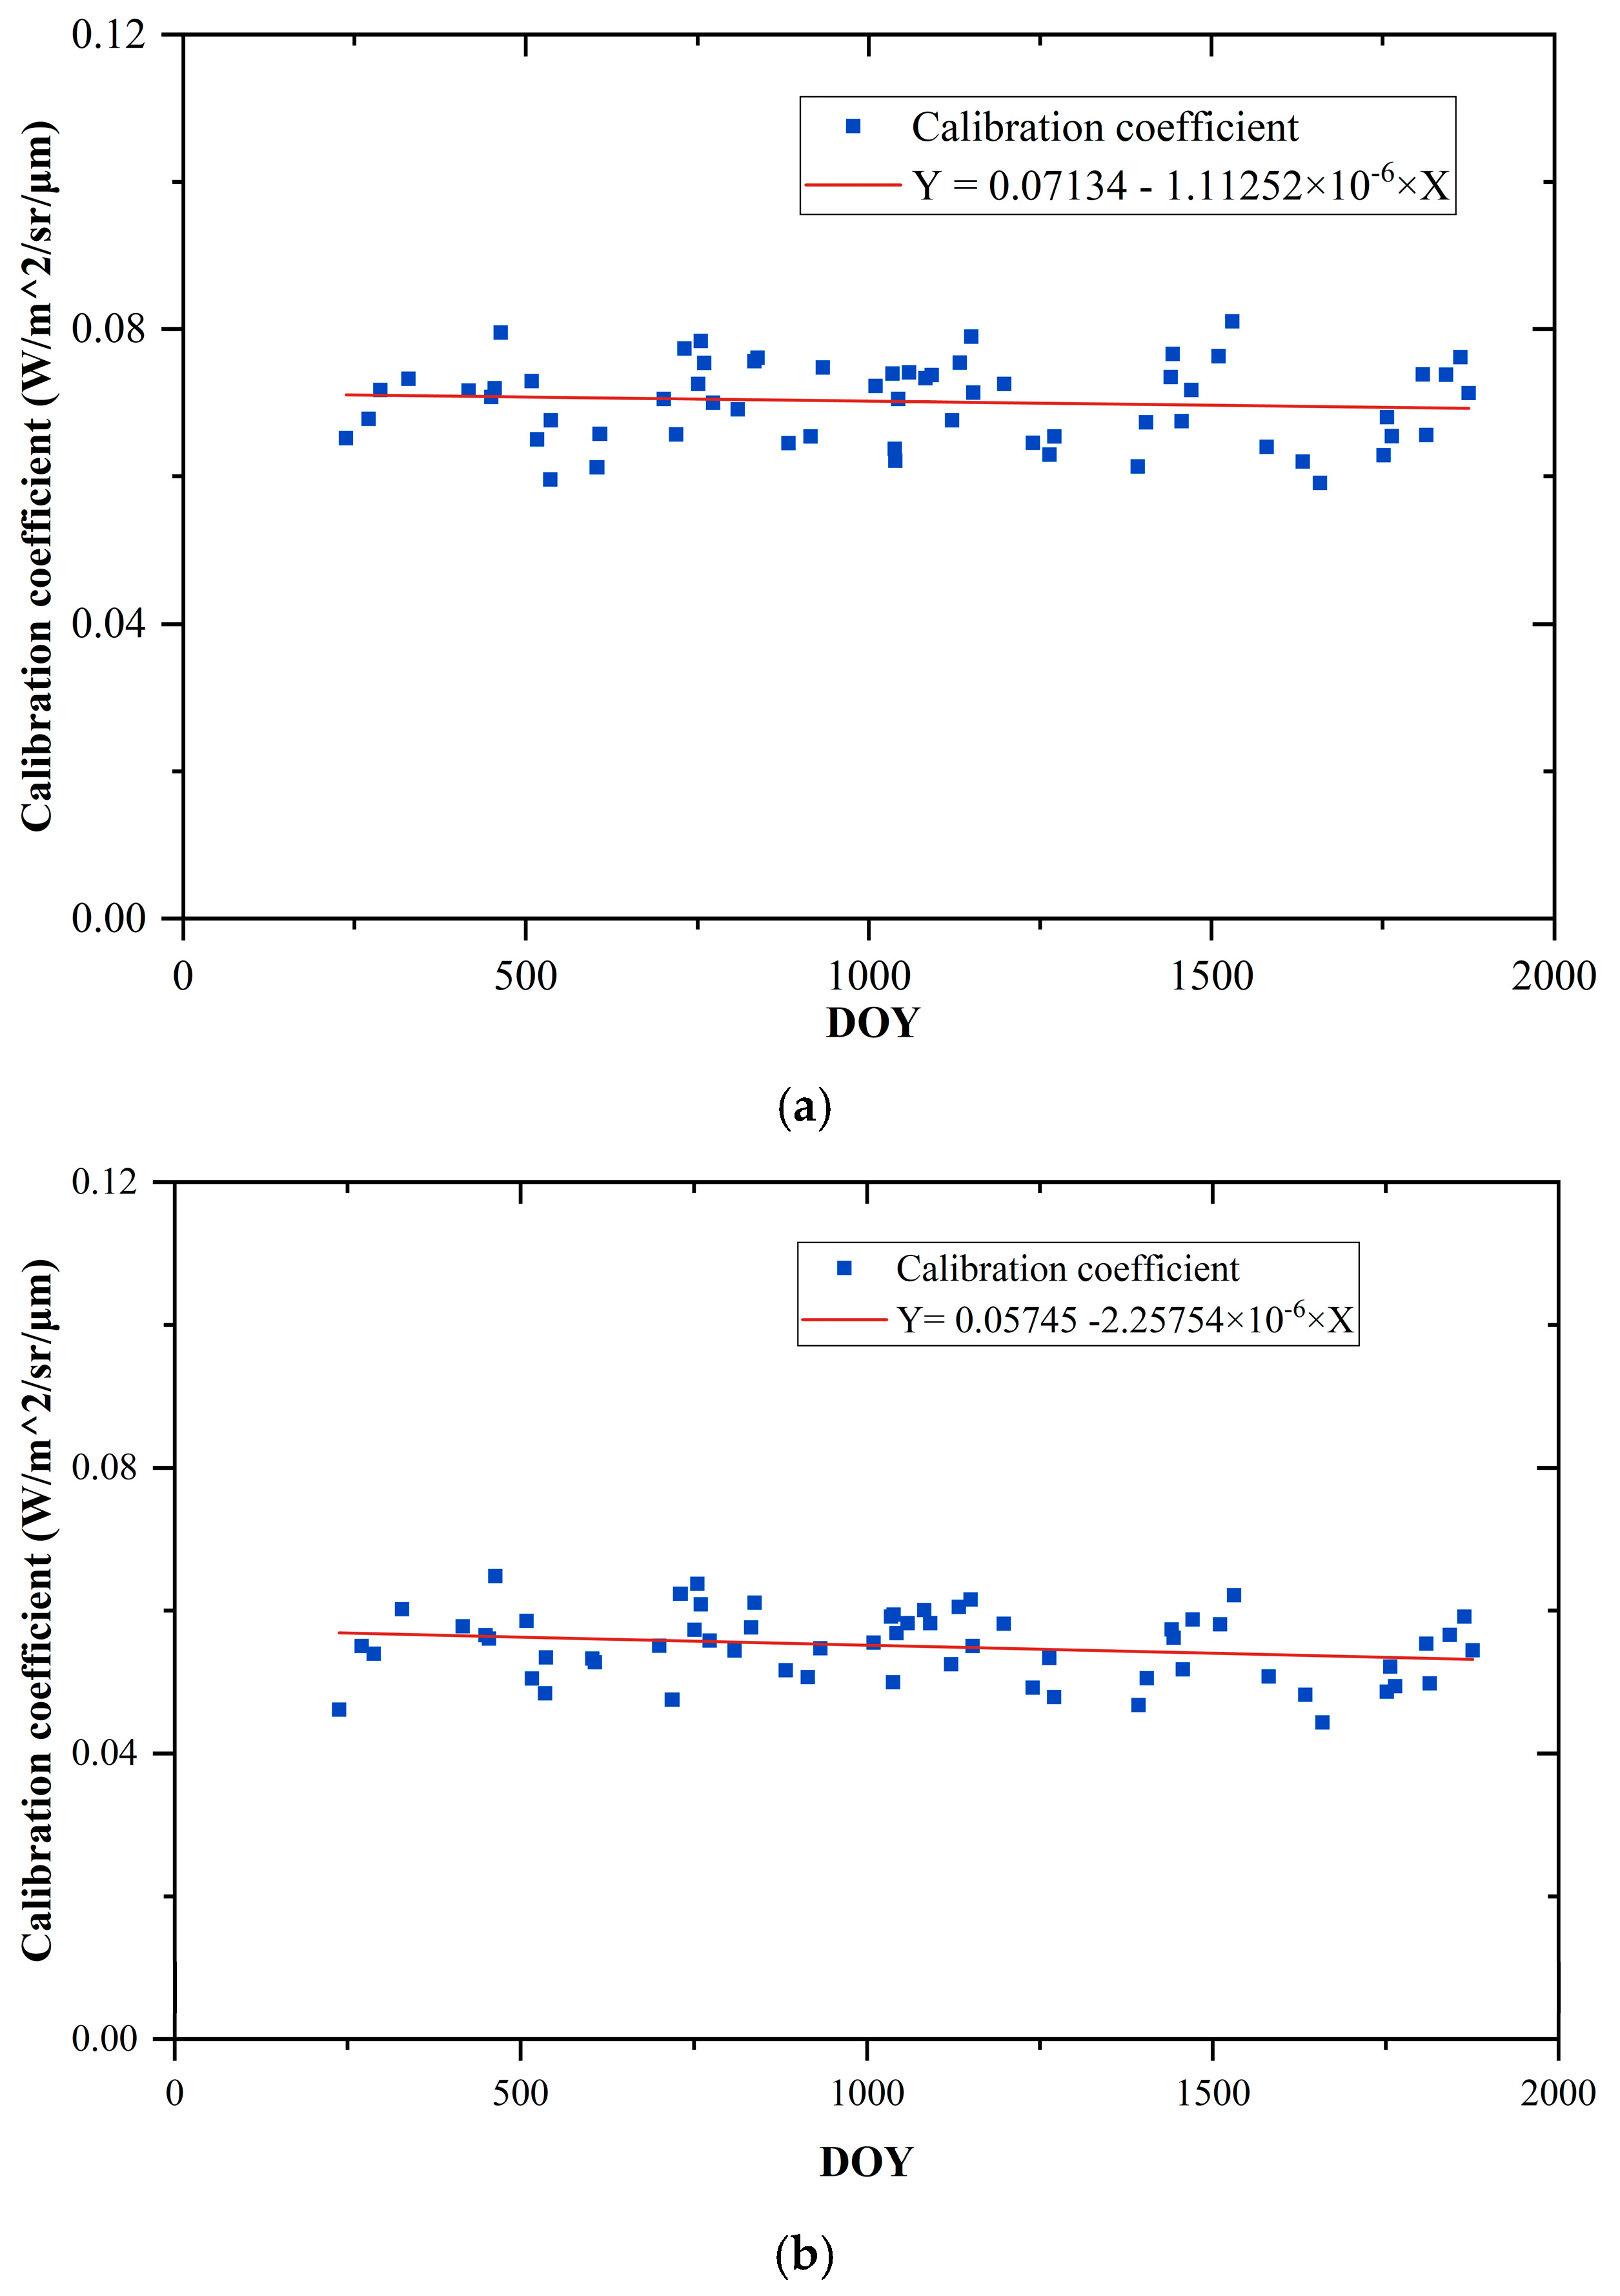
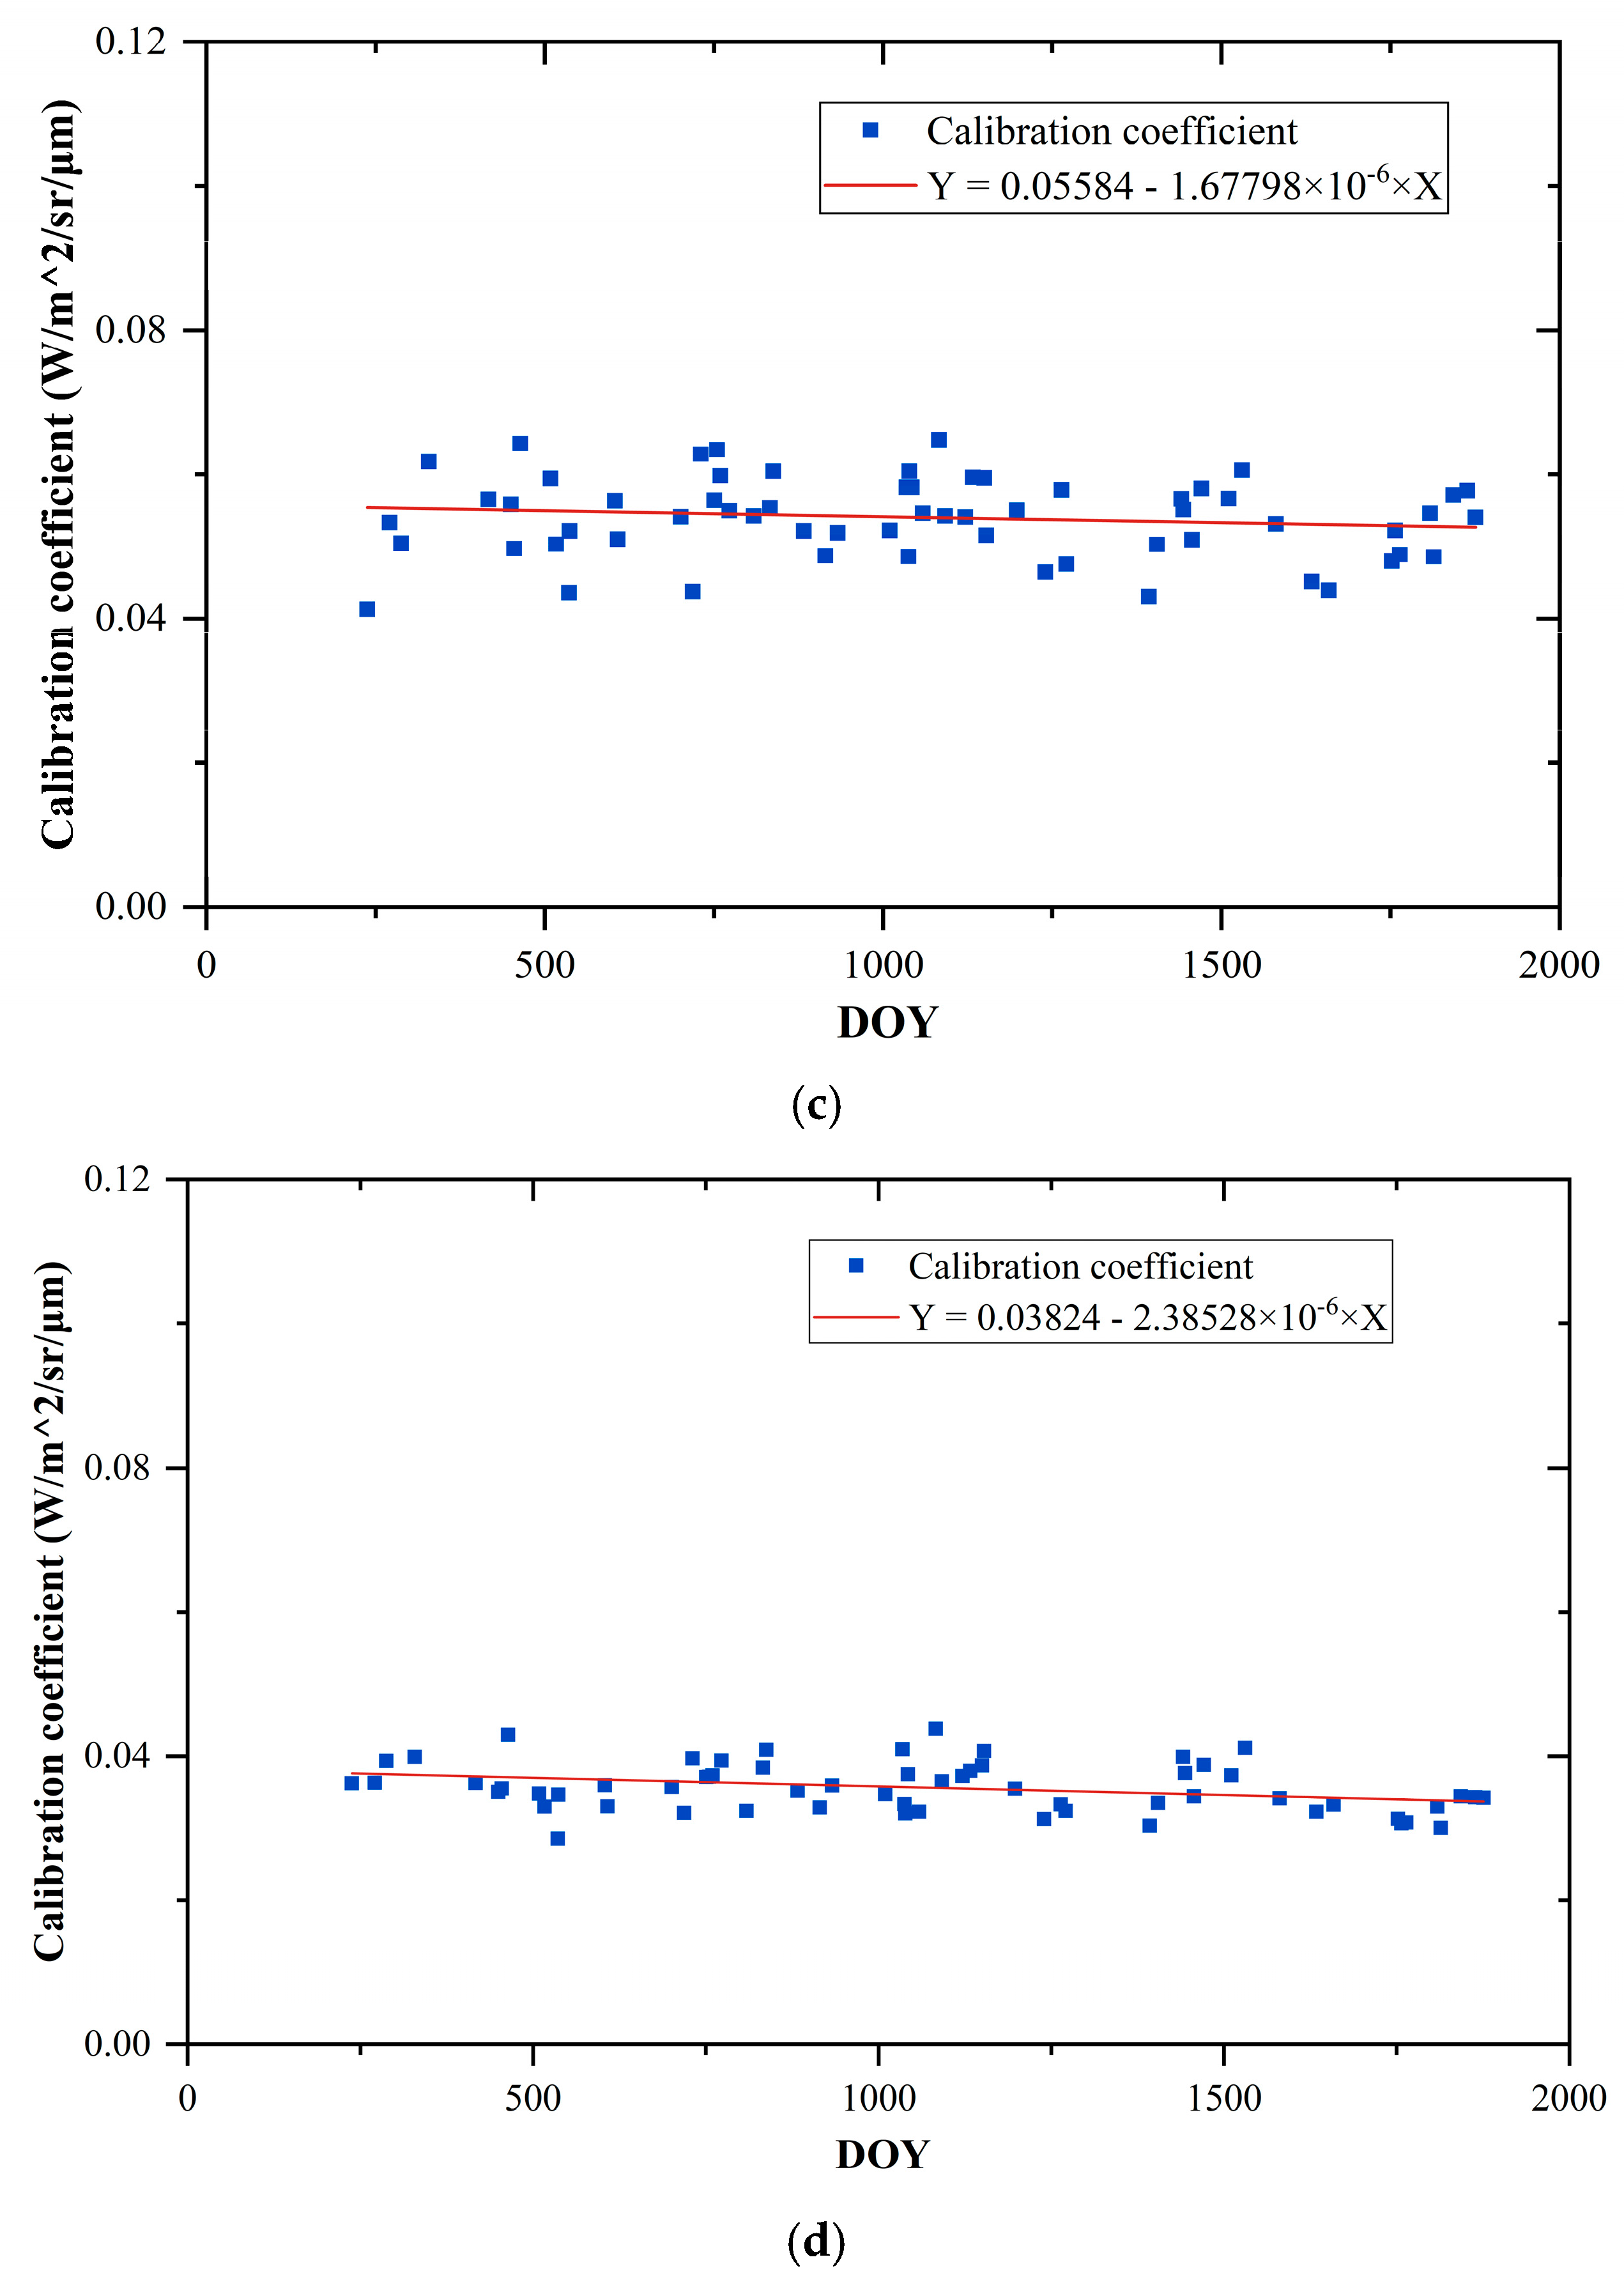
Following the boxplot statistical analysis, the time-series calibration coefficients for GF-6/WFV were refined through outlier removal. Subsequently, the trends illustrating the gradual decline in radiometric performance were analyzed. These coefficients were linearly correlated with the DOY, as shown in Figure 15. Trend decay models for the blue, green, red, and near-infrared bands were then formulated and detailed in Table 6. Observation of Figure 15 reveals a slow degradation in radiometric performance across all four bands over time. For a more detailed quantitative analysis, the annual decay rate was employed to evaluate the degradation in radiometric performance of GF-6/WFV, and the formula was calculated as follows [30]:
where is the total decay rate during the period of radiometric calibration time, is the trend decay models listed in Table 6, and and are the first day and last days in the time series, respectively. Based on these models, the annual decay rates for each band of GF-6/WFV were determined to be 0.57%, 1.45%, 1.11%, and 2.31%. These findings indicate that the annual degradation of GF-6/WFV was relatively modest over the period from January 2019 to 2023. Moreover, Figure 15 shows only slight variations in the degradation trend of the calibration coefficients when aligned with DOY changes.
An analysis of the impact of radiometric performance degradation on the quantitative application of GF-6/WFV data was also undertaken, with a specific focus on the inversion of surface reflectance. This analysis compared the inversion results of surface reflectance before and after the decay. The decay in sensor radiometric performance resulted in annual variations of approximately 0.0073, 0.0080, 0.0084, and 0.0083 in the inversion of surface reflectance in the visible and near-infrared bands of GF-6/WFV. These variations have implications for the accuracy of vegetation indices derived from reflectance data. Supporting this observation, research by Zhang et al. demonstrated that a majority of the vegetation browning trends identified using MODIS Terra-C5 vegetation indices (vIs) were likely due to sensor degradation [7]. Therefore, the radiometric performance of GF-6/WFV during on-orbit operations inevitably introduces errors in surface reflectivity measurements, affecting the accuracy of calculations for commonly used indices. This underscores the necessity for ongoing, long-term calibration of GF-6/WFV to monitor and address potential sensor degradation effectively.
5. Conclusions
The GF-6 satellite, equipped with a WFV sensor, offers high spatial resolution and swath width capabilities. However, the full potential of GF-6/WFV images for quantitative applications necessitates consistent, long-term on-orbit radiometric calibration. Given the lack of on-board calibration equipment, post-launch on-orbit calibration techniques, such as vicarious and cross-radiometric calibration methodologies, emerge as primary strategies for ensuring the sensor’s radiometric calibration accuracy and performance monitoring post-launch. Traditionally, the absolute radiometric calibration of GF-6/WFV relies primarily on annual field calibrations conducted at the Dunhuang calibration site by CRESDA from July to September. This approach, however, poses limitations for continuous sensor performance assessment over its operational lifespan.
In response, this study introduced a method for time-series cross-radiometric calibration of GF-6/WFV, leveraging Sentinel-2/MSI as a reference at RadCalNet sites. Through this methodology, 62 on-orbit radiometric calibrations of GF-6/WFV were executed. The calibration process meticulously accounted for differences in spectral response, geometric angles, and atmospheric conditions between the GF-6/WFV and Sentinel-2/MSI sensors. Subsequent boxplot statistical analysis of the calibration coefficients facilitated the identification and exclusion of outliers, enabling an evaluation of the radiometric performance degradation trends of GF-6/WFV. This analysis revealed an annual degradation rate in radiometric performance ranging from 0.57% to 2.31% since the satellite’s launch. The implications of this degradation for quantitative applications, exemplified through surface reflectance retrieval, indicated an impact on the visible and near-infrared bands of GF-6/WFV, with deviations of approximately 0.0073, 0.0080, 0.0084, and 0.0083. Hence, the calibration desired by GF-6/WFV requires consistent long-time-series calibration throughout the entire mission lifetime.
Further validation of this study’s outcomes involved a comparison with RadCalNet radiometric products, yielding average absolute relative errors between cross-radiometric and RadCalNet TOA radiance values from 3.55% to 4.64%. Cross-validation employing high-precision on-orbit sensors such as Landsat-8/OLI and MODIS confirmed the reliability of our calibration results, with relative differences in sensor bands 1 to 4 staying under 5%. Additionally, the overall uncertainty of the cross-radiometric calibration ranged from 4.08% to 4.89%, introducing a bias in surface reflectance retrieval within the range of 0.011 to 0.014. Collectively, our findings highlight the operational efficacy and reliability of the proposed method for achieving long-term time-series on-orbit radiometric calibration of GF-6/WFV. The study corroborates the sensor’s relative stability and suitability for extended quantitative applications, particularly for long-term environmental monitoring tasks.
Author Contributions
Y.W. and Y.L. contributed to the research idea and analysis; W.Z. and H.W. contributed to the validation and paper revision; J.Z. and R.W. contributed to the data processing; Z.X. and Q.H. contributed to suggestions on data analysis; Y.W. and Y.L. wrote the paper. All authors have read and agreed to the published version of the manuscript.
Funding
The work was supported by the National Key R&D Program of China under grants 2022YFB3903000, 2022YFB3903004, and 2022YFB390300404; by the Youth Innovation Promotion Association CAS under grant 2021118; and by the National Natural Science Foundation of China under grant 42371376.
Data Availability Statement
The original contributions presented in the study are included in the article, further inquiries can be directed to the corresponding author.
Acknowledgments
The authors would like to thank the European Space Agency for providing Sentinel-2/MSI satellite data. Thanks are also given to the anonymous reviewers.
Conflicts of Interest
The authors declare no conflicts of interest.
References
- Czapla-Myers, J.S.; Thome, K.J.; Cocilovo, B.R.; McCorkel, J.T.; Buchanan, J.H. Temporal, spectral, and spatial study of the automated vicarious calibration test site at Railroad Valley, Nevada. In Proceedings of the Earth Observing Systems XIII, San Diego, CA, USA, 20 August 2008. [Google Scholar]
- Barsi, J.A.; Alhammoud, B.; Czapla-Myers, J.; Gascon, F.; Haque, M.O.; Kaewmanee, M.; Leigh, L.; Markham, B.L. Sentinel-2A MSI and Landsat-8 OLI radiometric cross comparison over desert sites. Eur. J. Remote Sens. 2018, 51, 822–837. [Google Scholar] [CrossRef]
- Thome, K.J.; Biggar, S.F.; Wisniewski, W.; Sensing, R. Cross comparison of EO-1 sensors and other Earth resources sensors to Landsat-7 ETM+ using Railroad Valley Playa. IEEE Trans. Geosci. Remote Sens. 2003, 41, 1180–1188. [Google Scholar] [CrossRef]
- Dong, J.; Chen, Y.; Chen, X.; Xu, Q. Radiometric Cross-Calibration of Wide-Field-of-View Cameras Based on Gaofen-1/6 Satellite Synergistic Observations Using Landsat-8 Operational Land Imager Images: A Solution for Off-Nadir Wide-Field-of-View Associated Problems. Remote Sens. 2023, 15, 3851. [Google Scholar] [CrossRef]
- Jiang, Y.; Shi, Y.; Li, L.; Xu, M.; Zeng, W.; Jiang, Y.; Li, Z. On-Orbit Radiance Calibration of Nighttime Sensor of LuoJia1-01 Satellite Based on Lunar Observations. Remote Sens. 2019, 11, 2183. [Google Scholar] [CrossRef]
- Franks, S.; Neigh, C.S.; Campbell, P.K.; Sun, G.; Yao, T.; Zhang, Q.; Huemmrich, K.F.; Middleton, E.M.; Ungar, S.G.; Frye, S.W. EO-1 data quality and sensor stability with changing orbital precession at the end of a 16 year mission. Remote Sens. 2017, 9, 412. [Google Scholar] [CrossRef] [PubMed]
- Zhang, Y.; Song, C.; Band, L.E.; Sun, G.; Li, J. Reanalysis of global terrestrial vegetation trends from MODIS products: Browning or greening? Remote Sens. Environ. 2017, 191, 145–155. [Google Scholar] [CrossRef]
- Lin, T.-H.; Chang, J.-C.; Hsu, K.-H.; Lee, Y.-S.; Zeng, S.-K.; Liu, G.-R.; Tsai, F.-A.; Chan, H.-P. Radiometric variations of On-Orbit FORMOSAT-5 RSI from vicarious and cross-calibration measurements. Remote Sens. 2019, 11, 2634. [Google Scholar] [CrossRef]
- Xiong, X.; Chiang, K.; Esposito, J.; Guenther, B.; Barnes, W. MODIS on-orbit calibration and characterization. Metrologia 2003, 40, S89. [Google Scholar] [CrossRef]
- McCorkel, J.; Thome, K.; Ong, L.; Sensing, R. Vicarious calibration of EO-1 Hyperion. IEEE J. Sel. Top. Appl. Earth Obs. Remote Sens. 2012, 6, 400–407. [Google Scholar] [CrossRef]
- Slater, P.N.; Biggar, S.F.; Thome, K.J.; Gellman, D.I.; Spyak, P.R.; Technology, O. Vicarious radiometric calibrations of EOS sensors. J. Atmos. Ocean. Technol. 1996, 13, 349–359. [Google Scholar] [CrossRef]
- Chander, G.; Mishra, N.; Helder, D.L.; Aaron, D.B.; Angal, A.; Choi, T.; Xiong, X.; Doelling, D.R.; Sensing, R. Applications of spectral band adjustment factors (SBAF) for cross-calibration. IEEE Trans. Geosci. Remote Sens. 2012, 51, 1267–1281. [Google Scholar] [CrossRef]
- Jing, X.; Leigh, L.; Helder, D.; Pinto, C.T.; Aaron, D. Lifetime absolute calibration of the EO-1 Hyperion sensor and its validation. IEEE Trans. Geosci. Remote Sens. 2019, 57, 9466–9475. [Google Scholar] [CrossRef]
- Tang, H.; Xiao, C.; Shang, K.; Wu, T.; Li, Q. Radiometric Calibration of GF5-02 Advanced Hyperspectral Imager Based on RadCalNet Baotou Site. Remote Sens. 2023, 15, 2233. [Google Scholar] [CrossRef]
- Teillet, P.; Slater, P.; Ding, Y.; Santer, R.; Jackson, R.; Moran, M. Three methods for the absolute calibration of the NOAA AVHRR sensors in-flight. Remote Sens. Environ. 1990, 31, 105–120. [Google Scholar] [CrossRef]
- Liu, L.; Shi, T.; Gao, H.; Zhang, X.; Han, Q.; Hu, X. Long-term cross calibration of HJ-1A CCD1 and Terra MODIS reflective solar bands. Sci. Rep. 2021, 11, 7386. [Google Scholar] [CrossRef] [PubMed]
- Yang, A.; Zhong, B.; Hu, L.; Wu, S.; Xu, Z.; Wu, H.; Wu, J.; Gong, X.; Wang, H.; Liu, Q. Radiometric Cross-Calibration of the Wide Field View Camera Onboard GaoFen-6 in Multispectral Bands. Remote Sens. 2020, 12, 1037. [Google Scholar] [CrossRef]
- Bouvet, M.; Thome, K.; Berthelot, B.; Bialek, A.; Czapla-Myers, J.; Fox, N.P.; Goryl, P.; Henry, P.; Ma, L.; Marcq, S. RadCalNet: A radiometric calibration network for Earth observing imagers operating in the visible to shortwave infrared spectral range. Remote Sens. 2019, 11, 2401. [Google Scholar] [CrossRef]
- Marcq, S.; Meygret, A.; Bouvet, M.; Fox, N.; Greenwell, C.; Scott, B.; Berthelot, B.; Besson, B.; Guilleminot, N.; Damiri, B. New RadCalNet site at Gobabeb, Namibia: Installation of the instrumentation and first satellite calibration results. In Proceedings of the IGARSS 2018-2018 IEEE International Geoscience and Remote Sensing Symposium, Valencia, Spain, 22–27 July 2018. [Google Scholar]
- Han, J.; Tao, Z.; Xie, Y.; Li, H.; Yi, H.; Guan, X. Validation of the TOA Products of the Baotou Sandy Site With Landsat8/OLI Considering BRDF Correction. IEEE Trans. Geosci. Remote Sens. 2023, 61, 1–11. [Google Scholar] [CrossRef]
- Spoto, F.; Sy, O.; Laberinti, P.; Martimort, P.; Fernandez, V.; Colin, O.; Hoersch, B.; Meygret, A. Overview of sentinel-2. In Proceedings of the 2012 IEEE International Geoscience and Remote Sensing Symposium, Munich, Germany, 22–27 July 2012; pp. 1707–1710. [Google Scholar]
- Rubin, J.I.; Reid, J.S.; Xian, P.; Selman, C.M.; Eck, T.F. A global evaluation of daily to seasonal aerosol and water vapor relationships using a combination of AERONET and NAAPS reanalysis data. Atmos. Chem. 2023, 23, 4059–4090. [Google Scholar] [CrossRef]
- Chander, G.; Meyer, D.J.; Helder, D.L.; Sensing, R. Cross calibration of the Landsat-7 ETM+ and EO-1 ALI sensor. IEEE Trans. Geosci. 2004, 42, 2821–2831. [Google Scholar] [CrossRef]
- Wang, Z.; Xiao, P.; Gu, X.; Feng, X.; Li, X.; Gao, H.; Li, H.; Lin, J.; Zhang, X. Uncertainty analysis of cross-calibration for HJ-1 CCD camera. Sci. China Technol. Sci. 2013, 56, 713–723. [Google Scholar] [CrossRef]
- Qiao, E.; Ma, C.; Zhang, H.; Cui, Z.; Zhang, C. Evaluation of Temporal Stability in Radiometric Calibration Network Sites Using Multi-Source Satellite Data and Continuous In Situ Measurements. Remote Sens. 2023, 15, 2639. [Google Scholar] [CrossRef]
- Berk, A.; Anderson, G.; Acharya, P.; Shettle, E. MODTRAN® 5.2.1 User’s Manual; Spectral Sciences Inc.: Burlington, MA, USA, 2011. [Google Scholar]
- Gascon, F.; Bouzinac, C.; Thépaut, O.; Jung, M.; Francesconi, B.; Louis, J.; Lonjou, V.; Lafrance, B.; Massera, S.; Gaudel-Vacaresse, A. Copernicus Sentinel-2A calibration and products validation status. Remote Sens. 2017, 9, 584. [Google Scholar] [CrossRef]
- Thuillier, G.; Hersé, M.; Labs, D.; Foujols, T.; Peetermans, W.; Gillotay, D.; Simon, P.; Mandel, H. The solar spectral irradiance from 200 to 2400 nm as measured by the SOLSPEC spectrometer from the ATLAS and EURECA missions. Sol. Phys. 2003, 214, 1–22. [Google Scholar] [CrossRef]
- Sinyuk, A.; Holben, B.N.; Smirnov, A.; Eck, T.F.; Slutsker, I.; Schafer, J.S.; Giles, D.M.; Sorokin, M. Assessment of error in aerosol optical depth measured by AERONET due to aerosol forward scattering. Geophys. Res. Lett. 2012, 39. [Google Scholar] [CrossRef]
- Zhong, B.; Ma, Y.; Yang, A.; Wu, J. Radiometric performance evaluation of FY-4A/AGRI based on Aqua/MODIS. Sensors 2021, 21, 1859. [Google Scholar] [CrossRef]
Figure 1.
True-color composite image of GF-6/WFV over the Gobabeb site on 4 April 2021 with the red box indicated the location of the Gobabeb site’s core region.
Figure 1.
True-color composite image of GF-6/WFV over the Gobabeb site on 4 April 2021 with the red box indicated the location of the Gobabeb site’s core region.

Figure 2.
True-color composite image of GF-6/WFV over the La Crau site on 24 April 2021 with the red box indicated the location of the La Crau site’s core region.
Figure 2.
True-color composite image of GF-6/WFV over the La Crau site on 24 April 2021 with the red box indicated the location of the La Crau site’s core region.

Figure 3.
True-color composite image of GF-6/WFV over the RVP site on 3 April 2021 with the red box indicated the location of the RVP site’s core region.
Figure 3.
True-color composite image of GF-6/WFV over the RVP site on 3 April 2021 with the red box indicated the location of the RVP site’s core region.

Figure 4.
True-color composite image of GF-6/WFV over the Baotou site on 10 September 2020 with the red box indicated the location of the Baotou Sandy site.
Figure 4.
True-color composite image of GF-6/WFV over the Baotou site on 10 September 2020 with the red box indicated the location of the Baotou Sandy site.

Figure 5.
Spectral response functions for matched bands of Gf-6/WFV and Sentinel-2/MSI.

Figure 6.
Viewing geometries of Sentinel-2/MSI and GF-6/WFV: (a) viewing zenith angles of Sentinel-2/MSI, (b) viewing zenith angles of GF-6/WFV, (c) relative azimuth angles of GF-6/WFV, and (d) relative azimuth angles of Sentinel-2/MSI.
Figure 6.
Viewing geometries of Sentinel-2/MSI and GF-6/WFV: (a) viewing zenith angles of Sentinel-2/MSI, (b) viewing zenith angles of GF-6/WFV, (c) relative azimuth angles of GF-6/WFV, and (d) relative azimuth angles of Sentinel-2/MSI.


Figure 7.
The aerosol optical thickness at 550 nm and columnar water vapor at the time of the GF-6 satellite overpassing RadCalNet sites.
Figure 7.
The aerosol optical thickness at 550 nm and columnar water vapor at the time of the GF-6 satellite overpassing RadCalNet sites.

Figure 8.
Flowchart of the time-series cross-radiometric calibration and validation of GF-6/WFV at RadCalNet sites.
Figure 8.
Flowchart of the time-series cross-radiometric calibration and validation of GF-6/WFV at RadCalNet sites.

Figure 9.
Gains of the SBAFs between GF-6/WFV and Sentinel-2/MSI (a) in the blue band, (b) in the green band, (c) in the red band, (d) and in the near-infrared band.
Figure 9.
Gains of the SBAFs between GF-6/WFV and Sentinel-2/MSI (a) in the blue band, (b) in the green band, (c) in the red band, (d) and in the near-infrared band.


Figure 10.
Time-series radiometric cross-calibration coefficients of GF-6/WFV (a) in the blue band, (b) in the green band, (c) in the red band, (d) and in the near-infrared band.
Figure 10.
Time-series radiometric cross-calibration coefficients of GF-6/WFV (a) in the blue band, (b) in the green band, (c) in the red band, (d) and in the near-infrared band.


Figure 11.
Boxplot analysis of the time-series cross-radiometric calibration coefficients of GF-6/WFV.
Figure 11.
Boxplot analysis of the time-series cross-radiometric calibration coefficients of GF-6/WFV.

Figure 12.
Validation of GF-6/WFV time-series calibration results with RadCalNet datasets.

Figure 13.
Cross-validation of GF-6/WFV time-series calibration results with Landsat-8/OLI datasets.
Figure 13.
Cross-validation of GF-6/WFV time-series calibration results with Landsat-8/OLI datasets.

Figure 14.
Cross-validation of GF-6/WFV time-series calibration results with MODIS datasets.

Figure 15.
Trend analysis of the radiometric performance of GF-6/WFV (a) in the blue band, (b) in the green band, (c) in the red band, (d) and in the near-infrared band.
Figure 15.
Trend analysis of the radiometric performance of GF-6/WFV (a) in the blue band, (b) in the green band, (c) in the red band, (d) and in the near-infrared band.


Table 1.
Sensor characteristics of GF-6/WFV, Sentinel-2A/MSI, and Sentinel-2B/MSI in selected bands.
Table 1.
Sensor characteristics of GF-6/WFV, Sentinel-2A/MSI, and Sentinel-2B/MSI in selected bands.
| Sensor | Band No. | Spectral Band | Spectral Range (nm) | Spatial Resolution (m) |
|---|---|---|---|---|
| GF-6/WFV | 1 | Blue | 450–520 | 16 |
| 2 | Green | 520–590 | ||
| 3 | Red | 630–690 | ||
| 4 | Near-infrared | 770–890 | ||
| Sentinel-2A/MSI | 2 | Blue | 440–538 | 10 |
| 3 | Green | 538–582 | ||
| 4 | Red | 646–684 | ||
| 8 | Near-infrared | 760–980 | ||
| Sentinel-2B/MSI | 2 | Blue | 438–532 | 10 |
| 3 | Green | 536–582 | ||
| 4 | Red | 646–685 | ||
| 8 | Near-infrared | 774–907 |
Table 2.
Uncertainty of the cross-radiometric calibration of GF-6/WFV at the Gobabeb site.
| Band | Image Co-Registration | MODTRAN-5 | Sentinel-2/MSI | Spectral Matching Factor | Solar Irradiance | AOT at 550 nm | CWV | Overall Uncertainty |
|---|---|---|---|---|---|---|---|---|
| Blue | 0.55% | 2.00% | 3.00% | 2.31% | 1.5% | 0.42% | 0.31% | 4.60% |
| Green | 0.29% | 2.00% | 3.00% | 2.00% | 1.5% | 0.35% | 0.27% | 4.42% |
| Red | 0.73% | 2.00% | 3.00% | 2.52% | 1.5% | 0.02% | 0.3% | 4.71% |
| NIR | 0.43% | 2.00% | 3.00% | 1.31% | 1.5% | 0.13% | 0.35% | 4.15% |
Table 3.
Uncertainty of the cross-radiometric calibration of GF-6/WFV at the La Crau site.
| Band | Image Co-Registration | MODTRAN-5 | Sentinel-2/MSI | Spectral Matching Factor | Solar Irradiance | AOT at 550 nm | CWV | Overall Uncertainty |
|---|---|---|---|---|---|---|---|---|
| Blue | 0.34% | 2.00% | 3.00% | 2.53% | 1.5% | 0.42% | 0.04% | 4.68% |
| Green | 0.50% | 2.00% | 3.00% | 2.43% | 1.5% | 0.30% | 0.03% | 4.63% |
| Red | 0.79% | 2.00% | 3.00% | 2.21% | 1.5% | 0.03% | 0.02% | 4.55% |
| NIR | 0.45% | 2.00% | 3.00% | 1.51% | 1.5% | 0.18% | 0.32% | 4.22% |
Table 4.
Uncertainty of the cross-radiometric calibration of GF-6/WFV at the RVP site.
| Band | Image Co-Registration | MODTRAN-5 | Sentinel-2/MSI | Spectral Matching Factor | Solar Irradiance | AOT at 550 nm | CWV | Overall Uncertainty |
|---|---|---|---|---|---|---|---|---|
| Blue | 0.04% | 2.00% | 3.00% | 2.94% | 1.5% | 0.06% | 0.03% | 4.89% |
| Green | 0.24% | 2.00% | 3.00% | 2.31% | 1.5% | 0.03% | 0.01% | 4.54% |
| Red | 0.12% | 2.00% | 3.00% | 1.80% | 1.5% | 0.01% | 0.00% | 4.30% |
| NIR | 0.37% | 2.00% | 3.00% | 1.07% | 1.5% | 0.08% | 0.3% | 4.08% |
Table 5.
Uncertainty of the cross-radiometric calibration of GF-6/WFV at the Baotou site.
| Band | Image Co-Registration | MODTRAN-5 | Sentinel-2/MSI | Spectral Matching Factor | Solar Irradiance | AOT at 550 nm | CWV | Overall Uncertainty |
|---|---|---|---|---|---|---|---|---|
| Blue | 0.71% | 2.00% | 3.00% | 1.84% | 1.5% | 0.18% | 0.00% | 4.37% |
| Green | 0.27% | 2.00% | 3.00% | 1.20% | 1.5% | 0.1% | 0.01% | 4.09% |
| Red | 0.48% | 2.00% | 3.00% | 1.37% | 1.5% | 0.03% | 0.00% | 4.17% |
| NIR | 0.21% | 2.00% | 3.00% | 1.49% | 1.5% | 0.13% | 0.03% | 4.19% |
Table 6.
The decay model of the radiometric performance of GF-6/WFV.
| Band | Decay Model |
|---|---|
| Blue | |
| Green | |
| Red | |
| NIR |
Disclaimer/Publisher’s Note: The statements, opinions and data contained in all publications are solely those of the individual author(s) and contributor(s) and not of MDPI and/or the editor(s). MDPI and/or the editor(s) disclaim responsibility for any injury to people or property resulting from any ideas, methods, instructions or products referred to in the content. |
© 2024 by the authors. Licensee MDPI, Basel, Switzerland. This article is an open access article distributed under the terms and conditions of the Creative Commons Attribution (CC BY) license (https://creativecommons.org/licenses/by/4.0/).
Share and Cite
MDPI and ACS Style
Wang, Y.; Liu, Y.; Zhao, W.; Zeng, J.; Wang, H.; Wang, R.; Xu, Z.; Han, Q. Time-Series Cross-Radiometric Calibration and Validation of GF-6/WFV Using Multi-Site. Remote Sens. 2024, 16, 1287. https://doi.org/10.3390/rs16071287
AMA Style
Wang Y, Liu Y, Zhao W, Zeng J, Wang H, Wang R, Xu Z, Han Q. Time-Series Cross-Radiometric Calibration and Validation of GF-6/WFV Using Multi-Site. Remote Sensing. 2024; 16(7):1287. https://doi.org/10.3390/rs16071287
Chicago/Turabian StyleWang, Yingxian, Yaokai Liu, Weiwei Zhao, Jian Zeng, Huixian Wang, Renfei Wang, Zhaopeng Xu, and Qijin Han. 2024. "Time-Series Cross-Radiometric Calibration and Validation of GF-6/WFV Using Multi-Site" Remote Sensing 16, no. 7: 1287. https://doi.org/10.3390/rs16071287
Note that from the first issue of 2016, this journal uses article numbers instead of page numbers. See further details here.