Article

Drone SAR Imaging for Monitoring an Active Landslide Adjacent to the M25 at Flint Hall Farm

by
Anthony Carpenter
1,*,
James A. Lawrence
1,
Philippa J. Mason
2,
Richard Ghail
3 and
Stewart Agar
1
1
Department of Civil and Environmental Engineering, Imperial College London, London SW7 2AZ, UK
2
Department of Earth Science and Engineering, Imperial College London, London SW7 2AZ, UK
3
Department of Earth Sciences, Royal Holloway University of London, Egham TW20 0EX, UK
*
Author to whom correspondence should be addressed.
Remote Sens. 2024, 16(20), 3874; https://doi.org/10.3390/rs16203874
Submission received: 11 September 2024 / Revised: 10 October 2024 / Accepted: 17 October 2024 / Published: 18 October 2024

Abstract

:
Flint Hall Farm in Godstone, Surrey, UK, is situated adjacent to the London Orbital Motorway, or M25, and contains several landslide systems which pose a significant geohazard risk to this critical infrastructure. The site has been routinely monitored by geotechnical engineers following a landslide that encroached onto the hard shoulder in December 2000; current in situ instrumentation includes inclinometers and piezoelectric sensors. Interferometric Synthetic Aperture Radar (InSAR) is an active remote sensing technique that can quantify millimetric rates of Earth surface and structural deformation, typically utilising satellite data, and is ideal for monitoring landslide movements. We have developed the hardware and software for an Unmanned Aerial Vehicle (UAV), or drone radar system, for improved operational flexibility and spatial–temporal resolutions in the InSAR data. The hardware payload includes an industrial-grade DJI drone, a high-performance Ettus Software Defined Radar (SDR), and custom Copper Clad Laminate (CCL) radar horn antennas. The software utilises Frequency Modulated Continuous Wave (FMCW) radar at 5.4 GHz for raw data collection and a Range Migration Algorithm (RMA) for focusing the data into a Single Look Complex (SLC) Synthetic Aperture Radar (SAR) image. We present the first SAR image acquired using the drone radar system at Flint Hall Farm, which provides an improved spatial resolution compared to satellite SAR. Discrete targets on the landslide slope, such as corner reflectors and the in situ instrumentation, are visible as bright pixels, with their size and positioning as expected; the surrounding grass and vegetation appear as natural speckles. Drone SAR imaging is an emerging field of research, given the necessary and recent technological advancements in drones and SDR processing power; as such, this is a novel achievement, with few authors demonstrating similar systems. Ongoing and future work includes repeat-pass SAR data collection and developing the InSAR processing chain for drone SAR data to provide meaningful deformation outputs for the landslides and other geotechnical hazards and infrastructure.

1. Introduction

Flint Hall Farm is located in Godstone, Surrey, UK, and is immediately adjacent to the London Orbital Motorway, or M25. The Gault Clay geology, high water table, and motorway cutting have produced several landslide systems which pose a significant geohazard risk to the road and its users. A previous slope failure that resulted in debris falling onto the road in December 2000 was the catalyst for ongoing monitoring of the site through in situ instrumentation [1].
Interferometric Synthetic Aperture Radar (InSAR) is an active remote sensing technique that developed from the 1990s with the proliferation of Radio Detection and Ranging (radar) satellites and their Synthetic Aperture Radar (SAR) data products. InSAR exploits the phase change between multiple SAR acquisitions of the target area to quantify earth surface and structural deformation to a millimetric scale [2]. InSAR has frequently been applied to the monitoring and prediction of slope geohazards, including landslides and landslips [3,4,5,6]. Using Sentinel-1 data, Carlà et al. [7] identified increasing trends of slope displacement at an open-pit mine, a natural rock slope, and a tailings dam embankment, which can inform early-warning prediction models. Liu et al. [8] used Envisat data and the Small BAseline Subset (SBAS) InSAR technique to identify two landslides in the Three Gorges region in China, with deformation rates up to 15 mm/yr, and seasonal landslide movements attributed to changes in the water level. InSAR has also been applied to the monitoring of road and motorway infrastructure exposed to landslides. Nefros et al. [9] utilised Persistent Scatterer Interferometry (PSI) and visual data to identify and monitor 235 new slow-moving landslides across the complex and mountainous road network of Crete, Greece. Yi et al. [10] used InSAR to identify 236 potential landslides along the Shanghai–Nyalam Road in China, including slow-sliding rockslides, debris flows and debris avalanches. These studies demonstrate the regional scale at which satellite InSAR may be applied whilst providing millimetric rates of surface deformation. The resultant landslide inventories may inform road maintenance and hazard mitigation procedures.
With technological advancements in Unmanned Aerial Vehicles (UAV) and Software Defined Radar (SDR), a new field of research has emerged with several authors developing drone radar and SAR systems [11,12,13,14,15,16,17,18], and one group of authors developing a drone InSAR system [19,20,21,22]; where drones are classified as small and lightweight UAVs. Drone radar deployment enables a lower observation altitude compared to satellites for an improved point density and spatial resolution; this is particularly useful for small or complex sites where multiple radar scatterers are located in close proximity. The drone may be deployed on a daily or sub-daily basis through rapid and customisable deployment for an improved temporal resolution and operational flexibility; this enables the creation of a detailed time-series to understand the impact of specific engineering or weather events on deformation in the InSAR data. Drone radar systems offer the potential to utilise higher frequency radar bands, such as within the K-band, since the atmospheric range and thus attenuation effect are both reduced [23]; these shorter wavelength signals are more sensitive to deformation for an improved detection capability. The use of SDR in drone radar allows the operator to change parameters such as the centre frequency, bandwidth and sampling rate on-the-fly, to optimise the system for penetration into different target materials. Lastly, drone radar may obtain a line-of-sight (LOS) vector from multiple directions, thus overcoming layover and shadowing effects found in satellite radar data for complex locations [13,14]. Drone InSAR should therefore provide a complimentary data source to satellite and ground-based methods, whilst providing improved spatial–temporal resolutions.
Li and Ling [11,12] developed an inexpensive pulsed SAR system for the DJI Phantom 2 drone. The total payload, which includes an ultra-wideband (UWB) P410 radar, Raspberry Pi, two 5-turn helix antennas and ancillaries weighs less than 0.3 kg, making it suitable for deployment on almost any size of drone. The range profiles of generated SAR images show good validation results against trihedral corner reflectors and other targets, despite the authors highlighting potential issues of turbulence sensitivity, drone flight instability, and nearfield antenna effects. Deguchi et al. [13,14,15] developed a Ku-band Frequency Modulated Continuous Wave (FMCW) SAR system for the DJI Matrice 600 Pro drone for slope stability and aging infrastructure management. Their low-weight and small form factor payload design includes two 48 × 68 mm aperture horn antennas with a 15 dBi gain. Verification of the SAR processing using corner reflectors shows good azimuth compression, with ongoing work to further improve this and develop drone differential InSAR (DInSAR). Moreira et al. developed a multi-band (P-, L- and C- bands) [19] and a P-band [20] single-pass drone InSAR system. Whilst multi-pass InSAR provides surface deformation data over time, single-pass InSAR utilises the physical separation of two antennas to compare two or more echoes of the target displaced in the along-track direction; this is useful for determining any distortions due to topography, and thus inform the creation of Digital Elevation Models (DEM). Finally, Oré et al. [21] and Luebeck et al. [22] utilise the same hardware as Moreira et al. [19,20] to demonstrate short-term, multi-pass drone InSAR; the former for crop growth monitoring and the latter for ground surface deformation monitoring. These investigations, however, have a limited temporal range and separation of input data, which reduces potential spatial–temporal decorrelation effects, such as the atmospheric contribution, that are commonly associated with long-term InSAR processing.
Long-term, multi-temporal, multi-pass drone InSAR is still yet to be demonstrated in the literature and is the motivation for ongoing research at Imperial College London. The long-term goal of this research is the downscaling of InSAR from satellites to drones, to provide long-term InSAR monitoring for natural hazards, geotechnical engineering and ageing infrastructure. The ongoing research and development is divided into four main stages:
  • Hardware development for a drone radar system.
  • Software development for SAR imaging from the drone radar system.
  • Fieldwork for repeat-pass SAR data collection.
  • Software development for InSAR.
Regarding the first two points, we have developed the hardware and software for a drone radar system utilising the DJI Matrice 600 Pro. The hardware includes a novel invention of radar horn antennas that are the first to be fabricated from Copper Clad Laminate (CCL) [24]. The CCL provides a lightweight and rigid dielectric substrate, where the internal surfaces are coated with a smooth 35 μm thick copper layer to provide a boundary for the electromagnetic field. CCL is deemed preferable to copper sheets for achieving a lightweight component for drone deployment. The software includes a custom FMCW radar flowgraph built in the open-source GNU Radio Companion (GRC) and a Range Migration Algorithm (RMA) for SAR focusing.
The purpose of this case study at Flint Hall Farm is to demonstrate the functionality of the developed drone radar system in acquiring SAR imagery that will be used in downstream InSAR processing for deformation monitoring of the landslide at Flint Hall Farm and other geotechnical hazards and infrastructure. The SAR image presented here is a novel achievement in a newly developing field of InSAR remote sensing. It is the first image made using the CCL antennas, which are themselves a novel invention, and it provides an improved spatial resolution compared to satellite SAR for feature identification. This study also demonstrates the use of corner reflectors as targets in landslide monitoring in rural locations. Ongoing and future work addresses points three and four, which includes repeat-pass SAR data collection and developing the InSAR processing chain for drone SAR data to provide meaningful deformation outputs for the landslide at Flint Hall Farm and other geotechnical hazards and infrastructure. A discussion of the adapted InSAR processing chain for drone SAR data is provided in Section 5.

2. Study Area

Flint Hall Farm is situated immediately east of the M25 Junction 6 in Godstone, Surrey, UK (grid reference TQ3652) (Figure 1). The south-facing slope was cut between 1976 and 1979 for the construction of the M25, with road overbridges at the east and west of the site. The resultant slope has angles between 5° and 16°, with a maximum height of 25 m [1,25]. Figure 2 presents a 1 m Light Detection and Ranging (LiDAR) Digital Terrain Model (DTM). The closely spaced elevation contour lines show that the site is situated in an area of steep elevation change. The approximately 900 × 130 m site has a sloping, uneven and hummocky ground surface, and it is currently utilised as pasture for cattle.
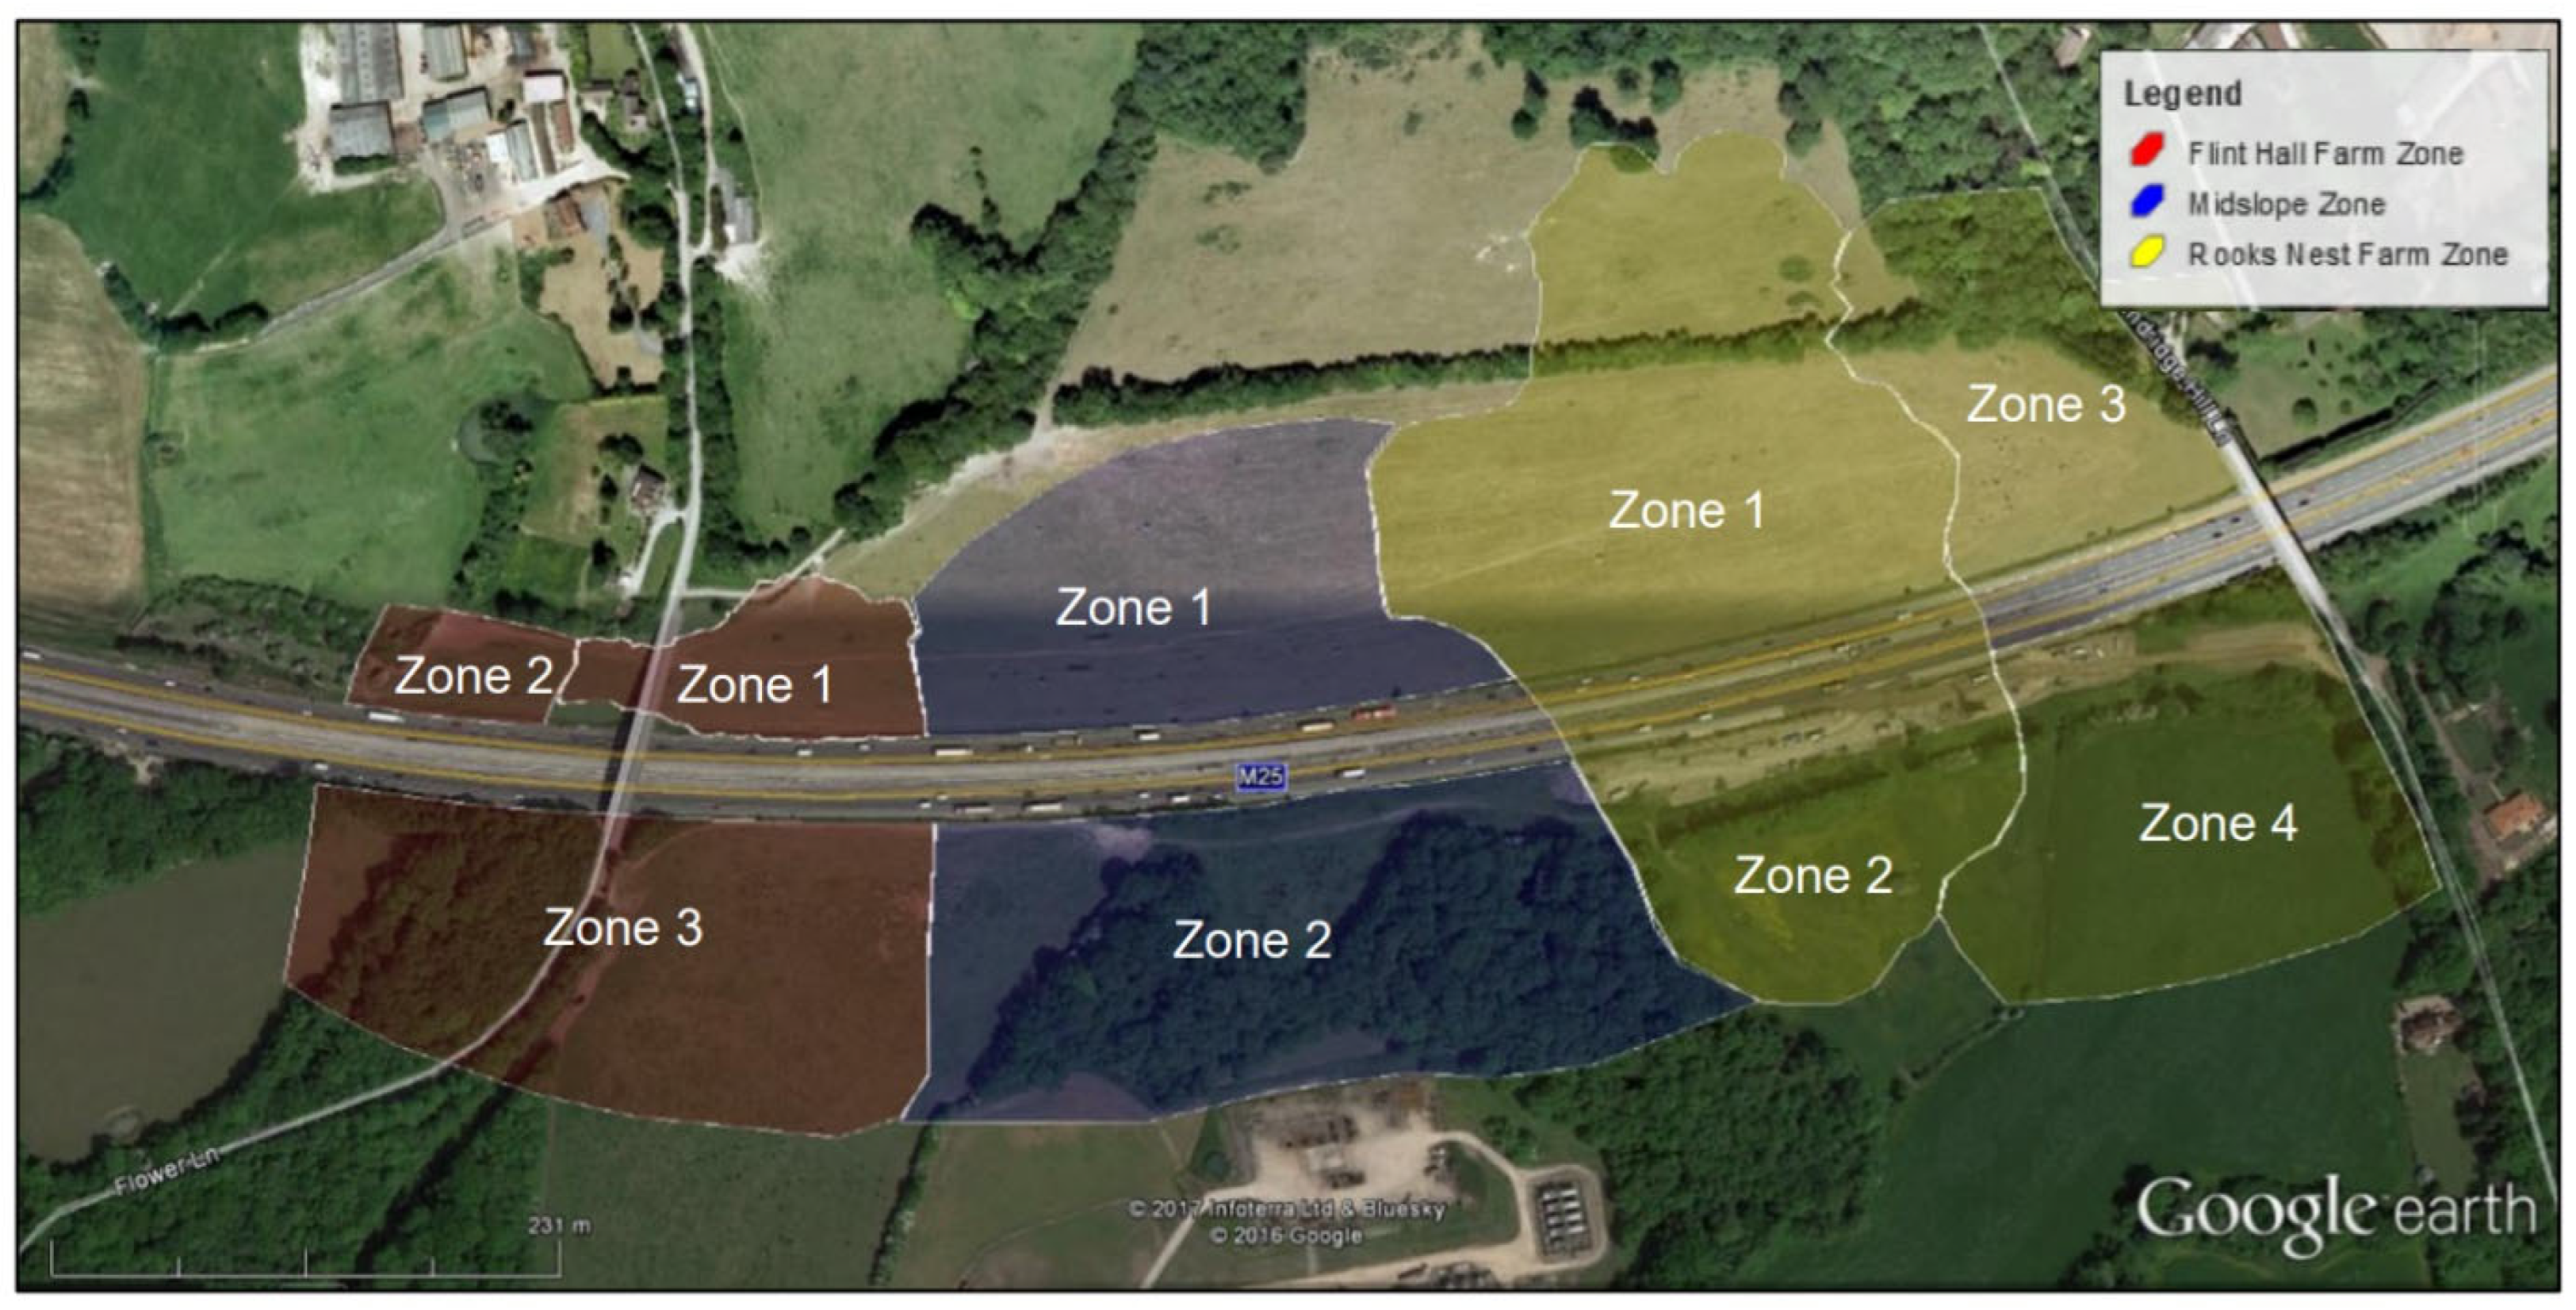
In the walkover and geomorphological mapping report by Atkins [25], the site is divided into three zones of geotechnical risk, based on the geomorphology, proximity to the M25 and the presence of instrumentation and stabilisation measures, amongst other factors. The zones were subjected to a semi-quantitative risk assessment by Atkins to assess the likelihood and impact of further ground movement hazards affecting the safety and operation of the M25, based on a review of all available ground monitoring data and geotechnical timelines. The Flint Hall Farm Zone, Midslope Zone and Rooks Nest Farm Zone are presented in Figure 3; the geotechnical hazard risk ratings for the sub-zones are the product of the hazard likelihood and impact and are listed in Table 1, with their association to the three landslide systems in Figure 4.
Given the geotechnical hazard and associated risks of landslide encroachment onto the M25, the site has been monitored on a sub-monthly basis since 2003 by a conglomerate of firms, including National Highways (formerly the Highways Agency and later Highways England), AECOM, Arup, Atkins, Connect Plus Services (CPS), and Geotechnical Observations. Field surveys and in situ instrumentation data from inclinometers, piezoelectric sensors, Shape Accel Array (SAA) sensors, and siphon well pressure sensors inform the production of geotechnical reports available through the National Highways Geotechnical and Drainage Management Service (GDMS). Monitoring the site through remote sensing, in this case InSAR, will provide millimetric rates of surface deformation for the entire site at a sub-daily temporal resolution if required.

2.1. Geology

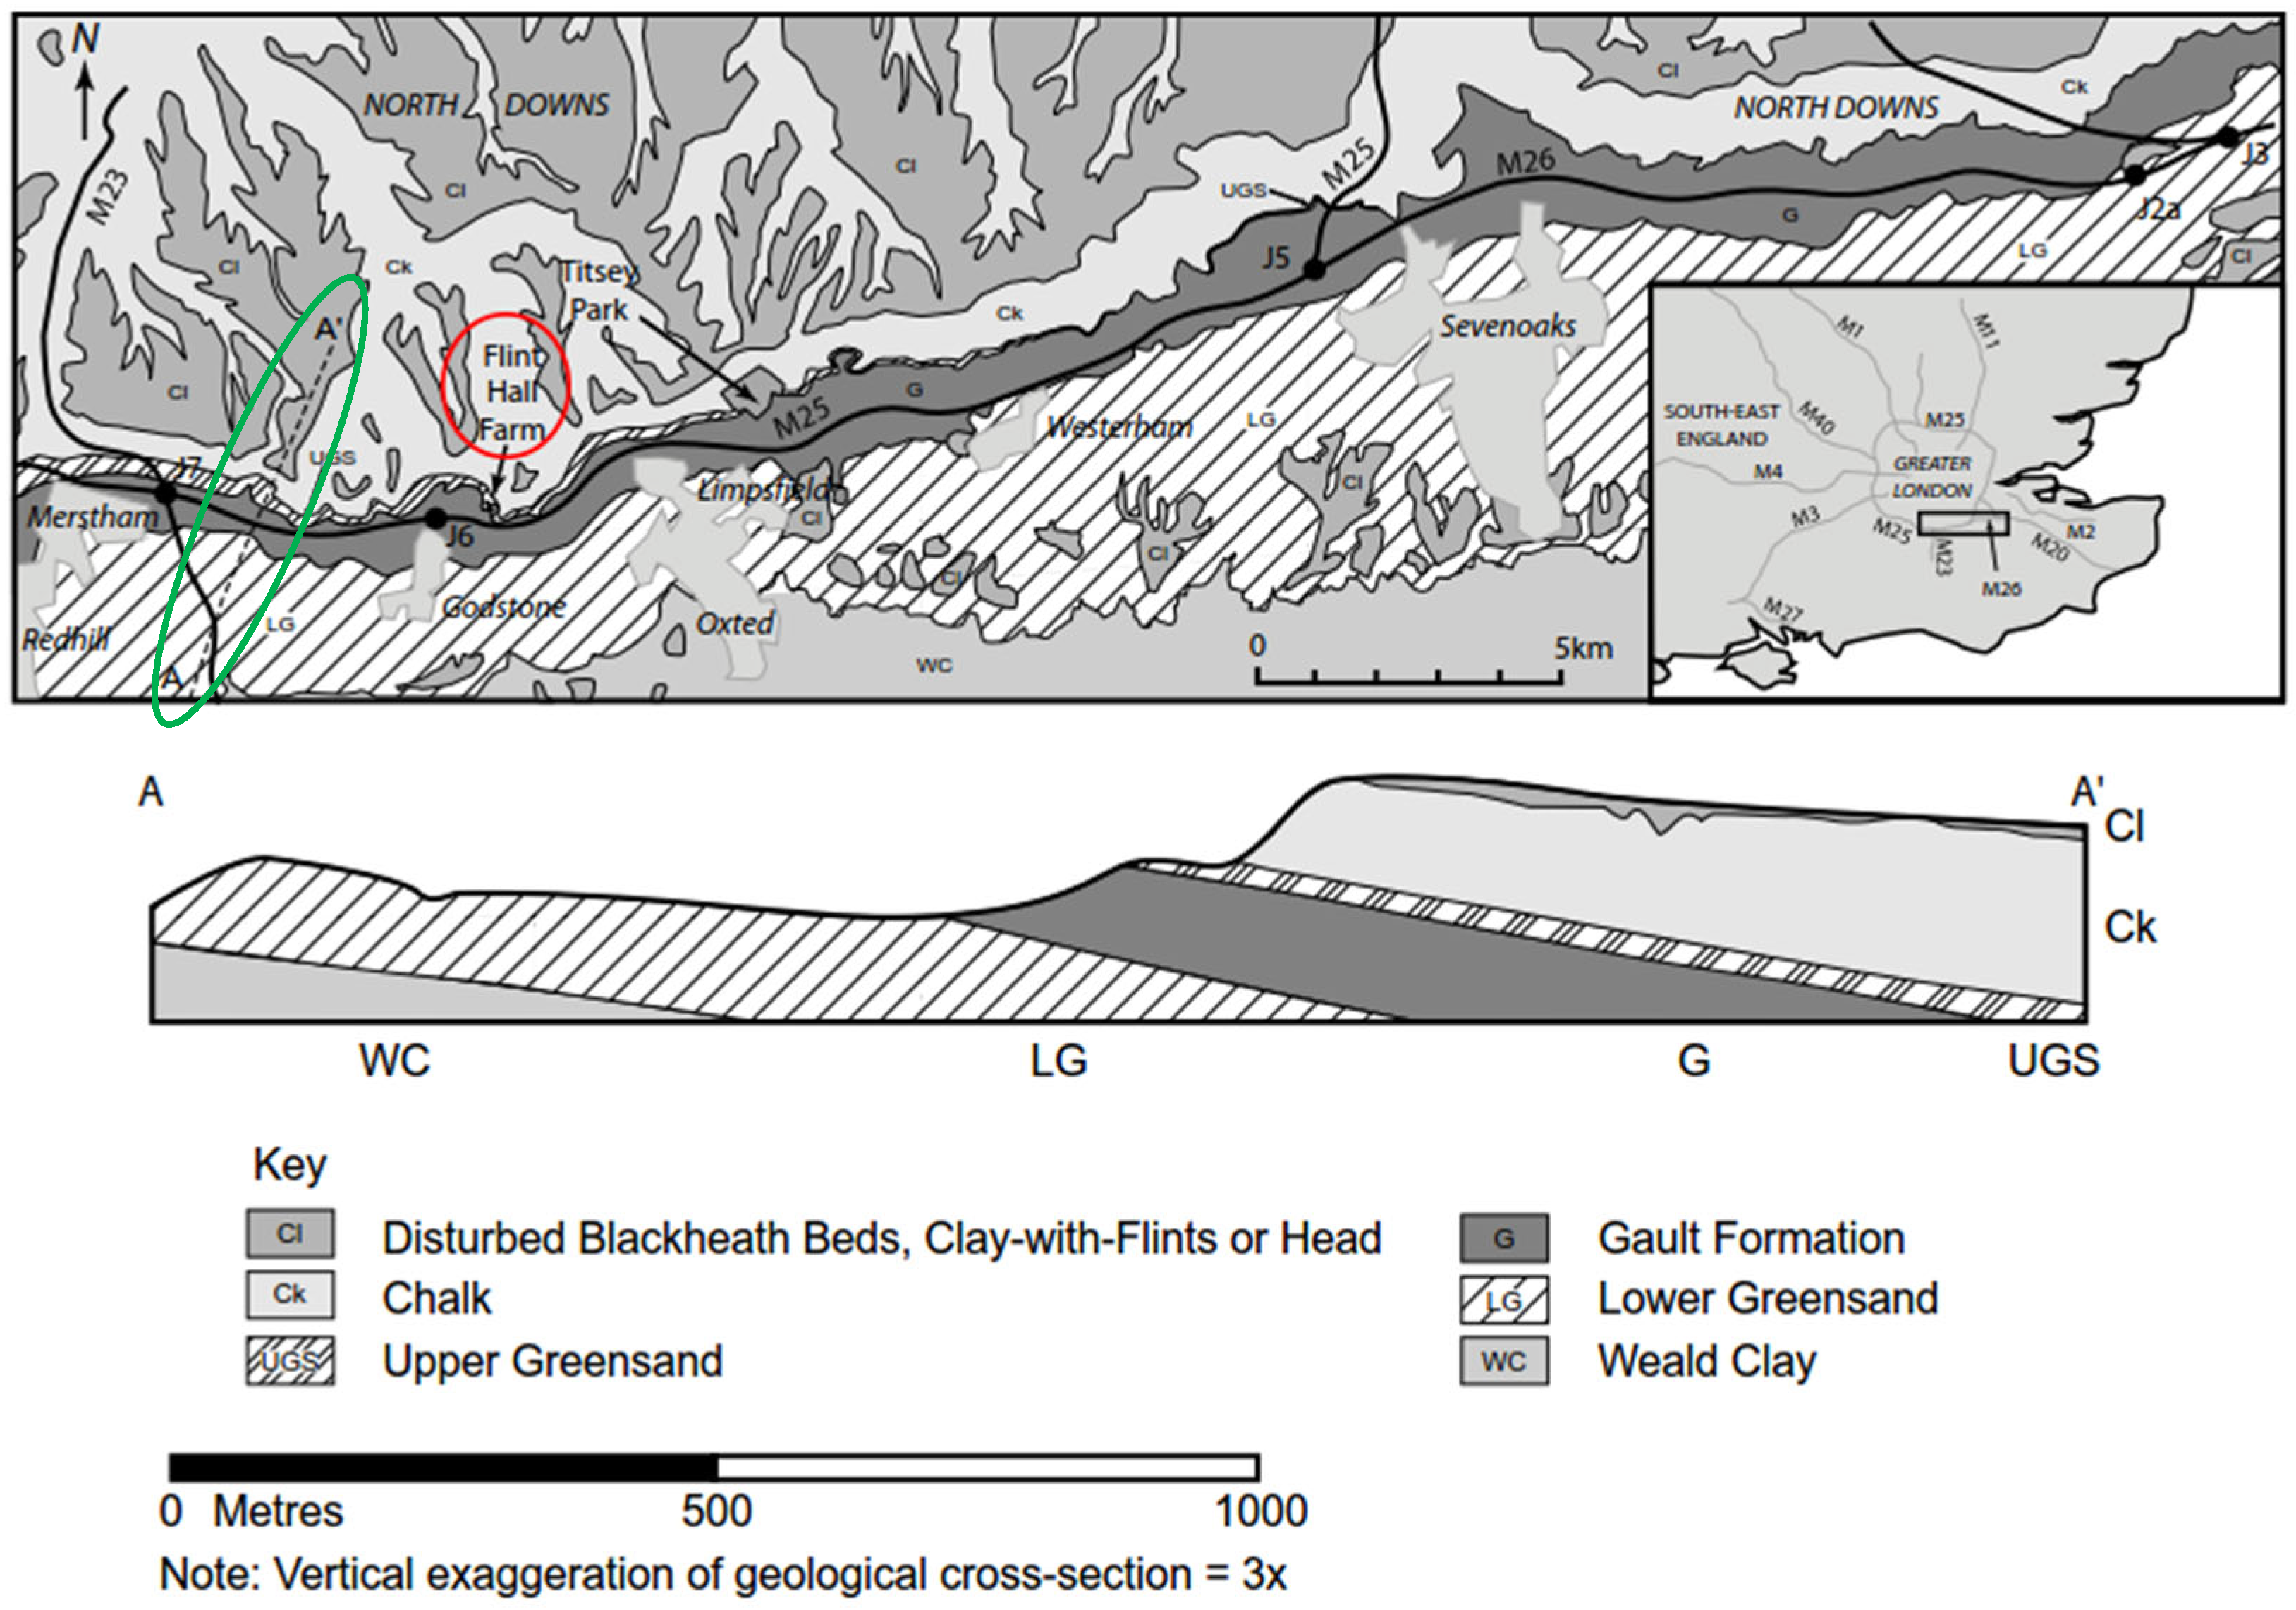
The geology at Flint Hall Farm is dominated by the Gault Formation, or Gault Clay, with sections of the mid-slope on the Upper Greensand Formation (Figure 5). The Gault Clay is a narrow-band (1–2 km width) sequence of pale to dark blue grey clay, mudstone and siltstone deposited during the Albian stage of the Lower Cretaceous (c. 113–100.5 Ma), spanning from Norfolk through to Devon. Other negligible formations include the Holywell Nodular Chalk and New Pit Chalk (c. 100.5–89.8 Ma), and the West Melbury Marly Chalk and Zig Zag Chalk (c. 100.5–93.9 Ma); however, these formations are rarely cited in geotechnical reports and literature for this location. Boreholes indicate geological contact between the Gault Clay and the Upper Greensand Formation (c. 113–93.9 Ma) at 75 to 125 m upslope to the north of the M25, with some present at the northern sections of Flint Hall Farm [25]. Outcrops of the Aptian to Albian Folkestone Formation (c. 126.3–100.5 Ma) are only present to the south of Flint Hall Farm.

2.2. Hydrological Regime

In situ permeability tests have demonstrated significant fissure flow in the Gault Clay, with high permeability rates between 5 × 10⁻⁶ and 7 × 10⁻⁷ m/s [1]. Whilst the groundwater flows towards the bedrock dip direction at a regional scale, the local groundwater flows towards the slope dip direction. The Gault Clay is an impermeable barrier, thus creating a perched aquifer at the top surface, and spring lines at the Upper Greensand and Gault Clay boundary. The springs saturate the underlying Gault Clay and create instabilities in slopes exceeding a 7° gradient [25].
Groundwater monitoring data from 2012 indicates a relatively high groundwater table surrounding Flint Hall Farm, which may be a contributing factor to any ground displacements [27]. The groundwater fluctuates seasonally, generally between 1 m and 2 m, with flow orientated towards the slope direction. To the north of the M25, groundwater levels vary from 0.6 m below ground level (bgl) during wet winters to 3.5 m bgl during dry months. To the south of the M25, groundwater levels vary from 1–2 m bgl to ground level, with saturated ground visible during site visits [27]. In an attempt to reduce the water level and stabilise the slope, 48 siphon wells across 310 m of the southern embankment were installed in 2005. Despite this, records from 2008 to 2012 indicate these measures were ineffective due to maintenance and biofouling issues [25].

2.3. Landslide Mechanisms

Gault Clay is susceptible to slope instability at gradients as shallow as 7° [28]. Former periglacial processes such as solifluction created shear surfaces at the upper 6 m region of the clay [26,28,29], with shallow historical landslides in this region, mostly 3–5 m deep [30]. Landslides and historic landslip plane reactivation present a significant geotechnical hazard to the M25 and other National Highways assets that are situated in this formation.
One active and twelve relict landslides are clustered between Junction 6 of the M25 and Titsey, which encompasses Flint Hall Farm. These were identified through desk-based geomorphological mapping using LiDAR and aerial photography [26]. The active landslide is defined as exhibiting recent movement that is expected to continue; inclinometer data indicates creep at a rate of 10 mm over six months. Geomorphological evidence for this landslide mechanism includes shallow depressions and indistinct toe lobes, which produce hummocky ground [26].
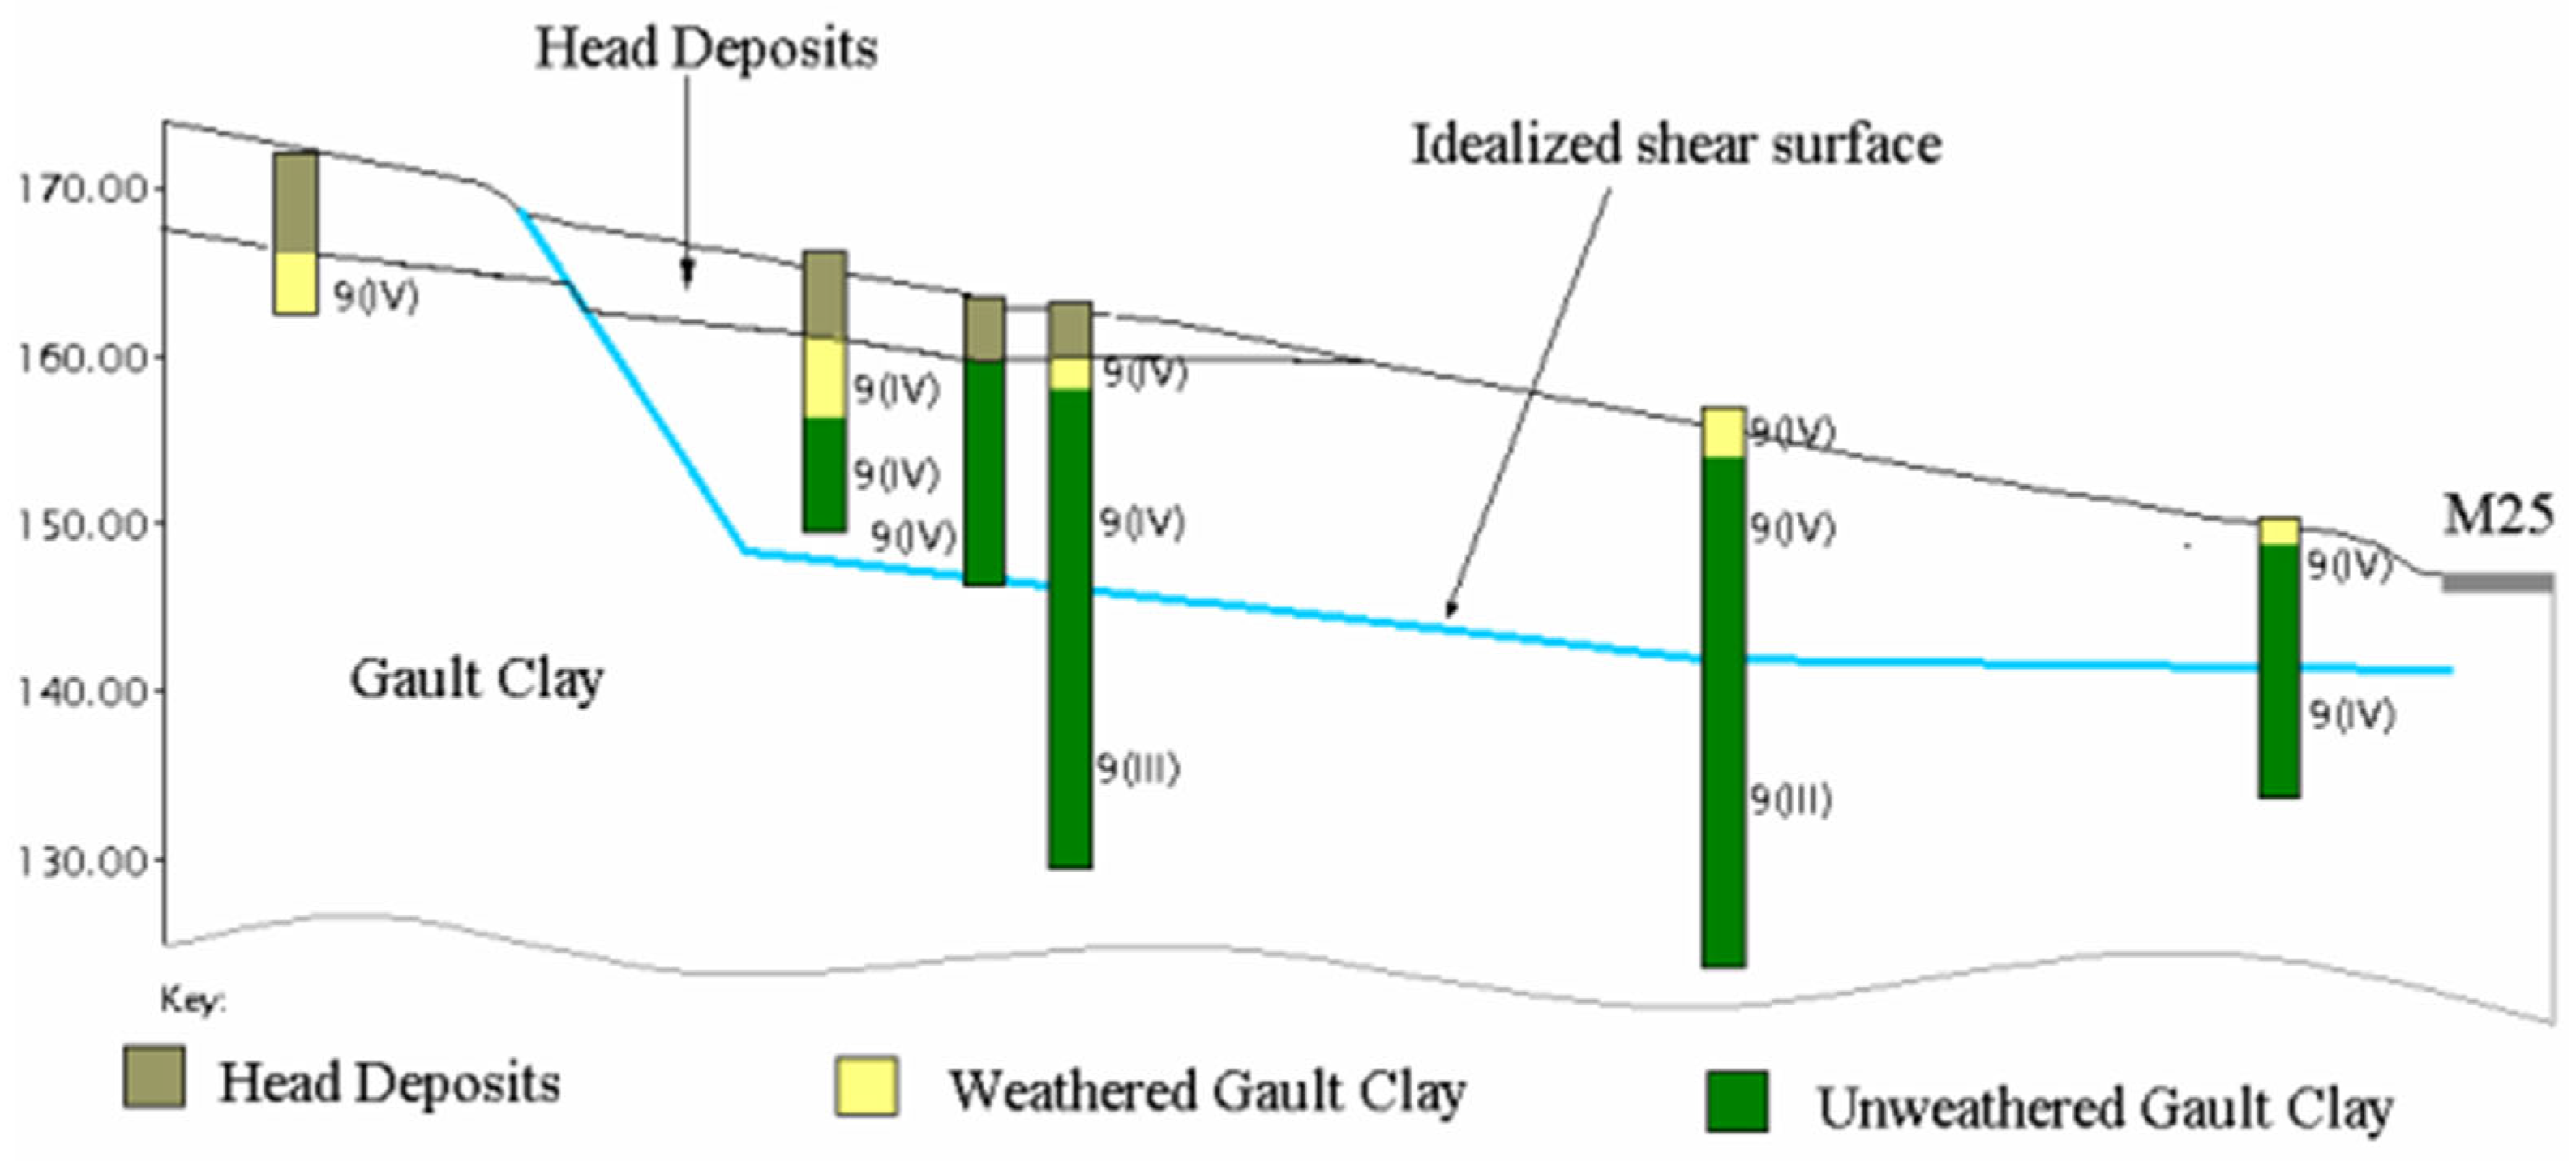
The Gault Clay is also susceptible to slide-type failures, caused by either the artificial destabilisation of the slope through cuttings for infrastructure, or the acceleration of creep movement [26]. Instrumentation was installed at Flint Hall Farm specifically, in conjunction with the aforementioned sub-monthly site visits, following the landslide that occurred on 19 December 2000. Excessive winter rainfall caused the failure of an 80 × 200 m section of the cut slope, which mobilised over 90,000 m3 of material; some of which encroached the M25 anti-clockwise carriageway [1] (Figure 6). The landslide was a wedge-shaped failure, with a basal shear plane 10 m bgl [1] (Figure 7). A trial pit shows the highly polished and moist contact between the head deposits and the Gault Clay, which enabled independent movement of the two formations [1]. Geomorphological evidence for this landslide mechanism included a distinct backscarp and well-defined toe lobe with a hummocky main body; however, these features are no longer visible due to remediation works, including cut-off and counterfort drains and piles [1,26].
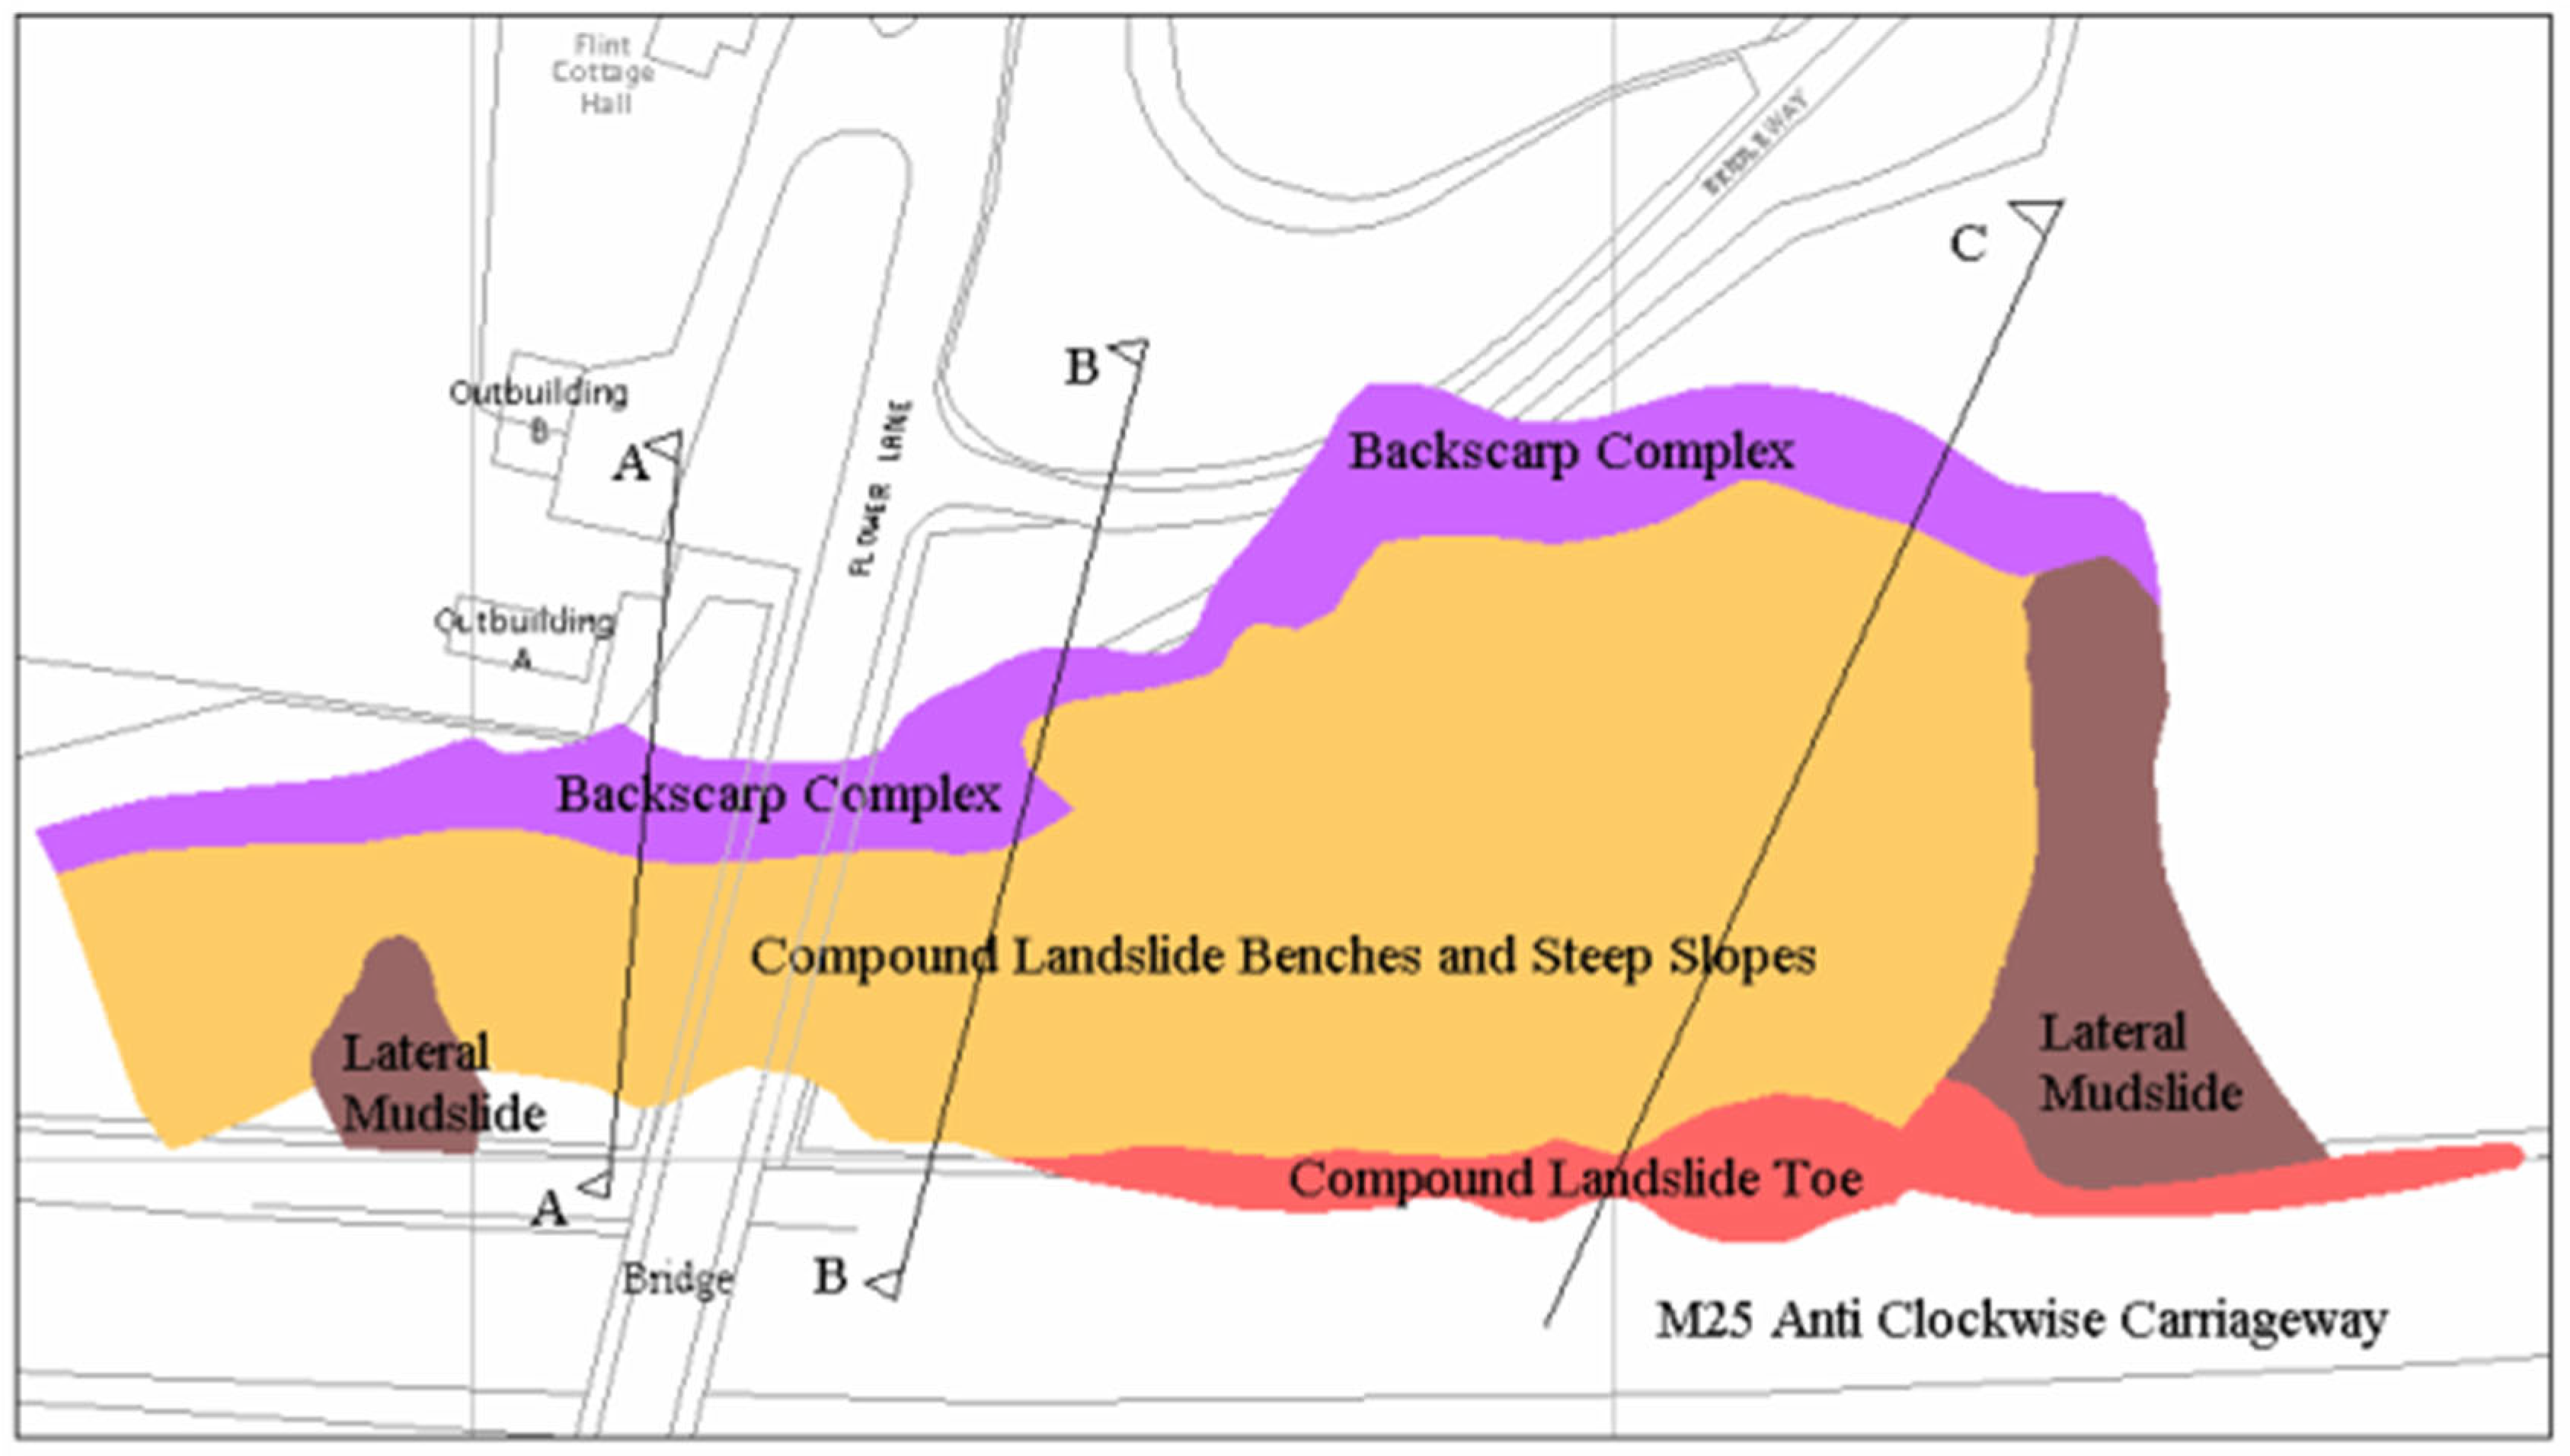
As shown in Figure 4, three landslides are present at the Flint Hall Farm study area: the Rooks Nest Farm Landslide, Flint Hall Farm Landslide and Flint Hall Farm South Landslide. The Rooks Nest Farm Landslide is a multi-rotational and translational movement which was reactivated by the M25 construction when the embankment increased loading at the lower sections. As stated, the Flint Hall Farm Landslide is a wedge failure within the Gault Clay, activated by high groundwater levels and the M25 construction. The Flint Hall Farm South Landslide is a dormant creep movement, with occasional reactivation during wet conditions [25].

3. Materials and Methods

3.1. Corner Reflectors

Two custom-built corner reflectors were installed at Flint Hall Farm in September 2021 to provide strong and stable radar reflectors at the predominantly rural location for satellite InSAR monitoring of the landslide deformation. The two reflectors were installed for observation by the Sentinel-1 ascending and descending azimuths of 345° and 195°, respectively. Subsequently, the corner reflectors were utilised as a target in the drone radar system flights, as demonstrated by similar other studies [14,15,22].
The reflectors are manufactured from 2 mm thick aluminium, as this is a lightweight and corrosion-resistant material. The 0.75 m inner leg provides a theoretical Radar Cross Section (RCS) of 26 dBm2; this is the minimum RCS required for detecting deformation at C-band radar frequencies [31]. The mesh perforated metal sheet facilitates the drainage of precipitation, reduces wind loads, and prevents debris accumulation, which may otherwise impact the triple-bounce mechanism or the installation orientation and elevation angles. The 4.7 mm hole diameter produces minimal RCS losses and satisfies the requirement for diameters to be less than one-sixth of the radar wavelength [31].
The reflectors were installed towards the centre of the Midslope Zone, Zone 1 in Figure 3 (51.25858°N, 0.04732°W); this zone is not attributed to a landslide mechanism; however, the geotechnical risk is greatest here at medium to high (Table 1). The foundation consists of a borehole casing filled with concrete, in which a scaffold pole was inserted. The installation is fenced-off to prevent damage from livestock interference (Figure 8).

3.2. Hardware Development

The drone radar hardware is a combination of commercially available and custom-made components. The payload components are considered in relation to the SWaP-C design criteria for drone deployment, of size, weight, power and cooling. The payload and its components have a small form factor and are lightweight for easier mounting to the drone and to maximise flight durations, respectively; the power consumption of electrical components such as the SDR and Single Board Computer (SBC) is considered, with internal rather than external power sources, and appropriate cooling mechanisms to dissipate any thermal energy that is produced.

3.2.1. Drone

The Shenzhen DJI Sciences and Technologies Ltd. (DJI) Matrice 600 Pro is an industrial grade hexacopter from Shenzhen, China. Compared to a typical quadcopter, the large aircraft frame size allows for a larger payload to be attached, with a potential hovering time of 18 min with a maximum payload weight of 5.5 kg. The two additional frame arms provide better flight stability by spreading the additional payload weight more evenly across the yaw axis. Hexacopters are also considered to be safer than quadcopters since the additional frame arms, motors, and batteries provide redundancies in the event of system or component failure. The majority of drone radar systems in the literature utilise this specific drone model [15,16,17,18,19,21,22], thus demonstrating its suitability for this type of custom payload application.

3.2.2. Software Defined Radio/Radar (SDR)

Software Defined Radio is a Radio Frequency (RF) communication system that implements Digital Signal Processing (DSP) components such as modulators, mixers, filters, and amplifiers through software rather than hardware. Hardware implementation is the traditional approach to radio communications; however, these are typically highly complex systems to design, implement and adapt if necessary. Software implementation through embedded systems and dedicated computer software takes advantage of recent, rapid improvements in computational power. An embedded system is a computer system with a dedicated function, comprising a computer processor, memory and input/output (I/O) devices. The ability to adapt and change the software components on-the-fly makes SDR operations very flexible and thus ideal for these research and development purposes. Importantly, SDR hardware may be used to implement radar functionality, since this falls within the RF spectrum. The use of the aforementioned SDR to implement radar is more specifically referred to as Software Defined Radar (SDR). For clarification purposes, the acronym SDR herein refers to the latter, Software Defined Radar, since all operations of Software Defined Radio in this research are for radar implementation.
The SDR utilised in the drone radar payload is the Ettus Universal Software Radio Peripheral (USRP) E312 [32]. Ettus Research is owned by National Instruments (NI) and located in Mountain View, CA, USA. The E312 features an AD9361 transceiver from Analog Devices, which provides 56 MHz of instantaneous bandwidth, a 10 MS/s sample rate, and a wide frequency range of operation from 70 MHz to 6 GHz; the latter being compatible with the custom antenna centre frequency of 5.4 GHz, described later in Section 3.2.3. Regarding the system architecture, the baseband processor utilises the Xilinx Zynq 7020 System-on-a-Chip (SoC) for accelerated Field Programmable Gate Array (FPGA) computations, with 512 MB Double Data Rate 3 (DDR3) Random-Access Memory (RAM) dedicated to the FPGA logic. Importantly, stand-alone operation is enabled by an ARM Cortex A9 866 MHz dual-core Central Processing Unit (CPU) with 1 GB DDR3 RAM; this A-class processor provides application cores for performance intensive systems. Transmission (Tx) and reception (Rx) filter banks suppress harmonics and reduce out-of-band signal interference, respectively.
Regarding SwaP-C, the E312 hardware is designed for mobile field deployment. The form factor is compact at 133 × 68 × 32 mm and is lightweight at 0.45 kg. Power is provided by an internal and rechargeable 3200 mAh Lithium-ion (Li-ion) battery for mobile operations up to two hours, depending on the centre frequency, sample rate and maximum gain settings. The SDR is not required to be completely weatherproof since it is mounted to the underside of the drone, thus shielding it from precipitation and wind effects. Furthermore, the DJI Matrice 600 Pro does not have an Ingress Protection (IP) rating and has a maximum wind resistance of 8 m/s (17.90 mph) [33]; therefore, the drone is not flown in precipitation or heavy wind. Nevertheless, the material properties of the E312 brushed-metal exterior make it durable, rugged and not easily damaged in challenging fieldwork conditions.

3.2.3. Antennas

Two antennas are mounted to the drone payload, for the simultaneous transmission and reception of RF signals. This section provides a summary of the antenna development, with a full account provided in [24]; this publication includes deriving the dimensions, simulating antenna performance metrics such as S11 and gain, and testing the fabricated antenna performances in a RF anechoic chamber.
The antennas are custom-made for control over the component dimensions and fabrication materials, whilst providing an improved understanding of the signal propagation mechanisms. The ideal antenna performance has good directionality and energy transfer to the target. The antenna type was selected from several options, based on their typical performance, size and weight for drone deployment. Aperture antennas such as horns and waveguides have good bandwidth and gain potential; horn antennas typically provide a highly directive main beam of radiation with smaller minor lobes, since the flared geometry acts to maintain the beam focus.
The 5.4 GHz centre frequency (f0) utilises the upper portions of the E312 frequency range, thus enabling a smaller horn antenna to be produced due to the shorter wavelength. This frequency is within the 5.35 to 5.46 GHz range allocated for civilian use in the UK and avoids the 5.73 to 5.83 GHz range used by the drone remote controller. This frequency facilitates the comparison and fusion of drone and satellite radar products, since the Sentinel-1 satellite constellation utilise a centre frequency of 5.405 GHz.
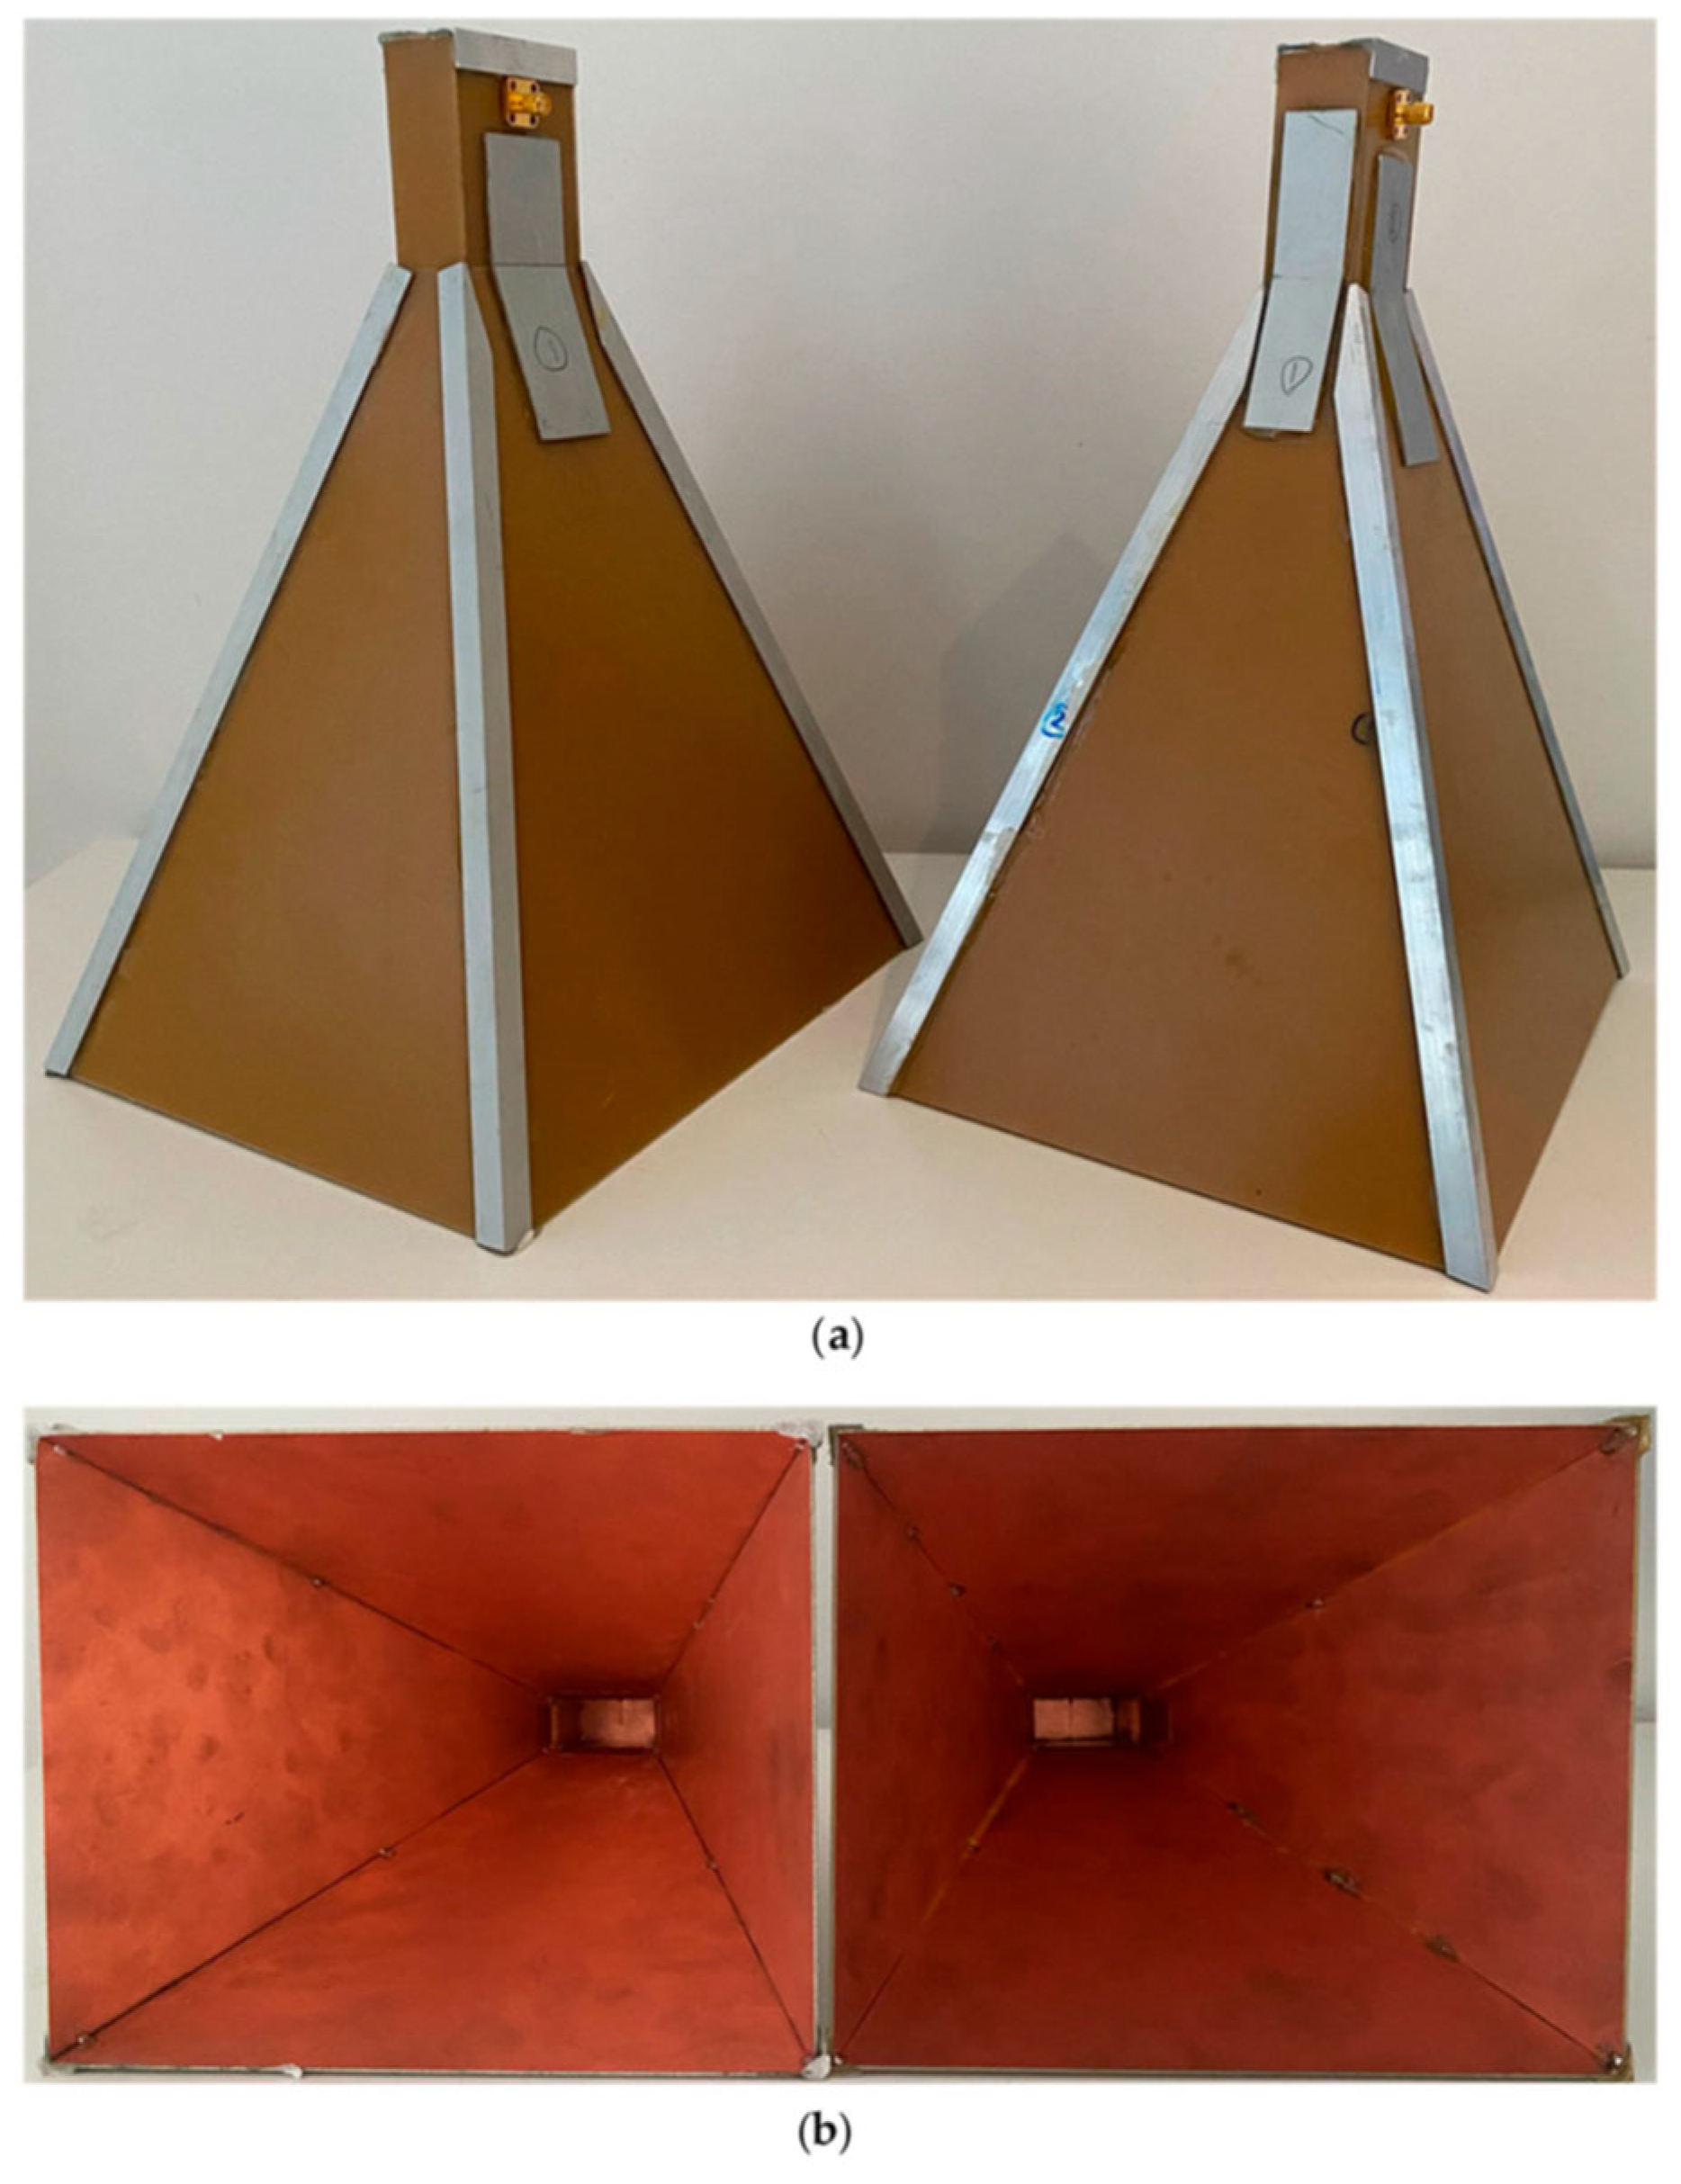
Copper Clad Laminate (CCL) is utilised as a conductive, lightweight, and inexpensive manufacturing material. Copper was chosen as a suitable antenna fabrication material due to its high conductivity. The primary material utilised here is a 1.6 mm thick, single-sided, FR-4 material grade CCL epoxy board. Previous demonstrations have shown antennas either integrated into the substrate or lined with this material [34,35,36,37,38,39,40], with this being the first demonstration of horn antennas fabricated from the CCL itself. The board base consists of eight layers of woven glass-reinforced fabric laminate epoxy resin. This provides a lightweight and rigid structure to the antenna at a suitable thickness for dimensional stability during drone deployment. The 35 μm thick copper at the internal surfaces provides a boundary for the electromagnetic field. CCL is deemed preferable to copper sheets for achieving a lightweight component for drone deployment, given their respective material densities of 1.8 and 8.96 g/cm3. The CCL pieces are machined using an XYZ Computer Numerical Control (CNC) machine and soldered together with multicore wire lead solder. In addition, 1 mm thick silver anodised aluminium is attached to the external edges of the flared sections using a water-resistant epoxy adhesive to support the soldered joints. The waveguide input feed was made by soldering a brass rod into the solder cup of a 50 Ω straight flange mount SMA connector (Figure 9).
Regarding SwaP-C, the two antennas have a combined weight of 0.99 kg; despite being the heaviest payload components, this weight falls comfortably within the potential payload capacity of 5.5 kg. Antenna testing was performed to compare the simulated and fabricated antenna performances. The S11, gain, radiation patterns, and beamwidths were measured in a RF electromagnetic anechoic chamber using a calibrated vector network analyser (VNA). Despite a slight performance disparity, which is attributed to artefacts of the manufacturing and testing processes, both antennas perform well, have a wide bandwidth of potential operation, and are suitable for deployment in the drone radar payload [24].

3.2.4. Single Board Computer (SBC)

An SBC is a complete computer system integrated onto a single board, with a CPU, memory, and I/O interfaces; this component is required for remotely operating the E312. The Raspberry Pi 4 with 8 GB RAM is utilised. Regarding SwaP-C, this 47 g SBC has an 85 × 56 × 17 mm form factor, and a low power consumption that is compatible with the drone power supply via a voltage converter. The 2.4 and 5 GHz WiFi and Bluetooth 5.0 module provides wireless connectivity for operation control via Secure Shell Protocol (SSH). The gigabit ethernet port is used to connect the Pi and E312.

3.2.5. Payload Enclosure and Other Components

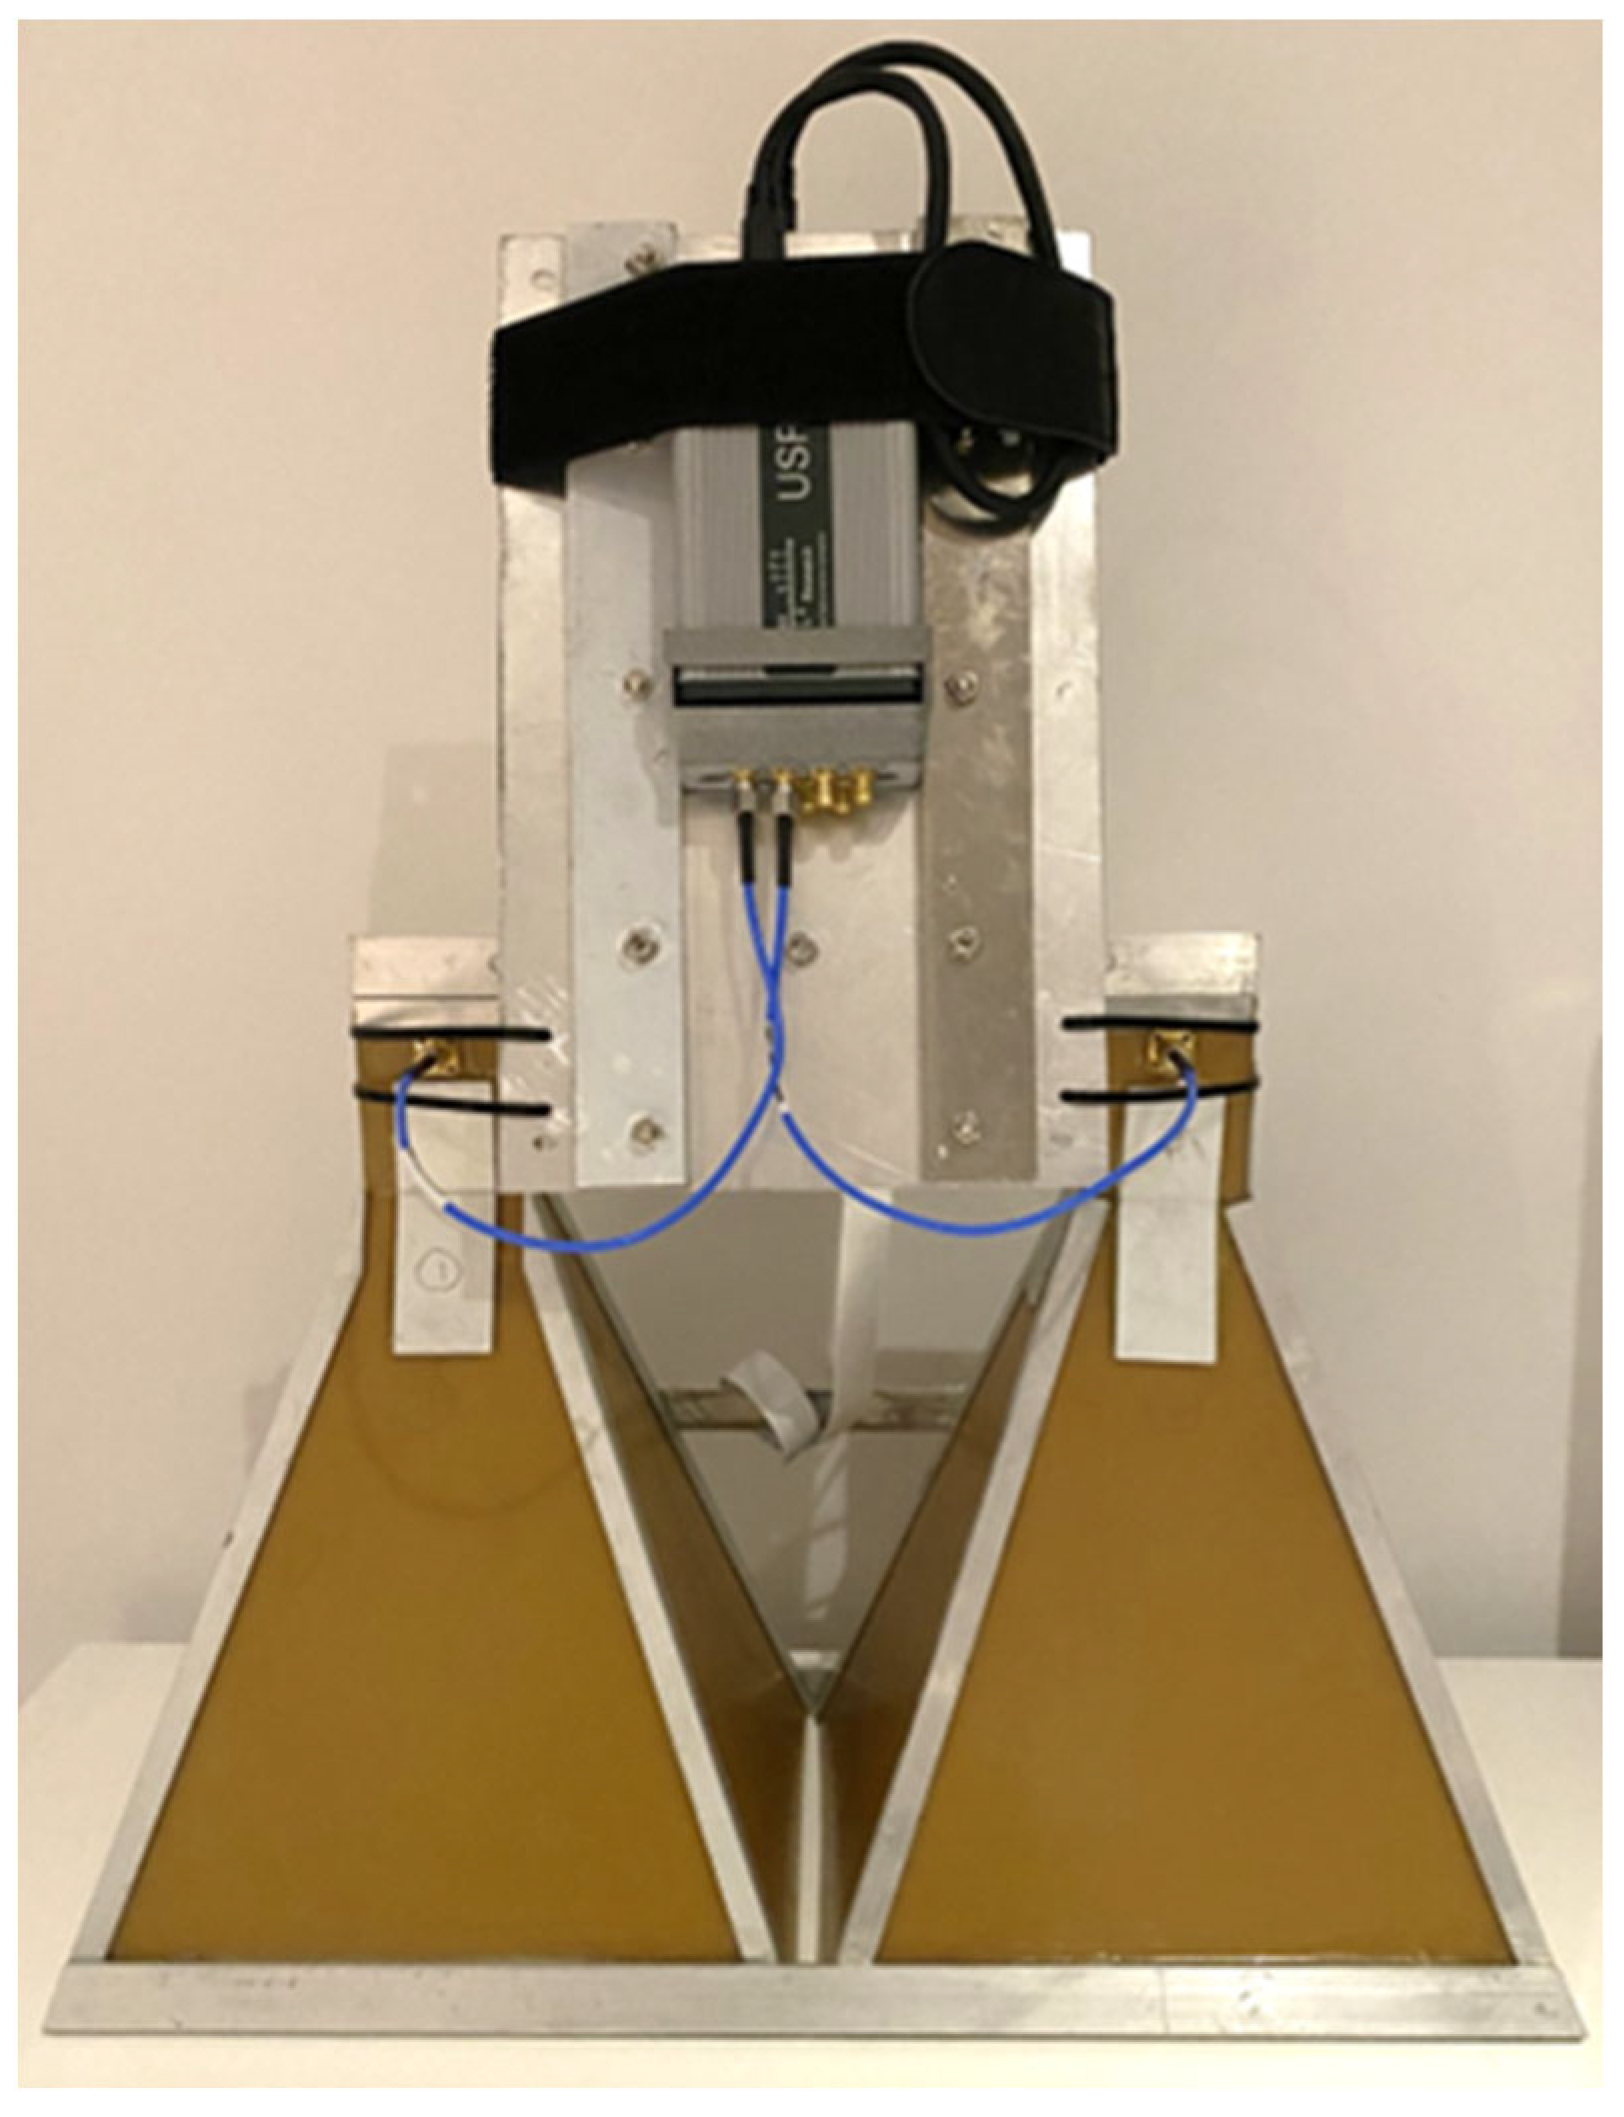
The antennas, E312 and Raspberry Pi are incorporated into an aluminium payload enclosure (Figure 10), which attaches to the underside of the drone in a modular fashion (Figure 11). Aluminium was chosen as a suitable material since it is a lightweight metal that provides good strength and stability at small thicknesses. The payload and antennas are oriented towards the front of the drone, due to the landing gear mechanisms and legs on the sides of the drone. As the drone can move about the yaw axis of rotation, the antennas can achieve the side-looking antenna viewing geometry required for SAR with forward-mounted antennas and sideways flight.
Other payload components in Figure 11 include the Raspberry Pi version 2.1 camera module and the Emlid RS+ Global Navigation Satellite System (GNSS) module; these components are not required for the drone SAR imaging presented here; however, they are utilised for the ongoing work regarding data visualisation and the transition from discrete SAR imaging to multi-pass InSAR. Regarding the former, the Sony IMX219 8 Megapixel sensor with a fixed-focus lens provides 3280 (H) × 2464 (V) pixel static images for SAR visualisation on optical data. Regarding the latter, this GNSS module is used in conjunction with an equivalent base station GNSS module for flight path corrections through Post Process Kinematics (PPK). To achieve repeat-pass interferometry, the flight path must be repeated to within a critical baseline, which is typically tens of centimetres for drone radar platforms, depending on the specific imaging geometries and radar parameters. The GNSS data corrected through PPK provides horizontal and vertical kinematic accuracies of 7 + 1 and 14 + 2 (mm + ppm), respectively.

3.3. Software

3.3.1. DJI Ground Station (GS) Pro

The DJI GS Pro version 2.0.17 iPad application is used for autonomous remote control of the drone during flight. The application enables multiple flight paths to be defined, with custom waypoints, speeds, altitudes, headings and end-mission actions. The fully customisable routes enable the observation of locations that are shadowed in satellite SAR data. The flight altitude impacts the spatial resolution of the SAR data, as the drone can fly immediately above or hundreds of feet above the target. The route is planned to provide the desired coverage of the target on a case-by-case basis. The estimated flight time and battery requirements for each flight path are estimated, based on the flight length and speed. This application is essential for future repeat-pass interferometry, whereby multiple, precise passes of the same flight path must be repeated over time. Furthermore, autonomous flight simplifies the procedures for the operator and reduces human error and safety issues associated with manual control. The automated flight path utilises a single onboard GPS system and the barometer for horizontal and vertical positioning, which introduces a positioning ambiguity. The aforementioned GNSS modules are used to ascertain the true drone positioning data and perform an accuracy assessment of the automated route, which may be impacted by wind, turbulence or atmospheric thermal gradients.

3.3.2. Frequency Modulated Continuous Wave (FMCW) Radar

GNU Radio Companion (GRC) is pre-installed on the E312 and is a freely available and open-source software development toolkit for DSP for implementing SDR through C++ and Python. GRC provides a range of DSP functions as discrete blocks, including filters, math operators, and waveform generators. FMCW is implemented through the DSP functionality of GRC. The lower transmission power of FMCW compared to pulsed Continuous Wave (CW) SAR enables a more efficient radar system for drone deployment where power supplies are limited. Furthermore, with CW radar there is no procedure to accurately time the transmission (Tx) and reception (Rx) signals and convert these into range measurements. Instead, Linear Frequency Modulation (LFM) is used for range compression. This allows measurements to within very small ranges of the target, with the minimal range comparable to the transmitted wavelength. In LFM FMCW, the frequency of the sinusoidal signal increases within the chirp between a given bandwidth. Figure 12 illustrates this modulation technique in the amplitude and frequency domains, with the latter producing a distinctive sawtooth pattern.
The distance between the antenna and the target (R) (m) is determined by the frequency shift of the received signal (Rx) compared to the transmission signal (Tx), which occurs due to the two-way travel delay ( Δ t ) between them:
R = c 0 Δ t 2 = c 0 Δ f 2 d f d t
where c 0 is the speed of light of 3.00 × 10⁸ m/s, Δ t is the delay time (s), Δ f is the measured frequency difference (Hz), and d f / d t is the frequency shift per unit of time, or the slope (S) in Figure 12b.
Figure 13 presents a radar block diagram which underpins the FMCW DSP theory and implementation in GRC.
Firstly, a carrier waveform is generated and converted to an analogue signal using a digital to analogue (D/A) converter. In GRC, the Signal Source block is used to define and produce the baseband signal. The frequency is modulated using a Voltage-Controlled Oscillator (VCO), whereby a complex sinusoid of frequencies is produced from a float input stream of control voltages. A bandpass filter controls the desired frequency range. In a traditional hardware system, a physical coupler would be used to branch off some of the transmission signal for mixing with the received signal at a later stage; this is achieved internally within the SDRs and by using the multiply math operator in GRC. Before transmitting to the target, the signal is amplified using the gain and RF settings of the UHD: USRP Sink block, which represents the E312 Tx antenna. Similarly, the low-noise amplifier is encompassed within the UHD: USRP Source block for the E312 Rx antenna. The received and amplified signal is mixed with the transmitted signal, with the mixer output being the frequency difference of the transmit and receive chirp (Δf). A low-pass filter blocks any unwanted frequencies, noise and interference from the system or environment before another amplification stage, if necessary. A Fourier transform converts the time domain signal into the frequency domain. Additional Throttle blocks were incorporated to prevent overrunning and CPU congestion. The FMCW output is an Intermediate Frequency ( I F ) (Hz) that the carrier wave has shifted to:
I F = S 2 R c
where S is the signal slope (d(f)/d(t)), R is the antenna to target distance (m), and c is the speed of light. If there are multiple targets, multiple IF tones and therefore multiple frequency peaks will be produced corresponding to the range of each target. An appropriate range resolution is therefore important for discerning closely spaced targets that may otherwise show as one peak on the frequency spectrum. By increasing the time and the resultant bandwidth ( B ) of the signal chirp, the range resolution ( d r e s ) (m) is improved:
d r e s = c 2 B
The GRC FMCW flowgraph is converted to a Python script and transferred to the E312 file system for remote operation without the standard Graphical User Interface (GUI).

3.3.3. Range Migration Algorithm (RMA)

Prominent SAR algorithms include the Range Doppler Algorithm (RDA), Chirp Scaling Algorithm (CSA) and Range Migration Algorithm (RMA). The RMA is selected as the most appropriate SAR algorithm for InSAR applications as it preserves the phase information across large integration angles [41].
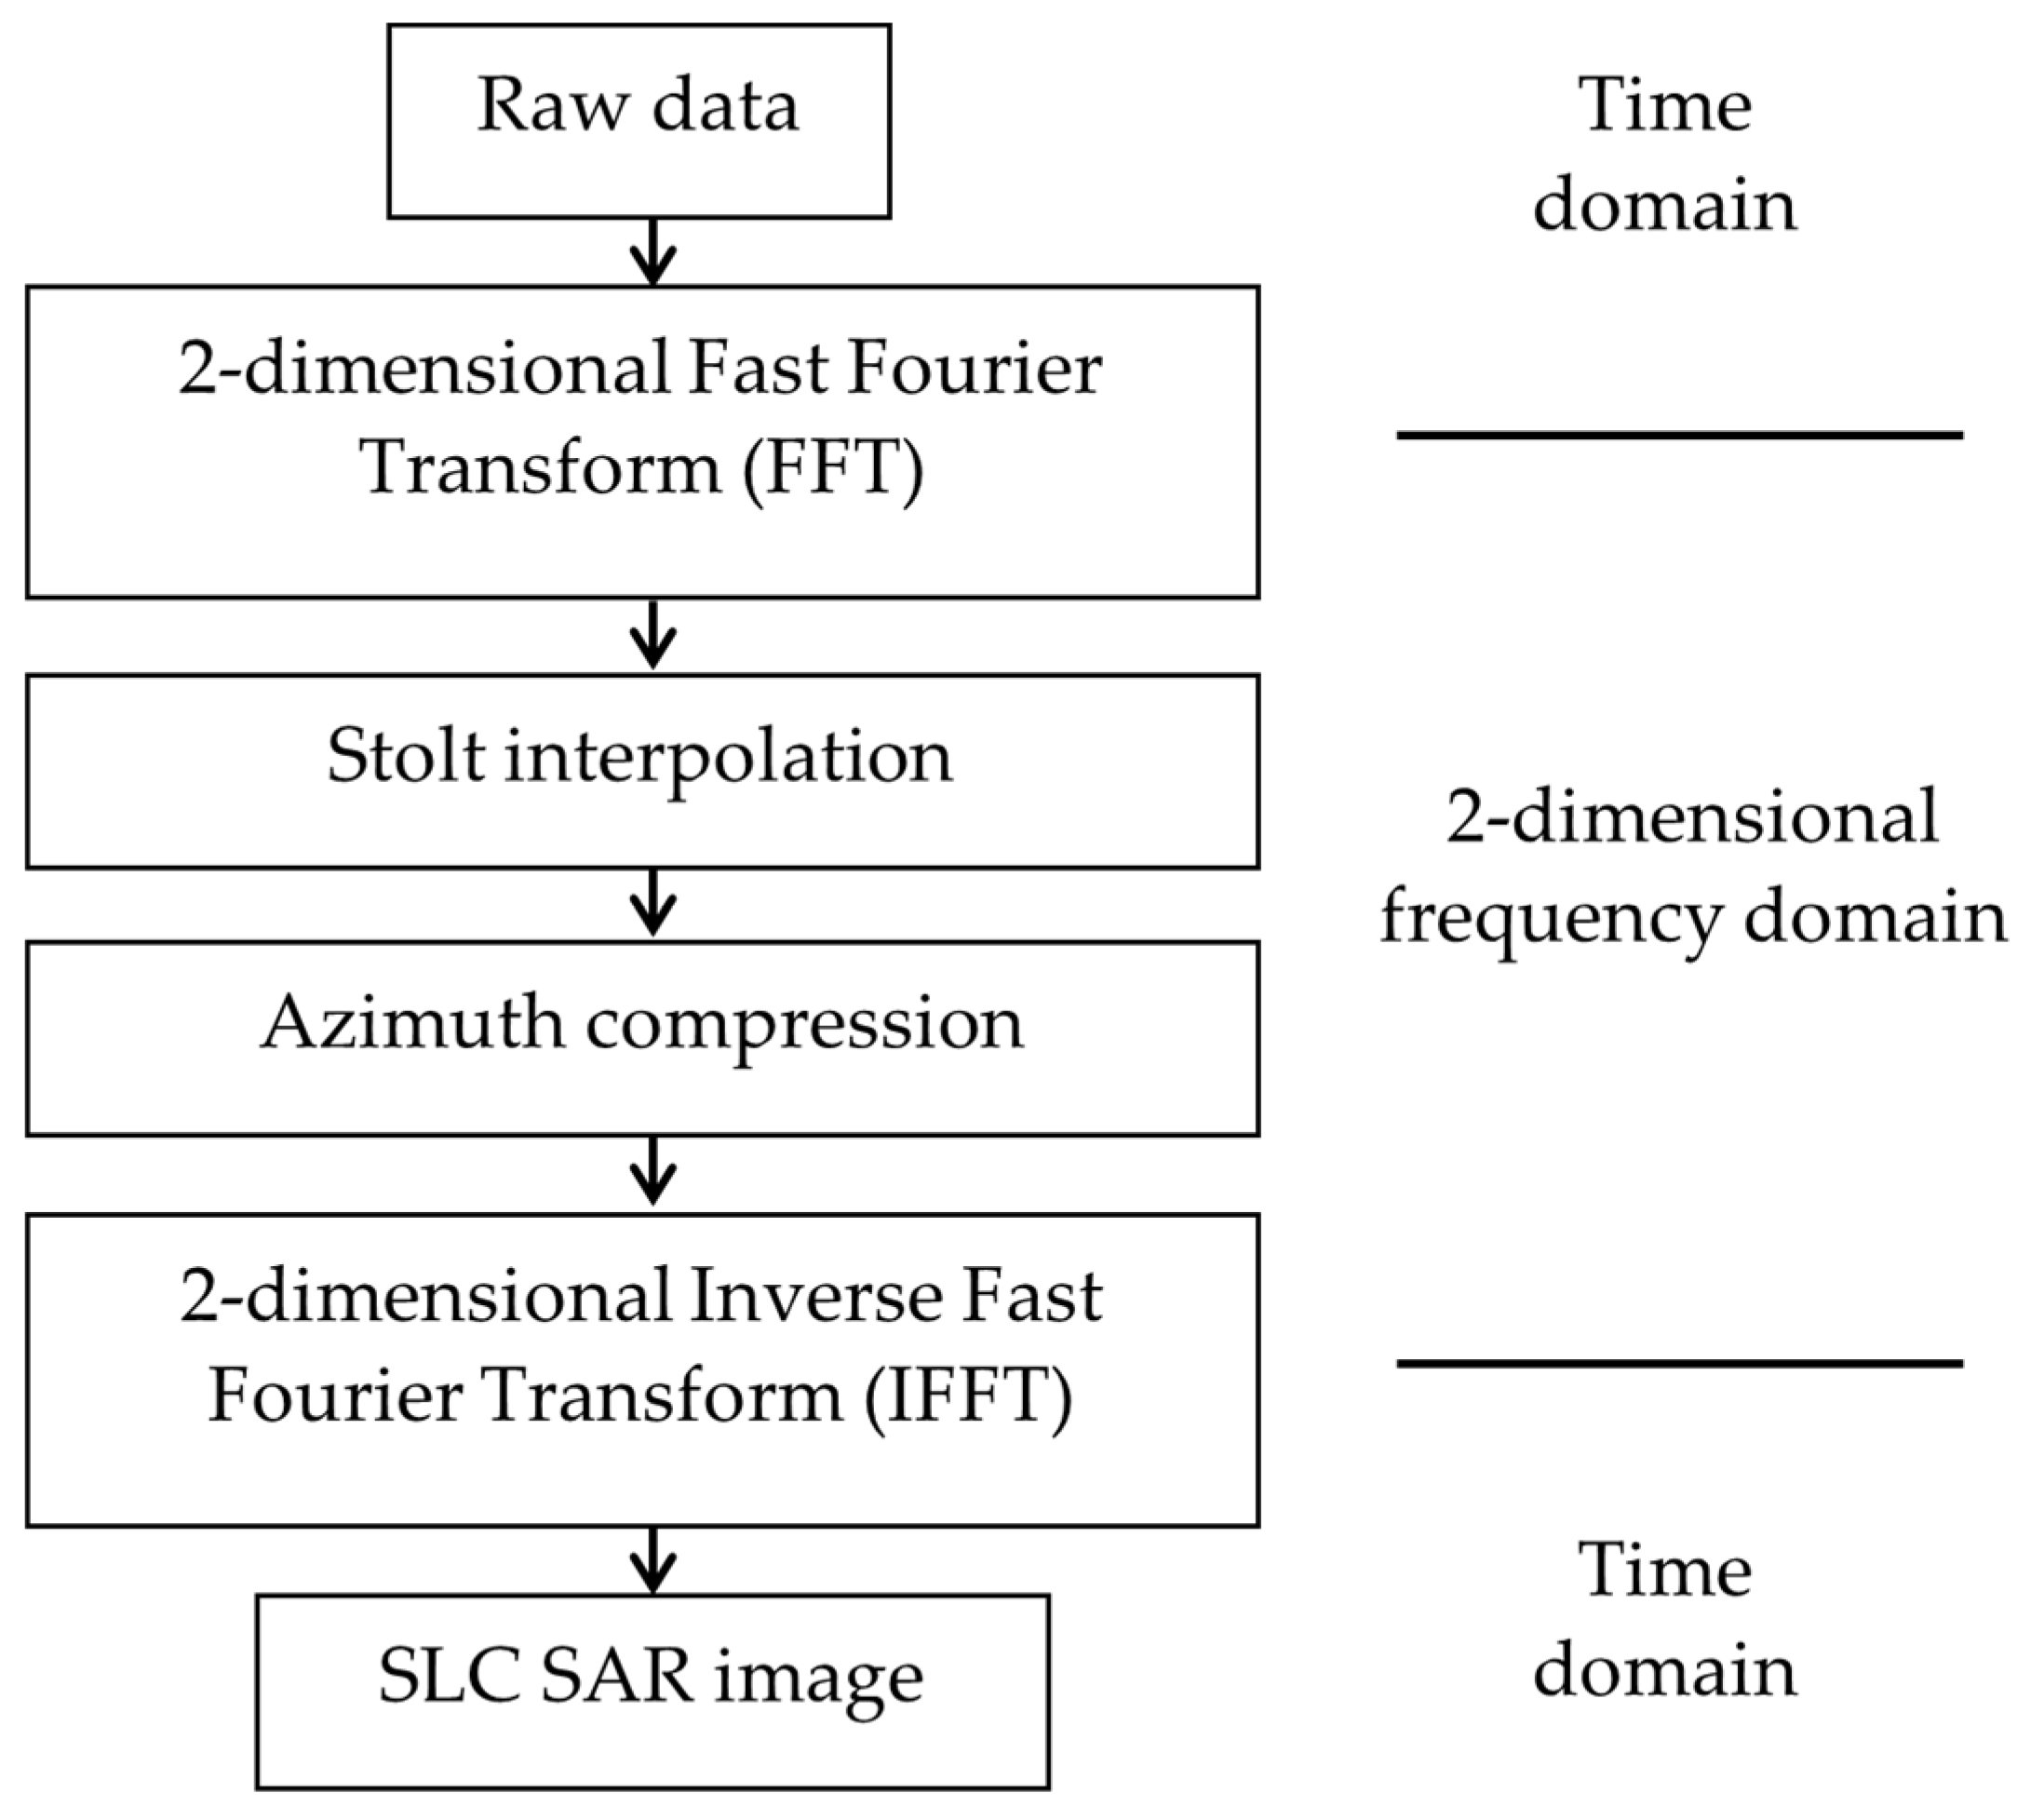
Figure 14 presents a block diagram that illustrates the RMA processing stages. The Fast Fourier Transform (FFT) and Inverse Fast Fourier Transform (IFFT) are converters from the time domain to the 2-dimensional frequency domain and back. Frequency domain processing is computationally efficient compared to time domain algorithms [42]. The Stolt interpolation warps the data using a 1-dimensional variable to balance the range curvature of the target field. The azimuth compression is essentially a matched filter, whereby a reference function is multiplied with the signal spectrum to focus the spread data to a zero Doppler point. Resultantly, the Stolt interpolation and azimuth compression compresses the signal energy in both the azimuth and range directions, with the full-resolution image visible following the IFFT.
The RMA produces Single Look Complex (SLC) images from FMCW waveforms for a moving platform. The algorithm inputs include:
  • Raw radar data: the unfocussed in-phase and quadrature (I/Q) data collected by the E312 in a matrix format; the rows and columns correspond to the downrange and cross-range directions, respectively.
  • Waveform definition: including sample rate (Hz), LFM sweep time (μs), bandwidth (Hz), direction and interval, output format and number of samples and sweeps. These parameters are derived from the Signal Source block in GRC.
  • Platform velocity: drone flight speed, which is typically 1 m/s, derived from the automated flight path data in DJI GS Pro and verified through the fixed GNSS data in Emlid Studio.
  • Operating frequency: radar centre frequency of 5.4 GHz, derived from the UHD: USRP Sink and Source blocks in GRC.
  • Range distance: distance between the radar antennas and the beam centre on the ground, derived from Equation (1).

3.4. Fieldwork Procedures

3.4.1. Flight Safety

Flint Hall Farm is not subject to any restricted airspace which would impact on our drone operations. The site is not located within any Airport Control Zone (CTR), or Flight Restriction Zone (FRZ) associated with airports, airfields and London airspace. Indeed, the site is south of the Kenley FRZ, Kennel Farm Hang Glider Site and the London Biggin Hill Airport FRZ, and it is north of Gatwick Airport and the Redhill Aerodrome.
Flight safety procedures outlined in the General Visual Line of Sight (GVC) training course are adhered to; this includes the provision of safety equipment, the completion of extensive risk assessments and conducting a pre-flight inspection of the site and equipment. Whilst the farm itself is private land, a minimum of 50 m separation distance is maintained between the drone and the M25 at all times to avoid impacting uninvolved people. Drone operations are conducted at relatively low altitudes, with a maximum flight altitude of 30 m. These measures ensure that, should the drone fail, it does not fall onto or near the M25. Furthermore, this should prevent drivers being distracted by the drone, which may otherwise create a secondary safety hazard.

3.4.2. Data Collection

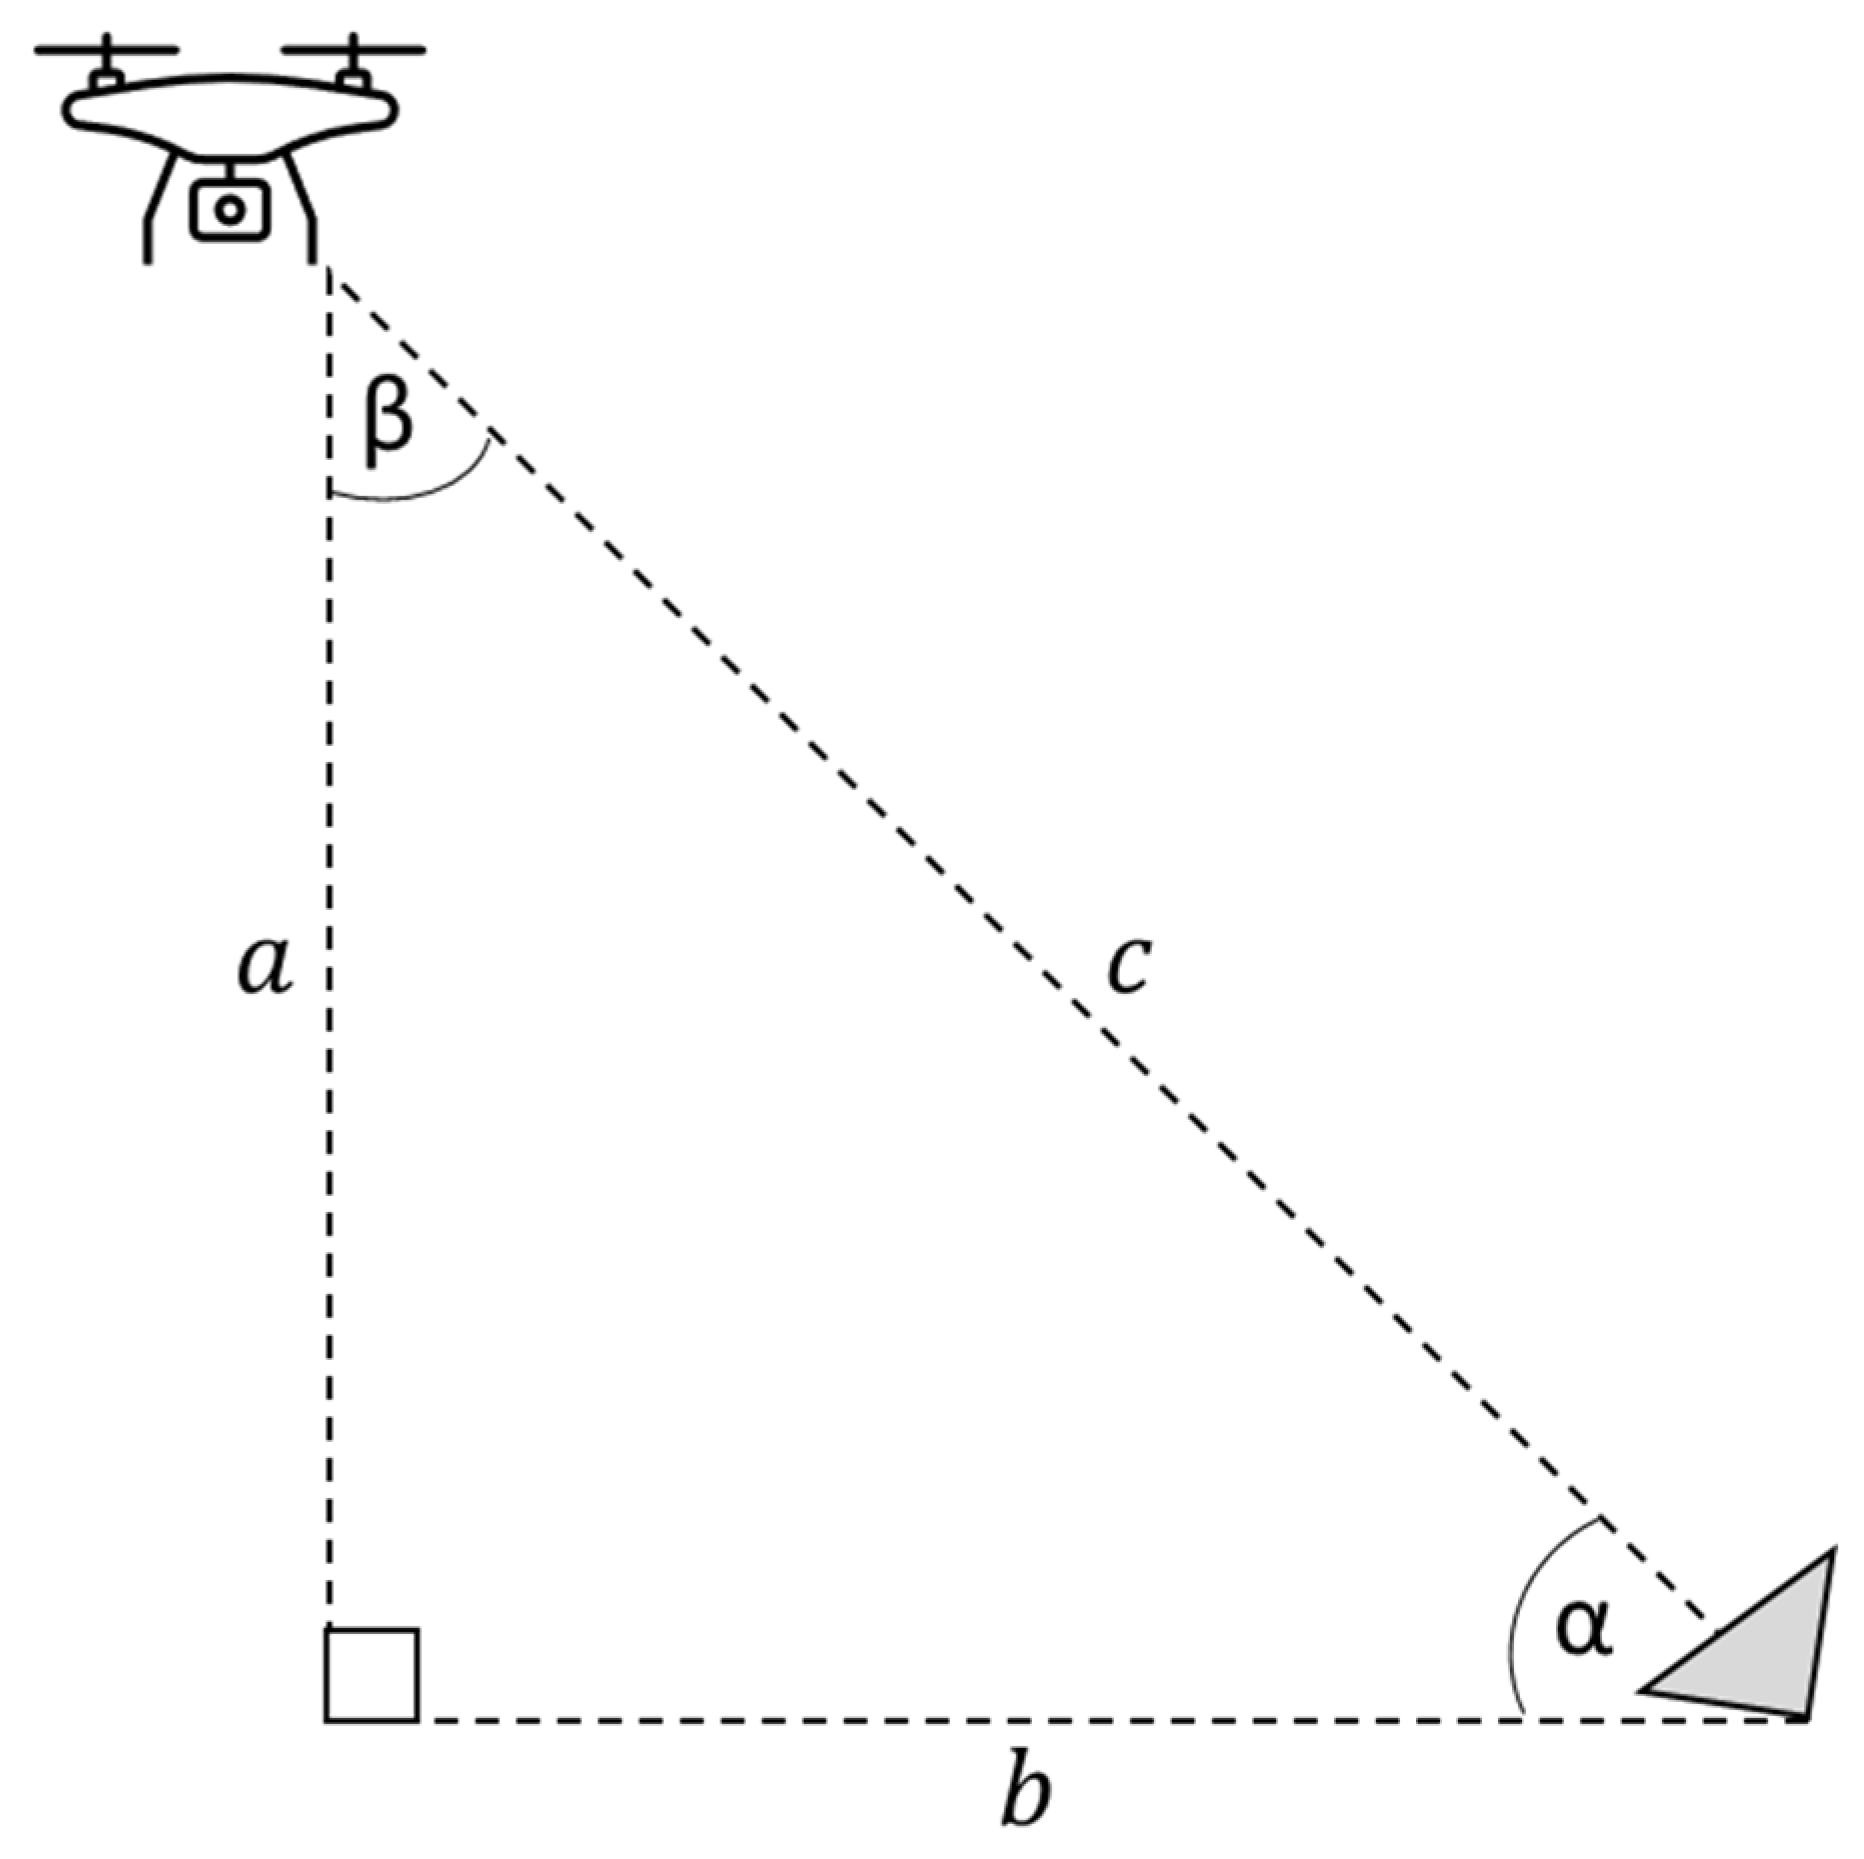
The corner reflectors are used as point targets for the drone radar. Figure 15 illustrates the side-looking viewing geometry when the drone passes the corner reflector, which is used to create the flight path. An α of 52° is optimal for the corner reflector triple bounce mechanism and thus target visibility. β is therefore 38°. a is the drone altitude of 30 m. The horizontal separation distance of the corner reflector and drone, b, is 23.44 m. The slant range, c, is the line-of-sight distance from the drone to the corner reflector of 38.07 m; this comfortably satisfies the requirement for the slant range to exceed the minimum antenna farfield distance of 1.67 m.
The SAR is side-looking and slightly downward facing due to the mounting angle of the antennas on the payload. As the corner reflectors are installed at approximately east–west orientations, the drone flight path is oriented south to north, flying uphill with a side-looking viewing geometry. The minimum and maximum flight latitudes are determined by the separation distance from the road and the tree line at the north of the site, respectively. This provides approximately 75 m of straight-line flight. The drone maintains a constant, low flight speed of 1 m/s to minimise pitching caused by rapid acceleration.

4. Results

4.1. Preliminary Results

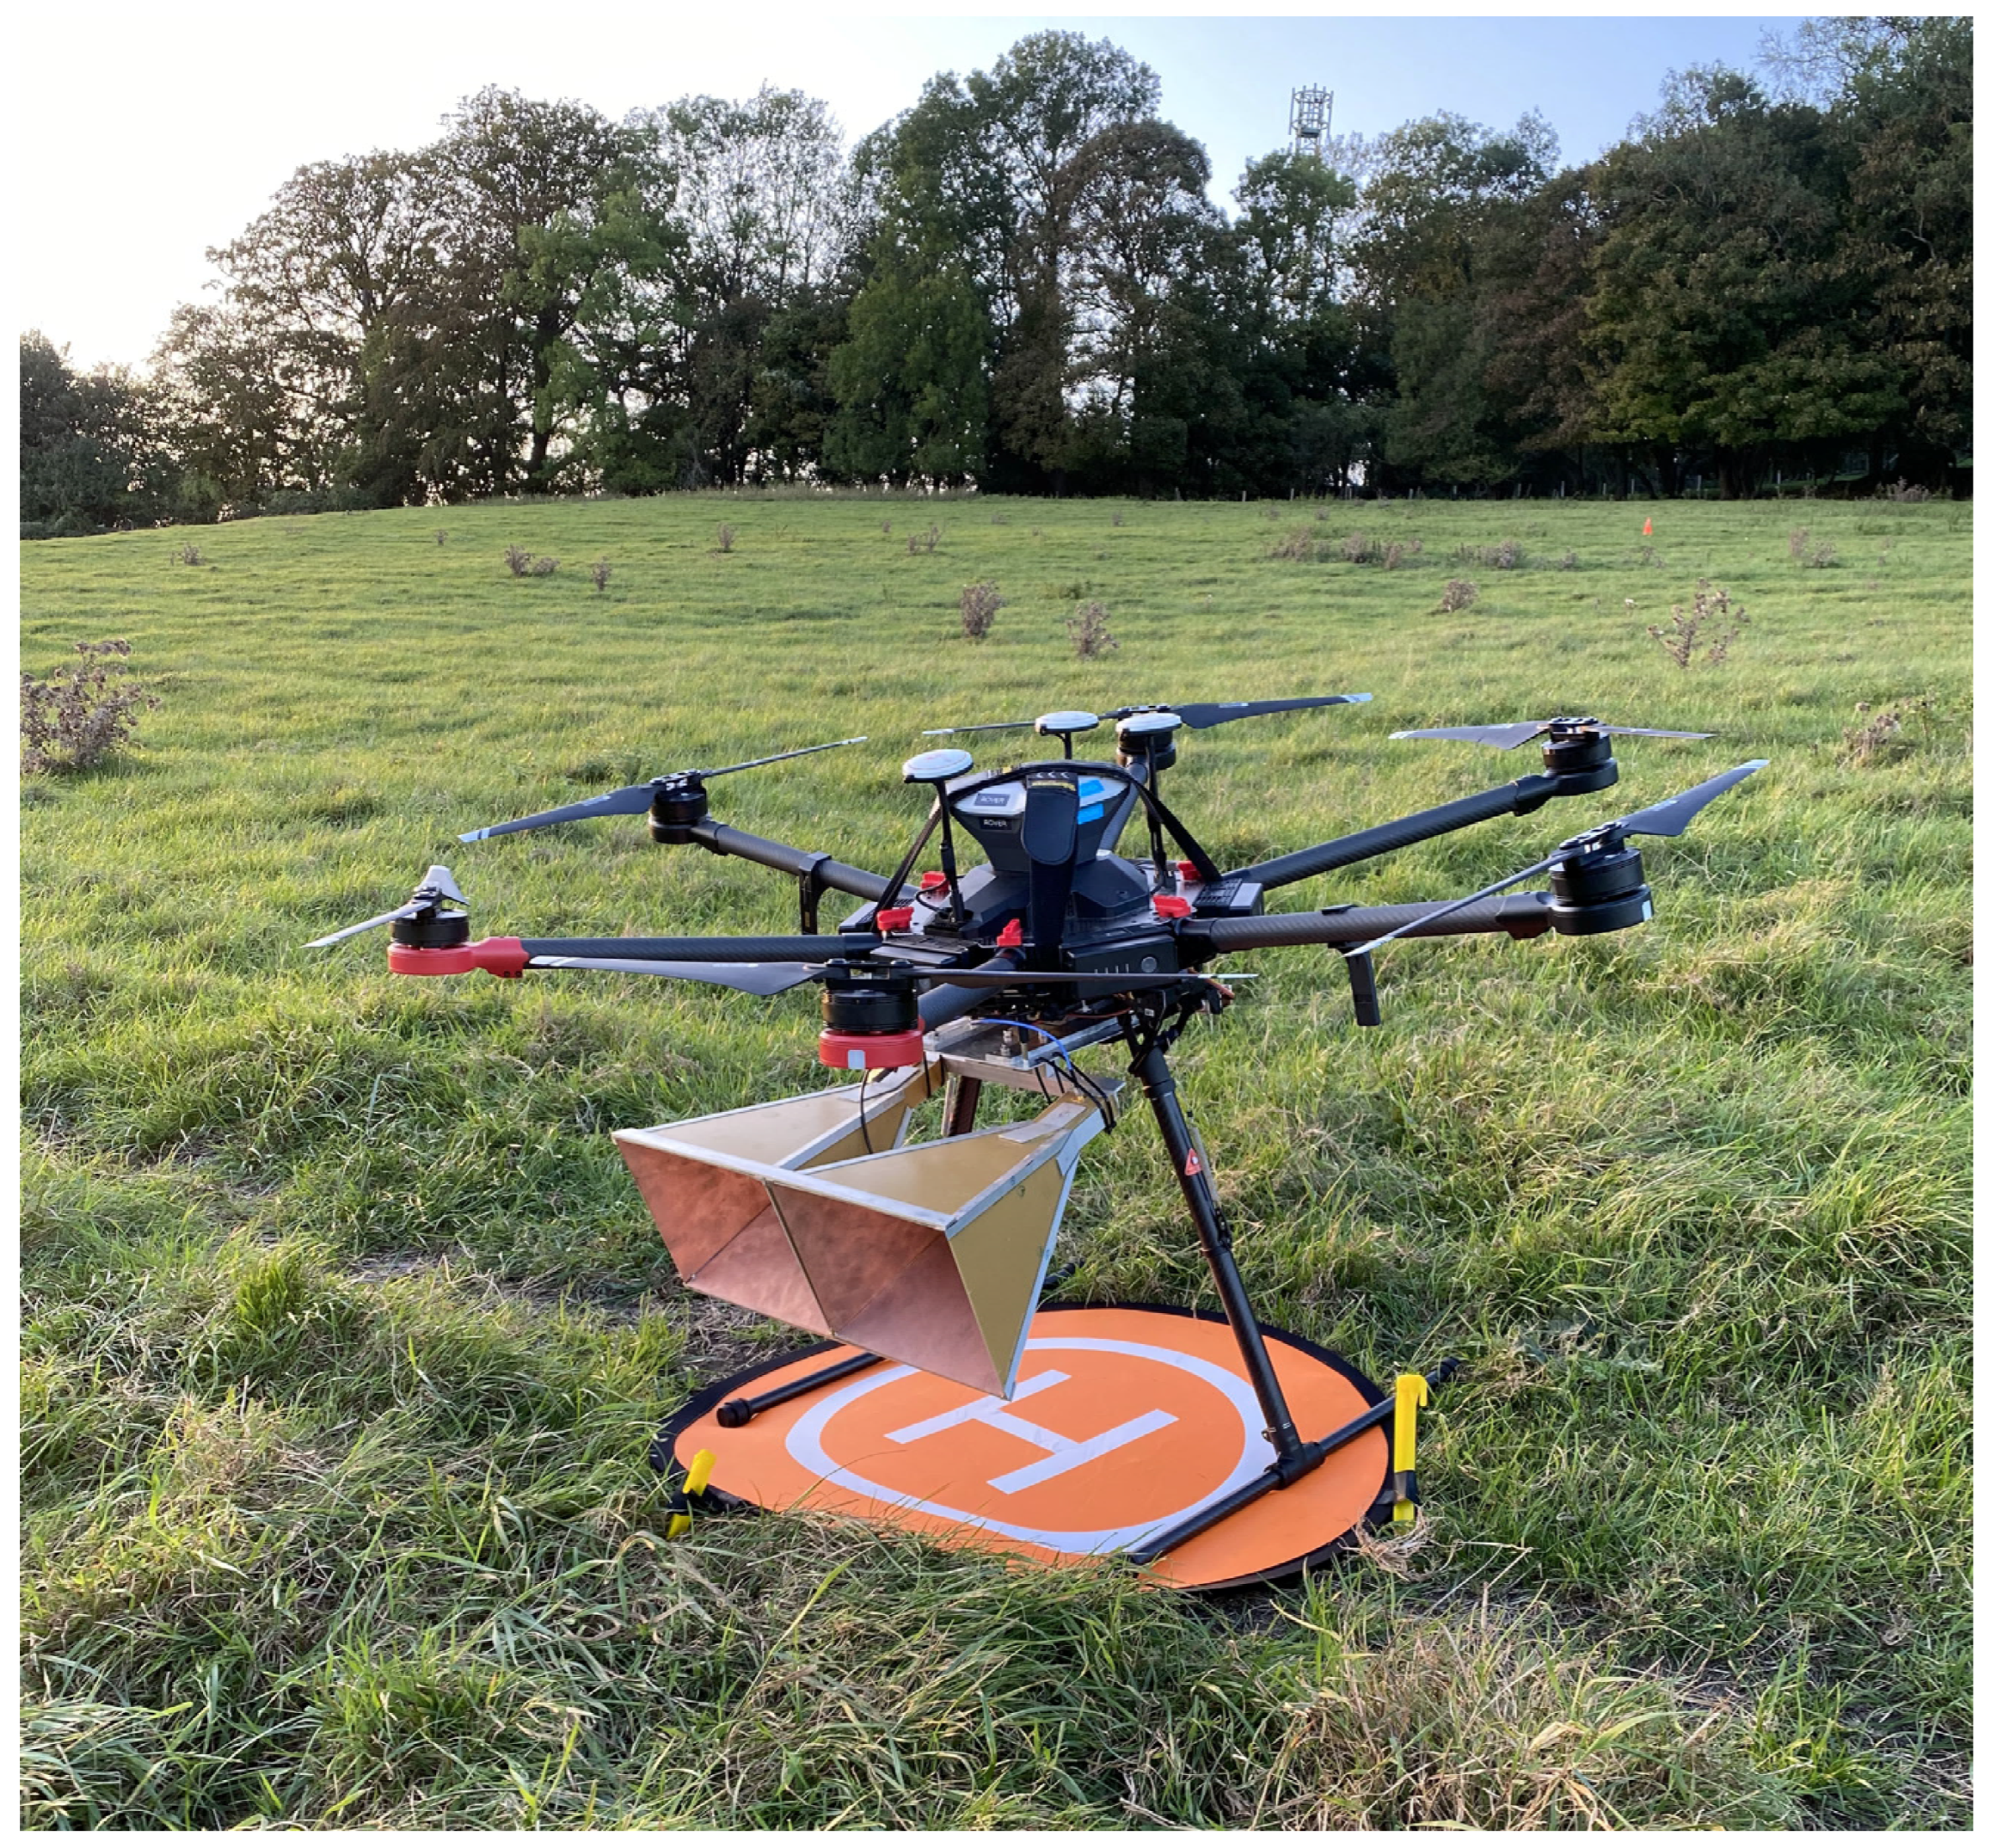
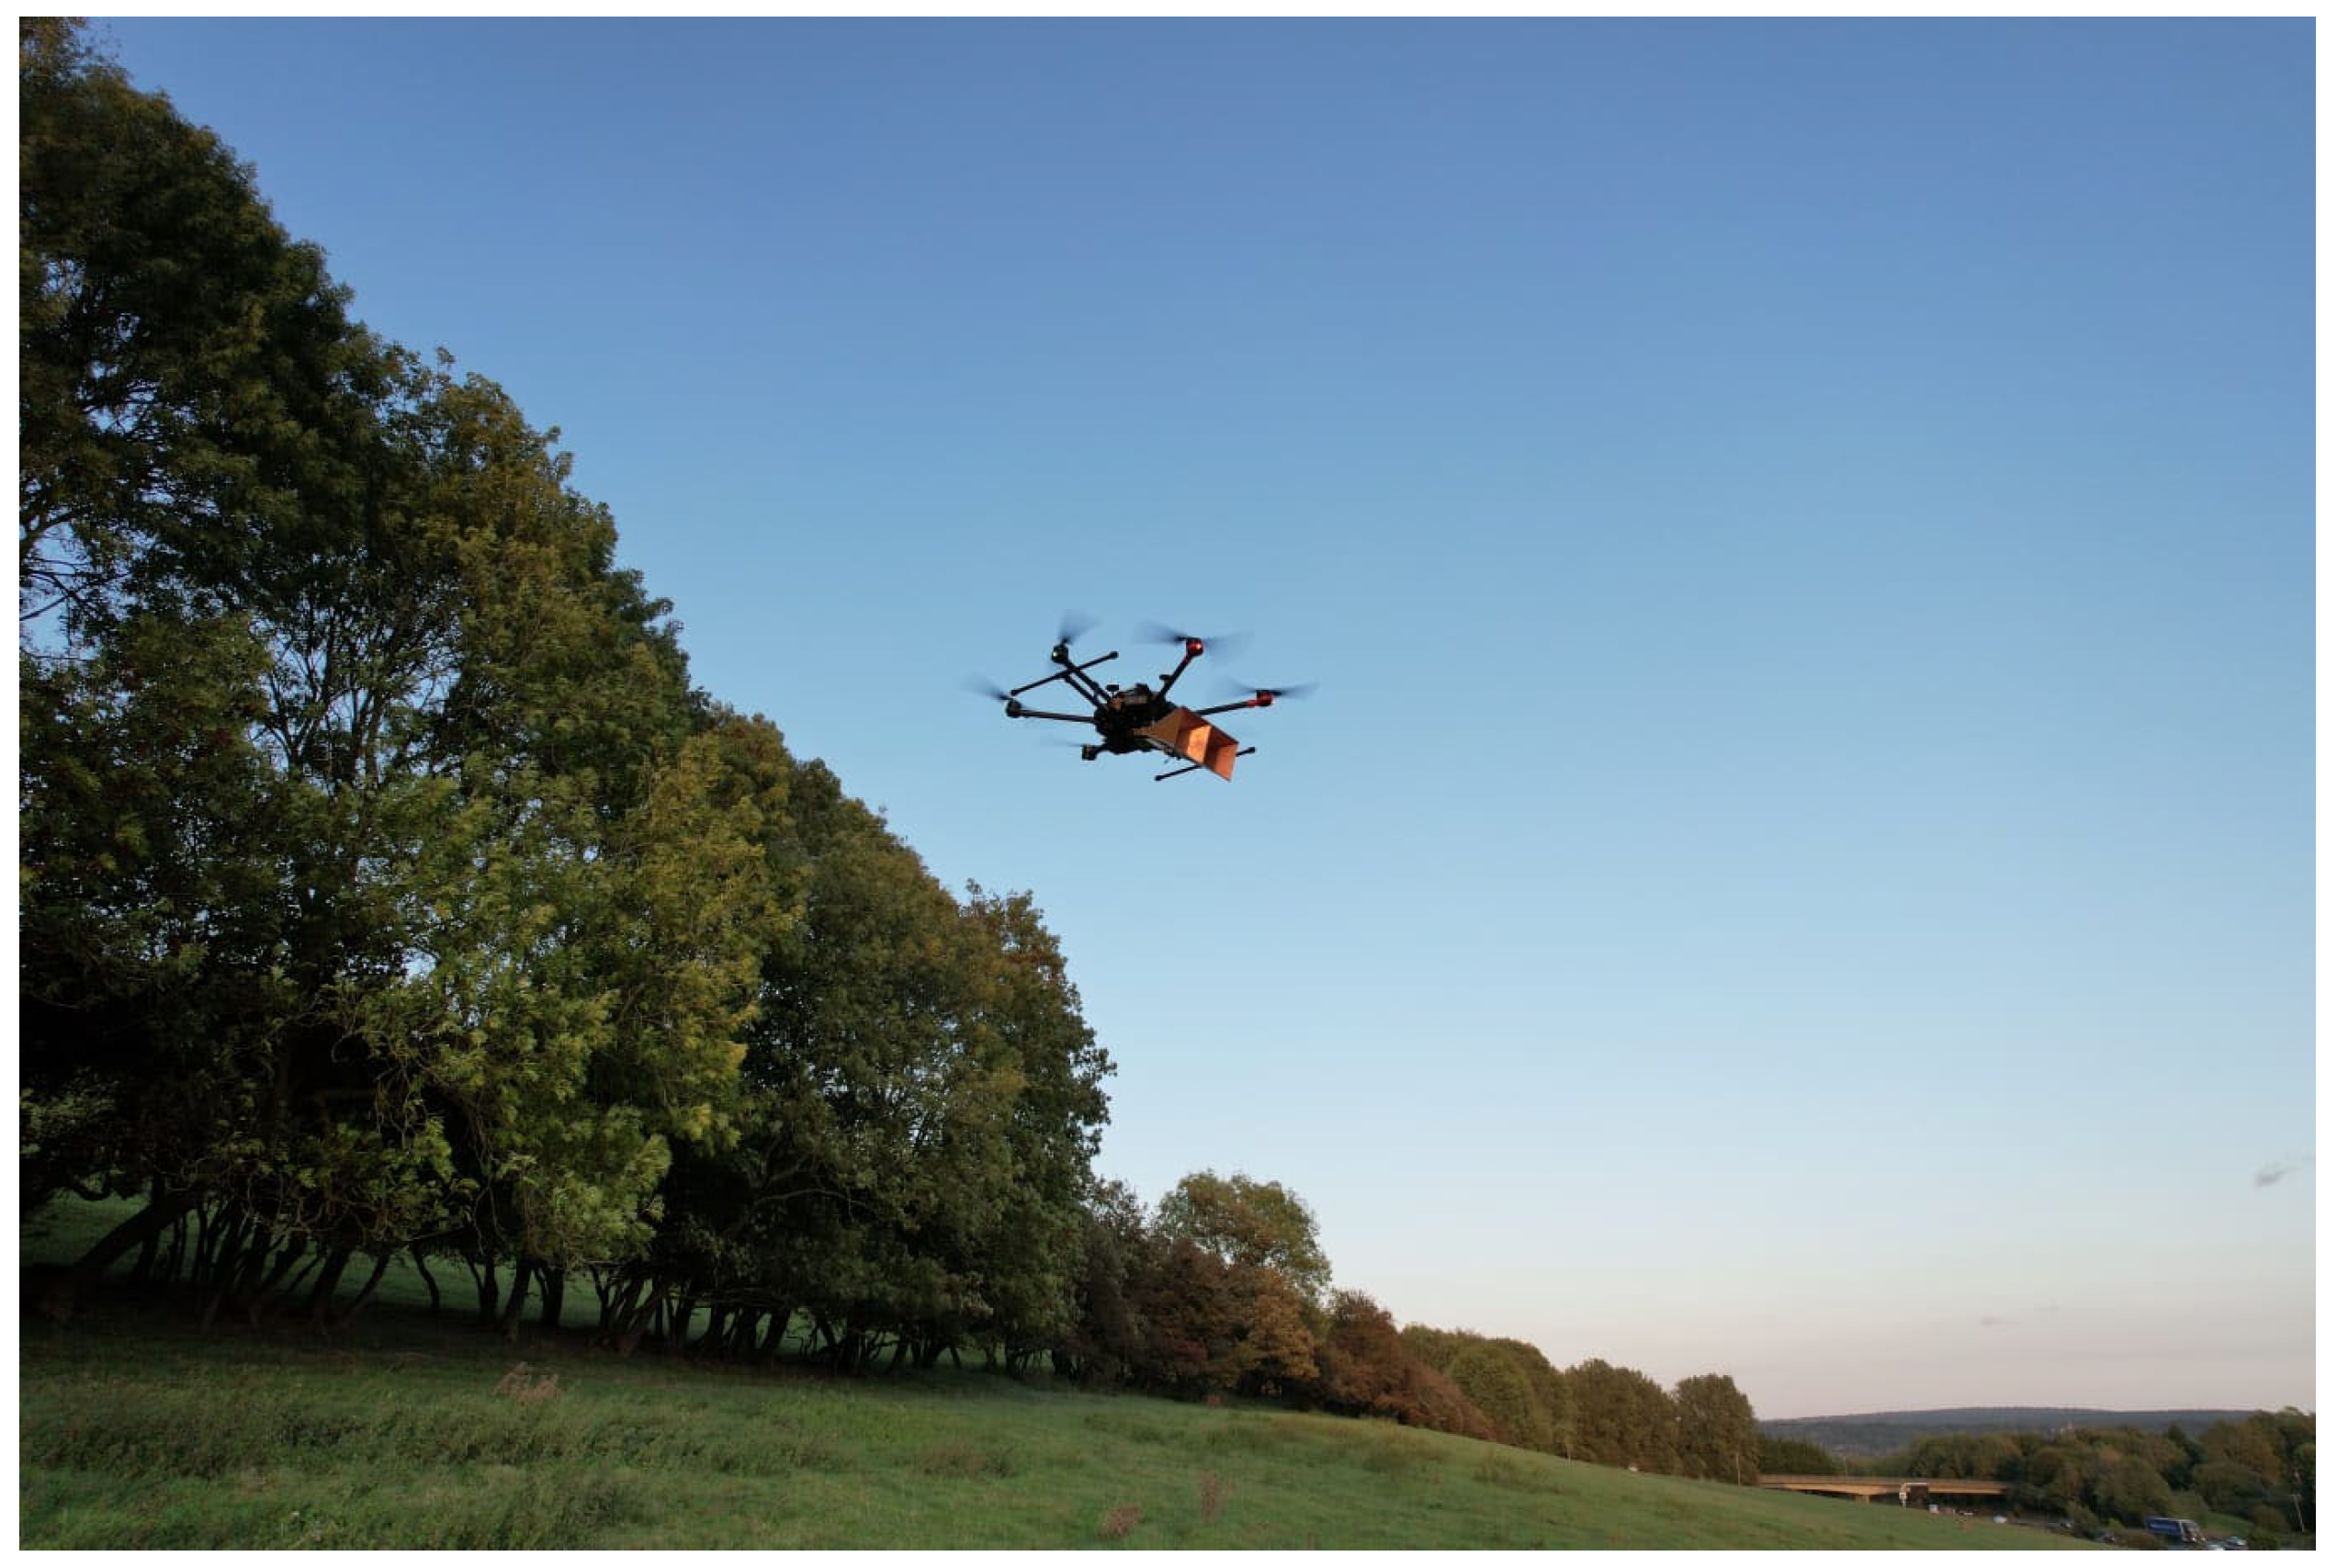
Figure 16 shows the drone radar system in-flight at Flint Hall Farm. The following preliminary results are noted from the fieldwork:
  • Flight duration: the drone demonstrated an average maximum flight duration of 21 min with the 3.5 kg payload attached. Any variability in the flight duration is attributed to varied atmospheric conditions, such as wind speeds and atmospheric pressure.
  • Flight stability: the drone demonstrated safe and stable flight at low to medium speeds with the payload attached. The hexacopter efficiently distributes the additional weight and maintains stability in windy conditions.

4.2. SAR Image

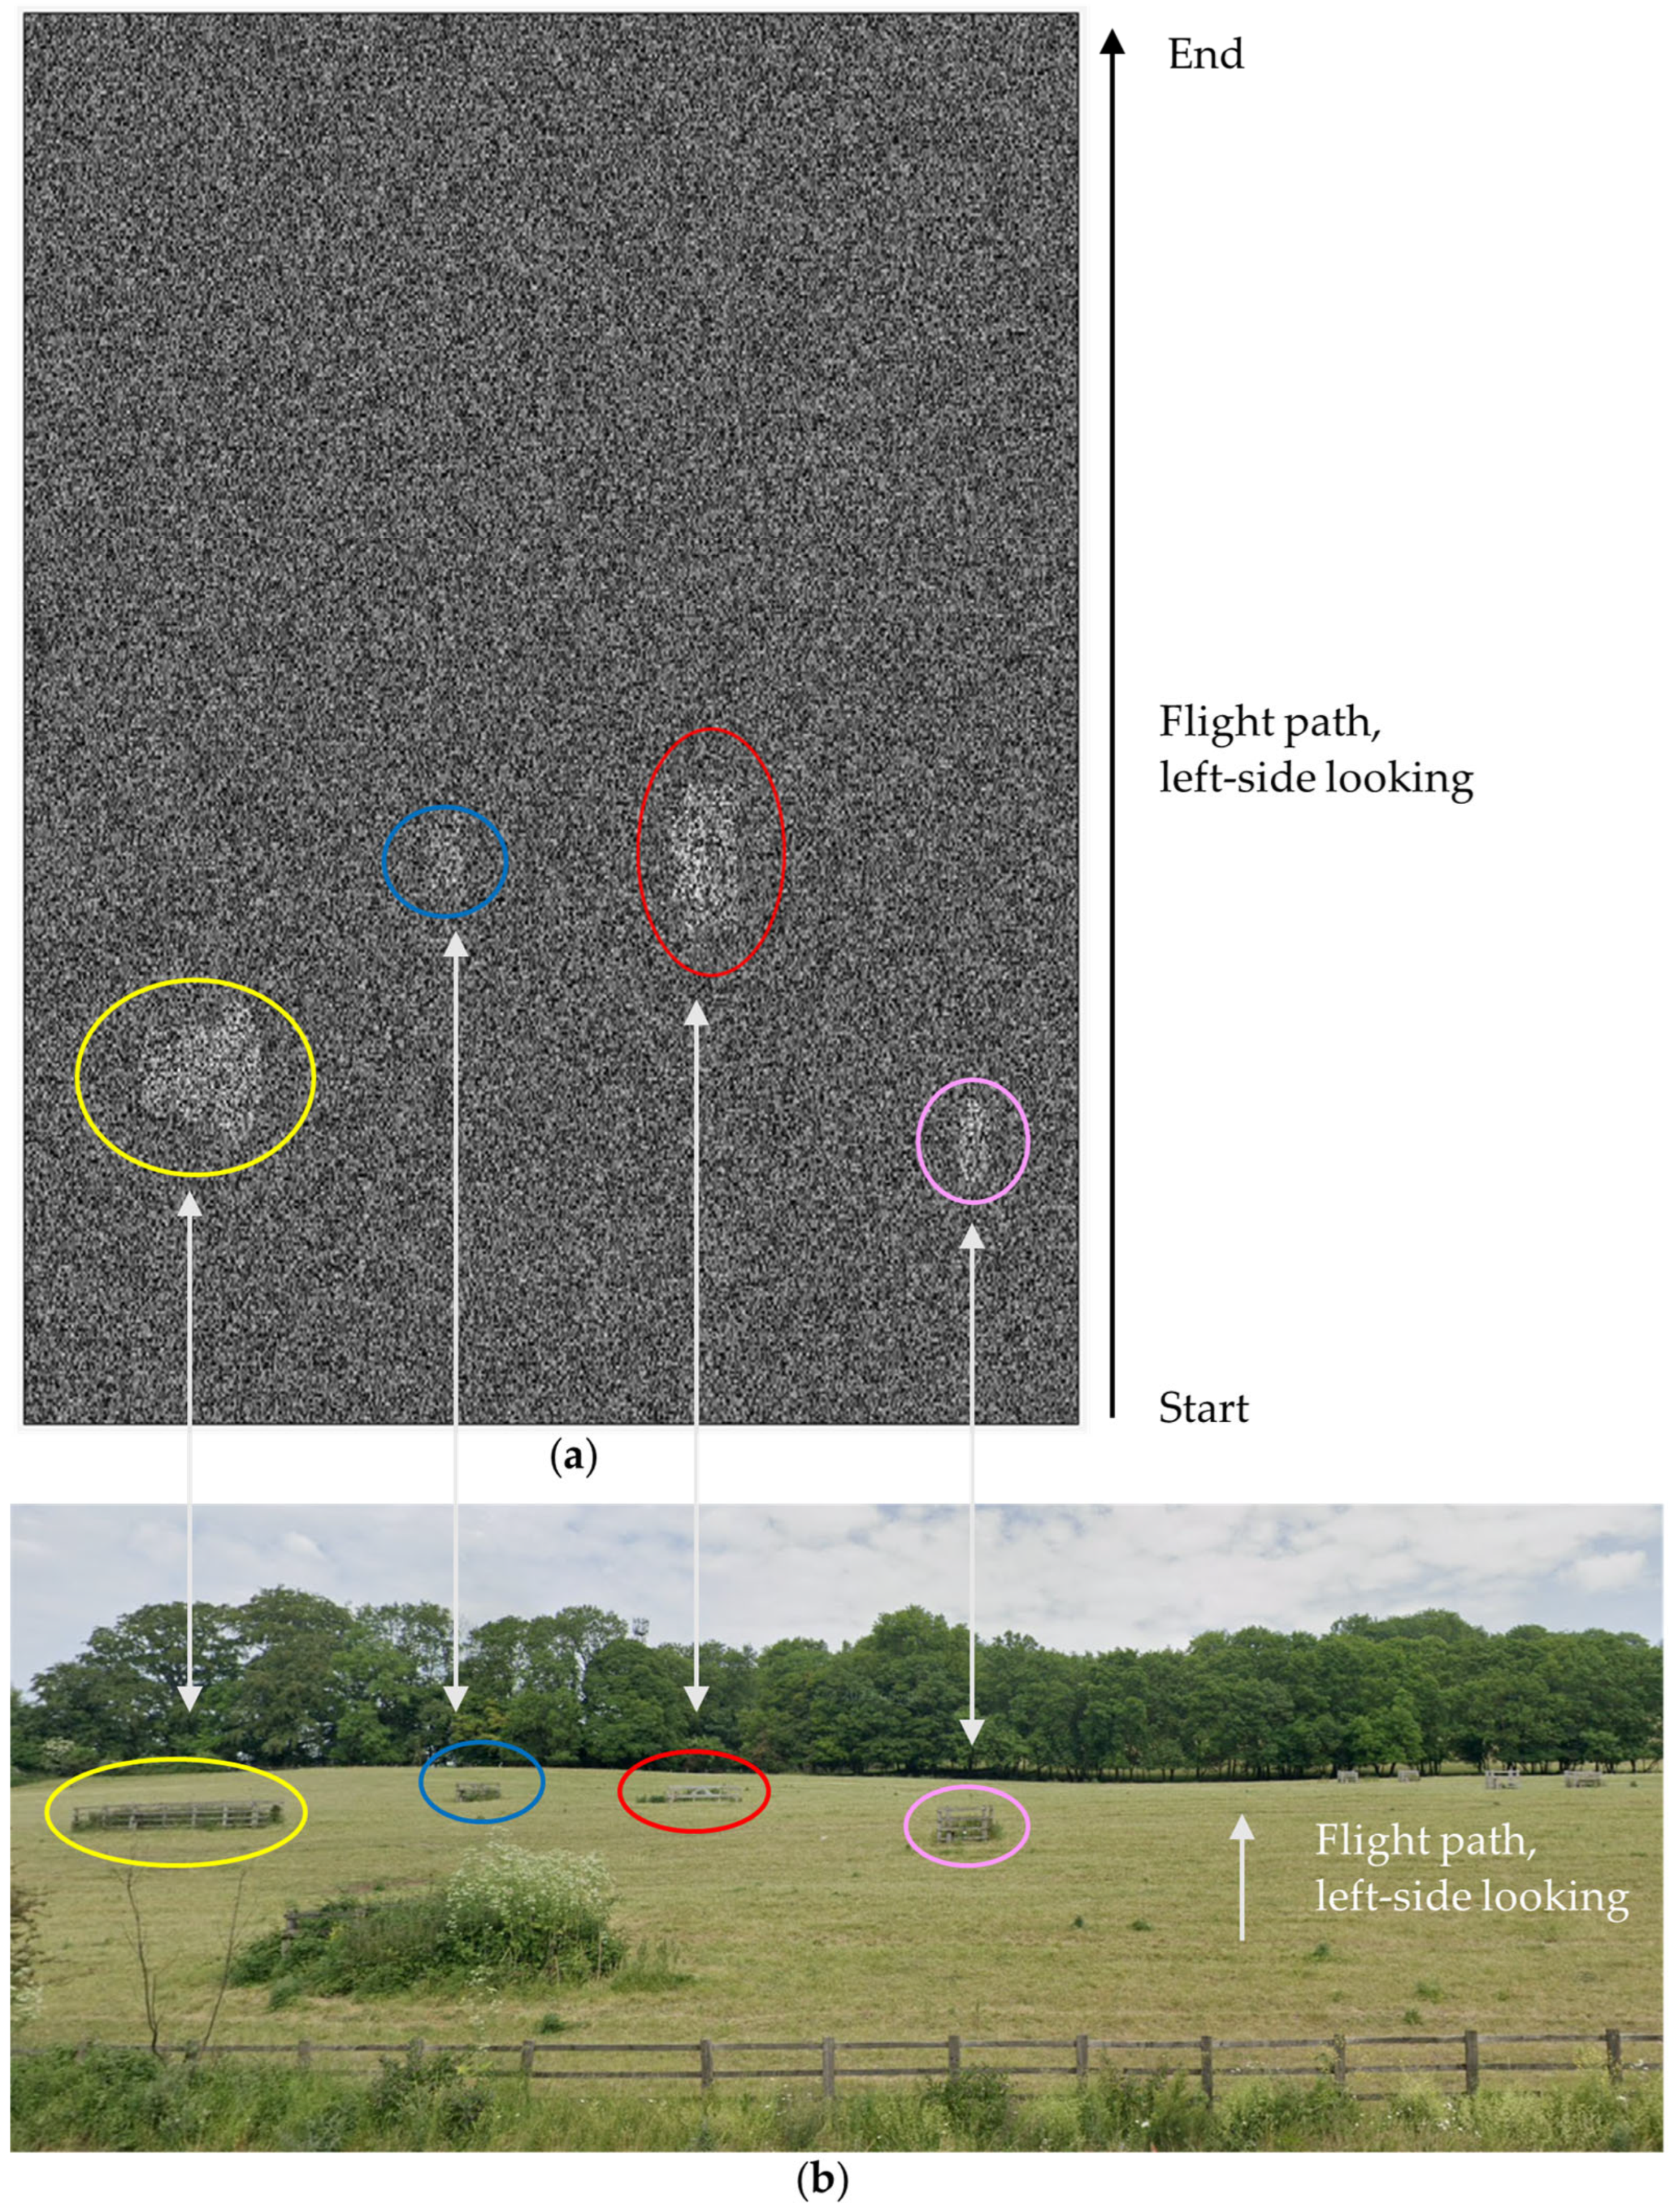
The raw FMCW radar data collected from Flint Hall Farm are post-processed using the RMA to produce the first SLC SAR image from the drone radar system (Figure 17). The SAR image does not utilise multilook processing and thus maintains the raw radar spatial resolution and speckled effect. The drone flight path aligns with the right-hand axis of the SAR image—left-looking from the bottom-right to the top-right of the image. Within the radar Field of View (FOV) are several strong and stable radar reflectors, which are discrete and separate targets on the slope. This includes the corner reflectors (red) and other fenced areas for in situ instrumentation (yellow, blue and pink). These targets are visible as bright spots within the SAR image, with their size and positioning as expected. The corner reflectors provide the brightest pixels of these targets, thus indicating a strong radar signal return. The grass and vegetated areas surrounding the targets and towards the top half of the SAR image are shown as a natural speckle.

5. Discussion

Conducting landslide assessments along transportation corridors is essential for the sustainability of critical infrastructure. Remote sensing provides a more automated approach compared to traditional in situ monitoring and quantification methods, with improved spatial coverage and data accuracies. In particular, InSAR has been shown to have potential applications across the geophysical and civil engineering domains, including the identification and monitoring of landslide movements [3,4,5,6,7,8,9,10]. The resultant landslide inventories may inform early-warning prediction models, road maintenance and hazard mitigation procedures.
Downscaling InSAR from satellite to drone platforms will provide improved spatial–temporal data resolutions and operational flexibility. Several authors have demonstrated drone radar systems with SAR imaging capabilities [11,12,13,14,15]; however, only one group of authors has demonstrated multi-pass drone InSAR [21,22], and their investigations are short-term with a limited temporal range and separation of input data. Long-term, multi-temporal, multi-pass drone InSAR is yet to be demonstrated in the literature and is the motivation for the development of our drone radar system.
Regarding the hardware development, like the other drone radar systems that utilise this model [15,16,17,18,19,21,22], the DJI Matrice 600 Pro demonstrates good flight durations and stability whilst carrying the 3.5 kg radar payload. The Raspberry Pi SBC provides a novel method for controlling the non-standard radar payload, with power supplied via the drone and a voltage converter. The SAR image is the first collected using the CCL antennas presented in [24], which are themselves a novel invention, thus validating this custom hardware production.
The drone SAR image presented in Figure 17 is the output of the custom GRC FMCW flowgraph and SAR RMA. Corner reflectors were installed at Flint Hall Farm to provide strong and stable radar reflectors in this rural location and support the investigation of landslide deformation using satellite InSAR. Following the examples of other drone radar systems in the literature [14,15,22], the corner reflectors were subsequently utilised as targets for the drone SAR imaging. The fenced area for the corner reflectors is approximately 4 × 4 m; the blue and pink targets in Figure 17 are both approximately 3 × 3 m; and the yellow target is approximately 10 × 3.5 m. The drone SAR image provides an improved centimetric spatial resolution compared to satellite SAR, which is useful for the identification of these features and micro-scale analysis. The size and positioning of these targets were used for a ground-truth comparison to assess the accuracy of the SAR data, with results as expected. Furthermore, drone flight instabilities may introduce phase errors which impact the SAR image accuracy. To account for this potential source of error, an accuracy assessment of the automated GPS flight path was conducted using the fixed GNSS data with millimetre accuracy. This yielded a maximum horizontal and vertical flight path deviation of 5 and 10 mm, respectively, which is deemed to have a negligible effect on the SAR image accuracy and quality beyond some minor distortions, which are somewhat inevitable.
Figure 18 presents the average SAR amplitude for Flint Hall Farm from Sentinel-1, from the date of the corner reflector installation in September 2021 until September 2023. Strong and stable radar reflectors such as buildings and motorway overbridges appear as bright pixels. The zoomed-in image for Flint Hall Farm shows that the corner reflectors and other instrumentation appear as a grouped blur of bright pixels of approximately 50 × 120 m, given the 5 × 20 m spatial resolution of the Sentinel-1 sensor. It is also assumed that the very high radar return from the corner reflectors contributed to the saturation of nearby pixels to create this oversized vertical blur. Discrete target identification is not possible for small and closely spaced objects at this spatial resolution. Figure 19 provides a side-by-side comparison of the satellite and drone SAR images; the group of blurred pixels in the former is visible as individual targets in the latter due to the improved spatial resolution. Whilst this comparison of drone and satellite SAR utilises Sentinel-1 data for the latter, the spatial resolutions of satellite Stripmap and ScanSAR sensors range between 3 and 100 m [43,44,45,46,47,48,49,50,51]. The sub-meter spatial resolutions of COSMO-SkyMed Second Generation (CSG) and PAZ are only available in the spotlight imaging mode, which provides a narrower swath width, and with data only freely available for scientific research and application development upon acceptance of a project proposal, rather than commercial use [44,46].
The landslide in December 2000 that initiated the ongoing monitoring of Flint Hall Farm was triggered by excessive winter rainfall. As stated, the Flint Hall Farm Landslide is a wedge failure within the Gault Clay activated by high groundwater levels, whilst the Flint Hall Farm South Landslide is a dormant creep movement with occasional reactivation during wet conditions [25]. Seasonal landslide movements are often attributed to changes in the water level [8], as such it is desirable to monitor landslides pre-, during (if safe) and post-rainfall. The drone radar system may be deployed on a sub-daily basis for the creation of a detailed deformation time-series surrounding weather events; this may inform early-warning prediction models and hazard mitigation procedures. The temporal resolution of satellite SAR is dictated by orbital patterns and is often restricted to days or weeks, thus preventing the creation of such a detailed time-series.
Regarding the research and development timeline outlined in the Introduction, this case study demonstrates drone SAR imaging, which satisfies points one and two. For the monitoring of the landslide movement, ongoing and future work addresses points three and four of the timeline and includes repeat-pass SAR data collection at Flint Hall Farm, and developing the InSAR processing chain for the drone SAR data. Equation (4) outlines the phase change ( Δ φ ) contributors in typical satellite InSAR processing:
Δ φ = φ f l a t + φ t o p o + φ o r b i t + φ d e f o + φ t r o p o + φ i o n o + φ s c a t + φ n o i s e
where φ f l a t (flat earth) and φ t o p o (topographic) are geometric terms, which for satellite InSAR are typically corrected using a satellite-derived Digital Elevation Model (DEM). The commonly utilised National Aeronautics and Space Administration (NASA) Shuttle Radar Topography Mission (SRTM) DEM has a 30 m spatial resolution; for drone InSAR, a finer spatial resolution is required to match the drone SAR data resolution. This will be derived from either single-pass drone InSAR or third-party products from suppliers such as AW3D, who provide sub-metre resolutions. φ o r b i t is the phase change arising from deviations in the satellite orbit, which is corrected using the precise orbit data. For drone InSAR, flight paths will be corrected using the fixed GNSS data with millimetric accuracy. φ t r o p o (troposphere) and φ i o n o (ionosphere) are atmospheric phase contributors, which are typically corrected using spatial filtering. For drone InSAR, the shorter atmospheric range will reduce the attenuation potential and thus the effect of these two variables. Furthermore, spatial filtering will take place over smaller areas and potentially with higher frequency radar signals with different attenuation potentials. It is anticipated that the atmospheric contribution will be negligible. φ s c a t (scattering) and φ n o i s e are negligible phase contributors associated with the target characteristics and signal processing. φ d e f o (deformation) is the phase signal of interest, which informs the detection of relative changes in distance between the sensor and target, once all other phase contributors are accounted for. Once developed, this adapted InSAR processing chain will inform the detection of any landslide activity and movement, which is typically subsidence. For other geotechnical hazards and infrastructure, multi-pass SAR data collection will be required for the InSAR processor to output meaningful deformation data.

6. Conclusions

We have demonstrated the first SAR image from our drone radar system at Flint Hall Farm. The site is situated adjacent to the M25 and contains several landslide systems that pose a significant geohazard risk to this critical infrastructure. Conducting landslide assessments along transportation corridors is essential to the sustainability of critical infrastructure. The site has been routinely monitored by geotechnical engineers following a landslide that encroached onto the hard shoulder in December 2000. InSAR has been widely used to identify potential landslides and monitor millimetric rates of surface deformation. Downscaling InSAR from satellites to drones will provide improved spatial–temporal data resolutions and operational flexibility. This transition is made possible by recent technological advancements in drones and SDR processing power.
Long-term, multi-temporal and multi-pass drone InSAR is still yet to be demonstrated in the literature and is the motivation for the development of our drone radar system. The goal of this research is the downscaling of InSAR from satellites to drones, and the first step in achieving this is demonstrating drone SAR imaging. This case study demonstrates the functionality of the developed drone radar system in acquiring SAR imagery that will be used in downstream InSAR processing for deformation monitoring of the landslide at Flint Hall Farm and other geotechnical hazards and infrastructure. The drone SAR image from Flint Hall Farm is a novel achievement and provides an improved spatial resolution compared to satellite SAR. Discrete targets on the landslide slope are visible as bright pixels (Figure 17). Ongoing and future work includes repeat-pass SAR data collection and developing the InSAR processing chain for drone SAR data to provide meaningful deformation outputs for the landslides and other geotechnical hazards and infrastructure.
The main contributions of this work include:
  • The first SAR image from our drone radar system. This is a newly developing field of remote sensing research, with few authors demonstrating similar systems. The image validates our custom and novel hardware production of CCL radar horn antennas.
  • A comparison of the drone SAR image and Sentinel-1 SAR shows that the former provides an improved centimetric spatial resolution compared to the meter-level resolution of the latter. This is useful for the identification and imaging of small and closely spaced targets, such as the corner reflectors and in situ instrumentation at Flint Hall Farm.
  • A complete overview of the hardware and software development for the drone radar system; other demonstrations of drone radar systems in the literature do not provide such a comprehensive account.

Author Contributions

Conceptualization, A.C., J.A.L., P.J.M., R.G. and S.A.; methodology, A.C., J.A.L. and S.A.; software, A.C.; validation, A.C.; formal analysis, A.C.; investigation, A.C. and S.A.; resources, A.C.; data curation, A.C.; writing—original draft preparation, A.C.; writing—review and editing, A.C., J.A.L., P.J.M., R.G. and S.A.; visualization, A.C.; supervision, J.A.L., P.J.M. and R.G.; project administration, A.C. and J.A.L.; funding acquisition, A.C., J.A.L. and S.A. All authors have read and agreed to the published version of the manuscript.

Funding

This research was funded by the Nuclear Liabilities Fund (NLF) via EDF Energy.

Data Availability Statement

The original contributions presented in the study are included in the article, further inquiries can be directed to the corresponding author.

Acknowledgments

The authors acknowledge the landowners at Flint Hall Farm for providing us with access to install the corner reflectors and conduct the drone flights.

Conflicts of Interest

The authors declare no conflicts of interest.

References

  1. Davies, J.P.; Loveridge, F.A.; Perry, J.; Patterson, D.; Carder, D. Stabilisation of a landslide on the M25 highway London’s main artery. In Proceedings of the 12th Pan-American Conference on Soil Mechanics and Geotechnical Engineering, Boston, MA, USA, 22–26 June 2003. [Google Scholar]
  2. Uys, D. InSAR: An Introduction. Preview 2016, 182, 43–48. [Google Scholar] [CrossRef]
  3. Bianchini, S.; Pratesi, F.; Nolesini, T.; Casagli, N. Building deformation assessment by means of persistent scatterer interferometry analysis on a landslide-affected area: The Volterra (Italy) case study. Remote Sens. 2015, 7, 4678–4701. [Google Scholar] [CrossRef]
  4. O’Connor, W.; Mider, G.; Lawrence, J.A.; Agar, S.; Mason, P.J.; Ghail, R.; Scoular, J. An Investigation into Ground Movement on the Ventnor Landslide Complex, UK Using Persistent Scatterer Interferometry. Remote Sens. 2021, 13, 3711. [Google Scholar] [CrossRef]
  5. Rosi, A.; Tofani, V.; Tanteri, L.; Stefanelli, C.T.; Agostini, A.; Catani, F.; Casagli, N. The new landslide inventory of Tuscany (Italy) updated with PS-InSAR: Geomorphological features and landslide distribution. Landslides 2018, 15, 5–19. [Google Scholar] [CrossRef]
  6. Kang, Y.; Zhao, C.; Zhang, Q.; Lu, Z.; Li, B. Application of InSAR Techniques to an Analysis of the Guanling Landslide. Remote Sens. 2017, 9, 1046. [Google Scholar] [CrossRef]
  7. Carla, T.; Intrieri, E.; Raspini, F.; Bardi, F.; Farina, P.; Ferretti, A.; Colombo, D.; Novali, F.; Casagli, N. Perspectives on the prediction of catastrophic slope failures from satellite InSAR. Sci. Rep. 2019, 9, 18773. [Google Scholar] [CrossRef] [PubMed]
  8. Liu, P.; Li, Z.; Hoey, T.; Kincal, C.; Zhang, J.; Zeng, Q.; Muller, J.-P. Using advanced InSAR time series techniques to monitor landslide movements in Badong of the Three Gorges region, China. Int. J. Appl. Earth Obs. Geoinf. 2013, 21, 253–264. [Google Scholar] [CrossRef]
  9. Nefros, C.; Alatza, S.; Loupasakis, C.; Kontoes, C. Persistent Scatterer Interferometry (PSI) Technique for the Identification and Monitoring of Critical Landslide Areas in a Regional and Mountainous Road Network. Remote Sens. 2023, 15, 1550. [Google Scholar] [CrossRef]
  10. Yi, Y.; Xu, X.; Xu, G.; Gao, H. Landslide Detection Using Time-Series InSAR Method along the Kangding-Batang Section of Shanghai-Nyalam Road. Remote Sens. 2023, 15, 1452. [Google Scholar] [CrossRef]
  11. Li, C.J.; Ling, H. Synthetic Aperture Radar Imaging Using a Small Consumer Drone. In Proceedings of the 2015 IEEE International Symposium on Antennas and Propagation & USNC/URSI National Radio Science Meeting, Vancouver, BC, Canada, 19–24 July 2015. [Google Scholar]
  12. Li, C.J.; Ling, H. High-Resolution, Downward-Looking Radar Imaging Using a Small Consumer Drone. In Proceedings of the 2016 IEEE International Symposium on Antennas and Propagation (APSURSI), Fajardo, PR, USA, 26 June–1 July 2016; pp. 2037–2038. [Google Scholar]
  13. Deguchi, T.; Sugiyama, T.; Kishimoto, M. On the Development of Ground-Based and Drone-Borne Radar System. In Recent Research on Engineering Geology and Geological Engineering, Proceedings of the 2nd GeoMEast International Congress and Exhibition on Sustainable Civil Infrastructures; Springer: Cham, Switzerland, 2018; pp. 115–122. [Google Scholar]
  14. Deguchi, T.; Sugiyama, T.; Kishimoto, M. Development of SAR system installable on a drone. In Proceedings of the EUSAR 2021: 13th European Conference on Synthetic Aperture Radar, Online, 29–31 April 2021. [Google Scholar]
  15. Deguchi, T.; Sugiyama, T.; Kishimoto, M. R&D of drone-borne SAR system. Int. Arch. Photogramm. Remote Sens. Spat. Inf. Sci. 2019, 42, 263–267. [Google Scholar]
  16. Dill, S.; Schreiber, E.; Engel, M.; Heinzel, A.; Peichl, M. A drone carried multichannel Synthetic Aperture Radar for advanced buried object detection. In Proceedings of the 2019 IEEE Radar Conference (RadarConf), Boston, MA, USA, 22–26 April 2019. [Google Scholar]
  17. Engel, M.; Heinzel, A.; Schreiber, E.; Dill, S.; Peichl, M. Recent results of a UAV-based Synthetic Aperture Radar for remote sensing applications. In Proceedings of the EUSAR 2021; 13th European Conference on Synthetic Aperture Radar, Online, 29–31 April 2021. [Google Scholar]
  18. Brotzer, P.; Domínguez, E.M.; Henke, D. Prototype of a Small, Agile, Drone-Based SAR System and Preliminary Focusing Results. In Proceedings of the 2021 IEEE International Geoscience and Remote Sensing Symposium IGARSS, Brussels, Belgium, 12–16 July 2021. [Google Scholar]
  19. Moreira, L.; Castro, F.; Góes, J.A.; Bins, L.; Teruel, B.; Fracarolli, J.; Castro, V.; Alcântara, M.; Oré, G.; Luebeck, D.; et al. A drone-borne multiband DInSAR: Results and applications. In Proceedings of the 2019 IEEE Radar Conference (RadarConf), Boston, MA, USA, 22–26 April 2019. [Google Scholar]
  20. Moreira, L.; Lübeck, D.; Wimmer, C.; Castro, F.; Góes, J.A.; Castro, V.; Alcântara, M.; Oré, G.; Oliveira, L.P.; Bins, L.; et al. Drone-Borne P-Band Single-Pass InSAR. In Proceedings of the 2020 IEEE Radar Conference (RadarConf20), Florence, Italy, 21–25 September 2020. [Google Scholar]
  21. Oré, G.; Alcântara, M.S.; Góes, J.A.; Oliveira, L.P.; Yepes, J.; Teruel, B.; Castro, V.; Bins, L.S.; Castro, F.; Luebeck, D.; et al. Crop Growth Monitoring with Drone-Borne DInSAR. Remote Sens. 2020, 12, 615. [Google Scholar] [CrossRef]
  22. Luebeck, D.; Wimmer, C.; Moreira, L.F.; Alcântara, M.; Oré, G.; Góes, J.A.; Oliveira, L.P.; Teruel, B.; Bins, L.S.; Gabrielli, L.H.; et al. Drone-Borne Differential SAR Interferometry. Remote Sens. 2020, 12, 778. [Google Scholar] [CrossRef]
  23. Sanz, M.; Fedorov, K.G.; Deppe, F.; Solano, E. Challenges in open-air microwave quantum communication and sensing. In Proceedings of the 2018 IEEE Conference on Antenna Measurements & Applications (CAMA), Västerås, Sweden, 3–6 September 2018. [Google Scholar]
  24. Carpenter, A.; Lawrence, J.A.; Ghail, R.; Mason, P.J. The Development of Copper Clad Laminate Horn Antennas for Drone Interferometric Synthetic Aperture Radar. Drones 2023, 7, 215. [Google Scholar] [CrossRef]
  25. Atkins. M25 Godstone Landslides Walkover & Monitoring: Phase 1–Site Walkover and Geomorphological Mapping Report; Atkins: London, UK, 2020. [Google Scholar]
  26. Ellis, L.A.; Harrison, E.; Bowden, A.J. Landslides on Gault: Geomorphological identification and qualitative risk assessment. Q. J. Eng. Geol. Hydrogeol. 2011, 44, 35–48. [Google Scholar] [CrossRef]
  27. Atkins. Rooks Nest Farm Landslide Assessment; Atkins: London, UK, 2012. [Google Scholar]
  28. Forster, A.; Hobbs, P.R.N.; Cripps, A.C.; Entwistle, D.C.; Fenwick, S.M.M.; Raines, M.R.; Hallam, J.R.; Jones, L.D.; Self, S.J.; Meakin, J.L. Engineering Geology of British Rocks and Soil: Gault Clay; British Geological Survey: Nottingham, UK, 1994.
  29. Garrett, C.; Barnes, S.J. The design and performance of the Dunton Green retaining wall. Geotechnique 1984, 34, 533–548. [Google Scholar] [CrossRef]
  30. Mouchel & Partners Ltd. M25 Improvements Between Junction 2 and Junction 8; Highways Agency: Guildford, UK, 1991.
  31. Garthwaite, M.; Nancarrow, S.; Hislop, A.; Thankappan, M.; Dawson, J.; Lawrie, S. Design of Radar Corner Reflectors for the Australian Geophysical Observing System; Geoscience Australia: Symonston, Australia, 2015; Volume 3.
  32. Ettus Research. E310/E312. 2023. Available online: https://kb.ettus.com/E310/E312 (accessed on 16 May 2024).
  33. DJI. Support for Matrice 600 Pro. DJI. 2024. Available online: https://www.dji.com/uk/support/product/matrice600-pro (accessed on 16 May 2024).
  34. Chen, Z.N.; Qing, X.; Sun, M.; Gong, K.; Hong, W. 60-GHz antennas on PCB. In Proceedings of the 8th European Conference on Antennas and Propagation (EuCAP 2014), The Hague, The Netherlands, 6–11 April 2014. [Google Scholar]
  35. Walbeoff, A.; Langley, R.J. Multiband PCB antenna. IEE Proc.-Microw. Antennas Propag. 2005, 52, 471–475. [Google Scholar] [CrossRef]
  36. Ren, W.; Deng, J.Y.; Chen, K.S. Compact PCB monopole antenna for UWB applications. J. Electromagn. Waves Appl. 2007, 21, 1411–1420. [Google Scholar] [CrossRef]
  37. Ghassemi, N.; Wu, K. Millimeter-wave integrated pyramidal horn antenna made of multilayer printed circuit board (PCB) process. IEEE Trans. Antennas Propag. 2012, 60, 4432–4435. [Google Scholar] [CrossRef]
  38. Wu, Q.; Scarborough, C.P.; Martin, B.G.; Shaw, R.K.; Werner, D.H.; Lier, E.; Wang, X. A Ku-Band Daul Polarization Hybrid-Mode Horn Antenna Enabled by Printed-Circuit-Board Metasurfaces. IEEE Trans. Antennas Propag. 2013, 61, 1089–1098. [Google Scholar] [CrossRef]
  39. Lashab, M.; Hraga, H.I.; Abd-Alhameed, R.A.; Zebiri, C.; Benabdelaziz, F.; Jones, S.M.R. Horn Antennas Loaded with Metamaterial for UWB Applications. In Proceedings of the Progress in Electromagnetics Research Symposium Proceedings, Marrakesh, Morocco, 20–23 March 2011. [Google Scholar]
  40. Lashab, M.; Zebiri, C.; Benabdelaziz, F.; Jan, N.A.; Abd-Alhameed, R.A. Horn antennas loaded with metamaterial for Ku band application. In Proceedings of the 2014 International Conference on Multimedia Computing and Systems (ICMCS), Marrakesh, Morocco, 14–16 April 2014. [Google Scholar]
  41. Rahman, S. Focusing Moving Targets Using Range Migration Algorithm in Ultra Wideband Low Frequency Synthetic Aperture Radar; Blekinge Institute of Technology: Karlskrona, Sweden, 2010. [Google Scholar]
  42. Hosseiny, B.; Amini, J.; Esmaeilzade, M.; Nekoee, M. Range migration algorithm in the processing chain of signals of a ground-based sar sensor. Int. Arch. Photogramm. Remote Sens. Spat. Inf. Sci. 2019, 42, 521–525. [Google Scholar] [CrossRef]
  43. European Space Agency (ESA). COSMO-SkyMed. Available online: https://earth.esa.int/eogateway/missions/cosmo-skymed (accessed on 12 February 2023).
  44. European Space Agency (ESA). COSMO-SkyMed Second Generation. Available online: https://earth.esa.int/eogateway/missions/cosmo-skymed-second-generation (accessed on 12 February 2023).
  45. European Space Agency (ESA). TerraSAR-X and TanDEM-X. Available online: https://earth.esa.int/eogateway/missions/terrasar-x-and-tandem-x (accessed on 12 February 2023).
  46. European Space Agency (ESA). PAZ. Available online: https://earth.esa.int/eogateway/missions/paz (accessed on 12 February 2023).
  47. European Space Agency (ESA). Sentinel-1 Mission Summary. Available online: https://sentinels.copernicus.eu/web/sentinel/missions/sentinel-1/overview/mission-summary#:~:text=Wave%2DMode%3A%2020%20x%2020,x%205%20m%20spatial%20resolution (accessed on 12 February 2023).
  48. Canadian Space Agency (CSA). RADARSAR Technical characteristics. 2021. Available online: https://www.asc-csa.gc.ca/eng/satellites/radarsat/technical-features/characteristics.asp (accessed on 12 February 2023).
  49. Canadian Space Agency (CSA). RADARSAT Satellites: Technical Comparison. 2021. Available online: https://www.asc-csa.gc.ca/eng/satellites/radarsat/technical-features/radarsat-comparison.asp (accessed on 12 February 2023).
  50. Japan Aerospace Exploration Agency (JAXA). ALOS-2 Project/PALSAR-2. Available online: https://www.eorc.jaxa.jp/ALOS-2/en/about/palsar2.htm (accessed on 12 February 2023).
  51. European Space Agency (ESA). SAOCOM. Available online: https://earth.esa.int/eogateway/missions/saocom (accessed on 12 February 2023).
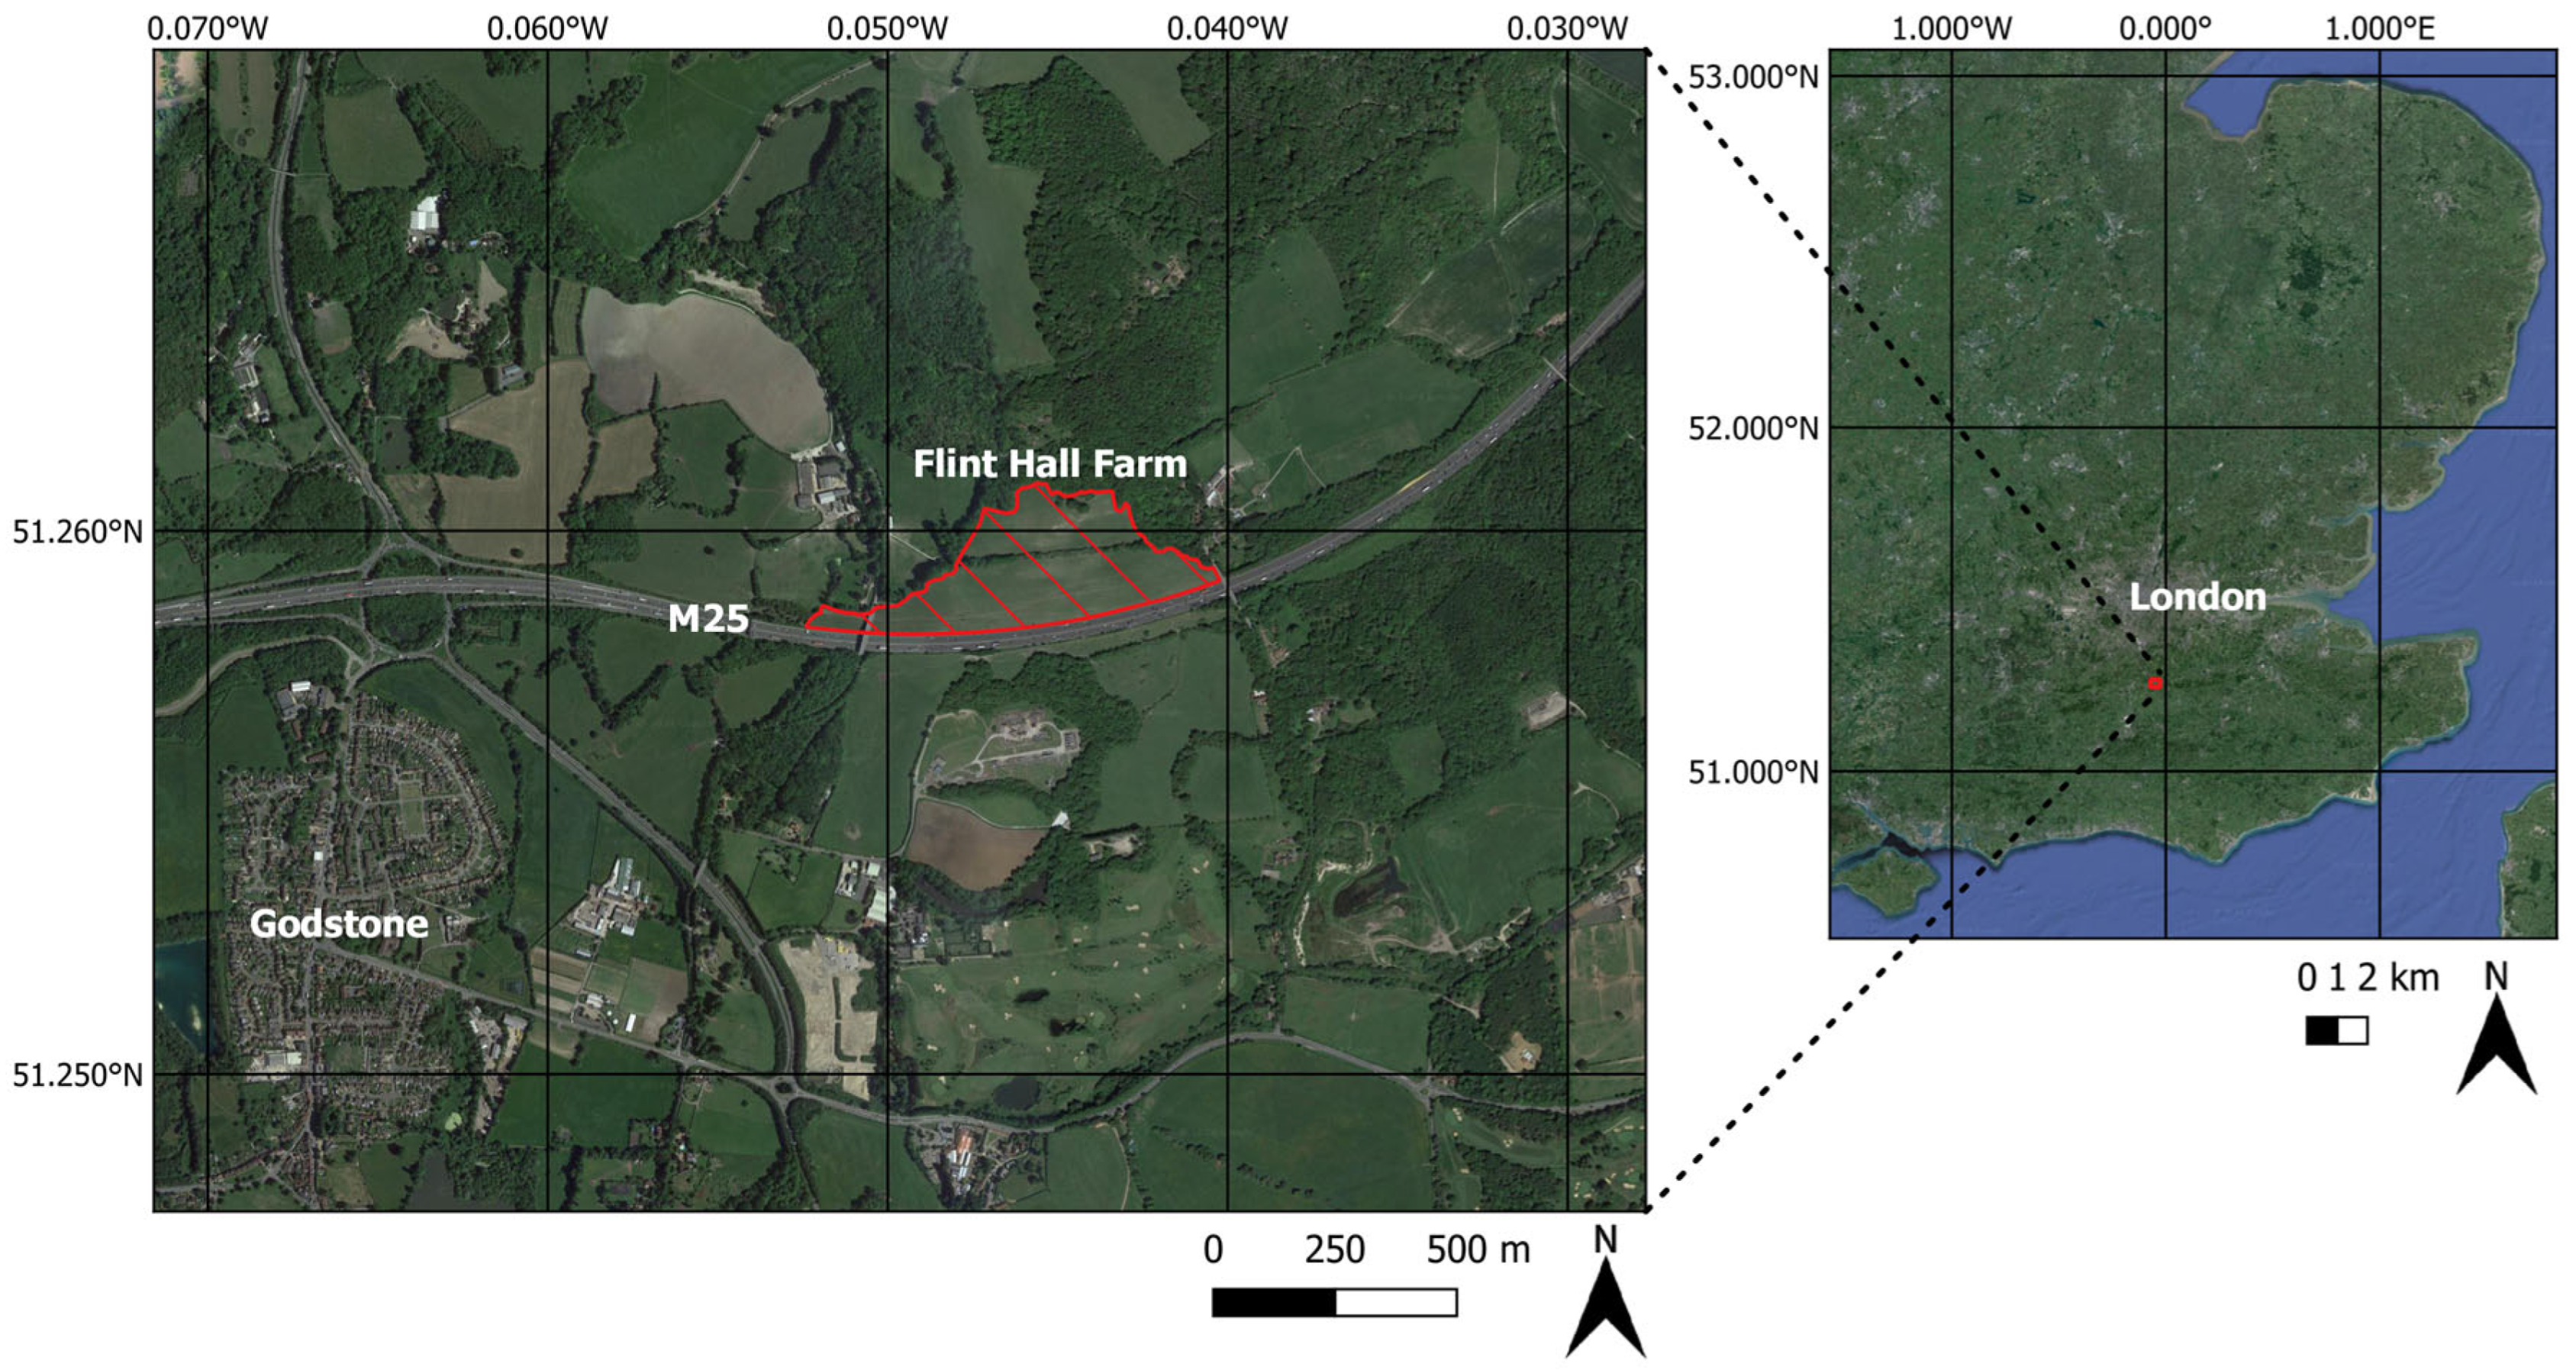
Figure 1. Flint Hall Farm study area (hatched red pattern), with annotated M25, Godstone, and regional UK overview map.
Remotesensing 16 03874 g001
Figure 2. Flint Hall Farm study area (hatched red pattern), with 1 m LiDAR Composite DTM for elevation and labelled contour lines.
Remotesensing 16 03874 g002
Figure 3. Zones and sub-zones at the Flint Hall Farm site, including the Flint Hall Farm Zone, Zones 1–3 (red); the Midslope Zone, Zones 1–2 (blue); and, the Rooks Nest Farm Zone, Zones 1–4 (yellow) [25]. The zone colour shading is more transparent than the legend colours for surface feature visibility.
Remotesensing 16 03874 g003
Figure 4. Landslide extents at the Flint Hall Farm site, including the Flint Hall Farm, Flint Hall Farm South, and Rooks Nest Farm Landslides [25].
Remotesensing 16 03874 g004
Figure 5. Simplified geological map of the study area, with Flint Hall Farm (red circle), and a geological cross-section for line A–A′ (green circle). Adapted from [26].
Remotesensing 16 03874 g005
Figure 6. Schematic of the Flint Hall Farm landslide, which occurred on 19 December 2000 [1].
Remotesensing 16 03874 g006
Figure 7. Geological cross-section schematic of the Flint Hall Farm landslide, which occurred on 19 December 2000 [1].
Remotesensing 16 03874 g007
Figure 8. Corner reflectors at Flint Hall Farm, with annotated M25.
Remotesensing 16 03874 g008
Figure 9. Photographs of the CCL horn antennas: (a) external view; (b) internal view.
Remotesensing 16 03874 g009
Figure 10. Drone radar payload, with the CCL horn antennas, E312 SDR and 3D-printed connection stabiliser for the SMB-SMA connectors, and Raspberry Pi (on the back).
Remotesensing 16 03874 g010
Figure 11. Drone radar payload attached to the drone at Flint Hall Farm.
Remotesensing 16 03874 g011
Figure 12. FMCW modulation: (a) amplitude domain; (b) frequency domain, where transmission (Tx) is red, and reception (Rx) is green.
Remotesensing 16 03874 g012
Figure 13. FMCW radar block diagram.
Remotesensing 16 03874 g013
Figure 14. RMA block diagram.
Remotesensing 16 03874 g014
Figure 15. Schematic of drone flight geometry with corner reflector target.
Remotesensing 16 03874 g015
Figure 16. Photograph of the drone radar system in-flight at Flint Hall Farm.
Remotesensing 16 03874 g016
Figure 17. (a) SLC SAR image from Flint Hall Farm, with annotated flight path and circled targets; the latter includes the corner reflectors (red), and other fenced areas for in situ instrumentation (yellow, blue and pink); (b) Google Street View imagery of Flint Hall Farm, with annotated flight path, and corresponding circled targets, as indicated by the arrows connecting (a,b).
Remotesensing 16 03874 g017
Figure 18. Average SAR amplitude for Flint Hall Farm (white boundary) from September 2021 to September 2023, with annotated M25 and Godstone. The zoomed image boundary is denoted by the red box. The corner reflector and in situ instrumental pixels are circled in blue.
Remotesensing 16 03874 g018
Figure 19. Side-by-side comparison of (a) average SAR amplitude for Flint Hall Farm (white boundary) from September 2021 to September 2023; the corner reflector and in situ instrumental pixels are circled in blue, and (b) drone SAR image from Flint Hall Farm, with circled targets, including the corner reflectors (red), and other fenced areas for in situ instrumentation (yellow, blue, and pink).
Remotesensing 16 03874 g019
Table 1. Zones and sub-zones at the Flint Hall Farm site, with geotechnical hazard risk ratings. Adapted from [25].
ZoneSub-ZoneRisk RatingLandslide System in Figure 4
NumberName
Flint Hall Farm1LandslideLow risk, with medium risk of creep failuresFlint Hall Farm Landslide
2Flower Lane cutting
3SouthLow riskFlint Hall Farm South Landslide
Midslope1NorthMedium to high riskN/A
2SouthLow risk
Rooks Nest Farm1Landslide NorthMedium riskRooks Nest Farm Landslide
2Landslide SouthLow risk, with medium risk of creep failures
3NortheastN/A
4Southeast
Disclaimer/Publisher’s Note: The statements, opinions and data contained in all publications are solely those of the individual author(s) and contributor(s) and not of MDPI and/or the editor(s). MDPI and/or the editor(s) disclaim responsibility for any injury to people or property resulting from any ideas, methods, instructions or products referred to in the content.