Article

Reawakening of Voragine, the Oldest of Etna’s Summit Craters: Insights from a Recurrent Episodic Eruptive Behavior

1
Istituto Nazionale di Geofisica e Vulcanologia, Osservatorio Etneo—Sezione di Catania, Piazza Roma 2, 95125 Catania, Italy
2
Dipartimento di Ingegneria Elettrica, Elettronica e Informatica, Università degli Studi di Catania, Viale A. Doria 6, 95122 Catania, Italy
*
Author to whom correspondence should be addressed.
Remote Sens. 2024, 16(22), 4278; https://doi.org/10.3390/rs16224278
Submission received: 29 September 2024 / Revised: 5 November 2024 / Accepted: 15 November 2024 / Published: 17 November 2024
(This article belongs to the Special Issue Remote Sensing: 15th Anniversary)

Abstract

:
Paroxysmal explosive activity at Etna volcano (Italy) has become quite frequent over the last three decades, raising concerns with the civil protection authorities due to its significant impact on the local population, infrastructures, viability and air traffic. Between 4 July and 15 August 2024, during the tourist season peak when the local population doubles, Etna volcano gave rise to a sequence of six paroxysmal explosive events from the summit crater named Voragine. This is the oldest and largest of Etna’s four summit craters and normally only produces degassing, with the previous explosive sequences occurring in December 2015 and May 2016. In this paper, we use thermal images recorded by the monitoring system maintained by the Istituto Nazionale di Geofisica e Vulcanologia, Osservatorio Etneo (INGV–OE), and an automatic procedure previously tested in order to automatically define the eruptive parameters of the six lava fountain episodes. These data allowed us to infer the eruptive processes and gain some insights on the evolution of the explosive sequences that are useful for hazard assessment. Specifically, our results lead to the hypothesis that the Voragine shallow storage has a capacity of ~12–15 Mm3, which was not completely emptied with the last two paroxysmal events. It is thus possible that one or two additional explosive paroxysmal events could occur in the future. It is noteworthy that an additional paroxysmal episode occurred at Voragine on 10 November 2024, after the submission of this paper, thus confirming our hypothesis.

1. Introduction

Lava fountaining is the mild explosive activity characteristic of the initial phases of a basaltic effusive or flank eruption, discharging lava into the atmosphere at rates of a few hundred cubic meters per second [1,2,3,4,5,6]. The earliest lava fountain model proposed by Wilson and Head [7] considered shallow magma degassing as the driver of the process, starting with magma ascending and degassing as bubbly flows, and transitioning to dispersed flows once the porosity reaches 75 percent. Jaupart and Vergniolle [8] and Vergniolle and Jaupart [9], based on laboratory experiments simulating a shallow conduit, provided an alternative lava fountain model, where gas bubbles accumulate as a foam layer at the roof of the subvolcanic reservoir. In their model, lava fountains result from violent annular flows triggered by the collapse of the foam layer once a critical thickness is reached.
The magma rise speed is the most important factor causing the transition from Strombolian-type explosive activity to lava fountaining, with gas content and viscosity determining the rise speed at which this transition occurs [10]. The height reached by lava fountaining is a function of the gas content within the magma [9,11,12], whereas a decrease in gas content causes a transition to passive effusion of vesicular lava [10].
Lava fountains (LFs) usually occur along eruptive fissures and with time concentrate at individual vents [4,13]. They can last for a few minutes to hours, days or even months and often occur as episodic events [14,15,16]. This periodic LF behavior can be explained by the existence of a shallow storage regularly refilled by a gas-rich magma batch from the depths, thus allowing for a possible forecast of the next event on a statistical basis [15]. Episodic LFs at Kilauea were accompanied by rapid inflation and deflation of the summit recorded by tiltmeters and accompanied by seismic tremor [14], again suggesting the replenishment of a shallow storage. The length of the repose times between episodes could be influenced by the amount of gas released by magma in the shallow conduit. Disruptive events such as erosion of the conduit or crater wall collapses could determine a change in the frequency of LF events and in the duration of eruptive pauses [16]. At fissure eruptions, the pulsating behavior of LFs is related to the size of the feeder dike and to the depth of the lava within the conduit and/or lava pond [4]. Episodic fountaining was observed several times at Kilauea volcano (Hawaii) between 1959 and 1986 [17,18,19], during the 2014–15 Holuhraun and the 2021 Geldingadalir eruptions in Iceland [4,16] and at Etna volcano in Italy during the last 25 years [6,20]. At Etna, LF episodes evolve into eruptive columns extending several kilometers above the vents and, for this reason, are often referred to as paroxysmal explosive eruptions [2,6,20]. LF episodes display a rather slow buildup [2,21] but stop abruptly, ending in chaotic bursts of gas and dense spatter as the lava ponded around the vent is swallowed back down into the conduit [1] or is erupted in rheomorphic or clastogenic flows [2,22,23,24].
Significant differences exist between LF episodes occurring along an eruptive fissure and as such declining with time and concentrating in one or more vents [3,13,16,17,25], and those taking place from a single vent, namely, one of the summit craters of the volcano, typical of open-conduit volcanoes such as Etna and Stromboli [6,20,26,27,28]. Indeed, LFs occurring along eruptive fissures commonly evolve into major effusive activity and form spatter ramparts accompanying the widening of the fissure and the emplacement of the feeder dike [17,29], whereas LFs focused at an open vent or summit crater can occur in sequences not followed by effusive activity, but representing an alternative way used by a steady-state volcano to release the magma accumulated into the shallow storage [20,30,31].
LFs at Etna volcano are normally referred to as explosive paroxysms. Paroxysmal explosive activity at the summit craters of Etna volcano is typified by increasing Strombolian activity, evolving to transitional explosions and then to paroxysmal LFs rising above the crater for thousands of meters and feeding a sustained eruptive column expanding up to 15 km above sea level (a.s.l.) for several minutes to a few hours [2,6,21,32,33]. The eruptive column gives rise to a sustained ash plume and eventually to tephra fallout, causing hazard and sometimes disruption at the local international airport of Catania and to the viability along the motorway running along the east coast of Sicily, as well as damage to cars, buildings and infrastructures, and threatening the health of the local population [34,35,36].
These paroxysmal explosions at Etna are often preceded, accompanied and/or followed by lava flow outputs from the base of the crater, lasting just a few hours. These often comprise rheomorphic or clastogenic lava from the flowage of agglutinated spatter fallout emplaced on a steep slope [2,21,22,23,24]. This paroxysmal activity mostly occurred, between 2000 and 2023, at the South-East Crater (SEC), the youngest of Etna’s four summit craters [37,38] (Figure 1). Looking back in time, this explosive activity became increasingly more common after 1971, precisely following the formation and growth of the SEC (Figure 1; Table 1). The SEC opened as a depression at the base of the Central Cone during the 1971 flank eruption [39] and is now the highest peak of the volcano [38,40]. The Central Crater, or Voragine (VOR; Figure 1), is the oldest and was the only active crater until 1911, when the North-East Crater (NEC; Figure 1) formed as a separated cinder cone [41]. Then, in 1968, within the Central Crater and next to VOR, there was the opening of a collapse pit only two meters wide, named Bocca Nuova (BN = new vent) [41] that eventually grew and reached almost the same size as that of VOR. BN now comprises two pits, BN-1 and BN-2 (Figure 1). Interesting enough, despite the idea that Etna volcano produces mainly effusive eruptions, since 1986 and up to 22 February 2022, it gave rise to more than 281 paroxysmal explosive events, most of them comprising eruptive sequences [6,20,42,43].
During the last few decades, all the four summit craters produced occasional paroxysmal explosive episodes, giving rise to powerful LFs extending 1–5 km above the crater and feeding extensive eruptive columns and ash plumes up to 15 km a.s.l. [2,42,44]. Since 2000, the LF activity from the SEC has become ever more common, with 64 episodes occurring during that year [45], and additional sequences recorded in 2011–2013 (68 episodes; [2]) and 2020–2022 (66 episodes; [20]). The SEC LFs are caused by the sudden emptying of a bubble foam layer accumulated at 1.5 km below the crater or 1.5 km a.s.l. [46]. The NEC has very rarely displayed this type of activity, which occurred as single episodes rather than as eruptive sequences, with the last powerful episodes in 1998 and 2013 [2,47]. VOR has occasionally produced paroxysmal episodes, with the most remarkable events taking place on 22 July 1998 [48,49], on 4 September 1999 [50,51], between 3 and 5 December 2015 with a sequence of four powerful paroxysms [44] and between 18 and 21 May 2016 with three episodes [6]. It is worth noting that the volume erupted by VOR during one single episode (8.5 × 10⁶ m3 for the 3 December 2015 episode [44]) is much greater than the average volume of each SEC paroxysmal event (~ 2.5 × 10⁶ m3 [2]). In addition, the depth of the shallow storage for the VOR paroxysms is much deeper than that for the SEC, given that the estimated depth for the VOR paroxysmal episodes occurring in 2015 was 1.5 km below sea level (b.s.l.) [44], that is, 3 km deeper than the SEC shallow storage [46]. During the 2015 sequence, it was possible to calculate for the first time the volume of both the pyroclastic material and the total fluid erupted (comprising gas and pyroclastic materials). The results revealed that the explosive sequence was characterized by a decreasing trend of erupted pyroclastic material with time, going from 41% (first event) to 13% (fourth event) of the total erupted pyroclastic volume [44]. Moreover, the total erupted volume of pyroclastic material was ~ 12 × 106 m3 [44,52], and the fluid/pyroclastic volume ratio increased markedly in the fourth and last event [44], forecasting the end of the eruptive sequence. In this paper, we use thermal images recorded by the INGV-OE monitoring system, applying to the analysis of the images the automatic procedure developed by Calvari and Nunnari [53], in order to calculate the erupted volumes of the paroxysmal explosive sequence occurring at VOR between 4 July and 15 August 2024 and evaluate its hazard implications.
Given that the effects of paroxysmal activity are a matter of great concern for the local population because of their impact on the territory, it is becoming of paramount importance to be able to forecast its evolution and possibly its end [20,30,44]. This is what we try to infer with the study presented here.

2. Voragine (VOR) Eruptive Activity in 2024

The VOR crater was quiet for several months before Strombolian activity started on 13–14 June 2024, accompanied by small lava flows spreading within the crater [54]. It is worth noting that the composition of the products erupted during this phase was more evolved than that of the last paroxysmal episode in December 2023 [54] and thus presumably involved the output of magma left over within the conduit from the previous eruptive activity. The explosive activity gradually increased, giving rise at 16:15 UTC on 4 July to the first paroxysmal LF episode occurring at VOR, which ended on the early morning of 5 July at 01:50 UTC, leaving the crater silent [55]. The eruptive column formed during this first episode rose up to 4.5 km a.s.l. and expanded SE reaching the town of Siracusa, ~120 km to the SE [55]. The seismic tremor accompanying the explosive activity decreased between 14:30 and 15:00 (UTC), suggesting a small explosive pause. At the end of the paroxysmal episode, a lava flow from VOR spread into BN-1 (Figure 1) and overflowed the west crater rim, then stopping in a few days [56].
Strombolian explosive activity started again on 6 July, gradually increasing and eventually evolving to the second LF episode at 02:00 UTC on 7 July and ending at 08:00 UTC the same day [55]. The eruptive column spread east, reaching the maximum elevation of 9.7 km a.s.l., while the fallout filling the summit crater overflowed the western rim, spreading for a few hundred meters [55]. The cumulated lava flow volume erupted during the two paroxysmal episodes of 4 and 7 July was ~1.1 ± 0.5 Mm3 [55], this being just the effusive portion of the paroxysmal event. The LF fallout deposited in the SE causing a growth of VOR of 15 m (reaching, on 8 July, 3412 m a.s.l.) and accumulating a deposit of up to 107 m [55]. The composition of the volcanic glass particles erupted by VOR during the strombolian phase preceding the paroxysms and the paroxysms of 4 and 7 July 2024 testifies that the earlier products were substituted by a more primitive magma feeding the LFs [56].
The third lava fountain episode began at 17:42 UTC at VOR on 15 July, climaxed at 22:57 UTC during the output of a lava flow and ended at 23:40 the same day [57]. The eruptive column reached the maximum elevation of 8.8 km a.s.l. at 21:12 UTC and spread SE, whereas the erupted lava volume from the overflows covering the W rim of the summit crater was ~0.41 Mm3 [57].
The fourth lava fountain episode from VOR took place between 02:08 and 08:15 on 23 July. The eruptive column reached 7.4 km a.s.l. at 06:57 UTC, spreading SSE, and was accompanied by overflows from the W crater rim, with a total volume of 0.5 Mm3 [58].
The fifth paroxysmal episode started at 02:30 UTC and ended at 07:10 UTC on 4 August. The eruptive cloud reached 10 km a.s.l., spreading E and SE, and was accompanied by several overflows from the western crater rim, for a volume of 0.45 Mm3 [59].
The sixth lava fountain episode started at 22:30 UTC on 14 August and ended at 01:20 on 15 August and produced an eruptive column 9.5 km high a.s.l. that expanded towards the SSW and ESE [60]. The paroxysmal event was followed by an overflow from the W crater rim that emplaced a lava volume of 0.40 Mm3 [60].

3. Materials and Methods

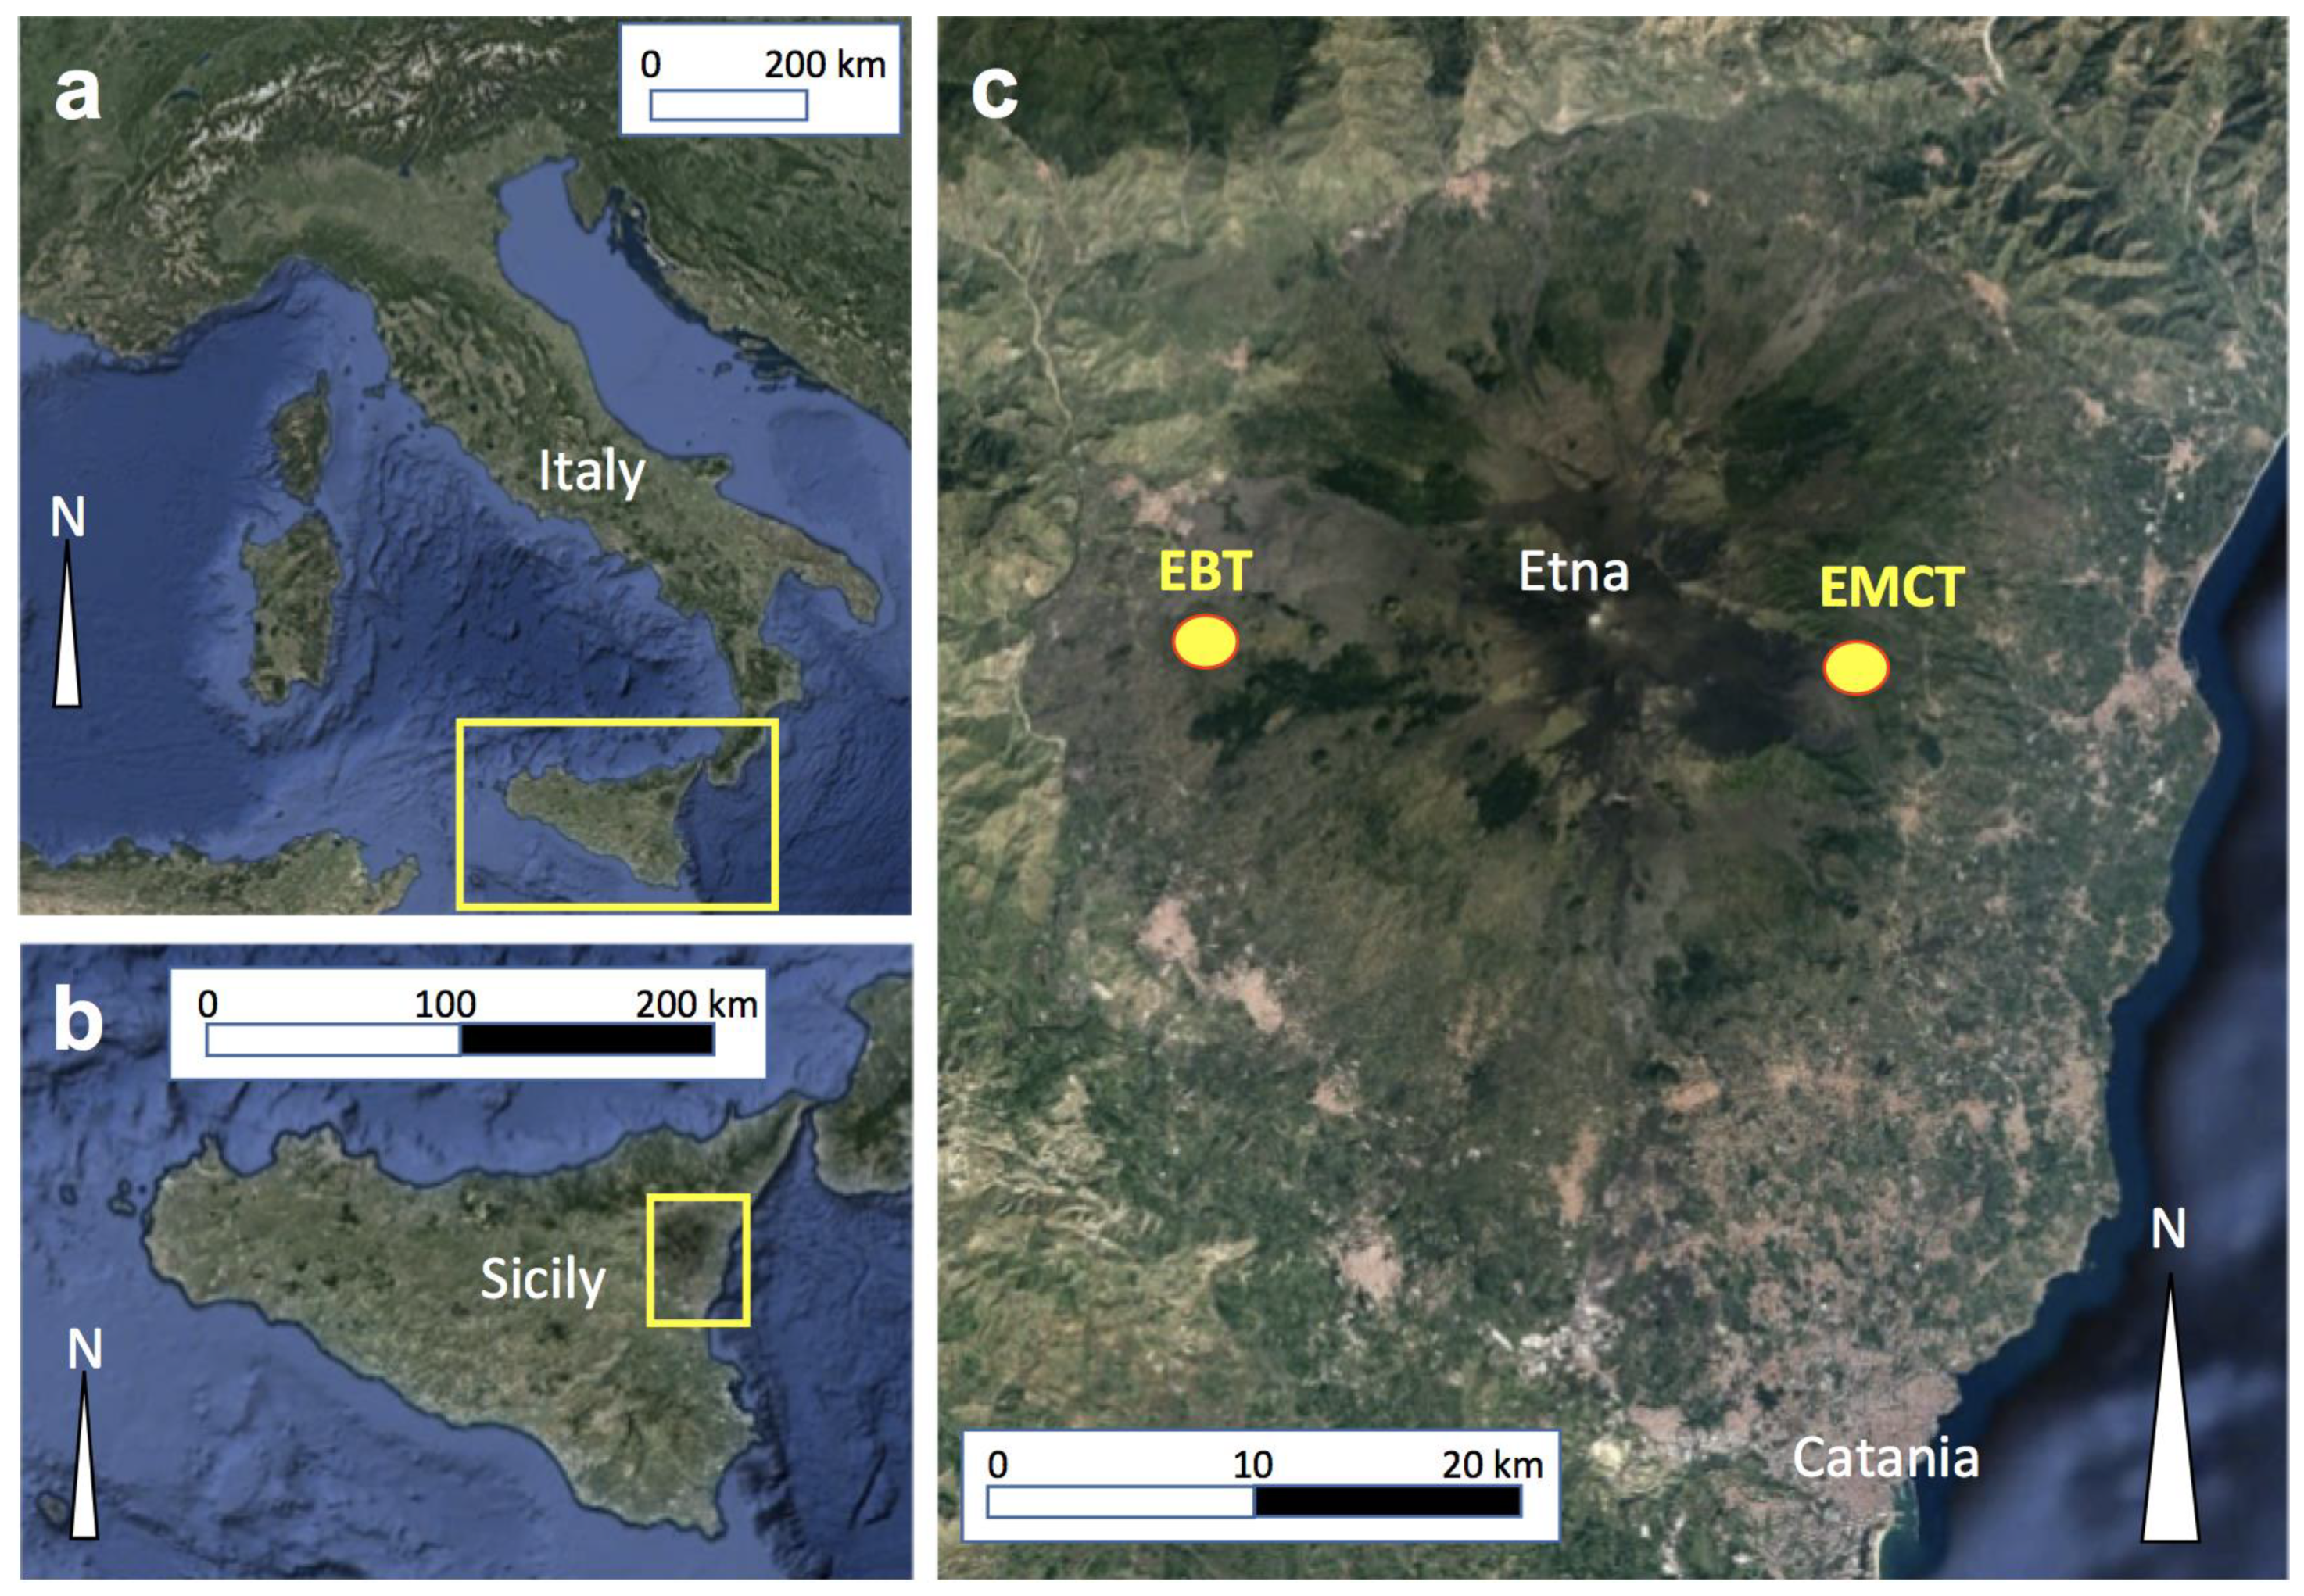
In this paper, we used thermal images recorded by EBT and EMCT cameras from the monitoring network of fixed devices belonging to the Istituto Nazionale di Geofisica e Vulcanologia—Osservatorio Etneo, Sezione di Catania (INGV-OE). Among the several thermal cameras available, we chose the EBT camera located west of the summit craters, because it offers the best view of the VOR crater, which caused the activity described here (Figure 2 and Table 1). However, a comparison with the EMCT camera images is also provided, given that this camera offers a different perspective. Despite its advantageous position, the EBT camera has limitations in the presence of thick cloud cover, and therefore the LF area signal extracted from the frames is sometimes discontinuous, leading to a limitation in the accuracy with which the parameters of interest are estimated. Following the manual procedure proposed by Calvari et al. [2,21] and applied to the activity at the SEC for over more than a decade (2011–2022) [2,53] and the automatic procedure proposed by Calvari and Nunnari [20], we obtained the starting and ending times of each episode, the duration, the erupted volume of pyroclastic material, the maximum elevation of the LF and the time-averaged discharge rate (TADR; [61]). In more detail, the fluid volume V erupted by the LF was firstly estimated by using the equation V = U · A v · D , where U is the mean fluid exit velocity at the vent (in m · s 1 ), A v is the vent section area in m 2 , and D is the duration of the LF in seconds. The mean velocity U was computed as U = ( 2 g H ) 0.5 , where g is the gravity acceleration, and H is the mean LF height in m. The vent surface area was calculated assuming a circular vent with a diameter of 30 m, considered constant. Finally, the volume V 2 of pyroclastic material was obtained from the total erupted volume V considering 0.18% as the ratio between the volumes of magma and volatiles within the eruptive column, typical for Etna’s LF [2,21]. The TADR of pyroclastic products was simply computed as T A D R = V 2 D .
An estimate of the accuracy of the parameter estimation obtained by this automatic detection procedure was made by comparison with manual estimations, with results presented in [53]. Specifically, we evaluated the precision of the starting and ending times of each LF, the maximum elevation reached by the LF over time and calculations of the erupted pyroclastic volume. The automatic detection showed a high level of accuracy, yielding results that were consistent with the manual analysis, particularly in capturing the sustained portion of the LF, which is critical for hazard assessment. While infrasound detectors and other instruments are used in tandem, a thick cloud cover may occasionally lead to a discontinuous thermal signal, but our multi-instrument approach minimized the risk of missing significant episodes. None of the eruptive episodes occurred during the time lapse considered here was missed.

The Software Package

The tool is built around a database organized into folders containing video clips in .avi format. Inside the main database folder, data recorded by the network are stored in subfolders, each named to indicate the specific station and the date to which the data pertain. For example, the folder named EMCT-20240704 contains the .avi files recorded by the EMCT camera station (Figure 2c) on 4 July 2024. Within each subfolder, the .avi files are segmented into 5 min intervals.
Each video file was opened as a MATLAB VideoReader object (release Matlab R2024b), which allows for reading video data and accessing information such as the video duration (in seconds), number of frames, width and height (in pixels), frame rate, etc. The frames were read within a loop, converted from RGB to binary images using a predefined threshold based on the camera’s operational environment. The following measurements (in pixels) were performed on each video frame:
  • Area: the total number of pixels in the region, returned as a scalar.
  • Centroid: the center of mass of the region, returned as a 1-by-Q vector. The first element of the centroid is the x-coordinate, and the second is the y-coordinate. Additional elements, if any, are ordered by dimension.
  • Perimeter: the distance around the boundary of the region, returned as a scalar.
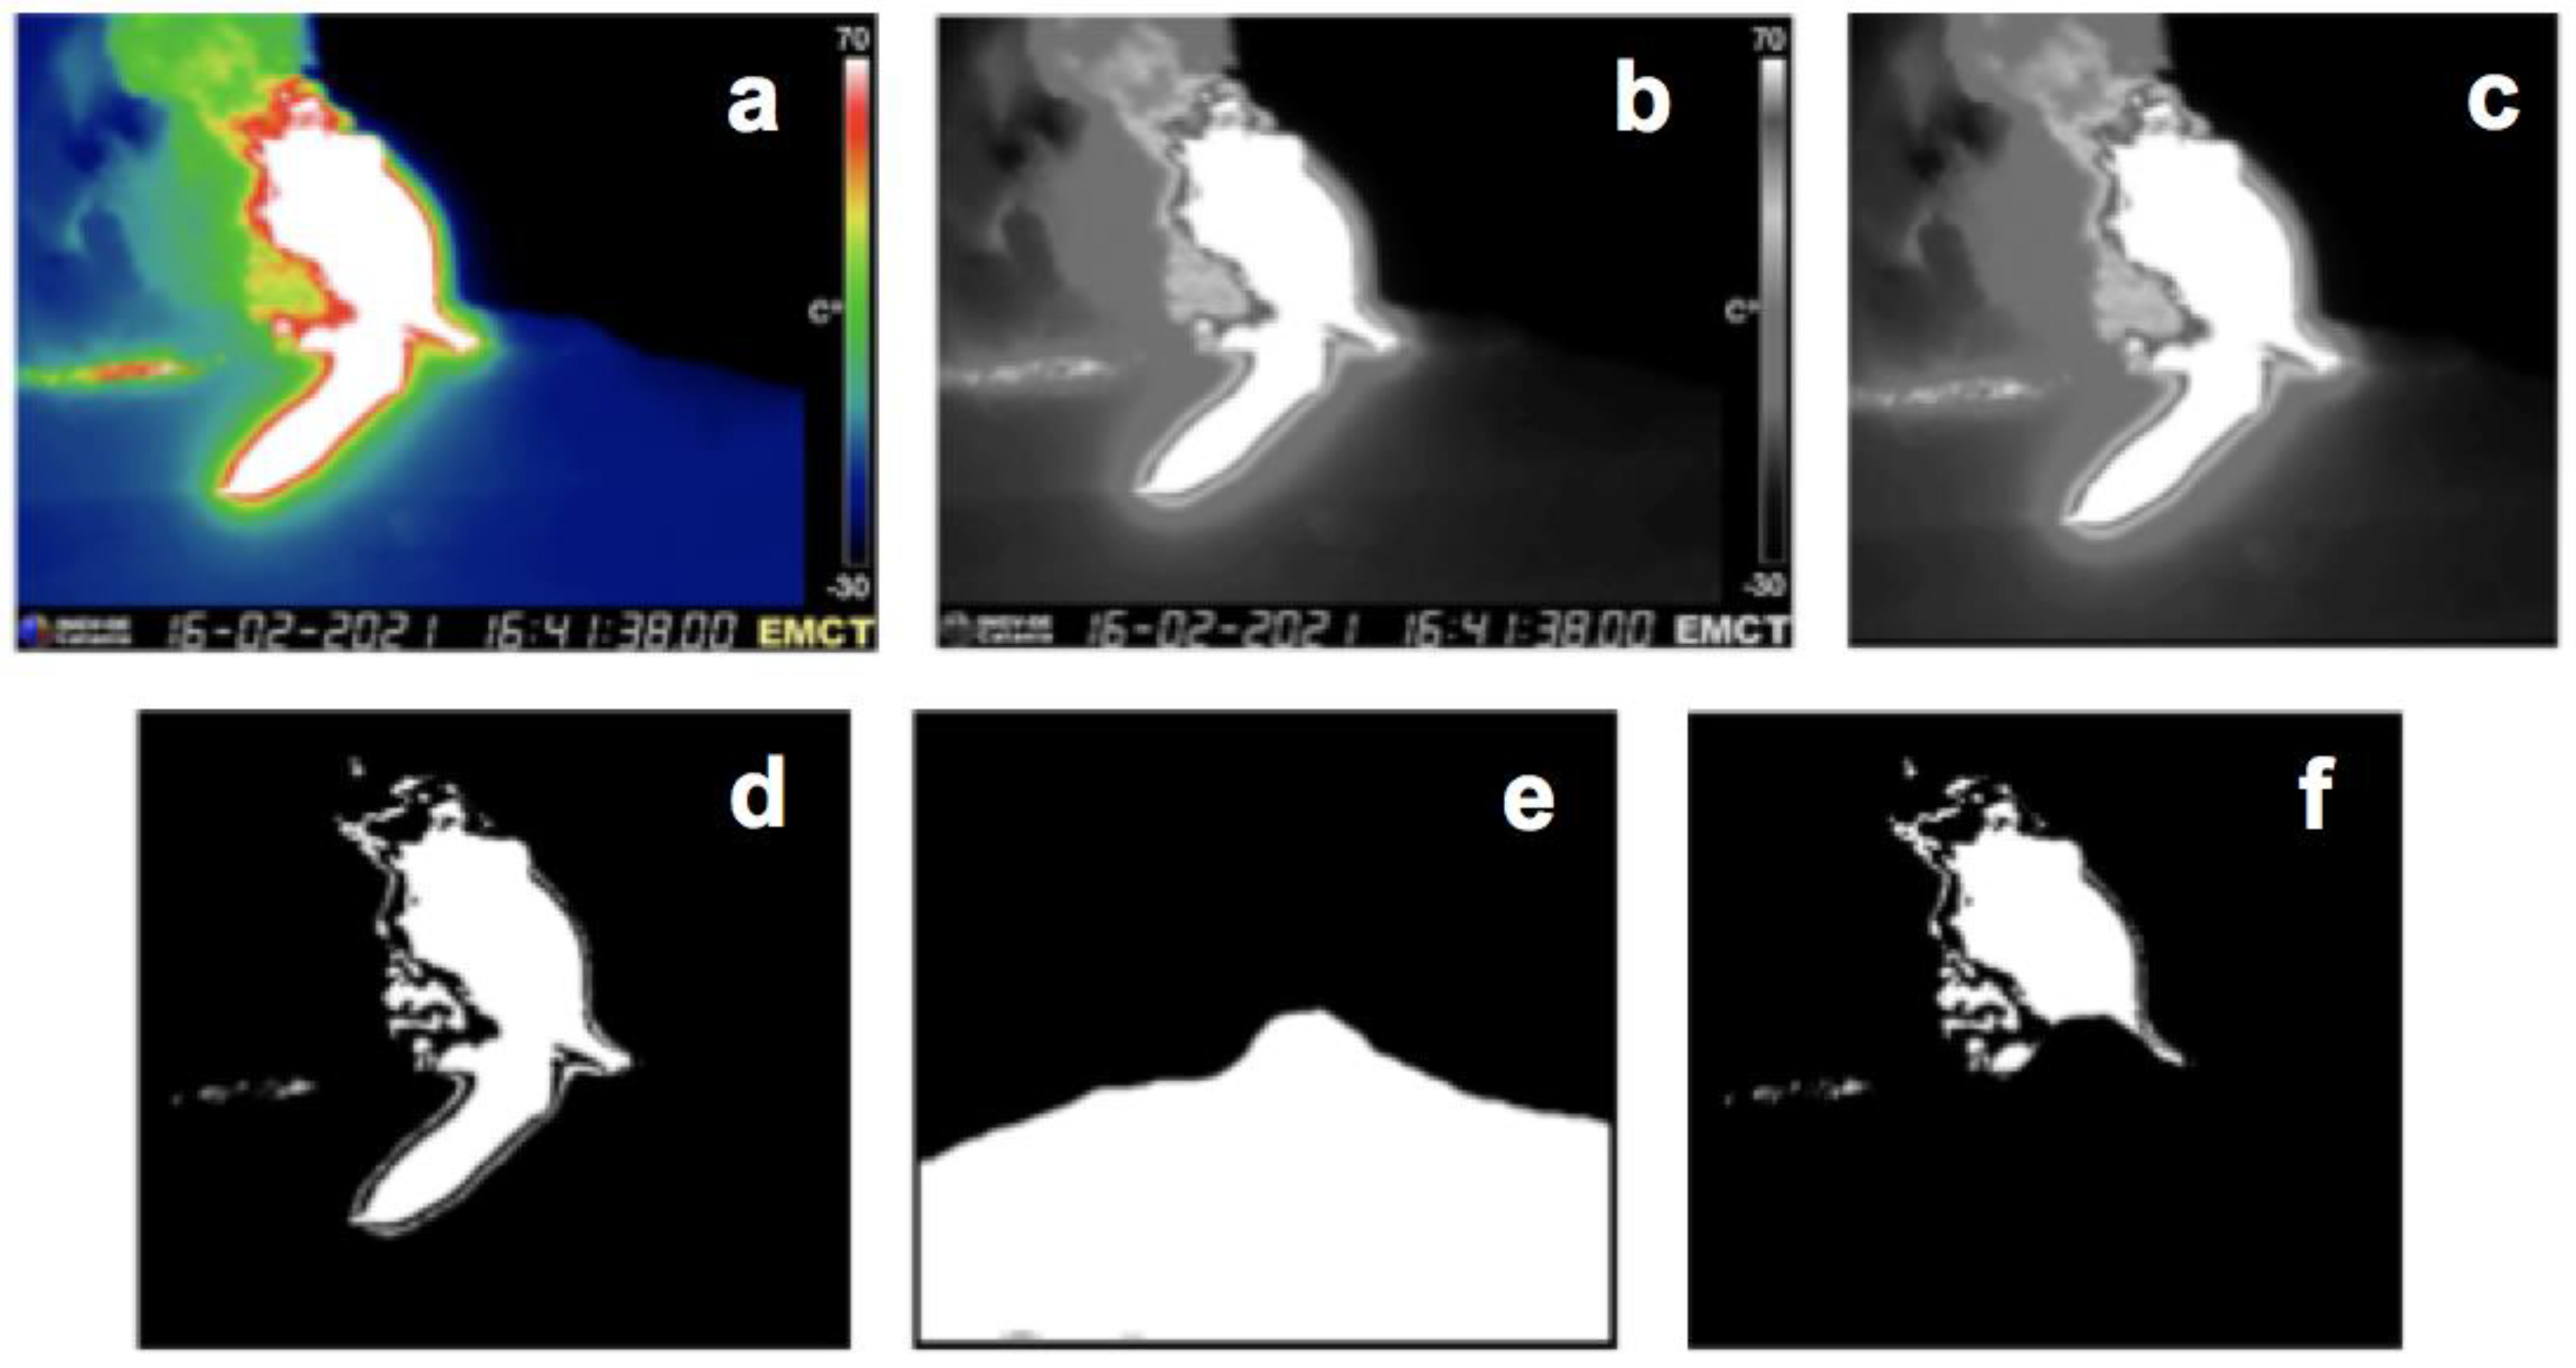
A useful feature of the software is the ability to define a region of interest (ROI) before the acquisition phase. When detecting and measuring an LF, the ROI typically corresponds to the area above the volcano’s profile as captured by the camera (Figure 3). This was done by defining a mask, an area displayed in black in the binarized image (Figure 4). An example of a mask designed to exclude hot masses that had fallen back to the ground after LF ejection is shown in Figure 3.
Before measurements can be taken on a frame, several preprocessing steps are necessary:
  • Extract RGB frames from the original .avi files at each time step.
  • Convert the RGB images to grayscale images.
  • Crop the grayscale images to remove information bars (e.g., color bar, camera name and time stamp).
  • Binarize the cropped grayscale images using an appropriate threshold level (ranging between 0.6 and 0.7). In these images, hot areas appear white, while the rest appears black.
  • Apply a mask to filter out unwanted hot objects (e.g., cooling matter, vegetation).
  • Measure the binarized and masked images to extract the desired information, resulting in the so-called labeled images.
In the binarized image, the hottest objects (e.g., newly erupted or cooling volcanic material) appear white, while all other objects appear black. In the absence of hot objects, the binarized image will be entirely black. However, hot objects may go undetected in the presence of a thick cloud cover, making the choice of a threshold crucial. The overall frame processing sequence is illustrated in Figure 4.
After preprocessing, each binarized image is further processed to obtain a labeled image, which provides the geometrical properties of the objects detected in the binarized image. Multiple objects in a single LF episode result from the fact that the LF’s volume does not have a uniform temperature. Thus, for practical purposes, different hot objects from the same LF (e.g., Figure 4f) were treated as a single entity. This was achieved by summing the areas of all detected objects and calculating the coordinates of a single centroid using a weighted average, as expressed in Equations (1)–(4):
A = i = 1 N A i ,
x = i = 1 N w i x i
y = i = 1 N w i y i
w i = i = 1 N A i A
A i being the area of the ith object, N the number of detected objects, and w i the normalized area of the ith object. It is straightforward to say that, with considerable approximation, due to the fact that the LF occurs in a 3-D volume, while images refer to a 2-D area, the estimated area A is in some way related to the volume of hot matters, while the y-coordinate of its centroid may be related with the mean elevation. Of course, A and its centroid coordinates (x, y), originally expressed in pixel units, can be converted into geographical units by appropriate conversion constants, depending on the position of the considered camera with respect to the monitored area.
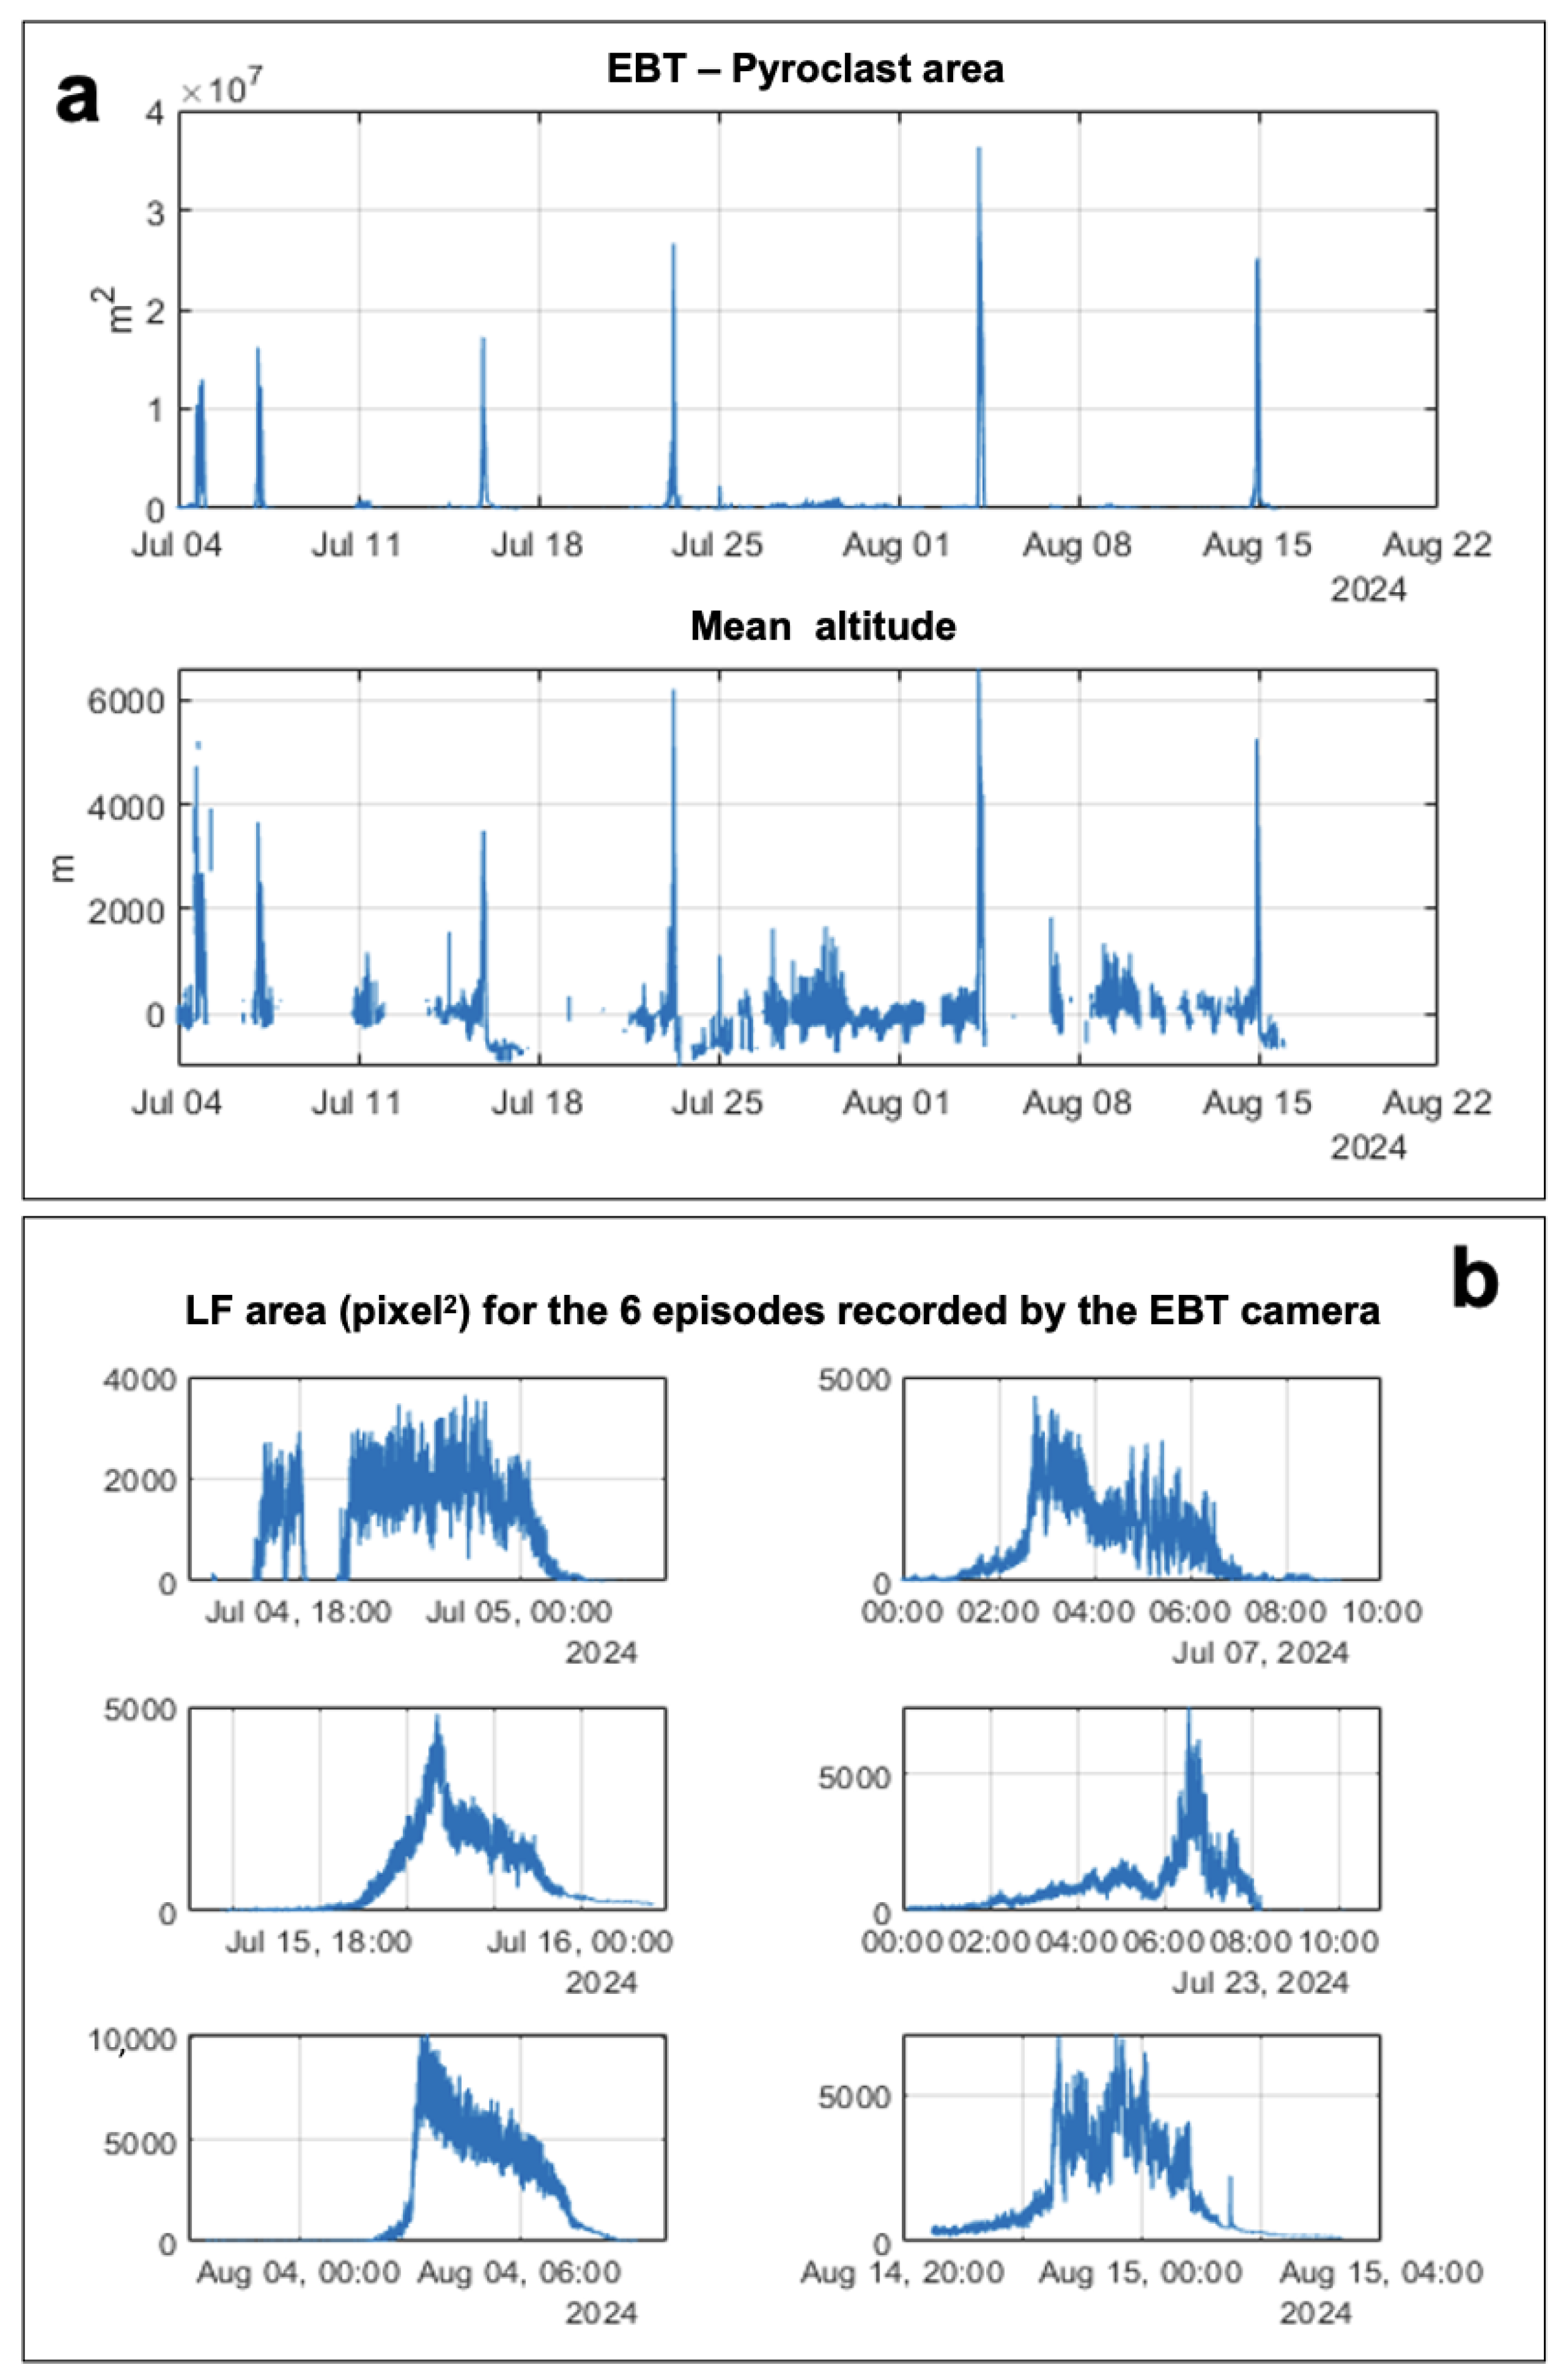
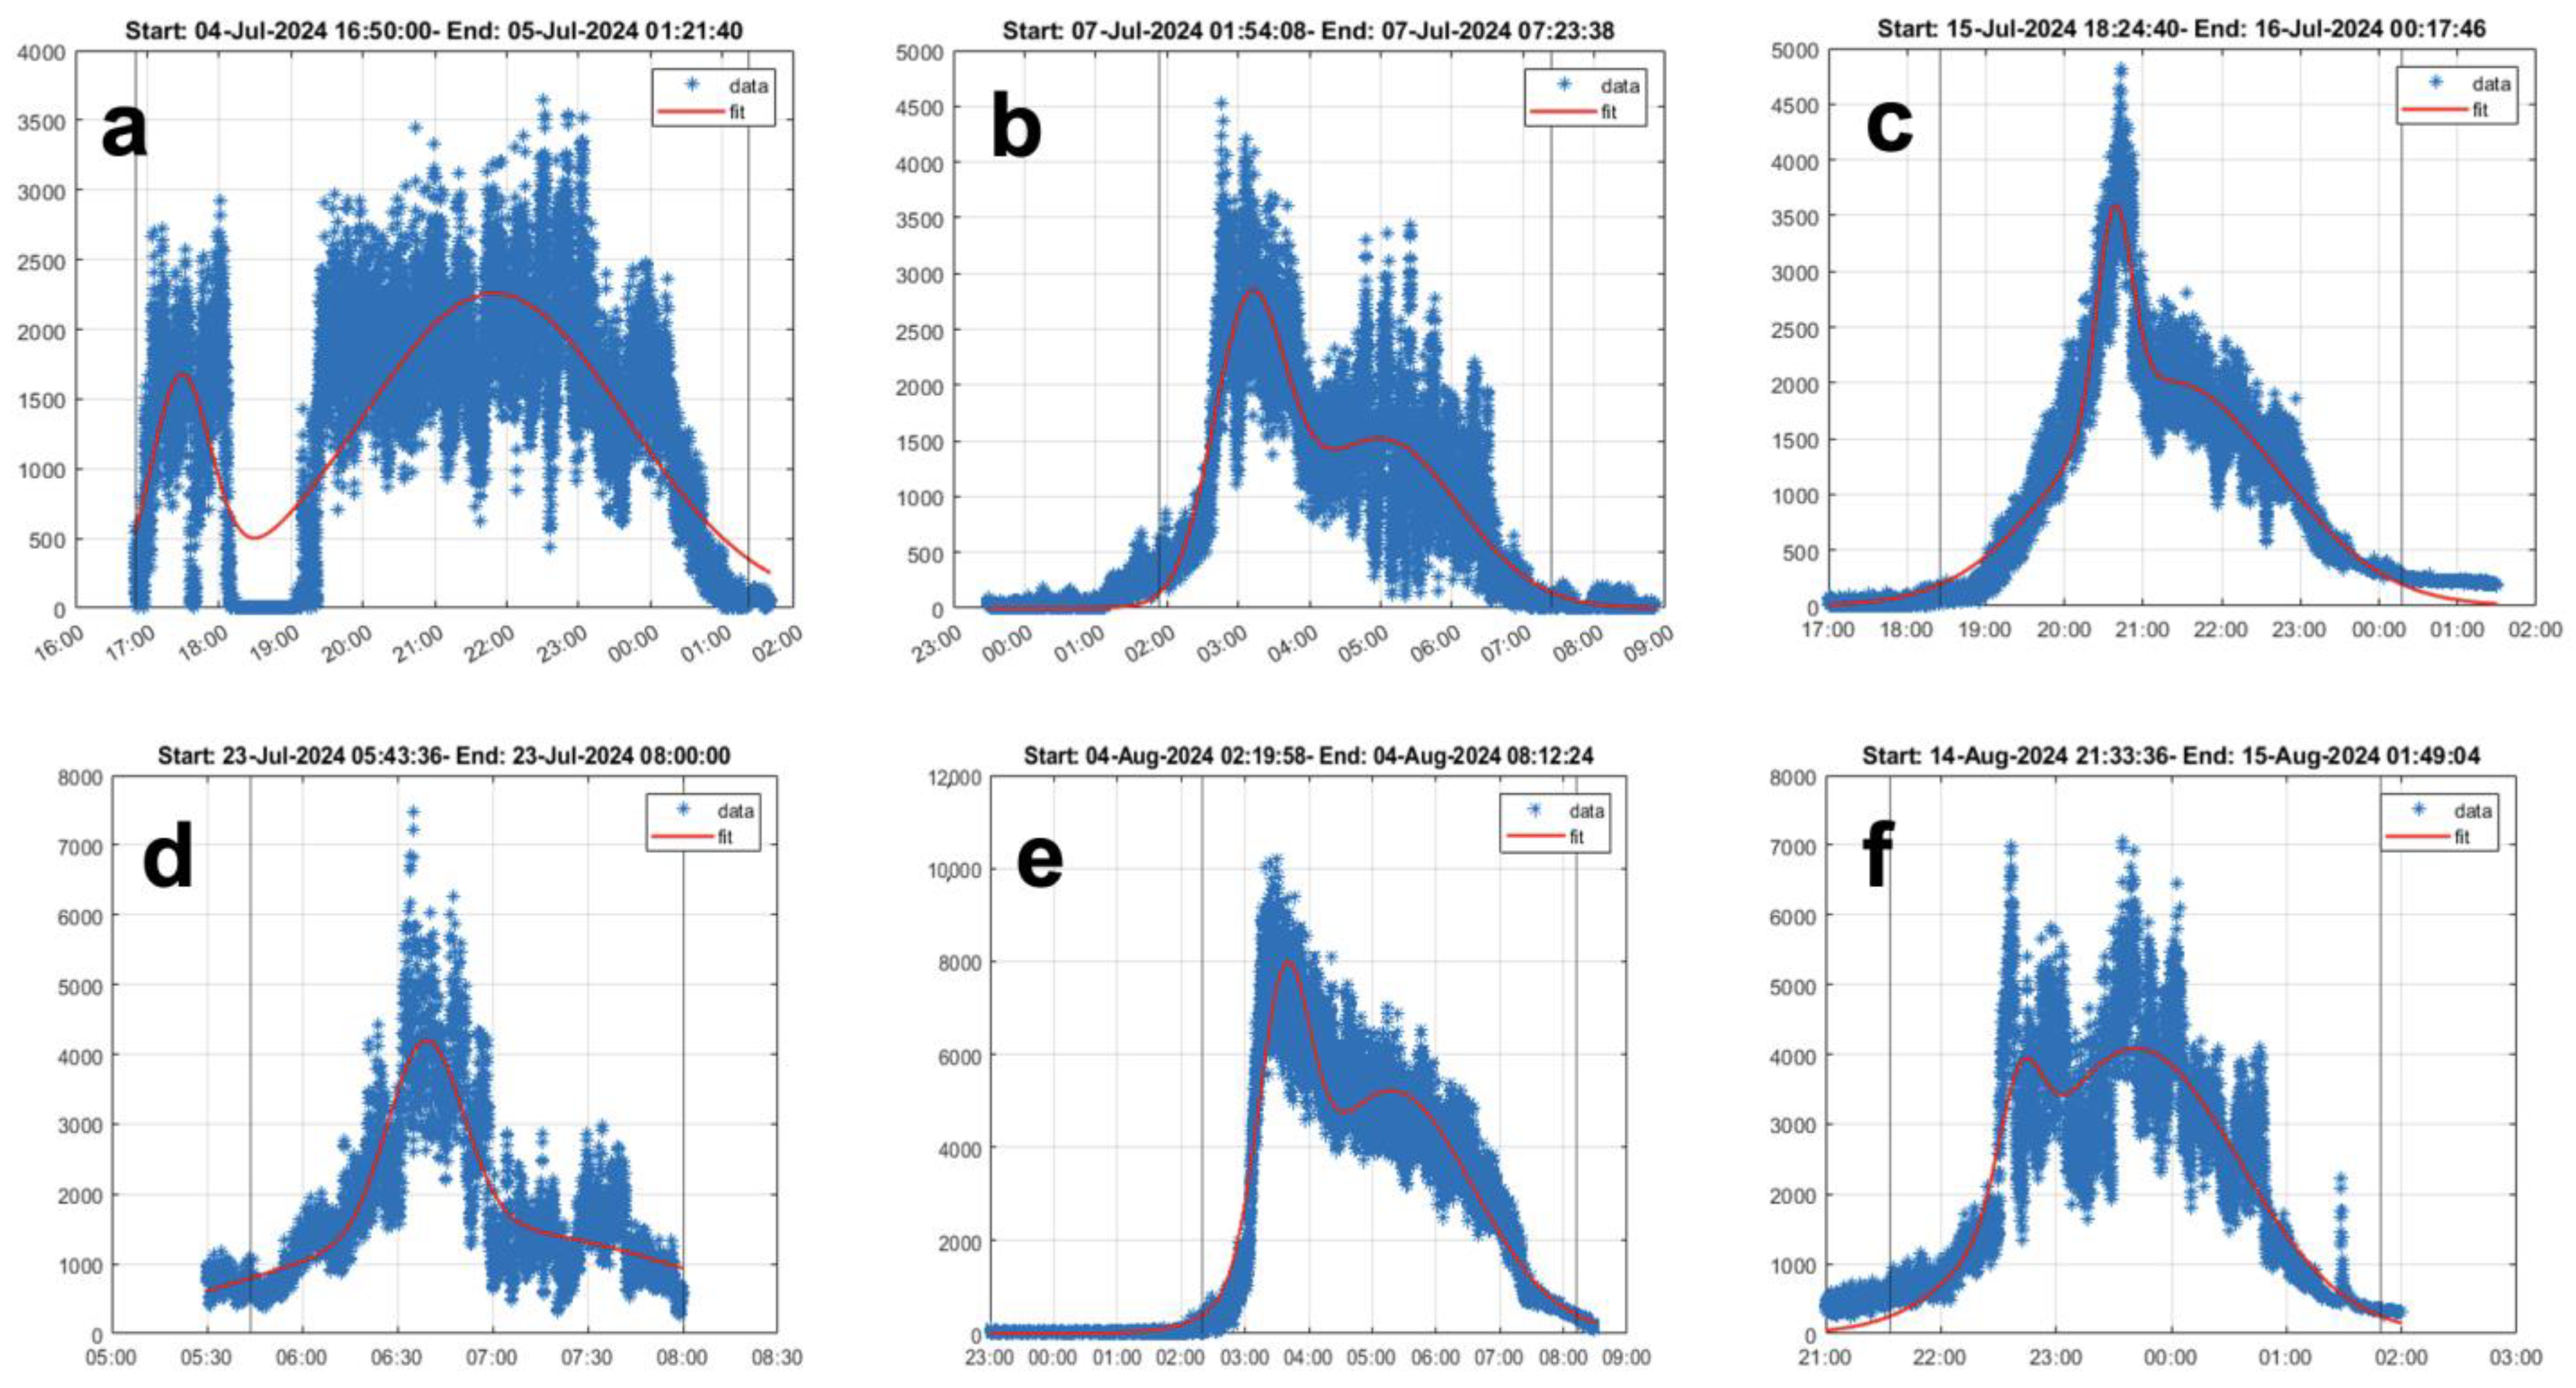
After calculating the area and centroid coordinates for each frame and using appropriate scaling coefficients, the results can be plotted, as shown in Figure 5 in the Results section. Additionally, the timing of each LF episode (i.e., the estimation of the start and end times) can be determined by fitting the area signal on the basis of Gaussian functions and applying a threshold approach [20,53], as shown in Figure 6 in the same section. Finally, the fluid volume (gas + pyroclastic) and the time-averaged discharge rate (TADR; [61]) were estimated following the method by Calvari et al. [2,21], based on the measurements of the LF heights at time lapses of 1 min and considering a constant vent radius of 15 m and a pyroclastic ratio of 0.18% of the total erupted fluids comprising gas plus pyroclastics [21].
The timing of an LF episode, after having carried out the approximation of the curve by means of a basis of Gaussian functions [53], is simply established by using a threshold approach: the starting time is set as the one in which the recorded data exceed, for the first time, a threshold of the normalized function height. Similarly, the end time is defined as the one in which the recorded signal falls, for the first time, below the threshold. In this paper, the threshold value was set, after a trial-and-error approach, to 5% of the maximum value.

4. Results

Analyzing the thermal images recorded by the EBT camera, located on the western flank of the volcano and as such offering a clear view of the VOR crater (Figure 1 and Figure 2c), six explosive paroxysmal events occurring at VOR were detected between 4 July and 4 September 2024: on 4–5 July, 7 July, 15 July, 23 July, 4 August and 14–15 August (Figure 5).
The data related to the LF area detected by the EMCT camera are shown in Figure 6, along with those from the EBT camera. As can be observed, due to the weather conditions, the EMCT camera signals were in general more discontinuous compared to those of the EBT camera, which is why the latter was preferred for the continuation of the work.
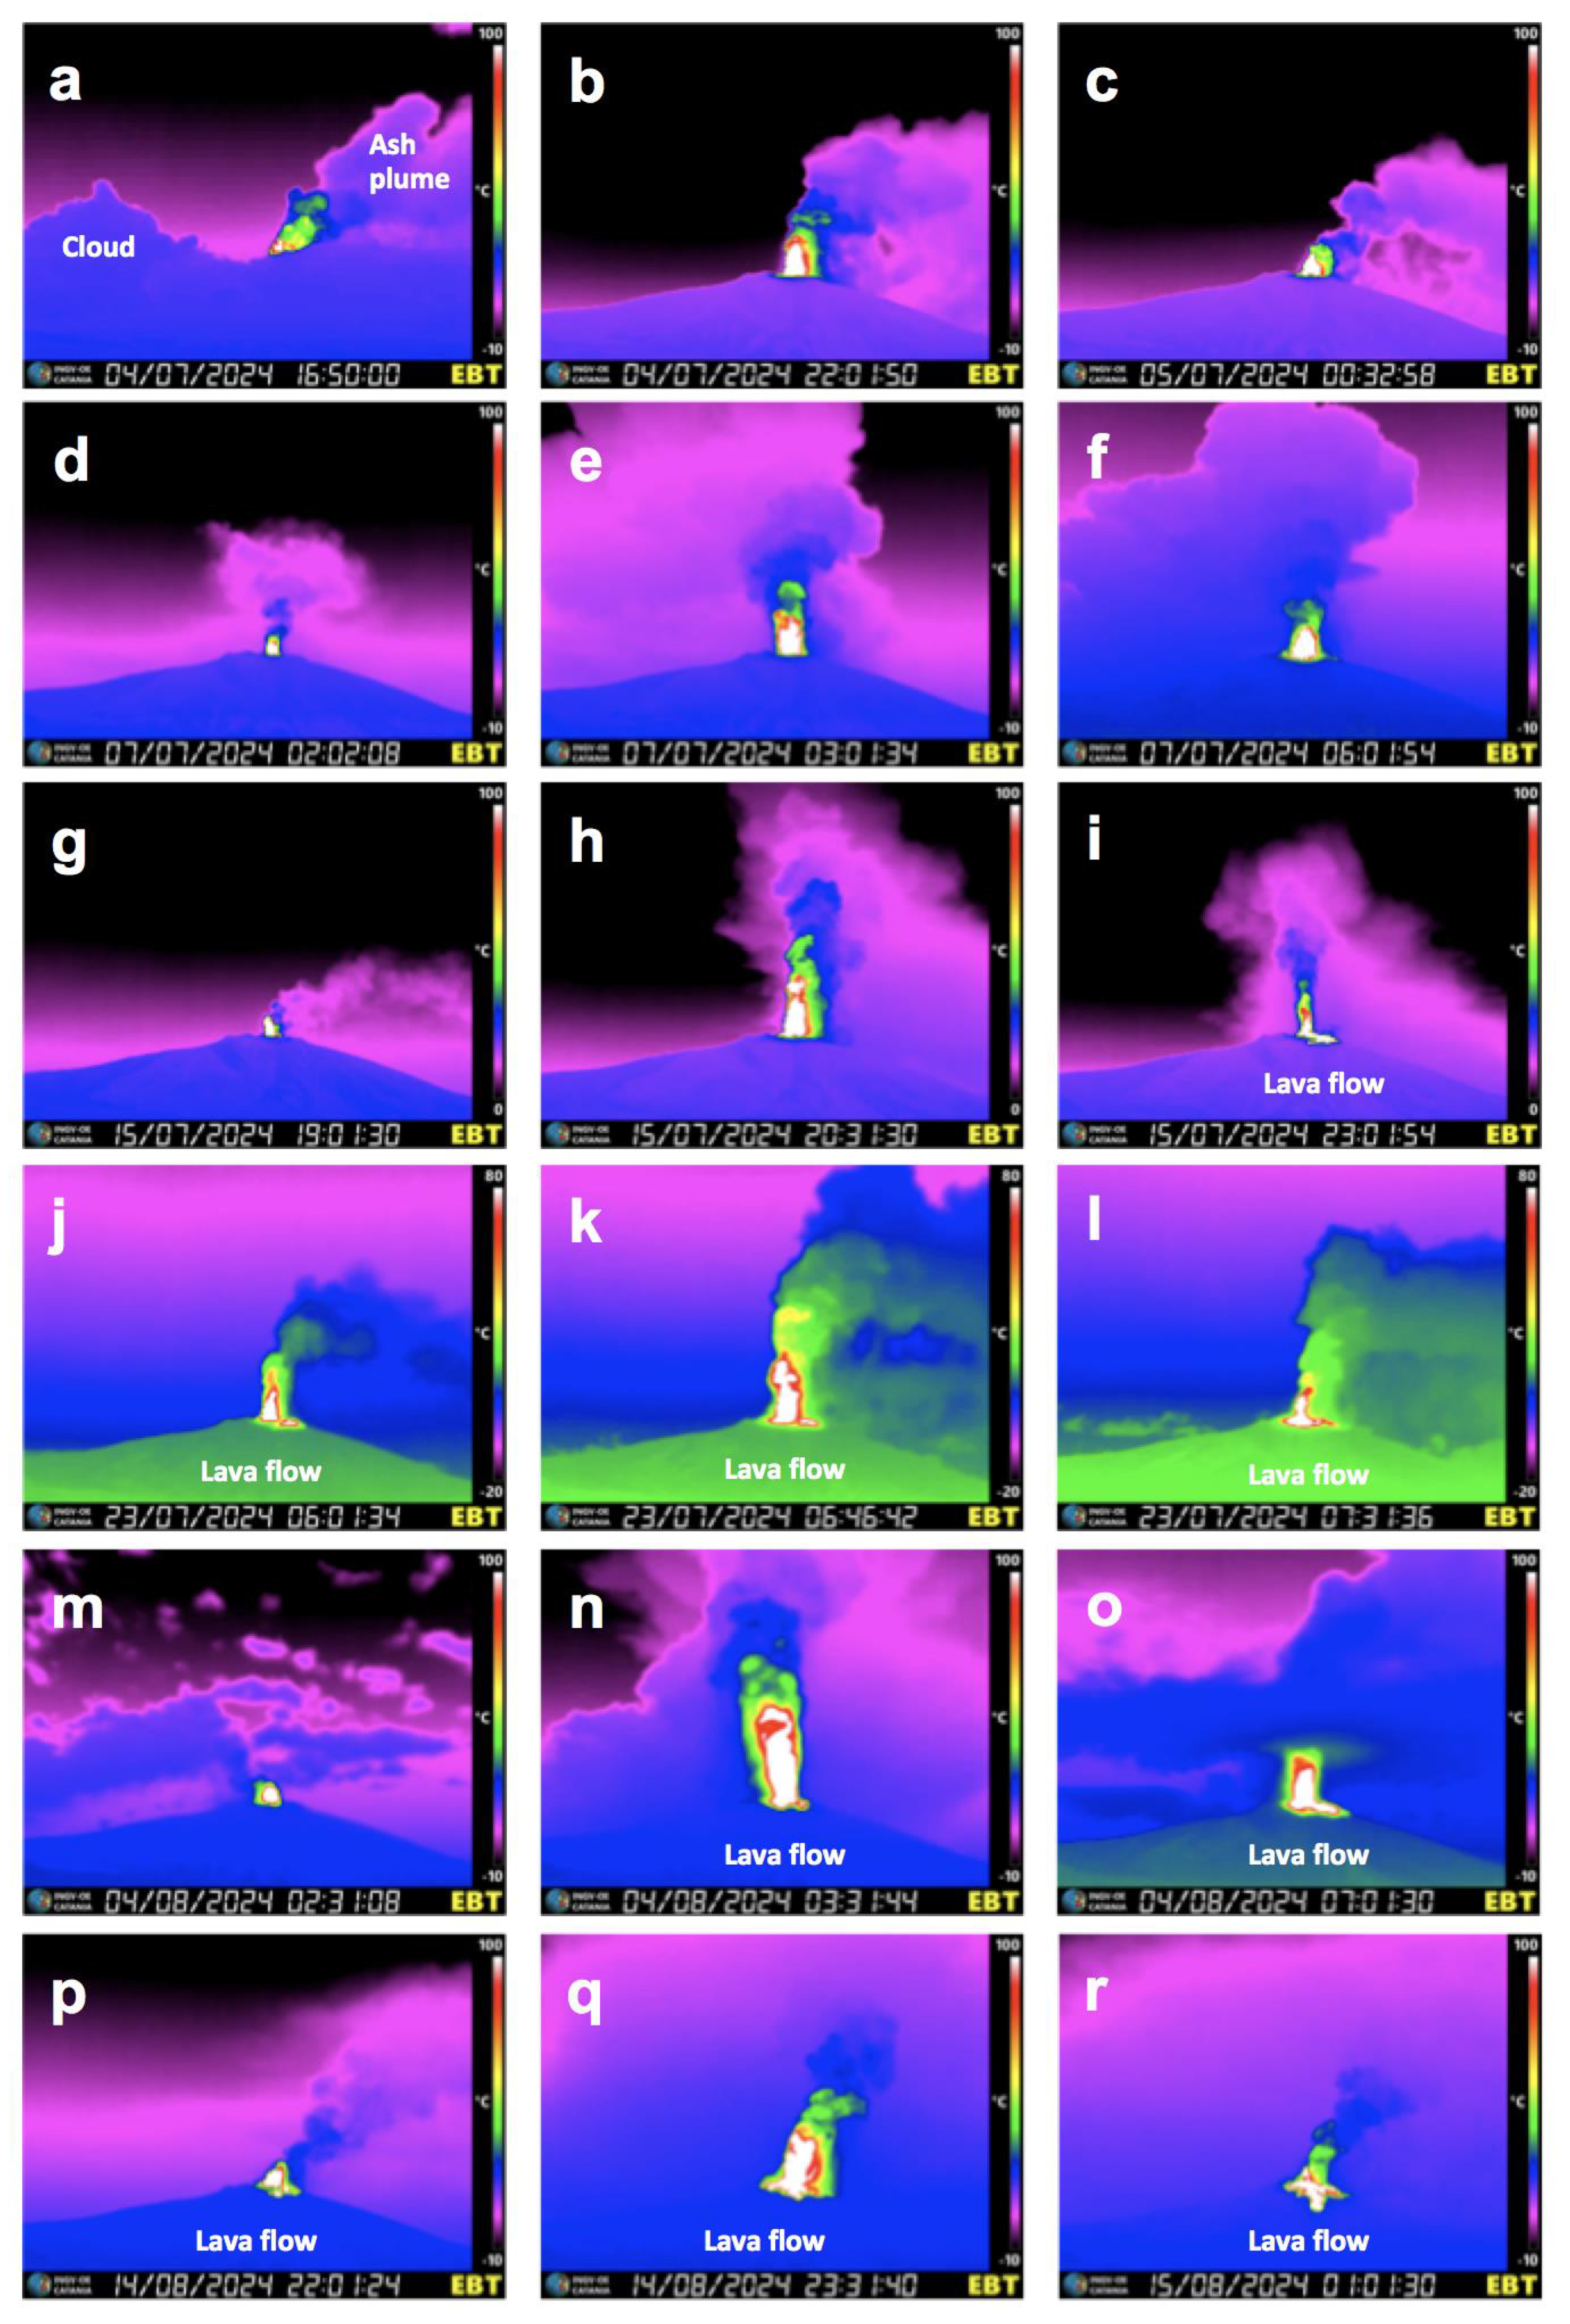
The first episode (Figure 6a, Figure 7a and Figure 8a–c) began its paroxysmal phase around 16:50 on 4 July 2024 and showed two phases, as the activity significantly decreased around 18:00 (Figure 7a) to resume shortly after 19:00 (Figure 7a), decline (Figure 8c) and finally end around 01:21 on 5 July 2024. However, upon reviewing the footage, it was evident that between 18:00 and 19:00, there was no real decrease in activity, but the field of view of the EBT camera was obscured by cloud cover (Figure 7a and Figure 8a); thus, the resulting erupted volume was underestimated. The presence of clouds had already prevented the visualization of the Strombolian activity starting at 12:00. The review of the images confirmed that the paroxysmal activity ended around 01:21 on 5 July 2024 and then continued as Strombolian activity (Figure 6a and Figure 7a).
The second episode (Figure 6b, Figure 7b and Figure 8d–f) began its paroxysmal phase at approximately 01:54 on 7 July and reached a maximum intensity at around 03:00 (Figure 8e). Subsequently, the intensity decreased and, after a relative peak around 05:20, ended at 07:23. The measured LF area data could be well fitted with a superposition of two Gaussian functions, as shown in Figure 7b. Some frames showing the beginning, the maximum intensity and the terminal phase are shown in Figure 8d–f.
The third episode (Figure 6c) began its paroxysmal phase at approximately 18:24 on 15 July and reached a maximum intensity around 20:43. Subsequently, the intensity gradually decreased and ended around 00:17. The measured data could be well fitted by superimposing a pair of Gaussian functions, as shown in Figure 7c. Some frames showing the onset, the maximum intensity and the terminal phase are shown in Figure 8g–i, respectively.
The fourth episode (Figure 6d) started its paroxysmal phase at approximately 05:43 on 23 July and reached a maximum intensity around 06:45. Subsequently, the intensity gradually decreased and ended around 08:00. Given the regularity of the episode, the measured data could be well fitted by a Gaussian function, as shown in Figure 7d. Some frames showing the onset, the maximum intensity and the terminal phase are shown in Figure 8j–l, respectively.
The fifth episode (Figure 6e) started its paroxysmal phase at about 02:19 on 4 August and reached a maximum intensity around 03:20. Subsequently, the intensity gradually decreased and ended around 08:12. The measured data could be well fitted by a pair of Gaussian functions, as shown in Figure 7e. Some frames showing the onset, the maximum intensity and the terminal phase are shown in Figure 8m, n and o, respectively.
The sixth episode (Figure 6f) began its paroxysmal phase at approximately 21:33 on 14 August and reached several intensity maxima between 22:30 and 00:05. Subsequently, the intensity gradually decreased and ended around 01:49. The measured data could be well fitted by a triplet of Gaussian functions, as shown in Figure 7f. Some frames showing the onset, the maximum intensity and the terminal phase are shown in Figure 8p–r, respectively.
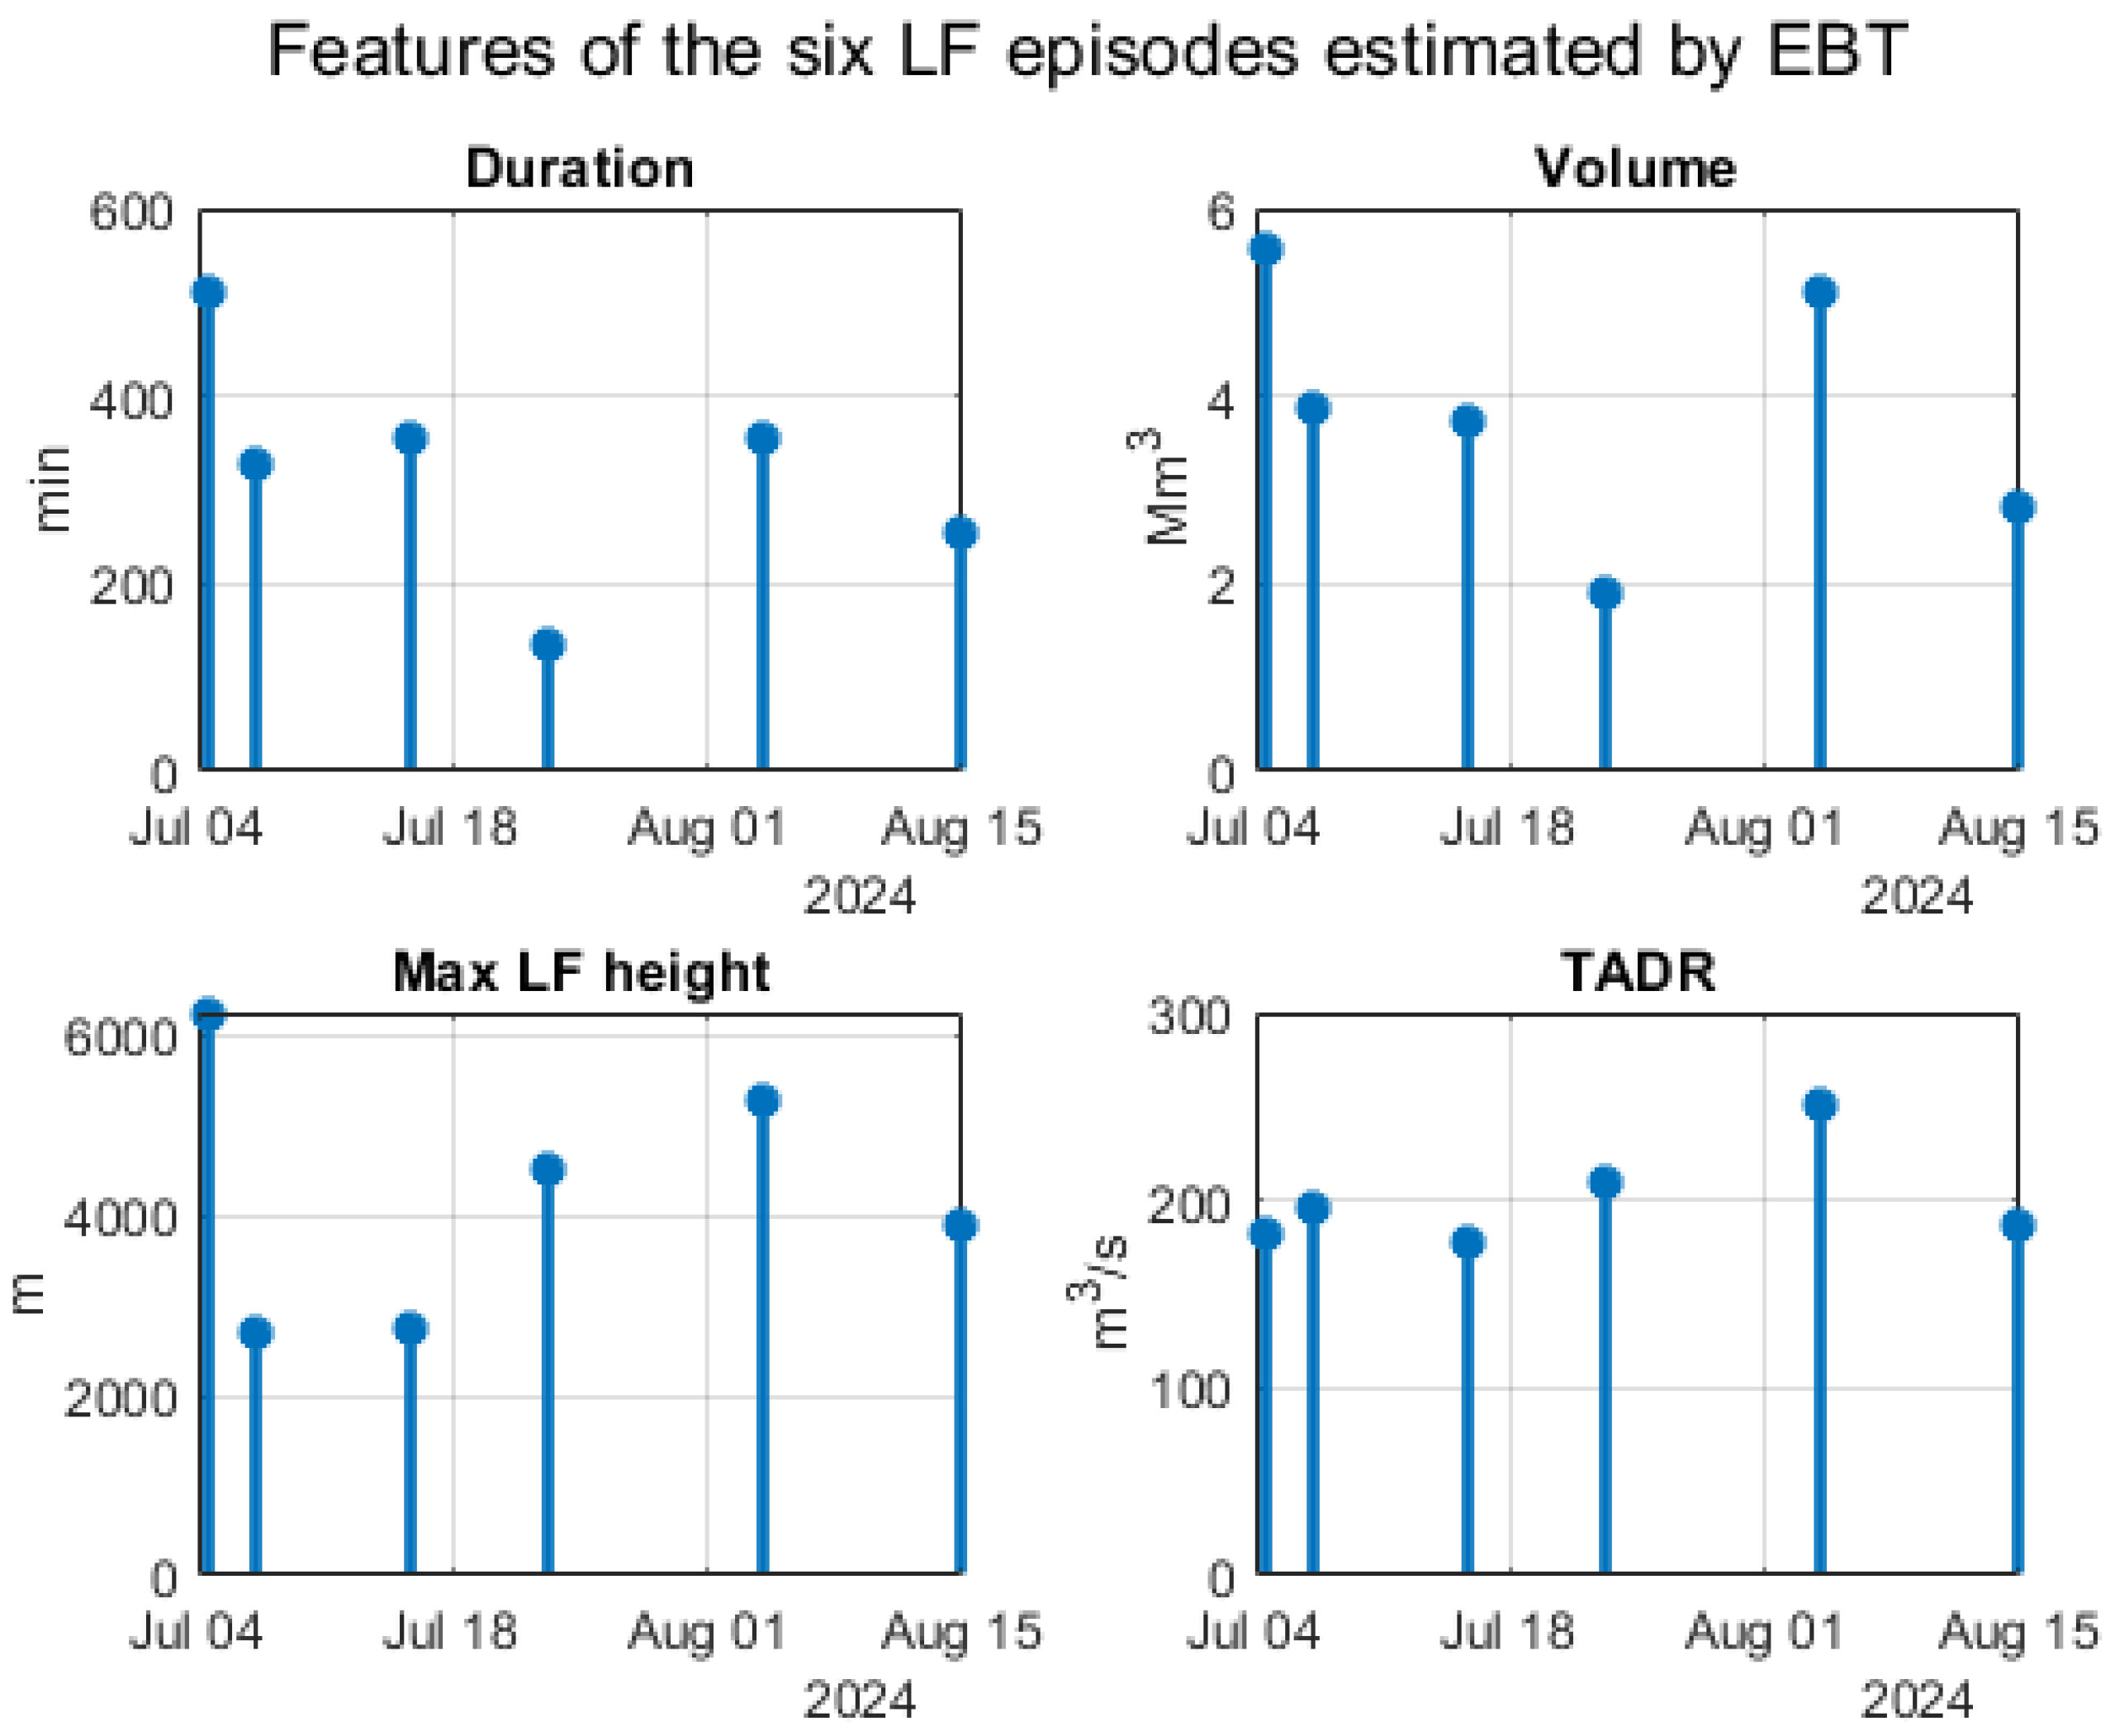
The starting and ending times and the duration of each event, together with the lava fountains’ height (maximum and average), erupted volume of pyroclastic material, and time-averaged discharge rate (TADR; [61]), are reported in Table 2 and graphically represented in Figure 9.
From Figure 9, it is evident that the first of the six studied episodes was clearly the most energetic, characterized by the longest duration, largest volume and highest maximum LF height. By contrast, the fourth episode was marked by the shortest duration and smallest volume.

5. Discussion

The observed episodic fountaining described above and occurring at VOR in 2024 and 2015 can be explained with two generic models available in the literature: (i) magma collection; (ii) pulsed supply [51]. The magma collection model (i) considers a shallow reservoir full of gas-rich magma that accumulates a foam layer at the roof up to a threshold thickness [8,46]. The collapse of the foam layer, once the threshold thickness is reached, causes one or more closely spaced fountaining episodes, allowing the shallow storage to be tapped [46,62]. This model would involve an almost constant erupted volume for each cycle of storage emptying [63]. The second model (ii) considers each paroxysmal episode being fed by a gas-rich magma batch entering the shallow storage. This batch would trigger a pressurization–depressurization cycle by increasing rise rate and volatile flux, coupled with rapid gas exsolution during ascent [51]. This model would involve a random distribution of the erupted volumes, each episode being fed by a batch of magma of a different size. This second model would be supported by a slightly different composition, crystallinity and gas content of the products erupted during the 2015 VOR paroxysms [64]. These heterogeneities can develop at time scales as short as a few tens of hours [64], which is the lapse of time between individual episodes. Thus, it is plausible that these heterogeneities form within the shallow conduit during magma ascent, that is, not in the deeper storage during its refilling. If we consider the trends of duration and erupted volume of each of the 2024 VOR paroxysms (Figure 9), a clear trend appears to group the first four episodes, which displayed a decreasing duration and a decreasing erupted volume with time, as already observed for the four episodes occurring at VOR in 2015 [44]. This decreasing trend would be compatible with the emptying of a shallow storage. As a proxy for the volume of the shallow storage, we can use the estimation of [44] and [52] for the four closely spaced paroxysmal episodes taking place at VOR in 2015, which erupted ~ 12 Mm3 magma in just 3 days. The total volume erupted during the first four 2024 VOR paroxysmal episodes was ~15 Mm3 (Table 3), which is remarkably close to the total volume estimated for the sequence of the four paroxysms occurred at VOR in 2015 [44,52]. In this framework, the last two paroxysmal explosive events at VOR in 2024, which erupted almost 10 Mm3 (Table 3), could represent a partial replenishment of the shallow storage during the twelve days spanning between the end of the fourth and the start of the fifth episode. This partial replenishment was possibly induced by the decompression due to the magma output of the previous four episodes. In the hypothesis that the shallow storage of VOR has a capacity of ~12–15 Mm3, it is thus possible that one or two additional explosive paroxysmal events could occur in the future. Interesting enough, a new paroxysmal event occurred at VOR on 10 November 2024, after this paper was submitted, thus confirming our hypothesis.
We can then speculate, on the basis of the calculated erupted volume from VOR, that the size of the shallow supply system of this crater has a capacity of ~12–15 Mm3 and, following previous geophysical results [44], is located at a depth of 1.5 km b.s.l. Compared to the results obtained from the SEC, it appears that the supply system of the SEC conduit is much shallower, being ~1.5 km a.s.l. [46], thus 3 km higher in the crust than that of VOR. The capacity of this storage is much smaller than that of the VOR storage, apparently in the order of ~2.5 Mm3 [2]. Thus, while the SEC storage is able to feed just one paroxysmal event, that of the VOR can be emptied with a sequence of episodes, cumulating all together a volume of ~12–15 Mm3. Recent data from Calvari and Nunnari [20] on the temporal distribution of LFs at the SEC from 2011 to 2022 concur with this hypothesis, showing that the interevent times of the paroxysmal sequences at the SEC follow a power law distribution. This indicates that the LFs at the SEC are governed by complex, non-linear dynamics rather than by regular, periodic processes.
If we compare our results to the analysis of explosive sequences obtained at other volcanoes [14,16,65], it appears evident that the most striking differences in the pattern of LF evolution are caused by the different structural settings. The emplacement and spreading of a feeder dike determine the sequence of LFs associated with flank eruptive activity at volcanoes that were previously quiescent [3,13,14,16,29,65]. Here, the LFs increase in strength while the dike is spreading and stabilizing and decrease when the available gas-rich magma is erupted, leaving room for discreet lava effusion [13,14,16,65]. A small but systematic shift of the active vents is also observed along the dike while it is still spreading [29]. In fact, effusive and explosive activity alternated at multiple vents while the eruptive fissure at Tajogaite (La Palma, Canary Islands) was active and still spreading [65], whereas at Etna, we have a stable open conduit fed by the emptying of a shallow storage. The 2021 Geldingadalir eruption in Iceland displayed episodic fountaining with different duration and repose times, related to the emplacement of the feeder dike [16]. Here, the amount of magma degassing within the fissure, the erosion of the conduit and collapses of the spatter and cinder cone comprising the fissure modulated the intensity of the LF [16]. The LFs at Kilauea volcano in 1983 were again related to the emplacement of the feeder dike and its spreading for about an 8 km length along the east rift zone [14]. Episodic fountaining recorded an increase in discharge rate and maximum height from episode 24 to 30, with tiltmeters recording cycles of gradual inflation of Kilauea’s summit between eruptive episodes and rapid deflation during fountaining episodes [14]. These refilling and emptying phases of Kilauea’s summit propagated downslope along the east rift zone, accompanying and feeding the spreading of the eruptive fissure [14]. The other endmember is displayed by the accumulation and release of gas–rich magma from a stable storage zone, frequently replenished by gas–rich magma, which determines the explosive sequences at the summit of open–conduit steady–state volcanoes such as Etna or Stromboli [2,15,62,63]. In this context, it is interesting to note that the same volcano could display both endmembers, depending on the LF being erupted from either the open–vent summit craters [2,6,20,21,24,27] or newly formed eruptive fissures [3,13,16]. Following the results presented in this paper and considering the eruptive history of Etna’s four summit craters, we can speculate that BN and NEC did not produce paroxysmal explosive sequences but just occasional and rare isolated paroxysmal events, because their shallow supply systems are small, possibly being lateral branches of the main feeder conduit. On the contrary, SEC and VOR have a much wider supply system, often refilled by gas–rich magma that accumulates at different depths and in separated storages and could be released by paroxysmal explosive sequences. The supply system of VOR is probably much larger than that of SEC, being located at a greater depth, with a greater lithostatic confining pressure.

6. Conclusive Remarks

Episodic LF sequences can occur in two different structural conditions: (1) at the summit of well–established, open–vent eruptive conduits; (2) along new eruptive fissures, giving rise to flank eruptions. The development in time of these episodic sequences is thus related to the emptying of a shallow storage feeding the summit conduit in the first case or to the spreading of the feeder dike, eventually leading to an effusive phase, in the second one. The case we described in this paper is related to Etna’s summit crater VOR, and we speculate that episodic LFs at this crater end once the shallow storage is tapped. Our results indicate that the volume of this shallow storage is ~12–15 Mm3. It is thus possible that one or two additional paroxysmal explosive episodes could occur in the future. It is remarkable that an additional paroxysmal event occurred at VOR on 10 November 2024 after this paper was submitted, thus confirming that our hypothesis was correct.
When considering episodic LFs occurring at the summit of a volcano, there are two available models [51]. These refer to the following events: (i) the collapse of a foam layer previously accumulated at the roof of a shallow chamber; (ii) a pulsed supply from the depths. The collapse of the foam layer (i) could possibly lead to a prediction of the lava fountain sequences once started, provided that the volume of each event is calculated. In this case, once the storage volume has erupted, there is no more magma available for more LF episodes. Conversely, in the case of a pulsed supply (ii), the duration of the episodic LF sequences would be governed by the rise of gas–rich magma from the depths and is thus, at the moment, difficult to predict, as [53] proposed for the LF sequences of the SEC occurring during the last few decades.
Although a comprehensive mathematical model for interpreting LF sequences is not yet available, the methods and analyses presented here lay a strong foundation for advancing both the understanding and the forecasting of such phenomena. These initial findings highlight the potential for developing predictive tools that can enhance hazard assessment and response strategies. Future work will focus on refining these approaches to increase their accuracy and applicability in real–time monitoring systems, paving the way towards quantitative models that support a more effective hazard forecasting.

Author Contributions

Conceptualization, S.C. and G.N.; methodology, G.N.; software, G.N.; validation, S.C. and G.N.; formal analysis, S.C. and G.N.; investigation, S.C. and G.N.; data curation, S.C. and G.N.; writing—original draft preparation, S.C. and G.N.; writing—review and editing, S.C. and G.N.; visualization, S.C. and G.N.; supervision, S.C. and G.N.; funding acquisition, S.C. All authors have read and agreed to the published version of the manuscript.

Funding

This research was funded by the project FIRST—ForecastIng eRuptive activity at Stromboli volcano (Delibera n. 144/2020; Scientific Responsibility: S.C.) INGV-Volcano Department, 2019. It was also supported by the Italian Research Center on High-Performance Computing Big Data and Quantum Computing (ICSC), a project funded by the European Union—NextGenerationEU—and the National Recovery and Resilience Plan (NRRP)—Mission 4 Component 2 within the activities of Spoke 3 (Astrophysics and Cosmos Observations).

Data Availability Statement

The webcam images used in this paper are the property of the Istituto Nazionale di Geofisica e Vulcanologia—Osservatorio Etneo, Sezione di Catania, and were used for monitoring purposes. A limited set of images can be requested from the first author of this paper.

Acknowledgments

We would like to warmly thank the four anonymous reviewers, whose comments and constructive criticism allowed us to significantly improve the paper, and Stephan Conway for revising the English style.

Conflicts of Interest

The authors declare no conflicts of interest.

List of the Acronyms Used in This Paper

a.s.l.above sea level
b.s.l.below sea level
BNBocca Nuova crater
Eeast
EBTEtna, Bronte thermal
EMCTEtna, Monte Cagliato thermal
INGV–OEIstituto Nazionale di Geofisica e Vulcanologia, Osservatorio Etneo
LFlava fountain
NECNorth-East Crater
NWnorth-west
RGBred, green and blue
ROIregion of interest
SEsouth-east
SECSouth-East Crater
SSEsouth-south-east
SSWsouth-south-west
TADRtime-averaged discharge rate
UTCCoordinated Universal Time
VORVoragine crater W = west

References

  1. Mangan, M.; Cashman, K.; Swanson, D. The dynamics of Hawaiian-style eruptions: A century of study. In Characteristics of Hawaiian Volcanoes; USGS Professional Paper; Poland, M., Takahashi, T., Landowski, C., Eds.; US Geological Survey: Reston, VA, USA, 2014; Volume 1801, pp. 323–356. [Google Scholar]
  2. Calvari, S.; Cannavò, F.; Bonaccorso, A.; Spampinato, L.; Pellegrino, A.G. Paroxysmal Explosions, Lava Fountains and Ash Plumes at Etna Volcano: Eruptive Processes and Hazard Implications. Front. Earth Sci. 2018, 6, 107. [Google Scholar] [CrossRef]
  3. Calvari, S.; Bilotta, G.; Bonaccorso, A.; Caltabiano, T.; Cappello, A.; Corradino, C.; Del Negro, C.; Ganci, G.; Neri, M.; Pecora, E.; et al. The VEI 2 Christmas 2018 Etna Eruption: A Small But Intense Eruptive Event or the Starting Phase of a Larger One? Remote Sens. 2020, 12, 905. [Google Scholar] [CrossRef]
  4. Witt, T.; Walter, T.R.; Müller, D.; Guðmundsson, M.T.; Schöpa, A. The Relationship Between Lava Fountaining and Vent Morphology for the 2014–2015 Holuhraun Eruption, Iceland, Analyzed by Video Monitoring and Topographic Mapping. Front. Earth Sci. 2018, 6, 235. [Google Scholar] [CrossRef]
  5. Neal, C.A.; Brantley, S.R.; Antolik, L.; Babb, J.L.; Burgess, M.; Calles, K.; Cappos, M.; Chang, J.C.; Conway, S.; Desmither, L.; et al. The 2018 rift eruption and summit collapse of Kīlauea Volcano. Science 2019, 363, 367–374. [Google Scholar] [CrossRef]
  6. Andronico, D.; Cannata, A.; Di Grazia, G.; Ferrari, F. The 1986–2021 paroxysmal episodes at the summit craters of Mt. Etna: Insights into volcano dynamics and hazard. Earth-Sci. Rev. 2021, 220, 103686. [Google Scholar] [CrossRef]
  7. Wilson, L.; Head, J.W., III. Ascent and Eruption of Basaltic Magma on the Earth and Moon. J. Geophys. Res. 1981, 86, 2971–3001. [Google Scholar] [CrossRef]
  8. Jaupart, C.; Vergniolle, S. The generation and collapse of a foam layer at the roof of a basaltic magma chamber. J. Fluid Mech. 1989, 203, 347–380. [Google Scholar] [CrossRef]
  9. Vergniolle, S.; Jaupart, C. The dynamics of degassing at Kilauea volcano. Hawaii. J. Geophys. Res. 1990, 95, 2793–2809. [Google Scholar] [CrossRef]
  10. Parfitt, E.A.; Wilson, L. Explosive volcanic eruptions-IX. The transition between Hawaiian-style lava fountaining and Strombolian explosive activity. Geophys. J. Int. 1995, 121, 226–232. [Google Scholar] [CrossRef]
  11. Head, J.W.; Wilson, L. Lava fountain heights at Pu’u ‘O’o, Kilauea, Hawaii: Indicators of amount and variations of exsolved magma volatiles. J. Geophys. Res. Solid. Earth 1987, 92, 13715–13719. [Google Scholar] [CrossRef]
  12. Parfitt, E.; Wilson, L.; Neal, C. Factors influencing the height of Hawaiian lava fountains: Implications for the use of fountain height as an indicator of magma gas content. Bull. Volcanol. 1995, 57, 440–450. [Google Scholar] [CrossRef]
  13. Spampinato, L.; Calvari, S.; Oppenheimer, C.; Lodato, L. Shallow magma transport for the 2002-03 Mt. Etna eruption inferred from thermal infrared surveys. J. Volcanol. Geotherm. Res. 2008, 177, 301–312. [Google Scholar] [CrossRef]
  14. Heliker, C.; Mattox, T.N. The First Two Decades of the Pu’u ‘O’o-Kupaianaha Eruption: Chronology and Selected Bibliography; U.S. Geological Survey Professional Paper; US Geological Survey: Reston, VA, USA, 2003; Volume 1676, pp. 1–27. [Google Scholar]
  15. Privitera, E.; Sgroi, T.; Gresta, S. Statistical analysis of intermittent volcanic tremor associated with the September 1989 summit explosive eruptions at Mount Etna, Sicily. J Volcanol Geotherm Res 2003, 120, 235–247. [Google Scholar] [CrossRef]
  16. Eibl, E.P.S.; Thordarson, T.; Höskuldsson, Á.; Gudnason, E.Á.; Dietrich, T.; Hersir, G.P.; Ágústsdóttir, T. Evolving shallow conduit revealed by tremor and vent activity observations during episodic lava fountaining of the 2021 Geldingadalir eruption, Iceland. Bull. Volcanol. 2023, 85, 10. [Google Scholar] [CrossRef]
  17. Swanson, D.A.; Duffield, W.A.; Jackson, D.B.; Peterson, D.W. Chronological Narrative of the 1969-71 Mauna Ulu Eruption of Kilauea Volcano, Hawaii; United States Department of the Interior, Gwological Survey: Washington, DC, USA, 1979; Volume 1056, p. 55, U.S Geol Surv Prof Paper. [Google Scholar]
  18. Wolfe, E.W.; Neal, C.A.; Banks, N.G.; Duggan, T.J. Geologic Observations and Chronology of Eruptive Events; 1988; Volume 1463, pp. 1–98, USGS Prof. Paper. [Google Scholar]
  19. Heliker, C.; Wright, T.J. The Pu’u ‘O’o-Kupaianaha Eruption of Kilauea. EOS Trans. Am. Geophys. Union. 1991, 72, 521–536. [Google Scholar] [CrossRef]
  20. Calvari, S.; Nunnari, G. Etna Output Rate during the Last Decade (2011–2022): Insights for Hazard Assessment. Remote Sens. 2022, 14, 6183. [Google Scholar] [CrossRef]
  21. Calvari, S.; Salerno, G.G.; Spampinato, L.; Gouhier, M.; La Spina, A.; Pecora, E.; Harris, A.J.L.; Labazuy, P.; Biale, E.; Boschi, E. An unloading foam model to constrain Etna’s 11–13 January 2011 lava fountaining episode. J. Geophys. Res. 2011, 116, B11207. [Google Scholar] [CrossRef]
  22. Calvari, S.; Pinkerton, H. Instabilities in the summit region of Mount Etna during the 1999 eruption. Bull. Volcanol. 2001, 63, 526–535. [Google Scholar] [CrossRef]
  23. Behncke, B.; Neri, M.; Carniel, R. An exceptional case of endogenous lava dome growth spawning pyroclastic avalanches: The 1999 Bocca Nuova eruption of Mt. Etna (Italy). J. Volcanol. Geotherm. Res. 2003, 124, 115–128. [Google Scholar] [CrossRef]
  24. Andronico, D.; Cristaldi, A.; Scollo, S. The 4–5 September 2007 lava fountain at South-East Crater of Mt Etna, Italy. J. Volcanol. Geotherm. Res. 2008, 173, 325–328. [Google Scholar] [CrossRef]
  25. Andronico, D.; Branca, S.; Calvari, S.; Burton, M.R.; Caltabiano, T.; Corsaro, R.A.; Del Carlo, P.; Garfì, G.; Lodato, L.; Miraglia, L.; et al. A multi-disciplinary study of the 2002-03 Etna eruption: Insights for a complex plumbing system. Bull. Volc. 2005, 67, 314–330. [Google Scholar] [CrossRef]
  26. Di Traglia, F.; Battaglia, M.; Nolesini, T.; Lagomarsino, D.; Casagli, N. Shifts in the eruptive styles at Stromboli in 2010–2014 revealed by ground-based InSAR data. Sci. Rep. 2015, 5, srep13569. [Google Scholar] [CrossRef]
  27. Giordano, G.; De Astis, G. The summer 2019 basaltic Vulcanian eruptions (paroxysms) of Stromboli. Bull. Volcanol. 2020, 83, 1. [Google Scholar] [CrossRef]
  28. Calvari, S.; Di Traglia, F.; Ganci, G.; Bruno, V.; Ciancitto, F.; Di Lieto, B.; Gambino, S.; Garcia, A.; Giudicepietro, F.; Inguaggiato, S.; et al. Multi-parametric study of an eruptive phase comprising unrest, major explosions, crater failure, pyroclastic density currents and lava flows: Stromboli volcano, 1 December 2002–30 June 2021. Front. Earth Sci. 2022, 10, 899635. [Google Scholar] [CrossRef]
  29. Witt, T.; Walter, T.R. Video monitoring reveals pulsating vents and propagation path of fissure eruption during the March 2011 Pu’u ‘Ō’ō eruption, Kilauea volcano. J. Volcanol. Geotherm. Res. 2017, 330, 43–55. [Google Scholar] [CrossRef]
  30. Bonaccorso, A.; Calvari, S. Major effusive eruptions and recent lava fountains: Balance between expected and erupted magma volumes at Etna volcano. Geophys. Res. Lett. 2013, 40, 6069–6073. [Google Scholar] [CrossRef]
  31. Viccaro, M.; Giuffrida, M.; Zuccarello, F.; Scandura, M.; Palano, M.; Gresta, S. Violent paroxysmal activity drives self-feeding magma replenishment at Mt. Etna. Sci. Rep. 2019, 9, 6717. [Google Scholar] [CrossRef]
  32. Poret, M.; Corradini, S.; Merucci, L.; Costa, A.; Andronico, D.; Montopoli, M.; Vulpiani, G.; Freret-Lorgeril, V. Reconstructing volcanic plume evolution integrating satellite and ground-based data: Application to the 23 November 2013 Etna eruption. Atmos. Chem. Phys. 2018, 18, 4695–4714. [Google Scholar] [CrossRef]
  33. Scollo, S.; Prestifilippo, M.; Bonadonna, C.; Cioni, R.; Corradini, S.; Degruyter, W.; Rossi, E.; Silvestri, M.; Biale, E.; Carparelli, G.; et al. Near-Real-Time Tephra Fallout Assessment at Mt. Etna, Italy. Remote Sens. 2019, 11, 2987. [Google Scholar] [CrossRef]
  34. Andronico, D.; Scollo, S.; Cristaldi, A.; Ferrari, F. Monitoring ash emission episodes at Mt. Etna: The 16 November 2006 case study. J. Volcanol. Geotherm. Res. 2009, 180, 123–134. [Google Scholar] [CrossRef]
  35. Horwell, C.J.; Sargent, P.; Andronico, D.; Castro, M.D.L.; Tomatis, M.; Hillman, S.E.; Michnowicz, S.A.K.; Fubini, B. The iron-catalysed surface reactivity and health-pertinent physical characteristics of explosive volcanic ash from Mt. Etna, Italy. J. Appl. Volcanol. 2017, 6, 12. [Google Scholar] [CrossRef]
  36. Pailot-Bonnétat, S.; Harris, A.J.L.; Calvari, S.; De Michele, M.; Gurioli, L. Plume Height Time-Series Retrieval Using Shadow in Single Spatial Resolution Satellite Images. Remote Sens. 2020, 12, 3951. [Google Scholar] [CrossRef]
  37. Calvari, S.; Coltelli, M.; Muller, W.; Pompilio, M.; Scribano, V. Eruptive history of the South-East Crater of Mount Etna, from 1971 to 1994. Acta Vulcanol. 1994, 5, 11–14. [Google Scholar]
  38. Behncke, B.; Neri, M.; Pecora, E.; Zanon, V. The exceptional activity and growth of the Southeast Crater, Mount Etna (Italy), between 1996 and 2001. Bull. Volcanol. 2006, 69, 149–173. [Google Scholar] [CrossRef]
  39. Rittmann, A.; Romano, R.; Sturiale, C. Some considerations on the 1971 Etna eruption and on the tectonophysics of the Mediterranean area. Int. J. Earth Sci. 1973, 62, 418–430. [Google Scholar] [CrossRef]
  40. Ganci, G.; Cappello, A.; Neri, M. Data Fusion for Satellite-Derived Earth Surface: The 2021 Topographic Map of Etna Volcano. Remote. Sens. 2023, 15, 198. [Google Scholar] [CrossRef]
  41. Guest, J.E. Mount Etna and the 1971 eruption—The summit of Mount Etna prior to the 1971 eruptions. Philos. Trans. R. Soc. London. Ser. A 1973, 274, 63–78. [Google Scholar] [CrossRef]
  42. Calvari, S.; Biale, E.; Bonaccorso, A.; Cannata, A.; Carleo, L.; Currenti, G.; Di Grazia, G.; Ganci, G.; Iozzia, A.; Pecora, E.; et al. Explosive Paroxysmal Events at Etna Volcano of Different Magnitude and Intensity Explored through a Multidisciplinary Monitoring System. Remote. Sens. 2022, 14, 4006. [Google Scholar] [CrossRef]
  43. Ganci, G.; Bilotta, G.; Zuccarello, F.; Calvari, S.; Cappello, A. A Multi-Sensor Satellite Approach to Characterize the Volcanic Deposits Emitted during Etna’s Lava Fountaining: The 2020–2022 Study Case. Remote Sens. 2023, 15, 916. [Google Scholar] [CrossRef]
  44. Bonaccorso, A.; Calvari, S. A new approach to investigate an eruptive paroxysmal sequence using camera and strainmeter networks: Lessons from the 3–5 December 2015 activity at Etna volcano. Earth Planet. Sci. Lett. 2017, 475, 231–241. [Google Scholar] [CrossRef]
  45. Andronico, D.; Corsaro, R.A. Lava fountains during the episodic eruption of South–East Crater (Mt. Etna), 2000: Insights into magma-gas dynamics within the shallow volcano plumbing system. Bull. Volcanol. 2011, 73, 1165–1178. [Google Scholar] [CrossRef]
  46. Allard, P.; Burton, M.; Muré, F. Spectroscopic evidence for a lava fountain driven by previously accumulated magmatic gas. Nature 2005, 433, 407–410. [Google Scholar] [CrossRef] [PubMed]
  47. Coltelli, M.; Puglisi, G.; Guglielmino, F.; Palano, M. Application of Differential SAR Interferometry for Studying Eruptive Event of 22 July 1998 at Mt. Etna. Development and Application of Remote Sensing Methods for the Monitoring of Active Italian Volcanoes. 2006. Quaderni di Geofisica, 43, 15-20. Available online: https://www.earth-prints.org/handle/2122/2614 (accessed on 15 November 2024).
  48. Aloisi, M.; D’Agostino, M.; Dean, K.G.; Mostaccio, A.; Neri, G. Satellite analysis and PUFF simulation of the eruptive cloud generated by the Mount Etna paroxysm of 22 July 1998. J. Geophys. Res. 2002, 107, 2373. [Google Scholar] [CrossRef]
  49. Bonaccorso, A. Explosive activity at Mt. Etna summit craters and source modelling by using high precision continuous tilt. J. Volcanol. Geotherm. Res. 2006, 158, 221–234. [Google Scholar]
  50. Calvari, S.; Neri, M.; Pinkerton, H. Effusion rate estimations during the 1999 summit eruption on Mt. Etna, and growth of two distinct lava flow fields. J. Volcanol. Geotherm. Res. 2003, 119, 107–123. [Google Scholar] [CrossRef]
  51. Harris, A.J.L.; Neri, M. Volumetric observations during paroxysmal eruptions at Mount Etna: Pressurized drainage of a shallow chamber or pulsed supply? Journal of Volcanology and Geothermal Research 2002, 116, 79–95. [Google Scholar] [CrossRef]
  52. Neri, M.; De Maio, M.; Crepaldi, S.; Suozzi, E.; Lavy, M.; Marchionatti, F.; Calvari, S.; Buongiorno, M.F. Topographic Maps of Mount Etna’s Summit Craters, updated to December 2015. J. Maps 2017, 13, 674–683. [Google Scholar] [CrossRef]
  53. Calvari, S.; Nunnari, G. Comparison between Automated and Manual Detection of Lava Fountains from Fixed Monitoring Thermal Cameras at Etna Volcano, Italy. Remote. Sens. 2022, 14, 2392. [Google Scholar] [CrossRef]
  54. INGV-OE, Bollettino Etna mensile del giugno 2024; Rep. N. M6/2024 ETNA. Available online: www.ct.ingv.it (accessed on 15 July 2024).
  55. INGV-OE, Bollettino settimanale Etna del 09/07/2024, Rep. N. 28/2024 ETNA. Available online: www.ct.ingv.it (accessed on 15 July 2024).
  56. INGV-OE, Bollettino settimanale Etna del 16/07/2024, Rep. N. 29/2024 ETNA. Available online: www.ct.ingv.it (accessed on 20 July 2024).
  57. INGV-OE, Bollettino settimanale Etna del 23/07/2024, Rep. N. 30/2024 ETNA. Available online: www.ct.ingv.it (accessed on 24 July 2024).
  58. INGV-OE, Bollettino settimanale Etna del 30/07/2024, Rep. N. 31/2024 ETNA. Available online: www.ct.ingv.it (accessed on 31 July 2024).
  59. INGV-OE, Bollettino settimanale Etna del 06/08/2024, Rep. N. 32/2024 ETNA. Available online: www.ct.ingv.it (accessed on 8 August 2024).
  60. INGV-OE, Bollettino settimanale Etna del 20/08/2024, Rep. N. 34/2024 ETNA. Available online: www.ct.ingv.it (accessed on 22 August 2024).
  61. Harris, A.J.L.; Dehn, J.; Calvari, S. Lava effusion rate definition and measurement: A review. Bull. Volcanol. 2007, 70, 1–22. [Google Scholar] [CrossRef]
  62. Bonaccorso, A.; Calvari, S.; Linde, A.; Sacks, S.; Boschi, E. Dynamics of the shallow plumbing system investigated from borehole strainmeters and cameras during the 15 March, 2007 Vulcanian paroxysm at Stromboli volcano. Earth Planet. Sci. Lett. 2012, 357–358, 249–256. [Google Scholar] [CrossRef]
  63. Calvari, S.; Spampinato, L.; Bonaccorso, A.; Oppenheimer, C.; Rivalta, E.; Boschi, E. Lava effusion—A slow fuse for paroxysms at Stromboli volcano? Earth Planet. Sci. Lett. 2011, 301, 317–323. [Google Scholar] [CrossRef]
  64. Pompilio, M.; Bertagnini, A.; Del Carlo, P.; Di Roberto, A. Magma dynamics within a basaltic conduit revealed by textural and compositional features of erupted ash: The December 2015 Mt. Etna paroxysms. Sci. Rep. 2017, 7, 4805. [Google Scholar] [CrossRef] [PubMed]
  65. Birnbaum, J.; Lev, E.; Hernandez, P.A.; Barrancos, J.; Padilla, G.D.; Asensio-Ramos, M.; Calvo, D.; Rodríguez, F.; Pérez, N.M.; D’auria, L.; et al. Temporal variability of explosive activity at Tajogaite volcano, Cumbre Vieja (Canary Islands), 2021 eruption from ground-based infrared photography and videography. Front. Earth Sci. 2023, 11, 1193436. [Google Scholar] [CrossRef]
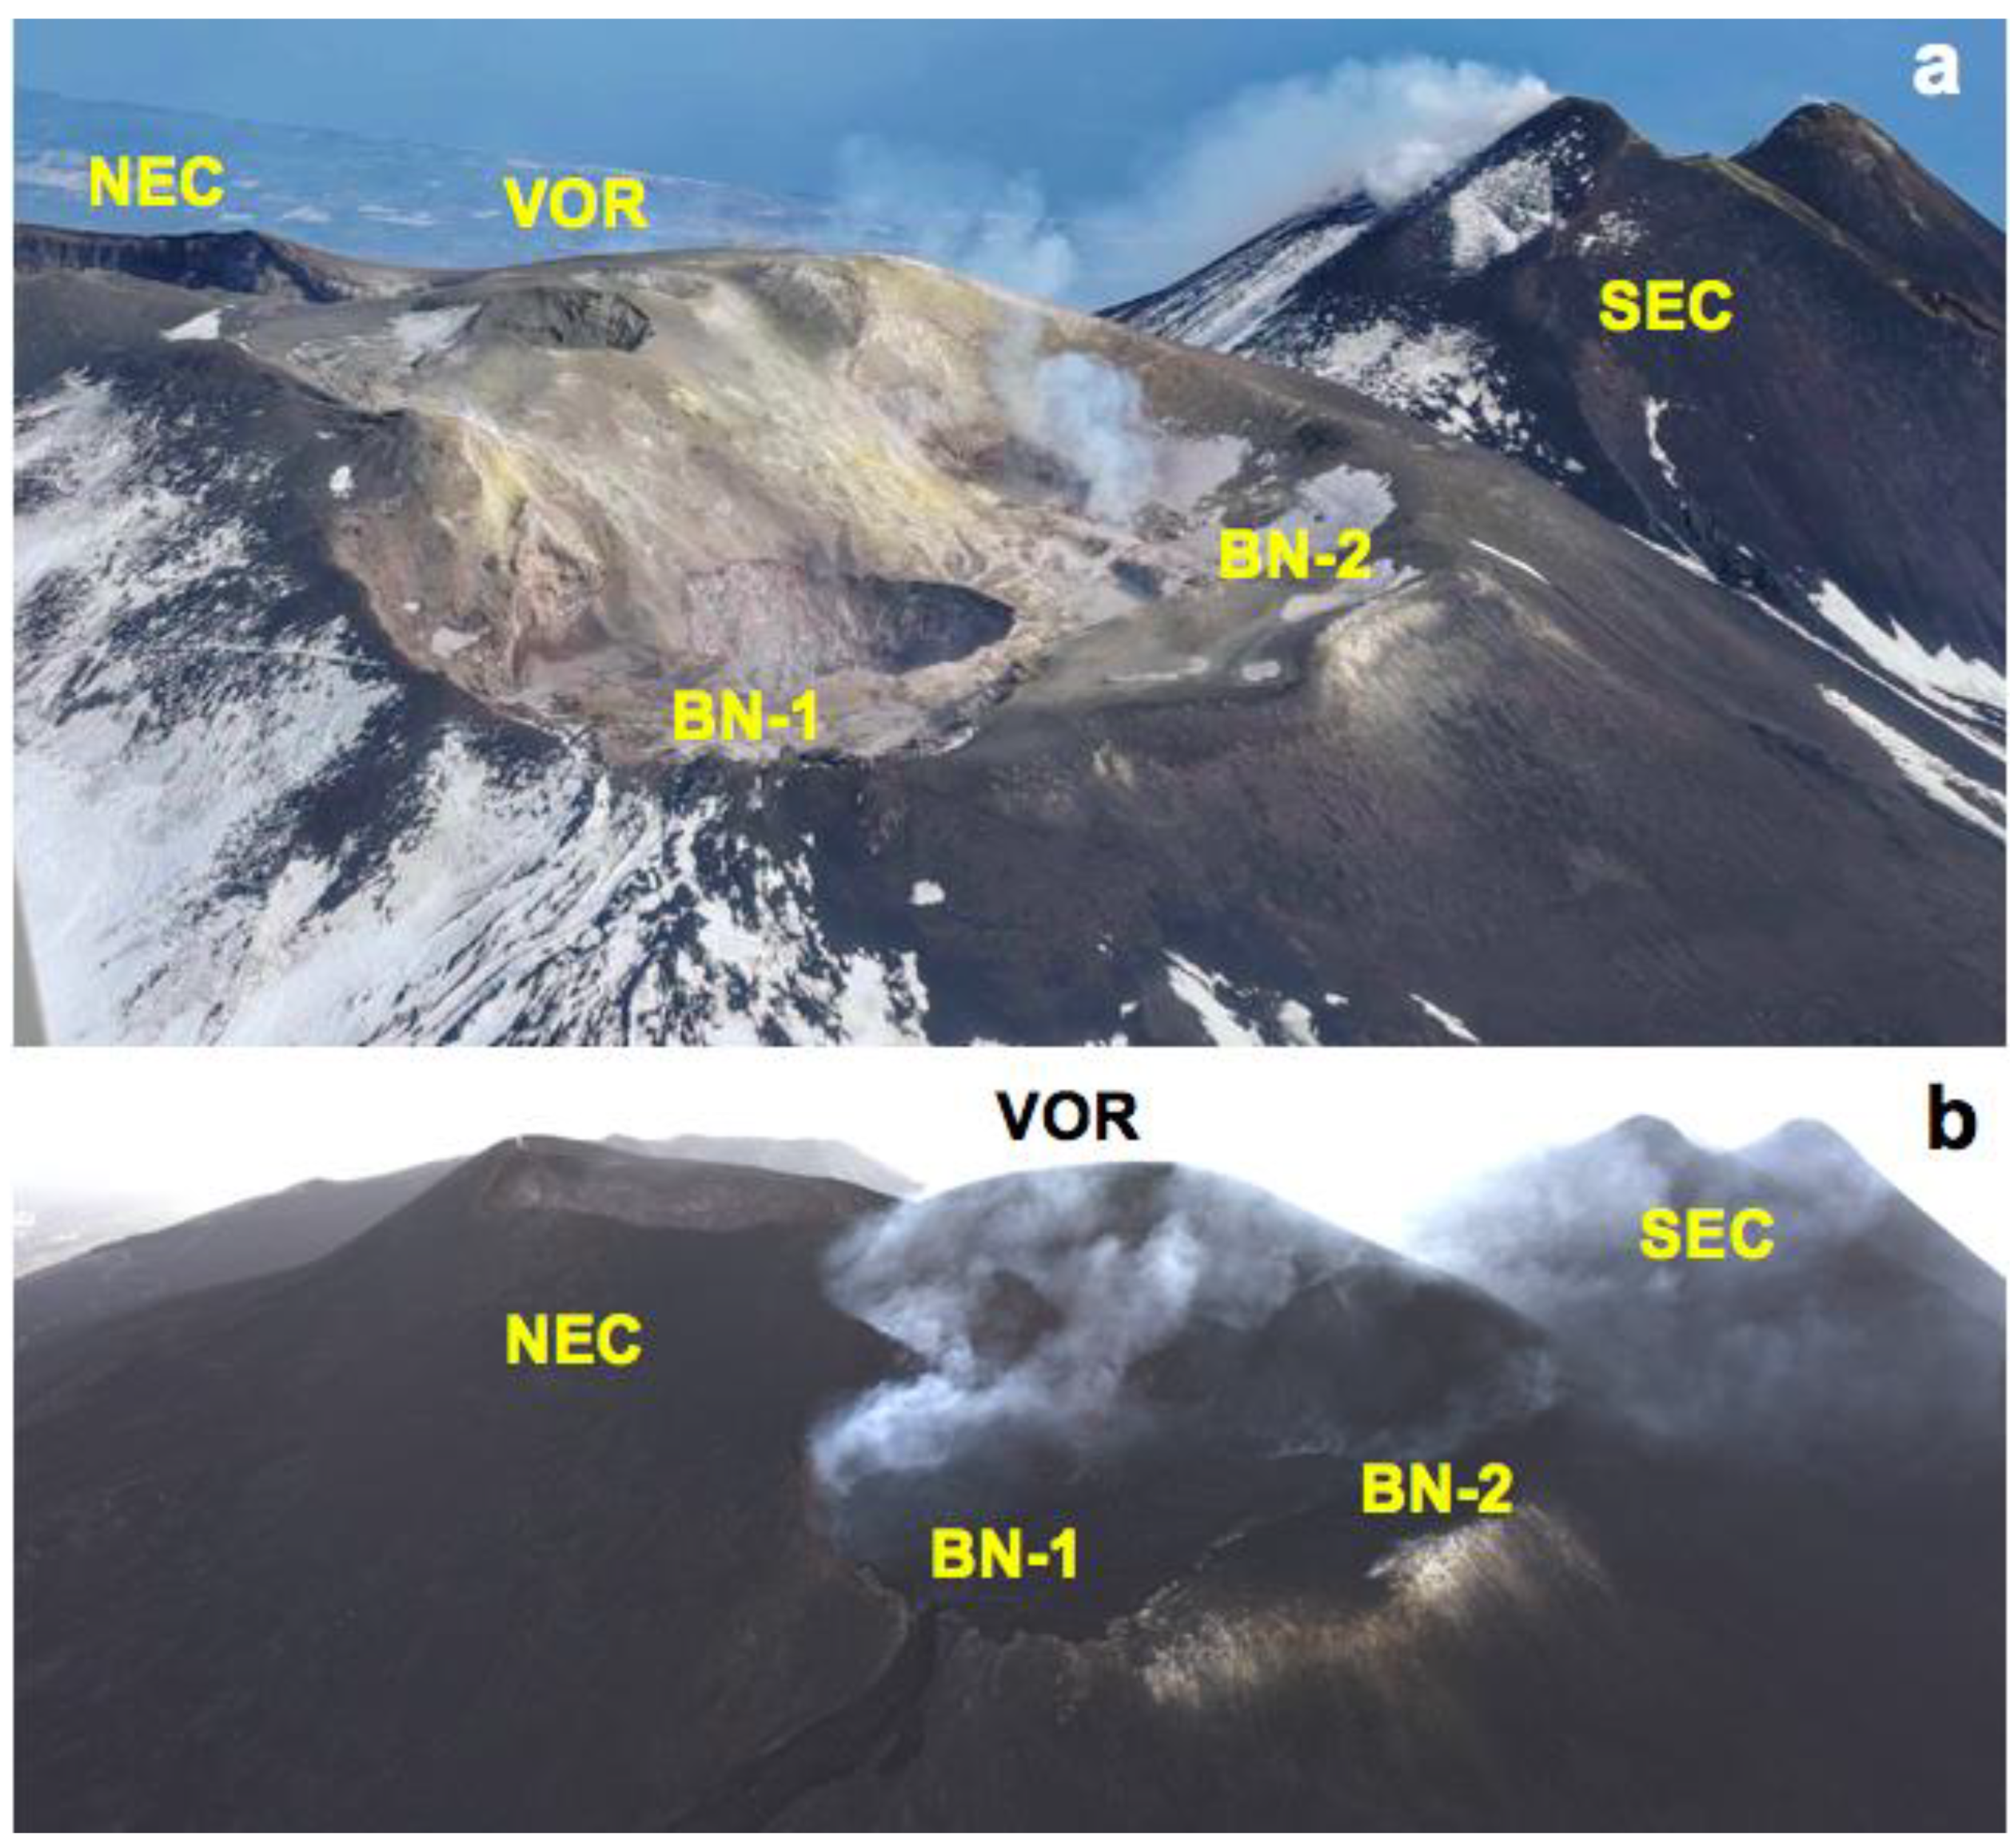
Figure 1. Photos of Etna’s summit craters taken from a helicopter on 9 February (a) and 9 July (b) 2024. NEC = North-East Crater; SEC = South-East Crater; BN-1 and BN-2 are the two pits of the Bocca Nuova crater; VOR = Voragine. The comparison between the two photos taken five months apart shows the growth of the Voragine owing to the eruptive activity occurring between February and July 2024. (a) Photo by Maria Catania, INGV-OE. (b) Photo by Stefano Branca, INGV-OE.
Remotesensing 16 04278 g001
Figure 2. (a) Google Earth map of Italy, with the yellow rectangle showing Sicily, framed in (b). (b) Google Earth map of Sicily, with the yellow rectangle showing Mt. Etna volcano, framed in (c). (c) Google Earth map of Etna volcano, with the summit, where the name Etna is displayed, and the position of the EBT and EMCT INGV-OE cameras.
Remotesensing 16 04278 g002
Figure 3. Delimiting a mask (blue line with blue dots) to outline the Region of Interest (ROI): the blue line traces the boundary of the area to be analyzed, with the black region above the mask representing the ROI. This mask serves to isolate the volcanic activity by excluding the lower regions, minimizing data noise from surrounding non-essential areas and enhancing the focus on the primary activity zone for subsequent analysis.
Remotesensing 16 04278 g003
Figure 4. (a) RGB frame showing an ongoing lava fountain and associated lava flows spreading in multiple directions. The frame also includes a color bar (right) and a bar with camera name, date and time (bottom). This original frame provides the full color context but contains extraneous elements that may interfere with a quantitative analysis. (b) The same image as in (a) after conversion to gray scale using an appropriate threshold. This step removes color information, focusing on the contrast between active volcanic features and the background, reducing color noise and isolating key areas for further analysis. (c) The cropped image with the right and bottom bars removed. This step eliminates graphical noise from the color bar and timestamp, retaining only the Region of Interest (ROI) and enhancing the accuracy in identifying volcanic phenomena. (d) The binarized image, which highlights contrast between active and inactive areas. This improves the visibility of high-intensity regions, making it easier to accurately identify and assess areas of volcanic activity. (e) The mask (white) to delimit the ROI and exclude the lava flow area. This mask further isolates the lava fountain and nearby active areas, excluding irrelevant regions to improve measurement accuracy within the defined ROI. (f) The final image after the preprocessing sequence, with extraneous elements filtered out to enhance data quality and consistency for subsequent analysis.
Remotesensing 16 04278 g004
Figure 5. (a) Pyroclast area (above) and mean altitude (below) obtained from 4 July to 22 August 2024 on the thermal images recorded by the EBT camera. (b) Details of the lava fountain (LF) area for the six episodes, as recorded by the EBT camera.
Remotesensing 16 04278 g005
Figure 6. Lava fountain (LF) area recorded by the EBT (blue line) and EMCT (red line) cameras. Explosive paroxysm of 4 July 2024 (a), 7 July 2024 (b), 15–16 July 2024 (c), 23 July 2024 (d), 4 August 2024 (e) and 14–15 August 2024 (f). The x-axis is time (UTC), the y-axis is graduated in p i x e l 2 . In this figure, for clarity, the signals were down-sampled at a rate of 1 min.
Remotesensing 16 04278 g006
Figure 7. Area (y-axis, in pixels squared) against time (x-axis, UTC) occupied by the pyroclastic portion of the lava fountains recorded by the station. The experimental area data are shown in blue, with red curves representing the fit obtained using a basis of Gaussian functions. The thin black vertical lines mark the start and end times of each episode, estimated using the threshold algorithm mentioned in Section 3. (af) Data of the episodes 1 to 6, respectively.
Remotesensing 16 04278 g007
Figure 8. Frames from the EBT camera showing the initial, climax and declining phases of each of the six paroxysmal episodes at the VOR crater between July and August 2024. In each image, north is on the left, south is on the right. The color bar on the right displays the scale of the apparent temperature. (a) Frame of 4 July 2024 at 16:50:00, with the warm ash plume bending to the right, and the blue cold cloud to the left of the image. (b) Frame of 4 July 2024 at 21:01:50. (c) Frame of 5 July 2024 at 00:32:58. (d) Frame of 7 July 2024 at 02:02:08. (e) Frame of 7 July 2024 at 03:01:34. (f) Frame of 7 July 2024 at 06:01:54, with the blue portion of the plume showing the ash cloud spreading north (left). (g) Frame of 15 July 2024 at 19:01:30. (h) Frame of 15 July 2024 at 20:31:30. (i) Frame of 15 July 2024 at 23:01:54, with a lava flow starting from the right base of the crater. (j) Frame of 23 July 2024 at 06:01:34, with a lava flow starting from the right base of the crater. (k) Frame of 23 July 2024 at 06:46:42, with a lava flow starting from the right base of the crater. (l) Frame of 23 July 2024 at 07:31:36, with a lava flow starting from the right base of the crater. (m) Frame of 4 August 2024 at 02:31:08. (n) Frame of 4 August 2024 at 03:31:44, with a lava flow starting from the base of the crater. (o) Frame of 4 August 2024 at 07:01:30, with a lava flow spreading from the right and central portions of the crater. (p) Frame of 14 August 2024 at 22:01:24, with two lava flows starting from the right and central parts of the crater. (q) Frame of 14 August 2024 at 23:31:40, with at least three lava flows spreading from the base of the crater, and ash plume fallout to the right. (r) Frame of 15 August 2024 at 01:01:30, with four lava branches expanding from the base of the crater. All times are expressed as UTC.
Remotesensing 16 04278 g008
Figure 9. Duration, volume, maximum height and time-averaged discharge rate versus time for the six lava fountain episodes.
Remotesensing 16 04278 g009
Table 1. List of the features of the EBT and EMCT cameras used in this paper.
LabelTypeLocationDistance from the Craters (km)Frame RateField of View
EBTThermal FLIR A320Bronte, NW flank
85 m a.s.l.
13.52 frames/s25° × 18.8°
EMCTThermal FLIR A320Mt. Cagliato, east flank
1160 m a.s.l.
8.31 frame/s320 × 240 pixels
Table 2. List of the values of the lava fountains’ parameters obtained from the EBT camera. Max and Mean LF refer to the maximum and average height of the lava fountain measured above the crater rim and were measured in meters (m). Pyro Volume refers to the volume of pyroclastic material erupted during the lava fountain phase and was measured in million cubic meters (Mm3), and TADR is the time-averaged discharge rate measured in cubic meters per second (m3s−1).
Episode
#
Date
dd/mm/yyyy
Start
Time UTC
End
Time UTC
Duration
Minutes
Max LF
(m)
Mean LF
(m)
Pyro Volume
(Mm3)
TADR
(m3s−1)
104/07/202416:5001:21511625813455.58 182
207/07/202401:5407:23329267712783.86 195
315/07/202418:2400:17353275310953.74 177
423/07/202405:4308:00137452415671.92209
504/08/202402:1908:12353529122425.10251
614/08/202421:3301:49256391012282.80186
Table 3. Comparison between the start and stop timing of the 6 lava fountain episodes described here and obtained by our procedure from the images of the EBT camera and the timing defined by INGV-OE* on the basis of the seismic and infrasound signals. Timing in UTC, duration in minutes. Volumes are in Mm3. N.A. = not available. The lava volume of 07/07/2024 refers to the cumulate of the first two paroxysmal episodes. The lava volumes (INGV-OE*) were obtained from satellite data.
Episode #DateStart
EBT
Start INGV-OE*Stop EBTStop
INGV-OE*
Volume of Pyro
EBT
Duration
EBT
Duration
INGV-OE*
Lava Volume INGV-OE*
104/07/202416:5016:15a01:2101:50 a5.58 511575N.A.
207/07/202401:5402:0007:2308:003.86 3293601.10 a
315/07/202418:2417:4200:1723:403.74 3533580.41 b
423/07/202405:4302:0808:0008:151.921373670.50 c
504/08/202402:1902:3008:1207:105.103532800.45 d
614/08/202421:3322:3001:4901:202.802561700.40 e
# = number of the episode. INGV-OE* = Istituto Nazionale di Geofisica e Vulcanologia, Osservatorio Etneo. Data published in the daily reports to the Italian Civil Protection, available online at www.ct.ingv.it (accessed on 15 August 2024). a = [55]; b = [56]; c = [57]; d = [58]; e = [59].
Disclaimer/Publisher’s Note: The statements, opinions and data contained in all publications are solely those of the individual author(s) and contributor(s) and not of MDPI and/or the editor(s). MDPI and/or the editor(s) disclaim responsibility for any injury to people or property resulting from any ideas, methods, instructions or products referred to in the content.