Article

Theoretical Analysis and Experimental Evaluation of Wide-Lane Combination for Single-Epoch Positioning with BeiDou-3 Observations

School of Environment Science and Spatial Informatics, China University of Mining and Technology, No. 1 Daxue Road, Xuzhou 221116, China
*
Author to whom correspondence should be addressed.
Remote Sens. 2024, 16(23), 4404; https://doi.org/10.3390/rs16234404 (registering DOI)
Submission received: 21 September 2024 / Revised: 13 November 2024 / Accepted: 22 November 2024 / Published: 25 November 2024

Abstract

:
Multi-frequency signals can enable some wide-lane (WL) observations to achieve instantaneous ambiguity resolution (AR) in complex scenarios, but simply adding WL observations will also place additional pressure on real-time kinematic data transmission. With the official service of the third-generation Beidou Navigation Satellite System, which broadcasts five-frequency signals, this dilemma has become increasingly evident. It is significant to explore multi-frequency observation combination methods that take into account both positioning precision and data transmission burden. In this work, we use the least squares method to derive the theoretical precision of the single-epoch WL combination of 16 schemes with varying frequency numbers (three or more) under the ionosphere-fixed model and the ionosphere-float model. The baseline solutions of 4.3 km and 93.56 km confirm that the positioning results are broadly consistent with the theoretical derivations under both models. In the ionosphere-fixed mode, the five-frequency scheme (B1C, B1I, B3I, B2b, B2a) yields the best positioning performance, improving the 3-dimensional positioning error standard deviation, circle error probable (CEP), and spherical error probable at 75% probability by 7.8%, 11.5%, and 6.7%, respectively, compared with the optimal triple-frequency scheme (B1C, B3I, B2a). Under the ionosphere-float model, the quad-frequency scheme (B1C, B3I, B2b, B2a) provides the best positioning performance, with only the CEP at 75% improving by 1.3% over the triple-frequency scheme. Given that the optimal triple-frequency scheme has a lower data volume, this work recommends it as the preferred scheme.

1. Introduction

Integer carrier-phase ambiguity resolution (AR) is essential for achieving rapid and high-precision Global Navigation Satellite System (GNSS) positioning and applications [1]. The BeiDou Navigation Satellite System (BDS) and Galileo Satellite Navigation System (Galileo) can both broadcast five-frequency signals, and some Global Positioning System satellites can transmit triple-frequency signals [2,3,4]. Developing multi-frequency (three or more) GNSS has become a major trend [5]. Compared with single- and dual-frequency GNSS signals, the additional frequency signals not only speed up carrier-phase AR, but also significantly improve the coverage and accuracy of GNSS [6].
The second-generation BeiDou Navigation Satellite System (BDS-2) is a regional satellite system that broadcasts triple-frequency signals [7]. A large number of scholars have researched the linear combination of triple-frequency observations of BDS-2. The research conducted by Tang revealed that the geometry-based three-carrier ambiguity resolution exhibited a markedly enhanced success rate of AR in comparison with dual-frequency methods based on BDS-2 observations [8]. Tian derived the first-order double-difference (DD) ionospheric delay estimated from the ambiguity-fixed extra-wide-lane (EWL) observations and applied smoothing methods to correct this delay, thereby improving positioning performance for medium-to-long baselines [9]. Li achieved instantaneous precision decimeter-level positioning of a 50 km baseline based on two ambiguity-fixed EWL observations [10]. Li proposed a method to solve the carrier-phase ambiguity in sequence according to the wavelengths of the combined observations, which significantly improved the computational efficiency of AR [11]. The above studies show that the linear combination of triple-frequency signals can speed up the carrier-phase AR and improve the service range of real-time kinematics (RTK).
The third-generation Beidou Navigation Satellite System (BDS-3) was officially put into service on 31 July 2020 [12]. Currently, there are 26 medium earth orbit (MEO) satellites and 3 inclined geosynchronous orbit (IGSO) satellites that can provide five-frequency public service signals: B1C, B1I, B3I, B2b, and B2a [13]. Compared with the triple-frequency signals of BeiDou-2, the five-frequency signals offer more combinations with long wavelengths, low noise, and weak ionospheric delay characteristics for the rapid AR, thereby improving the availability and reliability of BDS-3/GNSS [14]. Li examines the advantages of quad-frequency observations, highlighting the enhanced precision achievable in multi-frequency high-precision positioning, as well as the refined selection of EWL or wide-lane (WL) combinations to support instantaneous EWL/WL ambiguity resolution [15]. Liu analyzed the quad-frequency WL single-epoch positioning performance of the combined BDS-3 and Galileo. The results showed that the optimal triple-frequency observations can also match the positioning performance of quad-frequency, but the BDS-3 was not evaluated separately [16].
The above studies mainly focused on the gains of multi-frequency observations on AR. The prerequisite for using these methods is timely data transmission. However, data transmission is a major problem in scenarios where communication is blocked [17]. Some scholars have developed the correction value compression method to reduce the burden on communications caused by the increase in multi-frequency GNSS observation data [18,19,20]. In addition, high-dimensional matrix operations are also time-consuming and energy-consuming [21,22,23]. Therefore, it is necessary to fully explore the potential of multi-frequency signals and find a multi-frequency combination scheme that can fully improve computing efficiency while maintaining comparable positioning accuracy.
With the development of BDS-3, the linear combination scheme of the multi-frequency observations needs further study. In this study, we apply least squares (LS) methods to derive the positioning precision for each multi-frequency (three or more) WL combination scheme. We further conduct experiments to evaluate the positioning performance of each scheme under varying ionospheric delay mitigation strategies. By comparing the differences in performance, we can select an optimal scheme that balances positioning precision with computational efficiency. In addition, this study also provides a reference method for multi-frequency WL precise point positioning and multi-epoch narrow-lane AR.
The structure of this paper is arranged as follows: Section 2 introduces the method of selecting the optimal combination coefficients for each scheme and derives the theoretical positioning precision of each scheme under different ionospheric delay strategies. Section 3 provides detailed results for the baseline solutions of each scheme across two baseline cases. In Section 4, the a priori success rate of WL AR with different total errors is discussed, and finally, Section 5 lists the main conclusions of this study.

2. Materials and Methods

In this section, the BeiDou-3’s five public service signals are first introduced in detail and are displayed in Table 1. Second, we introduce the linear combinations and determine the optimal combination coefficients for each frequency scheme based on established criteria. Then, we use the LS method to calculate the positioning precision of each scheme, thereby quantitatively evaluating the performance of different frequency combination schemes.

2.1. Theory of BDS-3 Multi-Frequency Observations Combination

The basic DD pseudo-range and carrier-phase observation equations can be expressed as follows [14]:
Δ P i = Δ ρ + Δ O + μ i Δ I f i r + θ i Δ I sec + Δ T + Δ ε P λ i Δ ϕ i = Δ ρ + Δ O μ i Δ I f i r θ i Δ I sec + Δ T + λ i Δ N i + Δ ε ϕ
where Δ is the DD operator. ρ is the distance between the receiver and the satellite. The subscript i denotes the i-frequency. P and ϕ are the pseudo-range and carrier-phase observations, respectively, with units of meters and cycles. λ is the wavelength of the carrier-phase observations, with the unit of meters. T is the tropospheric delay. I f i r and I sec are the 1st-order and 2nd-order ionospheric delay corresponding to the first frequency, respectively. μ i is the ionospheric delay scalar factor for the i-frequency corresponding to the first frequency. N is the ambiguity. O is the orbit error. ε is the measurement noise.
The linear combination equations of BDS-3 multi-frequency carrier-phase DD observations are as follows [14]:
Δ Φ ( i , j , k , l , m ) = Δ ρ + Δ O + Δ T μ ( i , j , k , l , m ) Δ I f i r θ ( i , j , k , l , m ) Δ I sec λ ( i , j , k , l , m ) Δ N ( i , j , k , l , m ) + η ( i , j , k , l , m ) Δ ε φ
Δ Φ ( i , j , k , l , m ) = λ ( i , j , k , l , m ) Δ ϕ ( i , j , k , l , m )
Δ ϕ ( i , j , k , l , m ) = i Δ ϕ 1 + j Δ ϕ 2 + k Δ ϕ 3 + l Δ ϕ 4 + m Δ ϕ 5
λ ( i , j , k , l , m ) = c f ( i , j , k , l , m )
f ( i , j , k , l , m ) = i f 1 + j f 2 + k f 3 + l f 4 + m f 5
μ ( i , j , k , l , m ) = f 1 2 ( i / f 1 + j / f 2 + k / f 3 + l / f 4 + m / f 5 ) f ( i , j , k , l , m )
θ ( i , j , k , l , m ) = f 1 3 ( i / f 1 2 + j / f 2 2 + k / f 3 2 + l / f 4 2 + m / f 5 2 ) f ( i , j , k , l , m )
η ( i , j , k , l , m ) 2 = ( i f 1 ) 2 + ( j f 2 ) 2 + ( k f 3 ) 2 + ( l f 4 ) 2 + ( m f 5 ) 2 f ( i , j , k , l , m ) 2
c is the velocity of light in a vacuum. f 1 , f 2 , f 3 , f 4 , and f 5 represent BIC, B1I, B3I, B2a, and B2b signal frequencies. i, j, k, l, and m are the combination coefficients for each frequency. Δ Φ ( i , j , k , l , m ) represents the combined DD phase observations, with the unit of meters. f ( i , j , k , l , m ) is the virtual combined carrier-phase frequency. μ ( i , j , k , l , m ) and θ ( i , j , k , l , m ) are the 1st-order and 2nd-order ionospheric delay scale factors corresponding to the first frequency. η ( i , j , k , l , m ) is the noise amplitude factor corresponding to the first frequency. λ ( i , j , k , l , m ) is the virtual combined wavelength.

2.2. Optimal Coefficients Selection for Multi-Frequency Combination Signals

Among the five public service signals broadcasted by BDS-3, we can determine the schemes of different frequency numbers using mathematical combination methods. Specifically, there are 10 combination schemes for triple-frequency, 5 combinations for quad-frequency, and only 1 for five-frequency. There are 16 schemes for three or more frequency bands, which we mark as schemes 1 to 16. Schemes 1–10 are triple-frequency combinations, schemes 11–15 are quad-frequency combinations, and scheme 16 is a five-frequency combination. Since N-frequency signals can form N − 1 linearly independent WL combinations, a triple-frequency scheme has 2 WL signals, a quad-frequency scheme has 3, and a five-frequency scheme has 4.
For a specific frequency scheme, there are infinite integer linear combination coefficients. We prefer those virtual combination signals with longer wavelengths, smaller noise amplification factors, and smaller ionospheric delay scale factors. However, in reality, it is difficult for a combination signal to have all the good features at the same time. For example, a combination signal with a longer wavelength is often accompanied by a larger ionospheric delay scale factor or noise amplification factor, while one with a smaller ionospheric scale factor or noise amplification factor may have a shorter wavelength. In addition, the relationship between these characteristics is not a simple linear relationship.
It is a challenge to select sets of optimal combinations for ambiguity resolution from among the multiple available combinations, each with different characteristics. To solve this problem, this paper selects those combinations whose coefficients are in the commonly used range [−10, 10] and satisfy the conditions | μ ( i , j , k , l , m ) | < 1.8 and | η ( i , j , k , l , m ) | < 215 as the preliminary selection [24]. Furthermore, we introduce the concept of total noise level (TNL), which is reflected by Formula (10). σ T Φ is the TNL of the carrier-phase, in cycles [25].
σ T Φ = 1 λ ( i , j , k , l , m ) σ Δ O 2 + σ Δ T 2 + μ ( i , j , k , l , m ) 2 σ Δ I f i r 2 + θ ( i , j , k , l , m ) 2 σ Δ I sec 2 + σ ε Δ Φ ( i , j , k , l , m ) 2
To calculate the TNL corresponding to each preliminary combination of each scheme, Table 2 gives the approximate standard deviation (STD) of each error term [26]. TNL is an important indicator for evaluating the quality of the combination. Specifically, if we know the error budgets of each error term in the observation equation, we can calculate the TNL of the combined signal. Combined signals with smaller TNLs should be considered as sets of optimal combinations for a specific frequency scheme.
According to Formula (10) and Table 2, we determined sets of optimal linear combination coefficients for each scheme. As shown in Table 3, we list the optimal coefficients, wavelength, ionospheric delay amplification factor, noise amplification factor, and total noise level of each combination. It should be noted that in each scheme, a frequency band with all zero coefficients indicates that the scheme does not include that frequency band. For example, the triple-frequency Scheme 2 includes only B1I, B3I, and B2b. Each combined signal may use all available frequencies or only a subset of them.

2.3. Theoretical Analysis of Precision in BDS-3 Multi-Frequency Combination Signals

In this section, we mathematically derive the theoretical positioning precision of each scheme. Before the derivations, we introduce the 3-dimensional (3D) positioning precision as an indicator for evaluating the precision of each scheme. The specific formulas using single-frequency pseudo-ranges are as follows [27,28]:
σ 3 D = t r H T ( σ * 2 Q ) 1 H 1 = σ * t r H T Q 1 H 1 = σ * t r Q x ^ x ^
R D O P = t r Q x ^ x ^
where t r represents the trace of a matrix, H is the line-of-sight matrix, Q is a cofactor matrix of DD observations, σ * is the zenith STD of the undifferenced observation, and σ 3 D is the 3D positioning precision. Relative Positioning Dilution of Precision (RDOP), an adaptation of the traditional Positioning Dilution of Precision (PDOP), is commonly used in relative positioning to quantitatively assess the geometric strength of the satellite constellation. Unlike PDOP, RDOP incorporates the weight of each satellite. It can be seen from Formula (11) that the precision of GNSS positioning depends not only on the strength of the geometric figures between the receiver and the GNSS satellite, but also on the measurement noise of the observation value. In other words, the size of the observation noise and the geometric strength jointly determine the precision of the positioning result.

2.3.1. Ionosphere-Fixed Model

To simplify the derivation, we initially assume that the carrier-phase ambiguities are correctly fixed and do not consider the fixing rate of each scheme. Then, we proceed to derive the positioning precision of each scheme using both the ambiguity-fixed WL carrier-phase and pseudo-range observations.
In the short baseline scenario, the DD observation equation can effectively reduce the impact of ionospheric delay and tropospheric delay, thereby simplifying the model and leaving only the position parameters. This method is usually called the “ionosphere-fixed” model. The short baseline scenario function relationship is as follows [6]:
P Φ E = ( e 2 k 1 H ) x
where P = [ P 1 , , P k ] T , Φ E = [ Φ E ( 1 ) , , Φ E ( k 1 ) ] T . Φ E (   ) are the ambiguity-fixed WL carrier-phase observations, and e n is an n-dimensional column vector with all elements equal to 1. is the Kronecker product, and x is the vector of position parameters.
The stochastic model (taking Scheme 16 as an example) is as follows:
D = σ p 2 I k 0 0 σ φ 2 ψ Q
ψ = T W L T W L T
T W L = i 1 f 1 f i 1 , j 1 , k 1 , l 1 , m 1 j 1 f 2 f i 1 , j 1 , k 1 , l 1 , m 1 k 1 f 3 f i 1 , j 1 , k 1 , l 1 , m 1 l 1 f 4 f i 1 , j 1 , k 1 , l 1 , m 1 m 1 f 5 f i 1 , j 1 , k 1 , l 1 , m 1 i 2 f 1 f i 2 , j 2 , k 2 , l 2 , m 2 j 2 f 2 f i 2 , j 2 , k 2 , l 2 , m 2 k 2 f 3 f i 2 , j 2 , k 2 , l 2 , m 2 l 2 f 4 f i 2 , j 2 , k 2 , l 2 , m 2 m 2 f 5 f i 2 , j 2 , k 2 , l 2 , m 2 i 3 f 1 f i 3 , j 3 , k 3 , l 3 , m 3 j 3 f 2 f i 3 , j 3 , k 3 , l 3 , m 3 k 3 f 3 f i 3 , j 3 , k 3 , l 3 , m 3 l 3 f 4 f i 3 , j 3 , k 3 , l 3 , m 3 m 3 f 5 f i 3 , j 3 , k 3 , l 3 , m 3 i 4 f 1 f i 4 , j 4 , k 4 , l 4 , m 4 j 4 f 2 f i 4 , j 4 , k 4 , l 4 , m 4 k 4 f 3 f i 4 , j 4 , k 4 , l 4 , m 4 l 4 f 4 f i 4 , j 4 , k 4 , l 4 , m 4 m 4 f 5 f i 4 , j 4 , k 4 , l 4 , m 4
where Q is the cofactor matrix of DD observations, and we call ψ the correlation matrix. In this study, we assume that the pseudo-range measurements at different frequencies share identical random properties, and similarly, the carrier phase observations exhibit consistent random characteristics across frequencies. The STD of the pseudo-range observation is 100 times that of the carrier-phase, i.e.,  σ p = 100 σ φ . Based on this assumption, combining Formulas (13) and (14), we use the LS method to calculate the variance–covariance matrix of the position parameters x :
D x ^ x ^ short = γ 1 H T Q 1 H 1 = γ 1 Q x ^ x ^
where γ = k σ p 2 + ψ det ( ψ ) σ ϕ 2 . k is the number of the involved frequencies, ∑ means to sum all elements in the matrix, and det ( ) means to take the determinant of the matrix. ψ * is the adjugate matrix of ψ , and the same applies below. The matrix D x ^ x ^ short reflects the stochastic characteristics of the estimated position parameters and is a key indicator for evaluating positioning precision.
From the expression of Formula (17), we may deduce that γ 1 represents the user ranging error precision (UREP) of this scheme, and it varies between different schemes. However, Q x ^ x ^ only depends on the geometry of the observed satellites and is therefore equal in all investigated schemes. Therefore, the difference in 3D positioning precision is only determined by the UREP of each scheme.
Let M = ψ ψ and σ p 2 = 10 4 σ ϕ 2 , since k 10 4 M , then.
γ 1 = 1 / ( k 10 4 σ ϕ 2 + M σ ϕ 2 ) σ ϕ 2 M
Therefore, the matrix (17) can be accordingly transformed to:
D x ^ x ^ short = σ ϕ 2 M i Q x ^ x ^
The 3D positioning precision ratio of each scheme is the ratio of the UREP coefficient 1 / M i , and M depends on the correlation matrix ψ . The specific UREP coefficients for each scheme under the “ionosphere-fixed” model are shown in Table 4. From Table 4, it can be seen that the UREP coefficient of Scheme 3 is significantly higher than those of other schemes, while the UREP coefficients of other schemes are similar. The higher UREP coefficient in Scheme 3 is present because it involves linear combinations of three very close frequencies. This frequency proximity significantly amplifies measurement noise, causing error propagation to increase substantially.

2.3.2. Ionosphere-Float Model

From the ionospheric delay scale factors of each combination in Table 3, it can be seen that the ionospheric delay of the combined signal cannot be ignored. In the medium-to-long baseline positioning, the ionospheric delay cannot be fully eliminated by the DD observation equation. We must introduce the DD ionospheric delay parameter to compensate for it. This method is usually called the “ionosphere-float” model. At the same time, there is a small residual tropospheric delay, but we do not parameterize it due to its strong correlation with the vertical component, which typically requires multi-epoch solutions. Therefore, we apply an empirical model to correct the tropospheric error, which is more practical in a single-epoch model [6]. In the medium-to-long baseline scenario, the function is as follows [6]:
E P Φ E = e k H μ I e k 1 H μ E I x ι
where I is the unit matrix, ι represents the DD ionospheric delay of the first frequency, and μ E is the ionospheric delay mapping coefficient vector of the WL combination. By combining Formula (20) with Formula (14), the variance–covariance matrix of the estimated parameters is derived using the LS method:
D x ^ x ^ D x ^ l D l x ^ D l l = γ A T Q 1 H β H T Q 1 β Q 1 H ς Q 1 1
where D x ^ x ^ represents the variance–covariance matrix of the position parameters, which can be derived from the matrix (21) using the matrix inversion lemma:
D x ^ x ^ long = γ β 2 ς 1 Q x ^ x ^
where β = μ T σ p 2 G σ ϕ 2 , ς = σ p 2 μ T μ + V σ ϕ 2 , G = ( ψ d i a g ( μ E ) ) ψ , V = ( μ E T ψ μ E ) ψ with μ = [ μ 1 , , μ k ] T , μ E = [ μ E ( 1 ) , , μ E ( k 1 ) ] T . d i a g ( ) denotes converting a column vector into a diagonal matrix. Similar to Formula (18), Formula (22) can be accordingly transformed to:
γ β 2 ς 1 = σ ϕ 2 / k 10 4 + M μ / 10 4 G 2 μ T μ / 10 4 + V = σ ϕ 2 / N
Similarly, in the case of a medium-to-long baseline, the ratio of UREP between the schemes is the ratio of N. The form of N is relatively complex and difficult to simplify, which makes it difficult to directly analyze whether the UREP is dominated by the carrier-phase or the pseudo-range observations. To this end, we can directly remove the pseudo-range-related terms in Formula (23), and the remaining terms are the carrier-phase-related terms. Taking into account only carrier-phase observations, Formula (23) can be transformed to:
σ ϕ 2 / M G 2 V = σ ϕ 2 / N φ
Under the “ionosphere-float” model, the UREP coefficients of each scheme are shown in Table 4. As can be seen from Table 4, the UREP of schemes 2, 6, 7, 9, 11, 12, 14, 15, and 16 are all dominated by carrier phase observations.

3. Results

3.1. Data Description and Processing Strategy

To verify the positioning performance of each frequency band combination scheme under different ionospheric delay processing strategies, we selected the BUR2 and RHPT stations in the Asia-Pacific Reference Frame (APREF) network and the EIJS and BRUX stations in the European Permanent GNSS Network (EPN) to form two baselines. These stations can collect five-frequency data broadcasted by the BDS-3. Specifically, Baseline 1 between stations BUR2 and RHPT has a length of 4.30 km, while Baseline 2 between stations EIJS and BRUX has a length of 96.56 km. The selection of a 96.56 km baseline in this study was intentional: it sufficiently reduces the spatial correlation of ionospheric delay between the two stations, allowing for a thorough test of the ionosphere-float model. The sampling interval of the data is 30 s, and the period is from 00:00 to 24:00 on the 111th day of 2024 in UTC.
Figure 1 shows the number of satellites and RDOP of the two baselines in the experimental period. As can be seen from Figure 1a, the number of satellites above the cutoff angle for Baseline 1 ranges from 5 to 10, with most epochs falling between 6 and 8 satellites. The average number of satellites for the entire day is 6.8. Around the 450th, 750th, 1350th, 1700th, 2500th, and 2750th epochs, the number of satellites tracked is at least 5, with the average RDOP during these epochs exceeding 15. From Figure 1b, it can be observed that the number of satellites above the cutoff angle for Baseline 2 also ranges from five to ten, with most observations falling between six and nine satellites. The average number of satellites over the whole day is 7.3. Around the 900th and 1200th epochs, the number of satellites tracked is at least five, with the average RDOP during these epochs exceeding nine. Both baselines ensure that there are more than four satellites available throughout the experimental period, thus fulfilling the basic experimental requirements.
After obtaining the float solution of wide-lane ambiguities using the LS method, all ambiguities are resolved simultaneously using the least-squares ambiguity decorrelation adjustment (LAMBDA) method [29], rather than through a stepwise fixing strategy based on wavelength. The specific processing strategies for the two baselines are detailed in Table 5.

3.2. Results and Analyses of Two Baselines’ RTK Positioning

3.2.1. Positioning Performance of Baseline 1

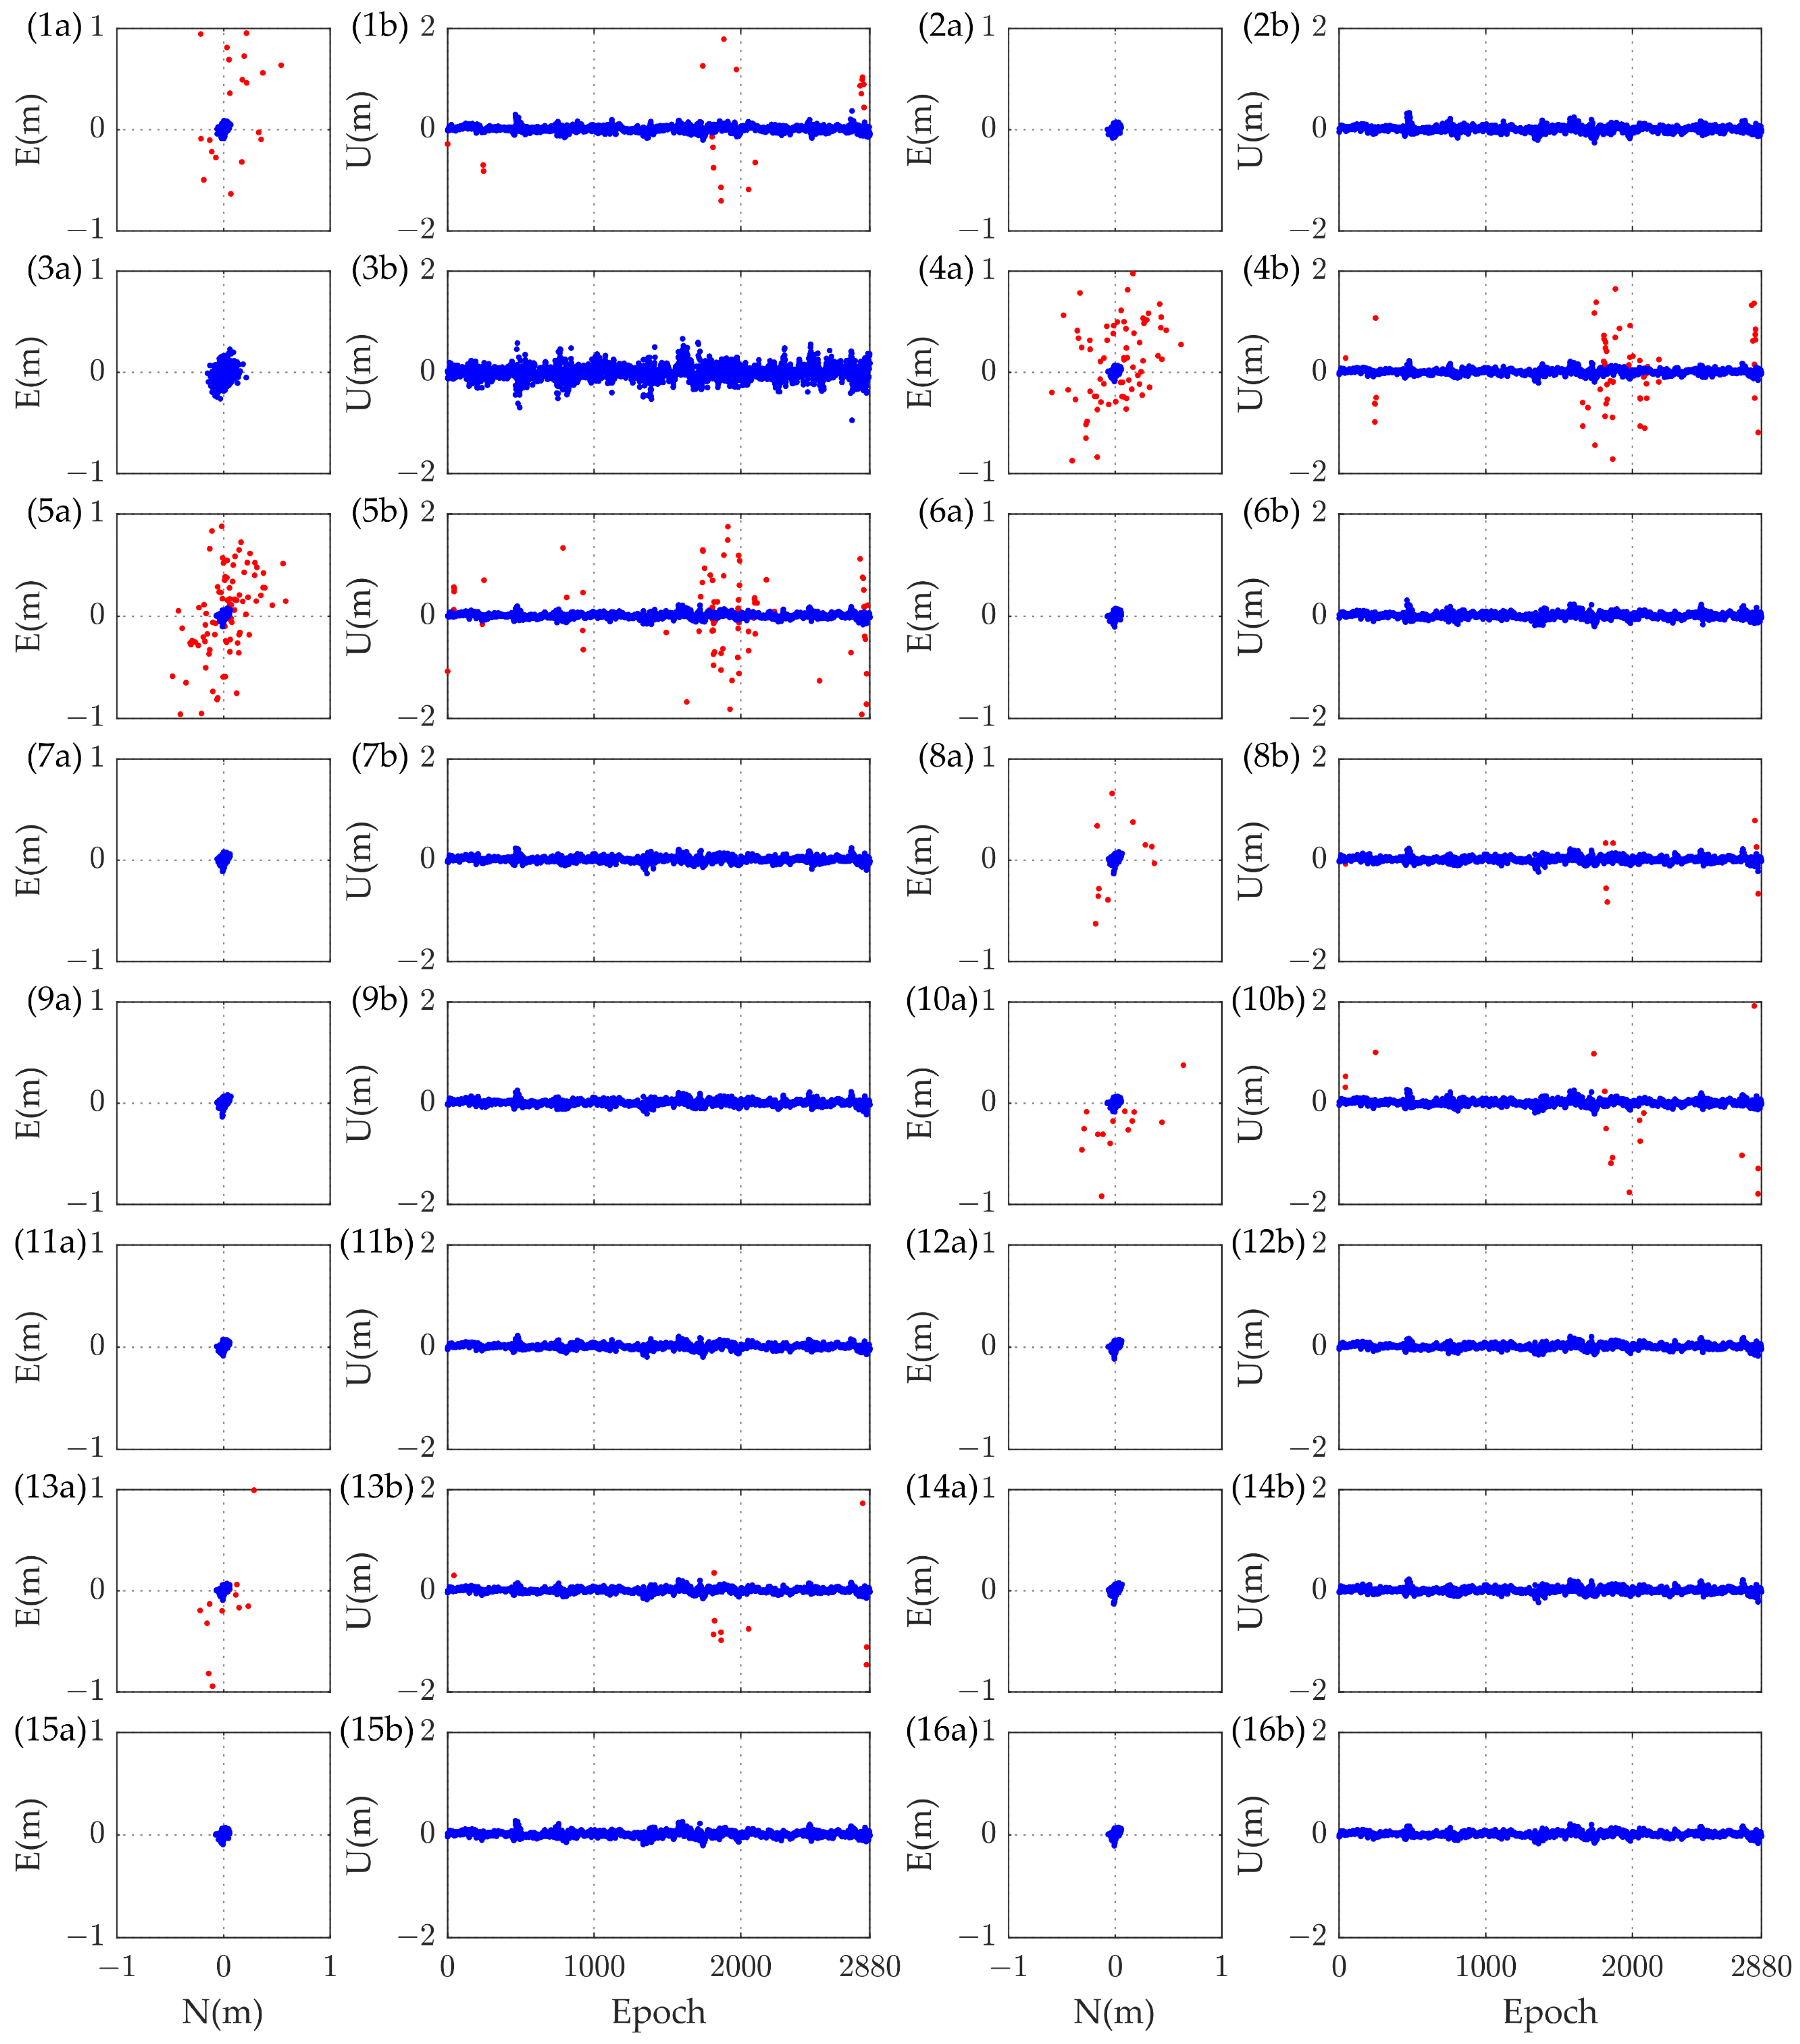
In this section, we interpret the results obtained for Baseline 1. Figure 2 presents the time series of the plane errors in the north (N) and east (E) directions, as well as the up (U) direction errors for the 16 schemes of Baseline 1. The numbers in parentheses in the upper left corner of each subplot are scheme numbers, where a denotes the plane error plot and b denotes the elevation error plot. Red scatter points represent float solutions, and blue scatter points represent fixed solutions. It can be observed that schemes 1, 4, 5, 8, 10, and 13 exhibit varying proportions of float solution epochs. Considering that the length of Baseline 1 is only 4.3 km, these epochs suggest that these schemes lack reliability.
Additionally, the distribution of fixed solutions across all schemes exhibits a minor systematic bias. Therefore, we primarily utilize the STD to assess the positioning precision of each scheme. Table 6 provides the STD and fixing rate (FR) of positioning results for Baseline 1. From Table 6, it can be observed that in the E, N, and U directions, the random noise of Scheme 3 is significantly higher compared with other schemes, and its STDs are approximately three times greater than those of other schemes. While the precision may differ among other schemes, they still maintain a high level of consistency. The precision of the U component is around 5 cm, and the differences between the east and north directions are also minimal. Excluding schemes containing float solutions, among the triple-frequency schemes, Scheme 9 has the lowest 3D STD, with STD values in the E, N, and U components at 1.3 cm, 1.8 cm, and 4.8 cm, respectively. Among the quad- and five-frequency schemes, Scheme 16 is optimal, with E, N, and U component STDs of 1.2 cm, 1.7 cm, and 4.3 cm, respectively. Compared with Scheme 9, the 3D STD of quad-frequency schemes 11, 12, 13, and 15, as well as five-frequency Scheme 16, improved by 3.8%, 3.8%, 7.8%, −1.9%, and 7.8%, respectively. However, the data volume for quad- and five-frequency schemes increased by 33.3% and 66.7%, respectively, compared with triple-frequency schemes. The experimental results indicate that increasing the number of frequencies does not necessarily lead to a significant improvement in positioning precision and may even result in a decrease in precision. This underscores the importance of developing a reasonable frequency combination scheme.
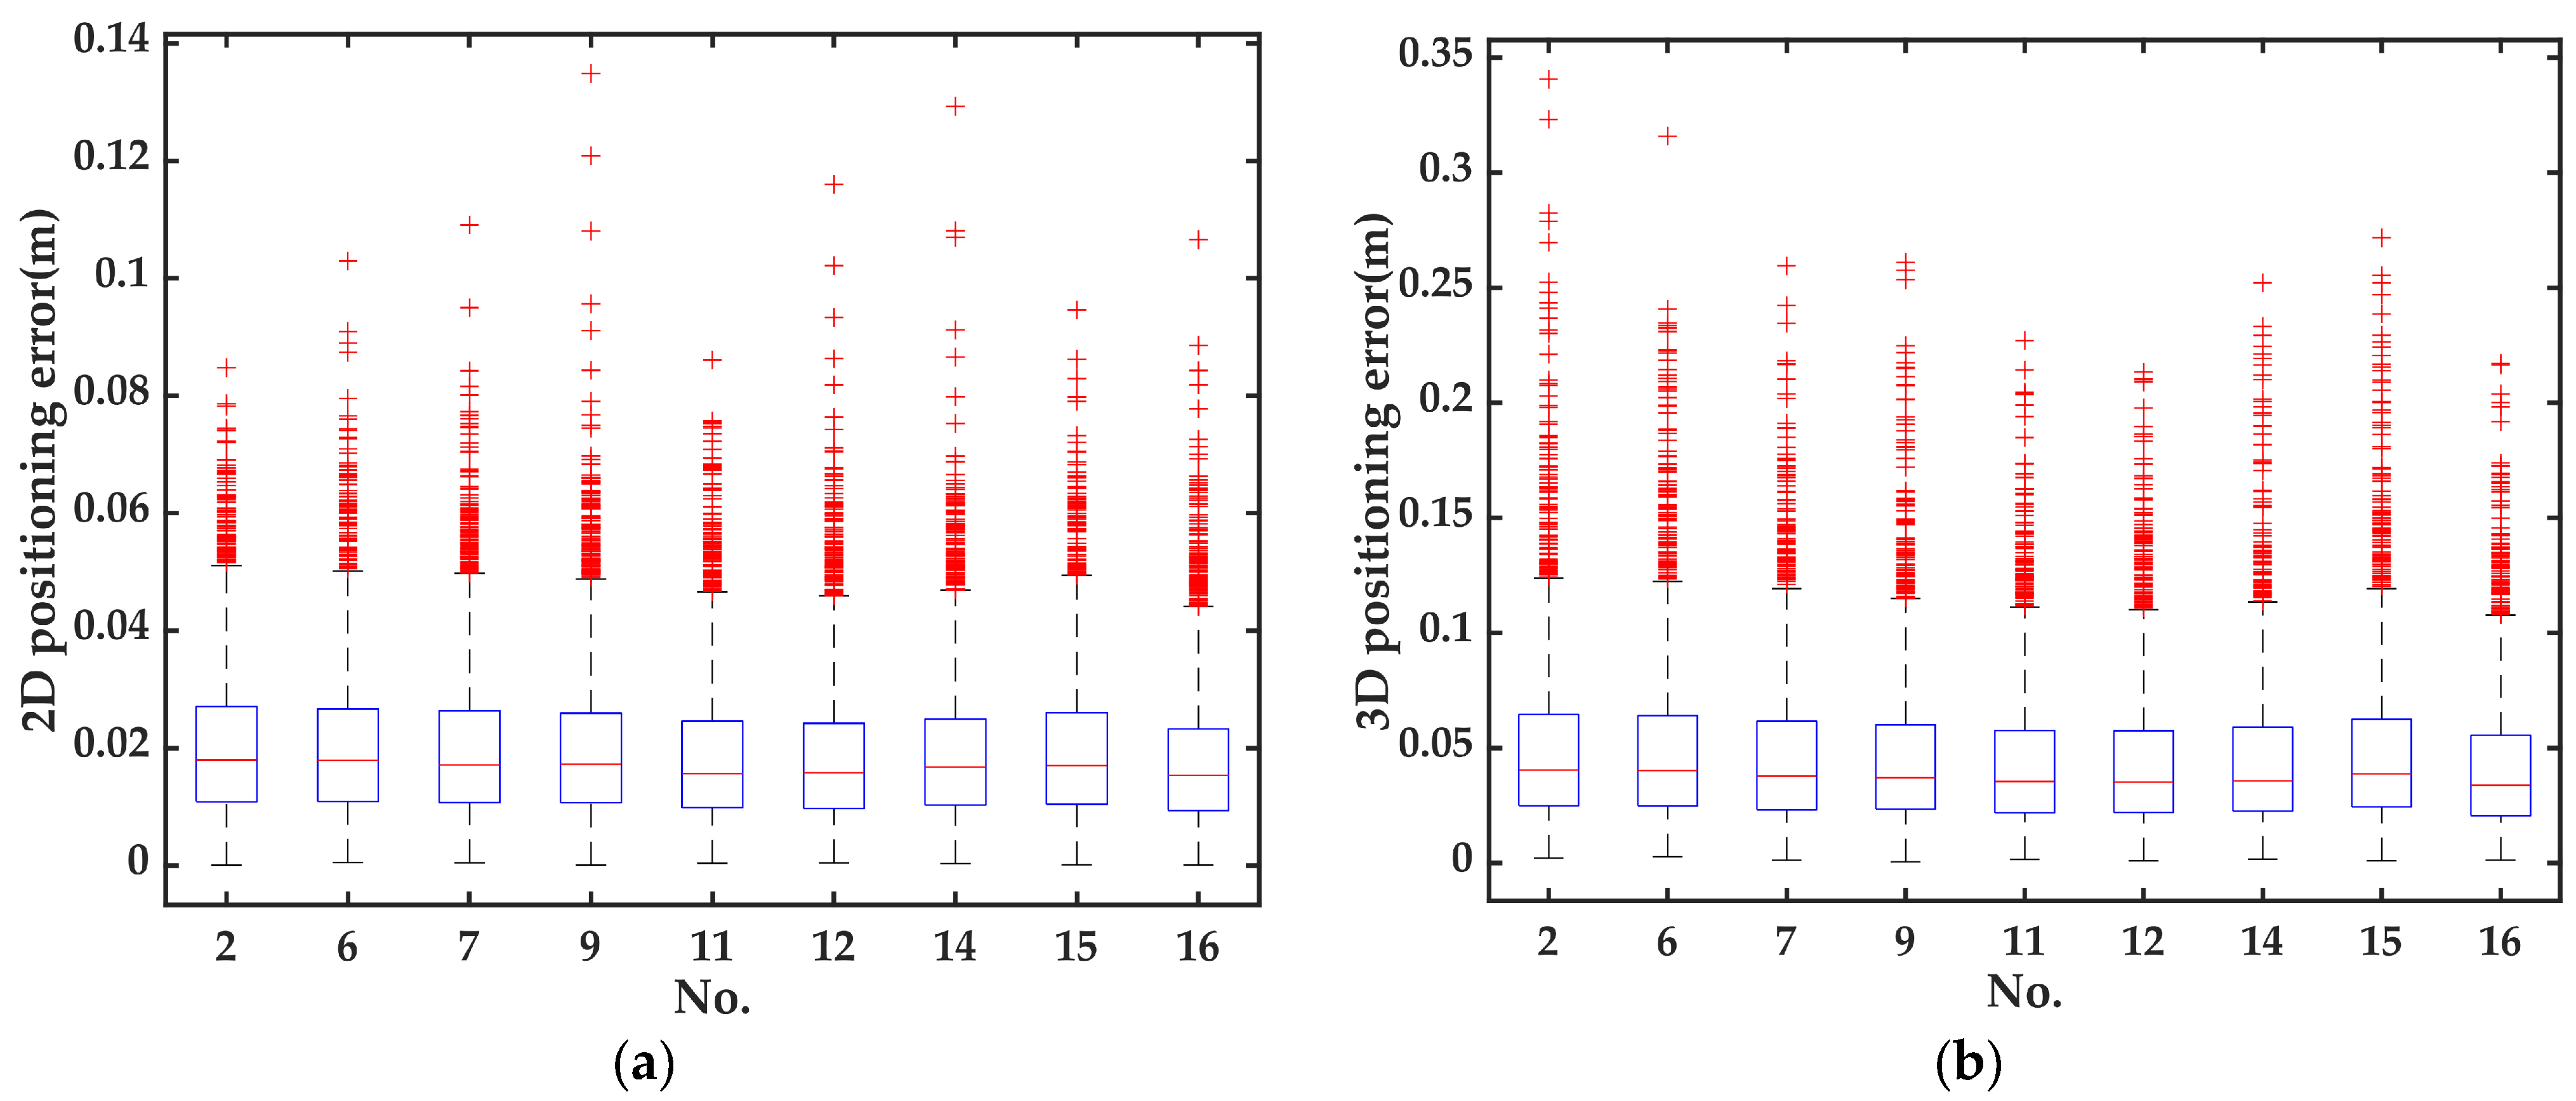
To make a more detailed comparison of the positioning error of different schemes, we present the two-dimensional (2D) (Figure 3a) and 3D (Figure 3b) positioning error boxplots for the schemes with 100% FR. The four horizontal lines within each box represent the upper limit, upper quartile (Q3), median, lower quartile (Q1), and lower limit of the data, respectively. The red symbols indicate data points that are considered outliers. The number of outliers is defined as the number of epochs whose position errors exceed 1.5 times the interquartile range (i.e., the range from Q1 to Q3). This indicator reflects the stability of the positioning results.
From Figure 3a,b, it can be observed that the positioning performances of the schemes differ slightly. First, we interpret the 2D positioning error. The lower limits of all boxes in Figure 3a are 0 cm. Among the triple-frequency schemes, Scheme 9 has the smallest maximum error of 4.9 cm; among all schemes, Scheme 16 has the smallest maximum error of 4.4 cm. Specifically, for Scheme 9, the lower quartile is 1.1 cm, the median is 1.7 cm, the upper quartile is 2.6 cm, and there are 107 outliers, with the largest error being 13.5 cm. For Scheme 16, the lower quartile is 0.9 cm, the median is 1.5 cm, and the upper quartile is 2.3 cm. Among the 119 outliers, the largest error is 10.7 cm. Scheme 16 demonstrates the best 2D positioning performance, with the upper quartile (which can be interpreted as circle error probable (CEP) at 75% probability) improving by approximately 11.5% compared with Scheme 9.
Next, we interpret the 3D positioning error of each scheme. The lower limits of all boxes are also 0 cm. Among the triple-frequency schemes, Scheme 9 has the smallest maximum error of 11.5 cm; among all schemes, Scheme 16 has the smallest maximum error of 10.8 cm. The lower quartile of Scheme 9 is 2.3 cm, the median is 3.7 cm, the upper quartile is 6.0 cm, the number of outliers is 103, and the maximum outlier is 26.1 cm. The lower quartile of Scheme 16 is 2.1 cm, the median is 3.4 cm, the upper quartile is 5.6 cm, and the largest of the 85 outliers is 21.7 cm. Scheme 16 is the best in terms of 3D positioning performance, and the upper quartile (which can be understood as spherical error probable (SEP) at 75% probability) is approximately 6.7% lower than that of Scheme 9.
To evaluate the correlation between the experimental results and the theoretical derivations, we introduce the Pearson correlation coefficient (see Formula (25)). Here, r x y is the Pearson correlation coefficient, x i and y i are the values of the two variables, and x ¯ and y ¯ are the average values of the data. The Pearson correlation coefficient is a statistic that measures the strength and direction of the linear relationship between two variables and is widely used in data analysis. Its value ranges from −1 to 1, where 1 indicates a perfect positive correlation, −1 indicates a perfect negative correlation, and 0 indicates no correlation. It is worth noting that scaling the two sets of data at different ratios will not affect the correlation coefficient. After substituting the 3D positioning error STD of each scheme in Table 6 and the 1 / M i data of each scheme of baseline 1 in Table 4 into Formula (25), the correlation coefficient was as high as 0.997, indicating that there is an extremely high positive correlation between the experimental results and the theoretical derivations.
r x y = ( x i x ¯ ) ( y i y ¯ ) ( x i x ¯ ) 2 ( y i y ¯ ) 2

3.2.2. Positioning Performance of Baseline 2

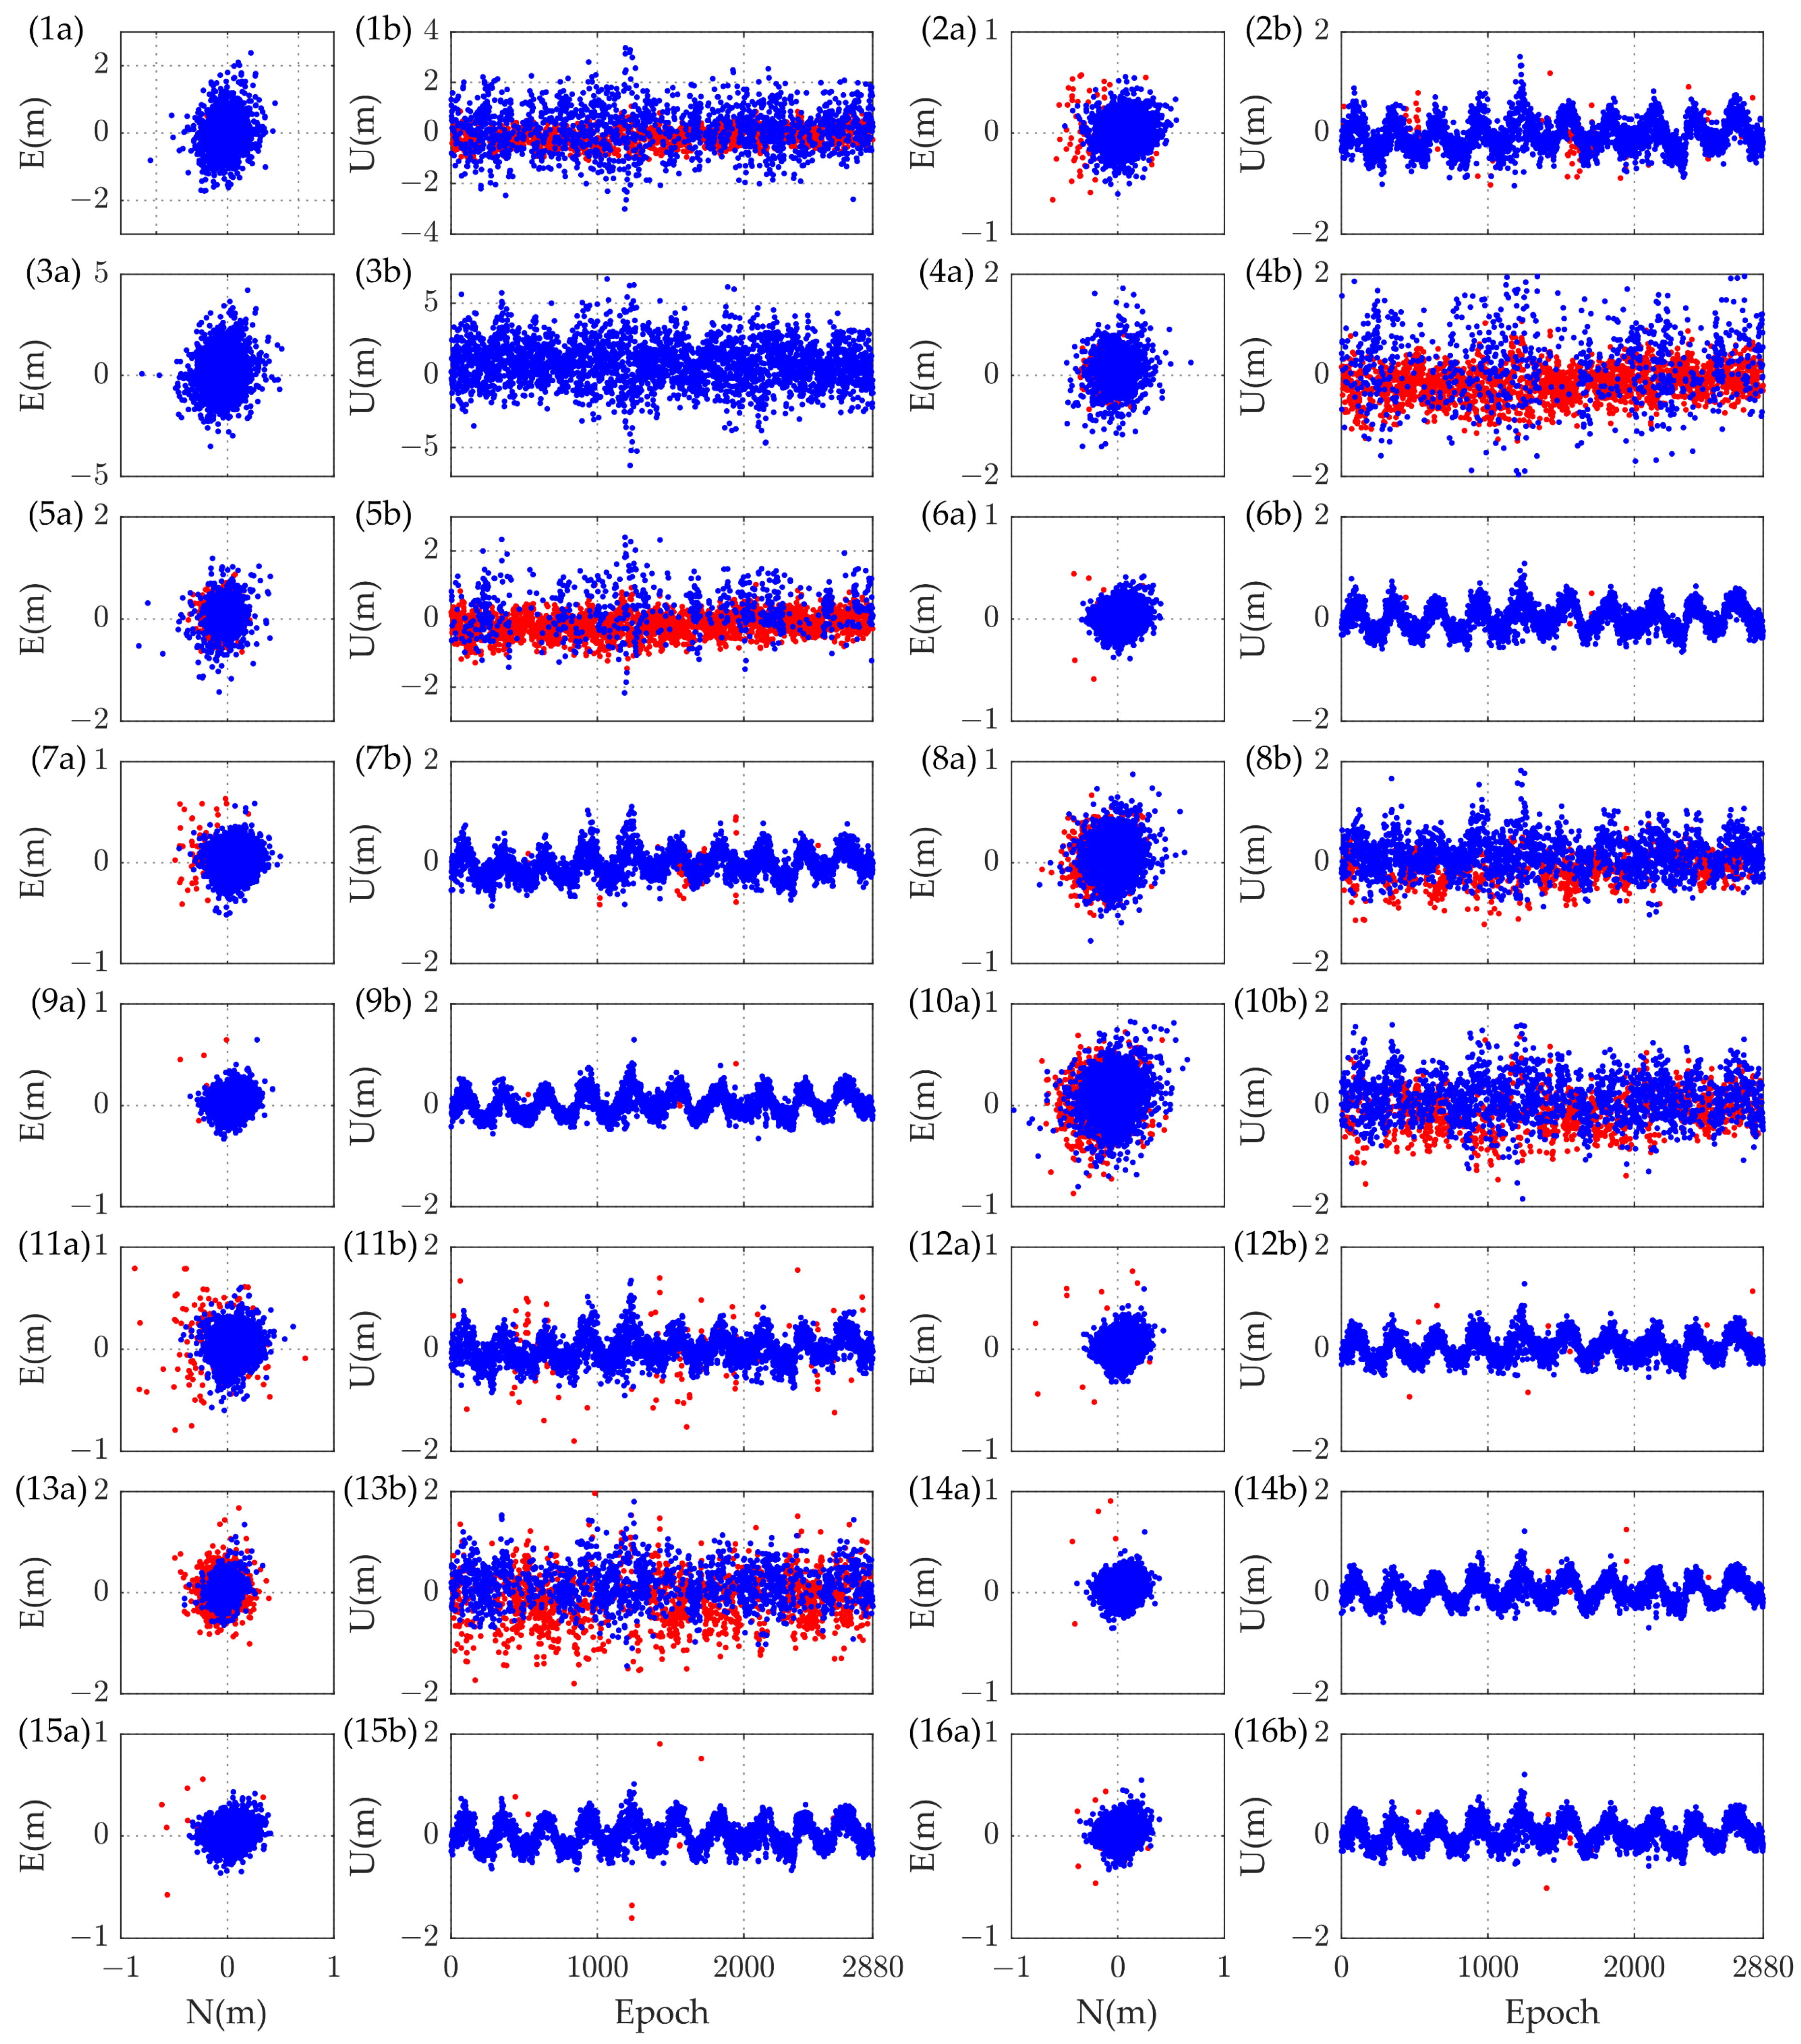
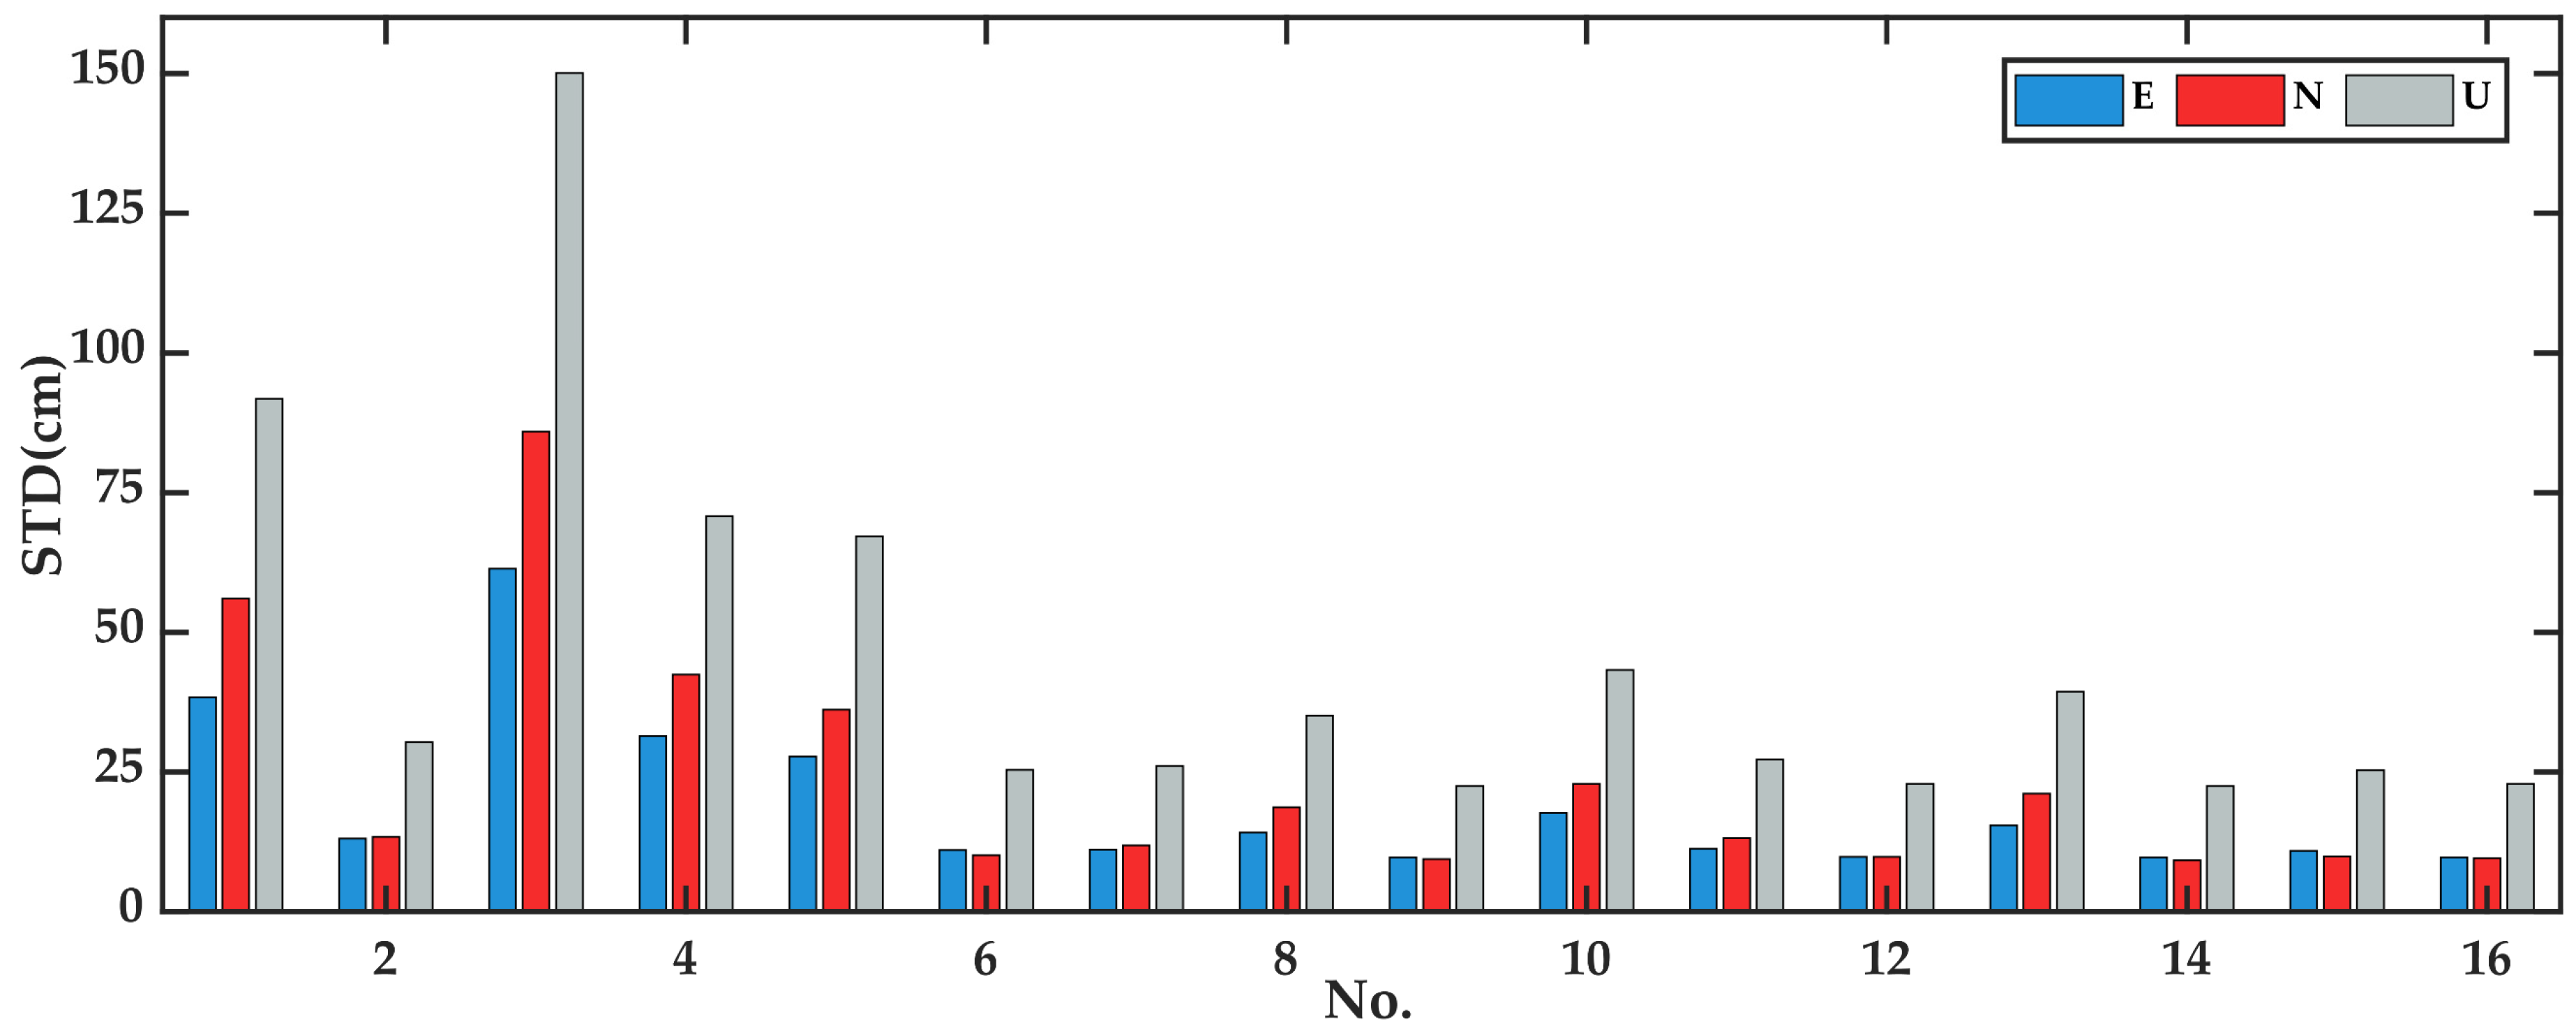
Figure 4 displays the error series of Baseline 2. As in Figure 2, red scatter points represent float solutions, and blue scatter points represent fixed solutions in Figure 4. From Figure 4, we can see that the random characteristics of each scheme are significantly different. Table 7 summarizes the positioning results, including the STD and FR for each scheme. Observing the FR in Table 7, it is evident that, except for Scheme 3, all other schemes include a varying proportion of float solutions. Despite parameterizing the ionospheric delay, achieving 100% FR remains challenging as the baseline length increases. Only Schemes 3, 6, 9, 12, 14, 15, and 16 have more than 99% FR, demonstrating high reliability. There are notable differences in the positioning precision of these schemes, except for Scheme 3. For ease of comparison, we plotted the STD bar charts for each scheme in the E, N, and U directions (see Figure 5). As shown in Figure 5, the positioning STD of schemes with more than 99% FR, except for Scheme 3, is relatively low, indicating high positioning precision. Although Scheme 3 achieves a 100% FR, the positioning precision is relatively poor due to the frequencies in this scheme being very close to each other, which amplifies the observation noise significantly. The high observation noise is also evident in the theoretical analysis, which predicts this result. According to Table 7, the scheme with the highest precision among the triple-frequency schemes is Scheme 9, with STDs of 9.7 cm, 9.4 cm, and 22.5 cm for the E, N, and U components, respectively. For the quad- and five-frequency schemes, Scheme 14 exhibits higher precision, with STDs of 9.7 cm, 9.2 cm, and 22.5 cm for the E, N, and U components, respectively. In comparison, the improvement of Scheme 14 over Scheme 9 is marginal, with only a slight enhancement in the north direction.
Figure 6 shows boxplots of the 2D and 3D positioning errors of the schemes with more than 99% FR. From Figure 6, we can see that the minimum error of all schemes is 0 cm and the positioning performance of schemes 9, 14, and 16 are significantly better than the other three schemes. Since the data volume of Scheme 16 is large and the positioning performance is not the optimal scheme, we only interpret Scheme 9 and Scheme 14. First, we interpret the 2D positioning error. Specifically, the lower quartile of Scheme 9 is 7.4 cm, the median is 11.5 cm, and the upper quartile is 16.2 cm. There are 54 outliers, and the largest outlier is 70.4 cm. The lower quartile of Scheme 14 is 7.2 cm, the median is 11.5 cm, and the upper quartile is 16.0 cm. The largest of the 51 outliers is 65.2 cm. In the 2D positioning performance, Scheme 14 is slightly better than Scheme 9, and the upper quartile is 1.3% higher than Scheme 9.
Next, we interpret the 3D positioning error results. The lower quartile of Scheme 9 is 15.7 cm, the median is 22.5 cm, the upper quartile is 30.8 cm, the number of outliers is 46, and the largest outlier is 137.1 cm. The lower quartile of Scheme 14 is 15.6 cm, the median is 22.1 cm, the upper quartile is 30.8 cm, and the largest outlier among the 43 is 128.5 cm. These results indicate that Scheme 14 offers marginally better 3D positioning accuracy than Scheme 9, as seen in its slightly lower median error and smaller maximum outlier. However, it achieves this at the cost of increased data volume, which is 33.3% higher than that of Scheme 9.
In Section 2.3.2, we theoretically derived the UREP of each scheme under the ionosphere-float model. We continue to use the Pearson correlation coefficient to evaluate the correlation between the experimental results and the theoretical derivations. Table 7 provides the STD of the fixed solutions for Baseline 2. By substituting the 3D STD data from Table 7 and the theoretically derived precision coefficient 1 / N i from Table 4 into the Formula (25), we obtain a correlation coefficient of 0.968. This result indicates a strong positive correlation between the experimental results and the theoretical derivations.

3.2.3. Performance of AR for Two Baselines

In the AR process, ambiguity acceptance testing plays a vital role, which determines whether to accept the integer resolution as the ambiguity fixed resolution. The R-ratio test is a widely used test method, which evaluates the reliability of the solution by the ratio of the quadratic form of the ambiguity residuals of the best and the suboptimal solution [23]. Usually, 2 or 3 is used as the empirical threshold. When the ratio exceeds this threshold, we believe that the optimal solution is reliable, and the higher the ratio value, the more reliable it is. To compare the positioning reliability of each scheme, we use the Formula (26) to perform statistics on each scheme. This can be expressed mathematically as:
P = N suc N all × 100 %
where P is the reliability percentage; N suc and N all are the number of epochs and the total number of epochs with a ratio larger than the specified threshold, respectively.
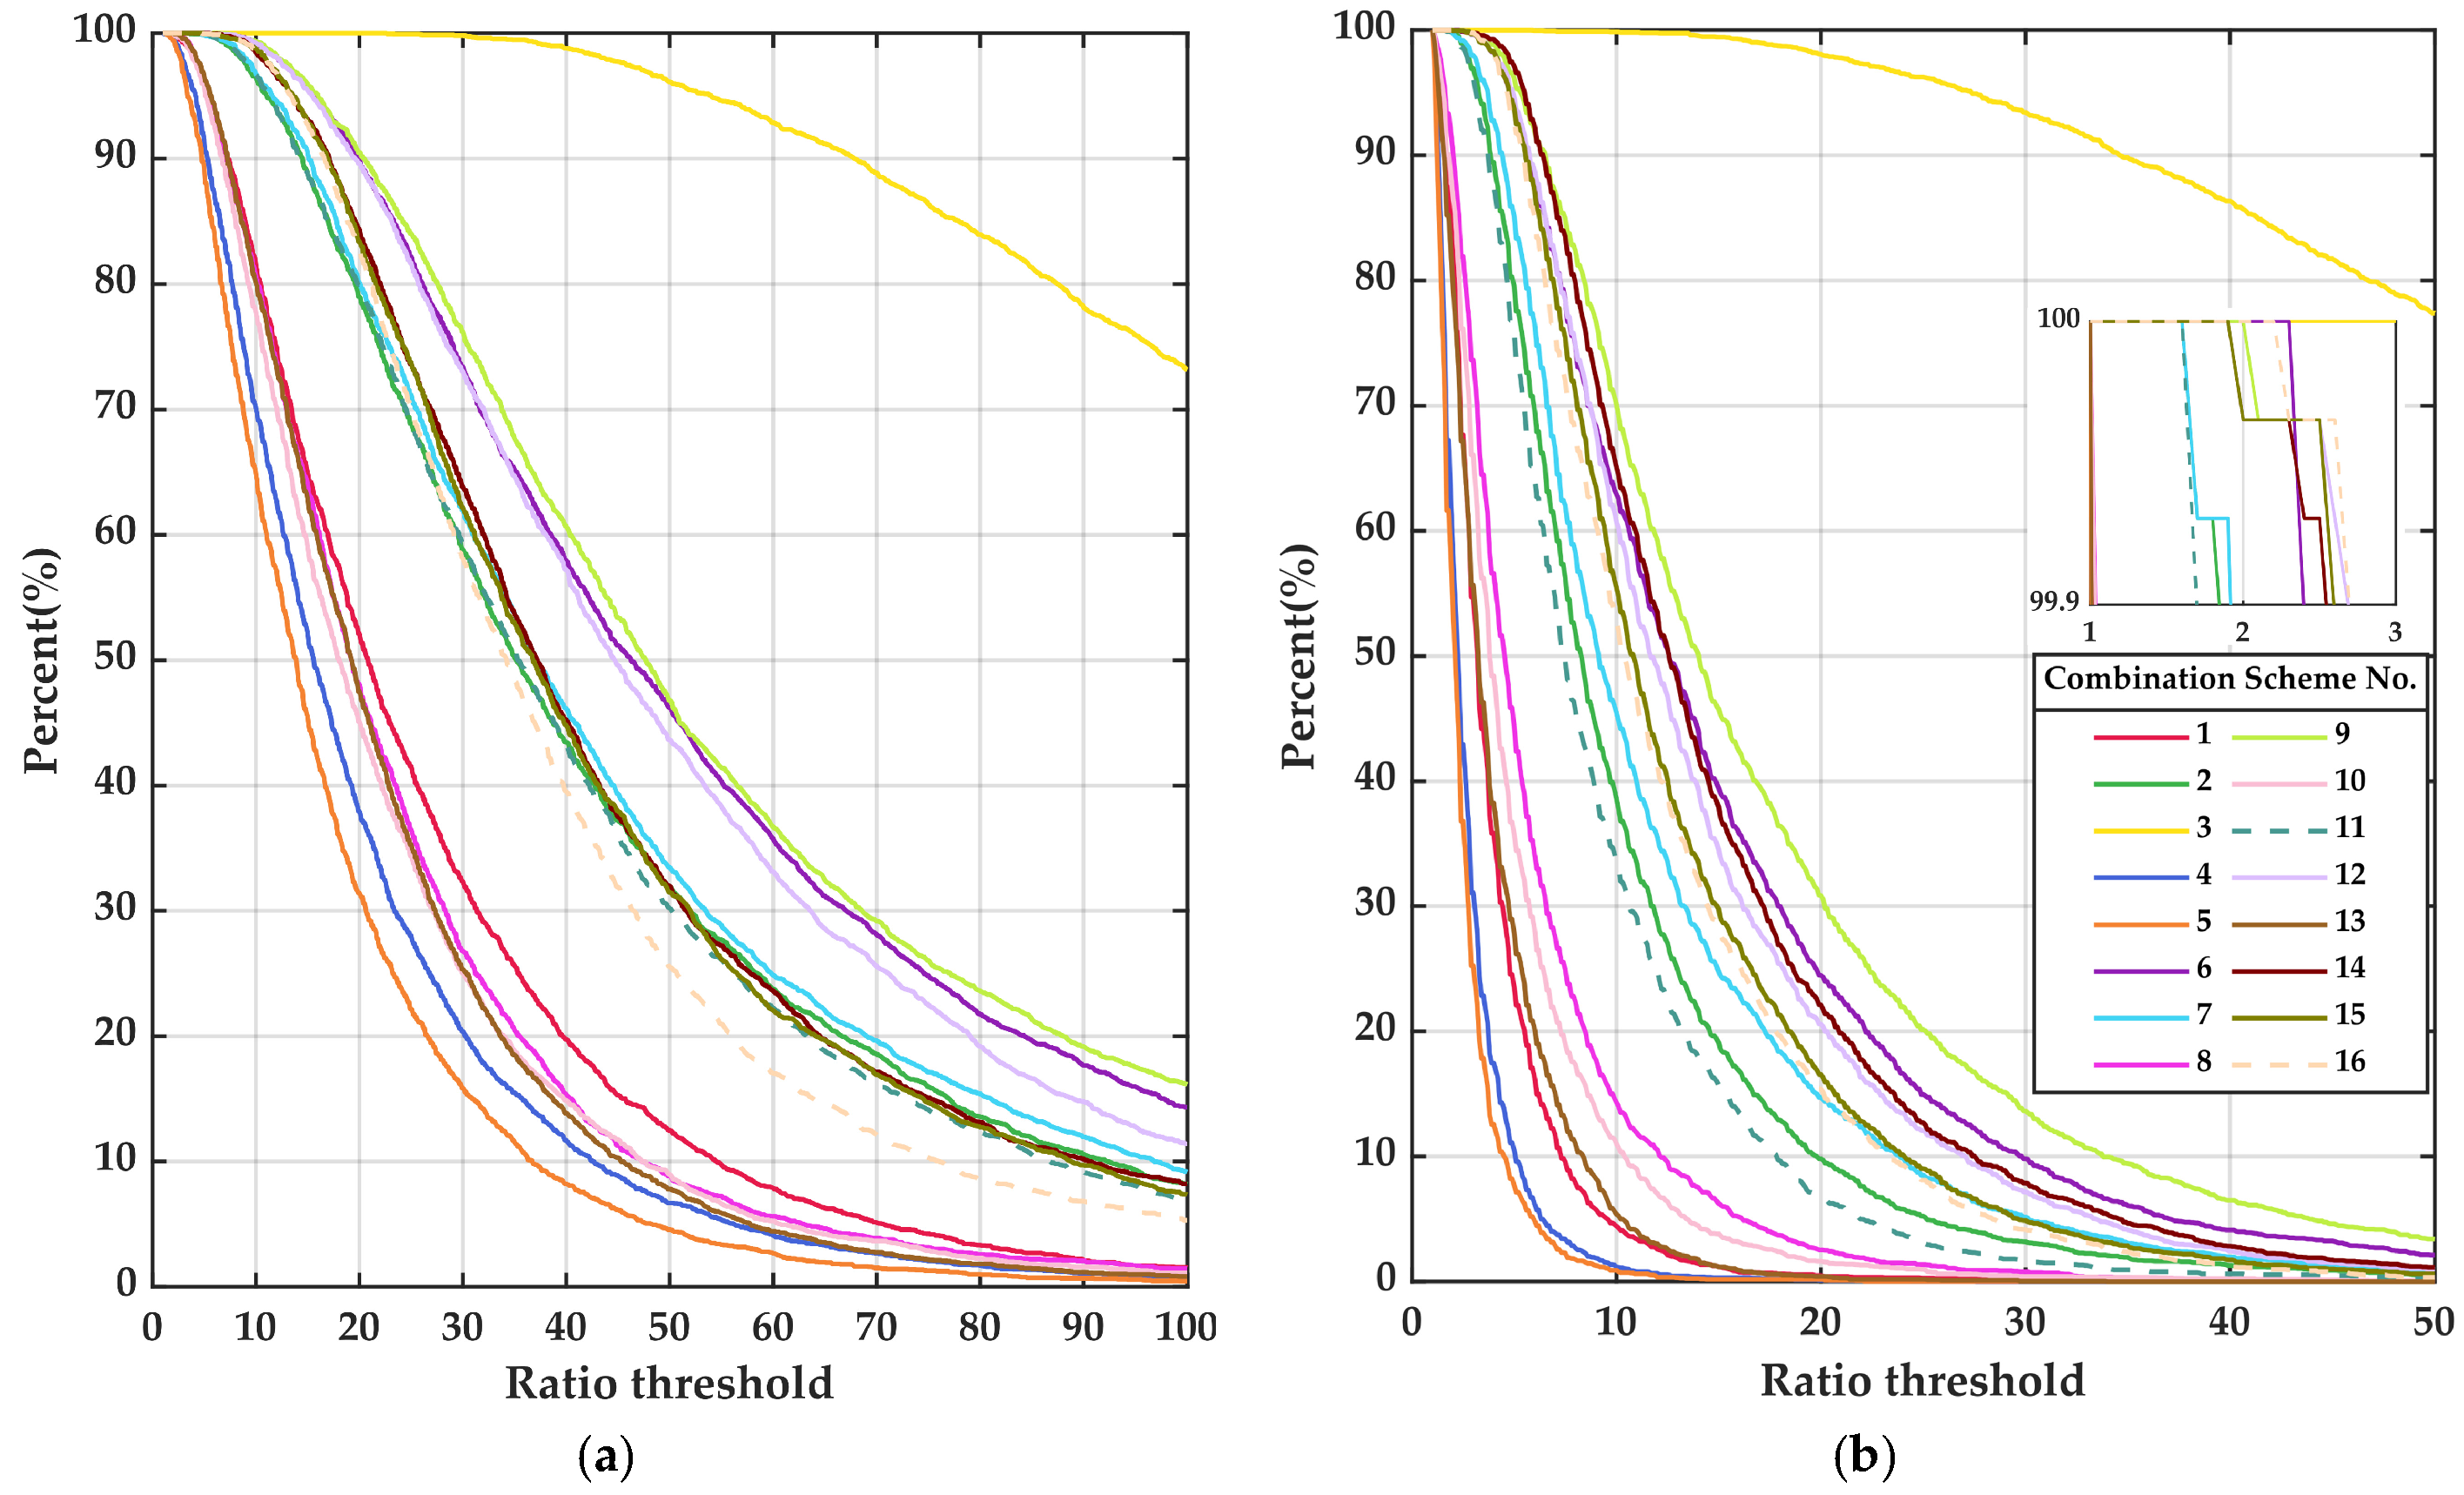
We counted the P values of each scheme for Baseline 1 with a threshold range of 1–100 (Figure 7a) and for Baseline 2 with a threshold range of 1–50 for Baseline 2 (Figure 7b). According to the trend of the lines of each scheme in the two figures, we can see that different frequency band combination schemes have different reliabilities. Carefully observing the two figures, they can be roughly divided into three categories according to the trend of the P value curve. Scheme 3 is the first category, which has a higher ratio value and also reflects that the fixed solution is more reliable; however, the observation noise is significantly amplified. The second category includes schemes 2, 6, 7, 9, 11, 12, 14, 15, and 16, among which all the quad- and five-frequency schemes except Scheme 13 belong to the second category. These are all dominated by carrier phase observations in ionosphere-float mode. The third category includes schemes 1, 4, 5, 8, 10, and 13. Through classification, we can see that the reliability of the quad- and five-frequency schemes is significantly better than that of the triple-frequency solution. Half of the triple-frequency schemes are in the third category, and only Scheme 13 of the quad- and five-frequency schemes is in the lowest category. It can be inferred that the quad-frequency and five-frequency schemes offer better reliability.
Combined with the positioning error analysis above, the positioning performance of the second type of scheme in ionosphere-fixed mode is comparable and has high reliability. In ionosphere-float mode, the positioning performance of the second type of schemes 6, 9, 12, 14, 15, and 16 are comparable and excellent. Considering the data volume, positioning performance, and reliability, Scheme 9 performs better, followed by Scheme 6.

4. Discussion

Given that long-baseline positioning performance is largely influenced by measurement noise, atmospheric residuals, and orbit residuals in the observation data, assessing the a priori success rate of Scheme 9 across varying error levels is essential. Assuming that the TNL of the combined signal follows a normal distribution, the probability of the ambiguity being correctly fixed can be theoretically calculated according to the Formula (27), based on the TNL and various error levels [32]. This can be expressed mathematically as:
P ( 0.5 < x < 0.5 ) = 0.5 0.5 1 σ T Φ 2 π exp ( x bias ) 2 2 σ T Φ 2 d x
where x is the difference between the float and true integer ambiguities. Figure 8 illustrates the probability of correct integer ambiguities for the two WL combinations of Scheme 9 under different biases. It can be seen that the first signal combination of Scheme 9 exhibits excellent performance, with a success rate remaining above 99.9% even when the error reaches 32 cm. The success rate of the second combination signal remains above 99% when the error reaches 25 cm. According to reference [25], for long baselines shorter than 500 km, the total error falls between 4.5 and 32 cm. Therefore, Scheme 9 can reliably achieve instantaneous AR for long baselines.
In addition, considering that the observation data are influenced by multiple errors, the actual tracking observations do not strictly follow a Gaussian distribution or random model. Therefore, it is normal that the precision ratios of each scheme’s experimental results do not strictly align with the theoretical analysis presented in Section 2.2.

5. Conclusions

Studying the positioning performance of different frequency combination schemes is conducive to the rational use of the multi-frequency signals broadcast by BDS-3. Based on the five-frequency signals from BDS-3, this study combines theoretical derivations with experimental validation to assess the positioning performance of each scheme under various ionospheric delay processing strategies. The key contributions and findings of this work are summarized as follows:
  • This study employs the LS method to derive the theoretical positioning precision for the single-epoch WL combination of 16 schemes, each with varying numbers of frequencies (three or more), under both the ionosphere-fixed and ionosphere-float models. These theoretical predictions are then validated using two baselines. The experimental results under both models show strong correlations with the theoretical derivations, with Pearson correlation coefficients of 0.997 and 0.968, respectively, demonstrating the validity of the theoretical derivations.
  • In the ionosphere-fixed mode and the ionosphere-float mode, the triple-frequency scheme 9 (B1C, B1I, B2b) has excellent performance and high reliability. Although the positioning performance is slightly inferior to scheme 14 and scheme 16, the amount of data it uses is significantly smaller. The positioning performance of Scheme 9 under the ionosphere-fixed model is 100% FR, CEP (75%) is 2.6 cm, and SEP (75%) is 6.0 cm; the positioning performance under the ionosphere-float model is 99.7% FR, CEP (75%) is 16.2 cm, and SEP (75%) is 30.8 cm.
  • This study shows that simply using multi-frequency data may not significantly improve positioning precision. Instead, it is more important to develop a reasonable frequency combination.

Author Contributions

Y.W. proposed research ideas; Y.W. conducted the theory studies; X.L., S.Z., and Y.W. designed experiments and analyzed results; Y.W. wrote the paper; X.L. and S.Z. offered guidance and supervision. All authors have read and agreed to the published version of the manuscript.

Funding

This research was funded by the National Natural Science Foundation of China (Grant Nos. 42304046 and 42271460), the Natural Science Foundation of Jiangsu Province (Grant No. BK20221146), the Youth Science and Technology Talent Support Project of Jiangsu Province (Grant No. JSTJ-2024-474), the Graduate Innovation Program of China University of Mining and Technology (Grant No. 2024WLJCRCZL249), and the Postgraduate Research & Practice Innovation Program of Jiangsu Province (Grant No. KYCX24_2829).

Data Availability Statement

The data used for this research were from the BUR2 and EIJS stations of the EUREF Permanent GNSS Network (EPN) (https://epncb.oma.be/pub/RINEX/2024/111/ (accessed on 5 May 2024)) and the RHPT and BRU2 stations of the Asia-Pacific Reference Frame (APREF) network (https://ga-gnss-data-rinex-v1.s3.amazonaws.com/index.html#public/ (accessed on 5 May 2024)).

Acknowledgments

We thank all the scientists and principal researchers who prepared and provided the research data. We thank the EUREF Permanent GNSS Network and the Asia-Pacific Reference Frame network for providing experimental data.

Conflicts of Interest

The authors declare no conflicts of interest.

References

  1. Teunissen, P.J.G.; Verhagen, S. GNSS Carrier Phase Ambiguity Resolution: Challenges and Open Problems. In Observing Our Changing Earth; Sideris, M.G., Ed.; International Association of Geodesy Symposia; Springer: Berlin/Heidelberg, Germany, 2008; Volume 133, pp. 785–792. ISBN 978-3-540-85425-8. [Google Scholar]
  2. Xu, W.; Yan, C.; Chen, J. Performance Evaluation of BDS-2/BDS-3 Combined Precise Time Transfer with B1I/B2I/B3I/B1C/B2a Five-Frequency Observations. GPS Solut. 2022, 26, 80. [Google Scholar] [CrossRef]
  3. Li, X.; Liu, G.; Li, X.; Zhou, F.; Feng, G.; Yuan, Y.; Zhang, K. Galileo PPP Rapid Ambiguity Resolution with Five-Frequency Observations. GPS Solut. 2020, 24, 24. [Google Scholar] [CrossRef]
  4. Pan, L.; Zhang, X.; Liu, J. A comparison of three widely used GPS triple-frequency precise point positioning models. GPS Solut. 2019, 23, 121. [Google Scholar] [CrossRef]
  5. Fernández-Plazaola, U.; Martín-Guerrero, T.M.; Entrambasaguas, J.T. A New Method for Three-Carrier GNSS Ambiguity Resolution. J. Geod. 2008, 82, 269–278. [Google Scholar] [CrossRef]
  6. Li, B.; Li, Z.; Zhang, Z.; Tan, Y. ERTK: Extra-Wide-Lane RTK of Triple-Frequency GNSS Signals. J. Geod. 2017, 91, 1031–1047. [Google Scholar] [CrossRef]
  7. Cao, X.; Shen, F.; Zhang, S.; Li, J. Satellite Availability and Positioning Performance of Uncombined Precise Point Positioning Using BeiDou-2 and BeiDou-3 Multi-Frequency Signals. Adv. Space Res. 2021, 67, 1303–1316. [Google Scholar] [CrossRef]
  8. Tang, W.; Shen, M.; Deng, C.; Cui, J.; Yang, J. Network-Based Triple-Frequency Carrier Phase Ambiguity Resolution between Reference Stations Using BDS Data for Long Baselines. GPS Solut. 2018, 22, 73. [Google Scholar] [CrossRef]
  9. Tian, Y.; Zhao, D.; Chai, H.; Wang, S. BDS Ambiguity Resolution with the Modified TCAR Method for Medium-Long Baseline. Adv. Space Res. 2017, 59, 670–681. [Google Scholar] [CrossRef]
  10. Li, B.; Feng, Y.; Gao, W.; Li, Z. Real-Time Kinematic Positioning over Long Baselines Using Triple-Frequency BeiDou Signals. IEEE Trans. Aerosp. Electron. Syst. 2015, 51, 3254–3269. [Google Scholar] [CrossRef]
  11. Li, J.; Yang, Y.; Xu, J.; He, H.; Guo, H. GNSS Multi-Carrier Fast Partial Ambiguity Resolution Strategy Tested with Real BDS/GPS Dual- and Triple-Frequency Observations. GPS Solut. 2015, 19, 5–13. [Google Scholar] [CrossRef]
  12. Zhu, Y.; Zhang, Q.; Mao, Y.; Cui, X.; Cai, C.; Zhang, R. Comprehensive Performance Review of BDS-3 after One-Year Official Operation. Adv. Space Res. 2023, 71, 883–899. [Google Scholar] [CrossRef]
  13. Composition and Operational Status of the Beidou Navigation Satellite System Constellation. Available online: https://glonass-iac.ru/beidou/sostavOG/ (accessed on 17 September 2024).
  14. Zhang, Z.; Li, B.; He, X. Geometry-free single-epoch resolution of BDS-3 multi-frequency carrier ambiguities. Acta Geod. Cartogr. Sin. 2020, 49, 1139–1148. [Google Scholar]
  15. Li, B.; Zhang, Z.; Miao, W.; Chen, G. Improved Precise Positioning with BDS-3 Quad-Frequency Signals. Satell. Navig. 2020, 1, 30. [Google Scholar] [CrossRef]
  16. Liu, L.; Pan, S.; Gao, W.; Ma, C.; Tao, J.; Zhao, Q. Assessment of Quad-Frequency Long-Baseline Positioning with BeiDou-3 and Galileo Observations. Remote Sens. 2021, 13, 1551. [Google Scholar] [CrossRef]
  17. Nie, Z.; Wang, B.; Wang, Z.; He, K. An Offshore Real-Time Precise Point Positioning Technique Based on a Single Set of BeiDou Short-Message Communication Devices. J. Geod. 2020, 94, 78. [Google Scholar] [CrossRef]
  18. Li, B.; Zhang, Z.; Zang, N.; Wang, S. High-Precision GNSS Ocean Positioning with BeiDou Short-Message Communication. J. Geod. 2019, 93, 125–139. [Google Scholar] [CrossRef]
  19. Gao, W.; Zhang, Z.; Pan, S.; Wang, C. Single Epoch Positioning Method Based on BDS Five-Frequency Extra-Wide-Lane Combination. J. Chin. Inert. Technol. 2023, 31, 918–924+931. [Google Scholar]
  20. Zhang, Z.; Li, B.; Gao, Y.; Zhang, Z.; Wang, S. Asynchronous and Time-Differenced RTK for Ocean Applications Using the BeiDou Short Message Service. J. Geod. 2023, 97, 7. [Google Scholar] [CrossRef]
  21. Lu, T.; Wang, X.; Lu, C. An improved GNSS high-dimensional ambiguity fast decorrelation algorithm. Geod. Geodyn. 2021, 41, 511–515. [Google Scholar]
  22. Liu, X.; Zhang, S.; Zhang, Q.; Ding, N.; Yang, W. A Fast Satellite Selection Algorithm with Floating High Cut-off Elevation Angle Based on ADOP for Instantaneous Multi-GNSS Single-Frequency Relative Positioning. Adv. Space Res. 2019, 63, 1234–1252. [Google Scholar] [CrossRef]
  23. Liu, X.; Zhang, S.; Zhang, Q.; Zheng, N.; Zhang, W.; Ding, N. Theoretical Analysis of the Multi-GNSS Contribution to Partial Ambiguity Estimation and R-Ratio Test-Based Ambiguity Validation. GPS Solut. 2021, 25, 52. [Google Scholar] [CrossRef]
  24. Zhang, Z.; Li, B.; He, X.; Zhang, Z.; Miao, W. Models, Methods and Assessment of Four-Frequency Carrier Ambiguity Resolution for BeiDou-3 Observations. GPS Solut. 2020, 24, 96. [Google Scholar] [CrossRef]
  25. Feng, Y. GNSS Three Carrier Ambiguity Resolution Using Ionosphere-Reduced Virtual Signals. J. Geod. 2008, 82, 847–862. [Google Scholar] [CrossRef]
  26. Li, B.; Feng, Y.; Shen, Y. Three Carrier Ambiguity Resolution: Distance-Independent Performance Demonstrated Using Semi-Generated Triple Frequency GPS Signals. GPS Solut. 2010, 14, 177–184. [Google Scholar] [CrossRef]
  27. Liu, X.; Wang, Q.; Zhang, S.; Wu, S. A New Efficient Fusion Positioning Method for Single-Epoch Multi-GNSS Based on the Theoretical Analysis of the Relationship between ADOP and PDOP. GPS Solut. 2022, 26, 139. [Google Scholar] [CrossRef]
  28. Bard, J.D.; Ham, F.M. Time difference of arrival dilution of precision and applications. IEEE Trans. Signal Process. 1999, 47, 521–523. [Google Scholar] [CrossRef]
  29. Teunissen, P.J.G. The Least-Squares Ambiguity Decorrelation Adjustment: A Method for Fast GPS Integer Ambiguity Esti-mation. J. Geod. 1995, 70, 65–82. [Google Scholar] [CrossRef]
  30. Liu, X.; Chen, G.; Zhang, Q.; Zhang, S. Improved Single-epoch Single-frequency Par Lambda Algorithm with Baseline Constraints for the BeiDou Navigation Satellite System. IET Radar Sonar Navig. 2017, 11, 1549–1557. [Google Scholar] [CrossRef]
  31. Landskron, D.; Böhm, J. VMF3/GPT3: Refined Discrete and Empirical Troposphere Mapping Functions. J. Geod. 2018, 92, 349–360. [Google Scholar] [CrossRef]
  32. Teunissen, P.J. Influence of ambiguity precision on the success rate of GNSS integer ambiguity bootstrapping. J. Geod. 2007, 81, 351–358. [Google Scholar] [CrossRef]
Figure 1. The number of BDS-3 satellites and RDOP values as a function of epochs: (a) Baseline 1; (b) Baseline 2.
Remotesensing 16 04404 g001
Figure 2. ENU errors for Baseline 1, showing comparisons of different processing schemes. (1a16a) Errors in the East (E) and North (N) directions for schemes 1 to 16 (indicated by numbers in parentheses). Red dots depict float solutions, whereas blue dots represent fixed solutions. (1b16b) Error in the Up (U) direction for the same schemes, with the same color coding applied.
Remotesensing 16 04404 g002
Figure 3. Positioning error of Baseline 1: (a) 2D positioning error; (b) 3D positioning error.
Remotesensing 16 04404 g003
Figure 4. ENU errors for Baseline 2, showing comparisons of different processing schemes. (1a16a) Errors in the East (E) and North (N) directions for schemes 1 to 16 (indicated by numbers in parentheses). Red dots depict float solutions, whereas blue dots represent fixed solutions. (1b16b) Error in the Up (U) direction for the same schemes, with the same color coding applied.
Remotesensing 16 04404 g004
Figure 5. STD of positioning results for Baseline 2 in E, N, and U directions across 16 different schemes.
Remotesensing 16 04404 g005
Figure 6. Positioning error of Baseline 2: (a) 2D positioning error; (b) 3D positioning error.
Remotesensing 16 04404 g006
Figure 7. P values as a function of thresholds: (a) Baseline 1; (b) Baseline 2.
Remotesensing 16 04404 g007
Figure 8. The success rate of theoretical AR under different total errors.
Remotesensing 16 04404 g008
Table 1. BDS-3 frequencies and wavelengths.
SignalFrequency (MHz)Wavelength (m)Satellite
B1C1575.4200.1903BDS-3 24MEO+3IGSO
B1I1561.0980.1920
B3I1268.5200.2363
B2b1207.1400.2483
B2a1176.4500.2548
Table 2. DD-phase STD budgets (cm).
ItemBudget (≤100 km)
Phase noise≈1
Orbit error<0.5
Tropospheric delay<1
1st-order ionospheric delay<10
2nd-order ionospheric delay<0.5
Table 3. The coefficients, wavelength (m), ionospheric scalar factor, noise amplitude factor, and TNL of BeiDou-3 high-quality combination signals.
No.i (B1C)j (B1I)k (B3I)l (B2b)m (B2a) λ  (m) μ η σ T Φ
11−100020.93−1.01154.860.07
01−1001.02−1.256.880.14
2001−104.88−1.6228.530.07
01−2101.30−1.1613.900.14
30001−19.77−1.7554.920.06
001−104.88−1.6228.530.07
41−100020.93−1.01154.860.07
010−100.85−1.325.580.17
51−100020.93−1.01154.860.07
0100−10.78−1.355.080.19
60010−13.26−1.6618.790.08
01−2011.50−1.0715.970.13
7001−104.88−1.6228.530.07
10−2101.22−1.1513.120.14
80001−19.77−1.7554.920.06
100−100.81−1.315.390.18
90010−13.26−1.6618.790.08
10−2011.40−1.0614.940.13
100001−19.77−1.7554.920.06
010−100.85−1.325.580.17
11001−104.88−1.6228.530.07
1−100020.93−1.01154.860.07
01−2101.30−1.1613.900.14
121−100020.93−1.01154.860.08
0010−13.26−1.6618.790.08
01−2011.40−1.0614.940.13
130001−19.77−1.7554.920.06
1−100020.93−1.01154.860.07
010−100.85−1.325.580.17
140001−19.77−1.7554.920.06
001−104.88−1.6228.530.07
10−2011.40−1.0614.940.13
150001−19.77−1.7554.920.06
001−104.88−1.6228.530.07
01−2011.50−1.0715.970.13
160001−19.77−1.7554.920.06
001−104.88−1.6228.530.07
1−100020.93−1.01154.860.07
01−2011.50−1.0715.970.13
Table 4. UREP coefficients of each scheme.
No.12345678910111213141516
10 4 M 316.8341.829.0485.6587.6396.2366.5465.3422.1437.6565.0646.5735.8465.7437.8753.7
1 M i 5.65.418.64.54.15.05.24.64.94.74.23.93.74.64.83.6
1 N i 263.4103.2659.3214.3195.470.998.7129.167.8134.096.666.6122.666.569.665.4
1 N i φ 810.8114.4958.8672.8620.074.6109.2172.371.2179.1109.270.9168.971.274.570.9
Table 5. Data process strategy settings.
ItemsLong RangeShort Range
Cutoff elevation10°20°
Sampling rate30 s
Observation weightingElevation-dependent weighting [30]
Satellite orbitBroadcast ephemeris
Satellite clockDD eliminated
Receiver clockDD eliminated
Ionospheric delayParameterizationDD eliminated
Tropospheric delayCorrected by GPT3 model [31]
Phase ambiguitiesLAMBDA
Ratio threshold3
Table 6. STD of positioning results for Baseline 1 across the E, N, and U directions, as well as 3D positioning precision, along with the FR for each of the 16 schemes. Units: STD in centimeters (cm), FR in percentage (%).
No.12345678910111213141516
E1.51.53.71.31.31.41.41.31.31.41.31.31.31.31.41.2
N2.01.95.01.71.71.81.81.81.81.81.71.71.71.81.81.7
U5.25.314.24.64.65.25.24.84.85.14.54.54.44.75.14.3
3D5.85.815.55.15.15.75.35.35.25.55.05.04.85.25.54.8
FR89.210010077.368.710010097.510095.410010099.6100100100
Table 7. STD of positioning results for Baseline 2 across the north, east, and up directions, as well as 3D positioning precision, along with the FR for each of the 16 schemes. Units: STD in centimeters (cm), FR in percentage (%).
No.12345678910111213141516
E38.4 13.1 61.4 31.4 27.8 11.0 11.1 14.2 9.7 17.7 11.3 9.8 15.5 9.7 10.9 9.7
N56.0 13.4 85.9 42.4 36.2 10.1 11.9 18.7 9.4 22.9 13.2 9.8 21.1 9.2 9.9 9.6
U91.8 30.4 150.1 70.8 67.2 25.4 26.1 35.1 22.5 43.3 27.2 22.9 39.4 22.5 25.3 22.9
3D114.2 35.7 183.6 88.3 81.3 29.5 30.7 42.3 26.2 52.0 32.3 26.7 47.3 26.2 29.3 26.6
FR53.6 96.8 100 30.3 24.3 99.7 97.9 72.6 99.7 64.8 95.9 99.6 54.7 99.8 99.6 99.7
Disclaimer/Publisher’s Note: The statements, opinions and data contained in all publications are solely those of the individual author(s) and contributor(s) and not of MDPI and/or the editor(s). MDPI and/or the editor(s) disclaim responsibility for any injury to people or property resulting from any ideas, methods, instructions or products referred to in the content.