Article

Spatiotemporal Characteristics and Influencing Factors of PM2.5 Levels in Lianyungang: Insights from a Multidimensional Analysis

1
School of Electronic Engineering, Jiangsu Ocean University, Lianyungang 222005, China
2
Jiangsu Institute of Marine Resources Development, Jiangsu Ocean University, Lianyungang 222005, China
3
The State Key Laboratory of Marine Environmental Science, College of Ocean and Earth Sciences, Xiamen University, Xiamen 361102, China
4
Lianyungang Branch of Jiangsu Hydrology and Water Resource Survey Bureau, Lianyungang 222004, China
5
School of Marine Technology and Geomatics, Jiangsu Ocean University, Lianyungang 222005, China
6
Marine College, Shandong University, Weihai 264209, China
*
Author to whom correspondence should be addressed.
Remote Sens. 2024, 16(23), 4495; https://doi.org/10.3390/rs16234495
Submission received: 23 September 2024 / Revised: 26 November 2024 / Accepted: 27 November 2024 / Published: 29 November 2024
(This article belongs to the Section Environmental Remote Sensing)

Abstract

:
The rapid industrialization and urbanization in China have exacerbated air pollution, particularly PM2.5, posing significant threats to public health. This study focused on Lianyungang, an industrial city, to analyze the spatiotemporal variations in PM2.5 concentrations from 2000 to 2023 and identify the influencing factors. Utilizing high-resolution PM2.5 data from the ChinaHighPM2.5 dataset and ERA5 meteorological data, the study employed Empirical Orthogonal Function (EOF) analysis to capture spatial variability and the Bayesian Estimator of Abrupt Change Seasonal and Trend (BEAST) to assess long-term trends and abrupt changes. The key findings include a marked seasonal pattern, with higher PM2.5 levels during the winter months and lower concentrations in the summer, primarily driven by temperature, humidity, and precipitation. A significant decline in PM2.5 levels was observed after 2014, following the implementation of pollution control measures. The study underscores the importance of continued environmental regulation and green technology adoption in mitigating air pollution in rapidly industrializing cities. This research provides a comprehensive analysis of PM2.5 trends and highlights the critical role of natural and human factors, contributing valuable insights for policymakers and researchers aiming to improve air quality.

1. Introduction

With the rapid advancement of global industrialization, air pollution has become a major environmental issue that affects human health and has attracted global attention [1]. Fine particulate matter (PM2.5), which refers to particles with an aerodynamic diameter of 2.5 microns or less, mainly consists of inorganic ions, carbon compounds, and mineral dust. The carbon compounds include both black carbon and organic carbon, as well as secondary organic aerosols. These components come from direct emissions, such as forest fires and agricultural waste burning. They also include secondary formations, like windblown mineral dust and pollutants that are formed through atmospheric chemical reactions. The main sources of these pollutants include residential energy use, vehicle emissions, energy production, solvent production and use, industrial emissions, and agricultural fertilization. PM2.5 particles have strong penetrability and can enter deep into the respiratory system, leading to various respiratory and cardiovascular diseases, and increasing overall mortality [2,3,4]. From 1980s to 2010s, with the rapid urbanization and industrialization, PM2.5 pollution became particularly prominent in many regions, attracting the focus of researchers and policymakers [5]. Due to the complex sources and spatiotemporal variability of PM2.5, long-term monitoring using atmospheric stations, remote sensing, and data analysis is essential to understanding its dynamics. These methods help policymakers identify key pollution sources and develop strategies to reduce emissions and protect public health [6].
Remote sensing has become an important tool in air quality monitoring because of its large coverage, high temporal resolution, and nondestructive detection capabilities [7,8,9]. In recent years, significant progress has been made in the application of remote sensing technology for PM2.5 monitoring [10]. Various satellite platforms, such as MODIS, VIIRS, TROPOMI, as well as MetOp (including IASI and GOME-2) and AQUA (MLS), provide researchers with extensive aerosol optical depth (AOD) data and atmospheric composition measurements. These sensors contribute crucial information, with IASI and GOME-2 offering detailed gas concentration data (e.g., ozone and nitrogen dioxide), and MLS providing vertical profiles of atmospheric pollutants, while AOD data are primarily available from other instruments such as MODIS and VIIRS [11,12,13]. Through inversion algorithms (e.g., regression models, physical models, and machine learning algorithms), these data can be used to accurately estimate surface PM2.5 concentrations [10,14,15]. Remote sensing offers unique advantages in monitoring PM2.5 pollution, overcoming the geographical limitations of traditional ground monitoring stations and enabling more comprehensive and continuous spatial monitoring. This is crucial for a deeper understanding of the long-term trends and seasonal variations in PM2.5 pollution. Remote sensing-based monitoring methods can precisely detect the spatiotemporal distribution of PM2.5, which can provide data support for the trend analysis of the pollutant concentrations, as well as a scientific and reliable basis of decision for the environmental management.
Lianyungang is located on the east coast of China (Figure 1) and is an important port city in Jiangsu Province. Its geographical location is unique and belongs to the warm-temperate monsoon climate zone and has distinct four seasons. The terrain of Lianyungang slopes from northwest to southeast and has various landforms including mountains, plains, oceans, rivers, lakes, hills, and mudflats. The area is divided from west to east into a hill area, plain, coastal area, and the Yuntai Mountain, an area with 251 peaks covering an area of nearly 200 km2 [16]. Lianyungang’s varied terrain, with mountains scattered between urban areas, can hinder the timely spread of pollutants. In addition, the city often experiences adverse meteorological conditions such as temperature inversions and calm winds in winter and spring, making air quality problems more challenging [16]. With the rapid economic development of Lianyungang, industrialization and urbanization have accelerated significantly, which is driven by heavy industries such as the steel and petrochemical industries, resulting in more and more PM2.5 pollution [16,17], which frequent exceeds the allowed PM2.5 pollution levels. In recent years, air quality problems in Lianyungang have posed a threat to the residents’ health and quality of life [18].
Research on PM2.5 pollution in Lianyungang has made some progress and has mainly focused on the following areas: spatiotemporal distribution analyses, pollution characteristics, source distribution, and health impact assessments [19,20,21,22,23,24,25]. The current studies rely heavily on ground monitoring data and model simulations, which help reveal the distribution patterns and key influencing factors of PM2.5 levels [22,25]. However, due to the limited spatial coverage and relatively short time span of data from monitoring stations, these studies were unable to capture the long-term trends and large-scale spatiotemporal distribution characteristics. These limitations hinder a comprehensive understanding of the pollution situation, as PM2.5 in the city has significant impacts for the science-based formulation of pollution control policies.
In contrast, remote sensing data, with its large time coverage and long temporal span, have shown significant advantages in overcoming these limitations. In recent years, studies have analyzed long-term remote sensing data to investigate the spatiotemporal variations in PM2.5 levels in different regions and revealed the mechanisms of various influencing factors [17,26]. However, for Lianyungang, a coastal city with typical industrialization characteristics, there is still a lack of systematic research based on long-term remote sensing data. Conducting such studies will not only help in comprehensively understanding the spatiotemporal characteristics of PM2.5 pollution in Lianyungang, but it also has important practical significance and research value for formulating science-based guidelines for pollution control.
The main objective of this study was to use long-term remote sensing data from 2000 to 2023 to reveal the spatiotemporal variation characteristics of PM2.5 concentrations in Lianyungang and identify the main trends and rules of change. To this end, we investigated the key factors affecting the spatiotemporal distribution of PM2.5, including natural factors (such as meteorological conditions and topographic features) and human factors (such as industrial emissions, traffic density, and urban expansion). The specific research questions included the following: What are the spatiotemporal variation characteristics of the PM2.5 concentrations in different periods in Lianyungang? What factors play a crucial role in the spatiotemporal changes in PM2.5 concentrations? The answers to these questions will provide scientific evidence for air quality management in Lianyungang and similar cities.

2. Materials and Methods

This section details the data sources and the methods used in this study. The data include high-resolution PM2.5 concentration and ERA5 meteorological datasets. The main analytical approach combines Empirical Orthogonal Function (EOF) analysis, Principal Component Analysis (PCA), and the Bayesian Estimator of Abrupt Change Seasonal and Trend (BEAST) algorithm to explore the spatial variability, detect trends, and analyze the seasonality of PM2.5 concentrations.

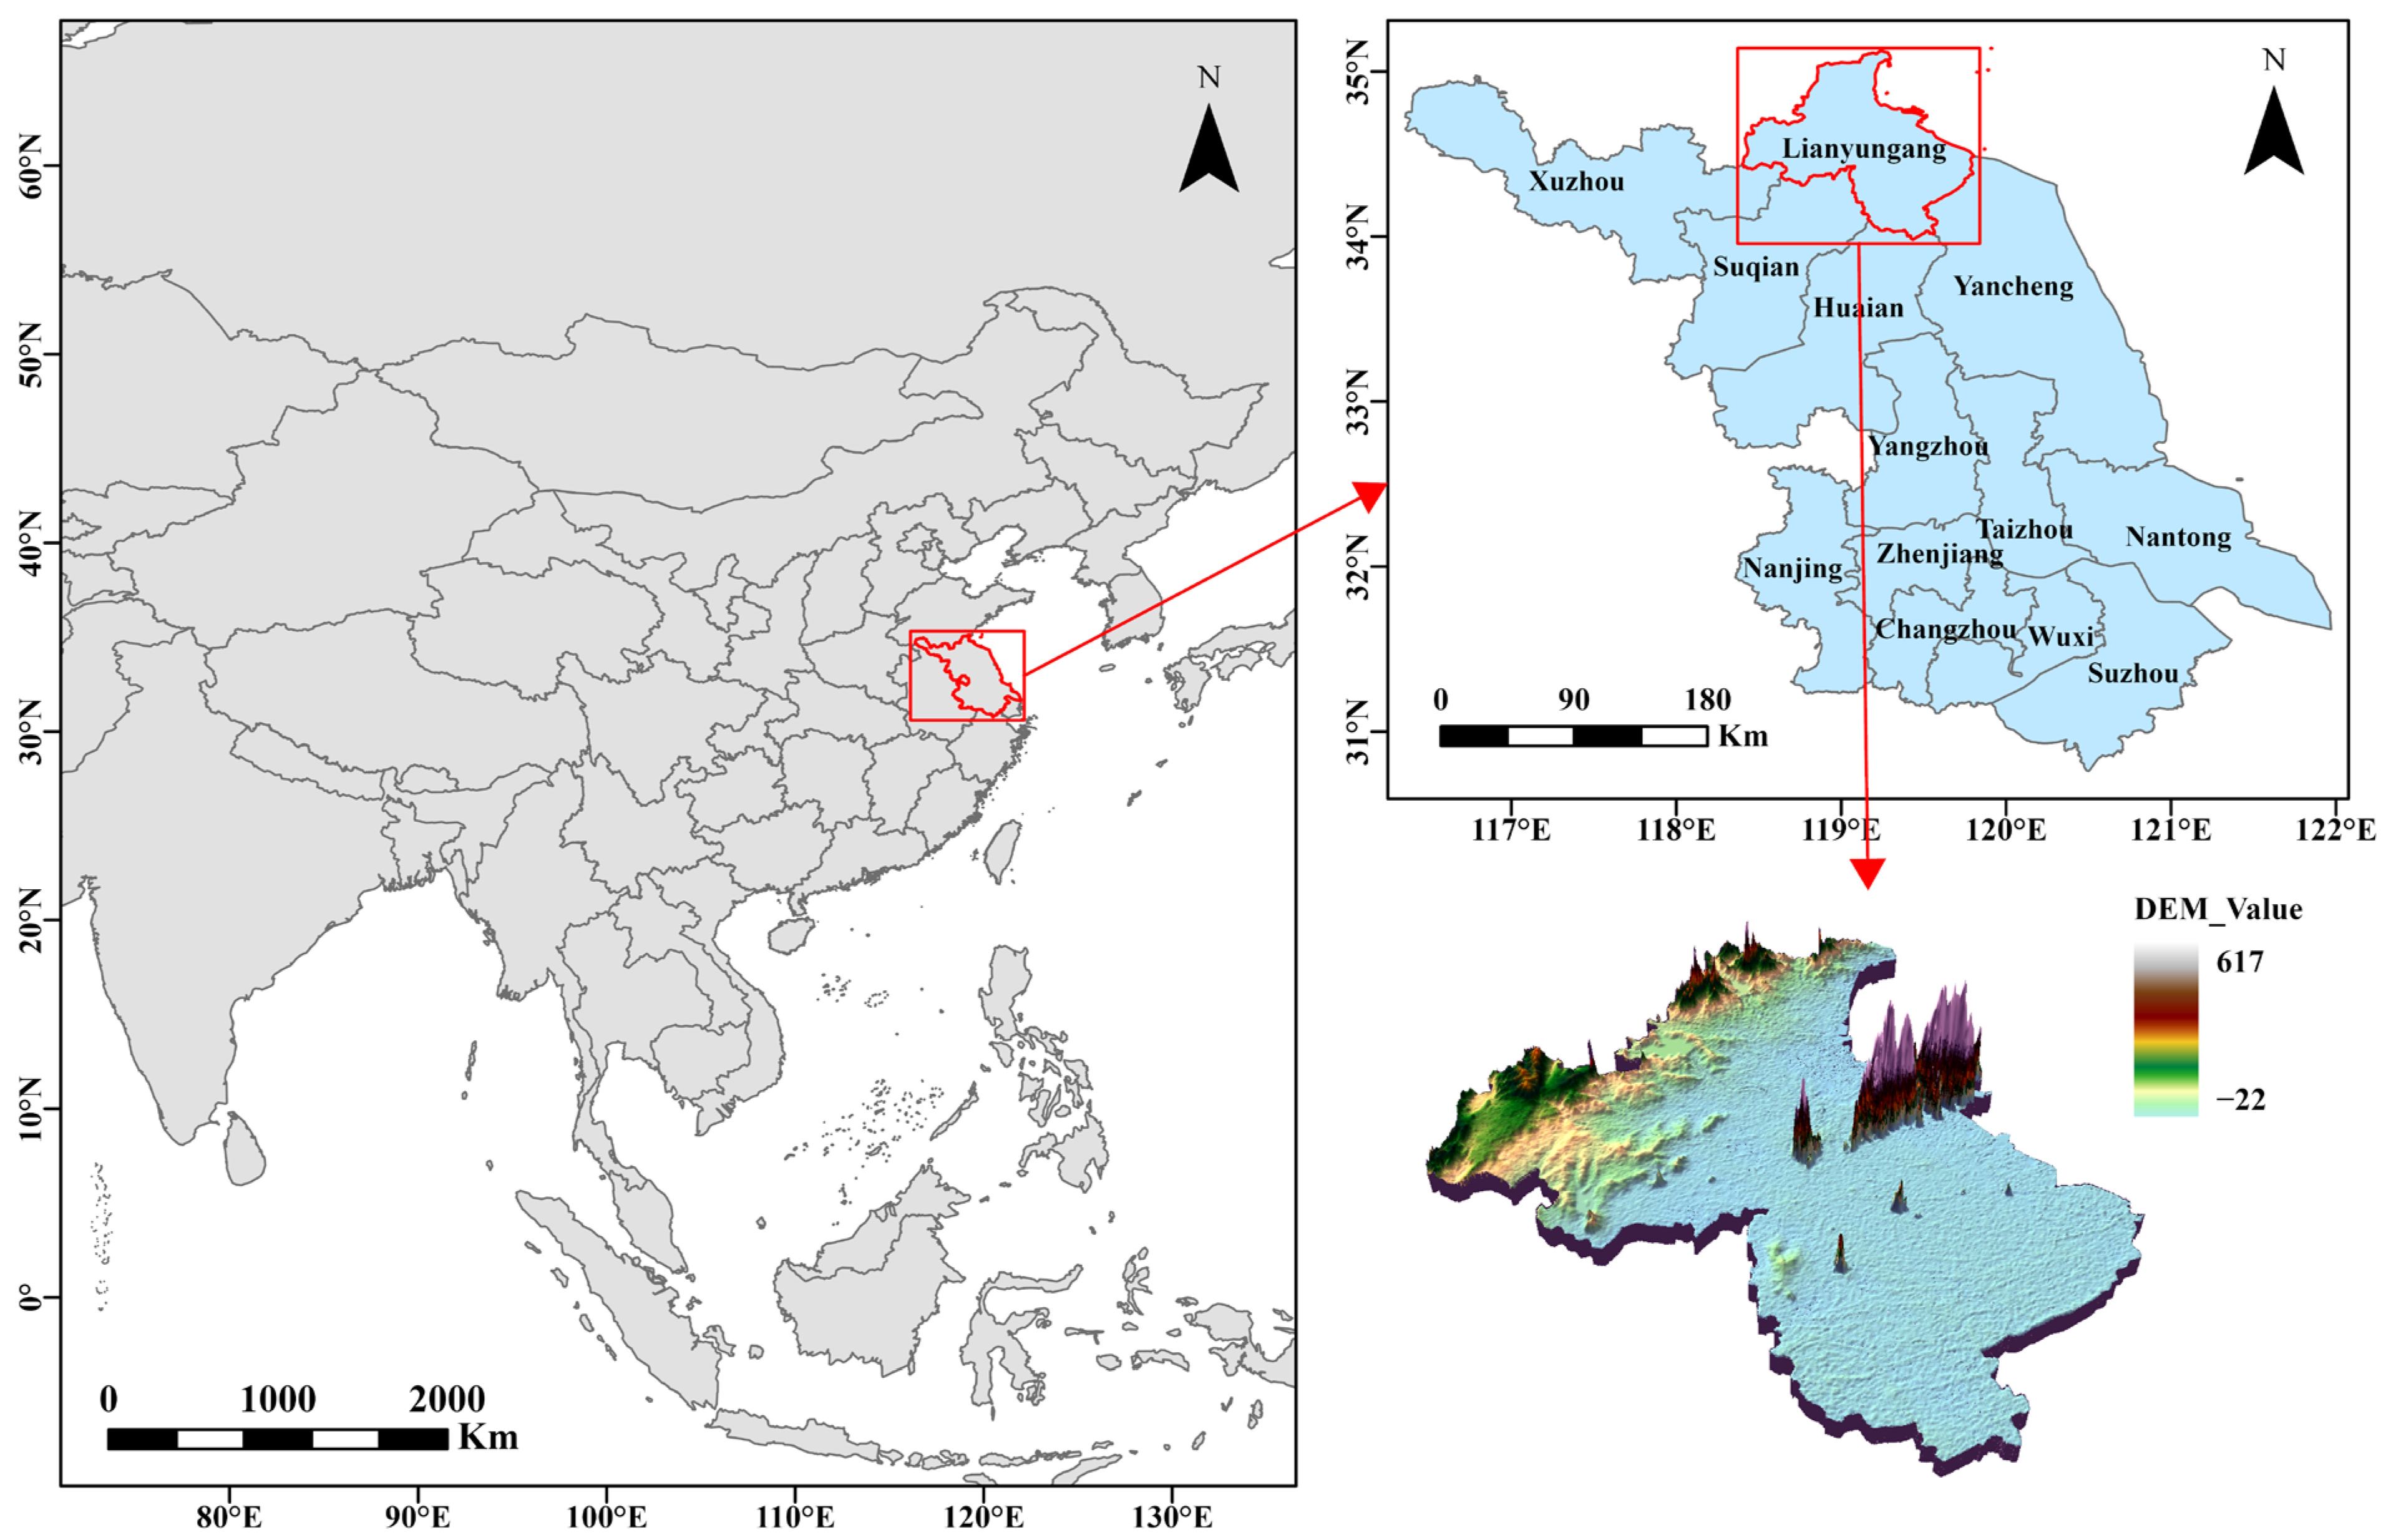
2.1. Data Acquisition and Processing

2.1.1. PM2.5 Data

This study utilized a high-quality monthly average dataset of PM2.5 concentrations obtained from the ChinaHighPM2.5 dataset [27]. This dataset, which provides high-resolution (1 km) PM2.5 data spanning from 2000 to 2023, was reconstructed using the Space-Time Extra-Trees (STET) model and Moderate Resolution Imaging Spectroradiometer (MODIS) data, as described in Wei et al. [10]. This dataset provides a comprehensive and seamless spatial representation of PM2.5 concentrations across China and enables an in-depth study of the spatiotemporal dynamics of air pollution. This comprehensive dataset enables a more holistic understanding of the long-term evolution patterns of PM2.5 pollution and can be used to shed light on the complex interplay between factors that influence air quality over time. Here, the administrative district shapefile of Lianyungang was utilized to clip the original dataset using MATLAB (2024a), thereby generating a monthly average PM2.5 dataset specific to Lianyungang for further analysis. To achieve a refined representation of the spatial distribution characteristics, the MATLAB function “shading interp” was applied to smooth the color transitions between grid cells, enhancing the visual continuity of the plot.

2.1.2. Meteorological Data

Meteorological data from the ERA5 reanalysis dataset were used for the analysis. The ERA5 dataset was created and is continuously updated by the European Center for Medium-Range Weather Forecasts (ECMWF) [28]. It is widely used in areas such as meteorology, hydrology, and land surface modeling [29,30]. Similarly, the administrative district shapefile of Lianyungang was utilized to clip the original dataset in MATLAB, resulting in a monthly average dataset specific to Lianyungang with a spatial resolution of 0.25°. Subsequently, we performed regional averaging to obtain the climate average values, which were used in the calculation of the average monthly regional climate values. These results were used in the subsequent correlation analysis with PM2.5.
In selecting the meteorological parameters for this study, we focused on their significance in understanding air pollution dynamics and their interactions with weather conditions. We incorporated various surface and boundary layer variables obtained from the ERA5 dataset, which are crucial for grasping the factors influencing air quality.
Data on the Boundary Layer Height (Blh; unit: m), a critical parameter for understanding the vertical distribution of pollutants in the atmosphere, were collected. Generally, a higher Blh indicates a greater capacity for dilution, which helps to lower pollution levels at the surface [31]. Surface Downwelling Shortwave Flux (Ssrd; unit: J/m2) plays a role in determining ground temperatures and is linked to photochemical reactions that affect the formation of ozone and PM2.5 [32]. Total Precipitation (Tp; unit: m) is also important since it helps wash away pollutants, directly impacting PM2.5 concentrations [33].
Surface Air Pressure (SP; unit: Pa) is another critical factor, as changes in pressure relate closely to the movement of weather systems that can influence both vertical and horizontal pollutant transport [34]. In addition, humidity metrics, such as Relative Humidity (RH; unit: %), Absolute Humidity (AH; unit: %), and Specific Humidity (q; unit: g/kg), are also vital because they significantly affect the growth of hygroscopic aerosols and the likelihood of haze formation [35]. RH, AH, and q can be derived using 2-Meter Temperature (T2 m, unit: K), 2-Meter Dewpoint Temperature (D2 m, unit: K), and SP, as detailed in the book Atmospheric Physics [36].
Wind Speed at 10 Meters (W10; unit: m/s) and Wind Direction (WD; unit: °), derived from the 10-Meter U Wind Component (U10; unit: m/s) and the 10-Meter V Wind Component (V10; unit: m/s) from the ERA5 data, were utilized to analyze the mechanisms through which air pollutants spread and disperse across larger areas [37].

2.1.3. Statistical Data

The statistical data were primarily from the comprehensive statistical figures of the “Lianyungang Statistical Yearbook” for 2001–2023 [38], which was compiled and published by the Lianyungang Municipal Bureau of Statistics. The yearbooks contain a wealth of data on various aspects such as macroeconomic indicators, population statistics, industrial development, and tax financing and provide a rich data base with data for GDP, industrial output value, built-up area, etc.

2.2. Data Analysis Methods
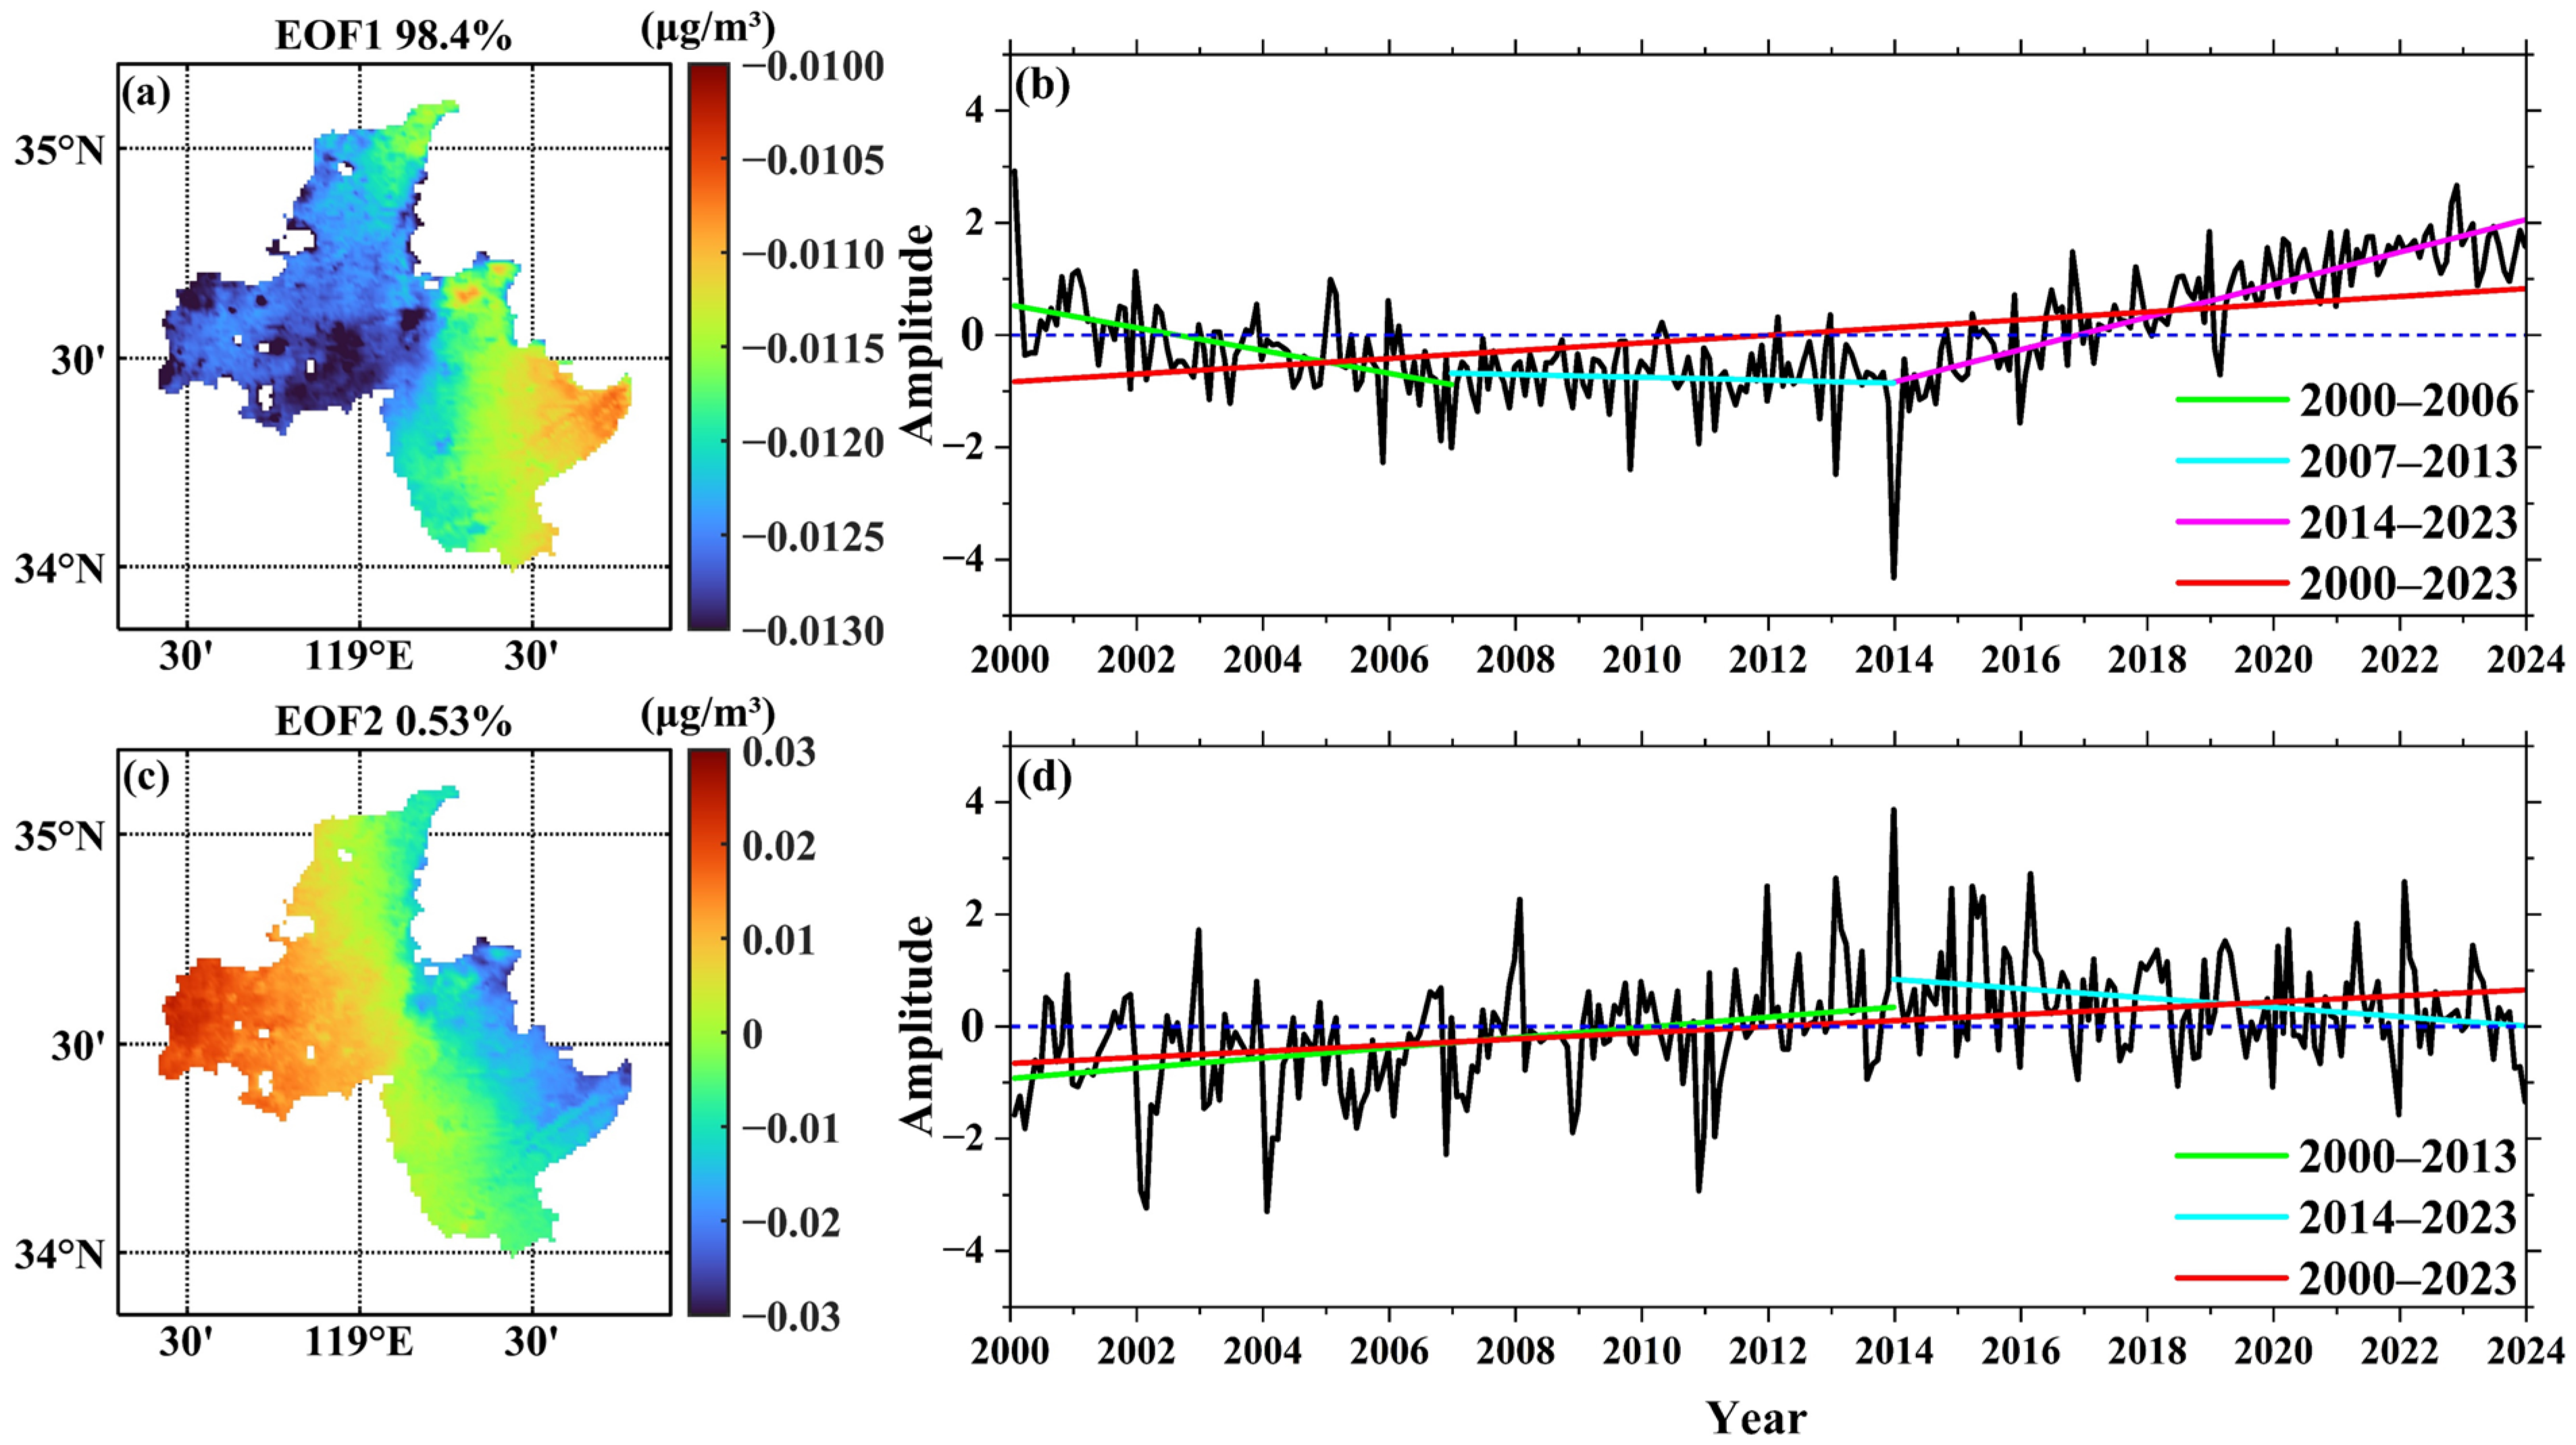
2.2.1. EOF Analysis

EOF analysis is a robust statistical technique for identifying the principal patterns of spatial and temporal variability within a dataset [39,40,41]. This method decomposes the data into a series of orthogonal spatial functions that are intrinsically derived from the dataset itself, rather than being predefined [40]. These functions are sequentially ranked according to the variance they explain, forming the most efficient framework for variance decomposition [40]. Typically, a small subset of EOF patterns (e.g., the first three) can account for a significant portion of the total observed variance, highlighting the presence of a limited number of dominant long-term patterns within the data [40]. EOF analysis offers the advantage of providing a concise representation of the spatial and temporal variability within data series, articulated through orthogonal functions and their corresponding time series coefficients [39,41]. With a long-standing history of application across various disciplines, including meteorology, oceanography, and geophysics, EOF analysis adeptly encapsulates complex datasets through a reduced set of orthogonal functions and their associated time series [42,43,44].
Here, the monthly average PM2.5 concentration anomalies dataset from Lianyungang City was utilized as the input data. This process extracted the primary spatial patterns associated with PM2.5 concentrations and their temporal variations, aiming to explore the spatiotemporal characteristics of PM2.5 and highlight the long-term trends and seasonal variations.

2.2.2. Statistical Methods

Here, OriginPro (2024b) software was utilized for the data analysis to ensure the accuracy and scientific rigor of the results. PCA was employed to reduce the dimensionality of the data and uncover the primary variation patterns in the high-dimensional datasets. PCA achieves this by computing a correlation matrix among the variables and extracting a few principal components that explain most of the variance in the data [45]. This method facilitates the visualization of data clustering and distribution characteristics, thereby providing a deeper understanding of the dataset [45].
Additionally, Pearson correlation coefficients (r) and p-values were used to assess the linear relationships between variables. The r value quantifies the degree of linear correlation between two continuous variables, while p-values indicate the statistical significance of these correlations [46]. To further analyze the relationships between variables, linear fitting was applied using the least squares method to estimate the parameters of the regression model (slope and intercept) and to compute the coefficient of determination (R2) for evaluating the goodness of fit.

2.2.3. Trend and Seasonal Change Analyses

The BEAST algorithm, introduced by Zhao et al. [46], is a robust time-series decomposition tool designed to detect abrupt changes, seasonality, and trends in environmental data [47]. Unlike conventional algorithms that rely on a single “best” model, BEAST employs a Bayesian ensemble modeling approach, integrating multiple competing models through Bayesian Model Averaging (BMA). This method allows BEAST to capture complex nonlinear dynamics and provide credible uncertainty measures, such as the probability of changepoint occurrences over time. The algorithm’s flexibility makes it suitable for analyzing various types of time-series data, including satellite imagery, to decipher ecosystem dynamics and detect low-magnitude disturbances. By incorporating all potential models and their probabilities, BEAST effectively addresses model uncertainty and reduces overfitting, offering a new analytical option for robust changepoint detection and nonlinear trend analysis in environmental time series.
The values representing the trend and seasonal components of PM2.5 concentrations were calculated using a Bayesian time-series decomposition approach. This method fitted a model to the observed PM2.5 data, separating the time series into three distinct components: the long-term trend, seasonal fluctuations, and residual error. The seasonal component was derived from the periodic patterns present in the data, enabling a thorough analysis of the PM2.5 dynamics across different seasons [47].

3. Results

The results section presents the spatiotemporal distribution patterns of PM2.5 in Lianyungang, highlighting the seasonal trends and identifying long-term changes. The findings showed distinct seasonal variations, with elevated PM2.5 levels in the winter and reduced concentrations in the summer, and indicate three phases of PM2.5 concentration changes across the study period.

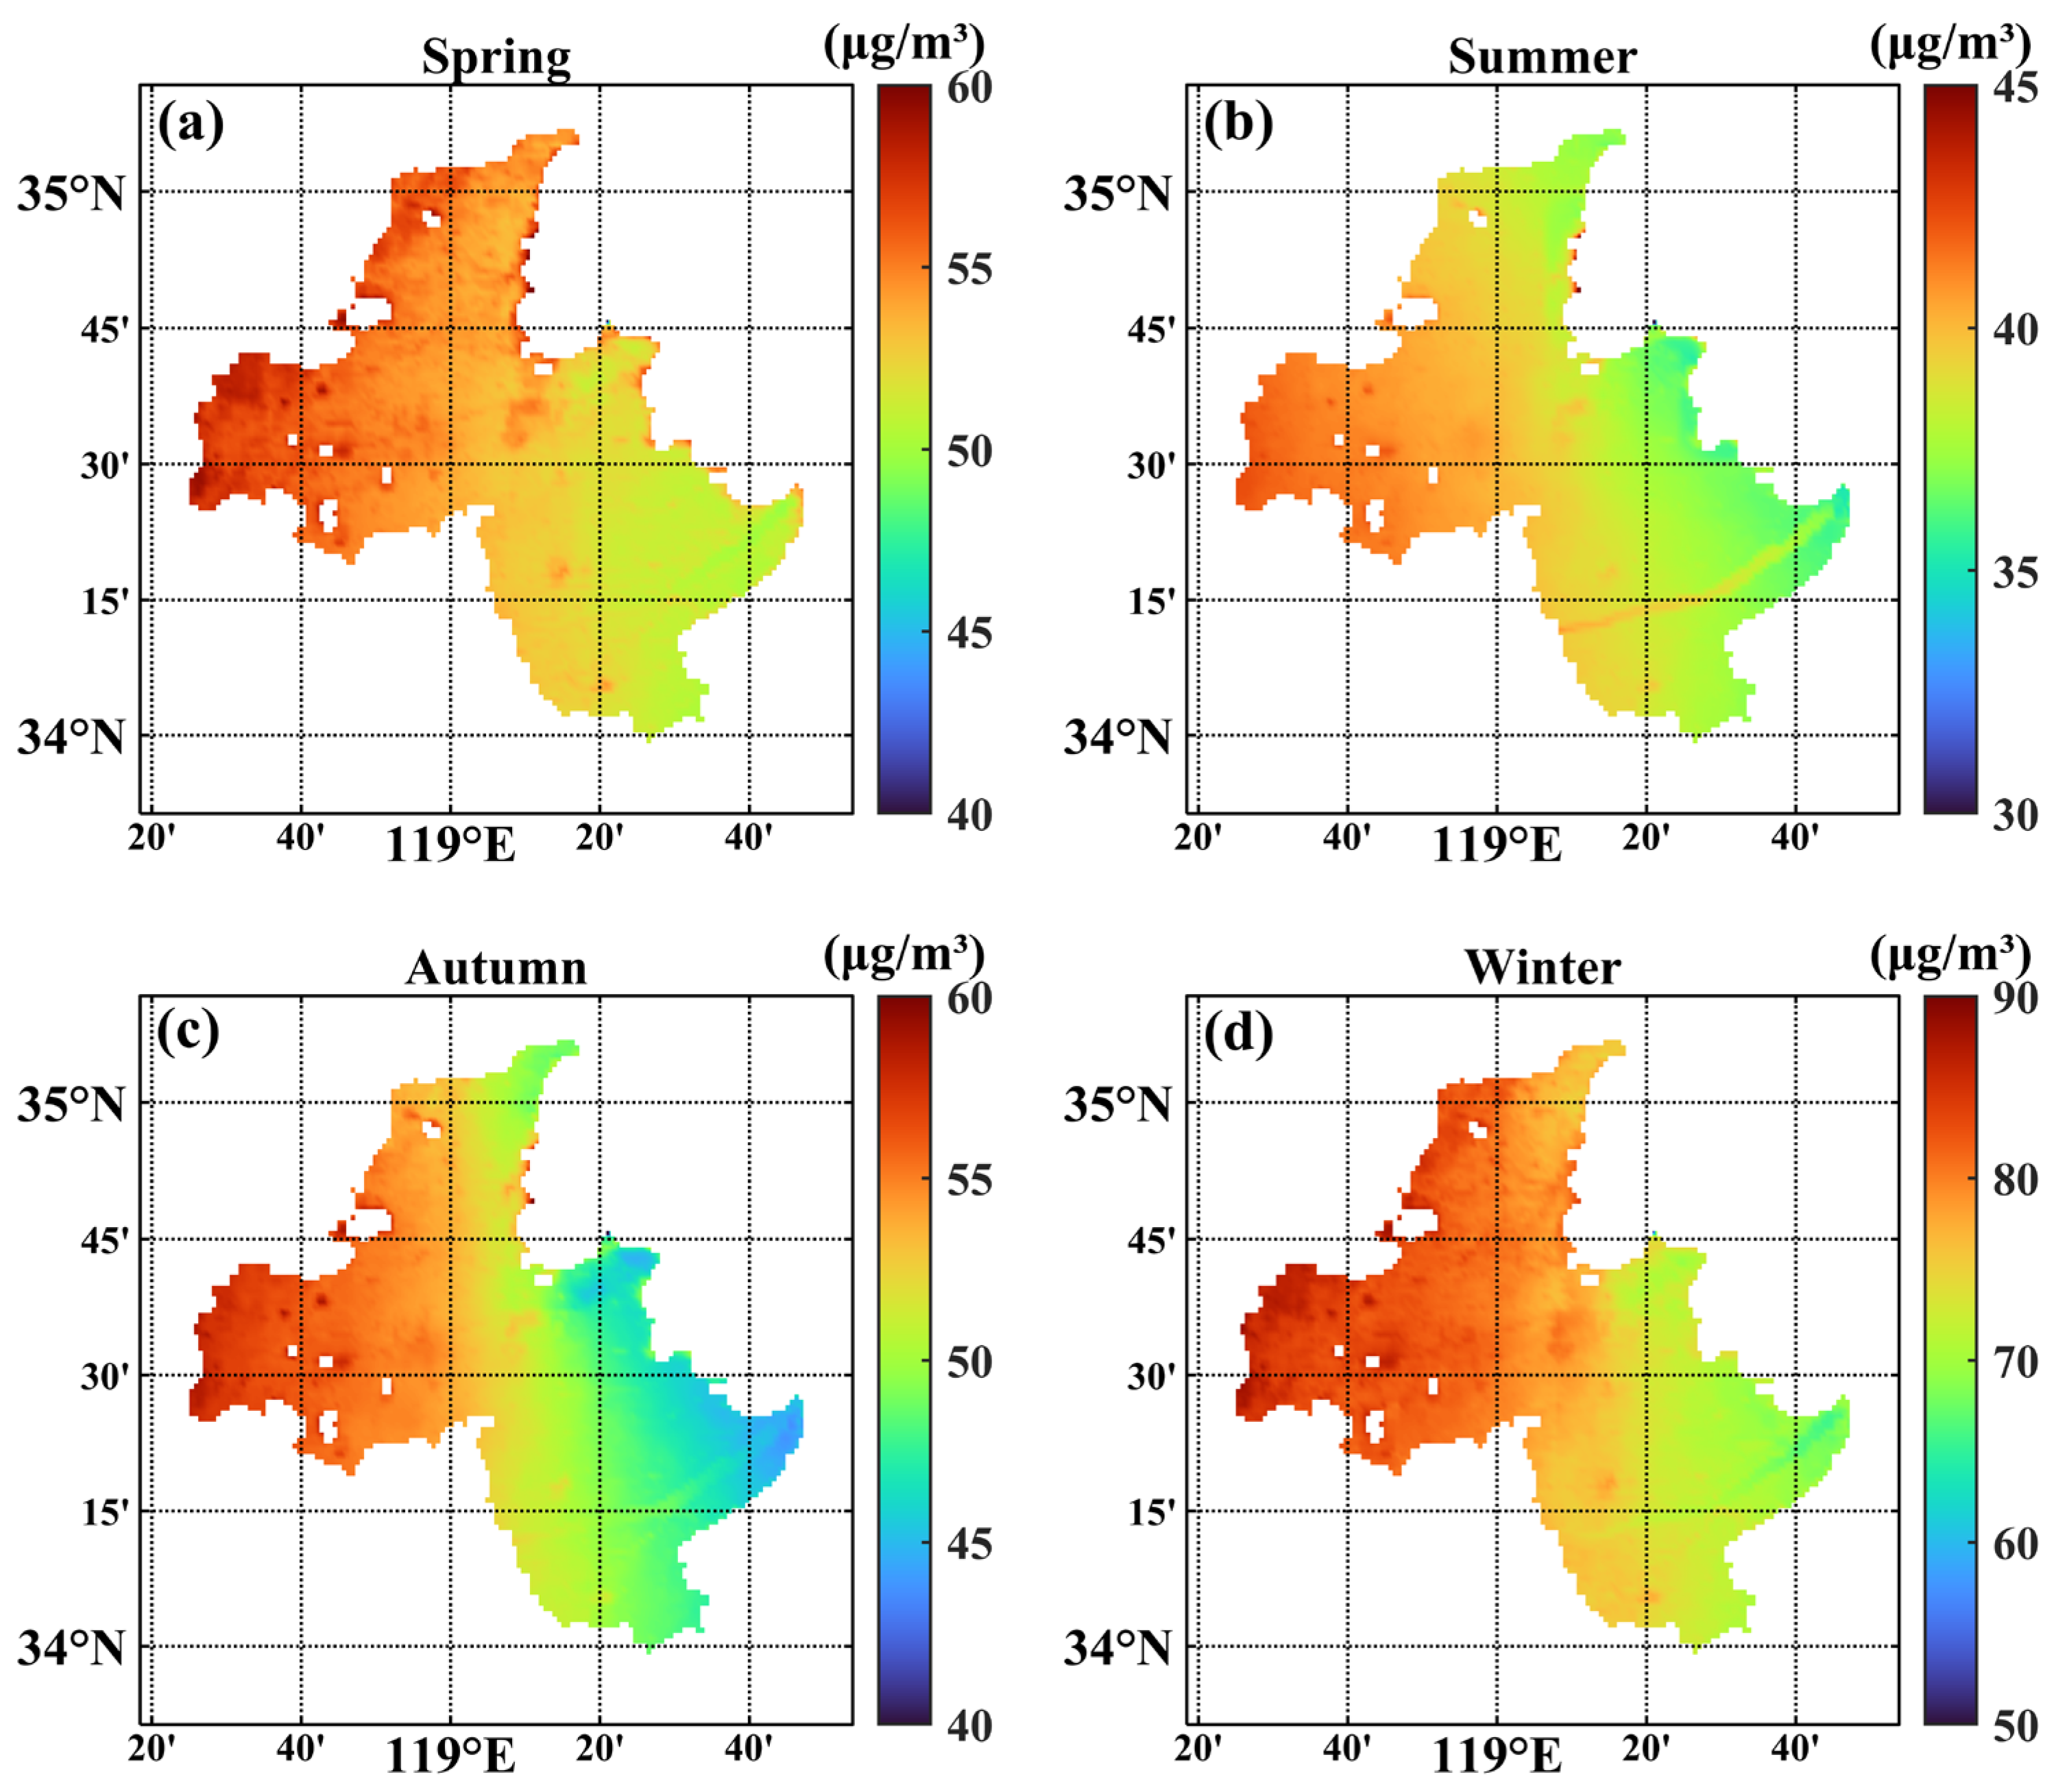
3.1. Spatiotemporal Distribution of Climatological PM2.5

Figure 2 presents the climatological monthly averages of the PM2.5 concentrations in Lianyungang from 2000 to 2023, revealing a distinct seasonal variation. The highest average PM2.5 concentrations were recorded in January (82.69 ± 16.03 µg/m3), followed closely by December (80.87 ± 18.02 µg/m3) and February (68.06 ± 13.95 µg/m3). In contrast, the lowest concentrations were observed in August (32.13 ± 9.35 µg/m3) and September (34.20 ± 8.28 µg/m3). The data exhibit a clear seasonal trend, as highlighted in the inset of Figure 2, showing a pronounced U-shaped pattern—higher concentrations at the beginning and end of the year, and lower levels in the middle months. Elevated PM2.5 levels were notably associated with the colder months, whereas the warmer months corresponded to significantly reduced concentrations. The transitional months of March, April, and May exhibited moderate PM2.5 values of 59.73 ± 9.82 µg/m3, 51.96 ± 9.81 µg/m3, and 49.29 ± 12.27 µg/m3, respectively. Notably, the PM2.5 concentrations peaked in January and December, exceeding 80 µg/m3, indicating a grade III air quality level and significant mild pollution during the winter. Conversely, the summer months, particularly June through August, displayed the lowest PM2.5 concentrations, with levels dropping to approximately 38 µg/m3.
Figure 3 illustrates the spatial distribution of the PM2.5 concentrations across Lianyungang during the four seasons: spring, summer, autumn, and winter. In the spring (Figure 3a), the PM2.5 levels were highest in the northern and western regions, reaching approximately 58–60 μg/m3, while the southeastern areas exhibited lower concentrations, around 42–44 μg/m3, indicating a decreasing gradient from northwest to southeast. This pattern may be influenced by the topographical barrier in the northwest, which can restrict pollutant dispersion, particularly under stable atmospheric conditions. During the summer (Figure 3b), the PM2.5 concentrations significantly decreased, with values ranging from 30 to 45 μg/m3. The southeastern regions showed the lowest concentrations (30–35 μg/m3), while the northwest experienced slightly higher levels, up to 45 μg/m3, suggesting a relatively cleaner air quality compared to other seasons. In the autumn (Figure 3c), the distribution pattern closely resembles that of spring, with higher concentrations (56–58 μg/m3) in the northwest and lower values (44–48 μg/m3) in the southeast, maintaining the northwest-to-southeast gradient. Winter (Figure 3d) presented the highest PM2.5 concentrations, particularly in the northwest, where the levels peaked at 85–90 μg/m3, marking the most severe pollution across the year. During this season, cold temperatures and limited vertical mixing further contributed to pollutant accumulation in these regions. Even in the southeast, the concentrations remained elevated (60–70 μg/m3) compared to other seasons. Overall, the spatial distribution showed a consistent pattern of higher PM2.5 levels in the northwest across all seasons, with winter being the most polluted period and summer the least.

3.2. Long-Term Spatiotemporal Distribution Characteristics of PM2.5

Figure 4 presents the results of the EOF analysis of the monthly average PM2.5 concentration anomalies in the Lianyungang region from 2000 to 2023. Its structural function for the first mode accounted for 98.4% of the total variance and was negative everywhere (Figure 4a), indicating a general tendency for the city’s PM2.5 concentration to be either increasing or decreasing. The second EOF mode contributed to 0.53% of the variance, as depicted Figure 4c, with the PM2.5 concentration anomalies exhibiting opposing spatial distribution patterns between the eastern and western regions. Hereafter, we only show the result of the first mode because of the higher total variance in the PM2.5 concentration anomalies in the Lianyungang region.
As shown in Figure 4a, the most significant variations in PM2.5 occurred in the western part of the city, where the PM2.5 anomalies surpassed 0.012. In contrast, the eastern region showed PM2.5 anomalies ranging between 0.011 and 0.012. Overall, there was a trend of increasing PM2.5 concentration variations from east to west. As illustrated in Figure 4b, the temporal coefficients exhibited a fluctuating decline during the period of 2000 to 2013. Specifically, the decline was notably rapid from 2000 to 2006 (green line), followed by a slower decline between 2007 and 2013 (blue line). Coupled with the entirely negative spatial pattern in Figure 4a, this indicates a gradual increasing trend for the city’s PM2.5 concentration in this period. In contrast, a fluctuating increase in PM2.5 concentration anomalies was found in the subsequent decade of 2014 to 2023 (purple line). Similarly, a gradual decreasing trend was observed for the city’s PM2.5 concentration. On the whole, the temporal coefficients for the first mode reveal an overall oscillating upward trend in PM2.5 concentration anomalies (red line) during the study period, reflecting a long-term gradual decrease in the city’s PM2.5 concentration.

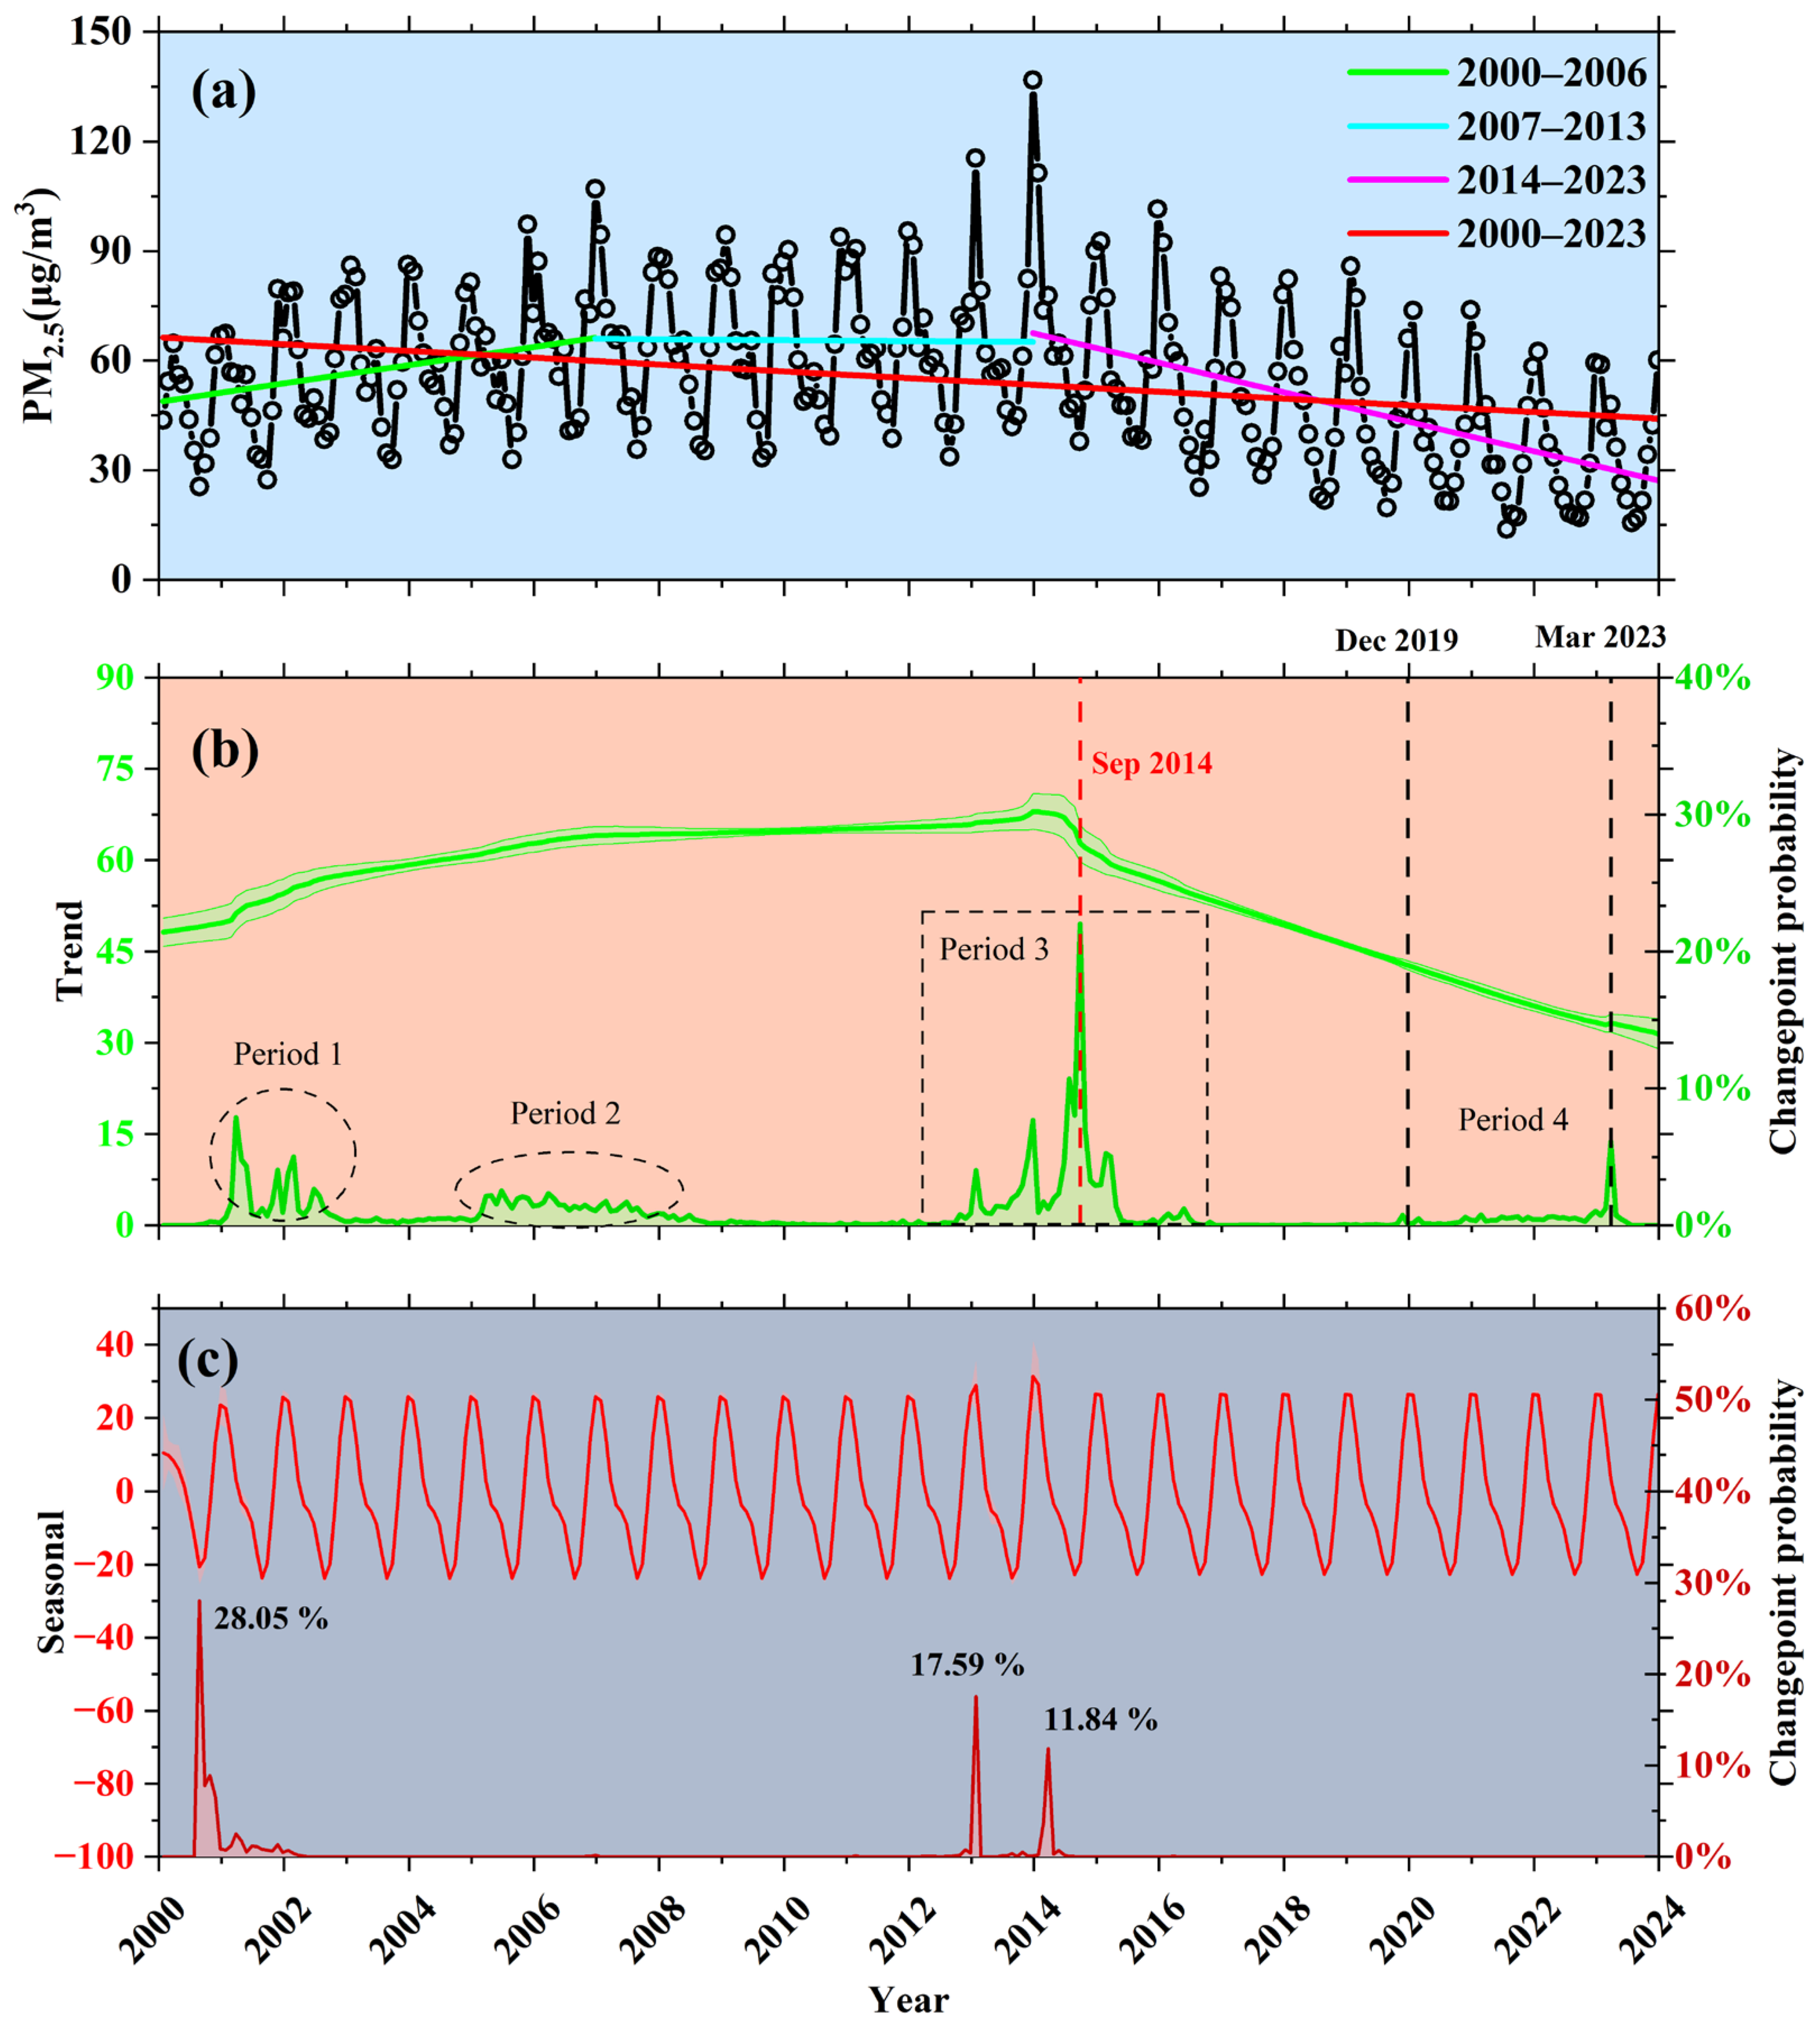
3.3. Long-Term Changes in PM2.5 Concentration

Figure 5a illustrates the monthly average PM2.5 concentration in Lianyungang from January 2000 to December 2023. The black line represents the observed monthly PM2.5 values, which exhibited significant seasonal fluctuations throughout the entire period. A noticeable peak in the PM2.5 concentrations typically occurred during the winter months, while lower concentrations were observed during the summer, indicating a clear seasonal pattern. This is consistent with Figure 2 and Figure 3 in Section 3.1. At the same time, Figure 5a reveals three distinct phases in the PM2.5 levels: a growth phase from 2000 to 2006 (green line), a stable phase from 2007 to 2013 (blue line), and a reduction phase from 2014 to 2023 (purple line). Over the 24-year period, the red dashed trend line indicates that there was a general decline in the PM2.5 concentrations.
The results of the trend analysis and detection of abrupt changes in the PM2.5 concentrations using BEAST is shown in Figure 5b. The green line represents the estimated trend, with the shaded area indicating the 95% confidence interval. A significant changepoint was detected around September 2014, corresponding to a marked decrease in PM2.5 levels with the highest probability (22% in Figure 5b). There was a one-year lag between the initiation of nationwide pollution control measures and the observed improvement in PM2.5 levels in Lianyungang. Specifically, China issued the “Action Plan for the Prevention and Control of Air Pollution” (commonly known as the “Ten Statements of Atmosphere”) in September 2013, while a significant reduction in the PM2.5 concentrations was not observed until September 2014 [48]. Interestingly, the timing of the observed reduction in PM2.5 levels coincided with the implementation of local regulations in Lianyungang, specifically the directive issued by the municipal government office titled “Notice on Further Strengthening Air Pollution Prevention and Control Across the City” [49]. This suggests that local initiatives may have played a crucial role in the observed improvement in air quality, aligning closely with the timeline of significant changes detected in September 2014. The accompanying dark green curve on the right y-axis shows the probability of detecting changepoints over time. Moreover, the abrupt changepoints corresponded to four distinct periods of fluctuation: 2000–2002 (Period 1 in Figure 5b), 2005–2008 (Period 2 in Figure 5b), 2013–2016 (Period 3 in Figure 5b), and 2019–2023 (Period 4 in Figure 5b). These periods were closely linked to several significant events, including dust storms and haze in the early 21st century, the rapid economic development of Lianyungang, and the impact of the COVID-19 pandemic [50,51,52,53,54,55,56].
The seasonal analysis results and abrupt changes in the PM2.5 concentrations identified using BEAST is shown in Figure 5c. The red curve indicates the seasonal component of the PM2.5 concentration, characterized by a clear periodic pattern that aligns with known seasonal variations in PM2.5 levels (Figure 2 and Figure 3). The changepoint probability (dark red line on the right y-axis) indicates the significant seasonal shifts, particularly around 2014, aligning with the trend analysis results (Figure 5b). The high probability (11.84% in Figure 5b) of a changepoint in 2014 corroborates the observed trend change and suggests an association in both the trend and seasonal behavior of PM2.5 levels during this period. Moreover, two abrupt significant changepoints were identified in 2000 and 2013, with high probabilities of 28.05% and 17.59%, respectively. These fluctuations in the changepoints were likely influenced by dust storms and haze, and the rapid economic development, which were prevalent during those periods [50,51,52,53,54,55,56].

4. Discussion

The PM2.5 pollution in Lianyungang showed distinct seasonal fluctuations and regional characteristics, with concentrations significantly higher in the winter compared to the summer (Figure 2 and Figure 3), and higher levels in the northwest compared to the eastern coastal areas. These variations were influenced by a combination of topographic features, meteorological conditions, and human emission activities. The analysis explored the impact of meteorological factors, urbanization, and industrial development on PM2.5 levels, assessing the effectiveness of pollution control measures and suggesting future improvement strategies.

4.1. Comprehensive Analysis of Seasonal Variations in PM2.5 Levels

4.1.1. Topographic Constraints on PM2.5 Dispersion

Lianyungang is located at the junction of mountains and the sea, with mountainous and elevated terrain in the northwest and plains and coastal areas in the southeast. This topographical configuration has a significant impact on the pathways and speed of dispersion of atmospheric pollutants such as PM2.5. The mountains act as natural barriers, blocking or slowing the horizontal movement of pollutants. This effect is particularly pronounced in winter, when stable regional climatic conditions, such as lower temperatures and weak wind speeds, result in a stable atmospheric stratification. Under these conditions, the pollutants tend to accumulate due to the obstruction from the terrain, leading to elevated PM2.5 concentrations [16,20]. In contrast, the eastern coastal areas benefit from the relatively open terrain and proximity to the ocean, which provide natural ventilation and a supply of clean maritime air during the summer. This helps to dilute and remove pollutants from the atmosphere.

4.1.2. Climatic Drivers of Seasonal PM2.5 Variations

The lower PM2.5 concentrations in Lianyungang during the summer are primarily attributed to the combined effects of its climatic and geographical conditions. Situated in a warm temperate monsoon climate zone and in the transitional area between the warm temperate and northern subtropical zones, Lianyungang’s summer climate features high temperatures and abundant sunlight, which foster strong atmospheric turbulence. This enhances the atmosphere’s mixing ability, accelerating the dispersion of pollutants [25]. The prevailing southeast monsoon brings humid and clean air from the ocean, effectively diluting locally emitted pollutants while transporting them farther away through continuous air exchange. Due to Lianyungang’s proximity to the coast, sea breezes in summer play a significant role in improving the air quality.
In addition, frequent summer rainfall is a key factor in further reducing PM2.5 concentrations. Rainfall facilitates wet deposition, removing particulate matter from the atmosphere and reducing the overall pollutant load. The combination of seasonal precipitation and atmospheric turbulence effectively clears PM2.5, resulting in the lowest PM2.5 concentrations of the year during the summer [25,57]. Research by Song et al. [58] supports this view, emphasizing that the joint effect of heavy rainfall and the southeast monsoon is a major reason for the improved air quality during the summer.
In contrast, the PM2.5 concentrations rise significantly in winter, primarily due to unfavorable climatic conditions and regional geographical features. The prevailing northerly winds bring cold air and pollutants from the north into the Lianyungang area, while lower temperatures and reduced sunlight limit the atmosphere’s vertical mixing ability. The cold conditions make the near-surface air layer more stable, leading to temperature inversions that inhibit pollutant dispersion [24,57].
Moreover, the increased demand for heating in winter leads to a higher consumption of solid fuels such as coal, further exacerbating the PM2.5 emissions [25]. Lianyungang experiences a relatively long heating season, and coal-fired heating is one of the primary contributors to the elevated PM2.5 levels. Zhao et al. [25] pointed out that winter air quality deterioration is not only related to meteorological conditions but it is also significantly influenced by emissions from heat sources. A detailed discussion of these emission activities is provided in Section 4.1.3. The combined effects of low temperatures, weak wind speeds, and a lower boundary layer height prevent effective pollutant dispersion, causing the PM2.5 concentrations to rise considerably [58].

4.1.3. Anthropogenic Drivers of Seasonal PM2.5 Variations

In Lianyungang, the primary emissions contributing to PM2.5 levels stem from industrial activities, vehicular traffic, residential heating, and agricultural practices, all of which exhibit distinct seasonal patterns [59]. The industrial sector, a significant contributor to PM2.5, includes activities such as manufacturing, power generation, and industrial heating. During winter months, there is often an uptick in heating demand, which can lead to increased emissions of particulate matter and precursor gases such as sulfur dioxide (SO2) and nitrogen oxides (NOx) [25]. The reliance on coal and other fossil fuels for heating contributes notably to PM2.5 concentrations during this season, particularly from industries that may ramp up operations to meet demands [25]. The transportation sector is another key source of primary emissions, with vehicle exhaust producing a continuous release of pollutants. Cold weather can exacerbate emissions due to more frequent cold starts, resulting in higher outputs of unburned hydrocarbons and particulate matter during the winter months. Additionally, the increased use of private vehicles for commuting due to colder conditions elevates emissions, further contributing to elevated PM2.5 levels [19,25]. Residential activities also notably influence PM2.5 concentrations, especially in areas where fossil fuels are burned for heating and cooking. In winter, the consumption of coal and biomass increases significantly, leading to substantial emissions of particulate matter and sulfur dioxide [60]. This not only raises primary PM2.5 levels but also facilitates the formation of secondary aerosols as these emissions undergo chemical transformations in the atmosphere [61]. Agricultural activities also contribute to seasonal variations in emissions [59]. Crop harvesting and land preparation can lead to increased soil disturbance and dust emissions, while the use of pesticides and fertilizers can release ammonia and other volatile compounds that can form secondary PM2.5 [62].
Secondary PM2.5 formation is a complex process driven by atmospheric chemical reactions involving precursor gases, such as volatile organic compounds (VOCs) and nitrogen oxides (NOx). These processes are strongly influenced by meteorological conditions, including temperature, solar radiation, and RH [63,64,65]. During summer, higher temperatures and increased solar radiation enhance photochemical reactions, accelerating the conversion of VOCs and NOx into secondary organic aerosols (SOAs) and other PM2.5 components [63,65]. These reactions are particularly significant under high photochemical activity, leading to a notable contribution of secondary PM2.5 to the overall burden in the atmosphere. However, the contribution of secondary PM2.5 can also vary by season and environmental condition. In winter, heterogeneous aqueous reactions play a more dominant role in secondary PM2.5 formation. Elevated RH during haze events facilitates these reactions, where precursor gases such as NOx and SO2 are converted into inorganic aerosols like nitrates and sulfates. Studies indicate that when the RH reaches 60–80%, the conversion rates of NOx to nitrate and SO2 to sulfate increase significantly, contributing to the heightened PM2.5 concentrations that are often observed during winter haze episodes [64]. The relative importance of photochemical and aqueous reactions highlights the seasonal dependency of secondary PM2.5 formation. While summer is characterized by temperature-driven photochemical activity, winter sees RH-enhanced heterogeneous reactions dominating the formation of inorganic aerosols. This nuanced understanding underscores the need for tailored strategies targeting seasonal drivers of secondary PM2.5.

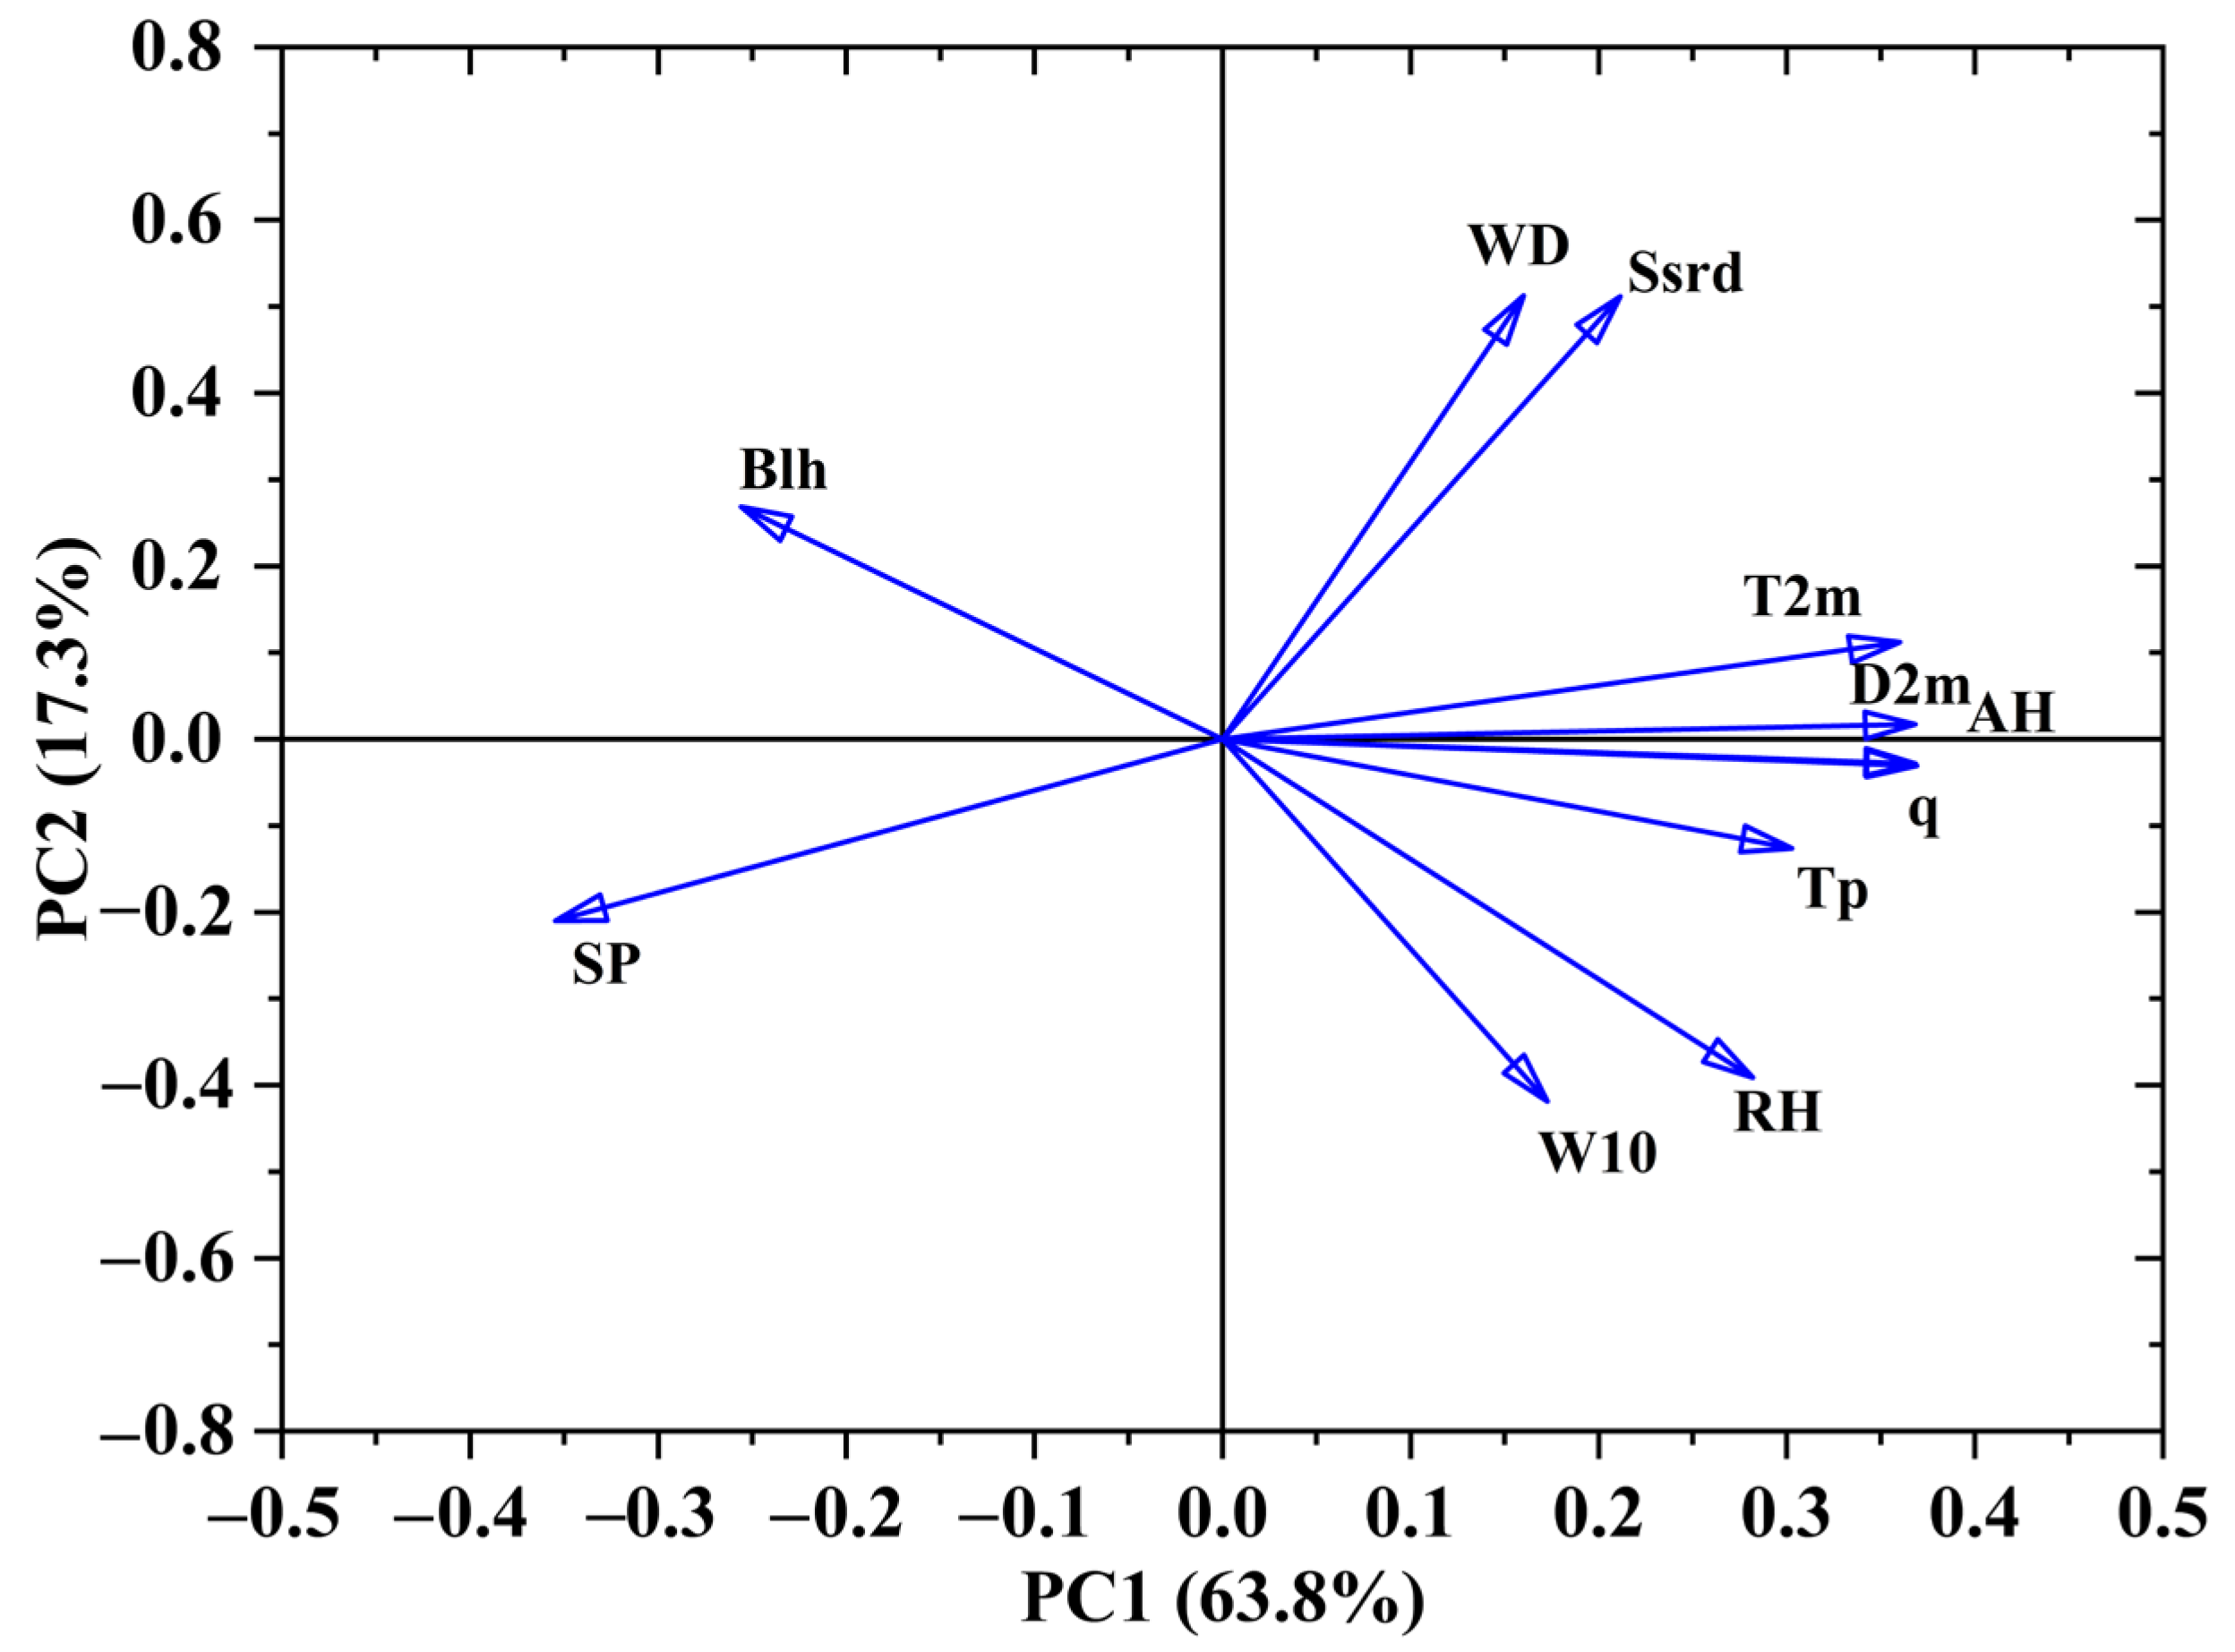
4.1.4. Deciphering Meteorological Drivers of PM2.5 Variations

Meteorological factors play a critical role in modulating PM2.5 concentrations, with their effects often manifesting through complex interactions. PCA and correlation analysis were employed to identify the dominant meteorological drivers and clarify their relative contributions to seasonal variations in PM2.5 concentrations in Lianyungang (Figure 6 and Figure 7, Table 1). The PCA results reveal that the first two principal components (PC1 and PC2) accounted for over 80% of the variance in PM2.5 concentrations, underscoring the primary meteorological mechanisms governing air quality in Lianyungang (Figure 6).
PC1, which accounted for 63.8% of the variance, highlights the significant influence of temperature, humidity, and precipitation in reducing PM2.5 concentrations. T2m had a strong negative correlation with PM2.5 in Table 1 and Figure 7e (r = −0.74, R2 = 0.90), indicating its critical role in enhancing vertical convection and atmospheric mixing. Warmer temperatures promote the dispersion of pollutants, a phenomenon that is particularly evident during summer when solar radiation strengthens these processes [25,58]. Similarly, humidity-related variables, including D2m, AH, and q, exhibited significant negative correlations with PM2.5 (Table 1; r ranging from −0.70 to −0.74). Higher humidity levels facilitate the hygroscopic growth of aerosols and subsequent wet deposition, effectively removing particulate matter from the atmosphere [58,64]. This mechanism is especially potent during periods of frequent rainfall, further emphasizing the critical role of humidity in reducing PM2.5 concentrations. Tp, with a moderate negative correlation (Table 1 and Figure 7c; r = −0.53, R2 = 0.60), provides a direct pathway for pollutant removal through wet scavenging. Heavy rain events are particularly effective in washing out airborne particles, contributing to the observed seasonal trough in PM2.5 concentrations during the summer [25,57,64].
PC2, which explained 17.3% of the variance, underscores the situational impacts of solar radiation and wind patterns. Ssrd showed a moderate negative correlation with PM2.5 (Table 1; r = −0.45), indicating that it has a role in enhancing atmospheric instability and promoting vertical mixing [57,63]. Additionally, solar radiation drives photochemical reactions that can degrade certain pollutants, further reducing PM2.5 levels during sunny conditions [65]. W10 and WD exhibited weak negative correlations (Table 1; r = −0.29 and r = −0.20, respectively). While higher wind speeds contribute to pollutant dispersion, their overall impact was less pronounced in Lianyungang due to the local topographical and emission characteristics [23]. However, wind direction can play a more nuanced role in pollutant transport, especially during winter, when northerly winds transport pollutants from upwind industrial regions, compounding local pollution levels [58].
The interplay of these meteorological factors aligns closely with seasonal variations in PM2.5 concentrations. During summer, the combined effects of the high temperatures, increased humidity, and frequent rainfall facilitate pollutant dispersion and removal, resulting in the lowest PM2.5 levels in the year [25,58,64]. In contrast, winter conditions are dominated by stable atmospheric patterns associated with an elevated SP (r = 0.66, Table 1) and lower Blh (r = 0.54, Table 1). These conditions limit vertical mixing and trap pollutants near the surface, exacerbating pollution levels [57]. The situation is further aggravated by increased emissions from heating activities, a primary contributor to the seasonal peaks in PM2.5 concentrations [25].
Although solar radiation and wind patterns, emphasized in PC2, play secondary roles in modulating PM2.5 levels, their effects are dependent on the situation. For example, during summer, increased solar radiation complements convective processes driven by higher temperatures, while favorable wind patterns can enhance pollutant dispersion [25,58]. Conversely, shifts in wind direction during winter may exacerbate pollution episodes by transporting pollutants from industrial areas [23,58].
The PCA findings underscore the multifaceted nature of meteorological influences on PM2.5 concentrations in Lianyungang. Temperature, humidity, and precipitation emerged as the most influential drivers of pollutant reduction, particularly during warm and humid periods. Meanwhile, stable atmospheric conditions associated with high-pressure systems and low boundary layer heights during winter hinder pollutant dispersion and promote accumulation [24,56,57]. Solar radiation and wind patterns contribute situationally to these dynamics, further shaping seasonal air quality trends [56,62]. These insights provide a comprehensive framework for understanding the meteorological factors influencing PM2.5 concentrations and highlight the need for targeted air quality management strategies. By focusing on reducing emissions during winter and leveraging natural dispersion mechanisms in summer, effective measures can be designed to achieve sustainable improvements in air quality.

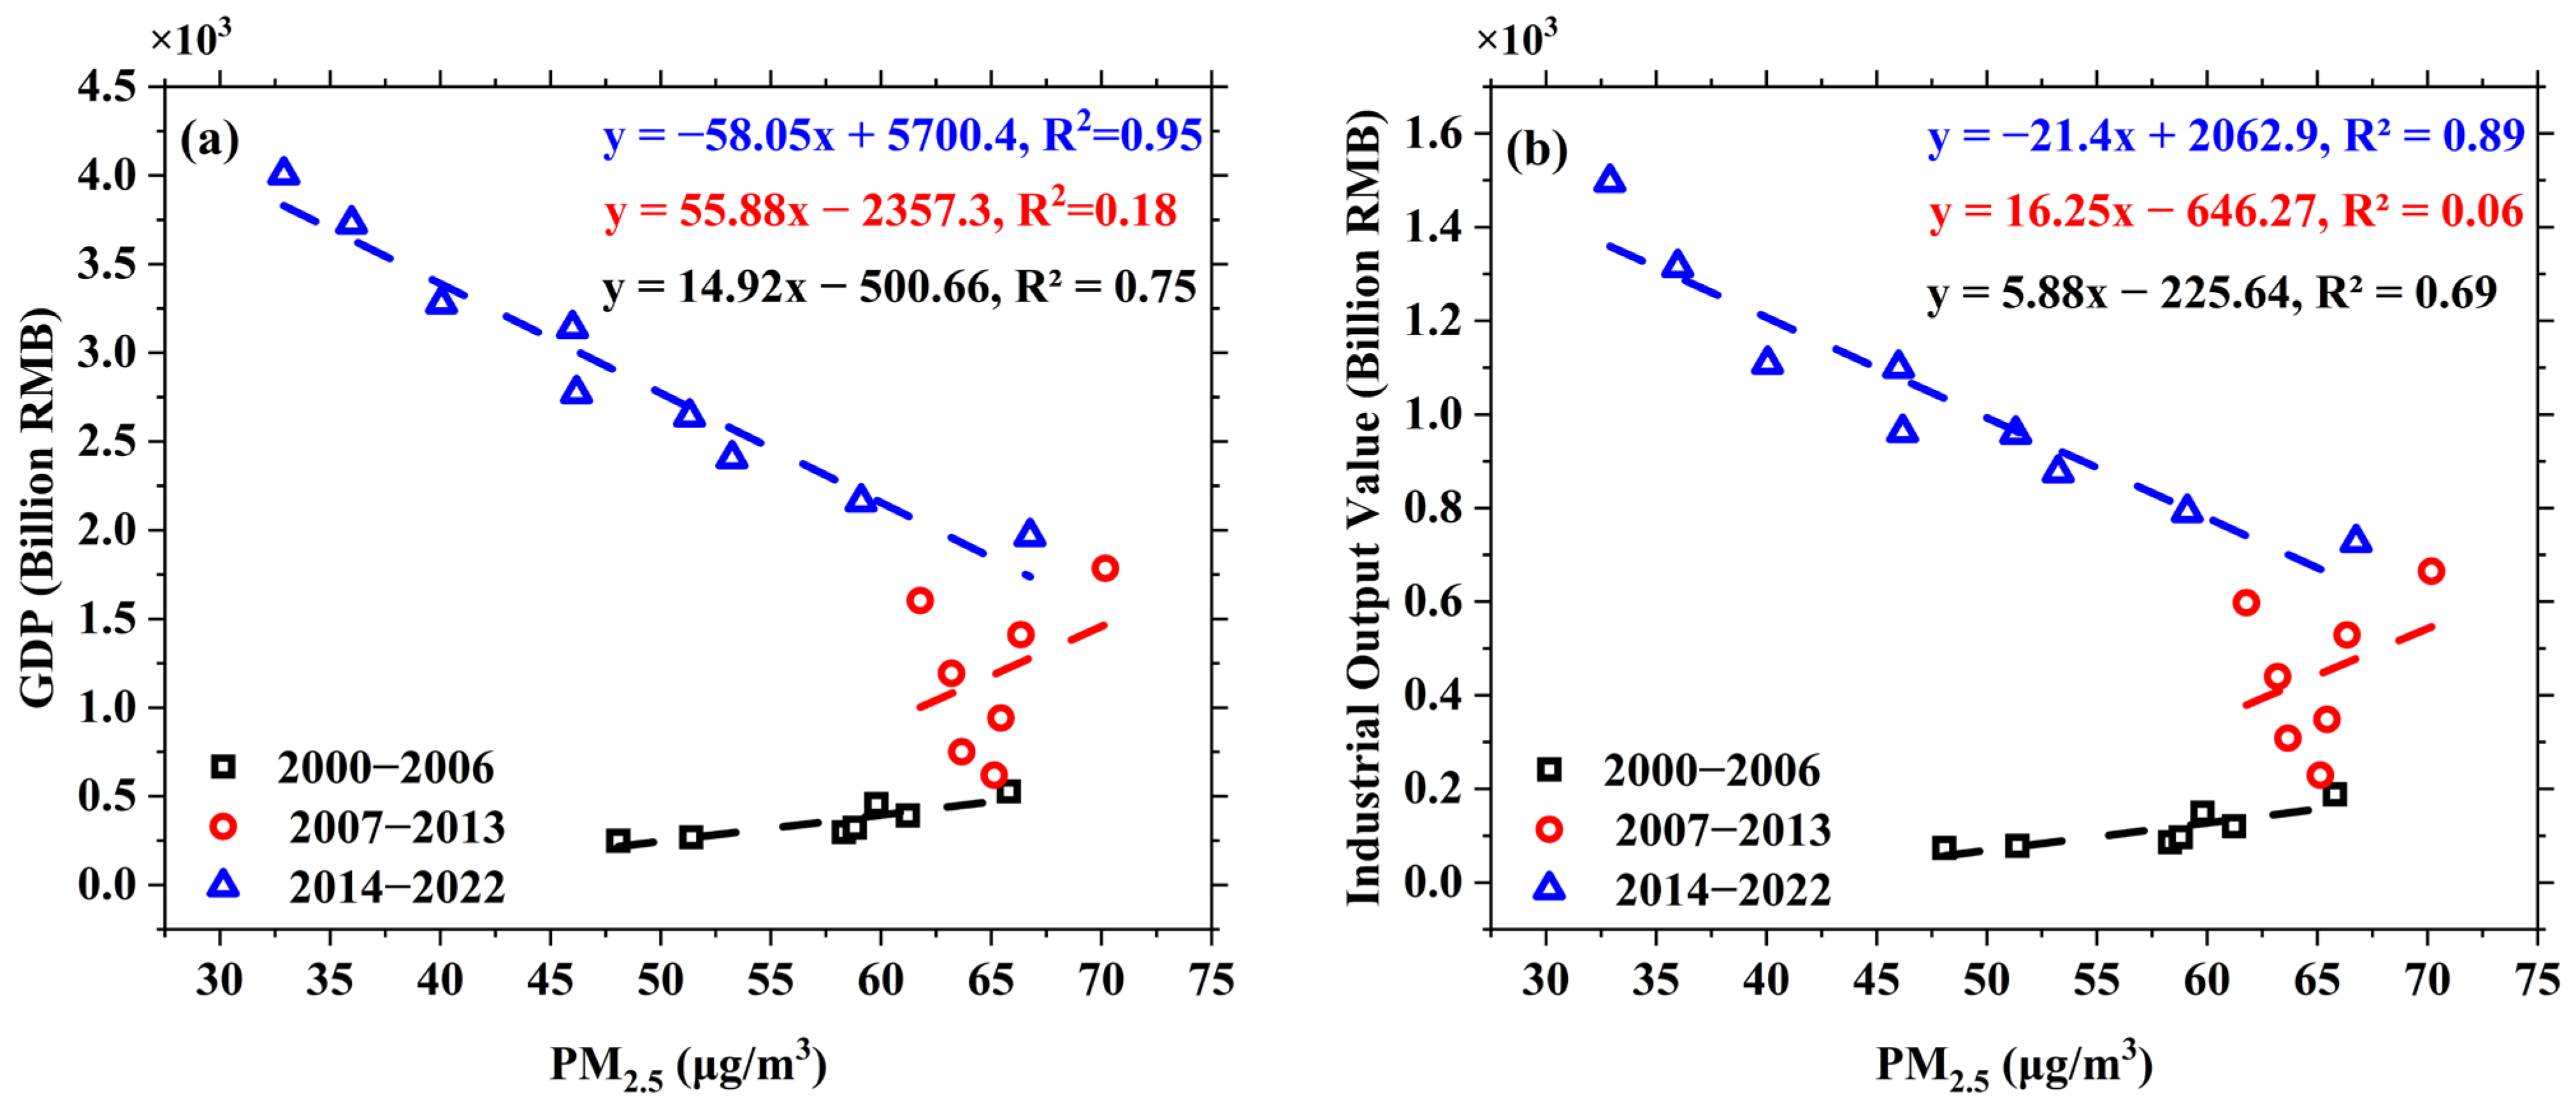
4.2. Policy Implementation and Socioeconomic Drivers

From 2000 to 2022 (due to the unavailability of data for 2023), the changes in PM2.5 concentration in Lianyungang showed an overall downward trend (Figure 5a), which can be divided into three distinct periods: 2000–2006 (a period of rapid economic growth and intensified pollution), 2007–2013 (a period of economic development and pollution decoupling), and 2014–2022 (a period of green transition and quality improvement) (Figure 5a). The relationship between the PM2.5 concentrations and economic indicators (GDP and industrial output value) across these periods, as shown in Figure 8, further corroborates these stages. Each phase not only reflects the evolution of Lianyungang’s economic growth model but also demonstrates the effectiveness of environmental policies implemented during these years.

4.2.1. Period of Rapid Economic Growth and Intensified Pollution

During 2000–2006, Lianyungang experienced rapid economic growth, with a strong positive correlation between GDP and the PM2.5 concentrations in Figure 8 and Table 2 (r = 0.87). Industrialization and urbanization accelerated during this period, with the industrial output (r = 0.83) and urban expansion (measured by build-up area, r = 0.91) significantly contributing to economic development. This growth was largely driven by energy-intensive and pollution-heavy industries, as well as extensive construction activities, resulting in a marked rise in PM2.5 emissions. Despite the Air Pollution Prevention and Control Law, originally passed in 1987 and revised in 1995, enforcement at the local level remained weak, and environmental awareness was still in its early stages [66,67]. Building on these earlier efforts, in 2001, the government implemented the ‘Tenth Five-Year Plan’ for key regions [68], focusing on air pollution prevention and control and setting pollution reduction goals for critical areas. However, these early policies proved largely ineffective at reducing emissions [69]. This highlights a critical trade-off: rapid economic development was achieved at the cost of environmental quality, reflecting a continued reliance on traditional, pollution-heavy growth strategies. Additionally, residential electricity consumption (r = 0.94) and population density increased significantly during this time, further exacerbating PM2.5 emissions. However, urban greening (greening rate of the urban built-up area), an indicator of environmental mitigation efforts, showed only a weak correlation with the PM2.5 levels (r = 0.47). This suggests that environmental measures were not yet a priority in urban planning during this phase of Lianyungang’s development. The minimal impact of greening highlights the lag in integrating sustainable practices into the urbanization process. As a result, the rising PM2.5 concentrations during this period exemplify the traditional development model, where economic growth was achieved at the expense of environmental health.

4.2.2. Period of Economic Development and Pollution Decoupling

From 2007 to 2013, the correlation between the PM2.5 concentrations and GDP, as well as industrial output value, weakened significantly, as shown in Figure 8 and Table 2; the r for GDP dropped to 0.34 and for the industrial output value, it dropped to 0.34, both of which are statistically insignificant (r > 0.45). This shift reflects the gradual introduction of environmental policies and adjustments to the industrial structure during this period. The implementation of the ‘11th and 12th Five-Year Plans’ introduced new policy tools that interacted with political incentives, strengthening the air pollution control measures [69,70,71]. As a result, while the economy continued to grow, the rate of pollutant emissions began to decouple from the industrial output value. Despite these improvements, Table 2 indicates that the urban population density (r = 0.44) and total social electricity consumption (r = 0.41) remained significant contributors to the PM2.5 concentration. This suggests that while industrial pollution was better controlled, rapid urbanization and increasing energy consumption continued to negatively impact air quality. Furthermore, urban greening and comprehensive pollution control measures were still not widely implemented, limiting the environmental benefits of these policies. As such, this period can be characterized as one of economic growth with partial progress in reducing industrial pollution, but with persistent environmental challenges driven by urban expansion and energy consumption. The effects of policy adjustments, while promising, were not fully realized, and environmental pressure remained high.

4.2.3. Period of Green Transition and Quality Improvement

From 2014 to 2022, Lianyungang entered a phase of green transition and significant environmental quality improvement. As depicted in Figure 8 and Table 2, the relationship between the PM2.5 concentrations and economic indicators such as GDP and industrial output value reversed dramatically, with r = −0.97 and r = −0.94, respectively, both of which are highly significant (p < 0.001). This indicates that Lianyungang’s economic growth during this period no longer relied on high-pollution industrial models but instead achieved a win–win scenario for both the economy and environment through green technologies, industrial upgrading, and sustainable development. The “Action Plan for the Prevention and Control of Air Pollution”, also known as the “Ten Statements of Atmosphere”, was issued by the Chinese government in 2013, which setting ambitious targets to reduce PM2.5 concentrations over five years [48]. Lianyungang followed suit with a local directive issued in September 2014, titled “Notice on Further Strengthening Air Pollution Prevention and Control Across the City” [49]. This local regulation likely contributed to the significant reductions in PM2.5 that were observed beginning in 2014 [72]. Simultaneously, the increase in urban green coverage (greening rate of the urban built-up area, r = −0.95) became a crucial factor in controlling PM2.5 concentrations, reflecting the government’s substantial investment in urban planning and environmental management. In 2023, the “National Action Plan for Sustained Air Quality Improvement” was introduced, aiming for a further 10% reduction in PM2.5 concentrations by 2025, which includes new measures for emission standards, fuel quality, and non-road mobile source controls [73]. Furthermore, the increase in the number of motor vehicle did not promote an increase in the PM2.5 concentrations (r = −0.77). Although industrial particulate matter emissions still showed some positive correlation with the PM2.5 concentrations (r = 0.89), their impact was significantly reduced, demonstrating the effective implementation of pollution control policies for heavily polluting industries.
The evolution of PM2.5 concentrations in Lianyungang from 2000 to 2022 clearly reflects Lianyungang’s shift from a high-pollution industrial development model to a green economy. During the early phase of the rapid economic growth, industrial expansion and urbanization drove up the PM2.5 concentrations. However, with the implementation of environmental policies and adjustments to the economic structure, PM2.5 levels significantly declined after 2014 (Figure 5b). This trend is closely linked to urban greening, motor vehicle emission controls, and industrial pollution governance. Moving forward, Lianyungang should continue to strengthen its green development model, further reduce pollutant emissions, and ensure long-term harmonious development between economic growth and environmental protection.

5. Conclusions

This study provides a detailed analysis of the spatiotemporal variations in PM2.5 concentrations in Lianyungang over a 24-year period, revealing clear seasonal patterns and significant long-term trends. The findings confirm that meteorological factors such as temperature, humidity, and precipitation play crucial roles in shaping PM2.5 levels, with the highest concentrations occurring in the winter and the lowest in the summer. Furthermore, the relationship between socioeconomic development and air pollution was evident, with rapid industrialization and urban expansion contributing to increased PM2.5 levels until 2014, after which, pollution control measures led to notable improvements in air quality.
The study successfully met its objective of identifying the key drivers behind PM2.5 pollution in Lianyungang and provides valuable insights for policymakers. However, it has certain limitations. The study relied heavily on remote sensing data, which may not capture smaller-scale pollution sources or localized factors affecting air quality. Additionally, while the analysis covered a substantial time frame, future research could benefit from more granular data to understand micro-level variations and the impact of emerging pollutants.
Future studies should explore the combined impact of PM2.5 with other pollutants and the role of more recent urban development patterns could provide a more holistic understanding of air quality dynamics. Moreover, investigating the effects of mitigation strategies in similar coastal industrial cities could offer comparative insights. These steps will not only deepen our understanding of air pollution but also challenge researchers and policymakers to develop more effective solutions for sustainable urban growth and protecting public health.

Author Contributions

Conceptualization, X.L. and W.Q.; methodology, H.H.; software, H.H.; validation, X.L., and H.H.; formal analysis, Y.S.; investigation, C.L.; data curation, D.W.; writing—original draft preparation, X.L.; writing—review and editing, W.Q.; visualization, X.L., L.L., and S.H.; supervision, W.Q.; funding acquisition, X.L., W.Q., and G.Z. All authors have read and agreed to the published version of the manuscript.

Funding

This work was supported by research grants from the Lianyungang Key Research and Development Program—Social Development (SF2333, SF2232); Lianyungang City “521 High-Level Talent Cultivation Project” Scientific Research Projects (LYG065212024023); National Natural Science Foundation of China (42306036, 62071207); China Postdoctoral Science Foundation (2023M731396); Lianyungang Postdoctoral Research Funding Program (LYG20220011); Project of Innovation for Undergraduate in Jiangsu Province (202311641020Z); Jiangsu Provincial Shuangchuang Doctor Program (JSSCBS20230350); Lianyungang Shuangchuang Doctor Program and Jiangsu Provincial Qinglan Project.

Data Availability Statement

The datasets produced and examined in this study can be obtained from the corresponding author upon reasonable request.

Acknowledgments

The authors gratefully acknowledge the creators of and contributors to the ChinaHighPM2.5 dataset, which offers a comprehensive spatial representation of PM2.5 concentrations across Lianyungang, forming a crucial foundation for our analysis. We also sincerely thank the Copernicus Climate Change Service for providing the ERA5 reanalysis dataset, which was integral to the meteorological analysis in this study. Finally, we extend our heartfelt gratitude to the three anonymous reviewers for their insightful comments and constructive suggestions, which have significantly enhanced the quality of this manuscript.

Conflicts of Interest

The authors declare no conflicts of interest.

References

  1. Fino, A. Air Quality Legislation. In Encyclopedia of Environmental Health; Elsevier: Amsterdam, The Netherlands, 2019; pp. 61–70. [Google Scholar] [CrossRef]
  2. Chaudhary, E.; George, F.; Saji, A.; Dey, S.; Ghosh, S.; Thomas, T.; Kurpad, A.V.; Sharma, S.; Singh, N.; Agarwal, S.; et al. Cumulative effect of PM2.5 components is larger than the effect of PM2.5 mass on child health in India. Nat. Commun. 2023, 14, 6955. [Google Scholar] [CrossRef] [PubMed]
  3. Lu, X.; Lin, C.; Li, W.; Chen, Y.; Huang, Y.; Fung, J.C.H.; Lau, A.K.H. Analysis of the adverse health effects of PM2.5 from 2001 to 2017 in China and the role of urbanization in aggravating the health burden. Sci. Total Environ. 2019, 652, 683–695. [Google Scholar] [CrossRef] [PubMed]
  4. McDuffie, E.E.; Martin, R.V.; Spadaro, J.V.; Burnett, R.; Smith, S.J.; O’Rourke, P.; Hammer, M.S.; van Donkelaar, A.; Bindle, L.; Shah, V.; et al. Source sector and fuel contributions to ambient PM2.5 and attributable mortality across multiple spatial scales. Nat. Commun. 2021, 12, 3594. [Google Scholar] [CrossRef]
  5. Han, L.; Zhou, W.; Li, W. Increasing impact of urban fine particles (PM2.5) on areas surrounding Chinese cities. Sci. Rep. 2015, 5, srep12467. [Google Scholar] [CrossRef]
  6. Fang, K.; Wang, T.; He, J.; Wang, T.; Xie, X.; Tang, Y.; Shen, Y.; Xu, A. The distribution and drivers of PM2.5 in a rapidly urbanizing region: The Belt and Road Initiative in focus. Sci. Total Environ. 2020, 716, 137010. [Google Scholar] [CrossRef]
  7. Li, X.; Shang, S.; Lee, Z.; Lin, G.; Zhang, Y.; Wu, J.; Kang, Z.; Liu, X.; Yin, C.; Gao, Y. Detection and Biomass Estimation of Phaeocystis globosa Blooms off Southern China From UAV-Based Hyperspectral Measurements. IEEE Trans. Geosci. Remote Sens. 2022, 60, 4200513. [Google Scholar] [CrossRef]
  8. Li, X.; Zhang, X.; Fu, D.; Liao, S. Strengthening effect of super typhoon Rammasun (2014) on upwelling and cold eddies in the South China Sea. J. Oceanol. Limnol. 2021, 39, 403–419. [Google Scholar] [CrossRef]
  9. Semlali, B.-E.B.; Amrani, C.E. A stream processing software for air quality satellite datasets. In Proceedings of the International Conference on Advanced Intelligent Systems for Sustainable Development, Tangier, Morocco, 21–26 December 2020; pp. 839–853. [Google Scholar]
  10. Wei, J.; Li, Z.; Lyapustin, A.; Sun, L.; Peng, Y.; Xue, W.; Su, T.; Cribb, M. Reconstructing 1-km-resolution high-quality PM2.5 data records from 2000 to 2018 in China: Spatiotemporal variations and policy implications. Remote Sens. Environ. 2021, 252, 112136. [Google Scholar] [CrossRef]
  11. Hubert, D.; Heue, K.-P.; Lambert, J.-C.; Verhoelst, T.; Allaart, M.; Compernolle, S.; Cullis, P.D.; Dehn, A.; Félix, C.; Johnson, B.J. TROPOMI tropospheric ozone column data: Geophysical assessment and comparison to ozonesondes, GOME-2B and OMI. Atmos. Meas. Tech. Discuss. 2021, 14, 7405–7433. [Google Scholar] [CrossRef]
  12. Liang, L.; Daniels, J.; Biancardi, M.; Zhou, Y. Reconstructing aerosol optical depth using spatiotemporal Long Short-Term Memory convolutional autoencoder. Sci. Data 2023, 10, 842. [Google Scholar] [CrossRef]
  13. Su, Y.; Xie, Y.; Tao, Z.; Hu, Q.; Yu, T.; Gu, X. Validation and inter-comparison of MODIS and VIIRS aerosol optical depth products against data from multiple observation networks over East China. Atmos. Environ. 2021, 247, 118205. [Google Scholar] [CrossRef]
  14. Handschuh, J.; Erbertseder, T.; Baier, F. Systematic Evaluation of Four Satellite AOD Datasets for Estimating PM2.5 Using a Random Forest Approach. Remote Sens. 2023, 15, 2064. [Google Scholar] [CrossRef]
  15. Wu, J.; Yao, F.; Li, W.; Si, M. VIIRS-based remote sensing estimation of ground-level PM2.5 concentrations in Beijing–Tianjin–Hebei: A spatiotemporal statistical model. Remote Sens. Environ. 2016, 184, 316–328. [Google Scholar] [CrossRef]
  16. Qin, X. Study on Countermeasures for the Coordinated Development of Economy and Environment in Lianyungang City; Tongfang Knowledge Network (Beijing) Technology Co., Ltd.: Bejing, China, 2020. [Google Scholar] [CrossRef]
  17. Cheng, L.; Zhang, T.; Chen, L.; Li, L.; Wang, S.; Hu, S.; Yuan, L.; Wang, J.; Wen, M. Investigating the Impacts of Urbanization on PM2.5 Pollution in the Yangtze River Delta of China: A Spatial Panel Data Approach. Atmosphere 2020, 11, 1058. [Google Scholar] [CrossRef]
  18. Chen, M.; Zou, X.; Liu, A. Quantitative calculation of the economic losses of atmosphere and water pollution and adjustment of GDP in Lianyungang area. China Popul. Resour. Environ. 2004, 14, 88–93. [Google Scholar] [CrossRef]
  19. Chen, L.; Chen, D.; Yang, W.; Shao, S.; Ling, J.; Li, X.; Wang, L.; Zhang, Y.; Zhu, T.; Zhu, L. Cause Analysis and Emergency Control Effect Evaluation of Winter Haze Pollution in Lianyungang. Environ. Monit. Forewarning 2023, 15, 43–50. [Google Scholar] [CrossRef]
  20. Cheng, C.; Zhang, L.; Yao, Y.; Wang, Y. Pollution Characteristics and Source Apportionment of Water Soluble Inorganic Ions in PM2.5 in Lianyungang City during Spring. Environ. Monit. Forewarning 2019, 11, 41–46. [Google Scholar] [CrossRef]
  21. Jiang, W.; Gao, X.; Yan, H.; Guo, L.; Zhang, H.; Ran, Z. Spatiotemporal Distribution Characteristics of PM2.5 in Coastal Areas of Lianyungang and Its Relationship with Meteorological Conditions. Technol. Innov. Appl. 2022, 12, 73–75. [Google Scholar] [CrossRef]
  22. Lu, J.; Liu, F.; Li, T. Long-term correlational analysis for air pollutants in Lianyungang city. Environ. Pollut. Control 2007, 390–393. [Google Scholar]
  23. Sun, C.; Tu, M. Analysis on Infl uencing Factors of PM2.5 Emission in Lianyungang Urban Area During Winter Spring Transition Period. Leather Manuf. Environ. Technol. 2023, 4, 36–38. [Google Scholar] [CrossRef]
  24. Xu, Y.; Liu, F.; Zhu, J. Multifractal Analysis of Air Pollutant Concentration Time Series Data in Lianyungang City. J. Huaihai Inst. Technol. 2011, 20, 41–45. [Google Scholar] [CrossRef]
  25. Zhao, Y.; Li, T. Analysis of the Change Tendency of Air Quality in LianYungang. Environ. Monit. China 2014, 30, 66–69. [Google Scholar] [CrossRef]
  26. Xue, W.; Zhang, J.; Zhong, C.; Ji, D.; Huang, W. Satellite-derived spatiotemporal PM2.5 concentrations and variations from 2006 to 2017 in China. Sci. Total Environ. 2020, 712, 134577. [Google Scholar] [CrossRef] [PubMed]
  27. Wei, J.; Li, Z. ChinaHighPM2.5: Big Data Seamless 1 km Ground-Level PM2.5 Dataset for China (2000–2021); National Tibetan Plateau/Third Pole Environment Data Center: Beijing, China, 2023. [Google Scholar]
  28. Muñoz-Sabater, J.; Dutra, E.; Agustí-Panareda, A.; Albergel, C.; Arduini, G.; Balsamo, G.; Boussetta, S.; Choulga, M.; Harrigan, S.; Hersbach, H.; et al. ERA5-Land: A state-of-the-art global reanalysis dataset for land applications. Earth Syst. Sci. Data 2021, 13, 4349–4383. [Google Scholar] [CrossRef]
  29. Hayes, L.; Stocks, M.; Blakers, A. Accurate long-term power generation model for offshore wind farms in Europe using ERA5 reanalysis. Energy 2021, 229, 120603. [Google Scholar] [CrossRef]
  30. Hoffmann, L.; Günther, G.; Li, D.; Stein, O.; Wu, X.; Griessbach, S.; Heng, Y.; Konopka, P.; Müller, R.; Vogel, B.; et al. From ERA-Interim to ERA5: The considerable impact of ECMWF’s next-generation reanalysis on Lagrangian transport simulations. Atmos. Chem. Phys. 2019, 19, 3097–3124. [Google Scholar] [CrossRef]
  31. Davis, E.V.; Raju, C.S.; Rajeev, K. Comprehensive observational evidence for the effect of clouds in the diurnal evolution of atmospheric boundary layer. In Proceedings of the 2019 URSI Asia-Pacific Radio Science Conference (AP-RASC), New Delhi, India, 9–15 March 2019; p. 1. [Google Scholar]
  32. Ceamanos, X.; Roujean, J.-L.; Carrer, D.; Meurey, C. Downwelling shortwave surface flux from MSG geostationary satellite: Impact assessment on Land Surface Models and improvements on consideration of aerosol effects. In Proceedings of the 2013 IEEE International Geoscience and Remote Sensing Symposium-IGARSS, Melbourne, VIC, Australia, 21–26 July 2013; pp. 3068–3071. [Google Scholar]
  33. Guo, L.; Zhang, Y.; Lin, H.; Zeng, W.; Liu, T.; Xiao, J.; Rutherford, S.; You, J.; Ma, W. The washout effects of rainfall on atmospheric particulate pollution in two Chinese cities. Environ. Pollut. 2016, 215, 195–202. [Google Scholar] [CrossRef]
  34. Karimi, F.; Amanollahi, J.; Reisi, M.; Darand, M. Prediction of air quality using vertical atmospheric condition and developing hybrid models. Adv. Space Res. 2023, 72, 1172–1182. [Google Scholar] [CrossRef]
  35. Zhao, P.; Ge, S.; Su, J.; Ding, J.; Kuang, Y. Relative humidity dependence of hygroscopicity parameter of ambient aerosols. J. Geophys. Res. Atmos. 2022, 127, e2021JD035647. [Google Scholar] [CrossRef]
  36. Sheng, P.X.; Mao, J.T.; Li, J.G. Atmospheric Physics; Peking University Press: Beijing, China, 2003. [Google Scholar]
  37. Fatahillah, A.; Masyhudi, M.; Setiawan, T. Numerical analysis of air pollutant dispersion in steam power plant area using the finite volume method. In Journal of Physics: Conference Series; IOP Publishing: Bristol, UK, 2020; p. 012002. [Google Scholar]
  38. Lianyungang Statistics Bureau. Lianyungang Statistical Yearbook; China Statistics Press: Beijing, China, 2001. [Google Scholar]
  39. Alkemade, F. Empirical orthogonal function (EOF) analysis of ozone variability. In Studies in Environmental Science; Elsevier: Amsterdam, The Netherlands, 1995; Volume 65, pp. 275–278. [Google Scholar]
  40. Fu, D.; Zhang, X.; Li, X.; Liu, D.; Yu, G.; Xu, H. Changes in the hydrodynamic characteristics of the upper layer of the South China Sea during the period of super typhoon Rammasun (2014). Tellus A Dyn. Meteorol. Oceanogr. 2020, 72, 1–15. [Google Scholar] [CrossRef]
  41. Neha; Marwah, R.; Pasari, S. Application of Empirical Orthogonal Function on Geodetic Time-Series Data. In Proceedings of the 2021 IEEE International India Geoscience and Remote Sensing Symposium (InGARSS), Ahmedabad, India, 6–10 December 2021; pp. 198–201. [Google Scholar]
  42. Jolliffe, I.T.; Cadima, J. Principal component analysis: A review and recent developments. Philos. Trans. R. Soc. A Math. Phys. Eng. Sci. 2016, 374, 20150202. [Google Scholar] [CrossRef] [PubMed]
  43. Liu, C.; Li, X.; Wang, S.; Tang, D.; Zhu, D. Interannual variability and trends in sea surface temperature, sea surface wind, and sea level anomaly in the South China Sea. Int. J. Remote Sens. 2020, 41, 4160–4173. [Google Scholar] [CrossRef]
  44. Zeng, J.; Liu, C.; Li, X.; Zhao, H.; Lu, X. Comparative study of the variability and trends of phytoplankton biomass between spring and winter upwelling systems in the South China Sea. J. Mar. Syst. 2022, 231, 103738. [Google Scholar] [CrossRef]
  45. Benesty, J. Noise Reduction in Speech Processing; Springer: Berlin/Heidelberg, Germany, 2009; Volume 14. [Google Scholar]
  46. Zhao, K.; Wulder, M.A.; Hu, T.; Bright, R.; Wu, Q.; Qin, H.; Li, Y.; Toman, E.; Mallick, B.; Zhang, X.; et al. Detecting change-point, trend, and seasonality in satellite time series data to track abrupt changes and nonlinear dynamics: A Bayesian ensemble algorithm. Remote Sens. Environ. 2019, 232, 111181. [Google Scholar] [CrossRef]
  47. Zhang, X.; Xu, X.; Ding, Y.; Liu, Y.; Zhang, H.; Wang, Y.; Zhong, J. The impact of meteorological changes from 2013 to 2017 on PM2.5 mass reduction in key regions in China. Sci. China Earth Sci. 2019, 62, 1885–1902. [Google Scholar] [CrossRef]
  48. The State Council of the People’s Republic of China. Pollution Prevention and Control Action Plan. Available online: https://www.gov.cn/jrzg/2013-09/12/content_2486918.htm (accessed on 12 September 2013).
  49. Lianyungang Municipal People’s Government. Notice on Further Strengthening Air Pollution Prevention and Control Across the City. Available online: https://www.lyg.gov.cn/zglygzfmhwz/sxwj/content/zwgk_89c72f1e7e284818ac1058df8e82c97f.htm (accessed on 12 September 2014).
  50. Chen, C.; Yang, W. Analysis on Pollution Characteristics and Influencing Factors of PM2.5 in Lianyungang. Environ. Sci. Manag. 2014, 39, 120–122. [Google Scholar]
  51. Dai, Y.; Tao, J.; Lin, Z.; Xie, S.; Cao, J.; Zhang, R. Characteristics of Haze and Its Impact Factors in Four Megacities in China During 2006–2009. Environ. Sci. 2013, 34, 2925–2932. [Google Scholar] [CrossRef]
  52. Li, J.; Wang, G. Impact of Sandstorm on Air Quality of Huangshi and Its Control. Environ. Sci. Technol. 2003, 47–49. [Google Scholar] [CrossRef]
  53. Li, M.; Zhang, L. Haze in China: Current and future challenges. Environ. Pollut. 2014, 189, 85–86. [Google Scholar] [CrossRef]
  54. Li, R.; Zhao, Y.; Fu, H.; Chen, J.; Peng, M.; Wang, C. Substantial changes in gaseous pollutants and chemical compositions in fine particles in the North China Plain during the COVID-19 lockdown period: Anthropogenic vs. meteorological influences. Atmos. Chem. Phys. 2021, 21, 8677–8692. [Google Scholar] [CrossRef]
  55. Niu, R.; Cai, X.; Zou, X.; Jiao, M. The Characteristics of Sand and Dust Weather Events in China in 2005. Clim. Environ. Res. 2007, 12, 358–364. [Google Scholar] [CrossRef]
  56. Su, B.; Zhan, M.; Zhai, J.; Wang, Y.; Fischer, T. Spatio-temporal variation of haze days and atmospheric circulation pattern in China (1961–2013). Quat. Int. 2015, 380–381, 14–21. [Google Scholar] [CrossRef]
  57. Liu, Q.; Yao, Y.; Zhao, Q. Impact of Atmospheric Transport on Fine Particulate Matter Concentrations in Lianyungang Urban Area. Qinghai Environ. 2018, 28, 140–144. [Google Scholar]
  58. Song, R.; Yang, L.; Liu, M.; Li, C.; Yang, Y. Spatiotemporal Distribution of Air Pollution Characteristics in Jiangsu Province, China. Adv. Meteorol. 2019, 2019, 5907673. [Google Scholar] [CrossRef]
  59. Chen, L.; Xia, M.; Yang, X.; Liu, P.; Cai, Q. Assessment of the emission inventory of air pollutants based on land use. J. China Univ. Min. Technol. 2016, 45, 1271–1277. [Google Scholar] [CrossRef]
  60. Brehmer, C.; Lai, A.; Clark, S.; Shan, M.; Ni, K.; Ezzati, M.; Yang, X.; Baumgartner, J.; Schauer, J.J.; Carter, E. The oxidative potential of personal and household PM2.5 in a rural setting in southwestern China. Environ. Sci. Technol. 2019, 53, 2788–2798. [Google Scholar] [CrossRef] [PubMed]
  61. Banks, A.; Kooperman, G.J.; Xu, Y. Meteorological influences on anthropogenic PM2.5 in future climates: Species level analysis in the community earth system model v2. Earth’s Future 2022, 10, e2021EF002298. [Google Scholar] [CrossRef]
  62. Song, M.; Kim, M.; Oh, S.-H.; Park, C.; Kim, M.; Kim, M.; Lee, H.; Choe, S.; Bae, M.-S. Influences of organic volatile compounds on the secondary organic carbon of fine particulate matter in the fruit tree area. Appl. Sci. 2021, 11, 8193. [Google Scholar] [CrossRef]
  63. Luo, H.; Chen, J.; Li, G.; An, T. Formation kinetics and mechanisms of ozone and secondary organic aerosols from photochemical oxidation of different aromatic hydrocarbons: Dependence on NO x and organic substituents. Atmos. Chem. Phys. 2021, 21, 7567–7578. [Google Scholar] [CrossRef]
  64. Quan, J.; Liu, Q.; Li, X.; Gao, Y.; Jia, X.; Sheng, J.; Liu, Y. Effect of heterogeneous aqueous reactions on the secondary formation of inorganic aerosols during haze events. Atmos. Environ. 2015, 122, 306–312. [Google Scholar] [CrossRef]
  65. Rabha, S.; Saikia, B.K.; Singh, G.K.; Gupta, T. Meteorological influence and chemical compositions of atmospheric particulate matters in an Indian urban area. ACS Earth Space Chem. 2021, 5, 1686–1694. [Google Scholar] [CrossRef]
  66. Standing Committee of the National People’s Congress. The Air Pollution Prevention and Control Law. 1987. Available online: http://www.law-lib.com/law/law_view.asp?id=95468 (accessed on 20 September 2024).
  67. Standing Committee of the National People’s Congress. The Air Pollution Prevention and Control Law. 1995. Available online: http://www.law-lib.com/law/law_view.asp?id=96365 (accessed on 20 September 2024).
  68. The Ninth National People’s Congress. The “Tenth Five-Year Plan”. 2001. Available online: https://www.gov.cn/gongbao/content/2001/content_60699.htm (accessed on 20 September 2024).
  69. Jin, Y.; Andersson, H.; Zhang, S. Air pollution control policies in China: A retrospective and prospects. Int. J. Environ. Res. Public Health 2016, 13, 1219. [Google Scholar] [CrossRef] [PubMed]
  70. The 16th Central Committee of the Communist Party of China. The 11th Five-Year Plan. 2005. Available online: https://www.gov.cn/ztzl/2005-10/19/content_79342.htm (accessed on 20 September 2024).
  71. The 17th Central Committee of the Communist Party of China. The 12th Five-Year Plan. 2011. Available online: https://www.gov.cn/zhuanti/2011-03/16/content_2623428_2.htm (accessed on 20 September 2024).
  72. Tian, Z. Analysis of Atmospheric Governance Policy in Yangtze River Delta. Master’s Thesis, Southwest Jiaotong University, Chengdu, China, 2021. [Google Scholar]
  73. The State Council of the People’s Republic of China. National Action Plan for Sustained Air Quality Improvement. 2023. Available online: https://www.gov.cn/zhengce/zhengceku/202312/content_6919001.htm (accessed on 20 September 2024).
Figure 1. Study area: Lianyungang in Jiangsu Province, China.
Remotesensing 16 04495 g001
Figure 2. Climatological average of PM2.5 in Lianyungang. (a) Monthly average; (b) seasonal average. Shadow and vertical line represent ±1 standard deviation.
Remotesensing 16 04495 g002
Figure 3. Climatological distribution characteristics of PM2.5 in Lianyungang. (a) Spring; (b) summer; (c) autumn; (d) winter.
Remotesensing 16 04495 g003
Figure 4. The first mode (EOF1) of the monthly average PM2.5 concentration anomalies (a) and the corresponding temporal coefficients (b) in the Lianyungang region during 2000 to 2023, while (c) and (d) are the result from the second mode (EOF2).
Remotesensing 16 04495 g004
Figure 5. Trend and season analyses of PM2.5 levels in Lianyungang from 2000 to 2023. (a) Time series of monthly average of PM2.5; (b) BEAST-derived trend and detected abrupt changepoint with the highest probability; (c) BEAST-derived season and detected abrupt changepoint with the highest probability.
Remotesensing 16 04495 g005
Figure 6. Loading plot of PCA for PM2.5 and meteorological factors.
Remotesensing 16 04495 g006
Figure 7. (ak) Relationship between climatological monthly average of PM2.5 concentration and meteorological factors. (a) Blh; (b) SSrd; (c) Tp; (d) SP; (e) T2m; (f) D2m; (g) RH; (h) AH; (i) q; (j) WD; (k) W10.
Remotesensing 16 04495 g007
Figure 8. Relationship between PM2.5 concentration and economic indicators over different periods. (a) GDP; (b) Industrial Output Value.
Remotesensing 16 04495 g008
Table 1. Pearson correlation coefficients between PM2.5 concentration and meteorological factors.
AcronymBlhSsrdTpSPT2mD2mRHAHqW10WD
UnitmJ/m2mmPaKK%%g/kgm/s(°)
Pearson Correlation (r) 0.54 *−0.45 *−0.53 *0.66 *−0.74 *−0.74 *−0.48 *−0.71 *−0.70 *−0.29 *−0.20 *
p-value<0.00016.23 × 10−4
* Correlation is significant at the 0.05 level.
Table 2. Pearson correlation coefficients between PM2.5 concentrations and socio-economic factors across different time periods.
PeriodCorrelation and Statistical SignificanceGDP (Billion RMB)GDP per Capita (RMB)Industrial Output Value (Billion RMB)Built-Up Area (km2)Greening Rate of Urban Built-Up Area (%)Urban Population Density (Person/km2)Per Capita Daily Residential Electricity Consumption
(kWh)
Total Social Electricity Consumption (Billion kWh)Number of Motor Vehicles Industrial Particulate Matter Emission
(Tons)
2000–2006Pearson Correlation (r) 0.87 *0.86 *0.83 *0.91 *0.470.98 *0.94------
p-value0.01160.01270.02000.00460.28210.00360.0649------
2007–2013Pearson Correlation (r) 0.340.330.340.220.120.440.410.410.330.19
p-value0.45150.46770.45780.63280.80210.32900.42310.36260.52820.7152
2014–2022Pearson Correlation (r) −0.97 *−0.97 *−0.94 *−0.97 *−0.95 *−0.97 *−0.96 *−0.88 *−0.77 *0.89 *
p-value<0.0001<0.00011.2629 × 10−4<0.0001<0.0001<0.0001<0.00010.0020.01420.0079
* Correlation is significant at the 0.05 level.
Disclaimer/Publisher’s Note: The statements, opinions and data contained in all publications are solely those of the individual author(s) and contributor(s) and not of MDPI and/or the editor(s). MDPI and/or the editor(s) disclaim responsibility for any injury to people or property resulting from any ideas, methods, instructions or products referred to in the content.

