Article

Optimizing the Vegetation Health Index for Agricultural Drought Monitoring: Evaluation and Application in the Yellow River Basin

1
School of Geography and Tourism, Qufu Normal University, Rizhao 276826, China
2
Sino-Belgian Joint Laboratory of Geo-Information, Rizhao 276826, China
3
Sino-Belgian Joint Laboratory of Geo-Information, 9000 Ghent, Belgium
4
Department of Geography, Ghent University, 9000 Ghent, Belgium
*
Author to whom correspondence should be addressed.
Remote Sens. 2024, 16(23), 4507; https://doi.org/10.3390/rs16234507
Submission received: 22 September 2024 / Revised: 26 November 2024 / Accepted: 28 November 2024 / Published: 1 December 2024

Abstract

:
The ecological environment of the Yellow River Basin in China is characterized by drought, which has been exacerbated by global warming. It is critical to keep accurate track of the region’s agricultural drought conditions. To enhance the vegetation health index (VHI), the optimal time scale for the standardized precipitation evapotranspiration index (SPEI) was determined by using the maximum correlation coefficient method, and the calculation method for VHI was optimized. The contributions of the vegetation condition index (VCI) and the temperature condition index (TCI) to the VHI were scientifically optimized, leading to the development of the optimal VHI (VHIopt). Soil moisture anomaly (SMA) and the SPEI were employed for assessing the performance of VHIopt. Furthermore, the temporal and spatial evolution of agricultural drought in the Yellow River Basin (YRB) was analyzed using VHIopt. The results indicate the following: (1) In the YRB, the optimal contribution of the VCI to the VHI is lower than that of the TCI. (2) The drought monitoring accuracy of VHIopt in forests, grasslands, croplands, and other vegetation types exceeds that of the original VHI (VHIori). Additionally, it demonstrates a high level of consistency with the SMA and the SPEI03 regarding spatial and temporal characteristics. (3) Agricultural drought in the YRB is gradually diminishing; however, significant regional differences remain. Generally, the findings of this study highlight that VHIopt is better suited to the specific climate and vegetation conditions of the Yellow River Basin, enhancing its effectiveness for agricultural drought monitoring in this region.

1. Introduction

Drought is a phenomenon manifested by insufficient water resources that fail to meet the growth requirements of both humans and plants [1,2]. It is a severe natural disaster impacting agricultural production in China [3]. The mechanisms underlying this natural disaster are complex, and its effects are far-reaching [4]. Drought is commonly categorized into four specific types: meteorological, agricultural, hydrological, and socioeconomic drought [5]. Agricultural drought develops when soil moisture is insufficient to sustain plant growth [6], which can be reflected by soil moisture content and the condition of plant growth [7]. Given the strong correlation between agricultural drought and crop production, improving the accuracy of agricultural drought monitoring is essential [8]. Agricultural drought directly influences crop development, resulting in decreased crop yields, substantial agricultural losses, and heightened threats to food security [9,10,11].
To monitor agricultural droughts more accurately and mitigate the substantial losses in agriculture caused by frequent droughts, Kogan developed a new drought index known as the vegetation health index (VHI), which combines two key components: the vegetation condition index (VCI) and the temperature condition index (TCI) [12]. Utilizing satellite remote sensing data, the VHI was designed to sensitively reflect the health of vegetation under drought [13,14]. The VHI not only reflects the drought status of vegetation in a specific region but also indirectly indicates the overall health of vegetation [15]. By integrating various factors such as regional soil characteristics, biological conditions, topography, and climate, the VHI offers a comprehensive approach to drought assessment. For instance, Zhang et al. employed this index to characterize drought conditions in the North China Plain [16]. Bento et al. [17] applied the VHI to monitor several severe drought events in global arid regions, with results showing that VHI performs excellently well in monitoring terrestrial systems. Javed et al. compared the standardized precipitation index (SPI) and the VHI, revealing that the VHI effectively captures changes in soil relative humidity and could accurately identify the occurrence of drought [18]. Kogan et al. [19] utilized the VHI to monitor agricultural drought in the United States, Mexico, Brazil and China and expanded the application scope of the VHI in agricultural drought monitoring from regional to global [19,20]. Therefore, the VHI has been widely used in the field of vegetation drought monitoring, providing valuable insights into the temporal and spatial distribution of drought across various regions [6].
VHI is primarily based on two key assumptions: (1) low normalized difference vegetation index (NDVI) and high land surface temperature (LST) indicate poor vegetation health, while high NDVI and low LST signify good vegetation health. (2) VCI and TCI are assumed to contribute equally to VHI based on empirical weights [6,12,21,22]. Many studies have assumed that VCI and TCI each contribute equally (0.5) to VHI for drought monitoring [21,22,23]. However, this assumption has significant limitations in practical applications and may increase errors in drought assessments, thereby affecting the accuracy of the VHI in drought monitoring [24]. In reality, the contribution value of VCI and TCI to VHI is greatly influenced by regional location, climate conditions, and vegetation types [16,17,25]. On one hand, VCI has a more significant impact on VHI in arid regions, where water availability is a primary constraint. Conversely, TCI exerts a greater influence in areas where temperature is the main limiting factor [22,26]. However, Bento et al. discovered the LST dataset that was developed at Princeton University cannot be updated regularly, which may lead to deviation in monitoring results for specific areas [27]. On the other hand, the type of vegetation is also a crucial factor influencing the contribution values of VCI and TCI to VHI. Consequently, VHI calculated using the same weights may not accurately reflect the drought conditions across different vegetation types [6,28]. The above research shows that the equal weight values of VCI and TCI ignore the differences in climatic conditions and vegetation types in different regions, leading to significant discrepancies in drought monitoring for different regions and various vegetation types [6,16].
Some scholars have made many efforts in adjusting the contribution of VCI and TCI to VHI. For instance, to analyze the relationship between agricultural drought and grain production in Morocco, Bouras et al. optimized the weights of VCI and TCI to VHI by using anomaly data from crop yield and discovered that TCI has a greater weight [29,30]. Yin et al. discovered that when the weight distribution ratio of VCI to TCI was 7:3, the VHI index effectively combined the strengths of both indices, making it more advantageous for monitoring agricultural drought in the midstream and downstream of the Yangtze River [31]. However, Zeng et al. calculated the contributions of VCI and TCI based on the self-calibrating Palmer Drought Severity Index (scPDSI) and discovered that in most parts of the world, assigning a greater weight to TCI than to VCI significantly improved the drought monitoring accuracy of VHI [6,32].
The multi-scale drought index can be used to evaluate the contribution of VCI and TCI to VHI. SPEI, proposed by Vicente-Serrano et al. in 2010 [33], is a drought indicator that not only considers the combined effects of temperature and precipitation [34] but also incorporates multi-time scale and standardization features [35]. This makes SPEI particularly suitable for drought monitoring in both humid and arid regions [36,37]. Therefore, SPEI is often employed to calibrate other drought indices [38]. For instance, Guo et al. used the 3-month SPEI during the growing season to calibrate the optimal scale drought condition index (OSDCI) [36]. Myoung-Jin Um et al. applied SPEI to calibrate the drought severity index (DSI) [39]. Chen et al. employed SPEI to enhance the comprehensive drought index (CI), resulting in an improved comprehensive drought index that effectively identifies most of the significant historical droughts in Hubei Province [40].
The Yellow River Basin (YRB) is essential for sustaining production and livelihoods in the arid and semi-arid regions of northern China [41,42,43]. In recent years, climate change and human activities have intensified drought conditions in the YRB, posing significant challenges to the region’s ecological environment, agricultural production, and socioeconomic development [44,45,46]. Simple and user-friendly agricultural drought indices such as VHI can be adapted to diverse climatic conditions, facilitating effective drought monitoring across different geographical regions [7,47,48]. However, the existing studies primarily utilize the VHI based on empirical weights to assess drought conditions in the YRB, which diminishes the accuracy of the VHI index in monitoring agricultural drought to some extent. Therefore, enhancing the accuracy of agricultural drought monitoring in the YRB is essential.
This study seeks to enhance the accuracy of VHI in monitoring agricultural drought by identifying the optimal timescale through maximizing the correlation between SPEI at various timescales and VHI. Using the SPEI at the optimal time scale as a reference, VHIopt is calculated based on the optimal contribution values of VCI and TCI. Based on VHIopt, the trend of agricultural drought development in the YRB from 2021 to 2023 was analyzed.

2. Materials and Methods
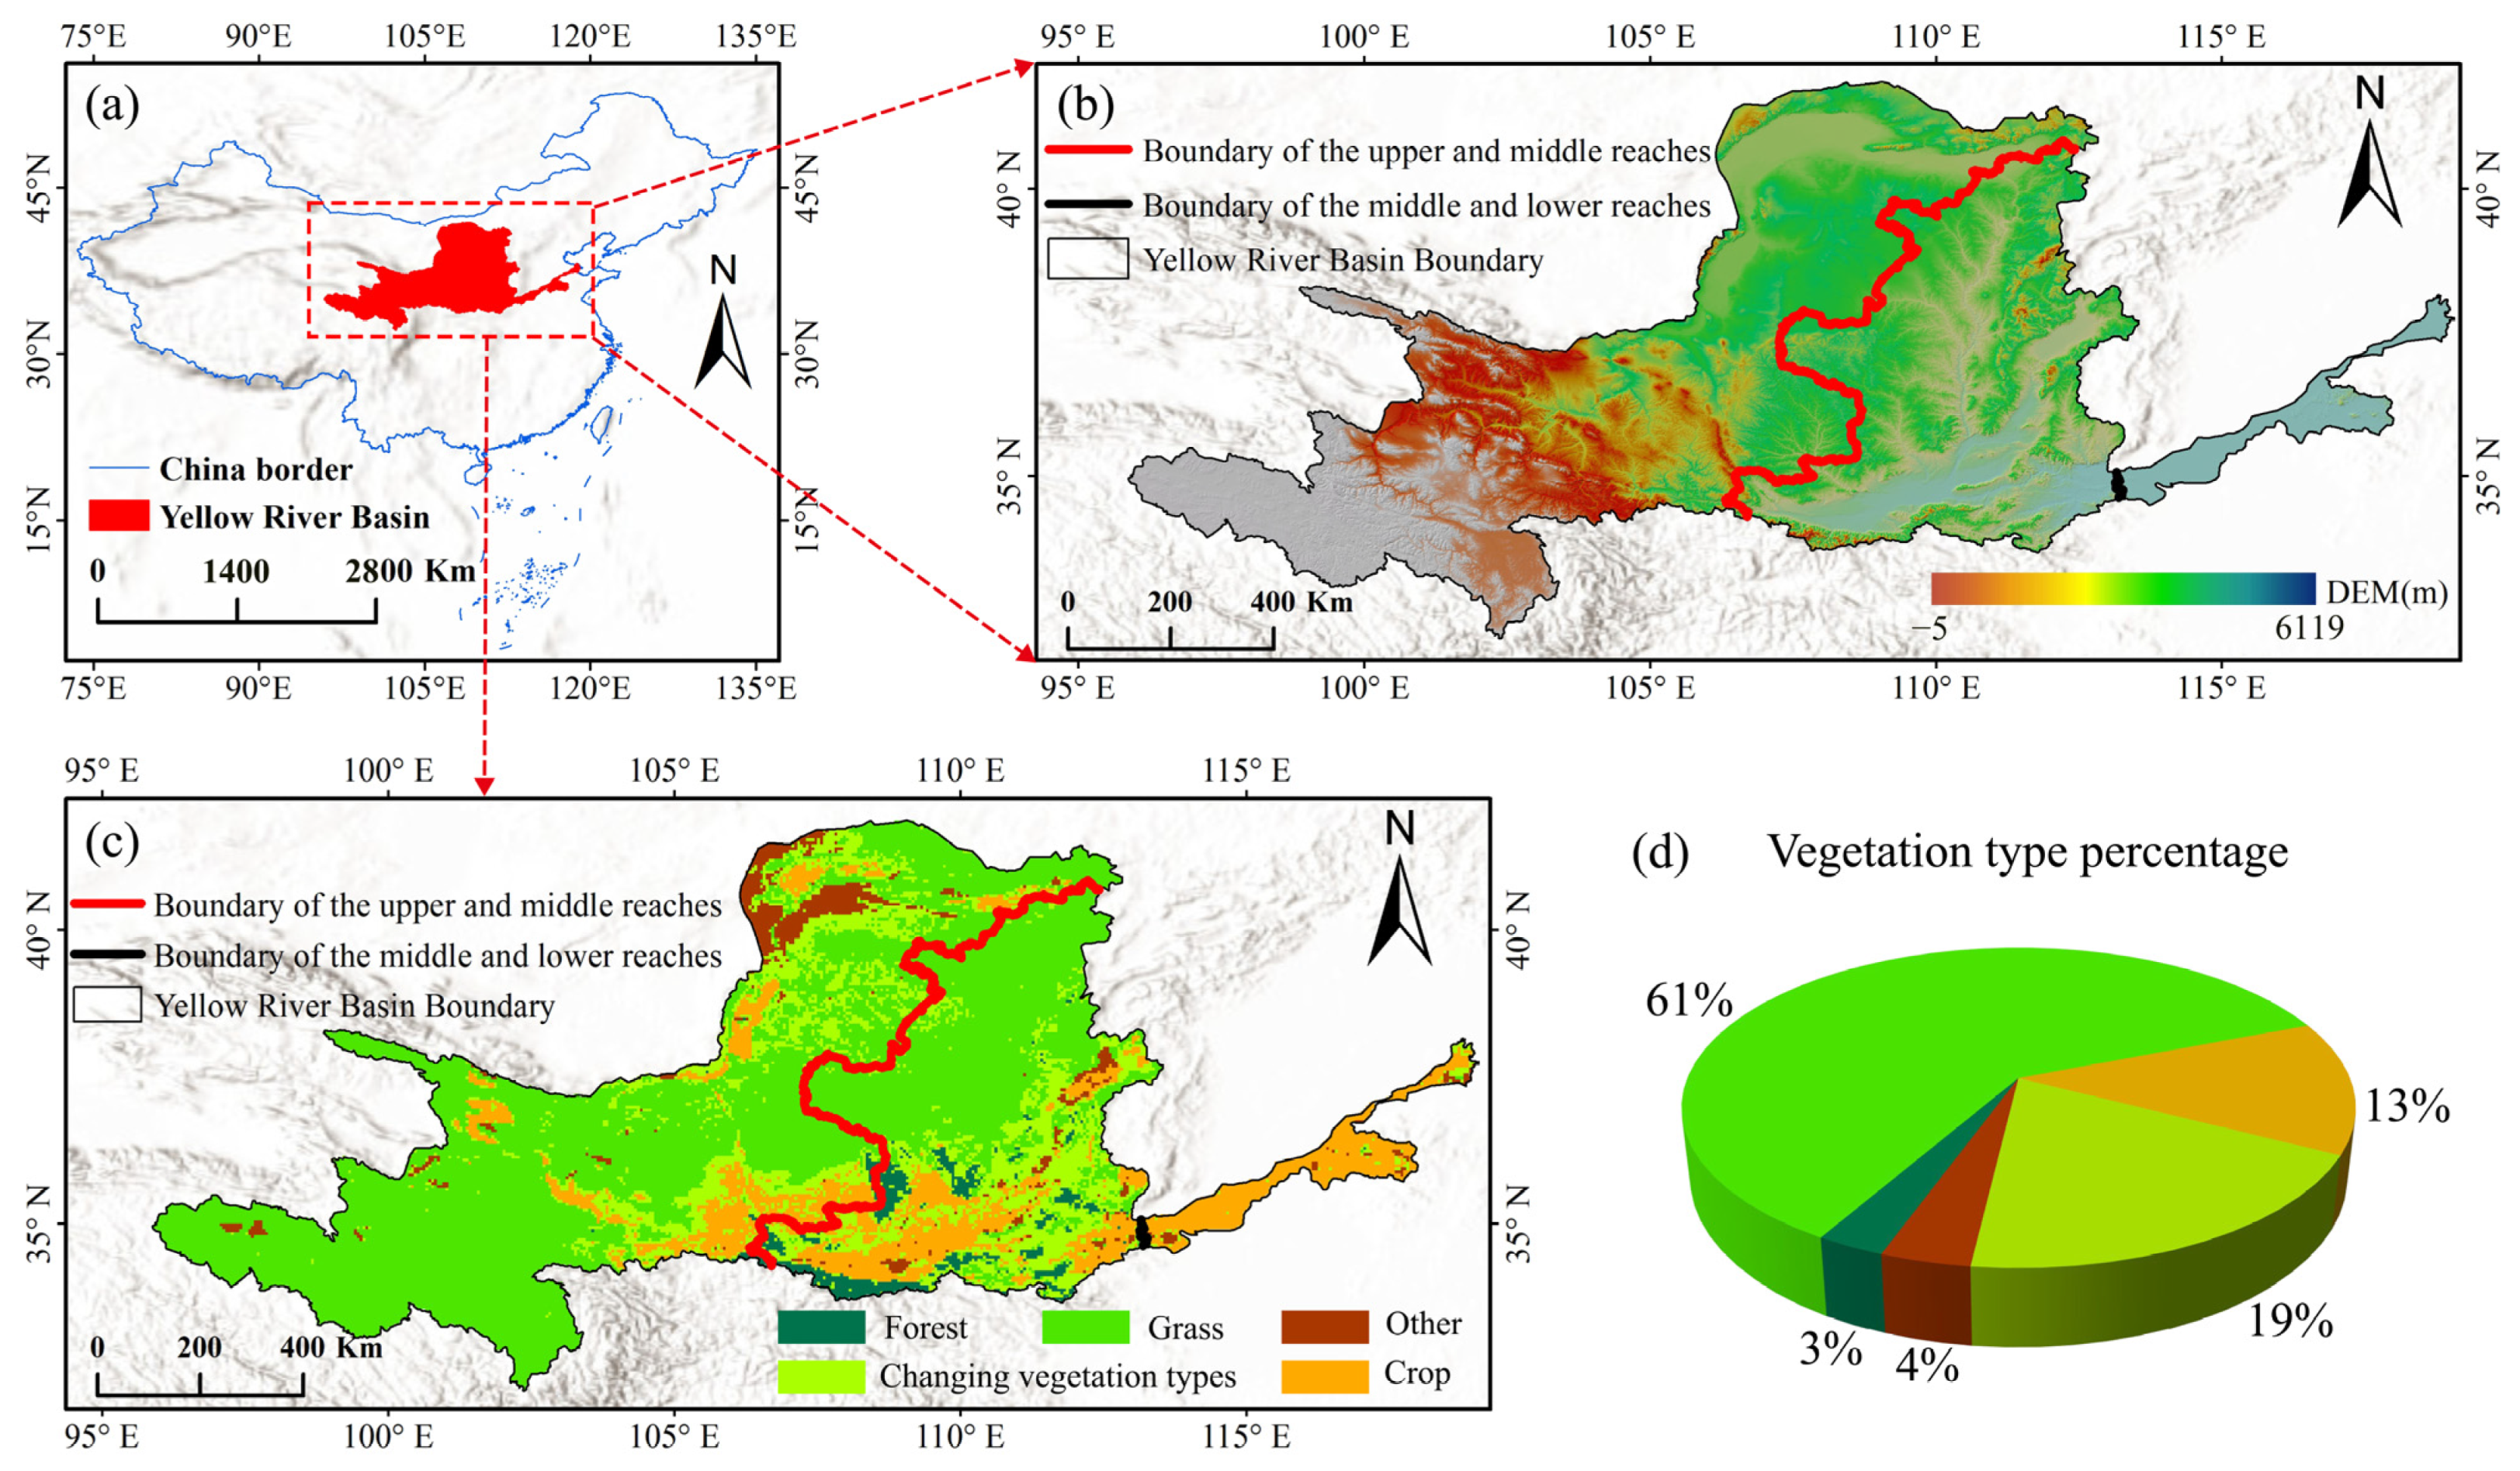
2.1. Study Area

As a vital water resource and ecological zone in China [40,41], the YRB is responsible for supplying water to major grain producing and densely populated areas [42]. It is located between 94° to 120°E and 30° to 42°N, originating from the Bayan Har Mountains [49,50,51]. The basin features diverse topography, with elevation gradually increasing from the southeast to the northwest (Figure 1a,b), encompassing a total area of approximately 795,000 km2 [43]. Upstream is primarily mountainous, the midstream is characterized by loess landforms, and the downstream consists of plains and hills. Diverse topography has resulted in a wide range of climatic conditions within the basin, including arid, semi-arid, and semi-humid types (Figure 1b,c) [52]. Due to the region’s complex and diverse climate, the YRB supports a wide range of vegetation types [53]. Grasslands account for about 61% of the total area, changing vegetation types account for about 19%, croplands account for about 13%, forests account for roughly 3%, and other types account for about 4% (Figure 1d).

2.2. Data

2.2.1. Meteorological Data

TerraClimate is a global dataset that offers monthly climate variables and water balance metrics specifically for terrestrial surfaces (https://www.climatologylab.org/terraclimate.html, accessed on 5 March 2024), with a spatial resolution of 4 km. In the study, monthly precipitation (PRE) data and potential evapotranspiration (PET) data from 1981 to 2021 were selected to calculate the SPEI index. Due to its long temporal coverage and high spatial resolution, this dataset is well-suited for drought monitoring [33].
ERA5-Land is a high-resolution reanalysis dataset developed by the European Centre for Medium-Range Weather Forecasts, providing gridded climate information (ECMWF) (https://cds.climate.copernicus.eu, accessed on 5 March 2024), featuring both monthly and hourly temporal resolutions with a spatial resolution of 0.1°. The soil moisture (SM) data derived from ERA5-Land are particularly applicable to arid and semi-arid regions [54] and have been extensively employed in the validation of agricultural drought indices [36]. In the study, monthly ERA5-Land soil moisture data from 2001 to 2021 were selected, and they were resampled to a 0.05° spatial resolution using the bilinear method to ensure consistency with the spatial resolution of other datasets. The soil moisture data were used to validate the accuracy of the VHI.
The global land evaporation Amsterdam model (GLEAM) comprises a series of algorithms specifically designed to estimate land evaporation and root zone soil moisture using satellite data. GLEAM can provide potential evaporation, surface soil moisture, and RZSM. GLEAM RZSM products are available on a 0.25° × 0.25° regular grid at daily and monthly temporal resolution (https://www.gleam.eu/, accessed on 5 March 2024). In the study, monthly GLEAM root zone soil moisture data from 2001 to 2021 were selected and resampled to a spatial resolution of 0.05° using the bilinear interpolation method to ensure consistency with the spatial resolution of other datasets. The soil moisture data were utilized to further validate the accuracy of VHI.

2.2.2. Vegetation Index

MOD13C2 and MOD11C3 are vegetation index datasets (https://earthdata.nasa.gov, accessed on 5 March 2024), acquired by moderate resolution imaging spectroradiometer (MODIS) sensors, with a spatial resolution of 0.05° and a temporal resolution of one month. Normalized difference vegetation index (NDVI) and land surface temperature (LST) data covering the period from 2001 to 2021 were employed to calculate VCI and TCI, respectively.

2.2.3. Land Use Data

MOD12C1 is a land cover dataset (https://earthdata.nasa.gov, accessed on 5 March 2024), acquired by moderate resolution imaging spectroradiometer (MODIS) with a spatial resolution of 0.05° and a temporal resolution of one year, using the International Geosphere-Biosphere Programme (IGBP) land cover classification scheme. In the study, MOD12C1 data from 2001 to 2021 were selected. To eliminate the effects of land use changes, we preprocessed and reclassified the original 17 land cover types. Evergreen needleleaf forests, evergreen broadleaf forests, deciduous needleleaf forests, deciduous broadleaf forests, mixed forests, closed shrublands, and open shrublands were reclassified as forests. Woody savannas, savannas, and grasslands were reclassified as grasslands. Croplands and cropland/natural vegetation mosaics were reclassified as croplands. Water bodies, permanent wetlands, urban and built-up areas, snow and ice, and barren lands were reclassified as others, as shown in Table A1.

2.3. Method

2.3.1. SPEI

SPEI is a powerful and versatile tool for monitoring drought [33,34]. Unlike traditional indices, such as SPI, which rely solely on precipitation data, the SPEI incorporates PET [37]. This allows it to capture the combined effects of precipitation deficits and temperature-induced water loss [35]. In comparison to scPDSI, the SPEI offers the advantage of being multi-scalar, which is essential for effective drought analysis and monitoring [33,37]. In the context of global climate change and rising temperatures, the SPEI surpasses traditional indices by integrating both precipitation and temperature-driven evapotranspiration [55]. The SPEI can be applied across various temporal and spatial scales, making it suitable for drought monitoring in diverse climate zones and agricultural regions [3,7,56]. Its flexibility positions it as a crucial tool in a range of drought assessment and early warning systems [37,55].
Generally, higher SPEI values signify wetter conditions, whereas lower SPEI values denote drier conditions [57]. Based on the drought classification standard of the SPEI index, SPEI values are divided into five categories [58] (Table 1). When the SPEI value is less than or equal to −0.5, it indicates the occurrence of drought. On the contrary, there is no drought.
The SPEI index is calculated as follows [33]:
Calculate the difference between precipitation and potential evapotranspiration:
D i , j = P i , j P E T i , j
where i is the year, j is the month, P is precipitation, and PET is potential evapotranspiration.
Construct cumulative water surplus/deficit series for different time scales of the study data:
D i , j k = i = 0 k 1 ( P i , j 1 P E T i , j 1 )
where D i , j k is the cumulative value of the difference between precipitation and potential evapotranspiration at time scale k.
The probability density function of a three-parameter log-logistic distributed variable is expressed as
f x = β α ( x γ α ) β 1 [ 1 + x γ α β ] 2
where α is the scale parameter, β is the shape parameter, and γ is the position parameter.
The probability distribution function of the D series, according to the log-logistic distribution, is given by
F x = 0 x f t d t = [ 1 + ( α x γ ) β ] 1
SPEI is calculated as follows [33]:
S P E I = ω C 0 + C 1 ω + C 1 ω 2 1 + ω d 1 + d 2 ω 2 + d 2 ω 3 ,   ω = 2 ln p   p 0.5 S P E I = C 0 + C 1 ω + C 1 ω 2 1 + ω d 1 + d 2 ω 2 + d 2 ω 3 ω , ω = 2 ln 1 p   p 0.5
where P = 1 − F(x), c 0 = 2.515517, c 1 = 0.802853, c 2 = 0.010328, d 1 = 1.432788, d 2 = 0.189269, d 3 = 0.001308.

2.3.2. VHI

VHI is a remote sensing index that combines both vegetation and temperature data. This integration enables VHI to simultaneously reflect changes in moisture and temperature within a given region, making it an effective tool for monitoring drought conditions across various time scales and geographic areas [19,59]. VCI [60], derived from the NDVI, is used to assess vegetation health [13]. TCI [19], calculated from LST, reflects land surface temperature and is widely employed in drought assessment and monitoring [61,62]. In this study, VHI is employed to evaluate the severity of drought conditions in the YRB, where a lower VHI value indicates more severe drought conditions and a higher value signifies less severe drought. The formula for calculating VHI is as follows [17]:
V C I i , j k = N D V I i , j k m i n ( N D V I i k ) m a x ( N D V I i k ) m i n ( N D V I i k )
where N D V I i , j k is the monthly NDVI at a given pixel k, month i , and year j, and m a x ( N D V I i k ) and m i n ( N D V I i k ) are the maximum and minimum value of NDVI in that same month i over the growing seasons from 2001 to 2021 [17,63]. The V C I i , j k value ranges from 0 to 1. Higher VCI values indicate healthier vegetation conditions for the current month, while lower VCI values suggest poor vegetation health [60].
T C I i , j k = m a x L S T i k L S T i , j k m a x L S T i k m i n L S T i k
where L S T i , j k is the monthly LST at a given pixel k, month i , and year j, and m a x L S T i k and m i n L S T i k are the maximum and minimum value of LST in that same month i over the growing seasons from 2001 to 2021 [17,63]. The T C I i , j k value ranges from 0 to 1. Higher TCI values indicate more favorable temperature conditions for vegetation health during the current month, while lower TCI values suggest less favorable temperature conditions, possibly leading to thermal stress or drought conditions [61,62].
V H I i , j k = α × V C I i , j k + ( 1 α ) × T C I i , j k
where α is the contribution of VCI to VHI, and 1 α is the contribution of TCI to VHI. The drought degree of the VHI index is divided into 5 grades, as presented in Table 2.

2.3.3. SMA

Soil moisture refers to the water content contained within unsaturated soil layers and serves as a crucial resource for both agriculture and natural vegetation [64]. Drought conditions occur when soil moisture is insufficient to satisfy the transpiration demands of crops and vegetation, leading to disruptions in normal physiological processes and potentially impacting crop yields [65]. Additionally, soil moisture is closely linked to variations in surface temperature and precipitation [66]. Consequently, soil moisture serves as a vital component for monitoring agricultural drought. Since the water content in the root zone directly influences the growth and physiological activities of plants, changes in soil moisture within this zone serve as a crucial indicator of agricultural drought [67,68,69]. Consequently, the soil moisture data utilized in this study represent the weighted average of the moisture levels in three layers: the first layer (0–7 cm), the second layer (7–28 cm), and the third layer (28–100 cm). The formula for calculating the weighted average is as follows [70]:
S M R Z = S M 1 × d 1 + S M 2 × d 2 + S M 3 × d 3 d 1 + d 2 + d 3
where SMRZ is the root zone soil moisture; d 1 , d 2 and d 3 are the depth of layer 1, layer 2 and layer 3; and S M 1 , S M 2 and S M 3 are the soil moisture of layer 1, layer 2 and layer 3.
However, the natural conditions in different regions lead to variations in the actual values of soil moisture. SMA normalizes these regional differences, highlighting deviations more clearly and making SMA a key element in many practical drought monitoring systems [71,72]. The formula for calculating SMA is [72]:
S M A = x i x ¯ σ
where x i is the soil moisture value of each pixel, x ¯ is the average soil moisture value of all pixels during 2001–2021, and σ is the standard deviation of soil moisture of all pixels during 2001–2021.

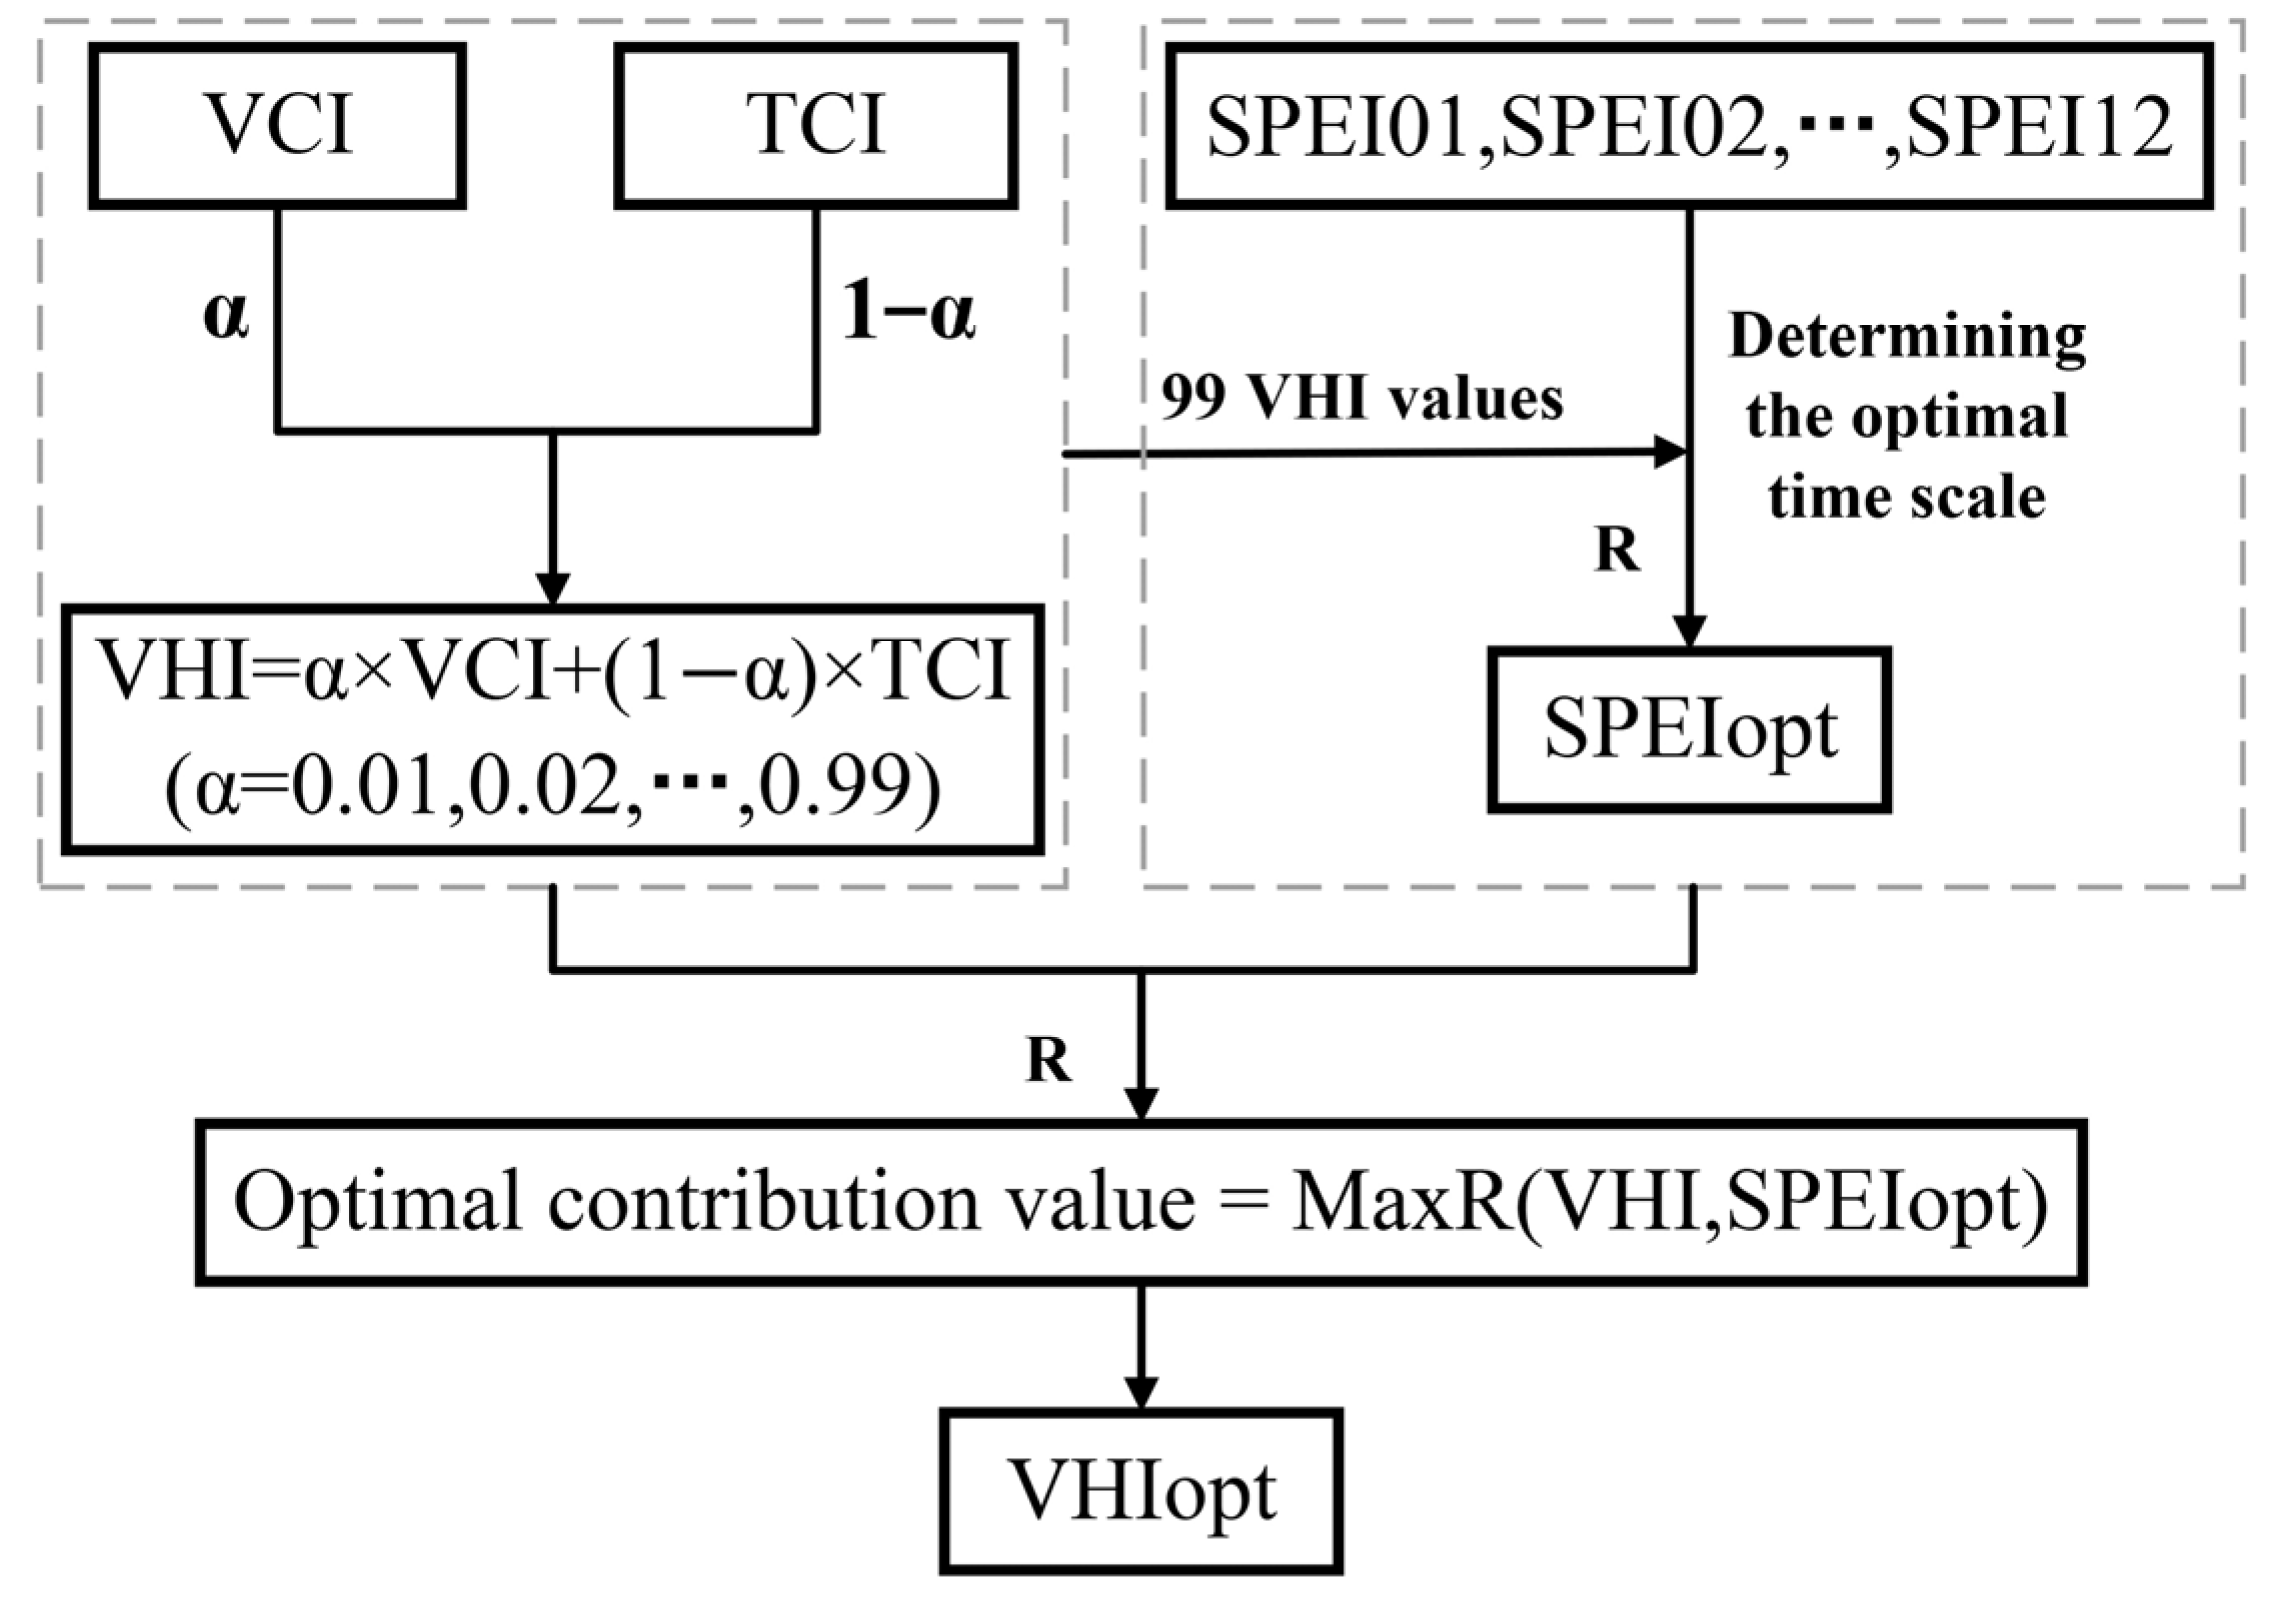
2.3.4. VHI Algorithm Optimization

The steps to calculate the contribution of VCI and TCI to VHI are as follows (Figure A1):
Firstly, according to the calculation method of VHI, the parameter α starts from 0.01, increases gradually to 0.99 by 0.01 steps, and then calculates VHI with different α values.
V H I α = α × V C I + ( 1 α ) × T C I
Secondly, Pearson correlation analysis is carried out between 99 VHI values calculated in step 1 and SPEI values in different time scales. The time scale corresponding to the maximum correlation coefficient is taken as the optimal time scale. The Pearson correlation coefficient (R) is calculated as
R = i = 1 n ( x i x ¯ ) ( y i y ¯ ) i = 1 n ( x i x ¯ ) 2 ( y i y ¯ ) 2
Here, R varies between −1 and 1. Suppose x and y represent two different drought indicators. Then, x i and y i are the values of x and y in the i-th year, n is the length of the dataset, x ¯ and y ¯ are the averages of x and y.
Thirdly, the Pearson correlation analysis is carried out on 99 VHI values calculated in step (1) and SPEI of the optimal time scale, and the α value corresponding to the maximum correlation coefficient is taken as the optimal contribution value.
α o p t = m a x R ( V H I α , S P E I 03 )
Finally, VHIopt is calculated as
V H I o p t = α o p t × V C I × 0.01 + ( 1 α o p t ) × T C I × 0.01

2.3.5. Evaluation Indices

Pearson’s correlation coefficient (R), relative bias (RB), and root mean square error (RMSE) were selected as the evaluation indices to assess the performance of VHIopt in enhancing drought monitoring enhancement across different vegetation types. R measures the consistency between VHIopt and SPEI03 or SMA, with an optimal value of 1 indicating a perfect correlation. RB evaluates the systematic bias between VHIopt and SPEI03 or SMA, with an optimal value of 0. RMSE assesses the overall error and precision of VHIopt, SPEI03, and SMA, with an optimal value of 0. The formulas for calculating RB and RMSE are as follows [73]:
R B = i = 1 N ( R R R V ) i = 1 N R V ¯
R M S E = 1 N i = 1 N ( R R R V ) 2
where N represents the number of data; i represents the i-th data; R V represents VHI; R R represents SPEI03 or SMA.

3. Results

3.1. Calculation of Optimal Weighting Factors

The SPEI indices of different time scales can reflect different types of droughts. Among these, vegetation drought typically refers to drought conditions with a shorter duration, generally lasting less than 12 months [59,74,75]. Consequently, we selected the SPEI across time scales of 1 to 12 months to investigate the optimal weighting values of VCI and TCI within the VHI. The growing season, which spans from April to September, was chosen for this study [13,76].
Figure 2 illustrates that the correlation between VHI and SPEI varies significantly with different weighting values. Specifically, when the weight of VCI is low, the correlation between VHI and SPEI across different time scales is high. However, this correlation tends to decrease as the VCI weight increases. This suggests that while both VCI and TCI provide valuable information on drought, an unbalanced weighting may negatively impact the efficacy of the VHI in drought monitoring. Among the various SPEI time scales, SPEI03 exhibited the strongest correlation with VHI. Furthermore, SPEI03 is more appropriate for the analysis of vegetation drought [6,77]. Therefore, three months was selected as the optimal time scale for further optimizing VHI and determining the optimal weights.
The contribution of VCI and TCI to VHI is significantly influenced by regional vegetation types [17]. As shown in Table A2, the optimal weights for VCI and TCI in VHI vary across different vegetation types. For forest areas, the correlation coefficient between SPEI03 and VHI was maximized with a VCI weight of 0.28, whereas the optimal VCI weights were 0.23, 0.45, and 0.28 for grasslands, croplands, and changing vegetation types, respectively. Considering all vegetation types together, the highest correlation coefficient between SPEI03 and VHI was 0.61 with a VCI weight of 0.29. Based on the above findings, a higher weight should be assigned to TCI in calculating VHI for the YRB to enhance the accuracy of agricultural drought monitoring.

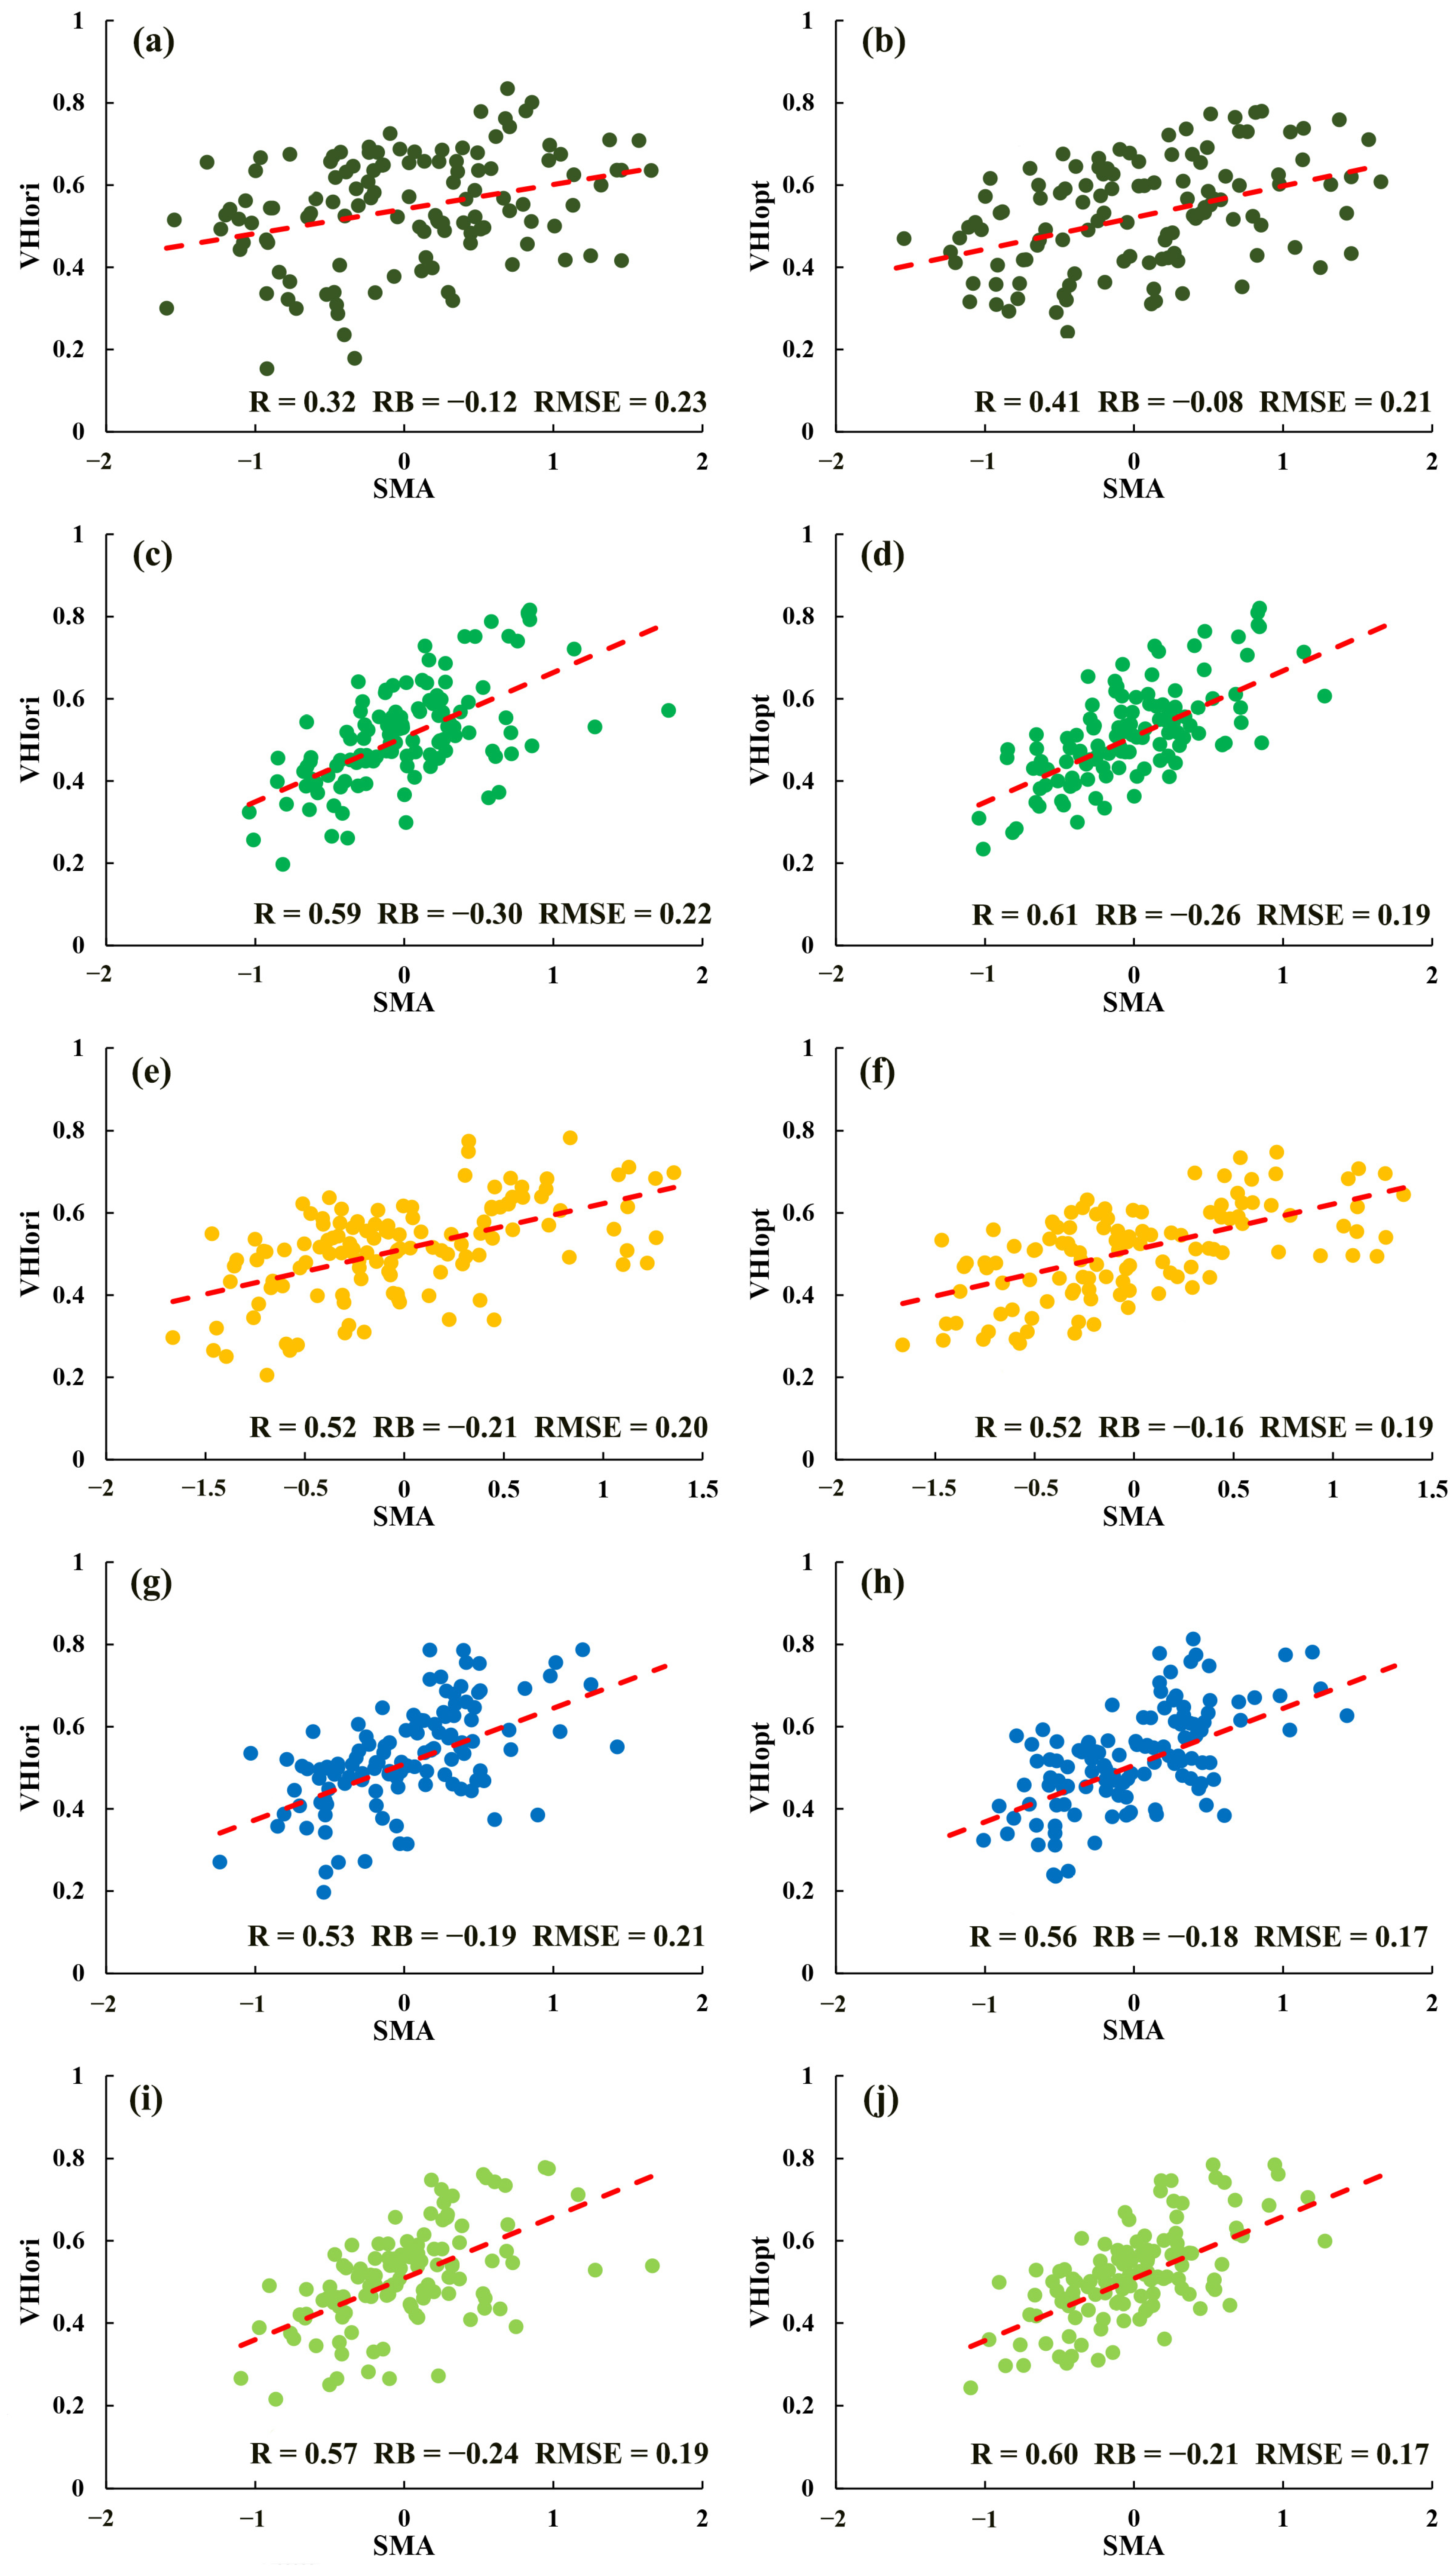
3.2. VHIopt Accuracy Evaluation

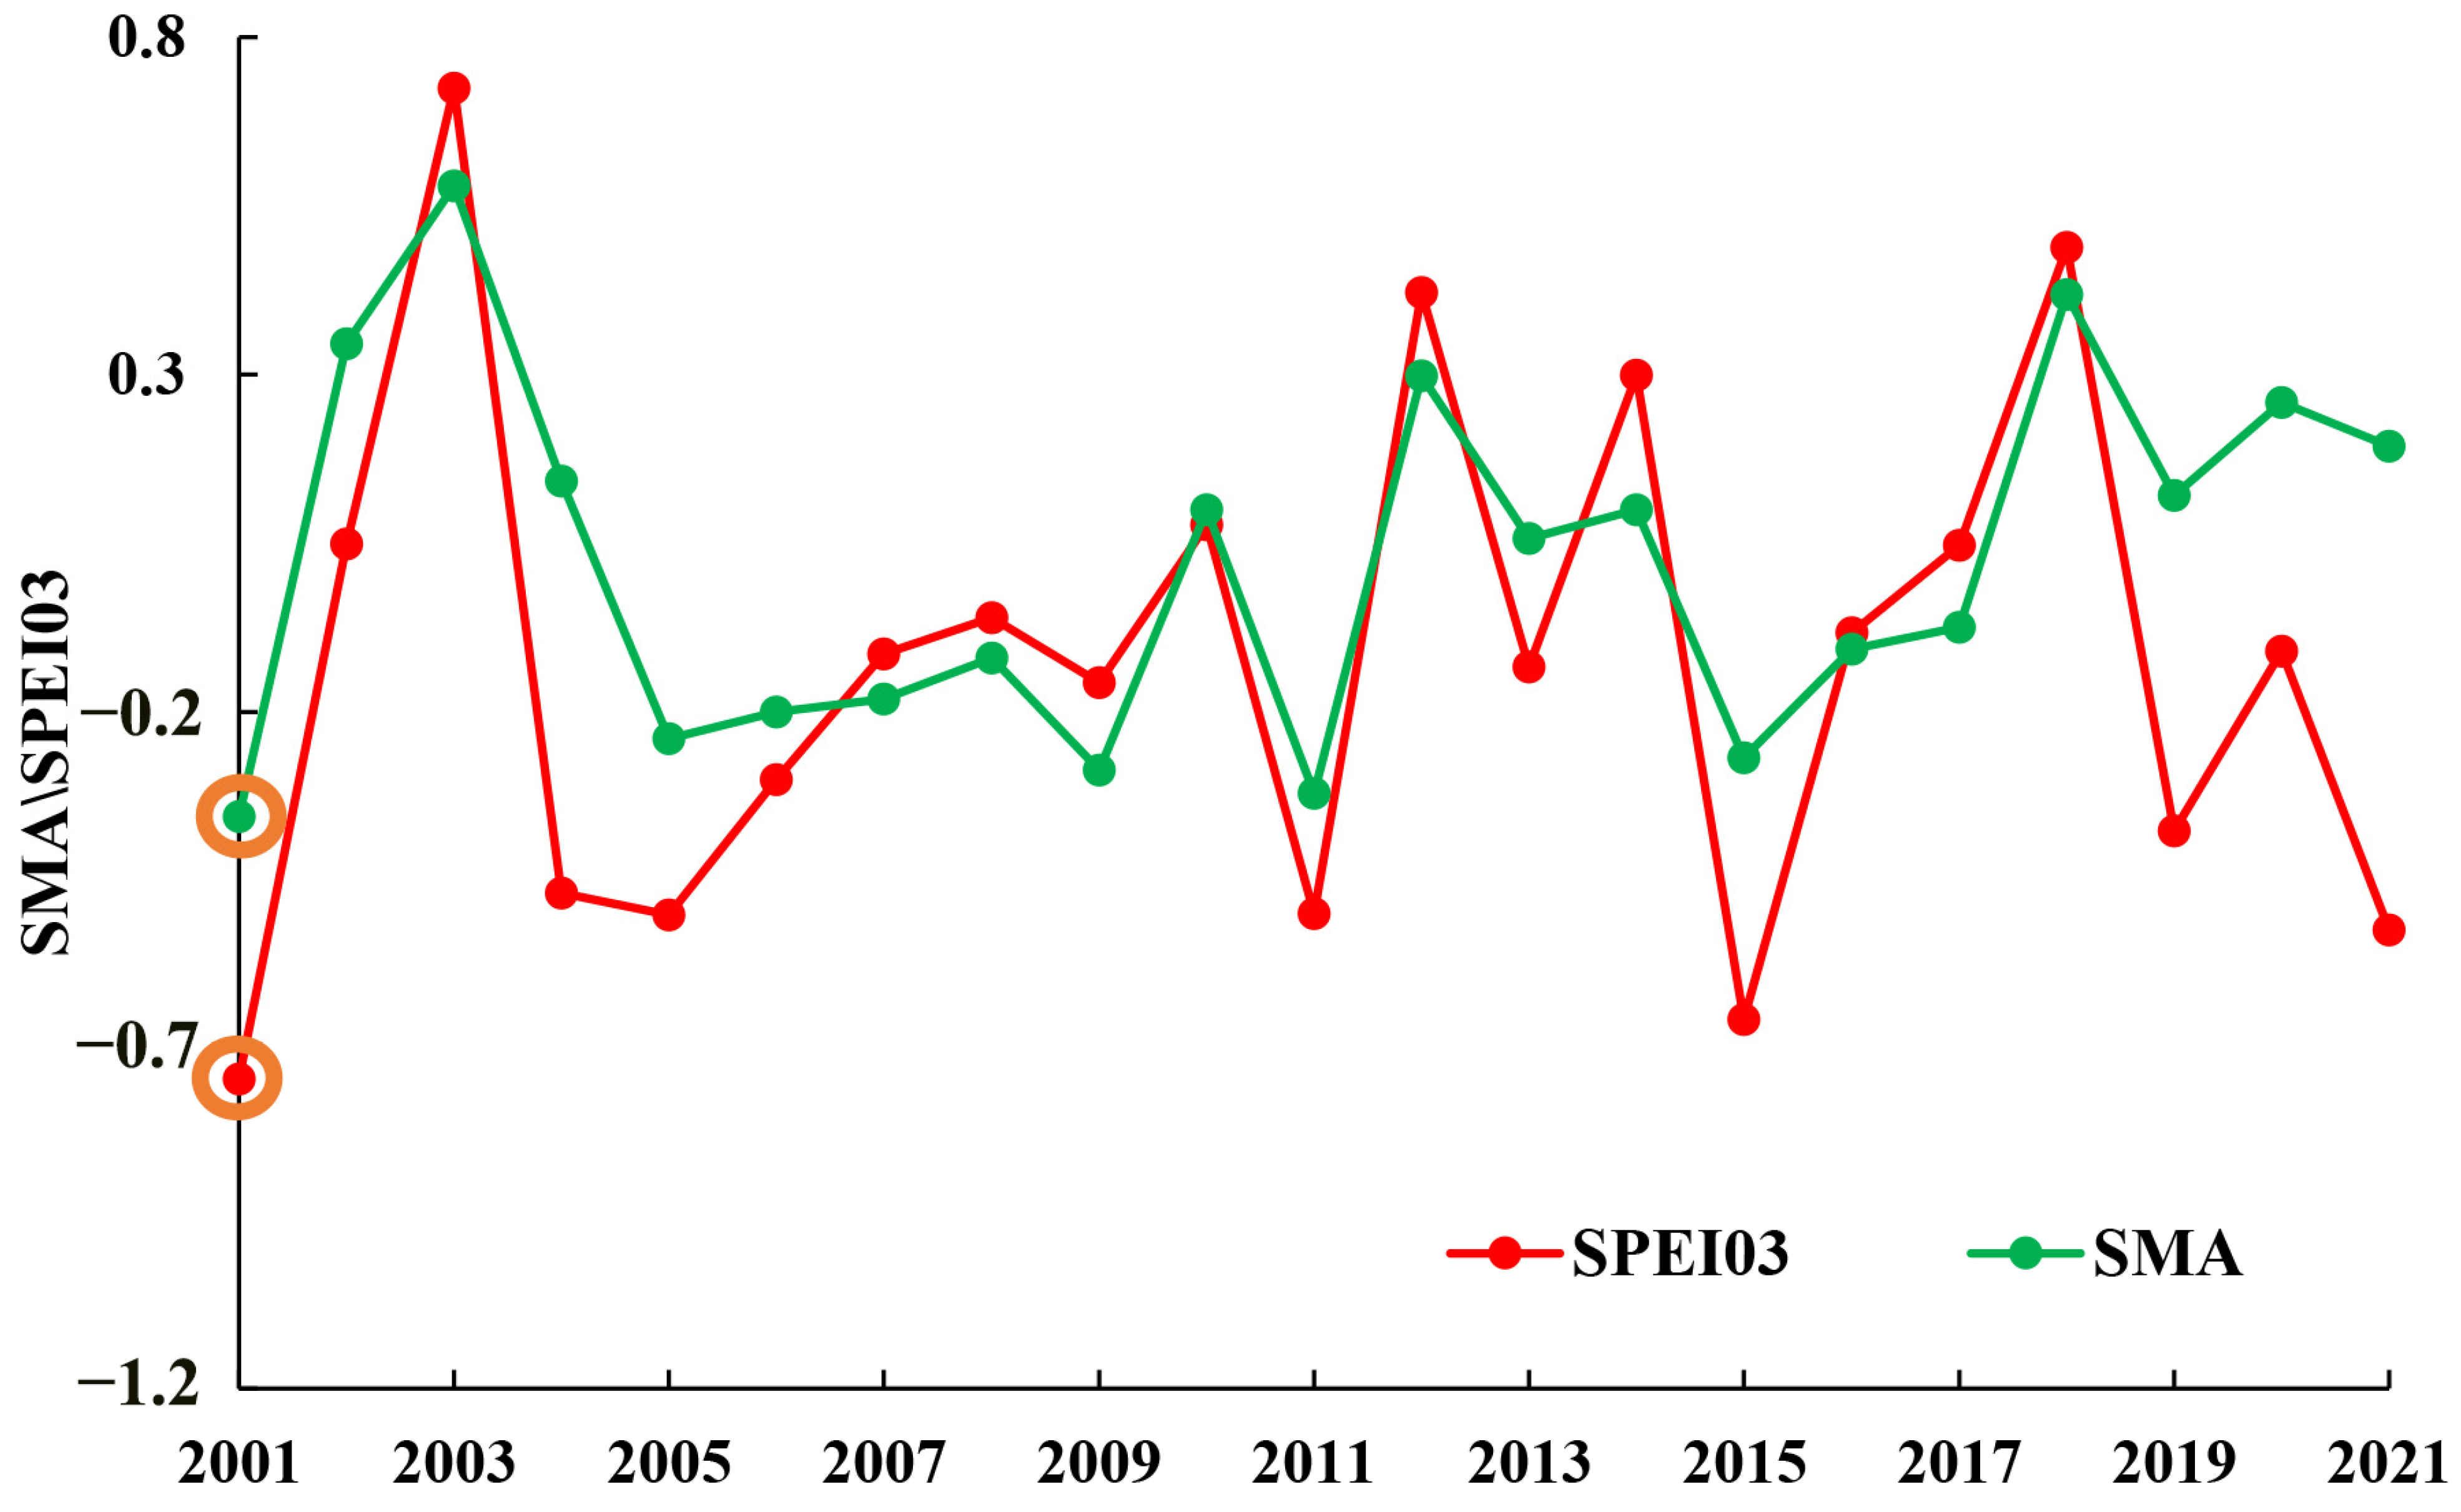
3.2.1. Evaluation Based on SMA

Since soil moisture is a crucial variable for monitoring drought condition, SMA was used to access the performance of VHIopt [36]. Figure 3 indicates a significant improvement in the correlation coefficient between VHIopt and SMA across all vegetation types compared to VHIori, with an overall increase of 0.03 in the vegetation area. Specifically, R increased by 0.09, 0.02, and 0.03 in forest, grassland, and changing vegetation areas, respectively. The R for farmland did not improve due to the limited extent of farmland vegetation in the YRB and its susceptibility to human influence. Additionally, both RB and RMSE showed significant decreases, RB between VHIopt and SMA decreased by 0.04, 0.04, 0.05, 0.01, and 0.03 in forest, grassland, farmland, varied vegetation types, and all vegetation types, respectively. RMSE of VHIopt and SMA decreased by 0.02, 0.03, 0.01, 0.04, and 0.02 in forest, grassland, farmland, changed vegetation type, and all vegetation types, respectively. Taking into account the accuracy of various SM data, we compared VHIopt with the SM data from the global land evaporation Amsterdam model (GLEAM). The verification results demonstrated that VHIopt outperforms VHIori overall (Figure A2), which is consistent with the findings presented in Figure 3. It can be seen that VHIopt can better reflect the abnormal situation of soil moisture than VHIori.

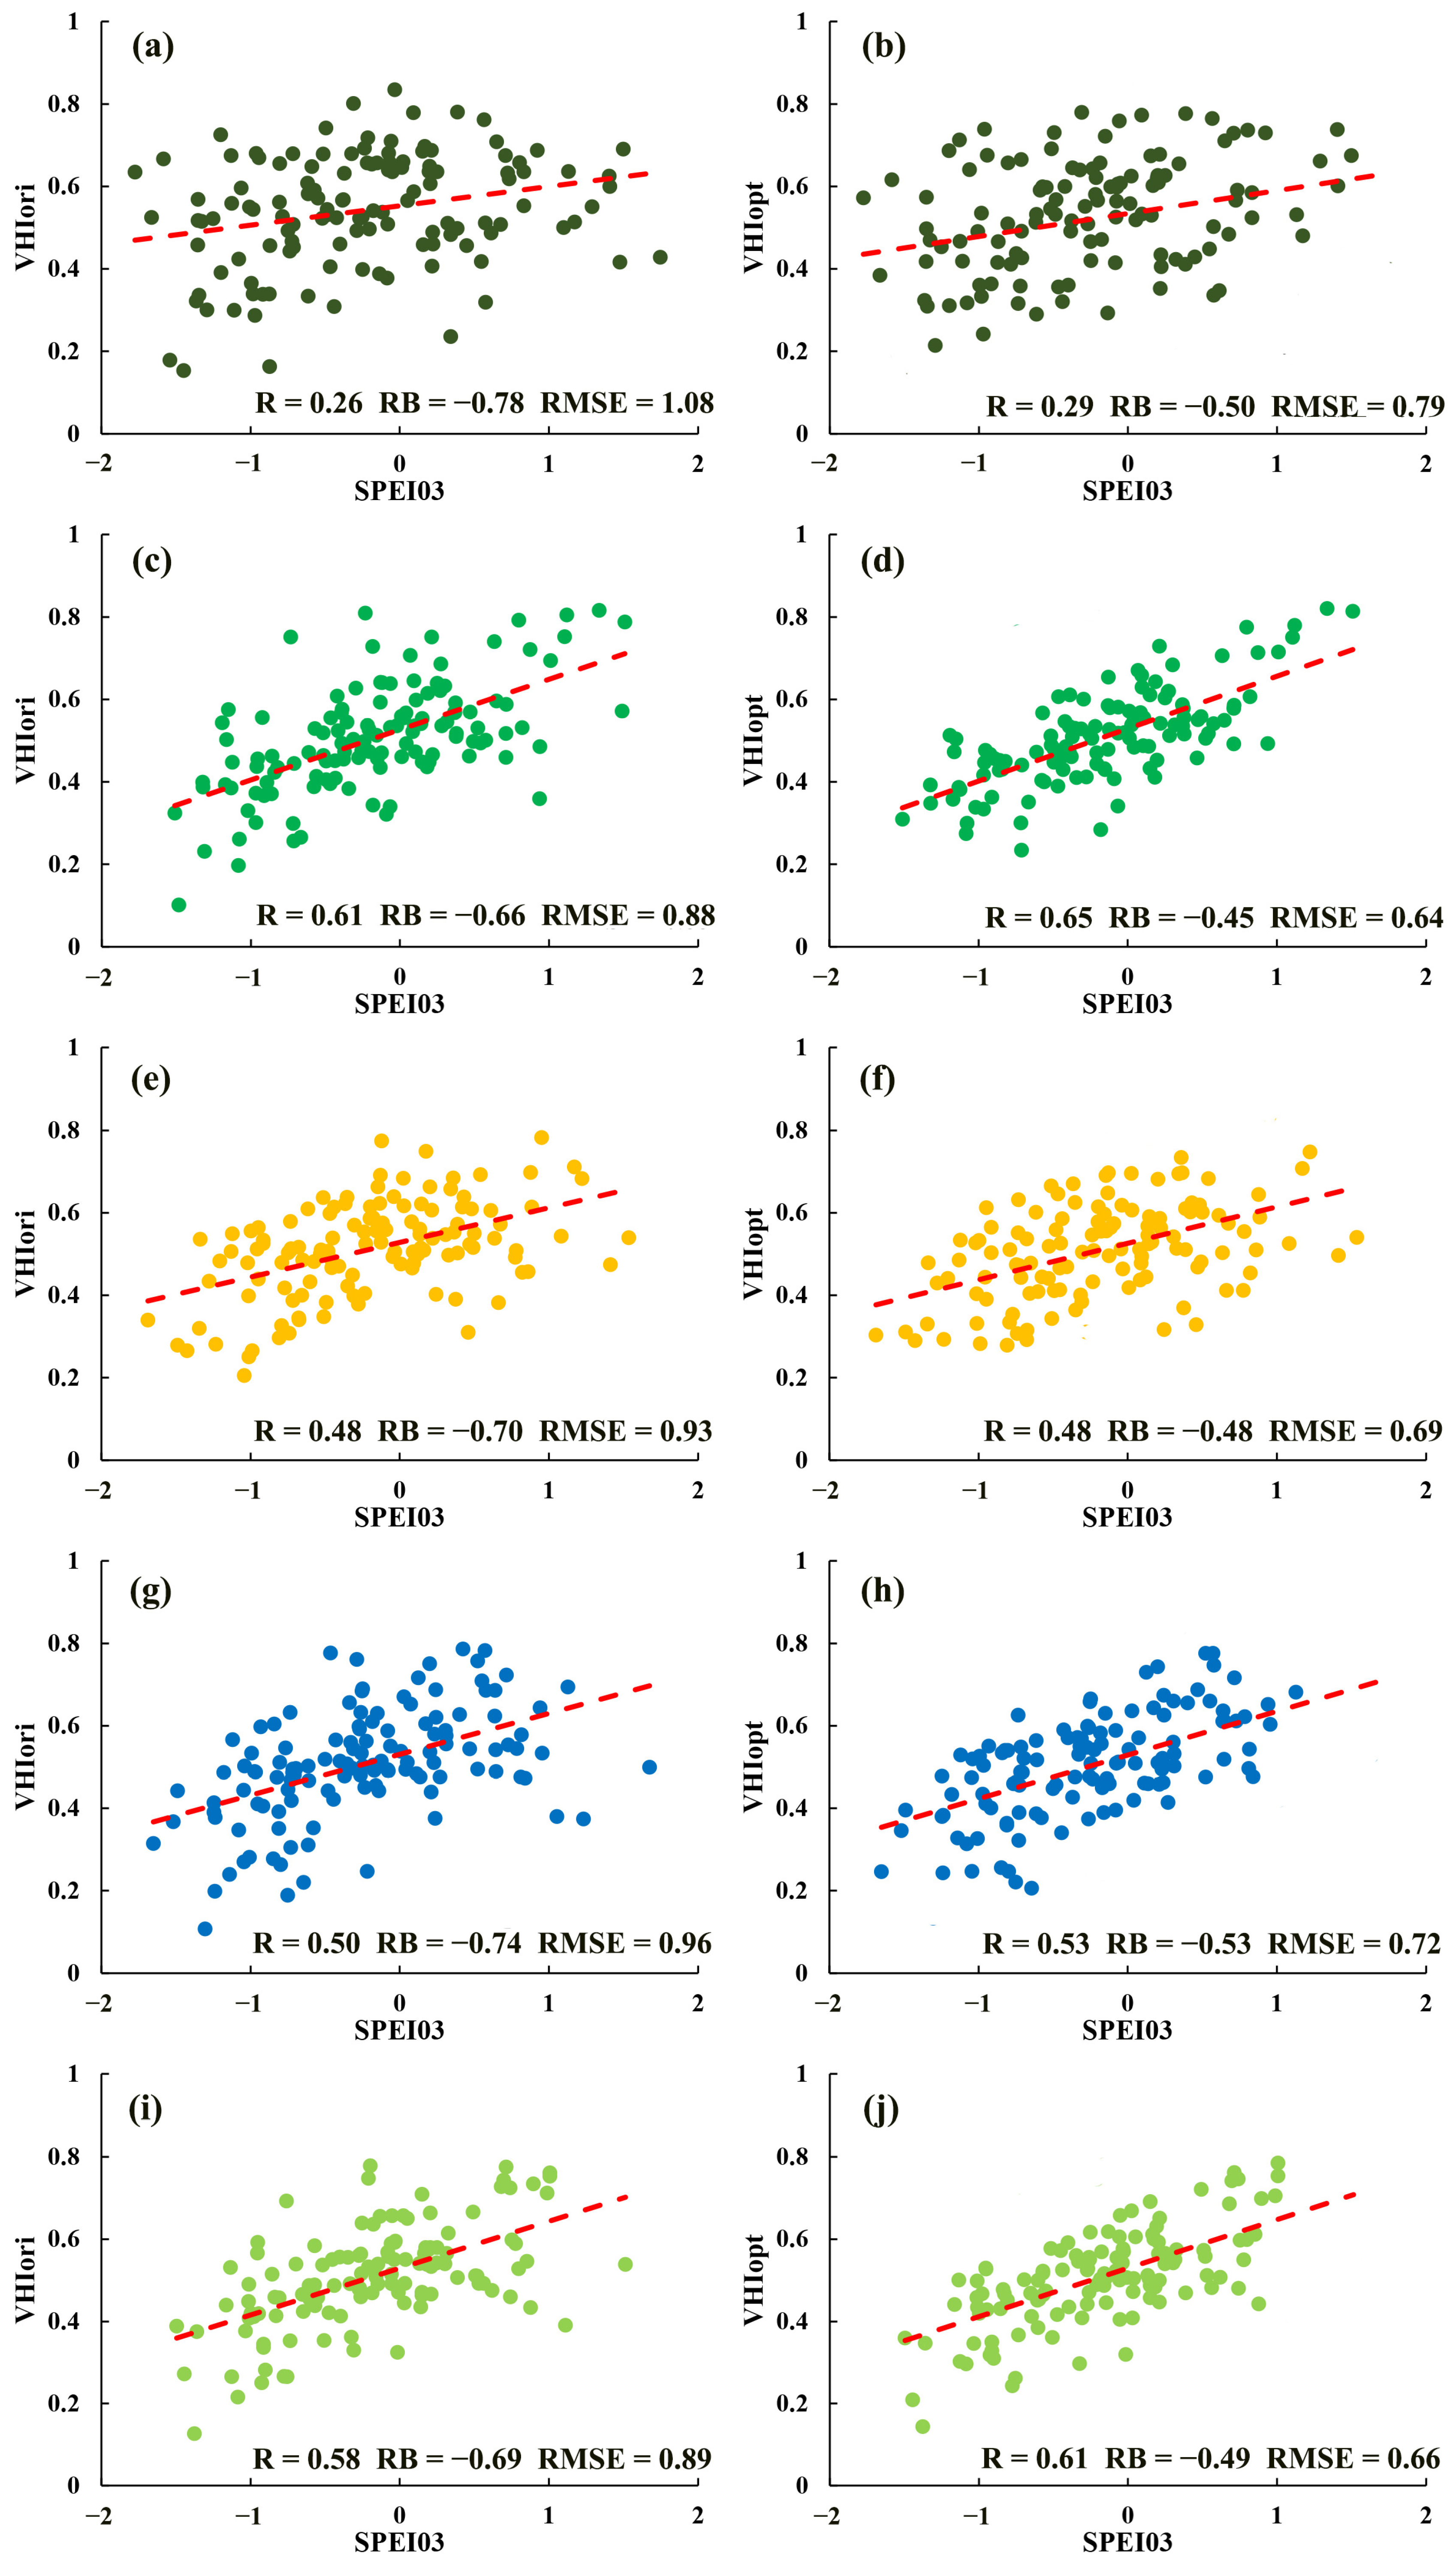
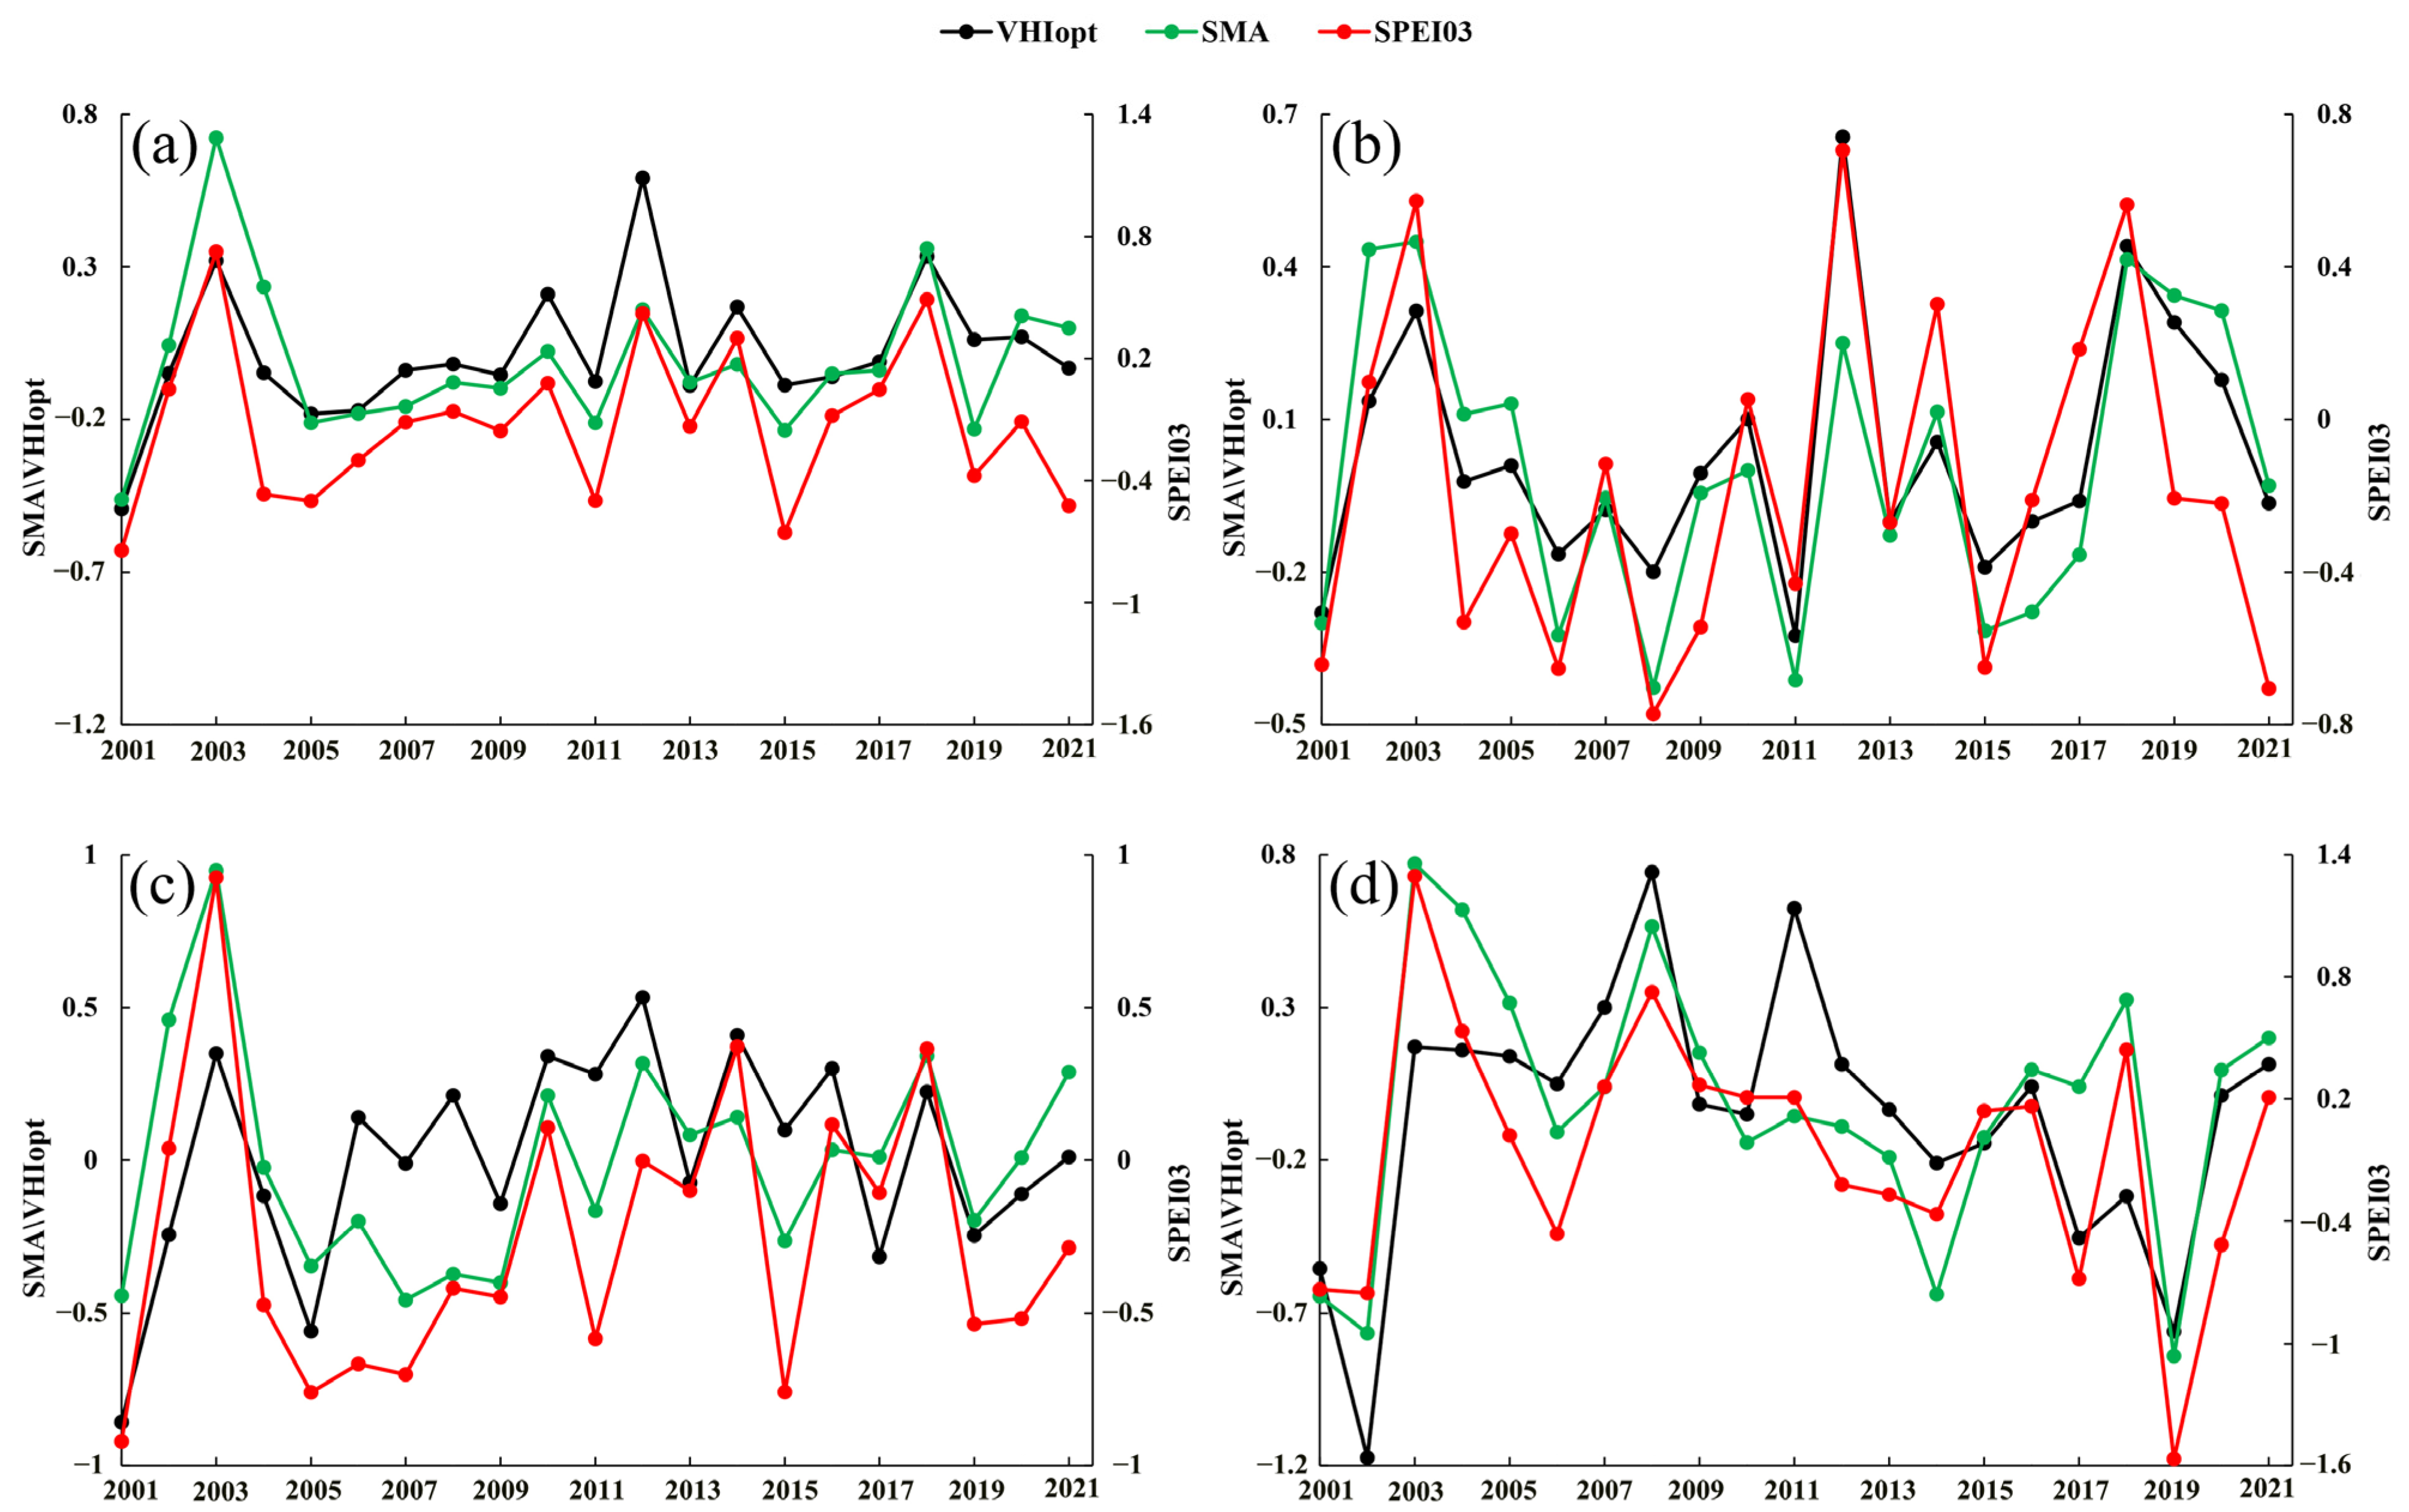
3.2.2. Evaluation Based on SPEI03

SPEI03 is well-suited for studying vegetation drought. To further evaluate the performance of VHIopt, it was compared with SPEI03 using R, RB, and RMSE. Figure A3 presents a scatter plot of SPEI03 versus VHIori and VHIopt. The figure shows that compared to VHIori, VHIopt demonstrates a significant increase in the correlation coefficient with SPEI03 across most vegetation types, with the exception of farmland. Specifically, the overall correlation coefficient in the YRB increased by 0.03, with improvements of 0.03 and 0.04 in forest and grassland areas, respectively. The R for farmland did not improve due to the limited extent of farmland vegetation in the YRB and its susceptibility to human influence. The RB between VHIopt and SMA decreased by 0.28, 0.21,0.22, 0.21, and 0.20 in forest, grassland, farmland, changing vegetation types, and total vegetation, respectively. Similarly, the RMSE between VHIopt and SMA decreased by 0.29, 0.24, 0.24, 0.24, and 0.23 for the same categories. These results indicate that VHIopt is more effective than VHIori in capturing variations in precipitation and temperature.
Using the detrended VHIopt, SPEI03, and SMA, we constructed annual time series charts for the YRB and its upstream, midstream, and downstream from 2001 to 2021 to analyze the volatility of these indices more accurately. Figure 4 illustrates that VHIopt, SPEI03, and SMA exhibit similar temporal patterns across the YRB, its upstream, and midstream over the past 21 years. This consistency in annual fluctuations among the three indices further confirms that VHIopt effectively reflects the trends in agricultural drought within the YRB.

3.2.3. Verification of Typical Drought Years

The validation of the drought index using the typical drought year is crucial for ensuring its accuracy and reliability in drought monitoring. For instance, Guo et al. selected 2008 as a representative drought year for evaluating the performance of OSDCI_rev in Central Asia [36]; Cao et al. selected 2001 and 2011 as dry years to evaluate various GPP datasets in China [53]. Throughout the study period, the YRB has experienced several droughts. To identify a typical year for monitoring drought evolution, the year with the lowest values of SPEI03 and SMA were selected [33,78,79]. As shown in Figure A4, SPEI03 values were lowest in 2001, 2009, and 2011, while SMA values were lowest in 2001, 2011, and 2019. Significantly, 2001 had the lowest values for both SPEI03 and SMA. Therefore, 2001 was chosen as a representative drought year to validate the accuracy of VHIopt in monitoring drought conditions.
Figure 5 illustrates that the VHIopt anomalies reveal a gradual spread of agricultural drought across the YRB from April to July, with the most severe drought conditions occurring in July. Subsequently, the drought conditions began to ease between July and September. Moreover, the spatial distribution pattern of agricultural drought monitored by SMA and SPEI03 is largely consistent with that monitored by VHIopt. In order to further evaluate the enhancement of VHIopt on time series, the changes in the VHIopt for 2001 were compared with those of SPEI03 and SMA. As shown in Figure 6, during the growing season of 2001, the VHIopt initially decreased, reached its lowest value in July, and then increased. This pattern aligns with the results in Figure 5, which indicate that the overall drought conditions in 2001 gradually eased. The time series of VHIopt aligns well with both SMA and SPEI03, demonstrating that VHIopt effectively captures the temporal variations and trends in agricultural drought.

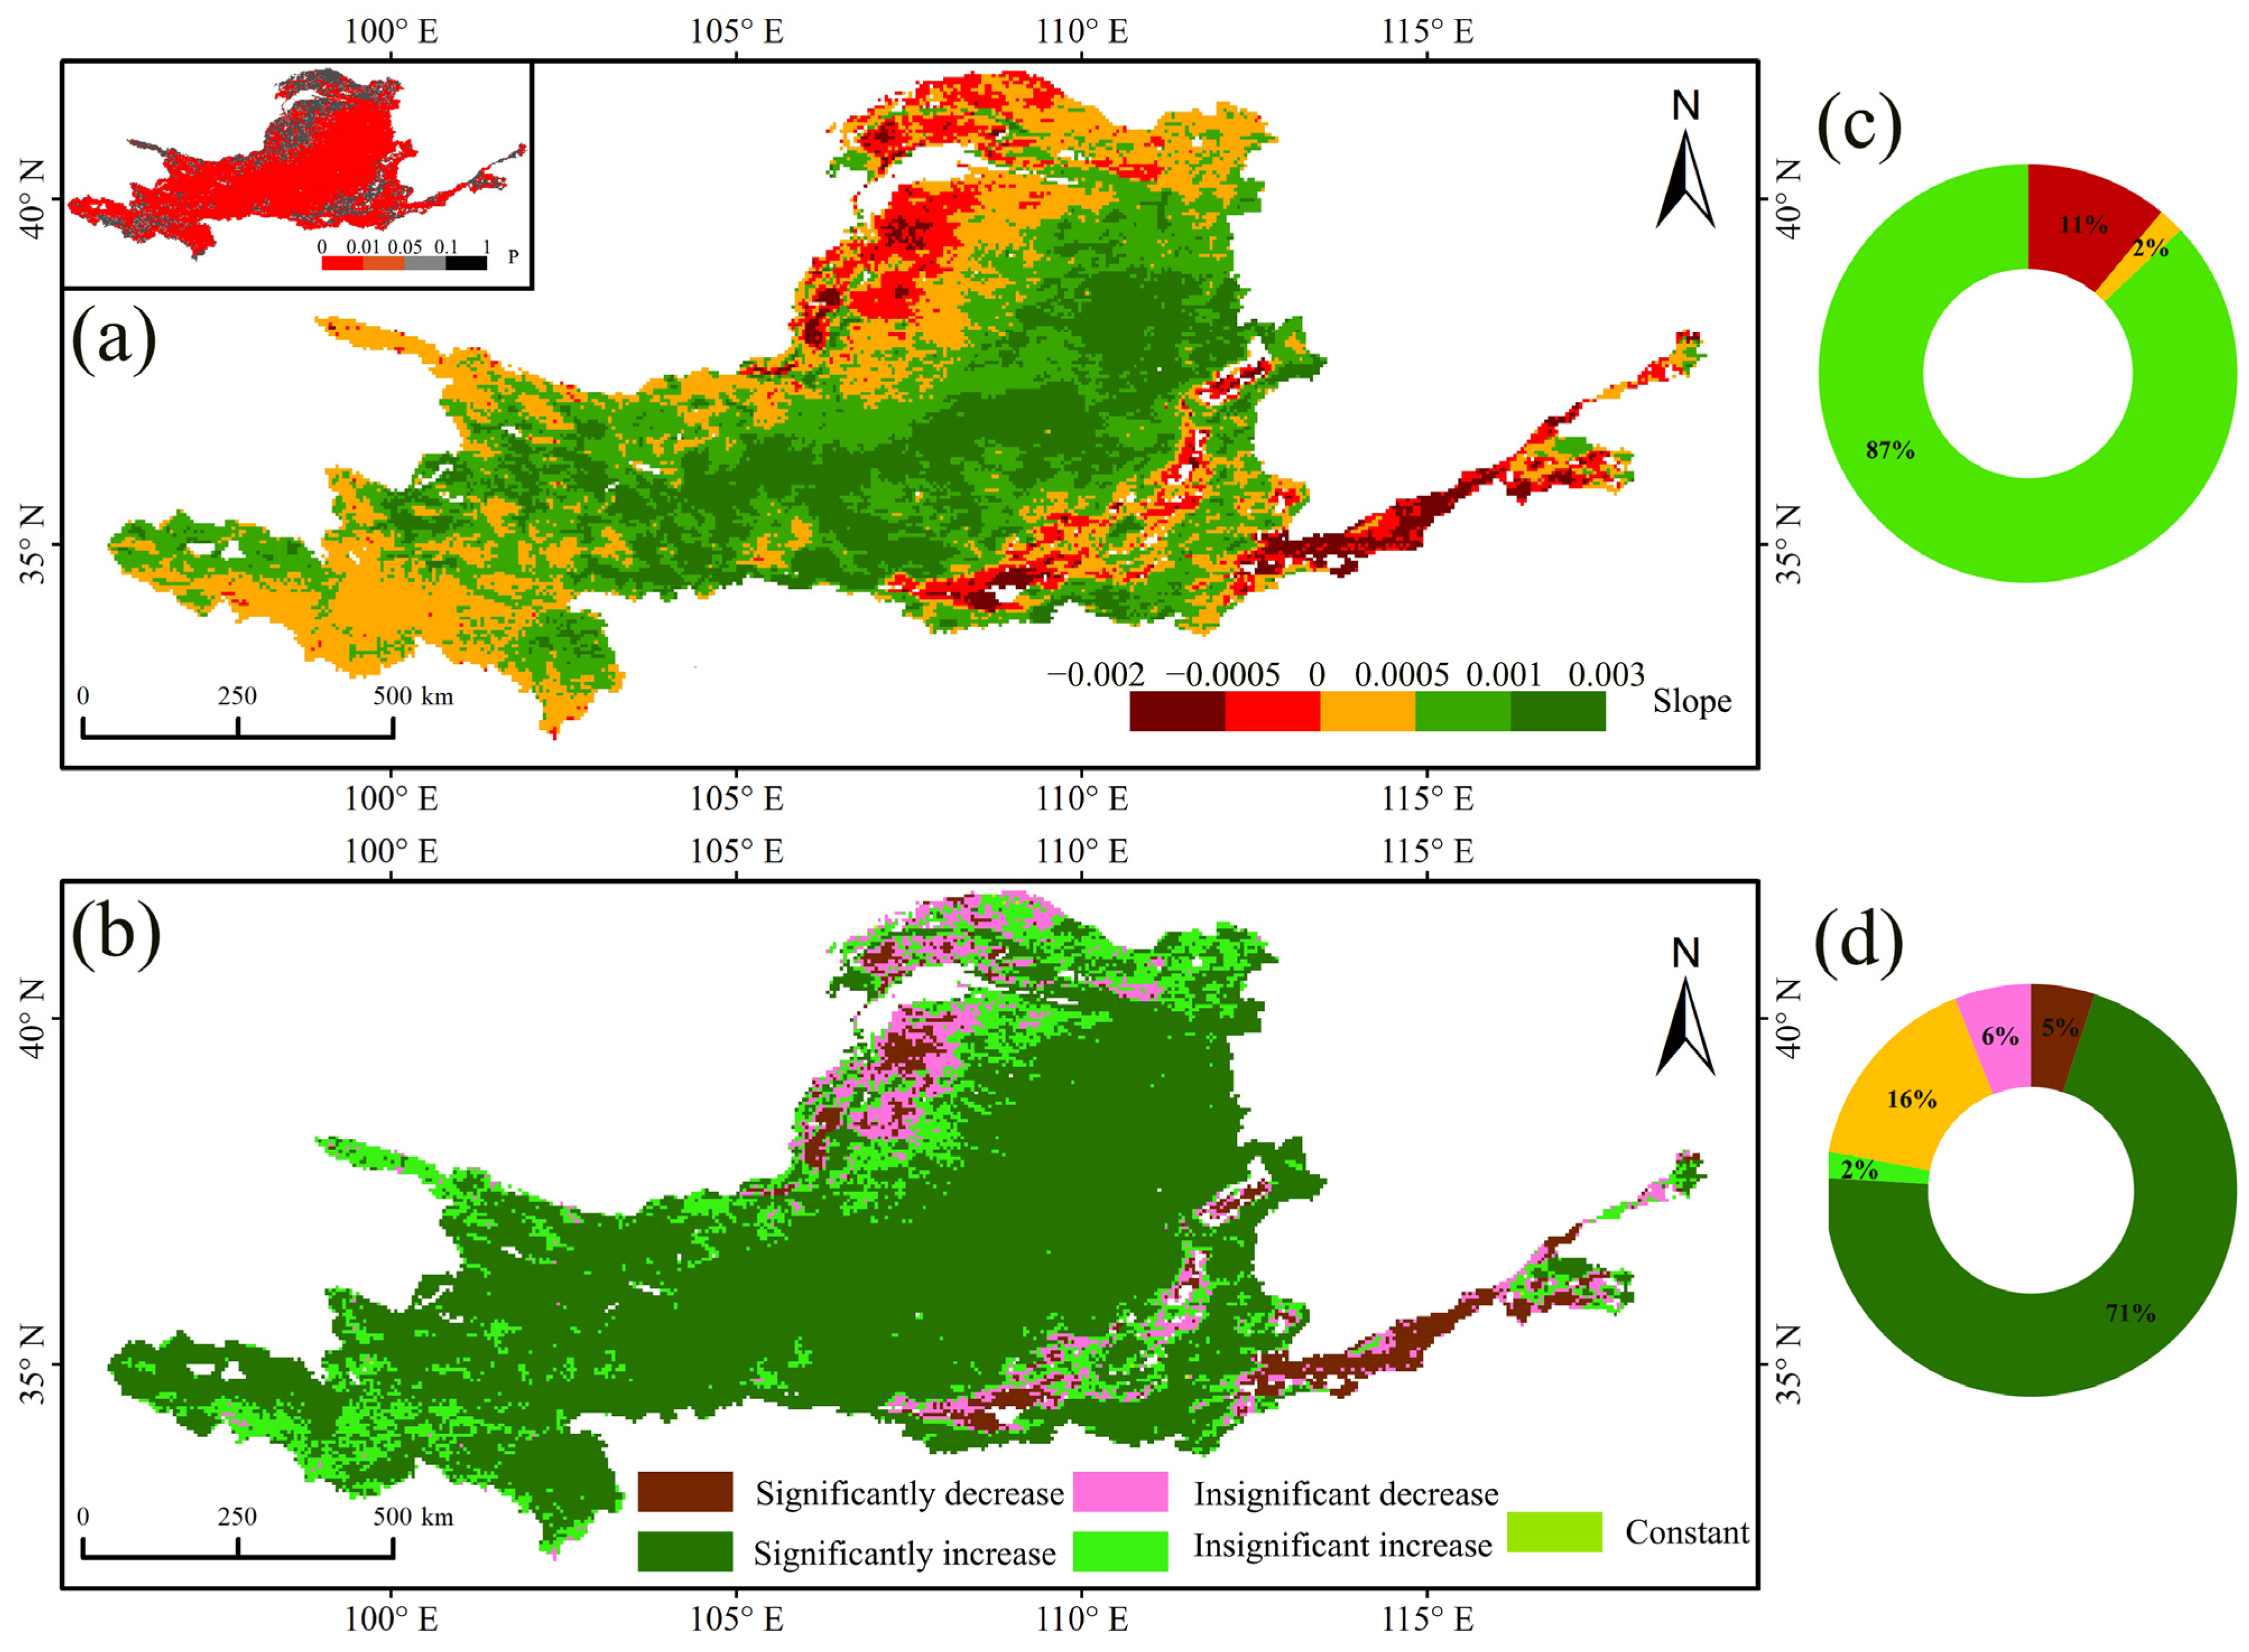
3.3. Spatial and Temporal Evolution Trend of Drought in YRB Based on VHIopt

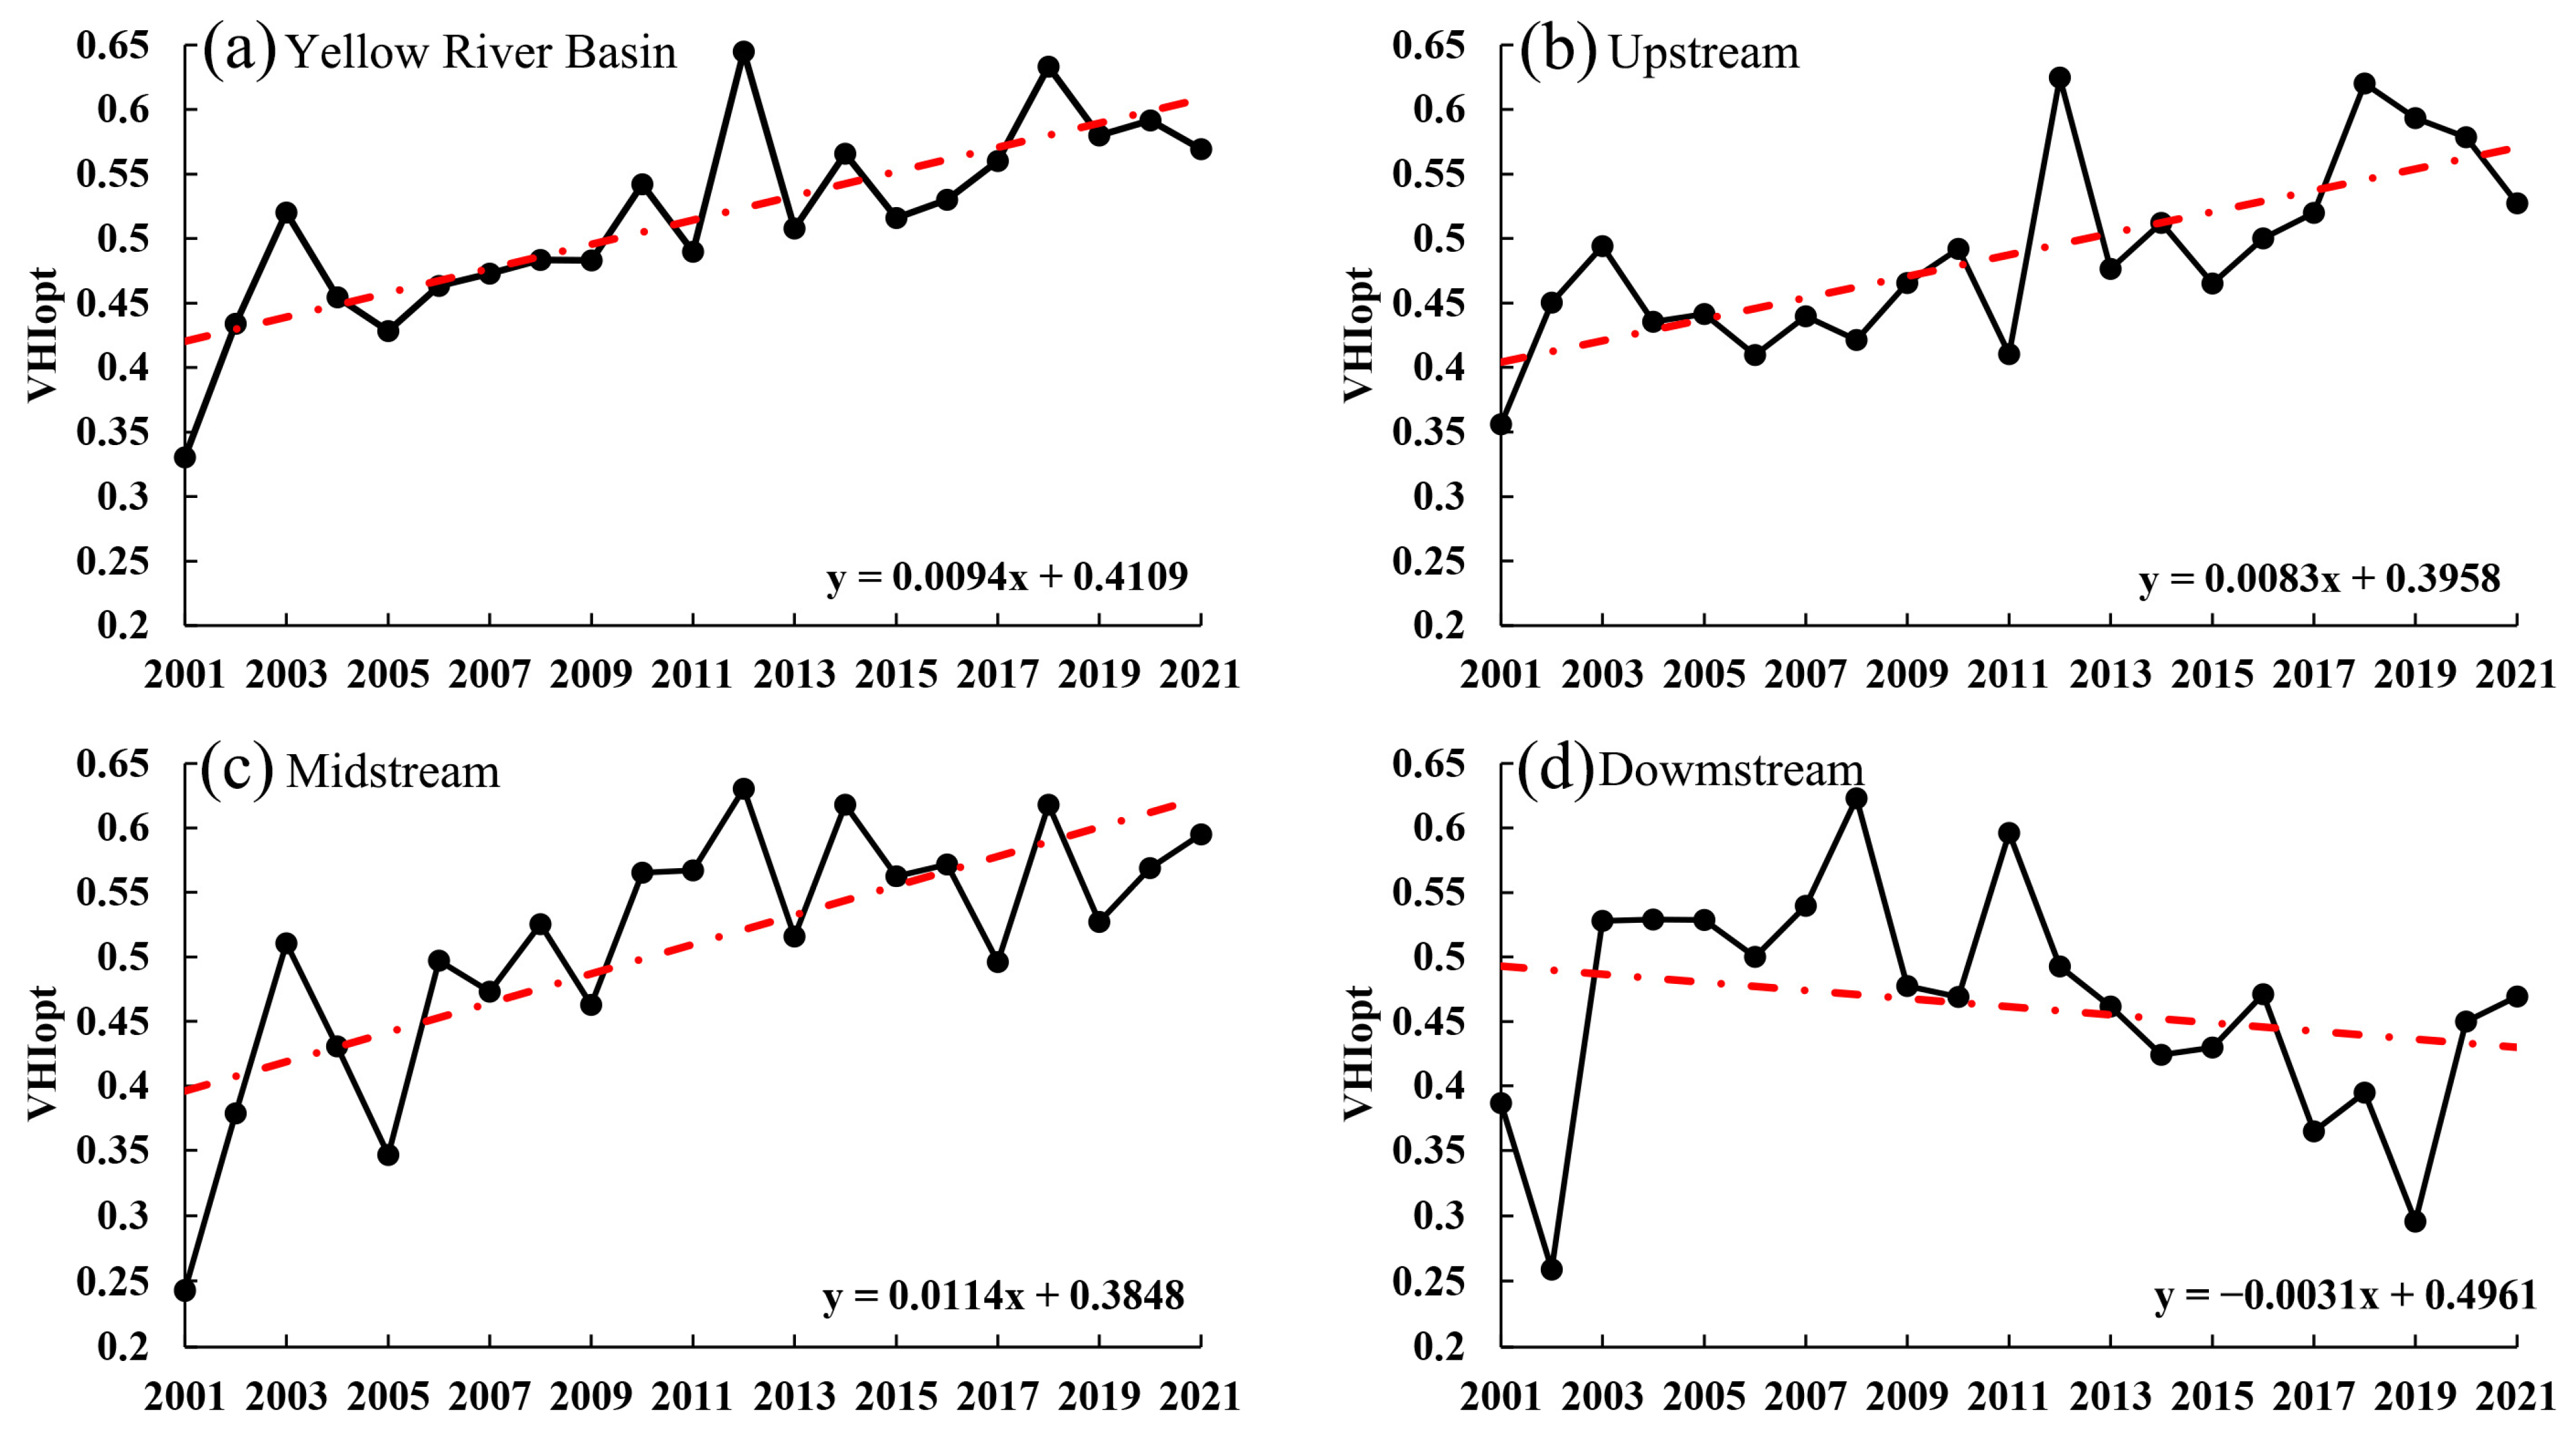
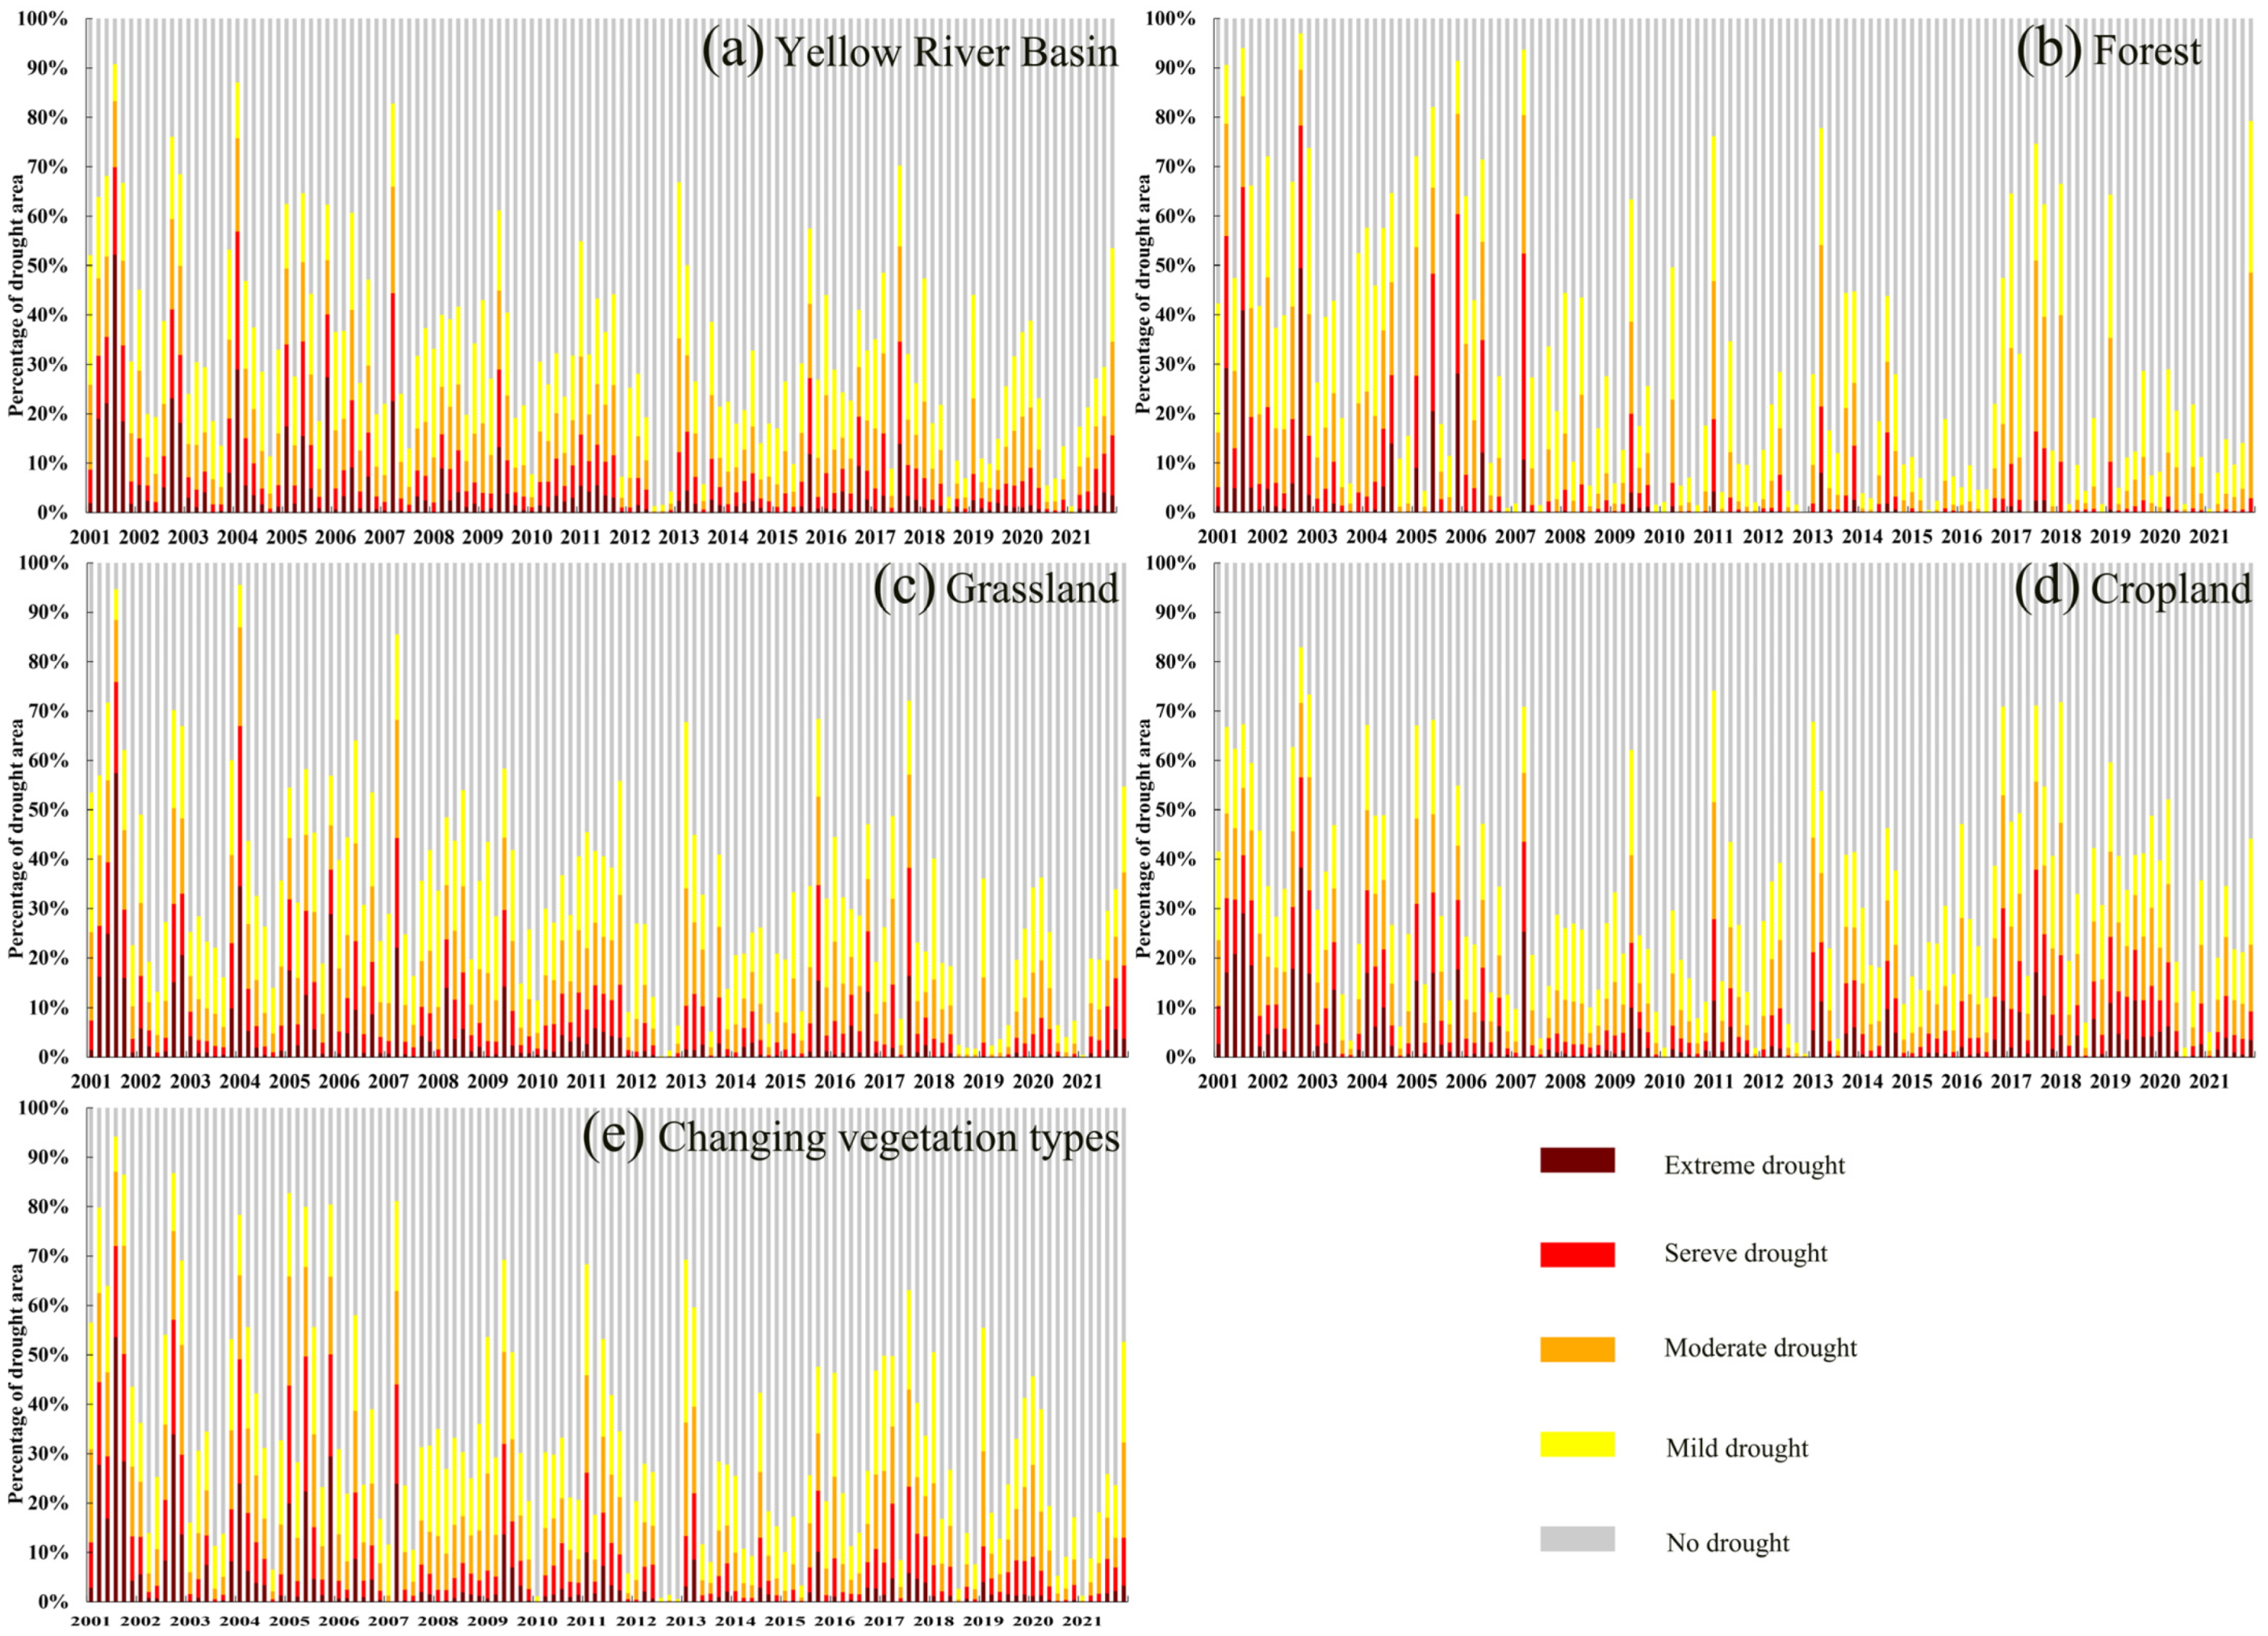
3.3.1. Analysis of Drought Time Variation

Analyzing the temporal evolution of drought is essential for understanding the dynamics of drought changes. The annual mean VHIopt is employed to examine the temporal variation of droughts in the YRB. Figure 7a shows that VHIopt fluctuated between 0.3 and 0.65 in the YRB from 2001 to 2021. The index displayed significant changes between 2001 and 2005, as well as from 2011 to 2013. In contrast, the changes were insignificant from 2006 to 2009 and from 2019 to 2020. Overall, the VHIopt trend in the YRB displayed a positive slope of 0.0094, indicating a weakening of drought conditions. Figure 7b–d present the VHIopt time series for the upstream, midstream, and downstream of the YRB, respectively. All three regions demonstrated substantial volatility in VHIopt, with the downstream showing the greatest fluctuation. Notably, the minimum values of VHIopt in the upstream and midstream align with those in the YRB, both occurring in 2012. The VHIopt trends in the upstream and midstream showed upward slopes of 0.0083 and 0.0114, respectively, indicating a weakening of drought conditions in these areas. Conversely, the VHIopt trend in the downstream displayed a downward slope of −0.0031, suggesting a worsening of drought conditions in the downstream, which can be ascribed to factors including rapid urban expansion, the greenhouse effect, and rising temperatures, which further exacerbate agricultural drought [80,81,82]. Significantly, VHIopt values for the YRB and its upstream, midstream, and downstream increased significantly in 2003, indicating a marked alleviation of drought conditions in that year. This improvement may be associated with various factors, such as increased precipitation, temperature changes, and human interventions in water resource management and ecological restoration measures [83,84,85].
Arid area is not only a significant characteristic of drought but also a vital indicator for evaluating the severity of drought conditions. To further understand the temporal evolution of drought, we calculated the percentage changes in drought areas at the monthly scale during the growing season for different vegetation zones and the YRB. Figure 8b–e shows that the percentage changes in drought areas for forests, grasslands, croplands, and changing vegetation types, respectively. Among them, forests exhibited the greatest fluctuation in drought areas, especially during the growing seasons of 2005, 2007, and 2021. The extreme and severe drought areas in forests were mainly concentrated between 2001 and 2007, as well as in 2009, 2011, and 2017, with most years dominated by moderate and mild drought, indicating a weaker sensitivity to drought conditions. From 2001 to 2021, the variability in drought area was smaller for grassland, cropland, and variable vegetation types compared to forests. Extreme and severe droughts occurred in grassland, cropland, and variable vegetation types, with similar proportions of extreme and severe drought areas across these three types. Extreme and severe droughts occurred in all three vegetation types, with similar proportions of extreme and severe drought areas. As illustrated in Figure 8a, the YRB exhibited the smallest fluctuation in drought areas, with extreme and severe drought occurring throughout the period from 2001 to 2021, similar to the patterns in grasslands, croplands, and changing vegetation types. Additionally, the total no drought area across forests, grasslands, croplands, changing vegetation types, and the YRB showed increased fluctuation from 2001 to 2021, indicating that drought conditions in the YRB have generally weakened.

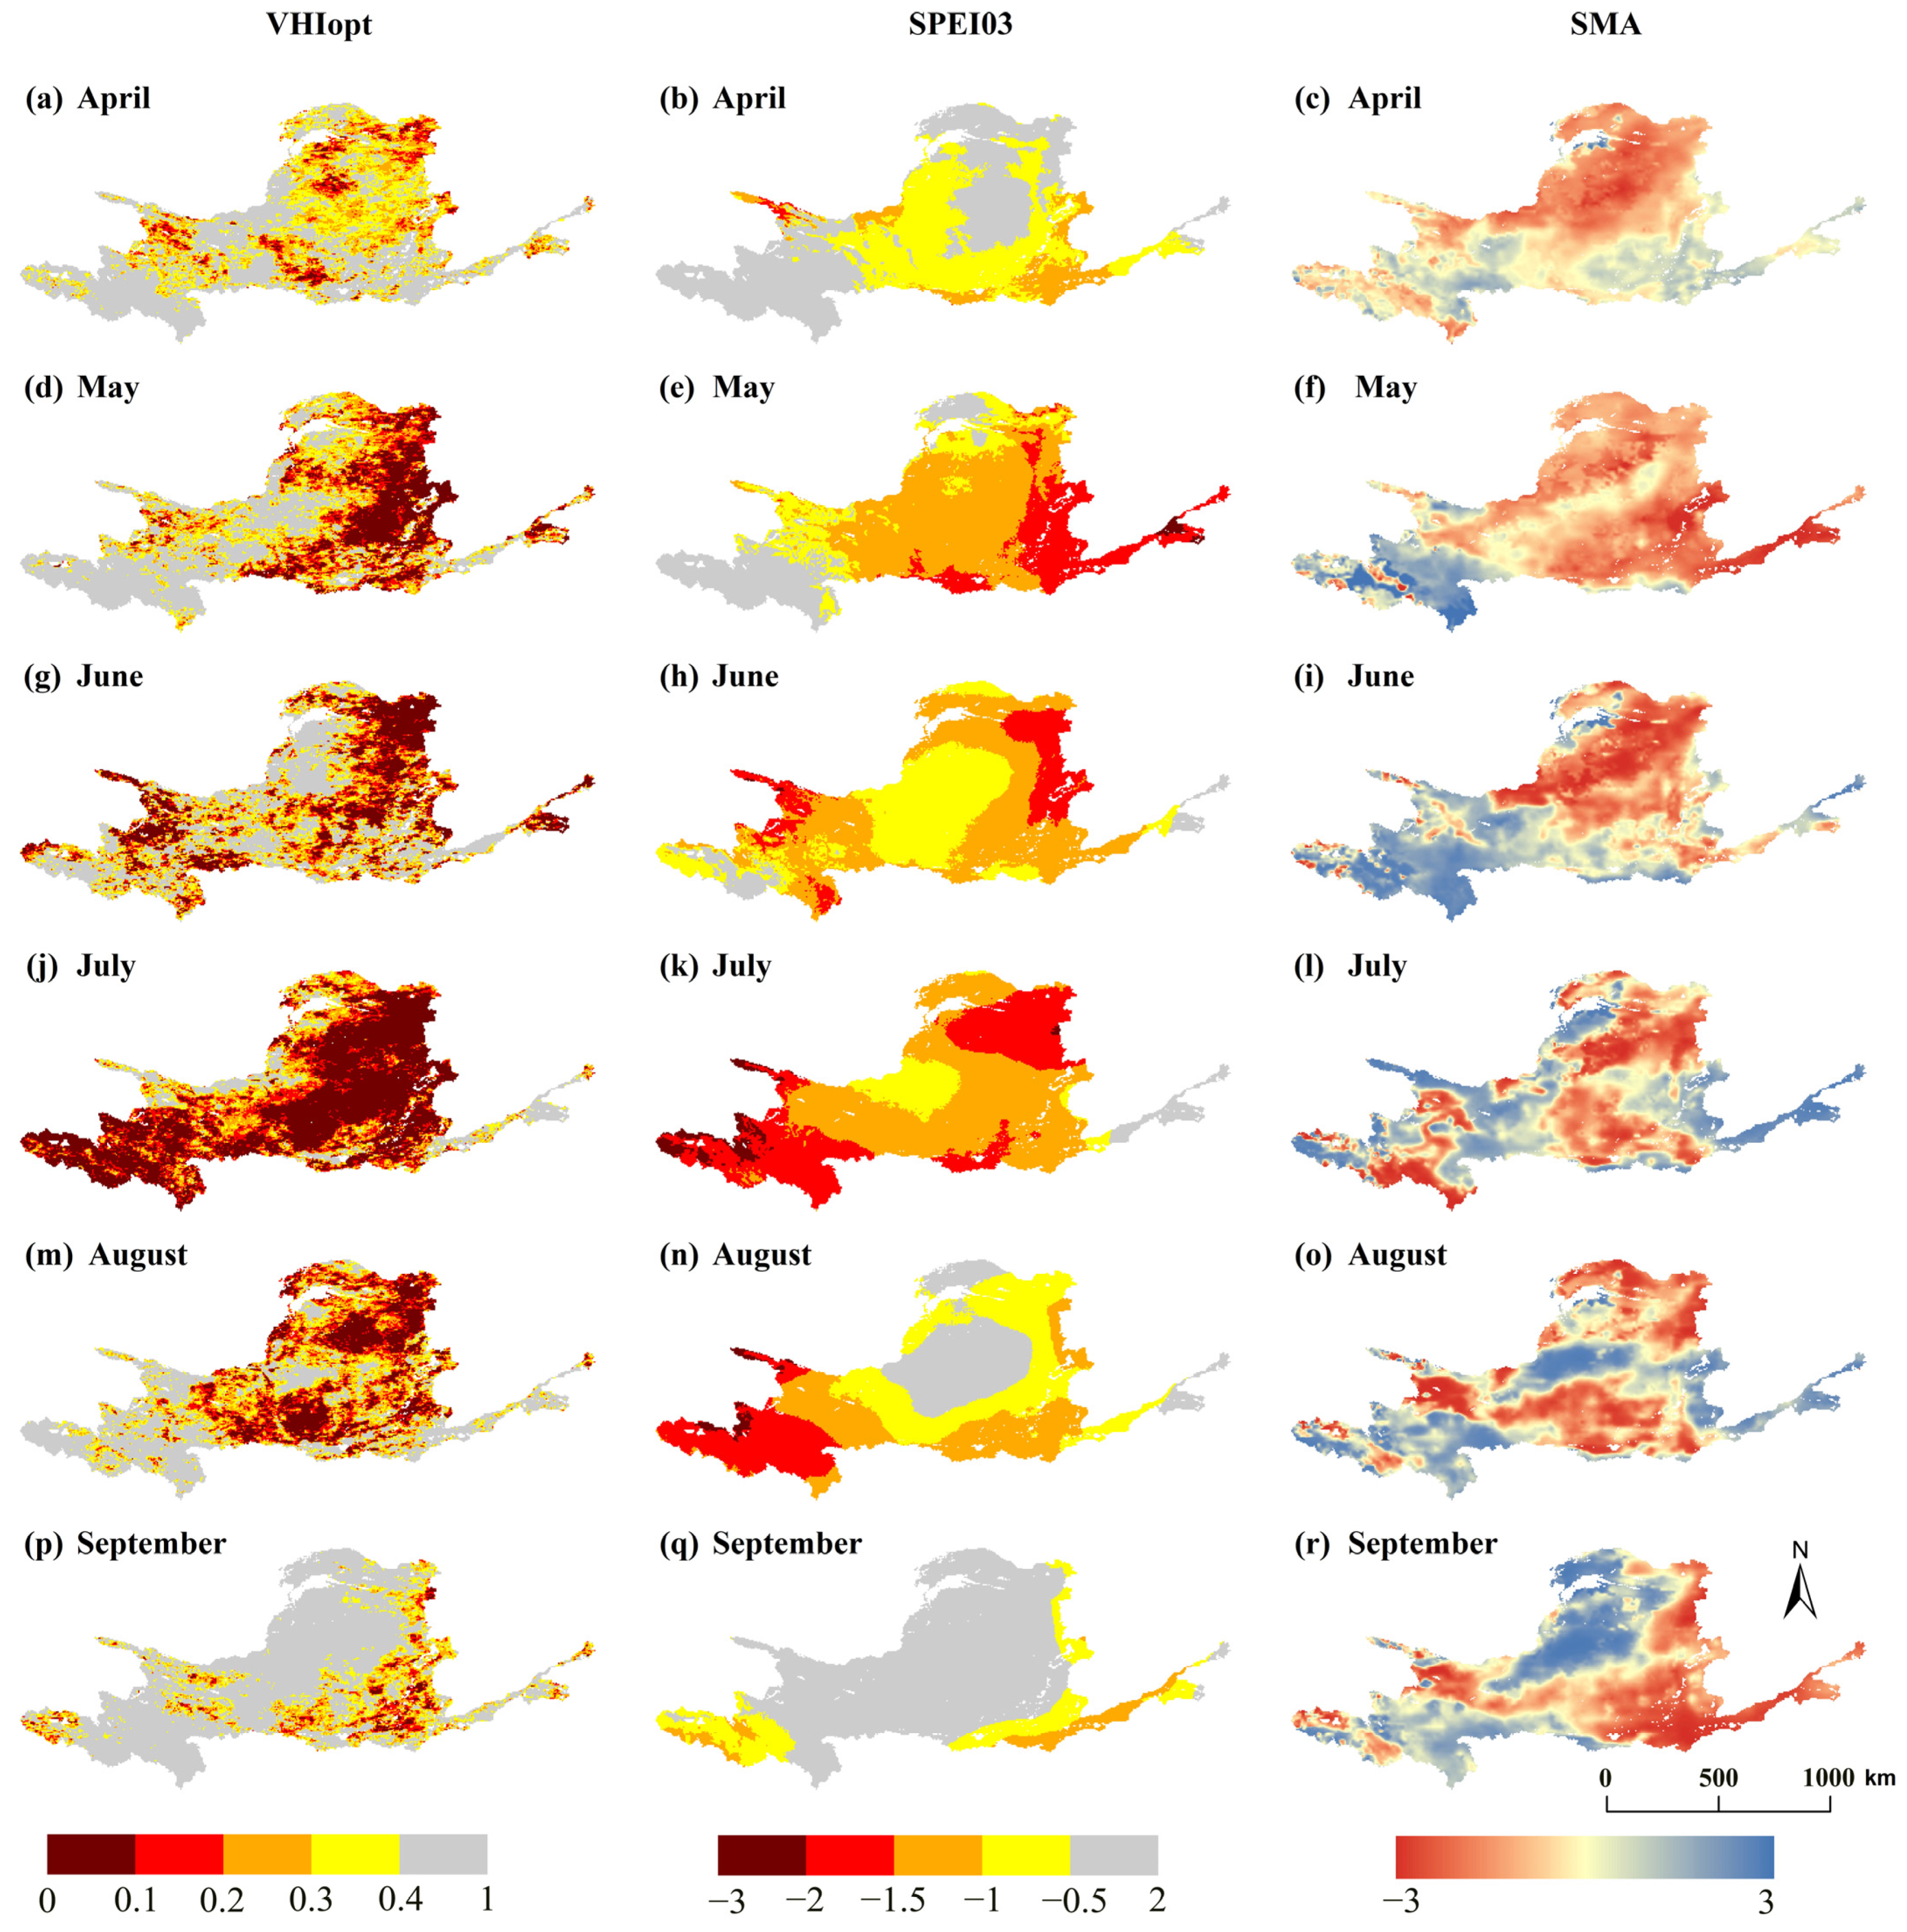
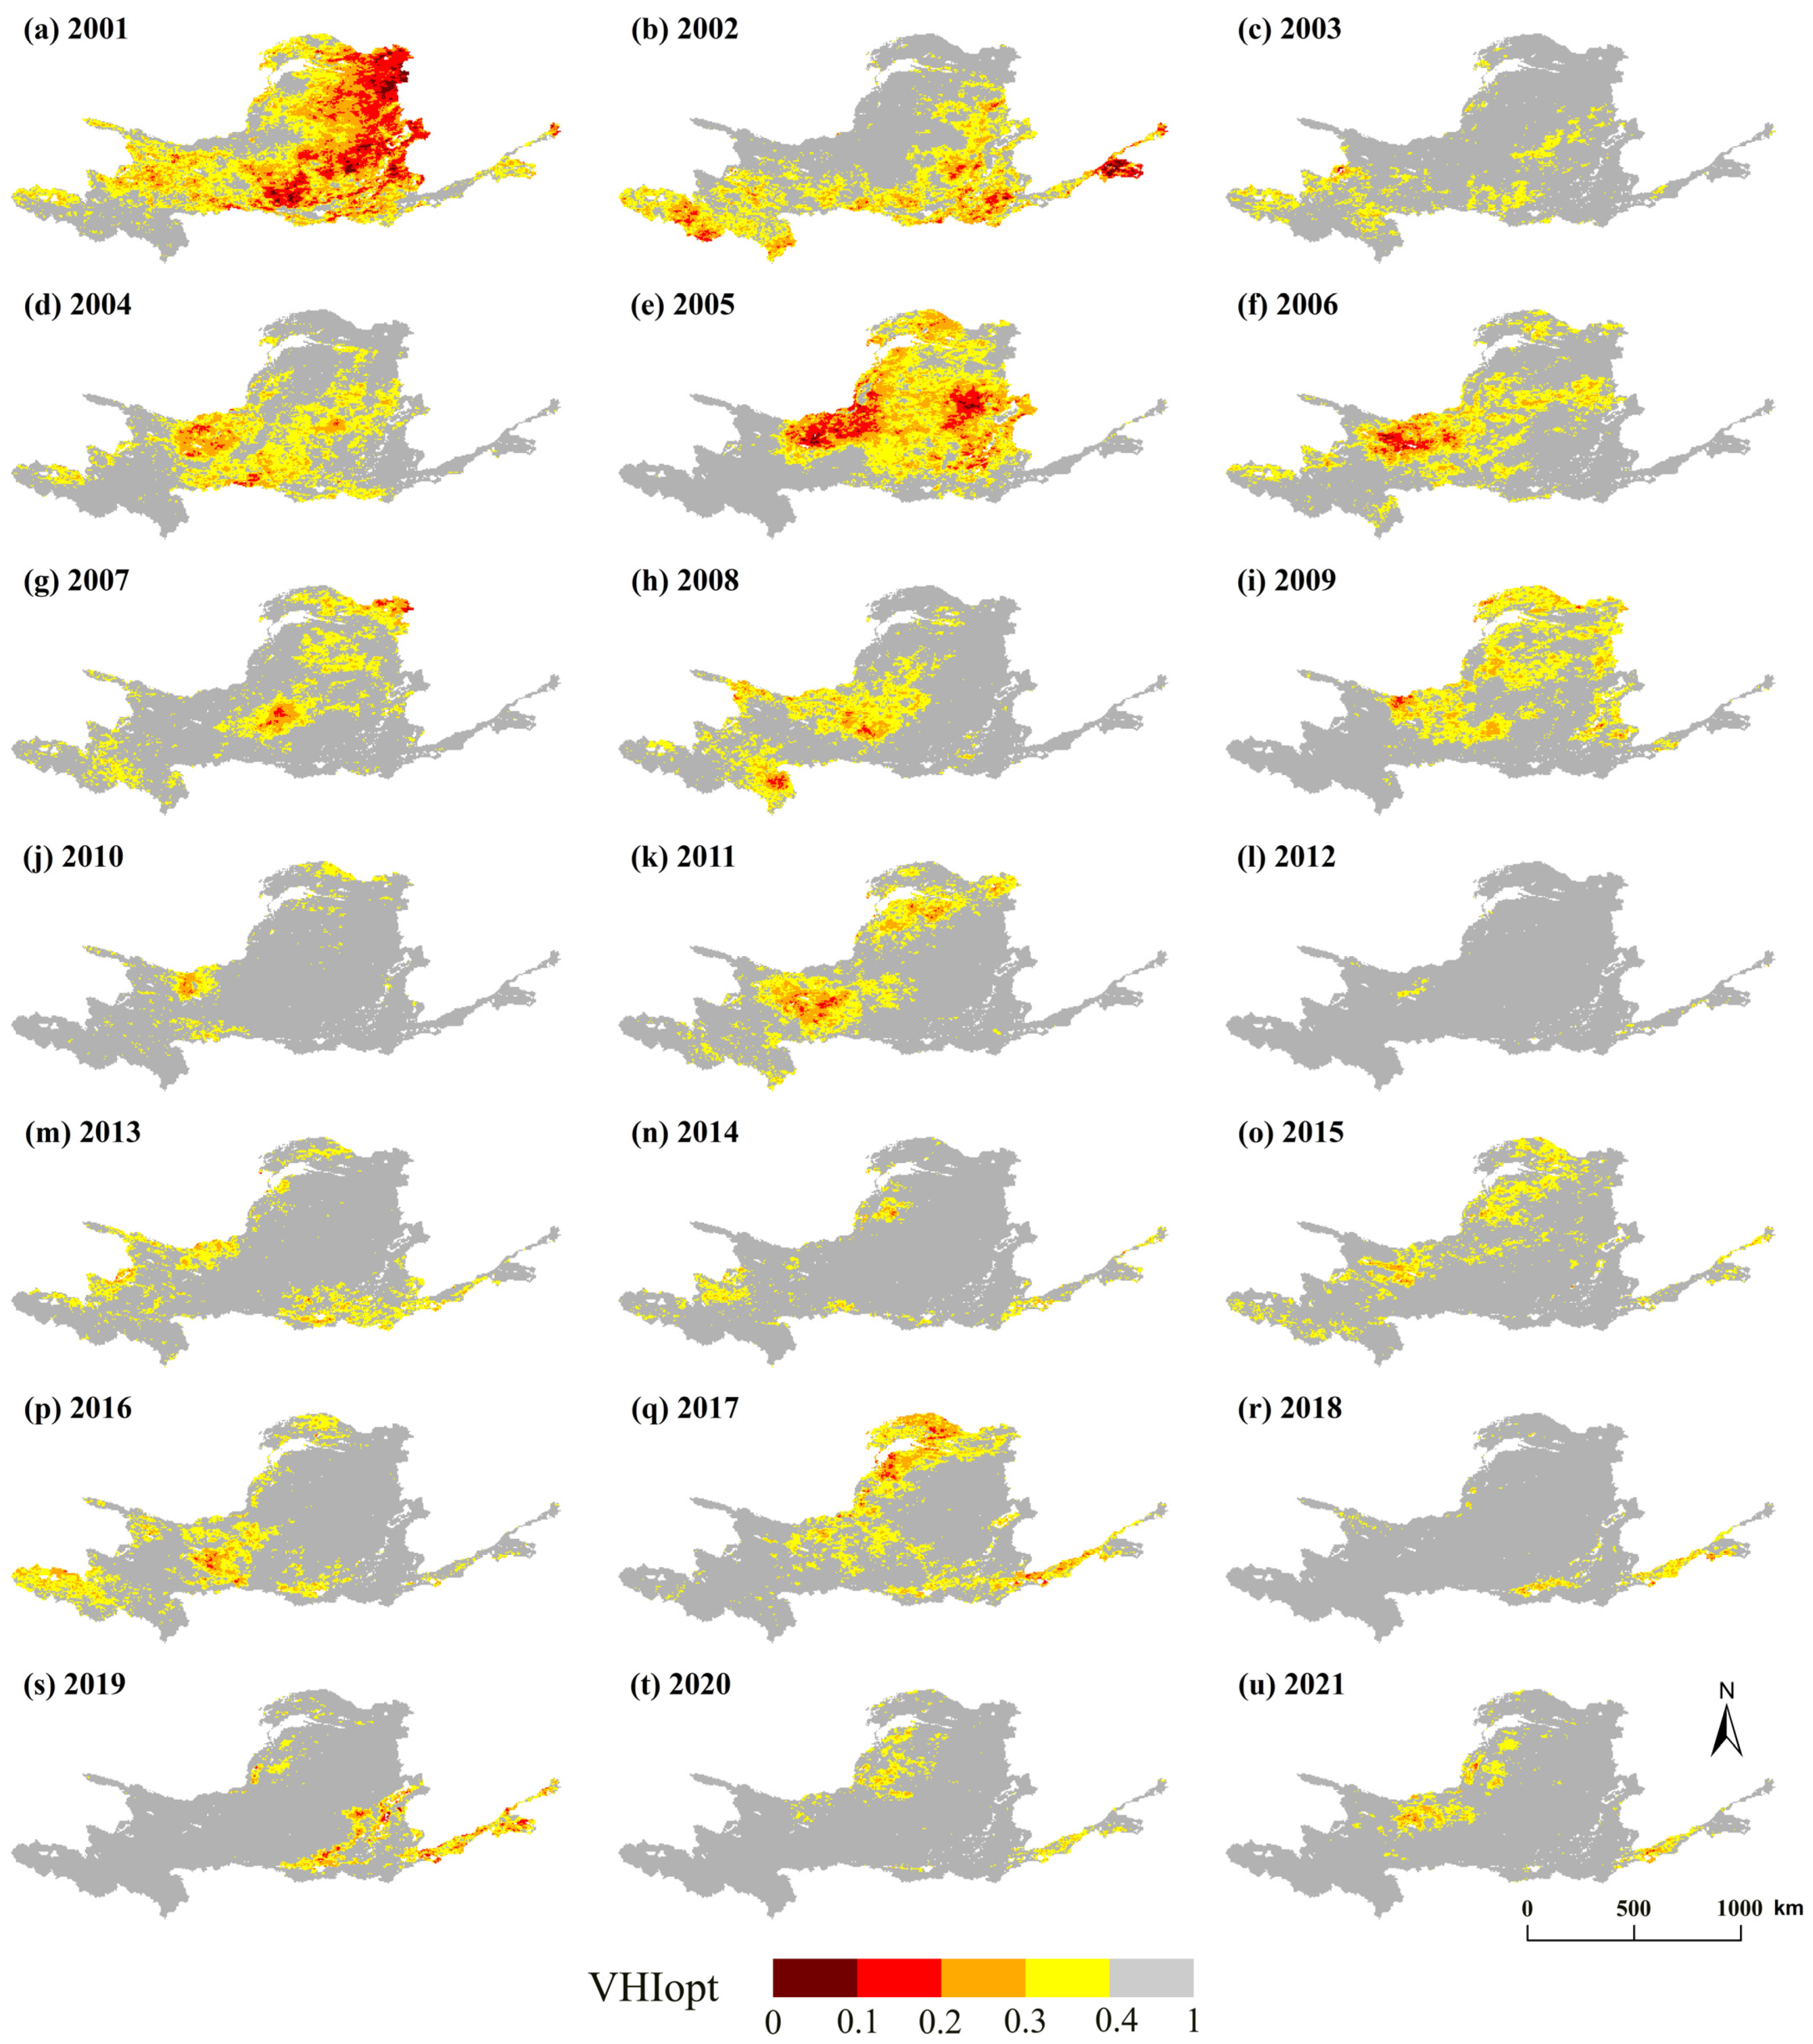
3.3.2. Spatial Distribution Analysis of Drought

Evaluating the spatial characteristics of drought is essential for understanding its patterns and impacts. Figure 9 depicts the spatial distribution of VHIopt during the growing season across the YRB from 2001 to 2021. In 2001, drought conditions were most severe, affecting nearly the entire YRB, with the northern and central regions experiencing extreme drought. By 2002 and 2003, the drought area gradually decreased from north to south. Although the intensity lessened, some regions continued to experience drought. In 2004, the drought area expanded again, with a more concentrated distribution in the midstream. The drought reached a second peak in 2005, particularly in the central basin, with significant increases in areas classified as extreme, severe, and mild drought. Since 2005, drought has primarily concentrated in the middle, western, and downstream of the YRB, with a relatively small drought area and a tendency for minimal fluctuations. Especially in 2012, the drought area decreased to its minimum, indicating that the year was the wettest between 2001 and 2021, with areas of extreme, heavy, moderate, and mild drought nearly disappearing. In other years, drought predominantly affected the central and western regions and the downstream.
To further investigate the spatial variation characteristics of VHIopt during the growing season in the YRB, this study employed Theil–Sen Median trend analysis and Mann–Kendall test methods to quantify and test the trends of VHIopt for each pixel, reflecting the spatial distribution of drought dynamics in the basin. Based on the positive and negative values of the VHIopt trend (Slope), the drought trends were classified into three categories: intensifying drought trend, stable drought trend, and alleviating drought trend. Figure 10a shows that areas with an alleviating drought trend account for the majority of the YRB, reaching 87%; areas with a stable drought trend make up 2%; while areas with an intensifying drought trend constitute 11% of the basin, mainly distributed in the Hetao Plain, Ningxia Plain, Guanzhong Plain, and parts of the downstream, indicating a worsening drought condition in these areas. Furthermore, the Mann–Kendall test showed 76% of the areas with significant changes in agricultural drought trend (p < 0.05) and 24% of the areas with no significant changes in drought in the vegetation coverage area of the YRB. Drawing on the results of the Theil–Sen Median trend analysis and the Mann–Kendall test, drought trends are divided into five main types: significant increase, insignificant increase, constant, insignificant decrease, and significant decrease, accounting for 5%, 6%, 2%, 16%, and 71% of the total area of the YRB, respectively. These results indicate that drought conditions have significantly worsened in certain areas, although drought conditions of the YRB are showing a decreasing trend, such as the Hetao Plain, Ningxia Plain, Guanzhong Plain, and parts of the downstream. The spatial distribution pattern is highly consistent with the linear trend analysis results of VHIopt.

4. Discussion

4.1. Spatial Differences Between VHIopt and VHIori

VHIori assumes that both VCI and TCI contribute equally to VHI, which diminishes the accuracy of VHI in monitoring agricultural drought [16,22]. In contrast, VHIopt distinctly assesses the contributions of VCI and TCI to VHI, and its drought monitoring performance is better than VHIori in different vegetation types, which makes up for the deficiency of VHIori. Compared to VHIopt, VHIori assigns a higher contribution of VCI to VHI, resulting in an underestimation of drought conditions in regions with dense vegetation cover and an overestimation in areas with sparse vegetation cover [22,86].
Figure A5 illustrates the spatial distribution of differences between VHIori and VHIopt in 2001. Positive differences, where VHIori exceeds VHIopt, indicate that VHIori underestimates the severity of agricultural drought. Conversely, negative differences, where VHIopt exceeds VHIori, suggest that VHIori overestimates drought conditions. In a typical drought year, VHIori tends to underestimate agricultural drought in the YRB, mainly in areas with high vegetation density, resulting in an overly optimistic assessment of vegetation health [6,32]. For example, VHIori underestimates agricultural drought in the Ordos Plateau and Guanzhong Plain in May; it underestimates agricultural drought in the Hetao Plain in June. Conversely, VHIori overestimates drought conditions in the YRB primarily in areas with low vegetation density. For instance, VHIori overestimates agricultural drought in the headwaters of the YRB in May; it overestimates agricultural drought in the Loess Plateau in September. Therefore, VHIopt is more sensitive for monitoring agricultural drought than VHIori and provides a more accurate assessment of vegetation stress, enhancing the application prospects of VHIopt.

4.2. Limitations and Uncertainties

The optimized VHI in the study improved the accuracy of agricultural drought monitoring in the YRB, but there were still some limitations and uncertainties.
Firstly, the datasets utilized in this study are mainly sourced from remote sensing observations and meteorological models. These sources are subject to limitations, including sensor resolution, observation frequency, atmospheric conditions, and systematic errors during data integration [87,88,89]. Such limitations can significantly impact the accuracy of drought monitoring [90].
Secondly, the VHI calculations span from 2001 to 2021, constrained by the availability of remote sensing data. Therefore, SPEI, calculated over a longer time frame, serves as a standard for climate-scale data. This methodology facilitates the calibration of VHI calculations for shorter time scales, enhancing the comparability of VHIopt with climate-scale data and mitigating the issue of insufficient representativeness in shorter time series [15,91,92,93].
Thirdly, SPEI is a standardized drought index, and its standardization process can mitigate the differences in climatic characteristics between regions, thereby enhancing spatial comparability. However, the significance of SPEI at different time scales is not entirely consistent in different climatic zones. This study uses multi-time-scale SPEI to optimize VHI, meaning that the performance of VHIopt will be influenced by the accuracy of SPEI [94,95,96].
Fourthly, there may be a lag effect between temperature and vegetation conditions [97]. However, the lag effect typically occurs within a month, and since our research is conducted on a monthly scale, the impact of the lag effect is effectively minimized to a certain extent [98,99].
Finally, although human activities, such as alterations in farmland moisture, can impact the accuracy of VHI [9], this study found that VHIopt maintains accuracy comparable to VHIori even in farmland areas significantly influenced by human activities, which suggests that VHIopt is robust against such variations and retains reliable monitoring performance.

5. Conclusions

SPEI03 was selected as the optimal time scale, and VHI was optimized by using the maximum correlation coefficient method. The optimal contributions of VCI and TCI to VHI were evaluated. Based on SMA and SPEI, the enhancement performance of VHIopt was verified. Furthermore, the spatiotemporal evolution of drought in the YRB from 2001 to 2021 was further analyzed by using VHIopt. The main results are summarized below:
(1) In the YRB, the 3-month time scale SPEI drought index shows the best correlation with VHI and is most suitable for analyzing the optimal weights for VHI. The contribution of VCI to VHIopt is lower than that of TCI. Validation based on SPEI03 and SMA standards demonstrates that VHIopt offers superior accuracy drought in monitoring across various land cover types, including forests, grasslands, and croplands, compared to VHIori. Specifically, VHIopt demonstrates higher precision and reliability in monitoring agricultural drought compared to VHIori, and it shows a higher consistency with drought conditions observed using SMA and SPEI03.
(2) Temporally, VHIopt in the growing season generally exhibits an upward trend, while the drought area shows a decreasing trend in variability, indicating a weakening of drought conditions in the YRB. However, there are notable differences in the changes in VHIopt and drought area across various regions. In the downstream, the slope value of VHIopt is −0.0031, indicating an intensifying trend in drought conditions. In contrast, forested areas primarily experience moderate to mild drought conditions, demonstrating a lower sensitivity to drought.
(3) In 2001, the YRB experienced its most severe drought, with the affected area nearly the entire area of the basin. Over time, the drought area during the growing season generally decreased, with 2012 marking the year with the smallest drought area. In other years, drought conditions were primarily concentrated in the middle, western, and downstream of the basin. The Theil–Sen median trend analysis and Mann–Kendall test indicate that drought conditions in most of the YRB alleviated from 2001 to 2021. However, significant intensification of drought was observed in parts of the Hetao Plain, Ningxia Plain, Guanzhong Plain, and much of the downstream.
In this study, we have improved the calculation method for VHI and introduced a new drought index, VHIopt. This index serves as a simple and effective tool for monitoring agricultural drought, thereby improving operational drought management. Future research will concentrate on validating and applying VHIopt across a wider range of applications to further advance studies in agricultural drought.

Author Contributions

Conceptualization, H.G. and P.D.M.; methodology, Q.H.; software, H.G., X.M., W.W. and Q.H.; validation, Q.H.; formal analysis, Q.H.; resources, X.M. and H.G.; data curation, Q.H., Y.W., Y.C. and R.L. writing—original draft preparation, Q.H.; writing—review and editing H.G., Y.W. and X.M.; visualization, Q.H.; supervision, X.M. and H.G.; project administration, H.G. and X.M.; funding acquisition, X.M. All authors have read and agreed to the published version of the manuscript.

Funding

This research was funded by the Youth Innovation Teams in Colleges and Universities of Shandong Province (Grant No. 2022KJ178), the Shandong Provincial Natural Science Foundation (grant number ZR2021QD055), the Third Xinjiang Scientific Expedition Program (grant number 2021XJKK140304), and Natural Science Foundation of Rizhao City (grant number RZ2021ZR41).

Data Availability Statement

Precipitation data and potential evapotranspiration data are downloaded from https://www.climatologylab.org, accessed on 5 March 2024. MOD13C2 and MOD11C3 vegetation index datasets and MOD12C1 land cover dataset are downloaded from https://earthdata.nasa.gov, accessed on 5 March 2024. SM data of ERA5-Land are downloaded from https://cds.climate.copernicus.eu, accessed on 5 March 2024.

Conflicts of Interest

The authors declare no conflicts of interest.

Appendix A

Table A1. Original land cover type (IGBP) and reclassification results.
IGBP ClassificationReclassification Results
Water BodiesOther
Evergreen Needleleaf ForestsForest
Evergreen Broadleaf ForestsForest
Deciduous Needleleaf ForestsForest
Deciduous Broadleaf ForestsForest
Mixed ForestsForest
Closed ShrublandsForest
Open ShrublandsForest
Woody SavannasGrasslands
SavannasGrasslands
GrasslandsGrasslands
Permanent WetlandsOther
CroplandsCroplands
Urban and Built-Up LandsOther
Cropland/Natural Vegetation MosaicsCroplands
Snow and IceOther
Barren Sparse VegetationOther
Table A2. Optimal weights for different vegetation types.
Vegetation TypeForestGrassCropVariableAll
Weight Value0.280.230.450.280.29
Figure A1. Flowchart of VHI optimization.
Remotesensing 16 04507 g0a1
Figure A2. Scatter plots of SMA (GLEAM RSM) versus VHIori and SMA (GLEAM RSM) versus VHIopt under different vegetation types (forest (a,b), grassland (c,d), cropland (e,f), changing vegetation types (g,h), and all vegetation types (i,j)) and the red dashed lines in all subfigures represent the lines of linear fit.
Remotesensing 16 04507 g0a2
Figure A3. Scatter plots of SPEI03 versus VHIori and SPEI03 versus VHIopt under different vegetation types (forest (a,b), grassland (c,d), cropland (e,f), changing vegetation types (g,h), and all vegetation types (i,j)) and the red dashed lines in all subfigures represent the lines of linear fit.
Remotesensing 16 04507 g0a3
Figure A4. Annual time series plot of VHIopt in the YRB from 2001 to 2021.
Remotesensing 16 04507 g0a4
Figure A5. Spatial distribution map of the differences between VHIopt and VHIori in 2001.
Remotesensing 16 04507 g0a5

References

  1. Wu, J.; He, B.; Lv, A.; Zhou, L.; Liu, M.; Zhao, L. Quantitative assessment and spatial characteristics analysis of agricultural drought vulnerability in China. Nat. Hazards 2010, 56, 785–801. [Google Scholar] [CrossRef]
  2. Chen, L.; He, Z.; Zhang, Y.; Shan, P. Spatial-temporal Characteristics Analysis of Agricultural Drought Based on Vegetation Supply Water Index in Guizhou. China Rural. Water Hydropower 2023, 4, 158–166. [Google Scholar]
  3. Mishra, A.K.; Singh, V.P. A review of drought concepts. J. Hydrol. 2010, 391, 202–216. [Google Scholar] [CrossRef]
  4. Haile, G.G.; Tang, Q.; Li, W.; Liu, X.; Zhang, X. Drought: Progress in broadening its understanding. Wiley Interdiscip. Rev. Water 2020, 7, e1407. [Google Scholar] [CrossRef]
  5. Wilhite, D.A.; Glantz, M.H. Understanding: The drought phenomenon: The role of definitions. Water Int. 1985, 10, 111–120. [Google Scholar] [CrossRef]
  6. Zeng, J.; Zhang, R.; Qu, Y.; Bento, V.A.; Zhou, T.; Lin, Y.; Wu, X.; Qi, J.; Shui, W.; Wang, Q. Improving the drought monitoring capability of VHI at the global scale via ensemble indices for various vegetation types from 2001 to 2018. Weather. Clim. Extrem. 2022, 35, 100412. [Google Scholar] [CrossRef]
  7. Liu, X.; Zhu, X.; Pan, Y.; Li, S.; Liu, Y. Agricultural drought monitor: Progress, challenges and prospect. Acta Geogr. Sin. 2015, 70, 1835–1848. [Google Scholar]
  8. Dilip, T.; Kumari, M.; Murthy, C.S.; Neelima, T.L.; Chakraborty, A.; Devi, M.U. Monitoring early-season agricultural drought using temporal Sentinel-1 SAR-based combined drought index. Environ. Monit. Assess. 2023, 195, 925. [Google Scholar] [CrossRef]
  9. Ciais, P.; Reichstein, M.; Viovy, N.; Granier, A.; Ogée, J.; Allard, V.; Aubinet, M.; Buchmann, N.; Bernhofer, C.; Carrara, A.; et al. Europe-wide reduction in primary productivity caused by the heat and drought in 2003. Nature 2005, 437, 529–533. [Google Scholar] [CrossRef]
  10. Gatti, L.V.; Gloor, M.; Miller, J.B.; Doughty, C.E.; Malhi, Y.; Domingues, L.G.; Basso, L.S.; Martinewski, A.; Correia, C.S.C.; Borges, V.F.; et al. Drought sensitivity of Amazonian carbon balance revealed by atmospheric measurements. Nature 2014, 506, 76–90. [Google Scholar] [CrossRef]
  11. Wang, G. Agricultural drought in a future climate: Results from 15 global climate models participating in the IPCC 4th assessment. Clim. Dyn. 2005, 25, 739–753. [Google Scholar] [CrossRef]
  12. Kogan, F.N. Operational space technology for global vegetation assessment. Bull. Am. Meteorol. Soc. 2001, 82, 1949–1964. [Google Scholar] [CrossRef]
  13. Pei, F.; Wu, C.; Liu, X.; Li, X.; Yang, K.; Zhou, Y.; Wang, K.; Xu, L.; Xia, G. Monitoring the vegetation activity in China using vegetation health indices. Agric. For. Meteorol. 2018, 248, 215–227. [Google Scholar] [CrossRef]
  14. Yin, H.; Zhang, Z.; Zhang, W.; Lai, H.; Wang, F. Using Vegetation Health Index to Calculate Spatiotemporal Variation in Drought and Its Determinants in Inner Mongolia. J. Irrig. Drain. 2023, 42, 80–89+105. [Google Scholar]
  15. Hu, T.; van Dijk AI, J.M.; Renzullo, L.J.; Xu, Z.; He, J.; Tian, S.; Zhou, J.; Li, H. On agricultural drought monitoring in Australia using Himawari-8 geostationary thermal infrared observations. Int. J. Appl. Earth Obs. Geoinf. 2020, 91, 102153. [Google Scholar] [CrossRef]
  16. Zhang, Z.; Wang, Z.; Lai, H.; Wang, F.; Li, Y.; Feng, K.; Qi, Q.; Di, D. Lag Time and Cumulative Effects of Climate Factors on Drought in North China Plain. Water 2023, 15, 3428. [Google Scholar] [CrossRef]
  17. Bento, V.A.; Gouveia, C.M.; DaCamara, C.C.; Libonati, R.; Trigo, I.F. The roles of NDVI and Land Surface Temperature when using the Vegetation Health Index over dry regions. Glob. Planet. Change 2020, 190, 103198. [Google Scholar] [CrossRef]
  18. Javed, T.; Li, Y.; Rashid, S.; Li, F.; Hu, Q.; Feng, H.; Chen, X.; Ahmad, S.; Liu, F.; Pulatov, B. Performance and relationship of four different agricultural drought indices for drought monitoring in China’s mainland using remote sensing data. Sci. Total Environ. 2021, 759, 143530. [Google Scholar] [CrossRef]
  19. Kogan, F.N. Global drought and flood-watch from NOAA polar-orbitting satellites. Adv. Space Res. 1998, 21, 477–480. [Google Scholar] [CrossRef]
  20. Kogan, N.F. Global Drought Watch from Space. Bull. Am. Meteorol. Soc. 1997, 78, 621–636. [Google Scholar]
  21. Rhee, J.; Im, J.; Carbone, G.J. Monitoring agricultural drought for arid and humid regions using multi-sensor remote sensing data. Remote Sens. Environ. 2010, 114, 2875–2887. [Google Scholar] [CrossRef]
  22. Bento, V.A.; Gouveia, C.M.; Dacamara, C.C.; Trigo, I.F. A climatological assessment of drought impact on vegetation health index. Agric. For. Meteorol. 2018, 259, 286–295. [Google Scholar] [CrossRef]
  23. Han, Y.; Li, Z.; Huang, C.; Zhou, Y.; Zong, S.; Hao, T.; Niu, H.; Yao, H. Monitoring Droughts in the Greater Changbai Mountains Using Multiple Remote Sensing-Based Drought Indices. Remote Sens. 2020, 12, 530. [Google Scholar] [CrossRef]
  24. Sun, D.; Kafatos, M. Note on the NDVI-LST relationship and the use of temperature-related drought indices over North America. Geophys. Res. Lett. 2007, 34, L24406. [Google Scholar] [CrossRef]
  25. Sun, N.S.; Chen, Q.; Liu, F.G. Vegetation Health Index 1-km Grid Dataset in Yellow River–Huangshui River Valley (2000–2020). J. Glob. Change Data Discov. 2022, 4, 589–596. [Google Scholar]
  26. Li, W.; Wang, Y. An Analysis of the Spatial-Temporal Characteristics of Drought in Guangdong Based on Vegetation Condition Index from 2003 to 2017. J. South China Norm. Univ. (Nat. Sci. Ed.) 2020, 52, 85–91. [Google Scholar]
  27. Bento, V.A.; Trigo, I.F.; Gouveia, C.M.; DaCamara, C.C. Contribution of land surface temperature (TCI) to vegetation health index: A comparative study using clear sky and all-weather climate data records. Remote Sens. 2018, 10, 1324. [Google Scholar] [CrossRef]
  28. Yin, G.; Zhang, H. A new integrated index for drought stress monitoring based on decomposed vegetation response factors. J. Hydrol. 2023, 618, 129252. [Google Scholar] [CrossRef]
  29. Bouras, E.H.; Jarlan, L.; Er-Raki, S.; Albergel, C.; Richard, B.; Balaghi, R.; Khabba, S. Linkages between rainfed cereal production and agricultural drought through remote sensing indices and a land data assimilation system: A case study in Morocco. Remote Sens. 2020, 12, 4018. [Google Scholar] [CrossRef]
  30. Unganai, L.S.; Kogan, F.N. Drought monitoring and corn yield estimation in Southern Africa from AVHRR data. Remote Sens. Environ. 1998, 63, 219–232. [Google Scholar] [CrossRef]
  31. Yin, G.; Zhang, H.; Zhang, L. Remote Sensing Monitoring of Agricultural Drought and Vegetation Sensitivity Analysis in the Middle and Lower Reaches of the Yangtze River from 2001 to 2019. Geomat. Inf. Sci. Wuhan Univ. 2022, 47, 1245–1256. [Google Scholar]
  32. Zeng, J.; Zhou, T.; Qu, Y.; Bento, V.A.; Qi, J.; Xu, Y.; Li, Y.; Wang, Q. An improved global vegetation health index dataset in detecting vegetation drought. Sci. Data 2023, 10, 338. [Google Scholar] [CrossRef] [PubMed]
  33. Vicente-Serrano, S.M.; Beguería, S.; López-Moreno, J.I. A Multiscalar Drought Index Sensitive to Global Warming: The Standardized Precipitation Evapotranspiration Index. J. Clim. 2010, 23, 1696–1718. [Google Scholar] [CrossRef]
  34. Gao, X.; Zhao, Q.; Zhao, X.; Wu, P.; Pan, W.; Gao, X.; Sun, M. Temporal and spatial evolution of the standardized precipitation evapotranspiration index (SPEI) in the Loess Plateau under climate change from 2001 to 2050. Sci. Total Environ. 2017, 595, 191–200. [Google Scholar] [CrossRef] [PubMed]
  35. Wang, Q.; Zeng, J.; Qi, J.; Zhang, X.; Zeng, Y.; Shui, W.; Xu, Z.; Zhang, R.; Wu, X.; Cong, J. A multi-scale daily SPEI dataset for drought characterization at observation stations over mainland China from 1961 to 2018. Earth Syst. Sci. Data 2021, 13, 331–341. [Google Scholar] [CrossRef]
  36. Guo, H.; Bao, A.; Liu, T.; Ndayisaba, F.; Jiang, L.; Zheng, G.; Chen, T.; De Maeyer, P. Determining variable weights for an optimal scaled drought condition index (OSDCI): Evaluation in central Asia. Remote Sens. Environ. 2019, 231, 111220. [Google Scholar] [CrossRef]
  37. Beguería, S.; Vicente Serrano, S.M.; Reig-Gracia, F.; Latorre, B. Standardized precipitation evapotranspiration index (SPEI) revisited: Parameter fitting, evapotranspiration models, tools, datasets and drought monitoring. Int. J. Climatol. 2014, 34, 3001–3023. [Google Scholar] [CrossRef]
  38. Li, L.; She, D.; Zheng, H.; Lin, P.; Yang, Z.L. Elucidating diverse drought characteristics from two meteorological drought indices (SPI and SPEI) in China. J. Hydrometeorol. 2020, 21, 1513–1530. [Google Scholar] [CrossRef]
  39. Um, M.J.; Kim, Y.; Park, D. Evaluation and modification of the drought severity index (DSI) in East Asia. Remote Sens. Environ. 2018, 209, 66–76. [Google Scholar] [CrossRef]
  40. Chen, J.; Sun, H.; Wang, J.; Liao, W.; Chen, H. Improvement of comprehensive meteorological drought index and its applicability analysis. Trans. Chin. Soc. Agric. Eng. 2020, 36, 71–77. [Google Scholar] [CrossRef]
  41. Liu, L.; Zeng, J.; Wu, X.; Qu, J.; Li, X.; Zhang, J.; Han, J. Review on ECO-environment research in the Yellow River Basin: A bibliometric perspective. Int. J. Environ. Res. Public Health 2022, 19, 11986. [Google Scholar] [CrossRef] [PubMed]
  42. Li, Y.; Chang, J.; Fan, J.; Yu, B. Agricultural drought evolution characteristics and driving mechanisms in the YRB under climate and land use changes. Trans. Chin. Soc. Agric. Eng. (Trans. CSAE) 2021, 37, 84–93. [Google Scholar]
  43. Huang, J.; Zhang, G.; Yu, H.; Wang, S.; Guan, X.; Ren, Y. Characteristics of climate change in the YRB during recent 40 years. J. Hydraul. Eng. 2020, 51, 1048–1058. [Google Scholar]
  44. Liu, H.; Jiang, L.L.; Liu, B.; Liu, R.; Xiao, Z.L. Characteristics of drought in China and its effect on vegetation change in recent 40 years. Acta Ecol. Sin. 2023, 43, 7936–7949. [Google Scholar]
  45. Yaning, C.; Yupeng, L.; Zhi, L.; Liu, Y.; Huang, W.; Liu, X.; Feng, M. Analysis of the impact of global climate change on dryland areas. Adv. Earth Sci. 2022, 37, 111. [Google Scholar]
  46. Han, L.; Zhang, Q.; Ma, P.; Wang, Y.; Huang, T.; Jia, Y.; Wang, X.; Wang, X.; Liu, W.; Li, D.; et al. Characteristics of drought disasters risk in the YRB under the climate warming. J. Desert Res. 2021, 41, 225. [Google Scholar]
  47. Xin’e Tao, H.C.; Xu, C. Characteristics of drought variations in Hanjiang Basin in 1961–2014 based on SPI/SPEI. J. Water Resour. Res. 2015, 4, 404–415. [Google Scholar]
  48. Zhang, A.; Jia, G. Monitoring meteorological drought in semiarid regions using multi-sensor microwave remote sensing data. Remote Sens. Environ. 2013, 134, 12–23. [Google Scholar] [CrossRef]
  49. Tian, F.; Liu, L.Z.; Yang, J.H.; Wu, J.J. Vegetation greening in more than 94% of the Yellow River Basin (YRB) region in China during the 21st century caused jointly by warming and anthropogenic activities. Ecol. Indic. 2021, 125, 107479. [Google Scholar] [CrossRef]
  50. Jin, L.; Chen, S.; Liu, M. Multiscale Spatiotemporal Dynamics of Drought within the Yellow River Basin (YRB): An Examination of Regional Variability and Trends. Water 2024, 16, 791. [Google Scholar] [CrossRef]
  51. Wang, S.-Y.; Liu, J.-S.; Ma, T.-B. Dynamics and changes in spatial patterns of land use in YRB, China. Land Use Policy 2010, 27, 313–323. [Google Scholar] [CrossRef]
  52. Ding, Y.; Zhang, L.; He, Y.; Cao, S.; Wei, X.; Guo, Y.; Ran, L.; Filonchyk, M. Spatiotemporal evolution of agricultural drought and its attribution under different climate zones and vegetation types in the YRB of China. Sci. Total Environ. 2024, 914, 169687. [Google Scholar] [CrossRef] [PubMed]
  53. Cao, Y.; Si, W.; Du, Z.; Liang, H.; Lei, T.; Sun, B.; Wu, Z. Changes in GPP of China during the typical drought years from 1982 to 2017. Arid. Land Geogr. 2023, 46, 1577–1590. [Google Scholar]
  54. Yu, T.; Bao, A.; Zhang, J.; Tu, H.; Chen, B.; De Maeyer, P.; Van de Voorde, T. Evaluating surface soil moisture characteristics and the performance of remote sensing and analytical products in Central Asia. J. Hydrol. 2023, 617, 128921. [Google Scholar] [CrossRef]
  55. Lotfirad, M.; Esmaeili-Gisavandani, H.; Adib, A. Drought monitoring and prediction using SPI, SPEI, and random forest model in various climates of Iran. J. Water Clim. Change 2022, 13, 383–406. [Google Scholar] [CrossRef]
  56. Jiménez-Donaire, M.P.; Giráldez, J.V.; Vanwalleghem, T. Impact of climate change on agricultural droughts in Spain. Water 2020, 12, 3214. [Google Scholar] [CrossRef]
  57. Yu, X.; Pu, Y.; Kang, B. Spatial-temporal characteristics of drought in recent 50 years in Guangdong Province based on SPEI. J. Arid. Meteorol. 2022, 40, 1051. [Google Scholar]
  58. Li, Y. Effects of Multi-time Scale Meteorological Drought on Vegetation in the YRB from 1982 to 2020. J. Soil Water Conserv. 2024, 38, 187–196. [Google Scholar]
  59. Vicente-Serrano, S.M.; Gouveia, C.; Camarero, J.J.; Beguería, S.; Trigo, R.; López-Moreno, J.I.; Azorín-Molina, C.; Pasho, E.; Lorenzo-Lacruz, J.; Revuelto, J.; et al. Response of vegetation to drought time-scales across global land biomes. Proc. Natl. Acad. Sci. USA 2013, 110, 52–57. [Google Scholar] [CrossRef]
  60. Kogan, F.; Sullivan, J. Development of global drought-watch system using NOAA/AVHRR data. Adv. Space Res. 1993, 13, 219–222. [Google Scholar] [CrossRef]
  61. Jalayer, S.; Sharifi, A.; Abbasi-Moghadam, D.; Tariq, A.; Qin, S. Assessment of spatiotemporal characteristic of droughts using in situ and remote sensing-based drought indices. IEEE J. Sel. Top. Appl. Earth Obs. Remote Sens. 2023, 16, 1483–1502. [Google Scholar] [CrossRef]
  62. Zou, L.; Cao, S.; Sanchez-Azofeifa, A. Evaluating the utility of various drought indices to monitor meteorological drought in Tropical Dry Forests. Int. J. Biometeorol. 2020, 64, 701–711. [Google Scholar] [CrossRef] [PubMed]
  63. Qiao, L.; Zheng, Z.; Ma, X.; Zhang, X.; Ru, X.; Peng, J.; Zhao, X.; Xia, H. Monthly 1km resolution VCI and TCI drought index datasets in the YRB (2003–2021). China Sci. Data 2023, 8, 223–233. [Google Scholar]
  64. Xiao, D.; Wang, S. Comments on the progress and direction in soil water research. Ecol. Environ. Sci. 2009, 18, 1182–1188. [Google Scholar]
  65. Li, W.; Liu, S.; Hou, M.; Han, J.; Chen, X. Advance in the Study on Meteorological and Agricultural Drought Indices. Meteorol. Environ. Sci. 2021, 44, 76–82. [Google Scholar]
  66. Seneviratne, S.I.; Corti, T.; Davin, E.L.; Hirschi, M.; Jaeger, E.B.; Lrene, L.; Orlowsky, B.; Teuling, A.J. Investigating soil moisture–climate interactions in a changing climate: A review. Earth-Sci. Rev. 2010, 99, 125–161. [Google Scholar] [CrossRef]
  67. Lai, E.N.; Wang-Erlandsson, L.; Virkki, V.; Porkka, M.; van der Ent, R.J. Root zone soil moisture in over 25% of global land permanently beyond pre-industrial variability as early as 2050 without climate policy. Hydrol. Earth Syst. Sci. 2023, 27, 3999–4018. [Google Scholar] [CrossRef]
  68. Farokhi, M.; Faridani, F.; Lasaponara, R.; Ansari, H.; Faridhosseini, A. Enhanced estimation of root zone soil moisture at 1 km resolution using SMAR model and MODIS-based downscaled AMSR2 soil moisture data. Sensors 2021, 21, 5211. [Google Scholar] [CrossRef]
  69. Carranza, C.; Nolet, C.; Pezij, M.; van der Ploeg, M. Root zone soil moisture estimation with Random Forest. J. Hydrol. 2021, 593, 125840. [Google Scholar] [CrossRef]
  70. Al Bitar, A.; Mahmoodi, A.; Kerr, Y.; Rodriguez-Fernandez, N.; Parrens, M.; Tarot, S. Global Assessment of Droughts in the Last Decade from SMOS Root Zone Soil Moisture. In Proceedings of the 2021 IEEE International Geoscience and Remote Sensing Symposium IGARSS, Brussels, Belgium, 11–16 July 2021; IEEE: Piscataway, NJ, USA, 2021; pp. 8628–8631. [Google Scholar]
  71. Chen, C.C.; Dominguez, F. The location of large-scale soil moisture anomalies affects moisture transport and precipitation over southeastern South America. Geophys. Res. Lett. 2024, 51, e2023GL106777. [Google Scholar] [CrossRef]
  72. Cammalleri, C.; Vogt, J.V.; Bisselink, B.; de Roo, A. Comparing soil moisture anomalies from multiple independent sources over different regions across the globe. Hydrol. Earth Syst. Sci. 2017, 21, 6329–6343. [Google Scholar] [CrossRef]
  73. Yuan, F.; Wang, B.; Shi, C.; Cui, W.; Zhao, C.; Liu, Y.; Ren, L.; Zhang, L.; Zhu, Y.; Chen, T.; et al. Evaluation of hydrological utility of IMERG Final run V05 and TMPA 3B42V7 satellite precipitation products in the Yellow River source region, China. J. Hydrol. 2018, 567, 696–711. [Google Scholar] [CrossRef]
  74. Zhou, L.; Tucker, C.J.; Kaufmann, R.K.; Slayback, D.; Shabanov, N.V.; Myneni, R.B. Variations in northern vegetation activity inferred from satellite data of vegetation index during 1981 to 1999. J. Geophys. Res. Atmos. 2001, 106, 20069–20083. [Google Scholar] [CrossRef]
  75. Ji, L.; Peters, A.J. Assessing vegetation response to drought in the northern Great Plains using vegetation and drought indices. Remote Sens. Environ. 2003, 87, 85–98. [Google Scholar] [CrossRef]
  76. Vilonen, L.L.; Blair, J.; Trivedi, P.; Zeglin, L.; Smith, M.D. Limited legacy effects of extreme multiyear drought on carbon and nitrogen cycling in a mesic grassland. Elem. Sci. Anth. 2022, 10, 000093. [Google Scholar] [CrossRef]
  77. Wang, Q.; Wu, J.; Li, X.; Zhou, H.; Yang, J.; Geng, G.; An, X.; Liu, L.; Tang, Z. A comprehensively quantitative method of evaluating the impact of drought on crop yield using daily multi-scale SPEI and crop growth process model. Int. J. Biometeorol. 2017, 61, 685–699. [Google Scholar] [CrossRef]
  78. Rojas, O.; Vrieling, A.; Rembold, F. Assessing drought probability for agricultural areas in Africa with coarse resolution remote sensing imagery. Remote Sens. Environ. 2011, 115, 343–352. [Google Scholar] [CrossRef]
  79. Quiring, S.M.; Ganesh, S. Evaluating the utility of the Vegetation Condition Index (VCI) for monitoring meteorological drought in Texas. Agric. For. Meteorol. 2010, 150, 330–339. [Google Scholar] [CrossRef]
  80. Huang, S.; Gan, Y.; Zhang, X.; Chen, N.; Wang, C.; Gu, X.; Ma, J.; Diyogi, D. Urbanization amplified asymmetrical changes of rainfall and exacerbated drought: Analysis over five urban agglomerations in the Yangtze River Basin, China. Earth’s Future 2023, 11, e2022EF003117. [Google Scholar] [CrossRef]
  81. Ault, T.R. On the essentials of drought in a changing climate. Science 2020, 368, 256–260. [Google Scholar] [CrossRef]
  82. Zhang, M.; Yuan, X.; Otkin, J.A.; Ji, P. Climate warming outweighs vegetation greening in intensifying flash droughts over China. Environ. Res. Lett. 2022, 17, 054041. [Google Scholar] [CrossRef]
  83. Zheng, F.; Wang, H.; Luo, H.; Yi, S. Decadal change in ENSO related seasonal precipitation over southern China under influences of ENSO and its combination mode. Clim. Dyn. 2020, 54, 1973–1986. [Google Scholar] [CrossRef]
  84. Chen, Y.; Fu, B.; Zhao, Y.; Wang, K.; Zhao, M.; Ma, J.; Wu, J.; Xu, C.; Liu, W.; Wang, H. Sustainable development in the YRB: Issues and strategies. J. Clean. Prod. 2020, 263, 121223. [Google Scholar] [CrossRef]
  85. Tang, Z.; Zhou, Z.; Wang, D.; Luo, F.; Bai, J.; Fu, Y. Impact of vegetation restoration on ecosystem services in the Loess plateau, a case study in the Jinghe Watershed, China. Ecol. Indic. 2022, 142, 109183. [Google Scholar] [CrossRef]
  86. Yuan, S.; Xing, X.L.; Ju, W.M. Temporal and spatial patterns of remote sensing drought indices and their responses to climate and land use changes in China. Acta Ecol. Sin. 2023, 43, 6691–6705. [Google Scholar]
  87. Jay, S.; Baret, F.; Dutartre, D.; Malatesta, G.; Héno, S.; Comar, A.; Weiss, M.; Maupas, F. Exploiting the centimeter resolution of UAV multispectral imagery to improve remote-sensing estimates of canopy structure and biochemistry in sugar beet crops. Remote Sens. Environ. 2019, 231, 110898. [Google Scholar] [CrossRef]
  88. Zhang, Y.; Xie, D.; Tian, W.; Zhao, H.; Geng, S.; Lu, H.; Ma, G.; Huang, J.; Choy Lim Kam Sian, K.T. Construction of an integrated drought monitoring model based on deep learning algorithms. Remote Sens. 2023, 15, 667. [Google Scholar] [CrossRef]
  89. Hazaymeh, K.; Hassan, Q.K. Remote sensing of agricultural drought monitoring: A state of art review. AIMS Environ. Sci. 2016, 3, 604–630. [Google Scholar] [CrossRef]
  90. Mullapudi, A.; Vibhute, A.D.; Mali, S.; Patil, C.H. A review of agricultural drought assessment with remote sensing data: Methods, issues, challenges and opportunities. Appl. Geomat. 2023, 15, 1–13. [Google Scholar] [CrossRef]
  91. An, Q.; He, H.; Gao, J.; Nie, Q.; Cui, Y.; Wei, C.; Xie, X. Analysis of temporal-spatial variation characteristics of drought: A case study from Xinjiang, China. Water 2020, 12, 741. [Google Scholar] [CrossRef]
  92. Guo, H.; Bao, A.; Liu, T.; Ndayisaba, F.; Jiang, L.; Kurban, A.; De Maeyer, P. Spatial and temporal characteristics of droughts in Central Asia during 1966–2015. Sci. Total Environ. 2018, 624, 1523–1538. [Google Scholar] [CrossRef] [PubMed]
  93. Zeng, J.; Zhang, R.; Lin, Y.; Wu, X.; Tang, J.; Guo, P.; Li, J.; Wang, Q. Drought frequency characteristics of China, 1981–2019, based on the vegetation health index. Clim. Res. 2020, 81, 131–147. [Google Scholar] [CrossRef]
  94. Moutia, S.; Sinan, M.; Lekhlif, B. Assessment of agricultural drought in Morocco based on a composite of the Vegetation Health Index (VHI) and Standardized Precipitation Evapotranspiration Index (SPEI)//E3S Web of Conferences. EDP Sci. 2021, 314, 04003. [Google Scholar] [CrossRef]
  95. Zhao, H.; Huang, Y.; Wang, X.; Li, X.; Lei, T. The performance of SPEI integrated remote sensing data for monitoring agricultural drought in the North China Plain. Field Crops Res. 2023, 302, 109041. [Google Scholar] [CrossRef]
  96. Abatzoglou, J.T.; Dobrowski, S.Z.; Parks, S.A.; Hegewisch, K.C. TerraClimate, a high-resolution global dataset of monthly climate and climatic water balance from 1958–2015. Sci. Data 2018, 5, 170191. [Google Scholar] [CrossRef]
  97. Kogan, F.N. Application of vegetation index and brightness temperature for drought detection. Adv. Space Res. 1995, 15, 91–100. [Google Scholar] [CrossRef]
  98. Son, N.T.; Chen, C.F.; Chen, C.R.; Chang, L.Y.; Minh, V.Q. Monitoring agricultural drought in the Lower Mekong Basin using MODIS NDVI and land surface temperature data. Int. J. Appl. Earth Obs. Geoinf. 2012, 18, 417–427. [Google Scholar] [CrossRef]
  99. Kukunuri AN, J.; Murugan, D.; Singh, D. Variance based fusion of VCI and TCI for efficient classification of agriculture drought using MODIS data. Geocarto Int. 2022, 37, 2871–2892. [Google Scholar] [CrossRef]
Figure 1. Location map (a), elevation (b), vegetation cover types (c), and percentage of vegetation types (d) in the YRB.
Remotesensing 16 04507 g001
Figure 2. Correlation between VHI during the growing season and SPEI at multiple timescales under different weight factors.
Remotesensing 16 04507 g002
Figure 3. Scatter plots of SMA versus VHIori and SMA versus VHIopt under different vegetation types (forest (a,b), grassland (c,d), cropland (e,f), changing vegetation types (g,h), and all vegetation types (i,j)) and the red dashed lines in all subfigures represent the lines of linear fit.
Remotesensing 16 04507 g003
Figure 4. Time series plots of VHIopt, SPEI03, and SMA during the growing season (YRB (a), upstream (b), midstream (c), downstream (d)).
Remotesensing 16 04507 g004
Figure 5. Spatial distribution maps of VHIopt, SPEI03, and SMA during the growing season in 2001.
Remotesensing 16 04507 g005
Figure 6. Time series plots of VHIopt, SPEI03, and SMA in 2001.
Remotesensing 16 04507 g006
Figure 7. Temporal evolution of VHIopt and the red dashed lines in all subfigures represent the lines of linear fit.
Remotesensing 16 04507 g007
Figure 8. Percentage of drought-affected area during the growing season from 2001 to 2021 in different vegetation types.
Remotesensing 16 04507 g008
Figure 9. Spatial distribution maps of VHIopt from 2001 to 2021.
Remotesensing 16 04507 g009
Figure 10. Drought change trends in the vegetation-covered areas of the YRB from 2001 to 2021 ((a) Theil–Sen Median trend analysis and Mann–Kendall test, (b) drought change characteristics, (c,d) percentage of area).
Remotesensing 16 04507 g010
Table 1. SPEI drought classification.
SPEISPEI ≤ −2.0−2.0 < SPEI ≤ −1.5−1.5 < SPEI ≤ −1.0−1.0 < SPEI ≤ −0.5−0.5 < SPEI
Drought
Severity
Extreme DroughtSevere
Drought
Moderate DroughtMild DroughtNo Drought
Table 2. VHI drought classification [6,12].
VHI0–0.10.1–0.20.2–0.30.3–0.40.4–1
Drought
severity
Extreme droughtSevere droughtModerate droughtMild droughtNo drought
Disclaimer/Publisher’s Note: The statements, opinions and data contained in all publications are solely those of the individual author(s) and contributor(s) and not of MDPI and/or the editor(s). MDPI and/or the editor(s) disclaim responsibility for any injury to people or property resulting from any ideas, methods, instructions or products referred to in the content.

