
Quantification of Nearshore Sandbar Seasonal Evolution Based on Drone Pseudo-Bathymetry Time-Lapse Data


Abstract

1. Introduction
1.1. Nearshore Sandbar
1.2. Coastal Seafloor Monitoring
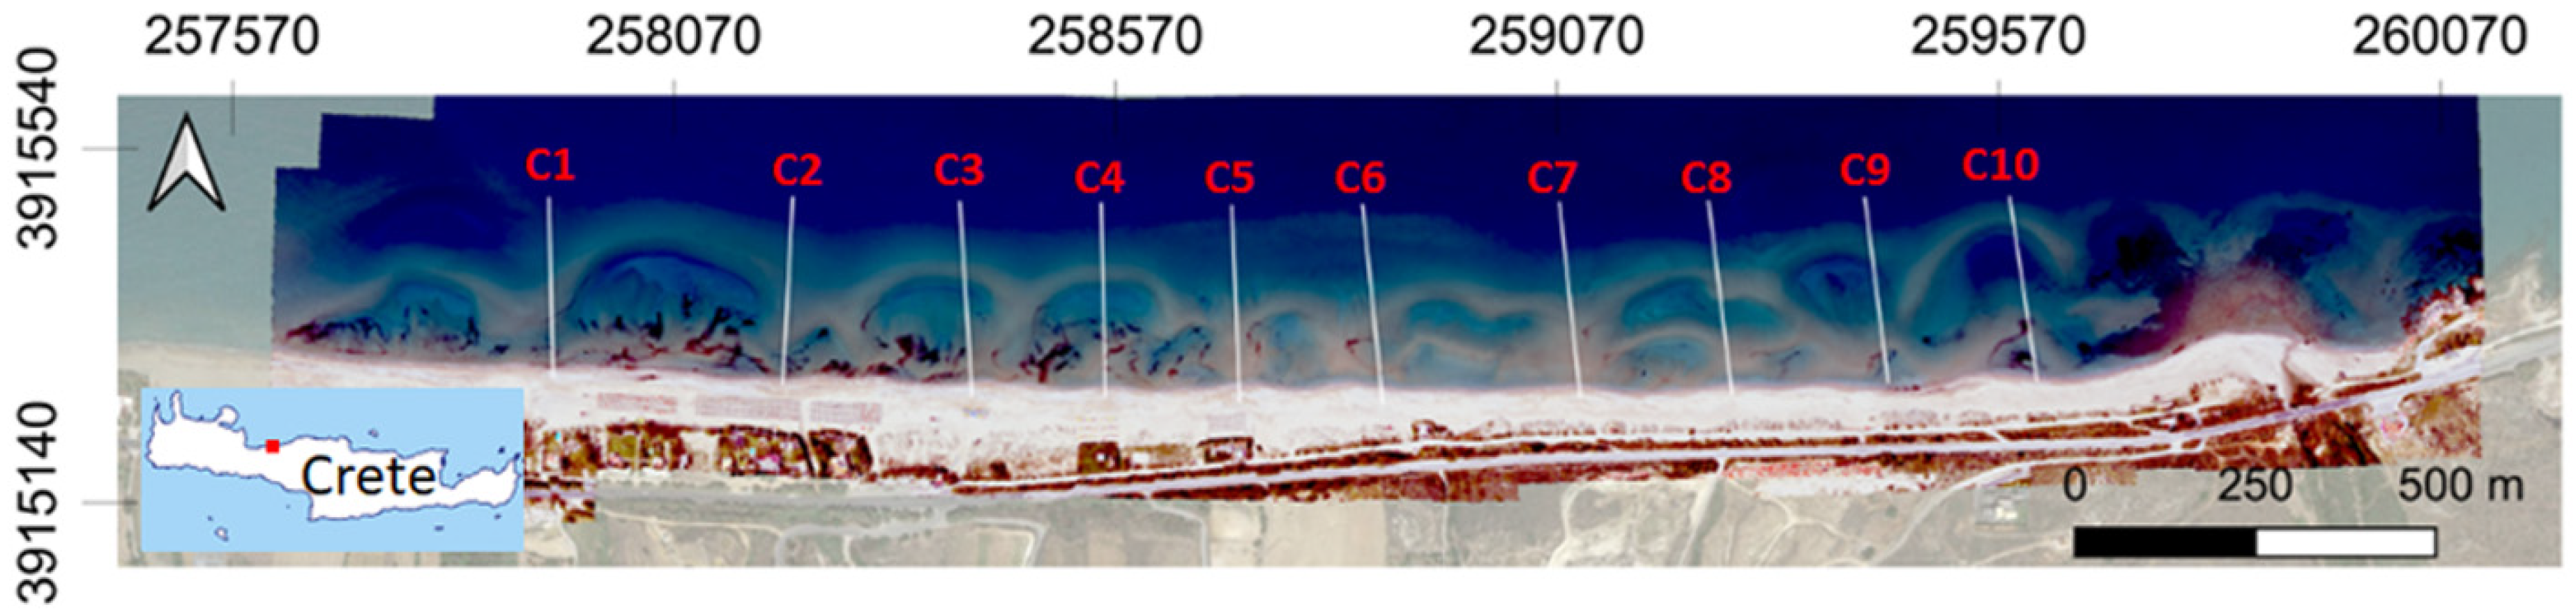
1.3. Study Area
2. Methods
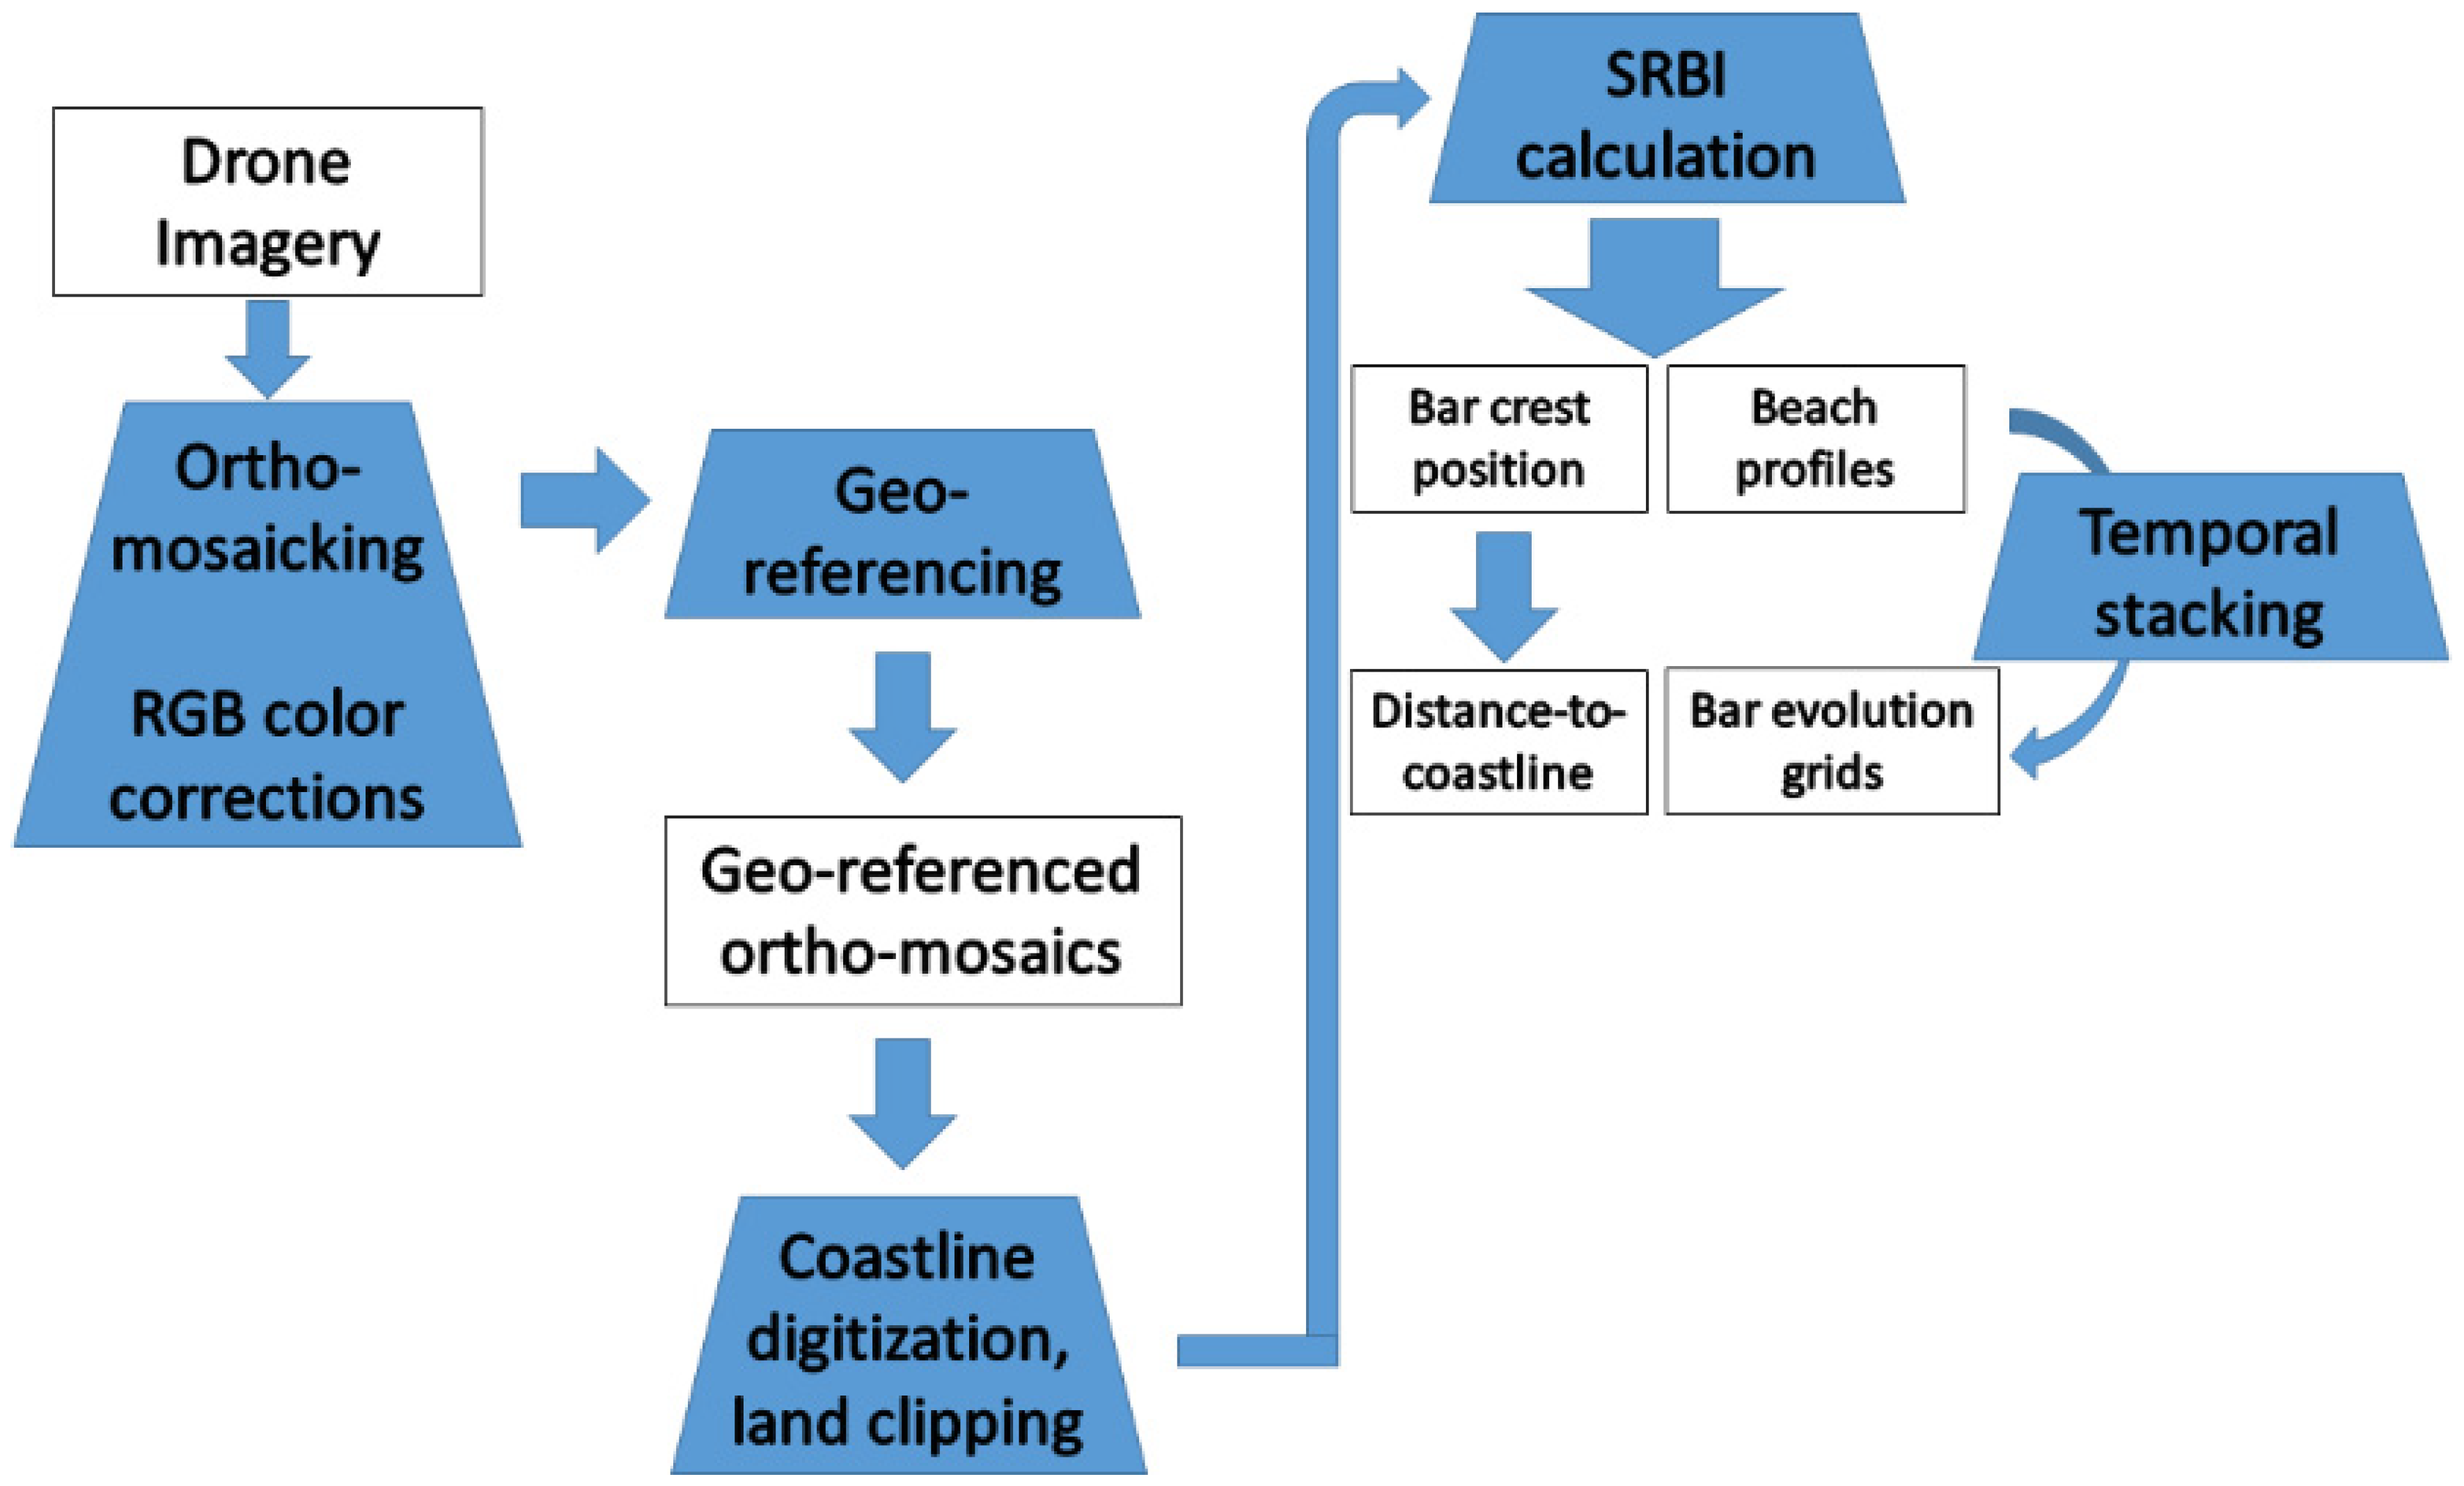
2.1. Acquisition and Processing of Drone Imagery
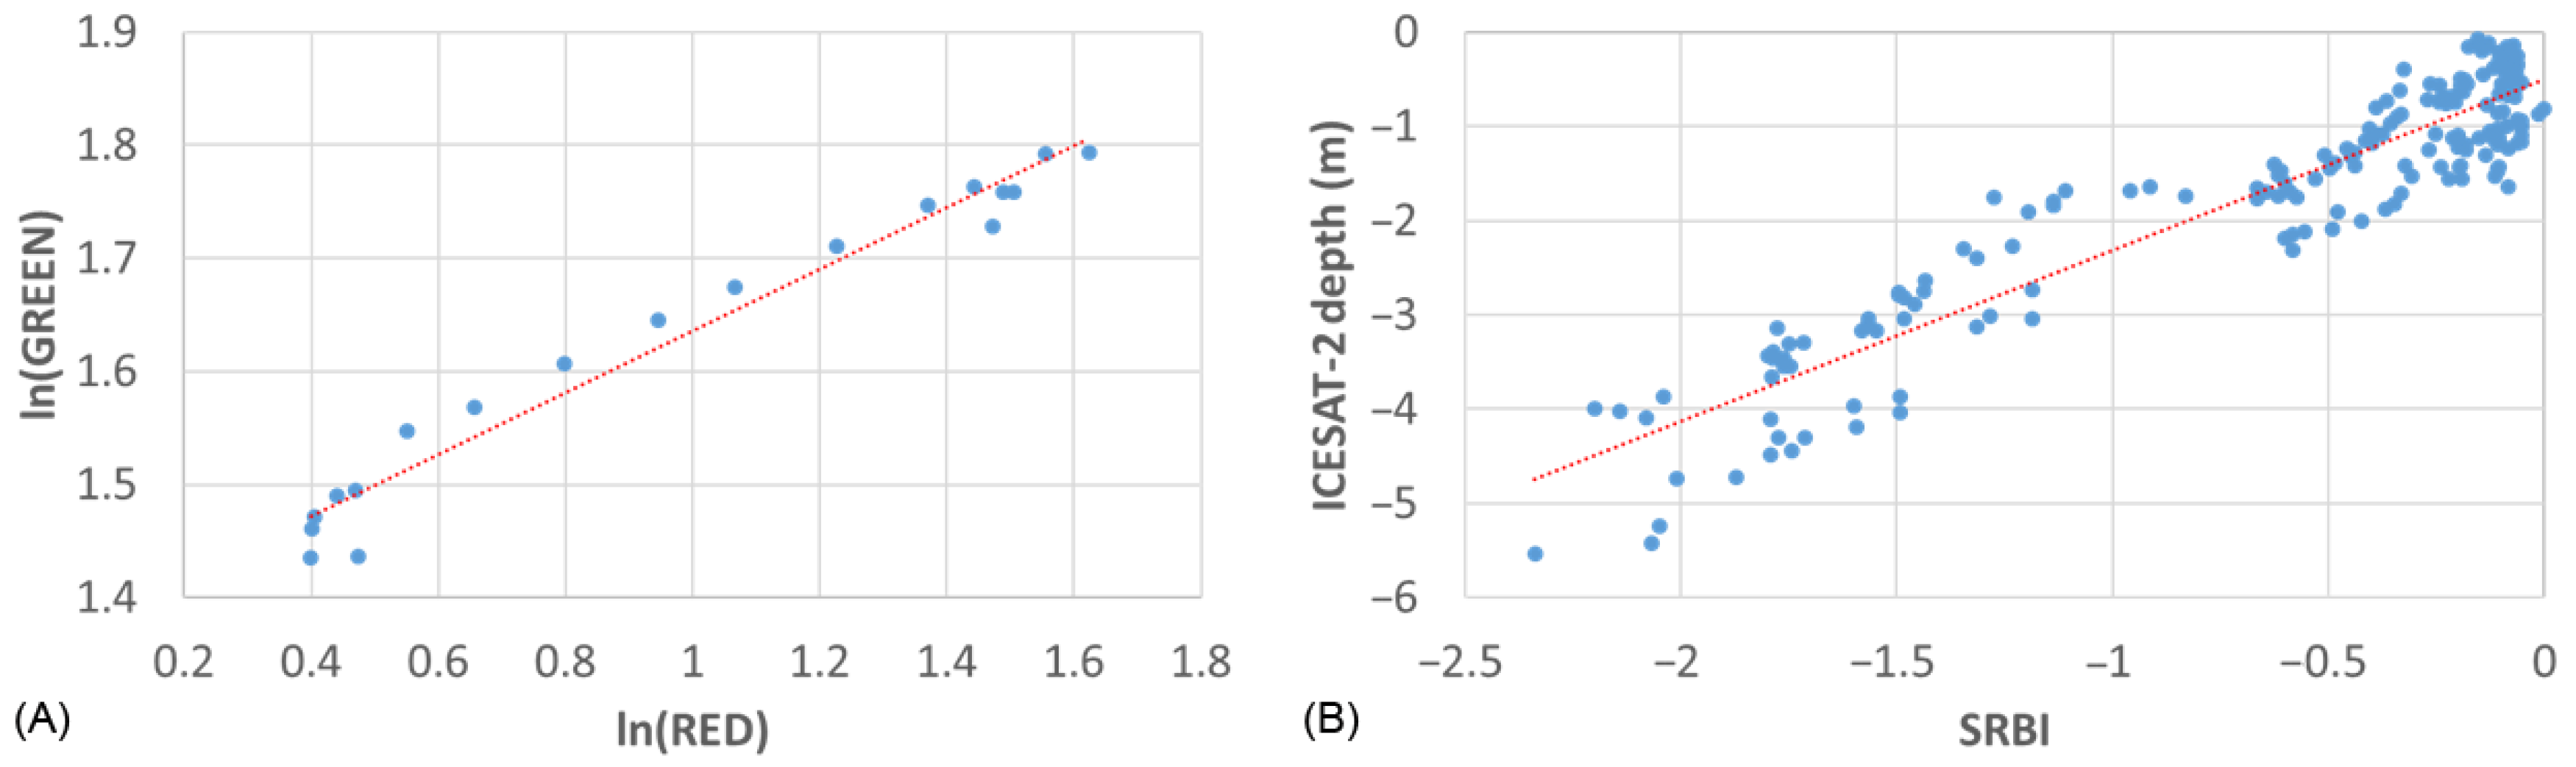
2.2. Standardized-Ratio Bathymetric Index (SRBI)
2.3. GIS Analyses
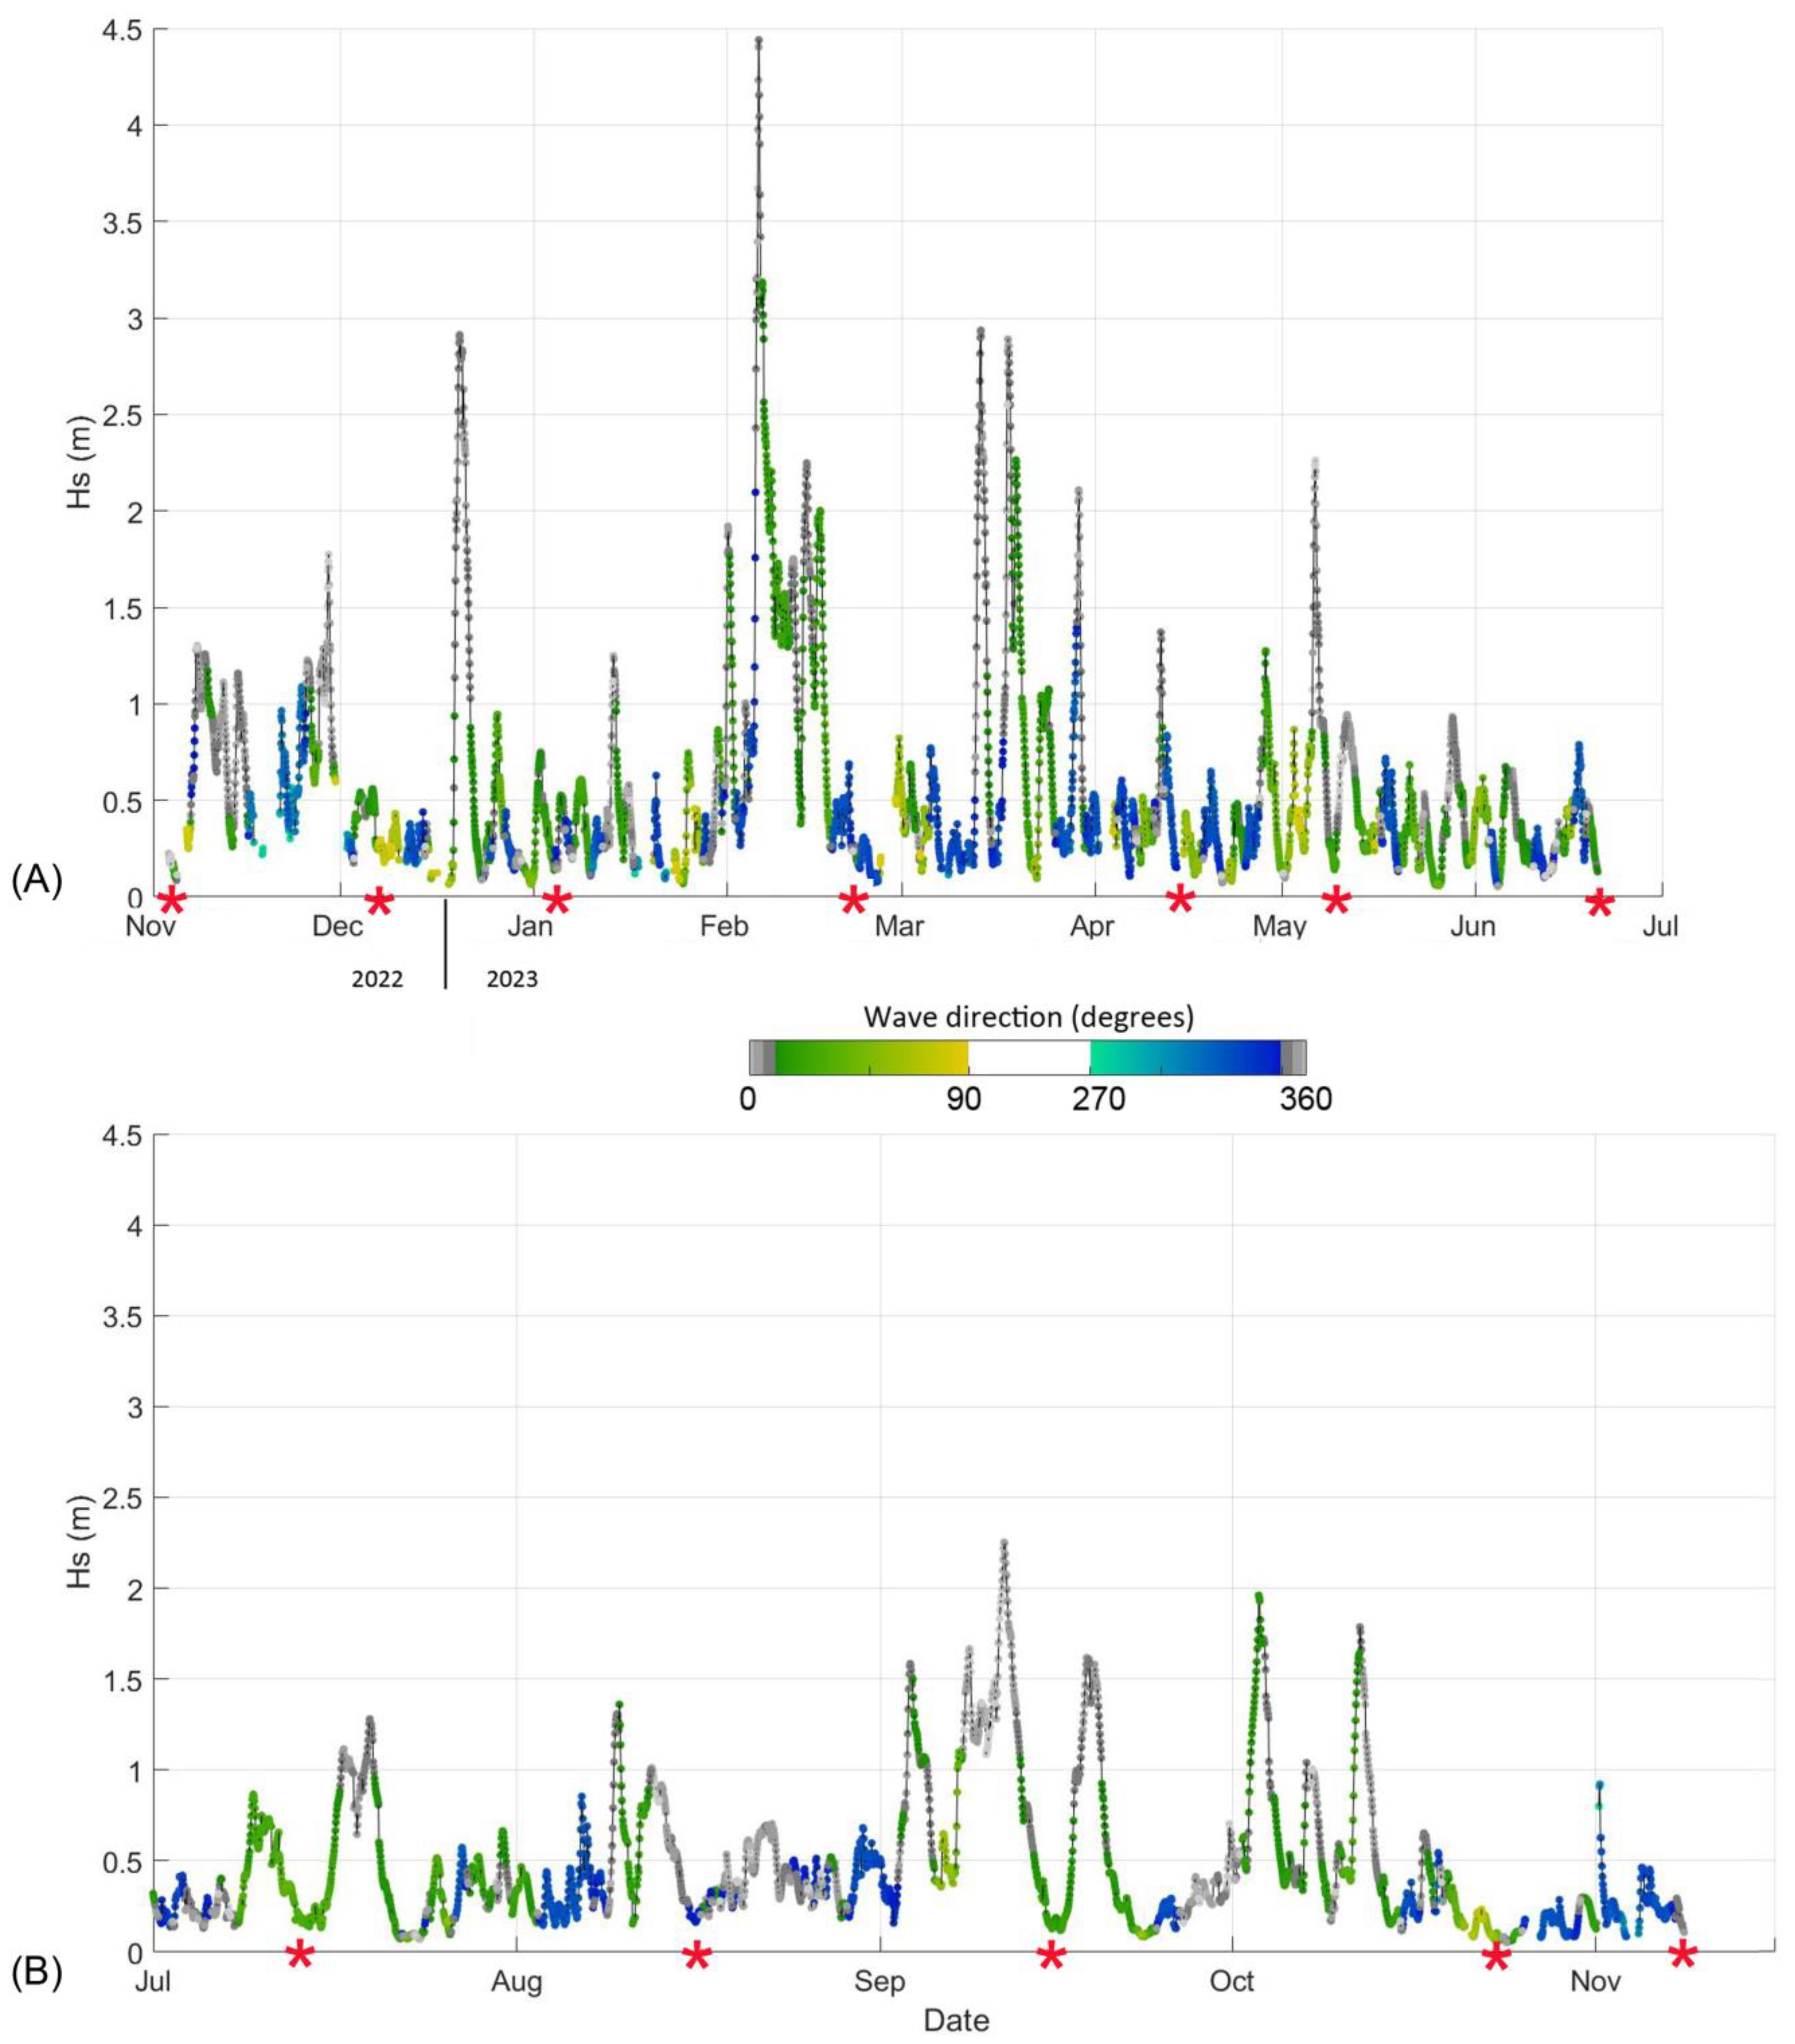
2.4. Wave Data
3. Results
3.1. Correlation with Satellite LiDAR Altimetry Data
3.2. Temporal Wave Data and PBMs
4. Discussion
4.1. Bar Migration
4.2. Workflow Applicability
5. Conclusions
Funding
Data Availability Statement
Acknowledgments
Conflicts of Interest
Appendix A

References
- Walstra, D.J.R. On the Anatomy of Nearshore Sandbars: A Systematic Exposition of Inter-Annual Sandbar Dynamics. Ph.D. Thesis, Delft University of Technology, Delft, The Netherlands, 2016. [Google Scholar]
- Aleman, N.; Certain, R.; Robin, N.; Barusseau, J.-P. Morphodynamics of Slightly Oblique Nearshore Bars and Their Relationship with the Cycle of Net Offshore Migration. Mar. Geol. 2017, 392, 41–52. [Google Scholar] [CrossRef]
- Ribas, F.; Falqués, A.; de Swart, H.E.; Dodd, N.; Garnier, R.; Calvete, D. Understanding Coastal Morphodynamic Patterns from Depth-Averaged Sediment Concentration. Rev. Geophys. 2015, 53, 362–410. [Google Scholar] [CrossRef]
- Athanasiou, P.; de Boer, W.; Yoo, J.; Ranasinghe, R.; Reniers, A. Analysing Decadal-Scale Crescentic Bar Dynamics Using Satellite Imagery: A Case Study at Anmok Beach, South Korea. Mar. Geol. 2018, 405, 1–11. [Google Scholar] [CrossRef]
- van Enckevort, I.M.J.; Ruessink, B.G.; Coco, G.; Suzuki, K.; Turner, I.L.; Plant, N.G.; Holman, R.A. Observations of Nearshore Crescentic Sandbars. J. Geophys. Res. Oceans 2004, 109, C06028. [Google Scholar] [CrossRef]
- Davidson-Arnott, R. Nearshore Bars. In Treatise on Geomorphology; Academic Press: Cambridge, MA, USA, 2022; pp. 247–269. ISBN 978-0-12-818235-2. [Google Scholar]
- van Enckevort, I.M.J.; Ruessink, B.G. Video Observations of Nearshore Bar Behaviour. Part 1: Alongshore Uniform Variability. Cont. Shelf Res. 2003, 23, 501–512. [Google Scholar] [CrossRef]
- Ruessink, B.G.; Blenkinsopp, C.; Brinkkemper, J.A.; Castelle, B.; Dubarbier, B.; Grasso, F.; Puleo, J.A.; Lanckriet, T. Sandbar and Beach-Face Evolution on a Prototype Coarse Sandy Barrier. Coast. Eng. 2016, 113, 19–32. [Google Scholar] [CrossRef]
- de Swart, R.L.; Ribas, F.; Simarro, G.; Guillén, J.; Calvete, D. The Role of Bathymetry and Directional Wave Conditions on Observed Crescentic Bar Dynamics. Earth Surf. Process. Landf. 2021, 46, 3252–3270. [Google Scholar] [CrossRef]
- Castelle, B.; Ruessink, B.G.; Bonneton, P.; Marieu, V.; Bruneau, N.; Price, T.D. Coupling Mechanisms in Double Sandbar Systems. Part 1: Patterns and Physical Explanation. Earth Surf. Process. Landf. 2010, 35, 476–486. [Google Scholar] [CrossRef]
- Elgar, S.; Gallagher, E.L.; Guza, R.T. Nearshore Sandbar Migration. J. Geophys. Res. Oceans 2001, 106, 11623–11627. [Google Scholar] [CrossRef]
- Tătui, F.; Vespremeanu-Stroe, A.; Ruessink, G.B. Alongshore Variability of Cross-Shore Bar Behavior on a Nontidal Beach. Earth Surf. Process. Landf. 2016, 41, 2085–2097. [Google Scholar] [CrossRef]
- Klemas, V. Beach Profiling and LIDAR Bathymetry: An Overview with Case Studies. J. Coast. Res. 2011, 277, 1019–1028. [Google Scholar] [CrossRef]
- Taramelli, A.; Cappucci, S.; Valentini, E.; Rossi, L.; Lisi, I. Nearshore Sandbar Classification of Sabaudia (Italy) with LiDAR Data: The FHyL Approach. Remote Sens. 2020, 12, 1053. [Google Scholar] [CrossRef]
- Freire, R.; Pe’eri, S.; Madore, B.; Rzhanov, Y.; Alexander, L.; Parrish, C.; Lippmann, T. Monitoring Near-Shore Bathymetry Using a Multi-Image Satellite-Derived Bathymetry Approach. In Proceedings of the US Hydrographic Conference 2015, National Harbor, MD, USA, 16–19 March 2015. [Google Scholar]
- Alexander, P.S.; Holman, R.A. Quantification of Nearshore Morphology Based on Video Imaging. Mar. Geol. 2004, 208, 101–111. [Google Scholar] [CrossRef]
- Janušaitė, R.; Jukna, L.; Jarmalavičius, D.; Pupienis, D.; Žilinskas, G. A Novel GIS-Based Approach for Automated Detection of Nearshore Sandbar Morphological Characteristics in Optical Satellite Imagery. Remote Sens. 2021, 13, 2233. [Google Scholar] [CrossRef]
- Kingston, K.S.; Ruessink, B.G.; van Enckevort, I.M.J.; Davidson, M.A. Artificial Neural Network Correction of Remotely Sensed Sandbar Location. Mar. Geol. 2000, 169, 137–160. [Google Scholar] [CrossRef]
- Oerlemans, S.C.M.; Nijland, W.; Ellenson, A.N.; Price, T.D. Image-Based Classification of Double-Barred Beach States Using a Convolutional Neural Network and Transfer Learning. Remote Sens. 2022, 14, 4686. [Google Scholar] [CrossRef]
- Melito, L.; Parlagreco, L.; Perugini, E.; Postacchini, M.; Devoti, S.; Soldini, L.; Zitti, G.; Liberti, L.; Brocchini, M. Sandbar Dynamics in Microtidal Environments: Migration Patterns in Unprotected and Bounded Beaches. Coast. Eng. 2020, 161, 103768. [Google Scholar] [CrossRef]
- Román-Rivera, M.A.; Ellis, J.T. A Synthetic Review of Remote Sensing Applications to Detect Nearshore Bars. Mar. Geol. 2019, 408, 144–153. [Google Scholar] [CrossRef]
- van Dongeren, A.; Plant, N.; Cohen, A.; Roelvink, D.; Haller, M.C.; Catalán, P. Beach Wizard: Nearshore Bathymetry Estimation through Assimilation of Model Computations and Remote Observations. Coast. Eng. 2008, 55, 1016–1027. [Google Scholar] [CrossRef]
- Alevizos, E.; Roussos, A.; Alexakis, D. Geomorphometric Analysis of Nearshore Sedimentary Bedforms from High-Resolution Multi-Temporal Satellite-Derived Bathymetry. Geocarto Int. 2021, 37, 8906–8923. [Google Scholar] [CrossRef]
- Capo, S.; Lubac, B.; Marieu, V.; Robinet, A.; Bru, D.; Bonneton, P. Assessment of the Decadal Morphodynamic Evolution of a Mixed Energy Inlet Using Ocean Color Remote Sensing. Ocean Dyn. 2014, 64, 1517–1530. [Google Scholar] [CrossRef]
- Misra, A.; Ramakrishnan, B. Assessment of Coastal Geomorphological Changes Using Multi-Temporal Satellite-Derived Bathymetry. Cont. Shelf Res. 2020, 207, 104213. [Google Scholar] [CrossRef]
- Tătui, F.; Constantin, S. Nearshore Sandbars Crest Position Dynamics Analysed Based on Earth Observation Data. Remote Sens. Environ. 2020, 237, 111555. [Google Scholar] [CrossRef]
- Alevizos, E.; Oikonomou, D.; Argyriou, A.V.; Alexakis, D.D. Fusion of Drone-Based RGB and Multi-Spectral Imagery for Shallow Water Bathymetry Inversion. Remote Sens. 2022, 14, 1127. [Google Scholar] [CrossRef]
- Rossi, L.; Mammi, I.; Pelliccia, F. UAV-Derived Multispectral Bathymetry. Remote Sens. 2020, 12, 3897. [Google Scholar] [CrossRef]
- Kabiri, K.; Rezai, H.; Moradi, M. A Drone-Based Method for Mapping the Coral Reefs in the Shallow Coastal Waters—Case Study: Kish Island, Persian Gulf. Earth Sci. Inform. 2020, 13, 1265–1274. [Google Scholar] [CrossRef]
- Parsons, M.; Bratanov, D.; Gaston, K.; Gonzalez, F. UAVs, Hyperspectral Remote Sensing, and Machine Learning Revolutionizing Reef Monitoring. Sensors 2018, 18, 2026. [Google Scholar] [CrossRef]
- Slocum, R.K.; Parrish, C.E.; Simpson, C.H. Combined Geometric-Radiometric and Neural Network Approach to Shallow Bathymetric Mapping with UAS Imagery. ISPRS J. Photogramm. Remote Sens. 2020, 169, 351–363. [Google Scholar] [CrossRef]
- Starek, M.J.; Giessel, J. Fusion of Uas-Based Structure-from-Motion and Optical Inversion for Seamless Topo-Bathymetric Mapping. In Proceedings of the 2017 IEEE International Geoscience and Remote Sensing Symposium (IGARSS), Fort Worth, TX, USA, 23–28 July 2017; pp. 2999–3002. [Google Scholar]
- Hashimoto, K.; Shimozono, T.; Matsuba, Y.; Okabe, T. Unmanned Aerial Vehicle Depth Inversion to Monitor River-Mouth Bar Dynamics. Remote Sens. 2021, 13, 412. [Google Scholar] [CrossRef]
- Casella, E.; Drechsel, J.; Winter, C.; Benninghoff, M.; Rovere, A. Accuracy of Sand Beach Topography Surveying by Drones and Photogrammetry. Geo-Mar. Lett. 2020, 40, 255–268. [Google Scholar] [CrossRef]
- Kandrot, S.; Hayes, S.; Holloway, P. Applications of Uncrewed Aerial Vehicles (UAV) Technology to Support Integrated Coastal Zone Management and the UN Sustainable Development Goals at the Coast. Estuaries Coasts 2022, 45, 1230–1249. [Google Scholar] [CrossRef] [PubMed]
- Kelaher, B.P.; Pappagallo, T.; Litchfield, S.; Fellowes, T.E. Drone-Based Monitoring to Remotely Assess a Beach Nourishment Program on Lord Howe Island. Drones 2023, 7, 600. [Google Scholar] [CrossRef]
- McDonald, K.K.; Fletcher, C.H.; Anderson, T.R.; Habel, S. Weekly Small Uncrewed Aerial System Surveys, Structure from Motion, and Empirical Orthogonal Function Analyses Reveal Unique Modes of Sediment Exchange Generated by Seasonal and Episodic Phenomena: Waikīkī, Hawai’i. Remote Sens. 2022, 14, 5108. [Google Scholar] [CrossRef]
- Richter, K.; Mader, D.; Sardemann, H.; Maas, H.-G. UAV-Based LiDAR Bathymetry at an Alpine Mountain Lake. Int. Arch. Photogramm. Remote Sens. Spat. Inf. Sci. 2024, XLVIII-2-2024, 341–348. [Google Scholar] [CrossRef]
- Wang, D.; Xing, S.; He, Y.; Yu, J.; Xu, Q.; Li, P. Evaluation of a New Lightweight UAV-Borne Topo-Bathymetric LiDAR for Shallow Water Bathymetry and Object Detection. Sensors 2022, 22, 1379. [Google Scholar] [CrossRef]
- Mandlburger, G.; Pfennigbauer, M.; Schwarz, R.; Flöry, S.; Nussbaumer, L. Concept and Performance Evaluation of a Novel UAV-Borne Topo-Bathymetric LiDAR Sensor. Remote Sens. 2020, 12, 986. [Google Scholar] [CrossRef]
- Agrafiotis, P.; Skarlatos, D.; Georgopoulos, A.; Karantzalos, K. Shallow Water Bathymetry Mapping from UAV Imagery Based on Machine Learning. Int. Arch. Photogramm. Remote Sens. Spat. Inf. Sci. 2019, XLII-2/W10, 9–16. [Google Scholar] [CrossRef]
- Dietrich, J.T. Bathymetric Structure-from-Motion: Extracting Shallow Stream Bathymetry from Multi-View Stereo Photogrammetry. Earth Surf. Process. Landf. 2017, 42, 355–364. [Google Scholar] [CrossRef]
- Alevizos, E.; Alexakis, D.D. Monitoring Short-Term Morphobathymetric Change of Nearshore Seafloor Using Drone-Based Multispectral Imagery. Remote Sens. 2022, 14, 6035. [Google Scholar] [CrossRef]
- Stumpf, R.P.; Holderied, K.; Sinclair, M. Determination of Water Depth with High-Resolution Satellite Imagery over Variable Bottom Types. Limnol. Oceanogr. 2003, 48, 547–556. [Google Scholar] [CrossRef]
- Caballero, I.; Stumpf, R.P. Retrieval of Nearshore Bathymetry from Sentinel-2A and 2B Satellites in South Florida Coastal Waters. Estuar. Coast. Shelf Sci. 2019, 226, 106277. [Google Scholar] [CrossRef]
- Gómez-Pujol, L.; Orfila, A.; Álvarez-Ellacuría, A.; Tintoré, J. Controls on Sediment Dynamics and Medium-Term Morphological Change in a Barred Microtidal Beach (Cala Millor, Mallorca, Western Mediterranean). Geomorphology 2011, 132, 87–98. [Google Scholar] [CrossRef]
- Ribas, F.; Falqués, A.; Garnier, R. Nearshore Sand Bars on Western Mediterranean Beaches. In Atlas of Bedforms in the Western Mediterranean; Guillén, J., Acosta, J., Chiocci, F.L., Palanques, A., Eds.; Springer: Berlin/Heidelberg, Germany, 2017; pp. 81–88. ISBN 978-3-319-33938-2. [Google Scholar]
- Petrakis, S.; Alexandrakis, G.; Poulos, S. Recent and Future Trends of Beach Zone Evolution in Relation to Its Physical Characteristics: The Case of the Almiros Bay (Island of Crete, South Aegean Sea). Glob. Nest J. 2014, 16, 104–113. [Google Scholar]
- Soukissian, T.; Prospathopoulos, A.; Korres, G.; Papadopoulos, A.; Hatzinaki, M.; Kambouridou, M. A New Wind and Wave Atlas of the Hellenic Seas. In Proceedings of the ASME 2008 27th International Conference on Offshore Mechanics and Arctic Engineering, Estoril, Portugal, 15–20 June 2008; pp. 791–799. [Google Scholar]
- Alevizos, E. Temporal (Monthly) RGB Orthomosaics from Episkopi Beach (North Crete, Greece) Using the DJI Mavic Air 2 Drone. 2024. Available online: https://doi.pangaea.de/10.1594/PANGAEA.973651 (accessed on 22 May 2024).
- Purkis, S.J. Remote Sensing Tropical Coral Reefs: The View from Above. Annu. Rev. Mar. Sci. 2018, 10, 149–168. [Google Scholar] [CrossRef] [PubMed]
- Gao, M.; Xing, S.; Zhang, G.; Zhang, X.; Li, P. Assessment of ICESat-2′s Horizontal Accuracy Using an Iterative Matching Method Based on High-Accuracy Terrains. Remote Sens. 2023, 15, 2236. [Google Scholar] [CrossRef]
- Parrish, C.; Magruder, L.; Neuenschwander, A.; Forfinski-Sarkozi, N.; Alonzo, M.; Jasinski, M. Validation of ICESat-2 ATLAS Bathymetry and Analysis of ATLAS’s Bathymetric Mapping Performance. Remote Sens. 2019, 11, 1634. [Google Scholar] [CrossRef]
- Mediterranean Sea Waves Analysis and Forecast. Available online: https://data.marine.copernicus.eu/product/MEDSEA_ANALYSISFORECAST_WAV_006_017/description (accessed on 22 May 2024).
- Ojeda, E.; Guillén, J.; Ribas, F. Dynamics of Single-Barred Embayed Beaches. Mar. Geol. 2011, 280, 76–90. [Google Scholar] [CrossRef]
- Cohn, N.; Ruggiero, P.; Ortiz, J.; Walstra, D.J. Investigating the Role of Complex Sandbar Morphology on Nearshore Hydrodynamics. J. Coast. Res. 2014, 70, 53–58. [Google Scholar] [CrossRef]
- Montreuil, A.-L.; Moelans, R.; Houthuys, R.; Bogaert, P.; Chen, M. Assessing Storm Response of Multiple Intertidal Bars Using an Open-Source Automatic Processing Toolbox. Remote Sens. 2022, 14, 1005. [Google Scholar] [CrossRef]
- Rafati, Y.; Hsu, T.-J.; Elgar, S.; Raubenheimer, B.; Quataert, E.; van Dongeren, A. Modeling the Hydrodynamics and Morphodynamics of Sandbar Migration Events. Coast. Eng. 2021, 166, 103885. [Google Scholar] [CrossRef]
- Price, T.D.; Ruessink, B.G. State Dynamics of a Double Sandbar System. Cont. Shelf Res. 2011, 31, 659–674. [Google Scholar] [CrossRef]
- Alevizos, E.; Alexakis, D.D. Evaluation of Radiometric Calibration of Drone-Based Imagery for Improving Shallow Bathymetry Retrieval. Remote Sens. Lett. 2022, 13, 311–321. [Google Scholar] [CrossRef]
- Alevizos, E. How to Create High Resolution Digital Elevation Models of Terrestrial Landscape Using UAV Imagery and Open-Source Software. 2019. Available online: https://www.researchgate.net/publication/333248069_HOW_TO_CREATE_HIGH_RESOLUTION_DIGITAL_ELEVATION_MODELS_OF_TERRESTRIAL_LANDSCAPE_USING_UAV_IMAGERY_AND_OPEN-SOURCE_SOFTWARE?channel=doi&linkId=5ce44566299bf14d95af4098&showFulltext=true (accessed on 11 March 2023).
- Román, A.; Tovar-Sánchez, A.; Olivé, I.; Navarro, G. Using a UAV-Mounted Multispectral Camera for the Monitoring of Marine Macrophytes. Front. Mar. Sci. 2021, 8, 722698. [Google Scholar] [CrossRef]


| Drone Survey Date | Flight Altitude (m.asl) | Number of Images | Sun Elevation (Degrees) | |
|---|---|---|---|---|
| 1. | 03/11/2022 | 254 | 36 | 19 |
| 2. | 07/12/2022 | 287 | 45 | 21 |
| 3. | 04/01/2023 | 300 | 38 | 24 |
| 4. | 17/02/2023 | 305 | 44 | 34 |
| 5. | 14/04/2023 | 327 | 42 | 18 |
| 6. | 09/05/2023 | 319 | 42 | 29 |
| 7. | 20/06/2023 | 330 | 38 | 32 |
| 8. | 13/07/2023 | 356 | 47 | 29 |
| 9. | 16/08/2023 | 351 | 34 | 19 |
| 10. | 15/09/2023 | 360 | 41 | 23 |
| 11. | 23/10/2023 | 353 | 43 | 18 |
| 12. | 08/11/2023 | 354 | 46 | 20 |
Disclaimer/Publisher’s Note: The statements, opinions and data contained in all publications are solely those of the individual author(s) and contributor(s) and not of MDPI and/or the editor(s). MDPI and/or the editor(s) disclaim responsibility for any injury to people or property resulting from any ideas, methods, instructions or products referred to in the content. |
© 2024 by the author. Licensee MDPI, Basel, Switzerland. This article is an open access article distributed under the terms and conditions of the Creative Commons Attribution (CC BY) license (https://creativecommons.org/licenses/by/4.0/).
Share and Cite
Alevizos, E. Quantification of Nearshore Sandbar Seasonal Evolution Based on Drone Pseudo-Bathymetry Time-Lapse Data. Remote Sens. 2024, 16, 4551. https://doi.org/10.3390/rs16234551
Alevizos E. Quantification of Nearshore Sandbar Seasonal Evolution Based on Drone Pseudo-Bathymetry Time-Lapse Data. Remote Sensing. 2024; 16(23):4551. https://doi.org/10.3390/rs16234551
Chicago/Turabian StyleAlevizos, Evangelos. 2024. "Quantification of Nearshore Sandbar Seasonal Evolution Based on Drone Pseudo-Bathymetry Time-Lapse Data" Remote Sensing 16, no. 23: 4551. https://doi.org/10.3390/rs16234551
APA StyleAlevizos, E. (2024). Quantification of Nearshore Sandbar Seasonal Evolution Based on Drone Pseudo-Bathymetry Time-Lapse Data. Remote Sensing, 16(23), 4551. https://doi.org/10.3390/rs16234551