Article

New Hyperspectral Geometry Ratio Index for Monitoring Rice Blast Disease from Leaf Scale to Canopy Scale

1
Engineering Laboratory of Spatial Information Technology of Highway Geological Disaster Early Warning in Hunan Province, Changsha University of Science & Technology, Changsha 410114, China
2
Key Laboratory of Smart Agricultural Technology in Tropical South China, Ministry of Agriculture and Rural Affairs, Guangzhou 510642, China
3
Department of Geomatics Engineering, School of Traffic & Transportation Engineering, Changsha University of Science & Technology, Changsha 410114, China
4
Key Lab of Guangdong for Utilization of Remote Sensing and Geographical Information System, Guangdong Open Laboratory of Geospatial Information Technology and Application, Research Center of Guangdong Province for Engineering Technology Application of Remote Sensing Big Data, Guangzhou Institute of Geography, Guangdong Academy of Sciences, Guangzhou 510070, China
5
Shenzhen Institute of Advanced Technology, Chinese Academy of Sciences, Shenzhen 518055, China
6
Key Laboratory of Digital Earth Science, Aerospace Information Research Institute, Chinese Academy of Sciences, Beijing 100094, China
7
College of Mathematics and Informatics, South China Agricultural University, Guangzhou 510642, China
*
Author to whom correspondence should be addressed.
Remote Sens. 2024, 16(24), 4681; https://doi.org/10.3390/rs16244681
Submission received: 13 November 2024 / Revised: 10 December 2024 / Accepted: 12 December 2024 / Published: 15 December 2024

Abstract

:
Rice blast is a highly damaging disease that greatly impacts both the quality and yield of rice. Timely identification and monitoring of this disease are essential for effective agricultural management and for ensuring optimal crop performance. The spectral vegetation index has been widely used in the identification of crop diseases. However, a limitation of these indices is that they cannot identify diseases at different scales. This study aimed to address these issues by developing the rice blast-specific hyperspectral Geometry Ratio Vegetation Index (GRVIRB) for monitoring rice blast disease at the leaf and canopy scales. The sensitive bands for identifying rice blast disease were 688 nm, 756 nm, and 1466 nm using the successive projection algorithm. Based on these three sensitive bands and the spectral response mechanism of rice blast, the GRVIRB was designed. GRVIRB demonstrated high classification accuracy using SVM (support vector machine) and LDA (Linear Discriminant Analysis) models in leaf-scale and canopy-scale datasets from 2020 and 2021, surpassing the current vegetation indices of rice blast detection. It is demonstrated that the GRVIRB has excellent robustness and universality for rice blast detection from leaf to canopy scales in different years. Additionally, the research suggests that the new hyperspectral vegetation index can serve as a valuable reference for studies conducted at both unmanned aerial vehicle and satellite scales.

1. Introduction

Rice serves as a fundamental dietary component for over half the global population and is a cornerstone of food security worldwide [1]. However, the sustainability of rice production is heavily compromised by a multitude of plant diseases, and rice blast disease, caused by a pathogenic fungus, is among the most destructive diseases affecting rice [2]. The disease fungi can generate conidia within the temperature range of 10 to 35 °C (25–28 °C is the most suitable), and they can quickly spread among plants via air and water currents, infecting rice plants and transferring to adjacent tissues, which leads to the disease in rice [3]. It is estimated that the amount of rice lost annually due to the rice blast disease is sufficient to cater to the dietary needs of 60 million people [4,5,6]. Rice leaf blast disease occurs in rice leaves, which causes serious damage to leaf tissue cells, decreases photosynthesis in rice plants, and has a negative impact on rice growth and development [7]. Rice leaf blast has the potential to inflict drastic reductions in crop yields, which can adversely affect the economic stability of farmers and the integrity of the food supply chain. Therefore, effective prevention and monitoring of rice leaf blast is essential, not only for preserving the quality and yield of rice but also for protecting the food supply of more than a billion people around the globe [8].
Traditionally, the primary method for detecting rice leaf blast has been through manual field inspections. However, this traditional approach is not only labor-intensive and slow, but it also poses environmental risks, especially when over-reliance on pesticides exacerbates ecological damage [9]. Remote sensing is the only technological approach capable of rapidly acquiring spatially continuous surface data in a large region; as a result, it has found extensive application in monitoring agricultural diseases and pests [10,11,12]. Hyperspectral remote sensing technology is an important technical field of remote sensing science. The application of hyperspectral remote sensing data in monitoring crop pests and diseases is widespread, owing to its abundant wavelength information and high spectral resolution [8]. For instance, Liu et al. revealed that certain spectral bands, particularly around 410, 470, 490, 570, 625, 665, and 720 nm, show high sensitivity in identifying the presence of leaf folders [13]. These specific wavelengths play a critical role in accurately detecting the pest. This discovery is consistent with the work of Huang et al., who pinpointed the 747–754 nm wavelength range as particularly effective for detecting leaf folders through an analysis of rice canopy spectral data [14].
Recently, vegetation indices (VIs) have become a powerful tool for analyzing physiological and biochemical changes in crops for crop identification [15]. Instead of screening based on spectral features and wavelengths, VIs can make the information in spectra more useful by using special relational expressions. VIs also have the capacity to reduce the influence of external conditions, such as changes in illumination, to some extent, resulting in improved stability [16,17]. Research has demonstrated that VIs possess a significant potential for use in the identification of crop diseases. For instance, Zheng et al. found a new spectral index (REDSI) which was proposed to detect yellow rust infection at different severity levels [18]. Zhao et al. developed a rice blast-specific vegetation index (RBVI) designed to qualitatively assess the severity of leaf blast disease within the field canopy [7]. Zhang et al. found that the physiological reflectance index (PhRI) was the sole indicator demonstrating sensitivity to yellow rust disease throughout all stages of plant growth [12]. However, there is less research on rice blast and a serious lack of hyperspectral vegetation indices dedicated to rice blast monitoring, and conventional vegetation indices (VIs) are inadequate for effectively capturing the detailed spectral responses linked to host–pathogen interactions, limiting their ability to provide insights into these complex dynamics. Consequently, they are unable to accurately reflect or represent the response mechanisms associated with specific diseases, which can lead to substantial errors in detecting diseases over large areas [19,20]. Moreover, the existing vegetation indexes are applied at a single scale, and there are shortcomings in the accuracy of rice disease monitoring when applied at different scales.
Therefore, the main goal of this study is to build a hyperspectral vegetation index specifically for rice blast, aimed at improving the monitoring and detection of the disease in rice crops at both the leaf and canopy scales. The aims of this study were (1) to explore the spectral response mechanism of rice leaf blast with different severity; (2) select the most sensitive bands for identifying healthy rice and infected rice; (3) propose a new vegetation index for discriminating rice blast-infected rice from healthy rice; and (4) to validate the capability of the new index in identifying rice blast disease and to apply it at different scales.

2. Materials and Methods

2.1. Study Area and Experimental Design

The experimental site is located in Lianma Village, Lvtian Town, Conghua District, Guangzhou City, Guangdong Province, China (23°53′27″N, 114°0′20″E). This region experiences an average annual rainfall of 1899.8 mm and an average yearly temperature of 21.9 °C. Due to the favorable environmental conditions created by elevated temperature and humidity, rice blast occurs nearly annually in this area throughout the rice growth season. The region plays a significant role in the occurrence of rice plague and serves as a long-term monitoring point for the disease at the Institute of Plant Protection, Guangdong Academy of Agricultural Sciences.
Four separate field campaigns were carried out in this area during the years 2020 and 2021. Field investigations and interviews with local farmers have established that rice blast is the sole pathogen affecting this region. As shown in Table 1, the study was designed to encompass a wide range of infection levels, from healthy canopies to those severely impacted by the disease. In 2020, the measurements of canopy reflectance (47 infected and 31 healthy sampling points) and leaf reflectance (80 infected and 41 healthy sampling points) were conducted on 9 September. In 2021, the measurements of canopy reflectance (42 infected and 59 healthy sampling points) and leaf reflectance (81 infected and 40 healthy sampling points) were conducted on 6 June. The estimation of the disease index and the collection of canopy spectral data were conducted simultaneously at the same locations.
The reflectance measurements of healthy leaves and rice blast-infected leaves collected in 2021 were used as the training set to distinguish the specific spectral response caused by pathogen infection and to develop the new spectral index based on these data. To validate the superiority and universality of the new index compared to previously proposed vegetation indices, leaf reflectance data from 2020 were used as an independent dataset for verification. Additionally, canopy data from 2020 and 2021 were utilized to test the applicability of the proposed new index at the canopy scale. To control variables influencing the development of the new index across different scales, the spectral data collected from both leaf and canopy experiments were restricted to the range of 350–2500 nm. This restriction was implemented to ensure accurate and consistent comparisons between the two datasets.

2.2. Data Acquisition

2.2.1. Measurement of Leaf and Canopy Reflectance Spectra

The measurement of leaf and canopy reflectance was conducted using an ASD FieldSpec spectroradiometer (Analytical Spectral Devices, Inc., Boulder, CO, USA) connected to a contact fiber-optic cable. The spectral measurements were taken within the wavelength range of 350 to 2500 nm. The spectral sampling interval was 1.4 nm for wavelengths between 350 and 1000 nm and 1.1 nm for wavelengths between 1001 and 2500 nm.
The process of leaf spectral measurement involved using an ASD leaf clip to capture reflectance spectra from a 10 mm radius area illuminated by a halogen bulb. For each sample, 2–3 rice leaves were carefully arranged to completely cover the leaf clip, ensuring the quality of the measurement data. For each leaf, three separate spectra were recorded from the upper surface at three distinct points—one-third, halfway, and two-thirds of the distance from the leaf base. This method ensured comprehensive coverage of the leaf’s spectral properties across its surface. To reduce random measurement errors, ten spectral measurements were taken at each location, and the average of three sets of measurements was used as the final spectrum for that sample. The spectral measurement was carried out from 10:00 a.m. to 2:00 p.m. on a sunny and cloudless day. Before measuring canopy reflectance, the instrument was optimized. All measurements of canopy spectra were performed at a height of 1.3 m above the ground, with a field of view of 25°. In order to remove spectral variations influenced by sunlight and environmental changes, spectral measurements were calibrated using a 40 cm × 40 cm BaSO4 white panel.

2.2.2. Estimation of the Proportion of Leaf Spots and Canopy Disease Index

Accurate extraction of rice blast spots is a critical step in both diagnosing the disease and accurately assessing its severity. Traditional rice blast spot estimation mainly relies on visual estimation by relevant agronomy professionals, which is highly subjective and slow to identify, with a high identification error and low real-time performance. Therefore, using image segmentation technology, we extracted the leaf area and lesion area of the rice blast-infected leaves collected. The rice blast Disease Ratio (DR) is calculated by determining the proportion of the infected area relative to the total leaf area:
D R = A S A L
where AS is the number of diseased spot pixels in the image, and AL is the number of leaf range pixels in the image.
The calculated severity of rice blast was used to derive the Disease Index (DI) based on the framework provided by the National Standard of China (GB/T 15790–2009) [3] titled “Rules of Investigation and Forecast for Rice Blast (Pyricularia oryzae (Cavara))”. This standard was applied to evaluate the extent of the disease, and the DI was established for each plot as a measure of the overall infection level across the field:
D I = 0 5 ( n × l ) M a x _ L × 0 5 n
Here, “l” denotes the level of infection. “n” stands for the quantity of leaves corresponding to each infection level. “Max_L” represents the highest incidence level that is observed at each site.

2.2.3. Hyperspectral Vegetation Index Commonly Used in Vegetation Disease Identification
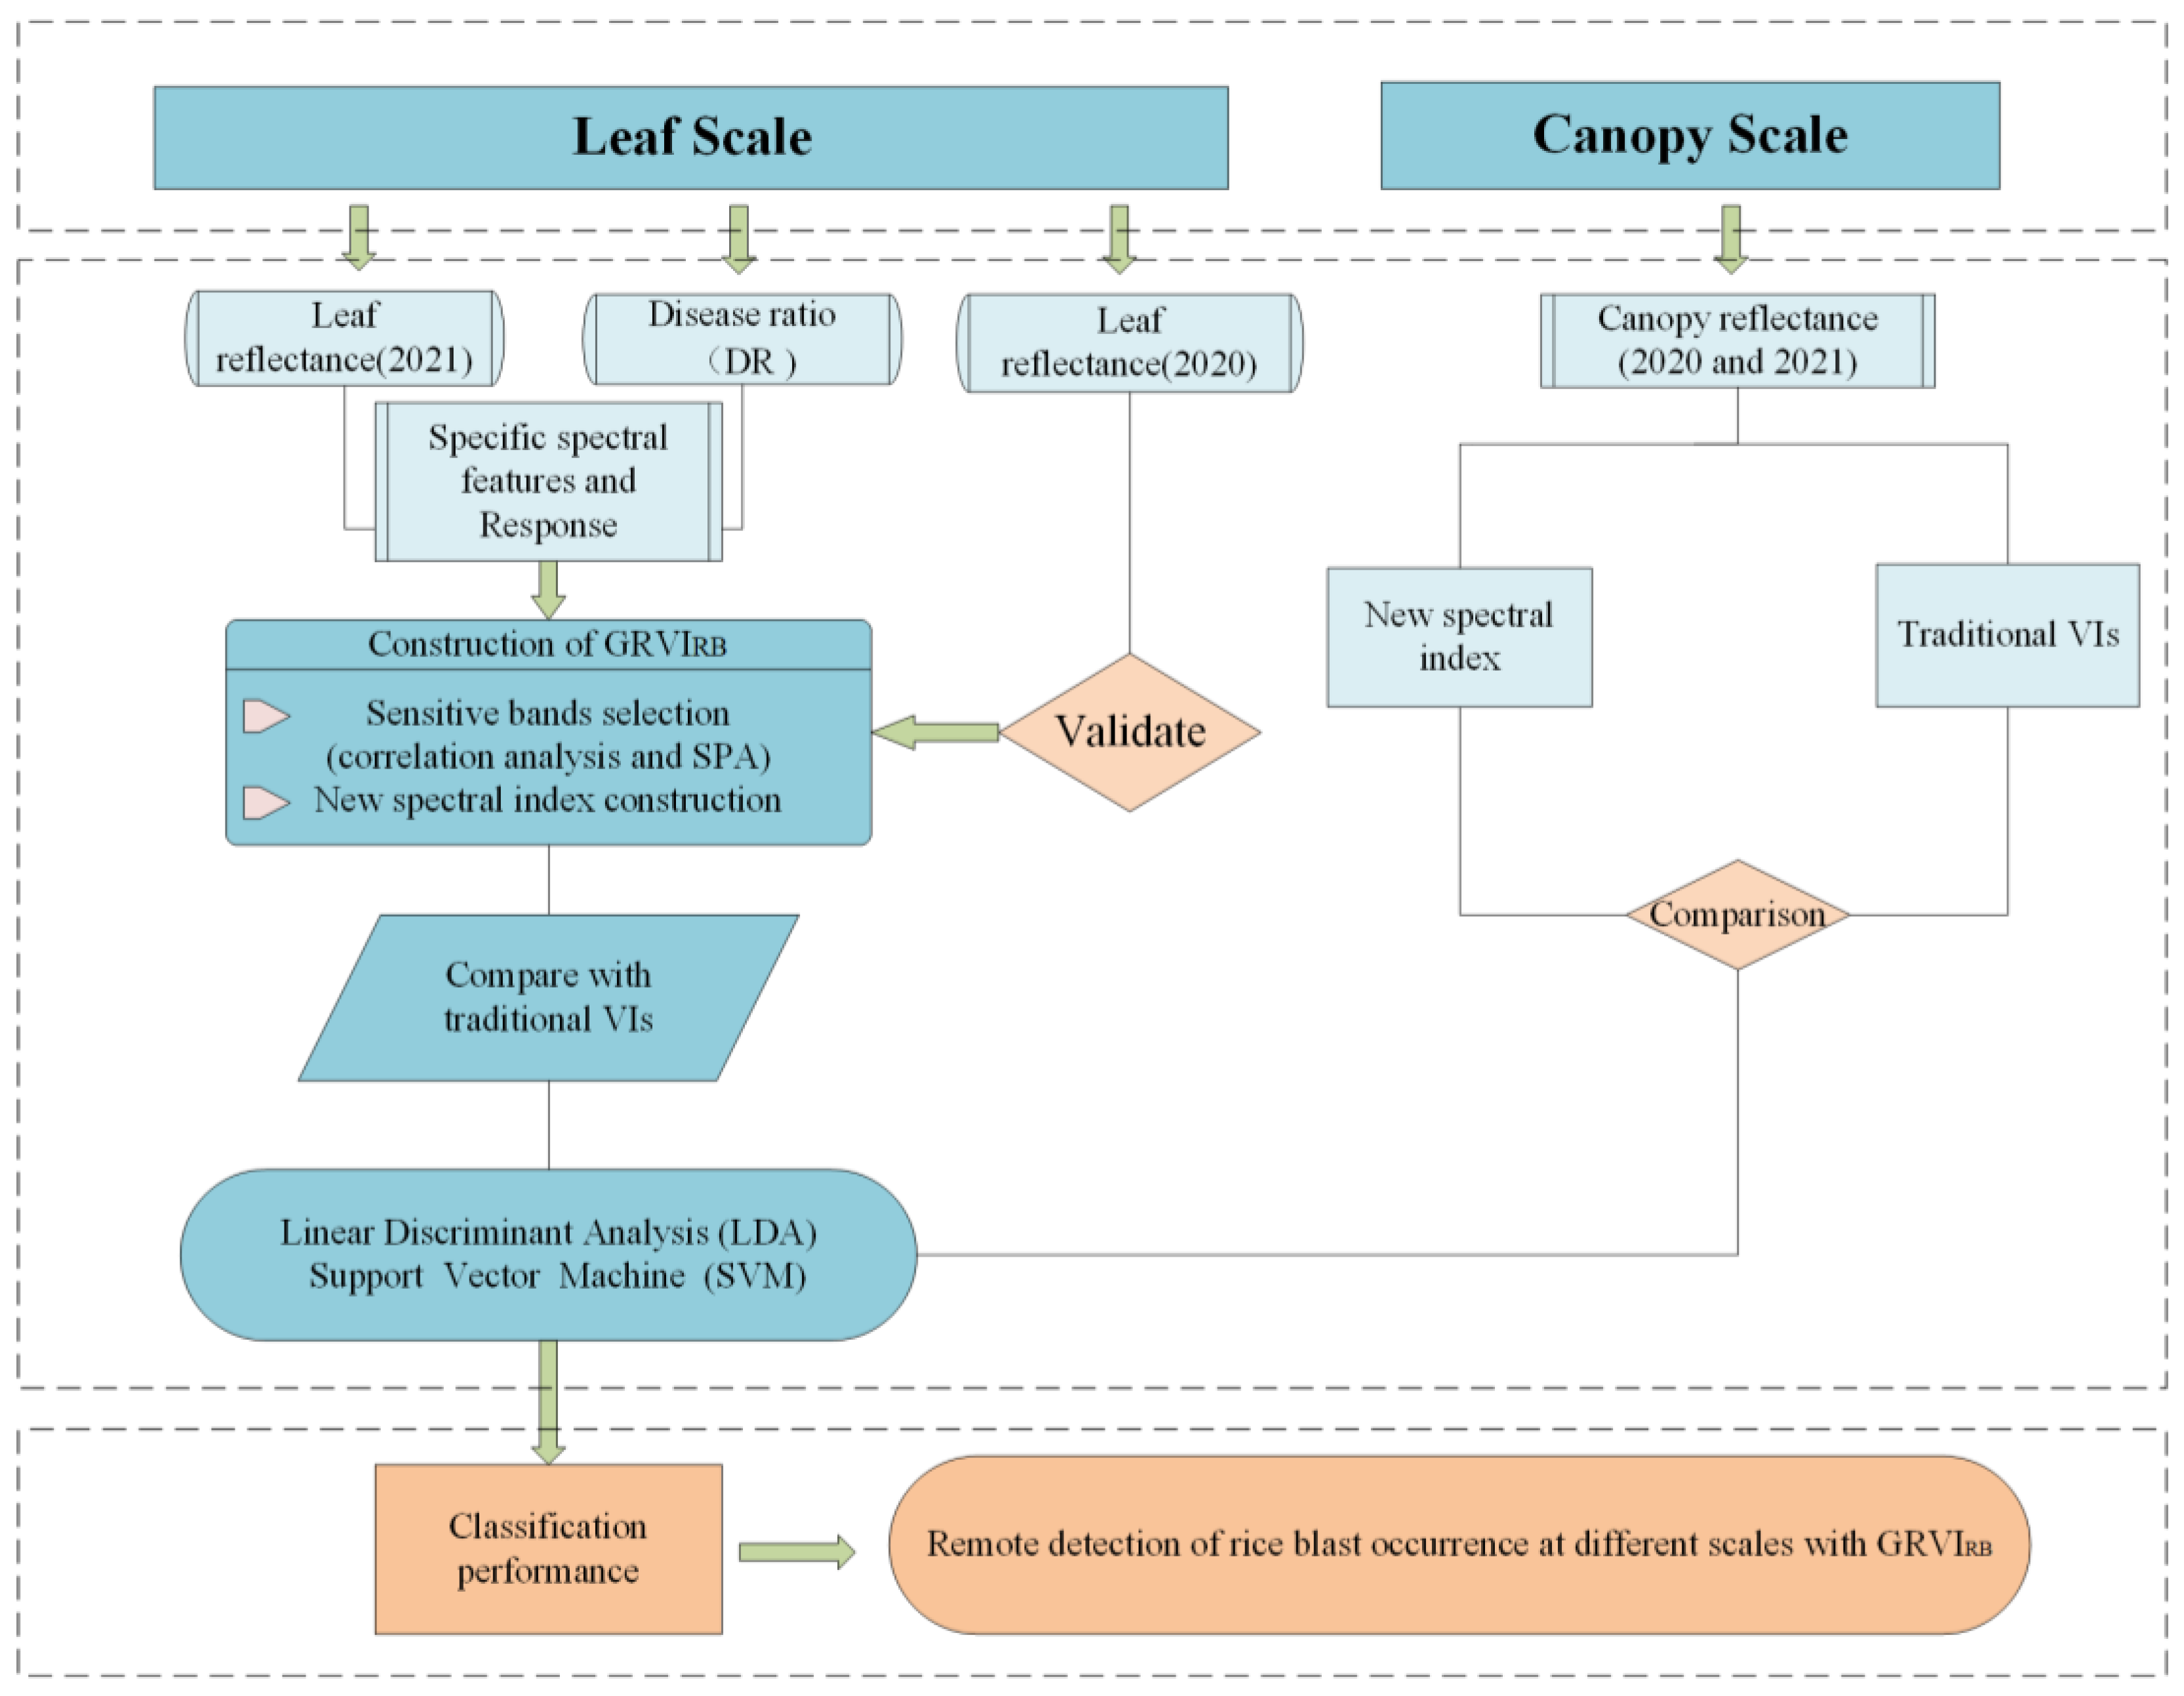
Spectral indices are highly correlated with crop physiological and biochemical information and have been widely applied in monitoring, analyzing, and mapping the temporal and spatial changes in vegetation [21]. By calculating relevant vegetation indices that reflect different physiological states of vegetation, it is possible to effectively distinguish between healthy rice and rice infected with blast disease. This research primarily selects 17 vegetation indices that included a comprehensive range of vegetation structure (e.g., leaf area index (LAI), green biomass), pigments (e.g., chlorophyll, carotenoid, and anthocyanin), biochemical parameters (e.g., cellulose, nitrogen), water and stress conditions, and rice blast identification indices that have been proposed by scholars, such as the RBI and RIBIs [3,22]. The 17 spectral vegetation indices utilized in this study, along with their respective formulations, are presented in Table 2.

2.3. Methodology

Figure 1 presents a flowchart of a new spectral index for rice blast detection that was developed based on hyperspectral data. By collecting healthy and diseased leaf samples across various years and scales, and considering the specific spectral responses triggered by rice blast infection, we selected sensitive single-band sections to form a new spectral index based on the spectral response. To demonstrate the superiority of the new spectral index in detecting and identifying rice blast, we used it in conjunction with traditional vegetation indices to compare the classification performance of health and diseases across various scales and years.

2.3.1. Selection of Spectral Features of Rice Blast

In this study, a correlation analysis for the sensitive band range determination and the successive projection algorithm was used as the feature selection method. The successive projection algorithm (SPA) is a forward variable selection algorithm designed to efficiently streamline the dataset by substantially reducing the number of variables involved, while also minimizing the covariance between them and eliminate redundant information in the original spectral matrix data, and thus greatly improve the modeling speed and efficiency [37]. The basic steps are as follows: First, any initial wavelength is selected as the initial iteration vector, and then the iteration is looped sequentially to calculate the projection of this wavelength on other wavelengths. The wavelength that corresponds to the highest projection value is picked as the option to be selected. This selection procedure persists until the quantity of selected wavelengths fulfills the established conditions.

2.3.2. Linear Discriminant Analysis

The linear discriminant analysis (LDA) model makes use of non-parametric K-means clustering to establish a classification framework. This approach has gained widespread application in the field of agricultural disease classification [38]. In this study, the linear discriminant model is employed. The LDA model in this chapter is utilized to evaluate and assess the effectiveness of vegetation indices in monitoring stripe rust. In practical implementation, the disease index of the canopy is classified into healthy and diseased categories based on quantitative measures. The accuracy of this classification should be verified using the leave-one-out cross-validation method. In this method, each sample is used as a validation sample in the model. At the same time, N-1 samples are used as training samples. Here, N represents the total number of samples. Eventually, N models will be generated, and the mean classification accuracy of the verified data from these N models will be used as the performance measure for the LDA model.

2.3.3. Support Vector Machine

To explore the stability of different data sources in rice blast monitoring, this study employs the supported vector machine (SVM) algorithm to assess the monitoring accuracy. The SVM is a dichotomous model whose core idea is to find a hyperplane in space and map the samples onto it [39]. The goal is to ensure that the distance between all the data in the sample set and the hyperplane is minimized. Among various options, radial basis functions are widely used and highly regarded in academic circles. The radial basis function (RBF) is often considered equivalent to the Gaussian function as they possess similar mathematical properties and applications. The kernel is also known as the Gaussian kernel, and its corresponding mapping function maps the space to an infinite-dimensional one. In this paper, the study utilizes the radial basis function (RBF) to map the sample data to the high-dimensional space.

2.3.4. Precision Evaluation

The confusion matrix, also known as the error matrix, is primarily used to compare classification results with actual observations. It is an important tool for evaluating the performance of a classifier. The various evaluation metrics derived from the confusion matrix are often used for model evaluation. In this study, four metrics are selected to evaluate the model: overall accuracy (OA), user’s accuracy (UA), producer’s accuracy (PA), and the kappa coefficient.

3. Results

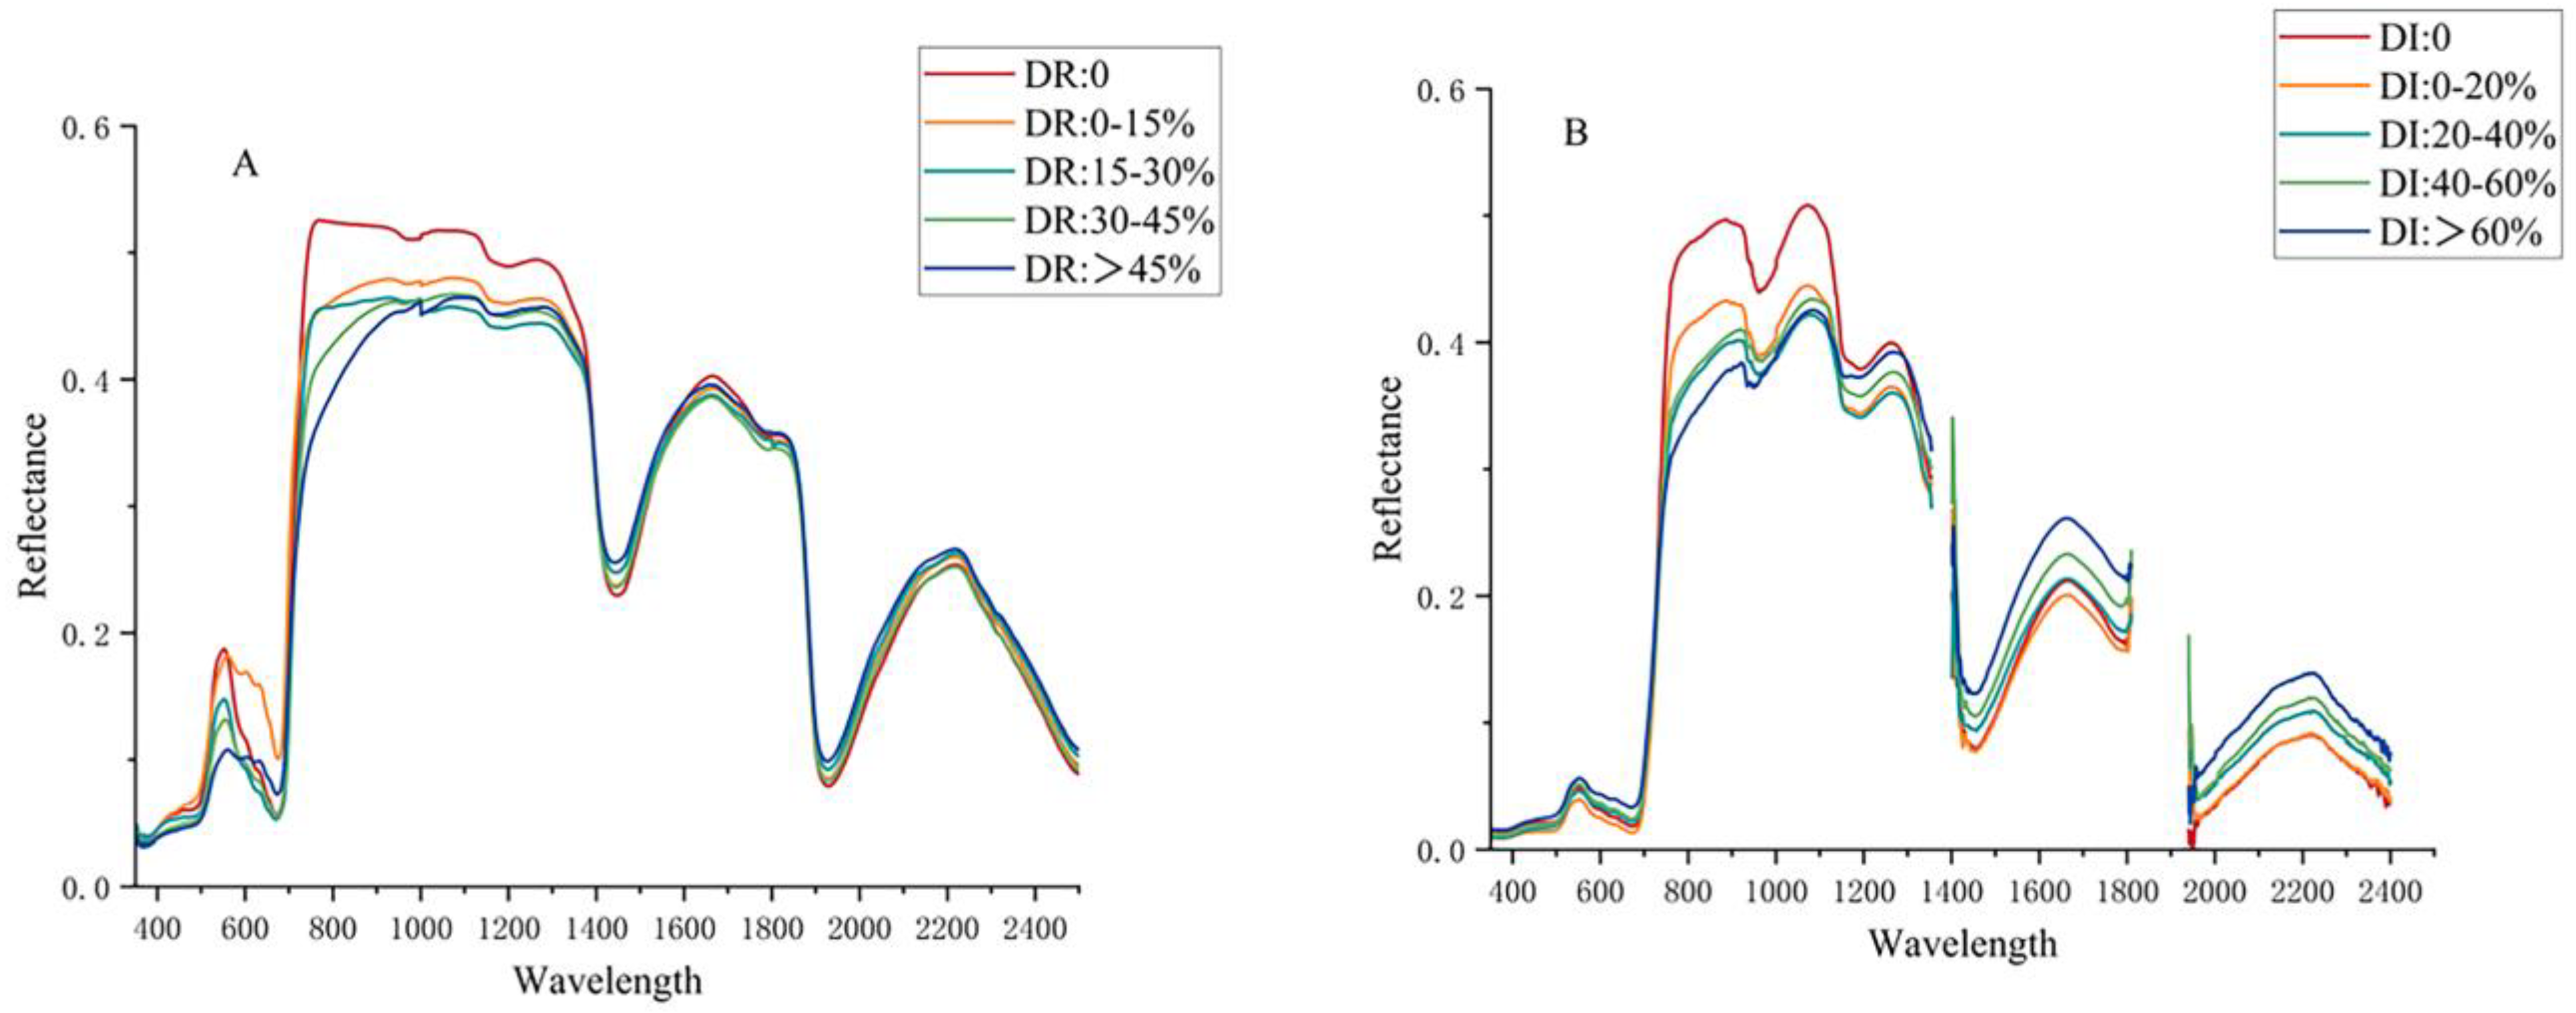
3.1. Responses of Reflectance at Both Leaf and Canopy Scales to Rice Blast Infection

Spectral reflectance changes in rice under pest and disease stress conditions serve as a fundamental basis for remote sensing monitoring [40]. At the leaf scale (as shown in Figure 2A), a general analysis reveals that both healthy samples and samples with varying levels of infection exhibit typical vegetation spectral characteristics, including green peaks, red valleys, near-infrared plateaus, and two water vapor absorption bands. A more detailed analysis shows that the spectral reflectance curves of the infected leaves are generally flatter compared to healthy leaves. Infected leaves exhibit reduced slopes in the red-edge region, lower overall reflectance, and typically higher reflectance within the 400–700 nm and 900–2500 nm ranges. As the severity of the disease increases, the DR value also increases; spectral reflectance decreases continuously in the near-infrared plateau while increasing in the shortwave region. This occurrence can be explained by a substantial decline in key biochemical properties, such as chlorophyll, carotenoids, and water content, in leaves that are under the stress of rice blast infection [41]. The reason for this variation in spectral reflectance characteristics may be explained from the point of view of plant disease physiology: When rice is infected by the rice blast fungus, the invasive filaments produced by the adhering cells first fill in the cellular interstices, so that the cellular structure and interstices of the healthy leaves are changed, and there is a continuous loss of water, which results in a decrease in the reflectance capacity of the water to the near-infrared region. As the invasive filaments penetrate further into the leaf cells, the chlorophyll is gradually destroyed and the energy absorption capacity for photosynthesis is diminished, leading to a decrease in the water-holding ability of the cells, reduced chlorophyll content, and lowered photosynthetic intensity. This cascade of effects causes a decline in reflectance in the near-infrared and green-light regions of the affected paddy, while reflectance in the red-light region increases [42].
At the canopy scale (as shown in Figure 2B), the study discovered a spectral response pattern of rice blast similar to that at the leaf scale. The effects were even more prominent in the NIR-SWIR regions, particularly noticeable at the water absorption peaks around 970 nm and 1240 nm. On the contrary, the variation in the spectral reflectance of the infected samples in the visible spectrum is extremely small, showing only slight differences compared to what was observed at the leaf scale. Additionally, due to significant noise at the end of the spectrum (>2400 nm) and in the water-dominated spectral areas centered at 1400 and 1940 nm, the field-based canopy reflectance spectra were reduced from 2151 wavelengths (350–2500 nm) to 1766 wavelengths by removing 1355–1400, 1811–2000 nm, and 2401–2500 nm.

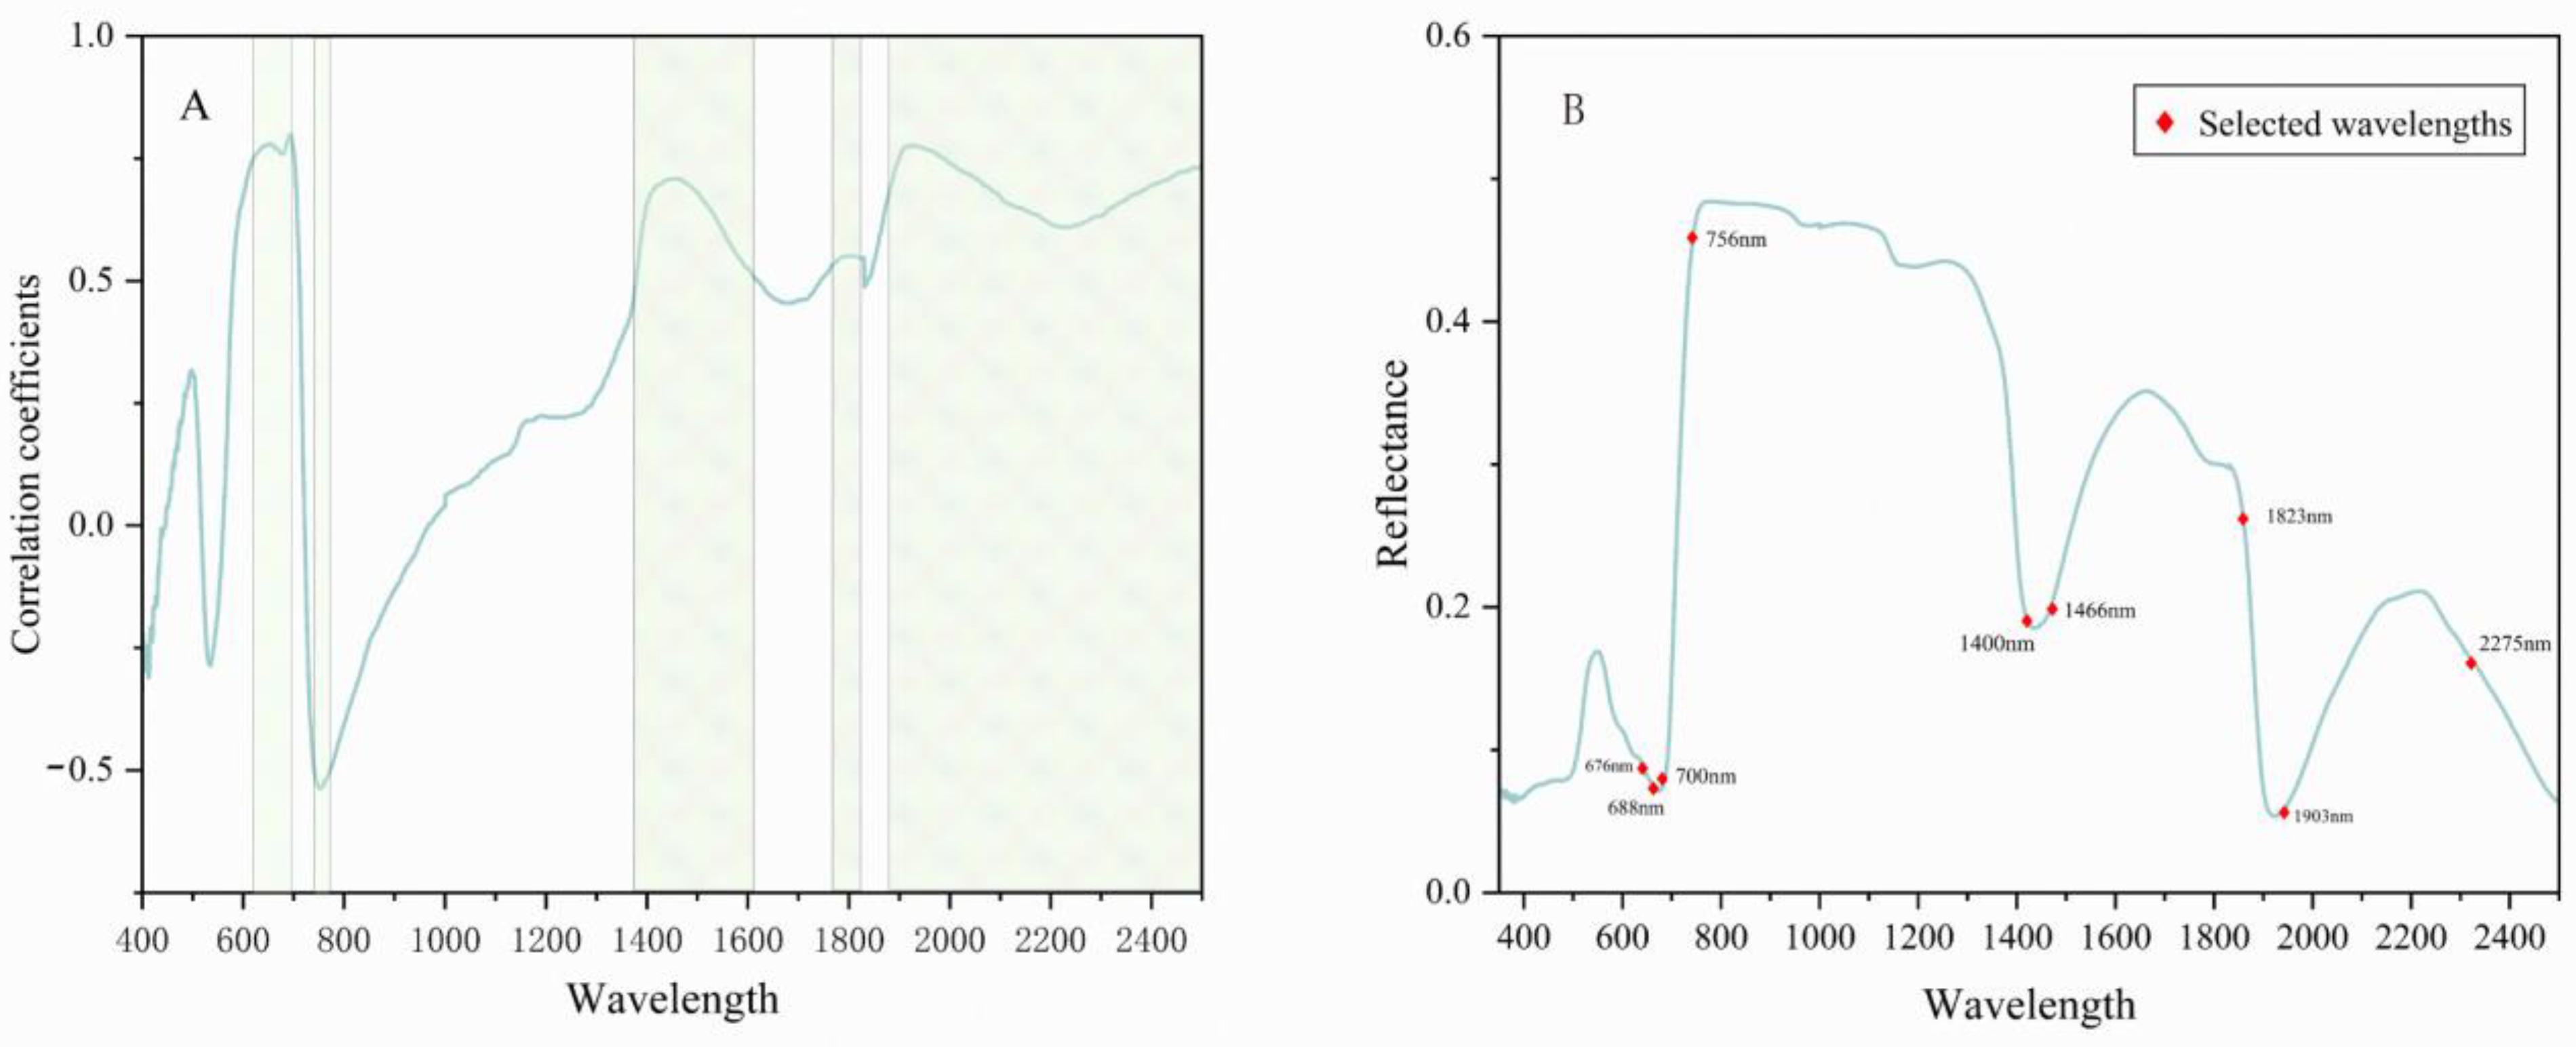
3.2. Spectral Feature Selection

Within the hyperspectral data range, there exists a significant correlation between adjacent bands. Employing all bands would merely increase computational complexity without providing any additional information. Furthermore, only a few selected bands contain the optimal information, and including the remaining bands would lead to data redundancy. To identify the sensitive bands for rice blast detection, the study followed a two-step process. The first step involved calculating the correlation coefficient between the spectral reflectance of the various bands and the Disease Ratio (DR) values through correlation analysis, so as to determine the band range that is sensitive to rice blast (shown in Figure 3A). The correlation analysis was carried out in the 2021 leaf scale dataset for the entire region (350–2500 nm), which can be found in 576 nm–714 nm, 735 nm–809 nm, 1368–1624 nm, and 1736–2500 nm band ranges showing high correlation (|R| ≤ 0.5, p < 0.001). The second step was to use the successive projection algorithm to extract sensitive bands from the sensitive band range. The spectrum of the selected sample was randomly divided into training data and validation data in a ratio of 2:1, and the characteristic wavelength was selected using SPA. Due to the random allocation of samples, multiple runs will produce different results. In this study, the process was run five times, and the bands that appeared three or more times were selected as the characteristic wavelengths; the result of one of them is shown in Figure 3B. The most selected bands were 676 nm, 688 nm, 700 nm, 756 nm, 1400 nm, 1466 nm, 1823 nm, 1903 nm, and 2275 nm. Considering the influence of canopy water vapor absorption bands, 1400 nm, 1823 nm, 1903 nm, and 2275 nm were discarded as sensitive bands. Based on trying all possible wavelength combinations, RRed = 688 nm, RNIR = 756 nm, and RSWIR = 1466 nm were chosen as the final wavelength combinations of the new index.

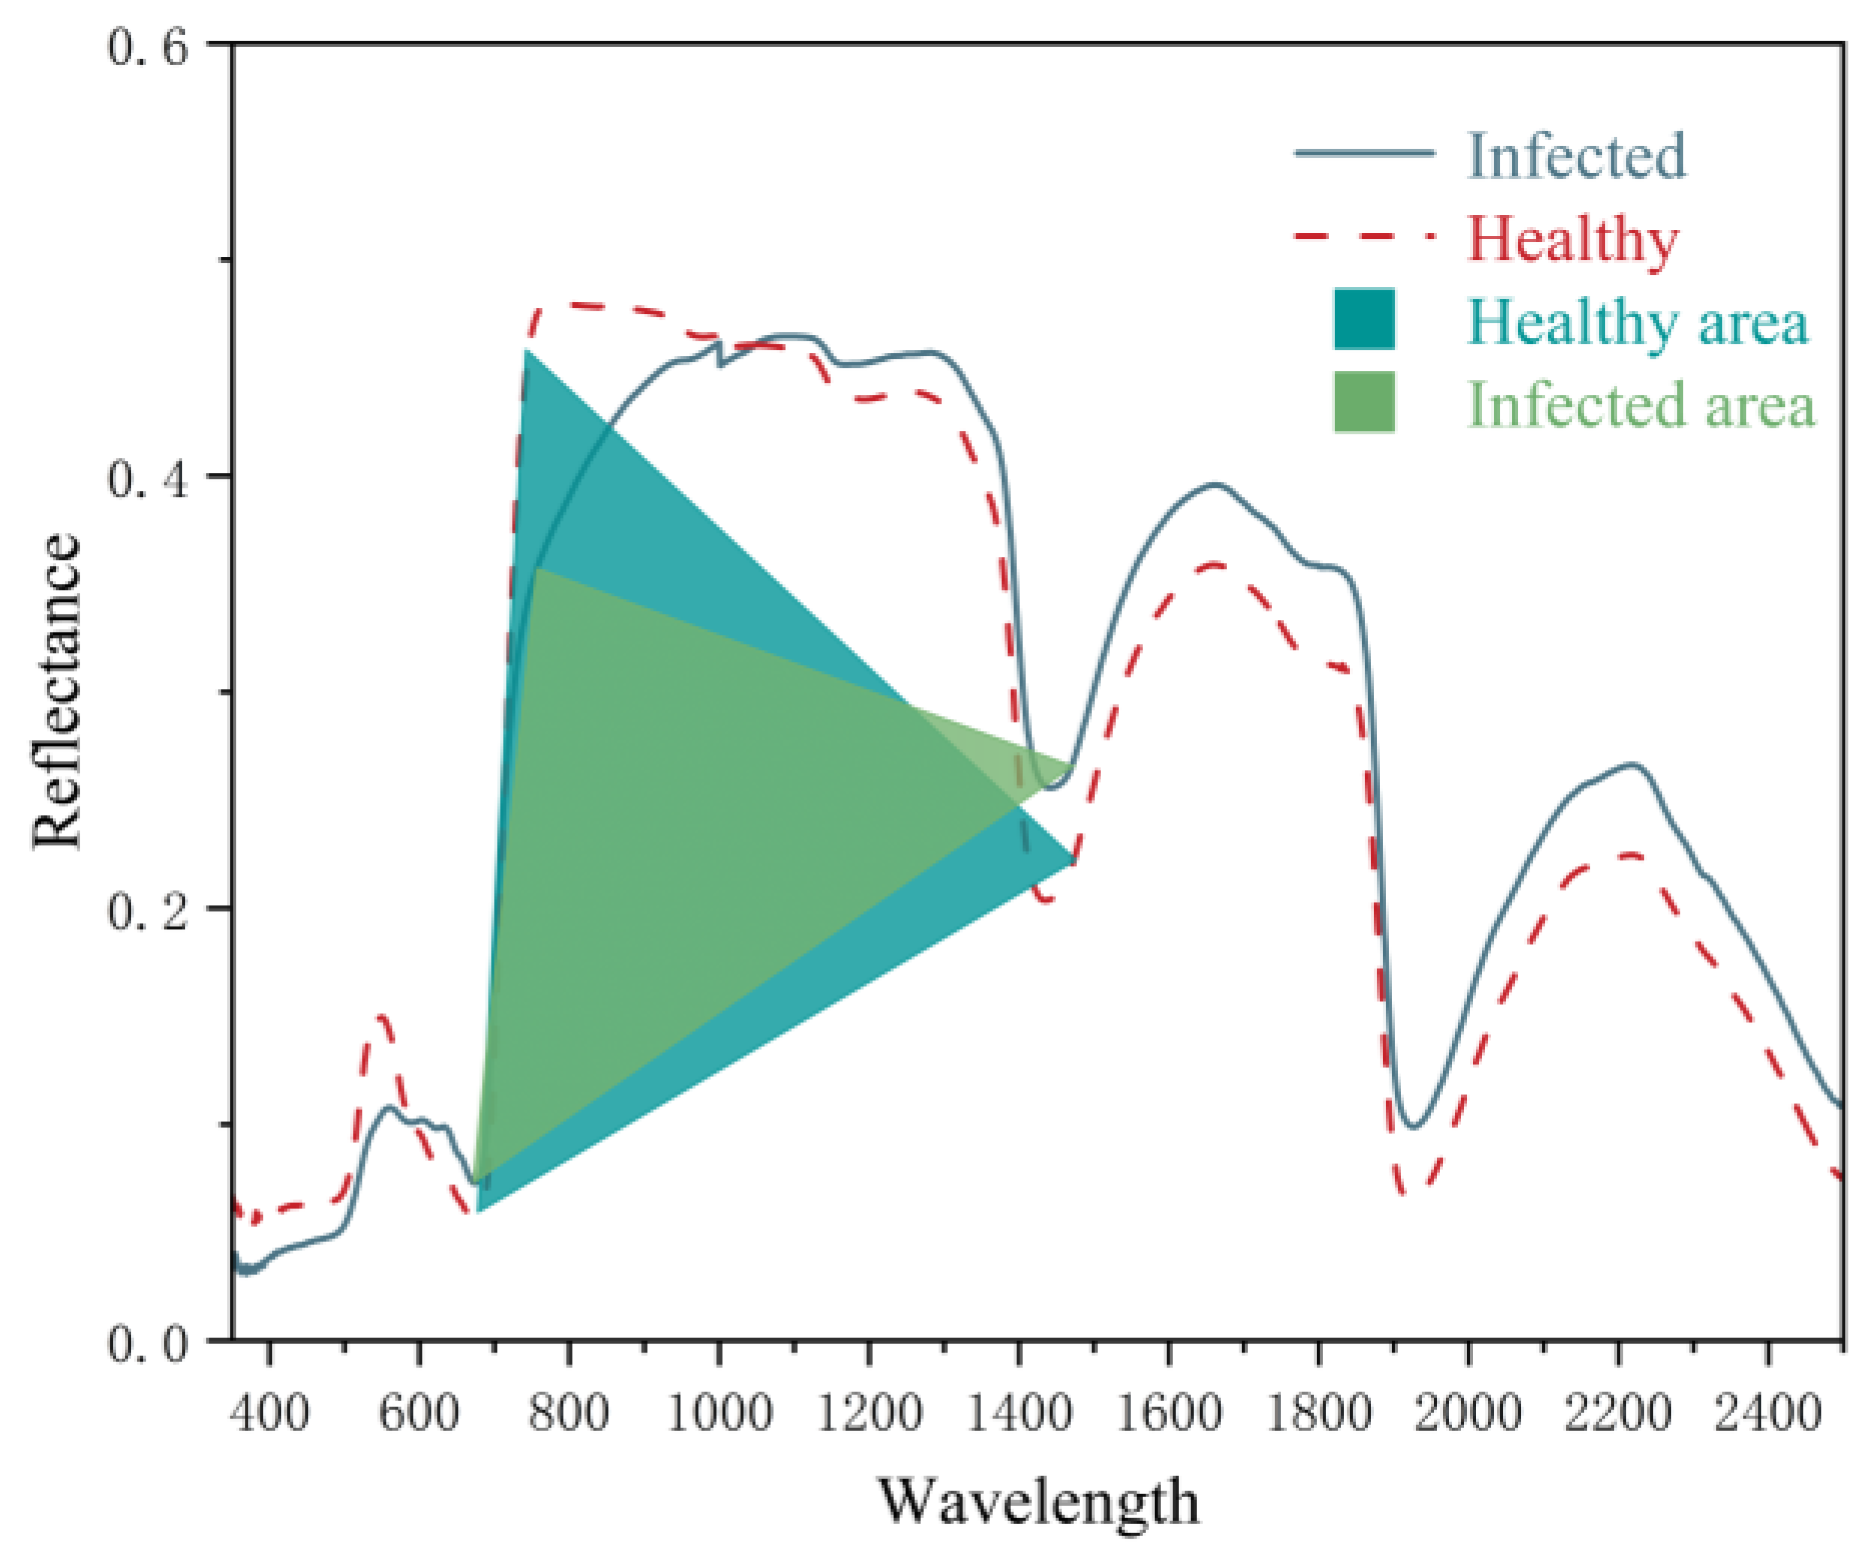
3.3. Formatting of Mathematical Components

Based on the analysis of the spectral response patterns in the previous section, our analysis revealed that infected samples exhibit higher reflectance compared to healthy samples in the 400–700 nm range. This was followed by a decline as the analysis moved into the early near-infrared range (750–900 nm), highlighting a significant change in spectral response linked to the infection.
However, in the subsequent near-infrared to shortwave infrared range (900–2500 nm), reflectance showed an increasing trend. Based on the spectral response characteristics of rice blast disease, the disease could be identified by the differences in triangle area formed by the positions and reflectance of sensitive bands (688 nm, 756 nm, and 1466 nm). We found that the triangle area of the healthy sample was larger than that of the sample infected with rice blast disease (shown in Figure 4). The formula is as follows:
A r e a t r i a n g u l a r = 688 756 × R 1466 + 1466 688 × R 756 + 756 1466 × R 688 2
However, when using triangles for rice blast identification, the difference in the area of the triangles composed of samples with slight degrees of rice blast infection and healthy samples was not significant. In order to address the identification of rice blast disease with a slight degree of infection, it was found that the trapezoidal area consisting of the position and reflectance of the sensitive bands 688 nm and 1466 nm was larger as the disease became more severe (shown in Figure 5).
A r e a t r a p e z o i d = R 688 + R 1466 × ( 1466 688 ) 2
In summary, since the triangular area of healthy samples was larger than that of the infected samples and the trapezoidal area was smaller than that of the infected samples, it was possible to calculate the ratio of the triangular area to the trapezoidal area to increase the difference between the healthy samples and samples infected with rice blast disease, which produced a good classification effect. The new vegetation index formed, called the Geometric Ratio-Vegetation Index (GRVIRB), has the following expression:
GRVI RB = A r e a t r i a n g u l a r A r e a t r a p e z o i d
GRVI RB = A r e a T r i A r e a T r a = 68 × R 756 R 1466 + 710 × ( R 756 R 688 ) 778 × ( R 688 + R 1466 )
where AreaTri denotes the area of the triangle, AreaTra represents the area of the trapezoid, and Ri indicates the reflectance of the i-th band (where i corresponds to 688 nm, 756 nm, and 1466 nm).

3.4. Classification of Infected and Healthy Leaves Using GRVIRB

To assess the discriminative capability of the new index GRVIRB for rice blast disease, this study constructed rice blast disease monitoring models based on the LDA and SVM. The models utilized rice leaf data from 2021 as the training dataset, while data from 2020 served as the validation dataset. This approach allowed for the calculation of identification accuracy of the new index in both healthy and rice blast-infected samples (shown in Table 3). In the training dataset (2021), the GRVIRB demonstrated impressive performance, achieving an overall classification accuracy of 98.25% and a kappa coefficient of 0.97 with the SVM model, and the LDA model recorded a classification accuracy of 95.04% and a kappa coefficient of 0.91, indicating strong reliability in distinguishing between healthy and rice blast-infected samples. The classification accuracies of the infected samples in both models were as high as 100%; the classification accuracies of the healthy samples were 95.24% and 86.96%, respectively. In the validation dataset from 2020, the GRVIRB exhibited overall classification accuracies of 80.41% with a kappa coefficient of 0.7 for the SVM model. Meanwhile, the LDA model achieved an accuracy of 79.73% and a kappa coefficient of 0.67. The classification accuracies of the infected samples in two models were 79.31% and 84.38%, and the classification accuracies of the healthy samples were 84.38% and 76.92%, respectively. Comparing the two different discrimination models, the identification accuracy of the rice blast leaf scale based on the SVM algorithm was slightly higher than that of the LDA method. This shows that GRVIRB has the ability to identify healthy rice leaves from rice blast-infected leaves.

3.4.1. Comparative Analysis of GRVIRB and Traditional VIs at the Leaf Scale

Table 4 summarizes the discriminatory ability of GRVIRB and 17 other commonly used vegetation indices constructed using the LDA model and the SVM model for rice blast disease. In order to further test the ability of GRVIRB to identify rice blast, it was applied to different datasets in different years. As shown in Table 4, in 2021, the classification accuracy of the newly constructed GRVIRB in distinguishing between healthy and diseased rice was the highest in both models, followed by RIBIred, MSR, and PSSRa in the SVM model, with overall classification accuracies of 97.52%, 92.56%, and 92.56%, respectively, followed by MTVI1, SRWI, and NRI in the LDA model, with overall classification accuracies of 94.87%, 94.21%, and 94.21%, respectively. In 2020, the classification accuracy of the GRVIRB was also the highest, 4.73% more accurate than the PSSRa, which was the highest of the traditional indices in the SVM model, and 0.68% more accurate than the EVI, which was the highest of the traditional indices in the LDA model, while the other indices performed significantly worse.
To confirm the new index’s excellent identification ability for minor infections, we selected most of the 2020 data from samples exhibiting less severe infections and less obvious hazardous symptoms of disease stress. Despite the overall classification accuracy in 2020 being lower than in 2021, it is evident that the classification accuracy of the new index remains superior to that of the existing indices. Consequently, testing the newly proposed rice blast monitoring vegetation index with various datasets demonstrated that GRVIRB is consistently reliable for identifying and monitoring early rice disease. This new index proves to be robust in detecting rice blast across different years and varying infection levels.

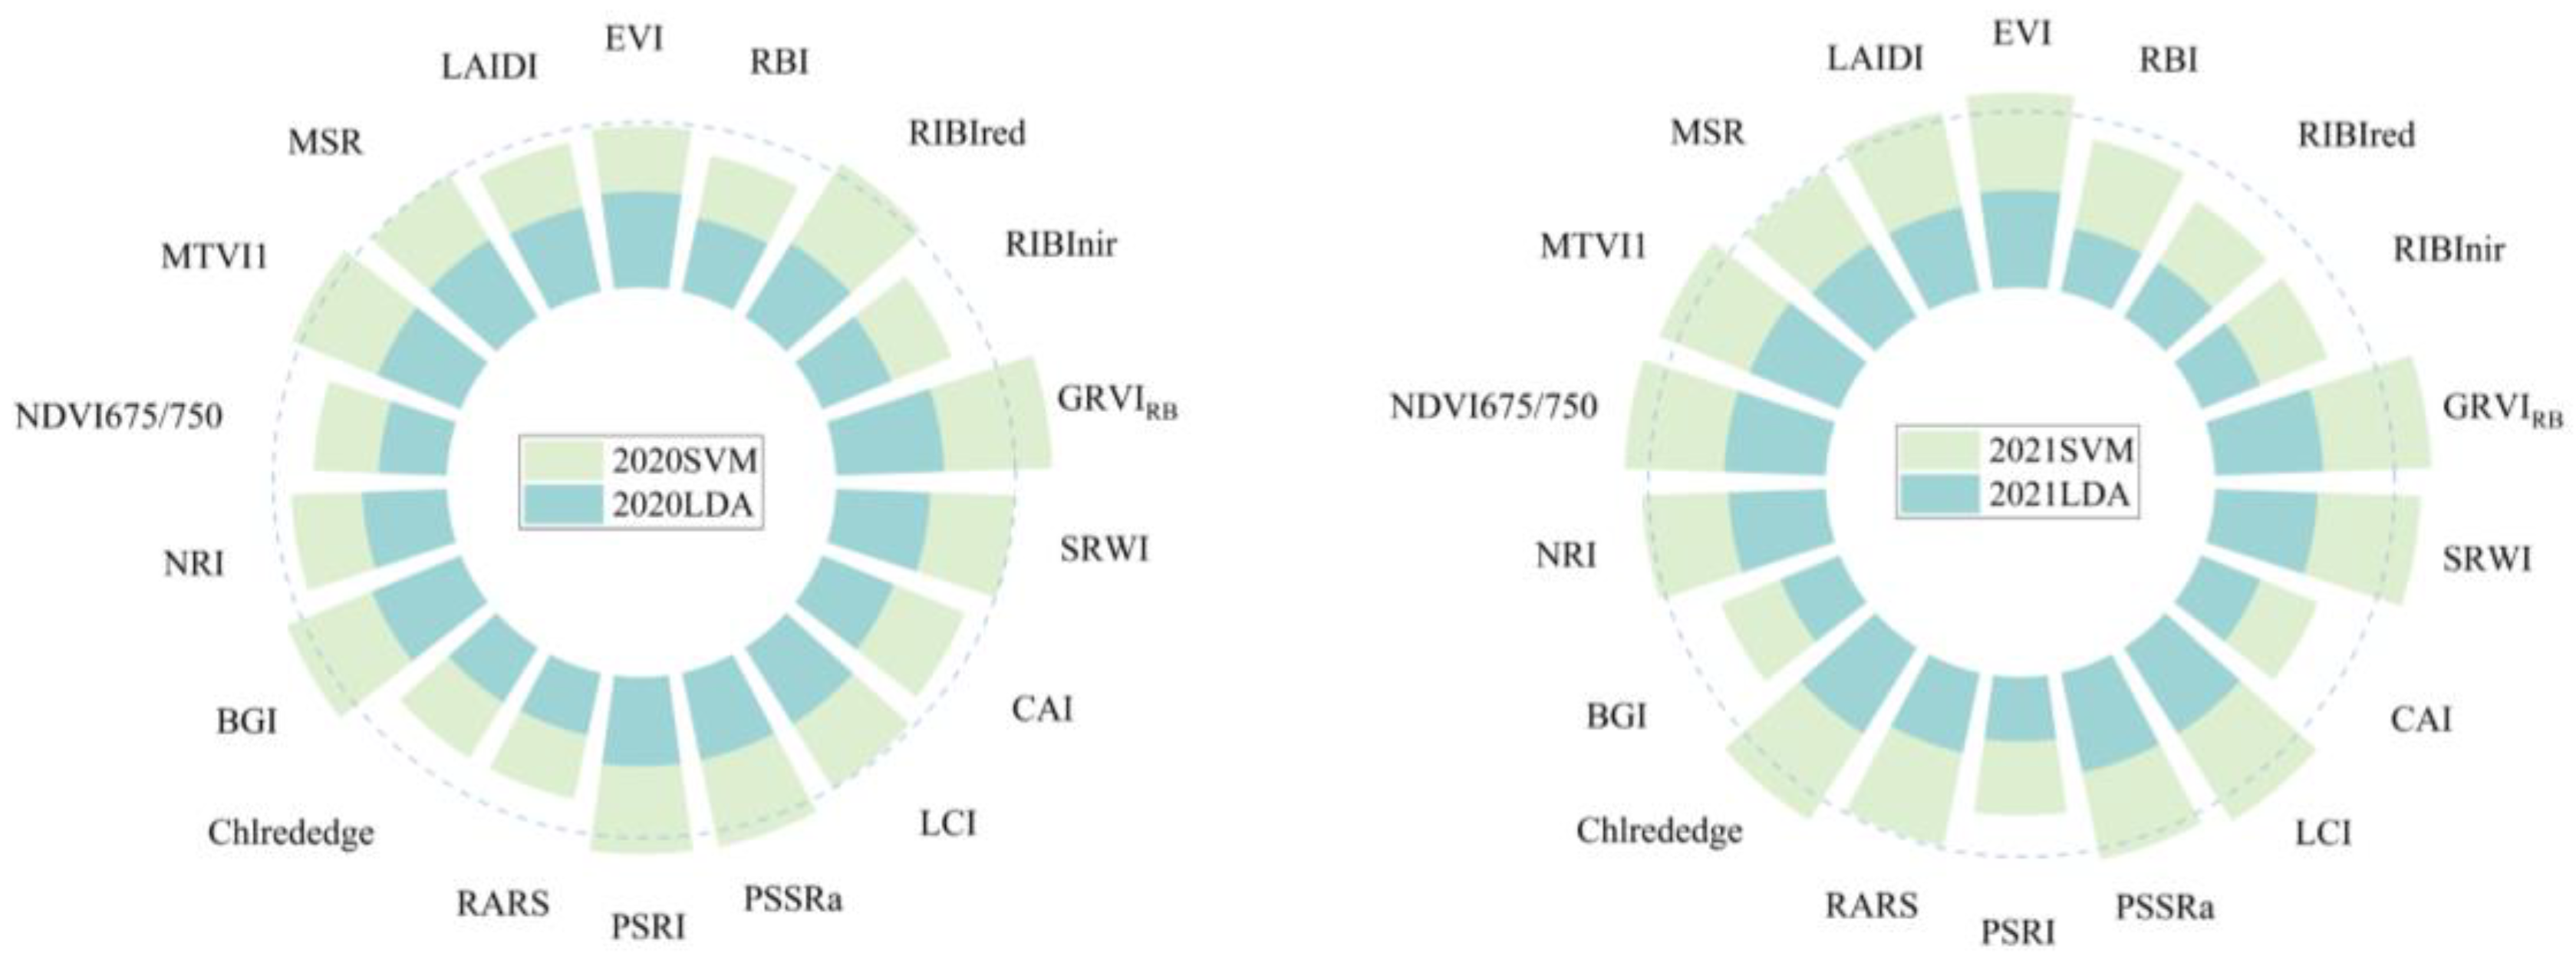
3.4.2. Comparative Analysis of GRVIRB and Traditional VIs at the Canopy Scale

In order to investigate the application capability of the new vegetation index in identifying rice blast at the canopy scale, this study uses two years of canopy data for the analysis and calculates the classification accuracy of the new index and the traditional indices by using different methods. Figure 6 shows the overall performance of different indices in classifying infected and healthy samples at the canopy scale using different classification models in the 2020 and 2021 datasets. It can be seen that GRVIRB still has the highest classification accuracy, with 97.03% and 89.74% classification accuracy for the 2021 and 2020 datasets in the GRVIRB-SVM model, respectively. In the GRVIRB-LDA model, the classification accuracy for the 2021 and 2020 datasets was 97.03% and 85.9%, respectively. Overall, the accuracy of the GRVIRB-SVM model is superior to that of the GRVIRB-LDA model. While RIBIred showed strong performance at the leaf scale, its effectiveness at the canopy scale was less satisfactory. On the contrary, SRWI did not have a high classification accuracy at the leaf scale but showed good classification performance at the canopy scale, which may be due to the significant reduction in canopy vegetation water content after rice was stressed by the disease, so the SRWI index was more sensitive at the canopy scale than it was at the leaf scale. Other vegetation indices with good potential at the leaf scale, such as MSR, EVI, and PSSRa, still did not perform as well as GRVIRB. This further suggests that GRVIRB has significant sensitivity for detecting rice blast and can better characterize the disease.

4. Discussion

When rice suffers from rice blast, the leaves face wilting and discoloration. Rice exhibits a diverse array of physiological symptoms in both healthy and infected canopies, influenced by the biological characteristics of the pathogens as well as the specific dynamics of host–pathogen interactions [43]. As illustrated in Figure 2, rice plants infected with rice blast tend to exhibit a notable increase in spectral reflectance in the visible and shortwave infrared (SWIR) regions, particularly in the red spectrum. In contrast, the spectral reflectance in the near-infrared (NIR) region is significantly reduced compared to healthy rice. Previous research has indicated that an increase in the amount of light reflected in the visible region might be related to a reduction in chloroplasts. Meanwhile, the decrease in reflectance in the near-infrared (NIR) region is mainly determined by substantial changes in leaf structure and water content [21,44]. In addition, the alterations in reflectance occurring in the shortwave infrared region are closely related to the undulations in lignin and protein content [45,46]. Numerous studies have confirmed the sensitivity of these regions. For example, Tian’s research found significant spectral changes in the near-infrared region following rice blast stress, which is consistent with the conclusions of this study [3]. These spectral characteristics align with the leaf and canopy spectral response patterns observed under rice blast stress in this study, forming a solid foundation for developing the conceptual model for the new vegetation index. This consistency supports the reliability of the spectral data and informs the design of the new index for effective disease monitoring.
The high accuracy and strong separability of GRVIRB are the result of the precise selection of spectral wavelengths and the well-designed structure of the spectral vegetation index. These factors contribute to its effectiveness in distinguishing between healthy and rice blast-infected samples. For the selection of spectral wavelengths, the successive projections algorithm was used to extract from a sensitive range of bands with high correlation coefficients with DR values, and SPA reduced the time cost of a large number of band combinations compared to Fisher’s discriminant analysis and exhaustive algorithmic methods [47]. Previous research has demonstrated that SPA is a more effective method for extracting feature wavelengths, which has been widely used for wavelength selection and data compression in various types of quantitative analysis and pest monitoring. The three bands (688 nm, 756 nm, and 1466 nm) that were finally determined to comprise the vegetation index were considered comprehensively for the spectral response patterns of leaf and canopy under rice blast stress. For the vegetation index structure, existing studies have shown that the spectral detection of crops can be further improved by utilizing the support vector machine model with a three-wavelength or eigen-construction [48]. This is because a three-wavelength vegetation index can capture more comprehensive crop information while offering greater stability and accuracy compared to a two-wavelength vegetation index. Through a comprehensive analysis of spectral variations, it was observed that reflectance in the early NIR region declines as disease severity increases, while the red region also shows a decrease with heightened infection. The reduction in NIR reflectance can be attributed to the shrinking green leaf area and breakdown of intercellular structures caused by the disease. Additionally, the drop in reflectance from the latter part of the NIR region to the SWIR region is linked to the diminished water absorption capacity in the infected leaves [41,49,50]. Based on this understanding, this geometric area ratio amplifies such subtle spectral variations twice, increasing the distinguish ability between healthy and diseased rice.
Here, we discuss the superiority of the GRVIRB compared to traditional indices at the leaf scale and canopy scale and the reasons behind it. Our study revealed that moisture-related biochemical indicators play a more significant role in detecting rice blast than pigment-related indicators. Previous research has largely focused on the visible spectrum, often overlooking the shortwave infrared (SWIR) region, which is closely tied to vegetation water content. The complexities introduced by moisture and canopy structure have left the specific spectral changes in the near-infrared (NIR) region, triggered by rice blast infection, less understood [51,52]. Although recent studies have just started to acknowledge the significance of the NIR region in detecting plant diseases, much remains to be explored [53]: they still rarely consider the use of the SWIR region to construct pest and disease monitoring indices. The sensitive bands that make up GRVIRB (688 nm, 756 nm, and 1466 nm) are similar to those of RIBIs (665 nm, 753 nm, and 1102 nm), but in this study, the GRVIRB demonstrated a markedly superior identification performance compared to RIBIs, showcasing its enhanced ability to detect and differentiate rice blast infections with greater precision and reliability. This superior performance may be attributed to two factors: firstly, the combination form of GRVIRB is more sensitive to the spectral response of rice blast disease; secondly, this study innovatively uses 1466 nm as a characteristic band for constructing the index. The results also proved that the new index incorporating the SWIR band showed a more stable and accurate classification for rice blast disease monitoring compared with the traditional index. Similarly, the traditional vegetation index SRWI, which is related to canopy vegetation water content, showed a significant improvement in accuracy from leaf to canopy rice blast monitoring. Furthermore, due to heightened pigment absorption, reflectance in the visible spectrum is often saturated at the canopy scale, diminishing sensitivity to pathogen-induced pigment alterations. This saturation leads to the suboptimal performance of many traditional vegetation indices, such as BGI, LCI, and Chlred-edge, in effectively monitoring rice blast [41,52,54]. In stark contrast, the GRVIRB consistently showcases exceptional performance at both the leaf and canopy scales, utilizing a variety of classification models across different yearly datasets. The pronounced variability in traditional vegetation indices across scales can be linked to the atypical fluctuations in the sensitivity of visible and near-infrared reflectance in response to rice blast infections. Previous research has provided mechanistic explanations for these disease-sensitive indices, establishing a connection between disease incidence and alterations in plant biochemical characteristics [41,55]. However, such indices do not scientifically explain their inevitable linkage to disease stress, and there is a need to construct vegetation indices that are specifically sensitive to rice blast by capturing changes in physiological and structural properties associated with rice blast infection, combining physiological and biochemical parameter response mechanisms with spectral information-specific indices for remote sensing monitoring.
Despite the GRVIRB performing well in monitoring rice blast at both the leaf and canopy scales, there are still some shortcomings. The monitoring effectiveness at the field scale requires further investigation. Similarly, since the current experimental data only pertain to rice blast, the ability to identify other diseases needs further discussion.

5. Conclusions

In this study, using the correlation analysis and successive projection algorithm to select sensitive bands, a new three-band spectral index GRVIRB (composed of the 688 nm, 756 nm, and 1466 nm bands) was proposed for rice blast disease monitoring at the leaf and canopy scales. Compared with other commonly used spectral vegetation indices, GRVIRB showed better performance in detecting and monitoring rice blast disease at the leaf and canopy scales. The accuracy of the GRVIRB-SVM model surpassed that of the GRVIRB-LDA model, indicating a more effective performance in classifying and detecting rice blast infections. In 2021 and 2020, the identification overall accuracy of leaf scale was 98.35% and 80.41%, respectively, and the overall accuracy at canopy scale was 97.03% for both years. GRVIRB shows high sensitivity and universality in identifying leaf scale and canopy scale rice blast across different years. Furthermore, the GRVIRB must undergo ongoing validation with various diseases and different rice cultivars to inform and enhance precision agricultural management practices.

Author Contributions

Q.Z.: Methodology, Investigation, Conceptualization, Writing—original draft, Writing—review and editing. Y.C.: Methodology, Supervision, Writing—review and editing. Q.X.: Conceptualization, Supervision. Y.Z.: Conceptualization, Supervision, Writing—review and editing. D.L.: Conceptualization, Supervision, Visualization, Funding acquisition. H.J.: Methodology, Conceptualization, Formal analysis. C.W. (Chongyang Wang): Investigation, Formal analysis, Validation. L.Z.: Investigation, Formal analysis. W.H.: Conceptualization, Supervision. Y.D.: Conceptualization, Supervision, Visualization. C.W. (Chuntao Wang): Investigation, Formal analysis. All authors have read and agreed to the published version of the manuscript.

Funding

Supported by the Strategic Priority Research Program of the Chinese Academy of Sciences (Grant No. XDA28010500), Hunan Provincial Natural Science Foundation of China (2023JJ40025), the Open Fund of Engineering Laboratory of Spatial Information Technology of Highway Geological Disaster Early Warning in Hunan Province (Changsha University of Science & Technology) (kfj210601, kfj210602), the Open Project Program of Key Laboratory of Smart Agricultural Technology in Tropical South China, Ministry of Agriculture and Rural Affairs, P.R.China (HNZHNY-KFKT-202201), the Scientific Research Foundation of Hunan Education Department (23B0327), and the Postgraduate Practice and Innovation Project of Changsha University of Science & Technology (CLSJCX24010).

Institutional Review Board Statement

This study did not involve humans.

Informed Consent Statement

This study did not involve humans.

Data Availability Statement

Requests to access the datasets should be directed to the author.

Conflicts of Interest

The authors declare no conflicts of interest.

References

  1. Sharma, T.R.; Rai, A.K.; Gupta, S.K.; Vijayan, J.; Devanna, B.N.; Ray, S. Rice Blast Management Through Host-Plant Resistance: Retrospect and Prospects. Agric. Res. 2012, 1, 37–52. [Google Scholar] [CrossRef]
  2. Deng, Y.; Zhai, K.; Xie, Z.; Yang, D.; Zhu, X.; Liu, J.; Wang, X.; Qin, P.; Yang, Y.; Zhang, G.; et al. Epigenetic regulation of antagonistic receptors confers rice blast resistance with yield balance. Science 2017, 355, 962–965. [Google Scholar] [CrossRef] [PubMed]
  3. Tian, L.; Wang, Z.; Xue, B.; Li, D.; Zheng, H.; Yao, X.; Zhu, Y.; Cao, W.; Cheng, T. A disease-specific spectral index tracks Magnaporthe oryzae infection in paddy rice from ground to space. Remote Sens. Environ. 2023, 285, 113384. [Google Scholar] [CrossRef]
  4. Dean, R.A.; Talbot, N.J.; Ebbole, D.J.; Farman, M.L.; Mitchell, T.K.; Orbach, M.J.; Thon, M.; Kulkarni, R.; Xu, J.R.; Pan, H.; et al. The genome sequence of the rice blast fungus Magnaporthe grisea. Nature 2005, 434, 980–986. [Google Scholar] [CrossRef] [PubMed]
  5. Wilson, R.A.; Talbot, N.J. Under pressure: Investigating the biology of plant infection by Magnaporthe oryzae. Nat. Rev. Microbiol. 2009, 7, 185–195. [Google Scholar] [CrossRef] [PubMed]
  6. Yang, W.; Zhang, H.; Li, M.; Wang, Z.; Zhou, J.; Wang, S.; Lu, G.; Fu, F. Early diagnosis of blast fungus, Magnaporthe oryzae, in rice plant by using an ultra-sensitive electrically magnetic-controllable electrochemical biosensor. Anal. Chim. Acta 2014, 850, 85–91. [Google Scholar] [CrossRef]
  7. Zhao, D.; Cao, Y.; Li, J.; Cao, Q.; Li, J.; Guo, F.; Feng, S.; Xu, T. Early Detection of Rice Leaf Blast Disease Using Unmanned Aerial Vehicle Remote Sensing: A Novel Approach Integrating a New Spectral Vegetation Index and Machine Learning. Agronomy 2024, 14, 602. [Google Scholar] [CrossRef]
  8. Zheng, Q.; Huang, W.; Xia, Q.; Dong, Y.; Ye, H.; Jiang, H.; Chen, S.; Huang, S. Remote Sensing Monitoring of Rice Diseases and Pests from Different Data Sources: A Review. Agronomy 2023, 13, 1851. [Google Scholar] [CrossRef]
  9. Huang, W.; Lamb, D.W.; Niu, Z.; Zhang, Y.; Liu, L.; Wang, J. Identification of yellow rust in wheat using in-situ spectral reflectance measurements and airborne hyperspectral imaging. Precis. Agric. 2007, 8, 187–197. [Google Scholar] [CrossRef]
  10. Huang, W.; Guan, Q.; Luo, J.; Zhang, J.; Zhao, J.; Liang, D.; Huang, L.; Zhang, D. New Optimized Spectral Indices for Identifying and Monitoring Winter Wheat Diseases. IEEE J. Sel. Top. Appl. Earth Obs. Remote Sens. 2014, 7, 2516–2524. [Google Scholar] [CrossRef]
  11. Franceschini, M.H.D.; Bartholomeus, H.; van Apeldoorn, D.F.; Suomalainen, J.; Kooistra, L. Feasibility of Unmanned Aerial Vehicle Optical Imagery for Early Detection and Severity Assessment of Late Blight in Potato. Remote Sens. 2019, 11, 224. [Google Scholar] [CrossRef]
  12. Zhang, J.; Pu, R.; Huang, W.; Yuan, L.; Luo, J.; Wang, J. Using in-situ hyperspectral data for detecting and discriminating yellow rust disease from nutrient stresses. Field Crops Res. 2012, 134, 165–174. [Google Scholar] [CrossRef]
  13. Liu, T.; Shi, T.; Zhang, H.; Wu, C. Detection of Rise Damage by Leaf Folder (Cnaphalocrocis medinalis) Using Unmanned Aerial Vehicle Based Hyperspectral Data. Sustainability 2020, 12, 9343. [Google Scholar] [CrossRef]
  14. Huang, J.; Liao, H.; Zhu, Y.; Sun, J.; Sun, Q.; Liu, X. Hyperspectral detection of rice damaged by rice leaf folder (Cnaphalocrocis medinalis). Comput. Electron. Agric. 2012, 82, 100–107. [Google Scholar] [CrossRef]
  15. Marang, I.J.; Filippi, P.; Weaver, T.B.; Evans, B.J.; Whelan, B.M.; Bishop, T.F.A.; Murad, M.O.F.; Al-Shammari, D.; Roth, G. Machine Learning Optimised Hyperspectral Remote Sensing Retrieves Cotton Nitrogen Status. Remote Sens. 2021, 13, 1428. [Google Scholar] [CrossRef]
  16. Anderegg, J.; Hund, A.; Karisto, P.; Mikaberidze, A. In-Field Detection and Quantification of Septoria Tritici Blotch in Diverse Wheat Germplasm Using Spectral–Temporal Features. Front. Plant Sci. 2019, 10, 1335. [Google Scholar] [CrossRef]
  17. Franceschini, M.D.; Bartholomeus, H.; van Apeldoorn, D.; Suomalainen, J.; Kooistra, L. Intercomparison of Unmanned Aerial Vehicle and Ground-Based Narrow Band Spectrometers Applied to Crop Trait Monitoring in Organic Potato Production. Sensors 2017, 17, 1428. [Google Scholar] [CrossRef]
  18. Zheng, Q.; Huang, W.; Cui, X.; Shi, Y.; Liu, L. New Spectral Index for Detecting Wheat Yellow Rust Using Sentinel-2 Multispectral Imagery. Sensors 2018, 18, 868. [Google Scholar] [CrossRef]
  19. Zheng, Q.; Huang, W.; Cui, X.; Shi, Y.; Liu, L. A Disease Index for Efficiently Detecting Wheat Fusarium Head Blight Using Sentinel-2 Multispectral Imagery. IEEE Access 2020, 8, 52181–52191. [Google Scholar] [CrossRef]
  20. Huo, L.; Persson, H.J.; Lindberg, E. Early detection of forest stress from European spruce bark beetle attack, and a new vegetation index: Normalized distance red & SWIR (NDRS). Remote Sens. Environ. 2021, 255, 112240. [Google Scholar] [CrossRef]
  21. Gitelson, A.A.; Kaufman, Y.J.; Stark, R.; Rundquist, D. Novel algorithms for remote estimation of vegetation fraction. Remote Sens. Environ. 2002, 80, 76–87. [Google Scholar] [CrossRef]
  22. Mandal, N.; Adak, S.; Das, D.K.; Sahoo, R.N.; Mukherjee, J.; Kumar, A.; Chinnusamy, V.; Das, B.; Mukhopadhyay, A.; Rajashekara, H.; et al. Spectral characterization and severity assessment of rice blast disease using univariate and multivariate models. Front. Plant Sci. 2023, 14, 1067189. [Google Scholar] [CrossRef]
  23. Liu, H.Q.; Huete, A. A feedback based modification of the NDVI to minimize canopy background and atmospheric noise. IEEE Trans. Geosci. Remote Sens. 1995, 33, 457–465. [Google Scholar] [CrossRef]
  24. Delalieux, S.; Somers, B.; Hereijgers, S.; Verstraeten, W.; Keulemans, W.; Coppin, P. A near-infrared narrow-waveband ratio to determine Leaf Area Index in orchards. Remote Sens. Environ. 2008, 112, 3762–3772. [Google Scholar] [CrossRef]
  25. Chen, J.M. Evaluation of Vegetation Indices and a Modified Simple Ratio for Boreal Applications. Can. J. Remote Sens. 1996, 22, 229–242. [Google Scholar] [CrossRef]
  26. Haboudane, D. Hyperspectral vegetation indices and novel algorithms for predicting green LAI of crop canopies: Modeling and validation in the context of precision agriculture. Remote Sens. Environ. 2004, 90, 337–352. [Google Scholar] [CrossRef]
  27. Rouse, J.W.; Haas, R.H.; Schell, J.A.; Deering, D.W. Monitoring Vegetation Systems in the Great Plains with Erts. NASA Spec. Publ. 1974, 351, 309. [Google Scholar]
  28. Chen, P.; Haboudane, D.; Tremblay, N.; Wang, J.; Vigneault, P.; Li, B. New spectral indicator assessing the efficiency of crop nitrogen treatment in corn and wheat. Remote Sens. Environ. 2010, 114, 1987–1997. [Google Scholar] [CrossRef]
  29. Zarco-Tejada, P.J.; Ustin, S.L.; Whiting, M.L. Temporal and Spatial Relationships between Within-Field Yield Variability in Cotton and High-Spatial Hyperspectral Remote Sensing Imagery. Agron. J. 2005, 97, 641–653. [Google Scholar] [CrossRef]
  30. Gitelson, A.A. Remote estimation of canopy chlorophyll content in crops. Geophys. Res. Lett. 2005, 32, L08403. [Google Scholar] [CrossRef]
  31. Chappelle, E.W.; Kim, M.S.; McMurtrey, J.E. Ratio analysis of reflectance spectra (RARS): An algorithm for the remote estimation of the concentrations of chlorophyll A, chlorophyll B, and carotenoids in soybean leaves. Remote Sens. Environ. 1992, 39, 239–247. [Google Scholar] [CrossRef]
  32. Merzlyak, M.N.; Gitelson, A.A.; Chivkunova, O.B.; Rakitin, V.Y.U. Non-destructive optical detection of pigment changes during leaf senescence and fruit ripening. Physiol. Plant. 1999, 106, 135–141. [Google Scholar] [CrossRef]
  33. Bannari, A.; Khurshid, K.S.; Staenz, K.; Schwarz, J.W. A Comparison of Hyperspectral Chlorophyll Indices for Wheat Crop Chlorophyll Content Estimation Using Laboratory Reflectance Measurements. IEEE Trans. Geosci. Remote Sens. 2007, 45, 3063–3074. [Google Scholar] [CrossRef]
  34. Datt, B. A New Reflectance Index for Remote Sensing of Chlorophyll Content in Higher Plants: Tests using Eucalyptus Leaves. J. Plant Physiol. 1999, 154, 30–36. [Google Scholar] [CrossRef]
  35. Zarco-Tejada, P.J.; Pushnik, J.C.; Dobrowski, S.; Ustin, S.L. Steady-state chlorophyll a fluorescence detection from canopy derivative reflectance and double-peak red-edge effects. Remote Sens. Environ. 2003, 84, 283–294. [Google Scholar] [CrossRef]
  36. Nagler, P.L.; Daughtry, C.S.T.; Goward, S.N. Plant Litter and Soil Reflectance. Remote Sens. Environ. 2000, 71, 207–215. [Google Scholar] [CrossRef]
  37. Araújo, M.C.U.; Saldanha, T.C.B.; Galvão, R.K.H.; Yoneyama, T.; Chame, H.C.; Visani, V. The successive projections algorithm for variable selection in spectroscopic multicomponent analysis. Chemom. Intell. Lab. Syst. 2001, 57, 65–73. [Google Scholar] [CrossRef]
  38. Fisher, R.A. The Use of Multiple Measurements in Taxonomic Problems. Ann. Eugen. 1936, 7, 179–188. [Google Scholar] [CrossRef]
  39. Schölkopf, B. Learning with Kernels: Support Vector Machines, Regularization, Optimization, and Beyond. IEEE Trans. Neural Netw. 2005, 16, 781. [Google Scholar] [CrossRef]
  40. Zhang, J.; Huang, Y.; Pu, R.; Gonzalez-Moreno, P.; Yuan, L.; Wu, K.; Huang, W. Monitoring plant diseases and pests through remote sensing technology: A review. Comput. Electron. Agric. 2019, 165, 104943. [Google Scholar] [CrossRef]
  41. Tian, L.; Xue, B.; Wang, Z.; Li, D.; Yao, X.; Cao, Q.; Zhu, Y.; Cao, W.; Cheng, T. Spectroscopic detection of rice leaf blast infection from asymptomatic to mild stages with integrated machine learning and feature selection. Remote Sens. Environ. 2021, 257, 112350. [Google Scholar] [CrossRef]
  42. Burchett, S.; Burchett, S. Plant Pathology; Garland Science, Taylor & Francis Group, Cop: New York, NY, USA, 2018. [Google Scholar]
  43. Cooke, B.M.; Jones, D.G.; Kaye, B. The Epidemiology of Plant Diseases; Springer: Dordrecht, The Netherlands, 2006. [Google Scholar]
  44. Jacquemoud, S.; Baret, F. PROSPECT: A model of leaf optical properties spectra. Remote Sens. Environ. 1990, 34, 75–91. [Google Scholar] [CrossRef]
  45. Apan, A.; Held, A.; Phinn, S.; Markley, J. Detecting sugarcane orange rust disease using EO-1 Hyperion hyperspectral imagery. Int. J. Remote Sens. 2004, 25, 489–498. [Google Scholar] [CrossRef]
  46. McLellan, T.M.; Aber, J.D.; Martin, M.E.; Melillo, J.M.; Nadelhoffer, K.J. Determination of nitrogen, lignin, and cellulose content of decomposing leaf material by near infrared reflectance spectroscopy. Can. J. For. Res. 1991, 21, 1684–1688. [Google Scholar] [CrossRef]
  47. Wang, J.; Shi, T.; Liu, H.; Wu, G. Successive projections algorithm-based three-band vegetation index for foliar phosphorus estimation. Ecol. Indic. 2016, 67, 12–20. [Google Scholar] [CrossRef]
  48. Cao, Z.; Cheng, T.; Ma, X.; Tian, Y.; Zhu, Y.; Yao, X.; Chen, Q.; Liu, S.; Guo, Z.; Zhen, Q.; et al. A new three-band spectral index for mitigating the saturation in the estimation of leaf area index in wheat. Int. J. Remote Sens. 2017, 38, 3865–3885. [Google Scholar] [CrossRef]
  49. Pacheco-Labrador, J.; El-Madany, T.S.; van der Tol, C.; Martin, M.P.; Gonzalez-Cascon, R.; Perez-Priego, O.; Guan, J.; Moreno, G.; Carrara, A.; Reichstein, M.; et al. Senscope: Modeling mixed canopies combining green and brown senesced leaves. Evaluation in a Mediterranean Grassland. Remote Sens. Environ. 2021, 257, 112352. [Google Scholar] [CrossRef]
  50. Ustin, S.L. Remote sensing of canopy chemistry. Proc. Natl. Acad. Sci. USA 2013, 110, 804–805. [Google Scholar] [CrossRef]
  51. Jacquemoud, S.; Verhoef, W.; Baret, F.; Bacour, C.; Zarco-Tejada, P.J.; Asner, G.P.; François, C.; Ustin, S.L. PROSPECT+SAIL models: A review of use for vegetation characterization. Remote Sens. Environ. 2009, 113, S56–S66. [Google Scholar] [CrossRef]
  52. Ollinger, S.V. Sources of variability in canopy reflectance and the convergent properties of plants. New Phytol. 2010, 189, 375–394. [Google Scholar] [CrossRef]
  53. Abdullah, H.; Skidmore, A.K.; Darvishzadeh, R.; Heurich, M. Sentinel-2 accurately maps green-attack stage of European spruce bark beetle (Ips typographus, L.) compared with Landsat-8. Remote Sens. Ecol. Conserv. 2018, 5, 87–106. [Google Scholar] [CrossRef]
  54. Féret, J.-B.; Gitelson, A.A.; Noble, S.D.; Jacquemoud, S. PROSPECT-D: Towards modeling leaf optical properties through a complete lifecycle. Remote Sens. Environ. 2017, 193, 204–215. [Google Scholar] [CrossRef]
  55. Mahlein, A.-K.; Alisaac, E.; Al Masri, A.; Behmann, J.; Dehne, H.-W.; Oerke, E.-C. Comparison and Combination of Thermal, Fluorescence, and Hyperspectral Imaging for Monitoring Fusarium Head Blight of Wheat on Spikelet Scale. Sensors 2019, 19, 2281. [Google Scholar] [CrossRef] [PubMed]
Figure 1. Flowchart of data analysis and processing.
Remotesensing 16 04681 g001
Figure 2. The impact of pathogen infection on reflectance in rice leaves (A) and canopies (B). (A) depicts the average spectral reflectance of leaf samples at varying levels of infection, (B) shows the mean reflectance of near-ground canopies.
Remotesensing 16 04681 g002
Figure 3. (A) Spectral reflectance and DR correlation coefficients. (B) SPA selected feature wavelength distribution.
Remotesensing 16 04681 g003
Figure 4. The triangular regions formed by the three sensitive bands.
Remotesensing 16 04681 g004
Figure 5. The trapezoidal regions formed by the three sensitive bands.
Remotesensing 16 04681 g005
Figure 6. Cumulative overall accuracies (OAs) for the proposed GRVIRB compared to traditional vegetation indices at the canopy scale.
Remotesensing 16 04681 g006
Table 1. Leaf and canopy sample data for different years.
LevelYearNumber of SamplesSampling DateHealthy SampleInfected Sample
Leaf20201489.115197
20211216.064081
Canopy2020789.113147
20211016.064259
Table 2. Vegetation indices used in this study.
RelatedIndex Reference
Disease stressRIBInir ( R 753 R 1102 ) / ( R 665 + R 1102 ) [3]
RIBIred ( R 753 R 665 ) / ( R 665 + R 1102 ) [3]
RBI R 1148 / R 1301 [22]
Structural indexEVI 2.5 ( R 800 R 670 ) / ( R 800 + 6 R 670 7.5 R 400 + 1 ) [23]
LAIDI R 1250 / R 1050 [24]
MSR ( R 800 R 670 1 ) / ( R 800 R 670 + 1 ) [25]
MTVI1 1.2 [ 1.2 R 800 R 550 2.5 R 670 R 550 ] [26]
NDVI675/750 ( R 750 R 675 ) / ( R 750 + R 675 ) [27]
NRI ( R 570 R 670 ) / ( R 570 + R 670 ) [28]
PigmentsBGI R 450 / R 550 [29]
Chlrededge ( R 760 800 / R 690 720 ) 1 [30]
RARS R 746 / R 513 [31]
PSRI ( R 680 R 500 ) / R 750 [32]
PSSRa R 800 / R 675 [33]
LCI ( R 850 R 710 ) / ( R 850 + R 680 ) [34]
WaterSRWI R 860 / R 1240 [35]
Biochemical parametersCAI 0.5 R 2020 + R 2220 R 2100 [36]
Table 3. A confusion matrix and the classification accuracies of the GRVIRB discriminant models.
MethodsGRVIRBHealthyInfectedUA (%)OA (%)Kappa
Training dataset (2021)SVMHealthy40010098.350.97
Infected27997.53
PA (%)95.24100
LDAHealthy40010095.040.91
Infected67592.59
PA (%)86.96100
Validation dataset (2020)SVMHealthy272452.9480.410.7
Infected59294.85
PA (%)84.3879.31
LDAHealthy302158.8279.730.67
Infected98890.72
PA (%)76.9280.73
Table 4. Evaluation of the GRVIRB’s classification capability in relation to other VIs at the leaf scale.
YearVIsOverall Classification Accuracy (%)
SVMLDA
2021GRVIRB98.3595.04
RIBIred97.5293.39
MSR92.5692.56
PSSRa92.5692.56
RARS83.4785.12
Chlrededge76.3990.91
EVI73.5594.04
MTVI171.0794.87
LAIDI70.0785.95
RIBInir69.9492.56
NRI66.9494.21
RBI66.9489.26
NDVI675/75066.3490.91
PSRI66.9478.51
SRWI66.9494.21
BGI66.9463.64
CAI66.2965.29
LCI66.2980.17
2020GRVIRB80.4179.73
MTVI174.3279.05
SRWI60.2260.81
NRI65.5461.49
EVI70.1279.05
RIBIred65.5466.22
RIBInir69.9466.22
MSR72.9774.32
PSSRa75.6873.65
NDVI675/75065.5474.32
Chlrededge65.1078.41
RBI66.7278.32
RARS68.9265.54
LAIDI65.5478.08
LCI65.5472.30
PSRI60.2260.14
CAI68.9268.54
BGI65.5465.54
Disclaimer/Publisher’s Note: The statements, opinions and data contained in all publications are solely those of the individual author(s) and contributor(s) and not of MDPI and/or the editor(s). MDPI and/or the editor(s) disclaim responsibility for any injury to people or property resulting from any ideas, methods, instructions or products referred to in the content.

