Technical Note

Characterizing Changes in Paddy Rice Flooding Time over the Sanjiang Plain Using Moderate-Resolution Imaging Spectroradiometer Time Series

1
State Key Laboratory of Black Soils Conservation and Utilization, Northeast Institute of Geography and Agroecology, Chinese Academy of Sciences, Changchun 130102, China
2
College of Resources and Environment, University of Chinese Academy of Sciences, Beijing 100049, China
3
College of Land Science and Technology, China Agricultural University, Beijing 100193, China
*
Author to whom correspondence should be addressed.
Remote Sens. 2024, 16(24), 4683; https://doi.org/10.3390/rs16244683
Submission received: 4 November 2024 / Revised: 4 December 2024 / Accepted: 12 December 2024 / Published: 15 December 2024

Abstract

:
Rice is a primary food crop, and rice production ensures food security and maintains social stability with great significance. Flooding paddy rice fields as an important step in rice production affects the entire growth process of rice. The selection of flooding time is highly correlated with paddy rice yield and water resource utilization. In the background of global warming, early flooding in high-latitude paddy rice planting areas can ensure that rice has sufficient growing time to increase yield. However, overly early flooding may cause waste of water resources due to insufficient heat. Currently, research on flooding timing is relatively lacking, and monitoring of temperature during flooding is particularly deficient. To respond to climate change, it is necessary to explore whether the current flooding schedule meets the actual needs. Based on MODIS surface reflectivity data, we identified the First Flooding Day (FFD) and Peak Flooding Day (PFD) in the Sanjiang Plain. Using MODIS Land Surface Temperature (LST) data and meteorological station-provided air temperature data, we analyzed the corresponding LST and air temperature for PFD from 2008 to 2024. The main conclusions are as follows: (1) both FFD and PFD in the Sanjiang Plain have a trend of advancing year by year, with PFD showing stronger advancement than FFD; (2) the LST and air temperature during flooding in the Sanjiang Plain show a downward trend year by year; and (3) by 2024, the flooding temperature of paddy rice fields in the Sanjiang Plain has generally met the needs for the next step of production. This study first attempts to use high-temporal-resolution remote sensing images to identify the flooding time of paddy fields and achieve timely monitoring of flooding and changes in flooding temperature.

1. Introduction

Rice is an indispensable staple globally [1], revered by billions as a cornerstone of their daily nourishment, with its need continuing to soar [2]. Approximately 42% of the energy consumed by humans on a daily basis is derived from grains, with rice ranking as the top grain type, providing around 19% of the energy [2]. A substantial 70% of the world’s fresh water is channeled for agricultural irrigation [3], of which around a quarter to a third is used for the cultivation of paddy rice [4]. As the most significant cereal crop in the world, timely monitoring of paddy rice growth conditions is crucial for ensuring food security, rational use of water resources, safeguarding human health, and maintaining social stability [5,6,7,8]. Flooding the paddy rice fields is one necessary period before rice transplanting, serving as the fundamental prerequisite for paddy rice growth [9,10]. Flooding the fields either too early or too late may bring problems, with early flooding potentially leading to wastage of water resources and late flooding possibly impacting paddy rice yields [11]. Accurately determining the timing of flooding and understanding the environmental conditions during the flooding period are of great significance in ensuring successful paddy rice growth.
The flooding stage of the paddy rice fields is a crucial phase in paddy rice growth and serves as a distinguishing feature of paddy rice compared to other crops [12]. Satellite remote sensing technology plays a vital role in detecting the flooding period, offering a variety of robust identification methods. Researchers have obtained temporal profiles of Land Surface Water Index (LSWI) and Normalized Difference Vegetation Index (NDVI) data from 10-day composite SPOT-4/VGT (500 m) images [13], defining the classification rule for paddy rice fields as regions where the LSWI value increases and temporarily exceeds the NDVI value [14]. With the development of remote sensing technology, scholars have improved this algorithm using 8-day composite MODIS surface reflectance products (MOD09A1) with higher temporal resolution to determine the paddy rice flooding period based on the relationship between LSWI, NDVI, and Enhanced Vegetation Index (EVI) [15,16]. However, wetlands, cloud contamination, and snow cover may introduce uncertainty into the results [17]. Subsequent studies have reduced this uncertainty by applying more precise thresholds and integrating multiple remote sensing products to continually enhance and update the aforementioned method. For instance, Sun et al. [18] and Peng et al. [19] modified existing algorithms in the identification of flooding periods for single-crop, early-season, and late-season paddy rice. Zhang et al. [20] identified the paddy rice flooding period by combining MODIS-provided Land Surface Temperature (LST) products with 8-day composite images. Ni et al. [21] calculated five indices, including Bare Soil Index (BSI), LSWI, EVI, NDVI, and Plant Senescence Reflectance Index (PSRI), based on Sentinel-2 images, and identified paddy rice fields according to their characteristics at different growth stages. Hence, a comprehensive and reliable paddy rice flooding identification method based on remote sensing indices has been established. However, the temporal resolution of these studies is generally low, with most flooding identifications not precise to the day.
Statistical data show that China’s paddy rice production accounts for 27.8% of global paddy rice production [22], with the Northeast region being a significant paddy rice-producing area in China, accounting for about 15% of the national paddy rice production [23]. Among them, the Sanjiang Plain is the major paddy rice cultivation area in the Northeast China, and in recent years, the paddy rice cultivation area has been continuously expanding, signaling the region’s growing strategic importance in paddy rice cultivation [24]. However, due to the high latitude of the Sanjiang Plain, paddy rice cultivation in this area is susceptible to constraints from temperature and other meteorological factors [25]. Current research indicates that in response to changes in environmental factors, people have chosen different flooding periods, and the changes in flooding periods can affect paddy rice yields [26]. Ding et al. [27] found that under the global warming trend, appropriately advancing the sowing period in the Northeast region may have a positive impact on paddy rice production. Therefore, in order to coordinate with the early sowing and seedling cultivation of paddy rice, the flooding time in paddy fields should also be adjusted accordingly to properly manage the paddy rice flooding period, promote the protection and rational utilization of water resources, ensure paddy rice yields, and provide references for further understanding the relationship between paddy rice cultivation and climate change [28,29].
This study used long-term (2008–2024) MODIS daily data and the index method to construct a daily dataset of paddy rice flooding in the Sanjiang. The analysis is complemented with data on LST and Air Temperature (Tair). The main objectives of this study are as follows: (1) to construct a yearly dataset of paddy rice flooding in the Sanjiang from 2008 to 2024; (2) to obtain the earliest and peak flooding date and explore the changes in the flooding day. (3) to investigate the patterns of LST and Tair on the flooding day in recent years and analyze whether the recent changes in flooding practices are reasonable.

2. Materials and Methods
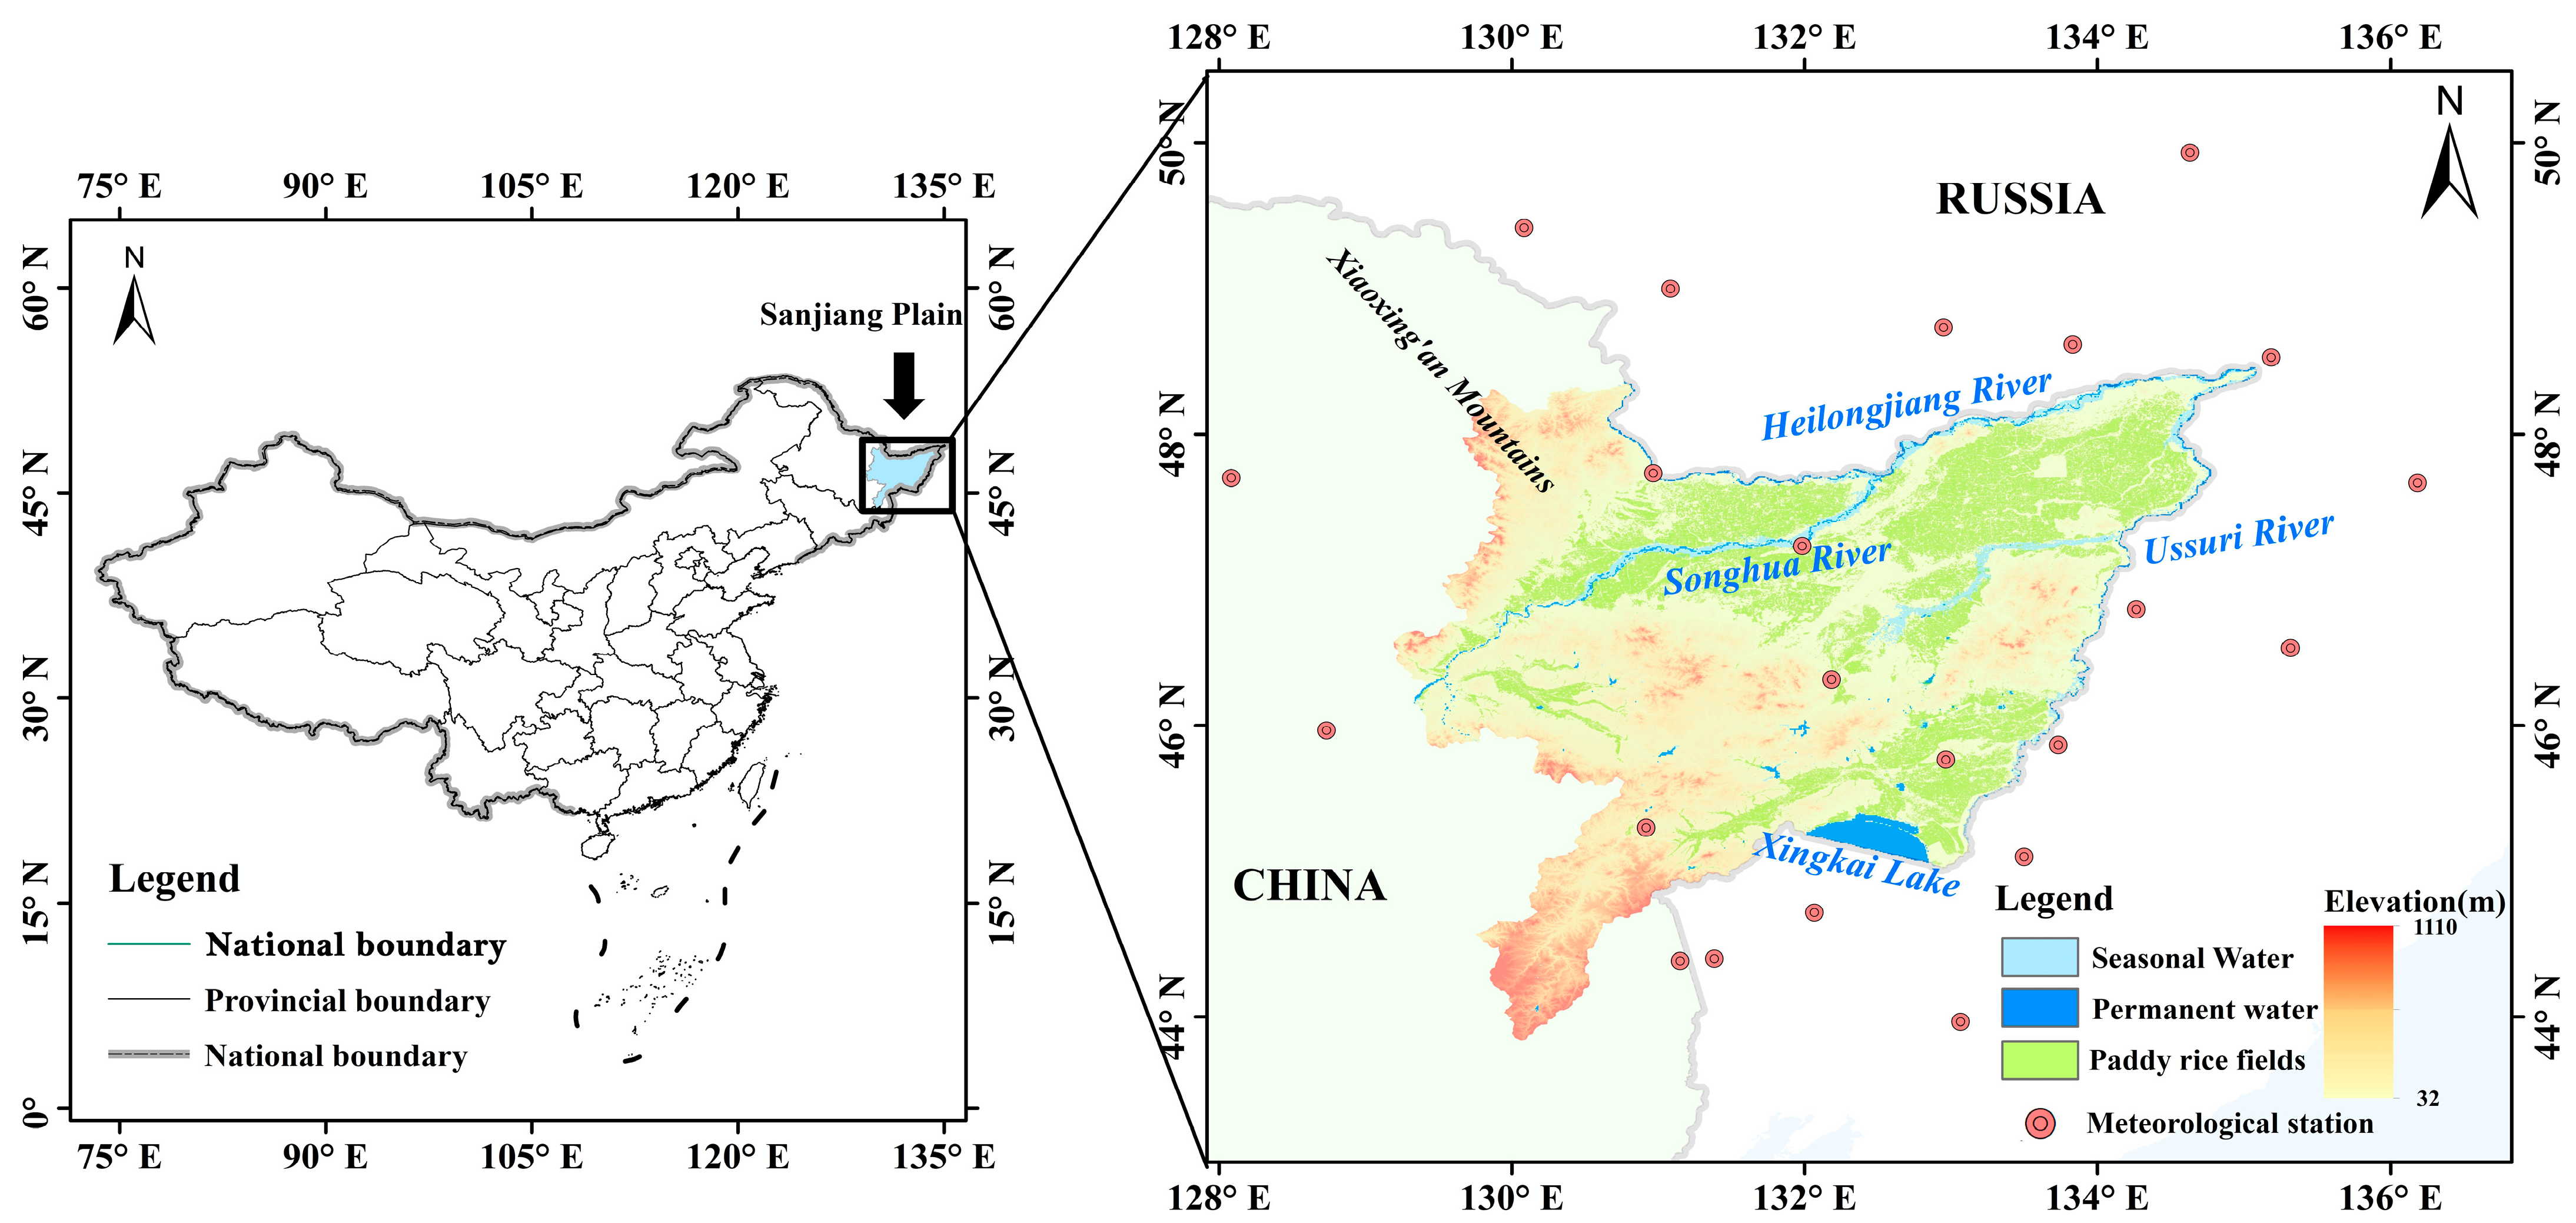
2.1. Study Area

The Sanjiang Plain is located in the northeastern part of Heilongjiang Province, bounded by the Heilongjiang River to the north, Xingkai Lake to the south, and the Xiaoxing’an Mountains to the west (Figure 1). The Heilongjiang, Wusuli, and Songhua Rivers run through this region and provide plenty of water and fertile floodplain. The Sanjiang plain experiences a temperate humid/subhumid continental monsoon climate, with an annual precipitation of approximately 500–600 mm, mostly falling between June and August. The accumulated temperature above 10 °C ranges from 2300 to 2500 °C, with a frost-free period lasting between 120 and 140 days. The average annual temperature in the region ranges from 1 °C to 4 °C, with relatively high temperatures in summer. The arable lands are rich in organic matter due to the black soil and mainly produce paddy rice, soybeans, and corn. The growth cycle of paddy rice usually spans 140 to 160 days. The rain and heat are in the same period in the Sanjiang plain, and the climate is suitable, which can ensure the growth and development of single-season rice. Since 2008, the Sanjiang Plain has been growing rice in large areas and has become one of the main rice-producing areas in northern China [30]. However, under the background of current climate change, the rising trend of temperature and the frequent occurrence of extreme weather may shorten the main growth period of paddy rice, which is not conducive to ensuring the yield of food [31,32]. Therefore, agricultural activities should seize the season that suits the paddy rice’s growth.

2.2. MODIS Data

Moderate-resolution Imaging Spectroradiometer (MODIS) is an important sensor on Terra and Aqua satellites, with a wide spectral range and high spectral resolution [35,36]. It covers the whole spectrum from 0.4 microns (visible light) to 14.4 micron (thermal infrared) and has 36 bands, which can support the observation of ground objects in the complex geographical systems [37]. The Terra satellite was launched on 18 December 1999, and the Aqua satellite was launched on 4 May 2002, which provides long-term MODIS data to monitor the changes in the land surface [38]. The daily surface reflectance product (MOD09GA.061) with 500 m spatial resolution was obtained on the Google Earth Engine (GEE) platform. In order to locate a clear flooding time, we did not perform time composition. They include seven bands: Red (620–670 nm), NIR1 (841–876 nm), Blue (459–479 nm), Green (545–565 nm), NIR2 (1230–1250 nm), and SWIR1 (1628–1652 nm). We removed bad observations caused by clouds and cloud shadows using the quality bands.

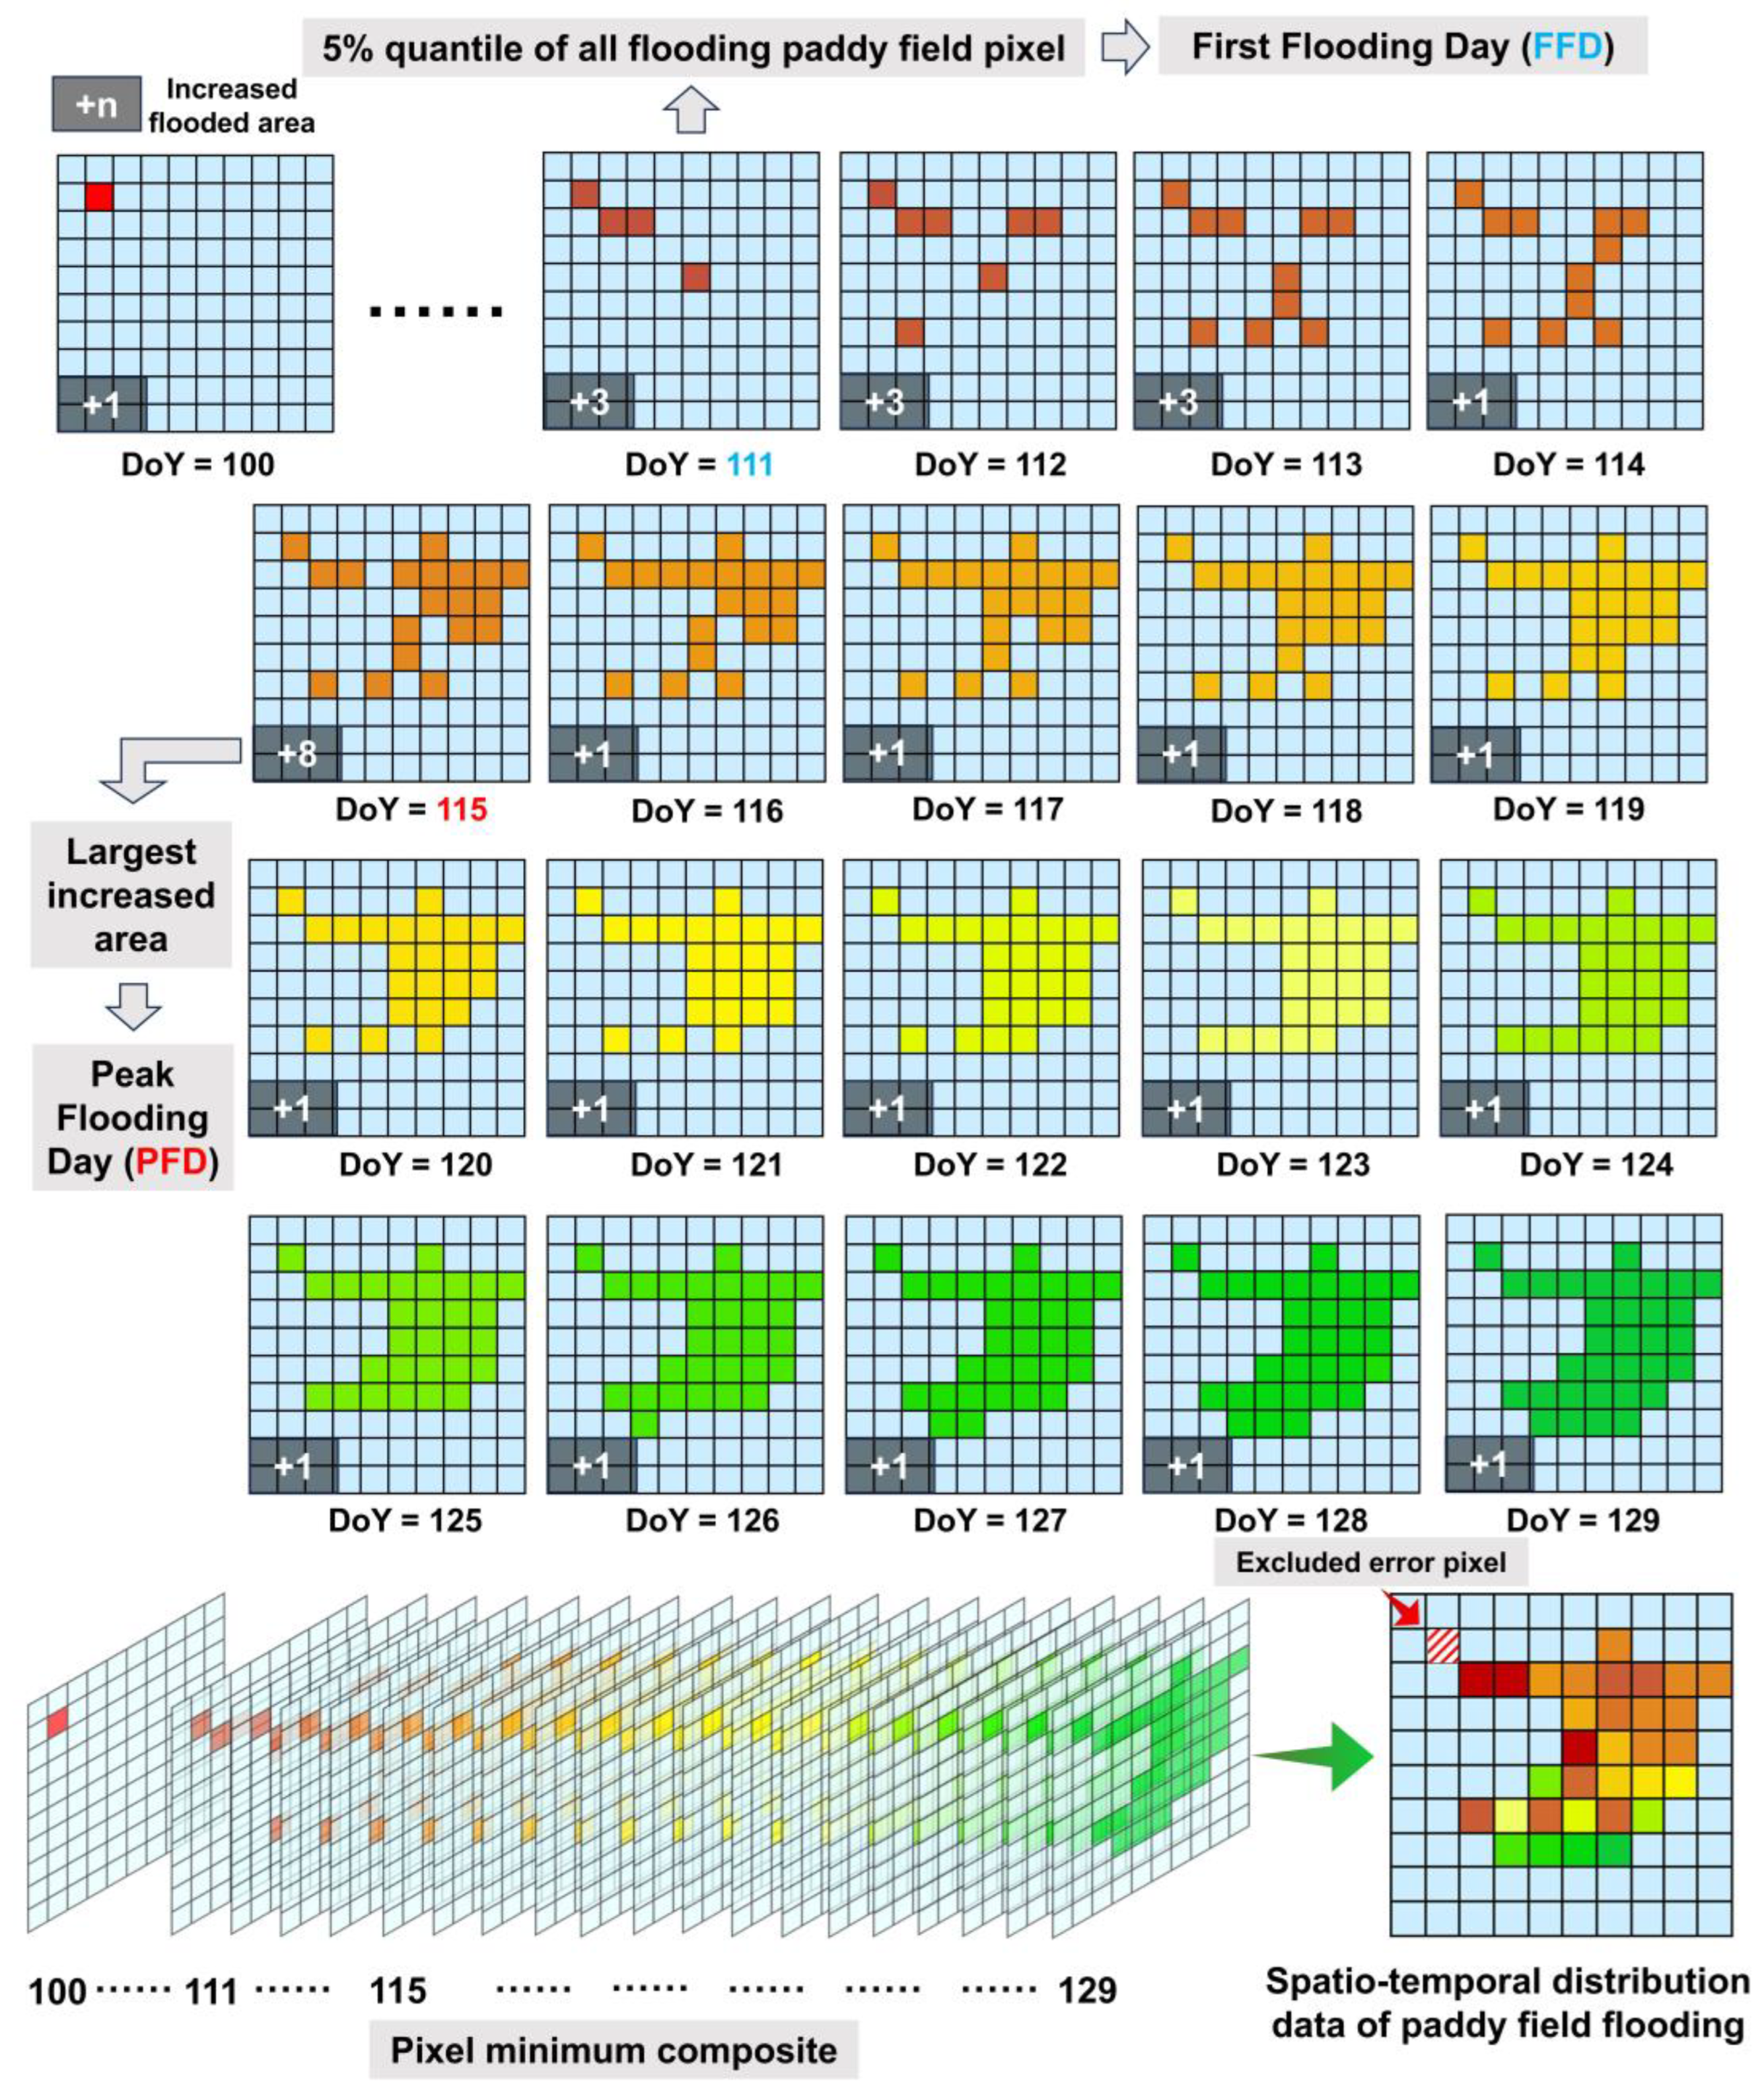
2.3. Identification of Rice Flooding Time

At the stage of flooding and transplanting, the spectrum of rice fields shows mixed signals of water and plants [39,40]. When the plants grow rapidly until the canopy is closed, the water signal gradually disappears, and the rice pixels appear as the spectrum of paddy plants [12]. In this study, we used the method of determination of flooding signal of paddy rice proposed by Xiao et al. [15,16]. When the paddy field is flooded, LSWI Equation (1) of the paddy field will approach or exceed NDVI Equation (2) or EVI Equation (3), which can represent the flooding signal of the paddy field [13,14]. Zhang et al. [20] took into account the fact that the spatial resolution of the MODIS image is 500 m and acknowledged the existence of mixed pixels. To address this, they utilized a threshold value of 0.05, and the 5% confidence interval is integrated to identify flooding pixels [15,16] (Equation (4)).
L S W I = ρ N I R 1 ρ S W I R 1 ρ N I R 1 + ρ S W I R 1
N D V I = ρ N I R 1 ρ R e d ρ N I R 1 + ρ R e d
E V I = 2.5 × ρ N I R 1 ρ R e d ρ N I R 1 + 6 × ρ R e d 7.5 × ρ B l u e + 1
L S W I + 0.05 N D V I L S W I + 0.05 E V I
The SWIR band is sensitive to leaf moisture and soil moisture, and LSWI based on NIR and SWIR has been successfully applied to rice extraction and mapping. Although both NDVI and EVI can reflect the vegetation coverage, when the vegetation coverage exceeds a certain level (LAI > 2), NDVI will gradually become saturated. In addition, NDVI is sensitive to changes in atmospheric conditions and soil background [41]. EVI provides higher sensitivity in high-biomass areas while minimizing the impact on soil and atmosphere [42,43].
We firstly used MODIS data from 1 April to 30 May, that is, Day of Year (DoY) from 90 to 145, to identify pixels with flooding signals and record the DoY of that day as the value of a flooding pixel. Secondly, the value that is not recognized as a paddy field pixel was defined as the DoY corresponding to a day outside the possible flooding period. Thirdly, the images after multi-scene processing were fused with a minimum value in one year. The distribution of paddy rice flooding time was finally obtained.

2.4. Elimination of Other Interfering Objects

Snow cover, water bodies, wetlands, and other factors may produce similar flooding signals in the flooding and transplanting period of rice in high-latitude areas, which creates obstacles for extraction in the flooding period in Sanjiang. In previous studies, many scholars used multiple algorithms to generate various masks to eliminate the factors affecting rice extraction. For example, Xiao et al. [15,16] generated masks of snow, permanent water bodies, and evergreen vegetation, and Zhang et al. [20] took the impact of wetlands into account. The misclassification error of rice fields could be significantly reduced after comprehensively considering these factors. Based on the actual hydrological conditions and vegetation coverage in the Sanjiang Plain, this paper mainly creates masks for snow, water (permanent water and seasonal water), and wetlands. Because wetlands and seasonal water have some intersections, but there are also areas that are different from each other, both were considered in our study.

2.4.1. Snow Cover Elimination

In Sanjiang, snow covers for a long time, and some years will last until the middle of April. Because of its NIR reflectivity and very low short-wave infrared (SWIR) reflectivity, snow has a high LSWI and a very low EVI, so it seems to be misclassified as rice fields. We used the Normalized Difference Snow Index (NDSI) Equation (5) based on MODIS to extract snow from each image in the study period [44]. Zhang et al. [20] used NDSI > 0.40 and NIR > 0.11 as segmentation thresholds in their study, which focused on the Northeast China region. Since our study area is similar, we applied the same thresholds from their work to mask the snow, which yielded satisfactory results. Therefore, we chose these thresholds for image processing.
N D S I = ρ G r e e n ρ S W I R 1 ρ G r e e n + ρ S W I R 1

2.4.2. Water Elimination

In general, water pixels also showed that LSWI is greater than NDVI/EVI. Therefore, it is necessary to use water masks to eliminate the influence of water. We used the permanent water body and seasonal water body provided by the yearly global surface water dataset published by Pekel et al. [34] to mask the annual image, so as to eliminate the influence of water pixels. This product is based on water body extraction using data from Landsat 5 (TM), Landsat 7 (ETM+), and Landsat 8 (OLI), with a spatial resolution of 30 m. It has shown high classification accuracy in the Northeast China region. We employed the nearest-neighbor resampling method on the Google Earth Engine (GEE) platform to standardize the resolution to 500 m. Since the timing of water body extraction may overlap with the flooding period of paddy fields, we used cropland mask data [45] to exclude rice paddies from the analysis.

2.4.3. Wetland Elimination

Wetlands are widely distributed in Northeast China and consist of static or flowing water bodies for a long time or temporarily, such as Xingkai Lake Wetland in the southeast of Sanjiang plain and Honghe Wetland in the northeast [46,47]. The increase in river net flow caused by melting ice and snow and precipitation in Northeast China will promote the growth of wetland vegetation, so wetlands show the same spectral characteristics as paddy fields in a certain period of time, and due to the heat and precipitation characteristics of the Sanjiang plain, the vegetation index changes in wetland vegetation are similar to paddy fields, so it is necessary to exclude wetland areas outside paddy fields to reduce classification errors. In the Sanjiang Plain, we mainly consider inland swamps. Therefore, we use China Wetland Mapping (CAS_Wetlands) by Mao et al. [48] to mainly exclude the inland swamp/inland marsh outside the paddy field. The spatial resolution of the data is 30 m, and the classification accuracy of swamp wetland reaches 95%. We resampled the data using the nearest neighbor method.

2.5. Daily Flooding Data Composite

Previous studies have used 8-day composite images to ensure the completeness of the extraction of flooding areas. In contrast, this study utilizes daily images to enhance the accuracy of detecting flooding timing. We obtained daily potential flooding pixel maps using the flooding pixel identification method and data-masking process. Each daily image contains two types of pixels: flooding pixels and other land cover pixels. To ultimately obtain a composite image of all flooding pixels during the potential flooding period, we need to perform data fusion processing on the images, which is shown in Figure 2. During the potential flooding period, the occurrence of precipitation may interfere with the identification of flooding pixels. Therefore, we use a 5% confidence interval to exclude such random errors. After removing 5% of pixels, the first day when flooding pixels appear is defined as the First Flooding Day (FFD). Subsequently, we assign values to the flooding pixels, where the value corresponds to the Day of Year (DoY) for each image within the year. Since flooding pixels may appear on multiple days and some pixels may persist for several consecutive days, we select the earliest day when a pixel is identified as a flooding pixel as its value during the data composite process. Based on this, we compare the flooding area appearing each day during the potential flooding period, and the day with the largest increased area is defined as the Peak Flooding Day (PFD), which corresponds to the period when the majority of farmers engage in flooding activities.

2.6. Temperature Data and Processing

2.6.1. Land Surface Temperature

Terra and Aqua satellites both have thermal infrared (TIR) bands (bands 31 and 32) and provided eight-day composite MODIS day and night surface temperature products, namely MOD11A2 (from the Terra satellite) and MYD11A2 (from the Aqua satellite), with spatial resolutions of 1 km. Temperature observation will be carried out during the day and night. The observation time during the day is 10:30 am (from the Terra satellite) and 13:30 pm (from the Aqua satellite) local time, and the observation time at night is 22:30 pm (from the Terra satellite) and 01:30 am (from the Aqua satellite). Due to the significant daily temperature changes in high latitudes, compared with Terra’s daytime temperature, the daytime temperature obtained by Aqua has a more sufficient light heating process, and the frost condition and crop planting depend on the daily minimum temperature. Therefore, the day and night temperature of MYD11A2 over the years is selected to study the day and night temperature of rice fields before and after flooding. The data of MYD11A2 are expressed in Kelvin temperature (K), and their grid value (DN) should be converted into LST with a unit value of Celsius by Equation (6).
L S T = D N K × 0.02   273.15

2.6.2. Air Temperature

Temperature is of great significance to the growth of rice, so farmers often need to consider temperature conditions when carrying out agricultural activities such as flooding and transplanting, so as to ensure the normal growth and development of rice. Therefore, we explored the corresponding temperature conditions before and after flooding in the Sanjiang Plain and the changes in different years. The National Oceanographic and Atmospheric Administration (NOAA) provides hourly/sub-hourly ground meteorological data for many stations around the world. In order to cover the whole study area and obtain better temperature interpolation results, we not only selected 7 stations in China, but also selected 15 meteorological stations in Russia, ranging from 128.1~136.2E and 44.5~48.6 N.
In order to match the acquisition time of MODIS LST data, we selected the time with the closest time and little difference in heat conditions (14:00 and 2:00 the next day) to collect its temperature data for subsequent processing.
The interpolation method is AUNSPLIN. The ANUSPLIN package provides a facility for transparent analysis and interpolation of noisy multi-variate data through comprehensive statistical analyses, data diagnostics, and spatially distributed standard errors using thin plate smoothing splines. The expression method of its theoretical statistical model is expressed through Equation (7):
z i = f x i + b T y i + e i i = 1,2 , , N
where each xi is a d-dimensional vector of spline independent variables; f is an unknown smooth function of the xi; each yi is a p-dimensional vector of independent covariates; b is an unknown p-dimensional vector of yi coefficients; and each ei is an independent, zero-mean error term with a variance wiσ2, where wi is termed the relative error variance and σ2 is the error variance, which is constant across all data points but normally unknown [49]. The model reduces, on the one hand, to an ordinary thin plate spline model when there are no covariates (p = 0) and to a simple multivariate linear regression model, on the other hand, when f(xi) is absent.
The function f and the coefficient vector b are determined by minimizing Equation (8).
i = 1 N z i f x i b T y i w i + ρ   J m f
where J m f is a measure of the complexity of f; the “roughness penalty” defined in terms of an integral of mth order partial derivatives of f; and ρ is a positive number called the smoothing parameter. The value of the smoothing parameter is normally determined by minimizing a measure of predictive error of the fitted surface given by the generalized cross-validation (GCV).
Because the temperature is mainly affected by geographical location and altitude, we choose longitude and latitude as independent variables and elevation as an independent covariate for temperature interpolation. By comparing the variance and standard deviation of the interpolation results, we choose the spline number as 2 and use the three-variable local thin plate smooth spline function (TVPTPS2) to interpolate and obtain the temperature interpolation results in the Sanjiang plain from 2008 to 2024.

3. Results

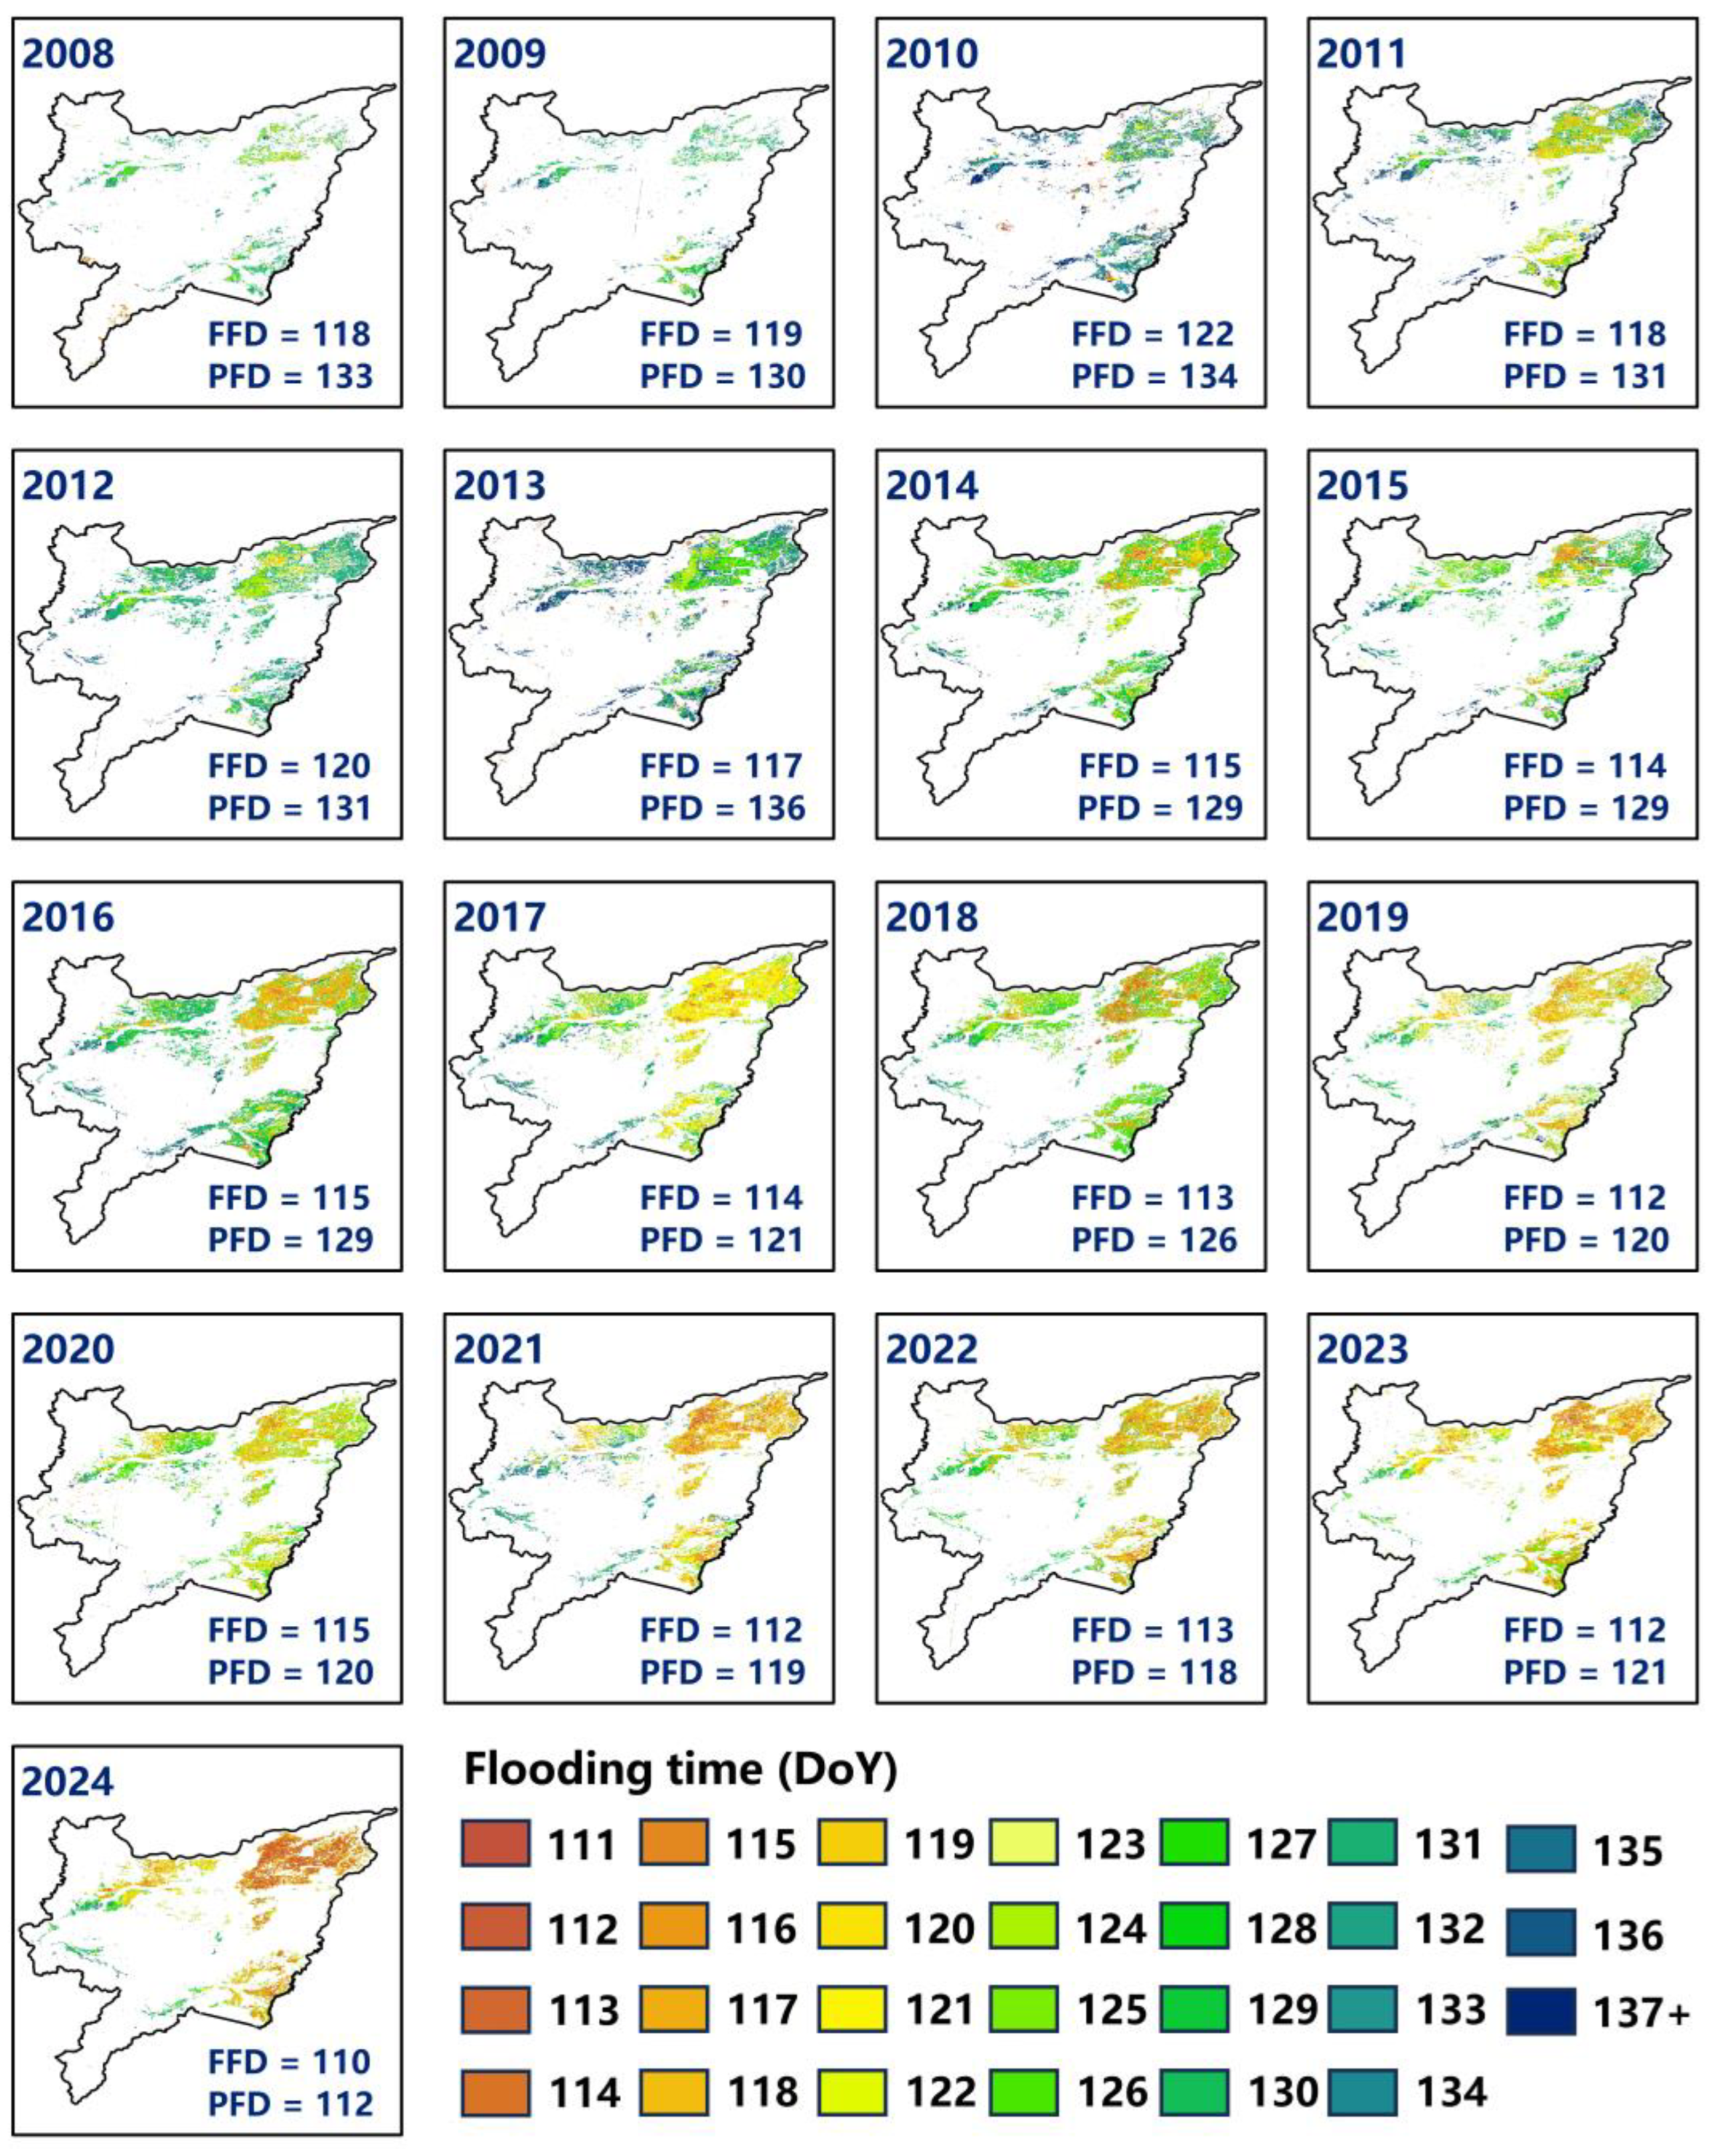
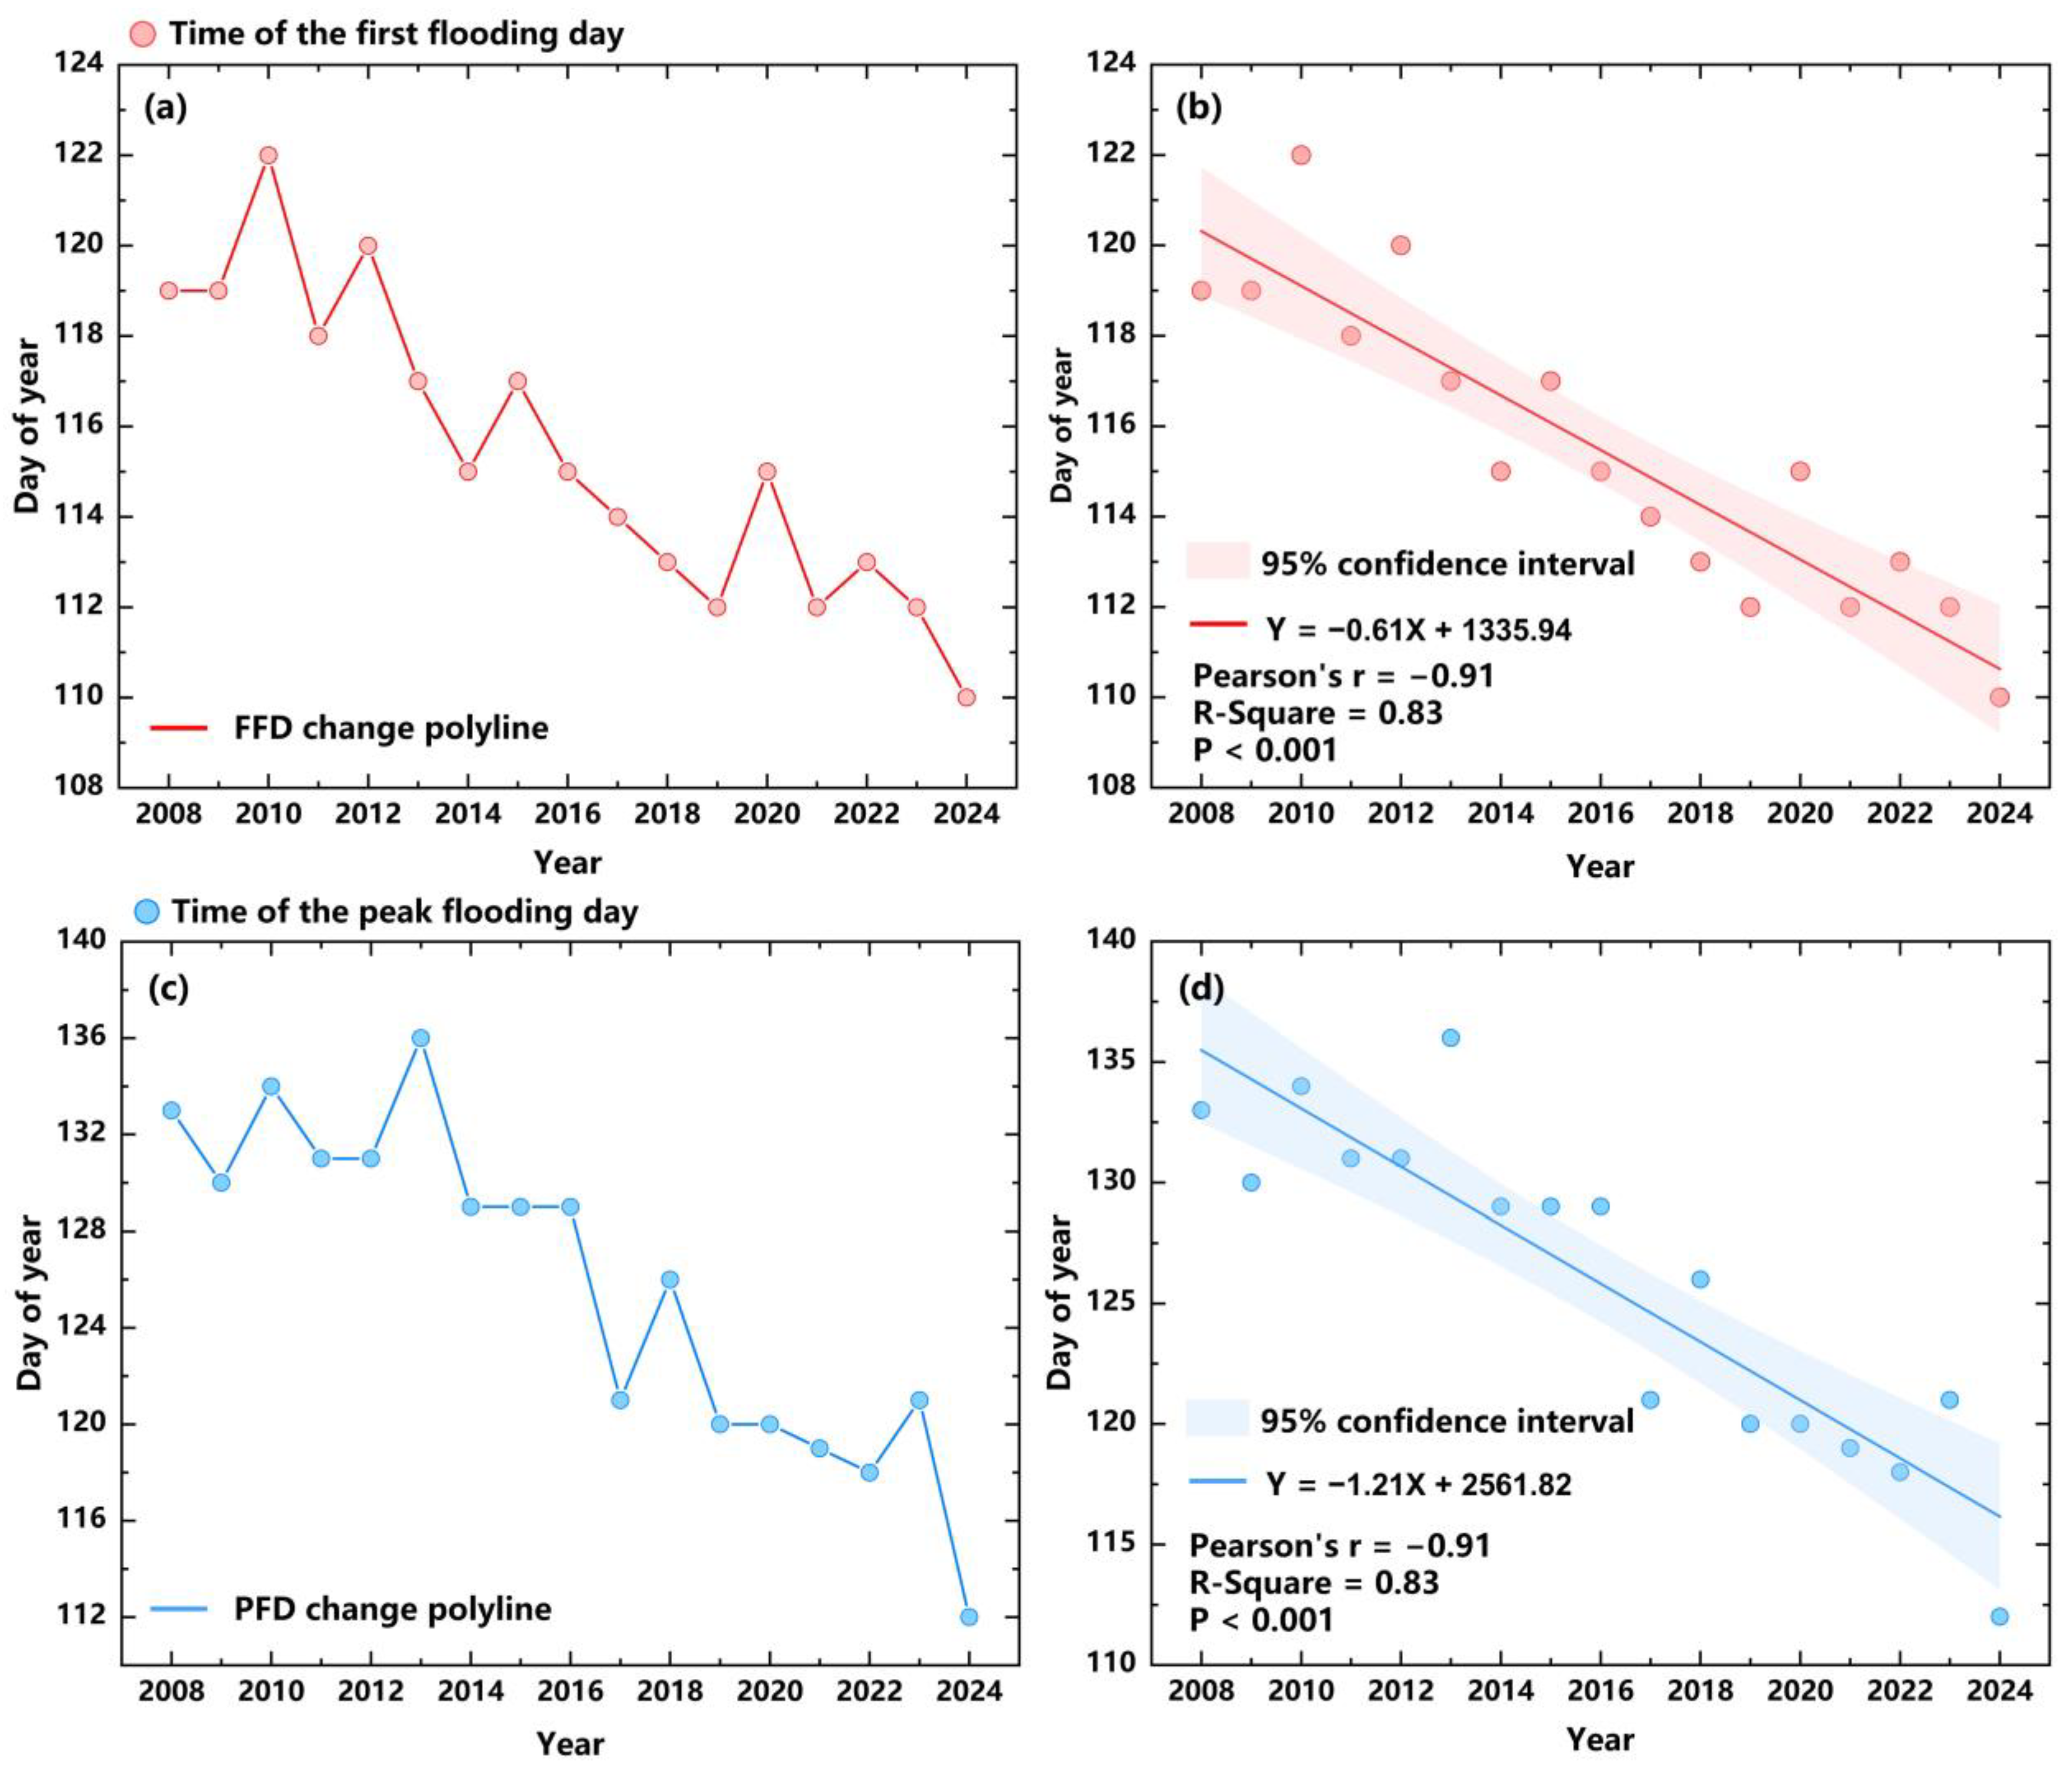
3.1. Spatio-Temporal Pattern of Flooding Time

The spatial distribution of MODIS-derived rice flooding time in Sanjiang from 2008 to 2024 is shown in Figure 3. It can be observed that the overall flooding timing across the Sanjiang Plain has been advancing, although the significance of this change varies across different areas. The northeastern part of Sanjiang, where rice cultivation is most extensive, exhibits the earliest flooding timing, with a notably significant shift toward earlier dates over time. The southeastern rice fields display a degree of synchronization with the northeastern region, following a similar trend. In contrast, the flooding timing in the northwest has also been advancing, but the magnitude of this change is less pronounced than in the eastern regions. The southwestern area, with the smallest rice-growing area, shows the least significant advancement in flooding timing.
The results showed that the earliest FFD was 110 in 2024, while the last FFD was 122 in 2010 (Figure 4). The earliest PFD was 136 in 2013, and the last was 112 in 2024. We further studied the trend of FFD and PFD using linear fitting and found the significant downward trend of FFD (Pearson’s r −0.91085, R-square 0.82965) and PFD (Pearson’s r −0.89937, R-square 0.79613) in these 17 years, which means that the rice flooding time was generally advanced in Sanjiang.

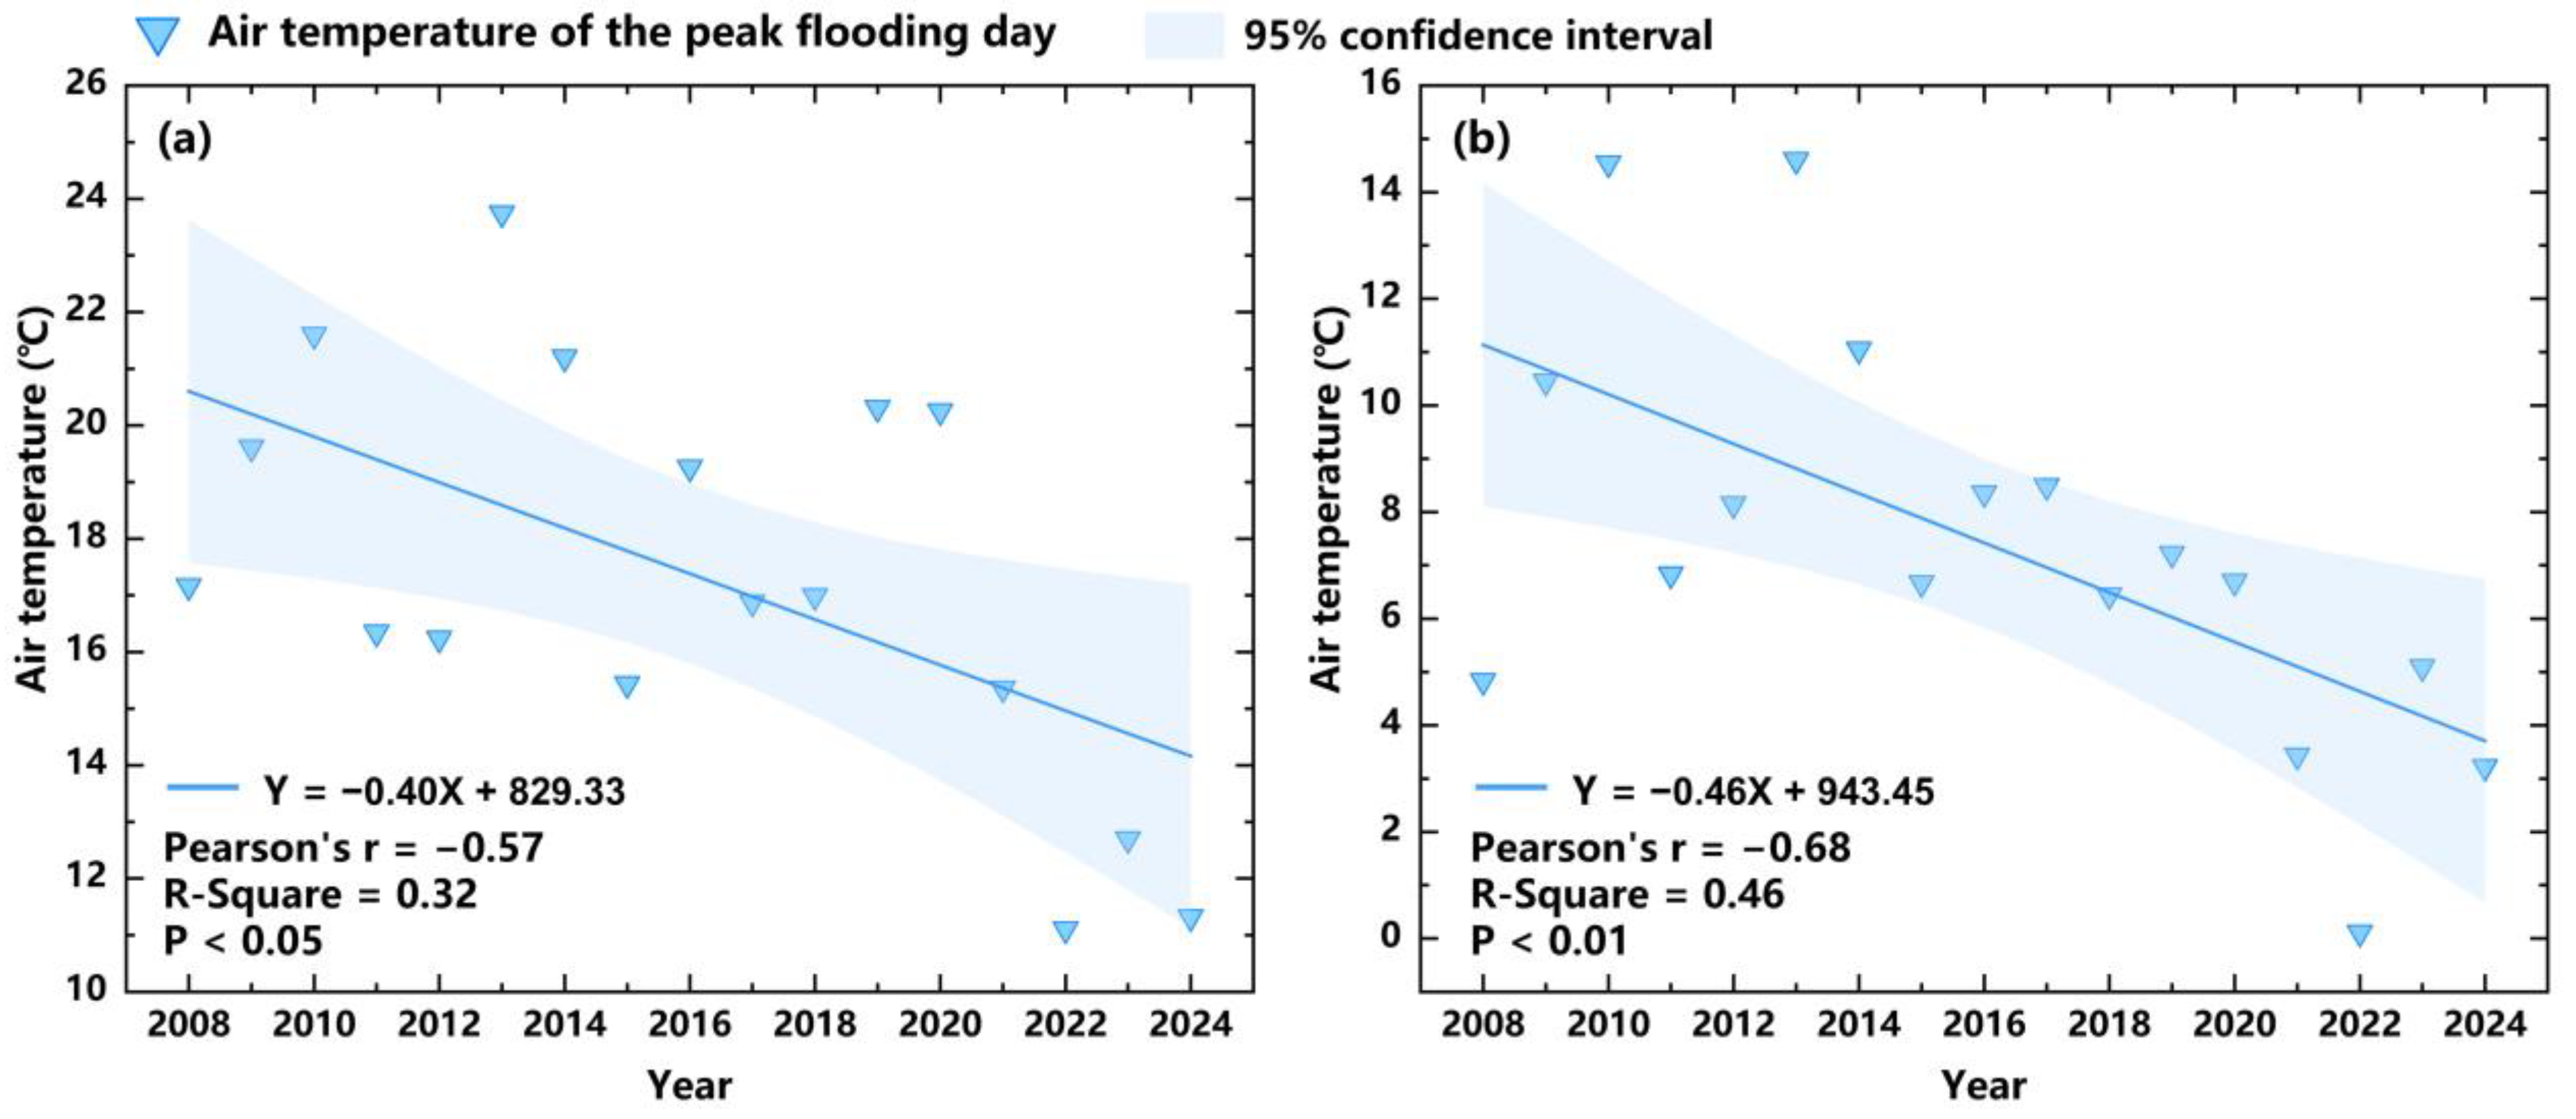
3.2. Changes in Temperature of PFD

PFD represents the most concentrated day of rice flooding, and the temperature of this day represents the flooding tendency. LST is originally in raster format, and the Tair data after the ANUSPLIN interpolation method is also in raster format. Therefore, we extracted the LST and Tair data for the increased flooded areas identified on the PFD and averaged the extracted values separately. Finally, we performed time series analysis and linear fitting on the LST and Tair data of PFD in each year. The lowest LST at 13:30 of PFD is 15.2 °C in 2022, and the highest is 27.8 °C in 2008, with an average of 21.9 °C (Figure 5a). The lowest LST of PFD at 01:30 the next day is 2.0 °C in 2019, and the highest is 13.7 °C in 2013, with an average of 6.8 °C (Figure 5b). The lowest Tair at 14:00 of PFD is 11.1 °C in 2022, and the highest is 23.7 °C in 2013, with an average of 17.6 °C (Figure 6a). The lowest Tair of PFD at 02:00 the next day is 0.1 °C in 2022, and the highest is 14.6 °C in 2013, with an average of 7.4 °C (Figure 6b). After linear fitting, the LST and Tair of PFD showed an obvious negative correlation trend with the change in years. It shows that the temperature of the flooding time has obviously decreased over the years.

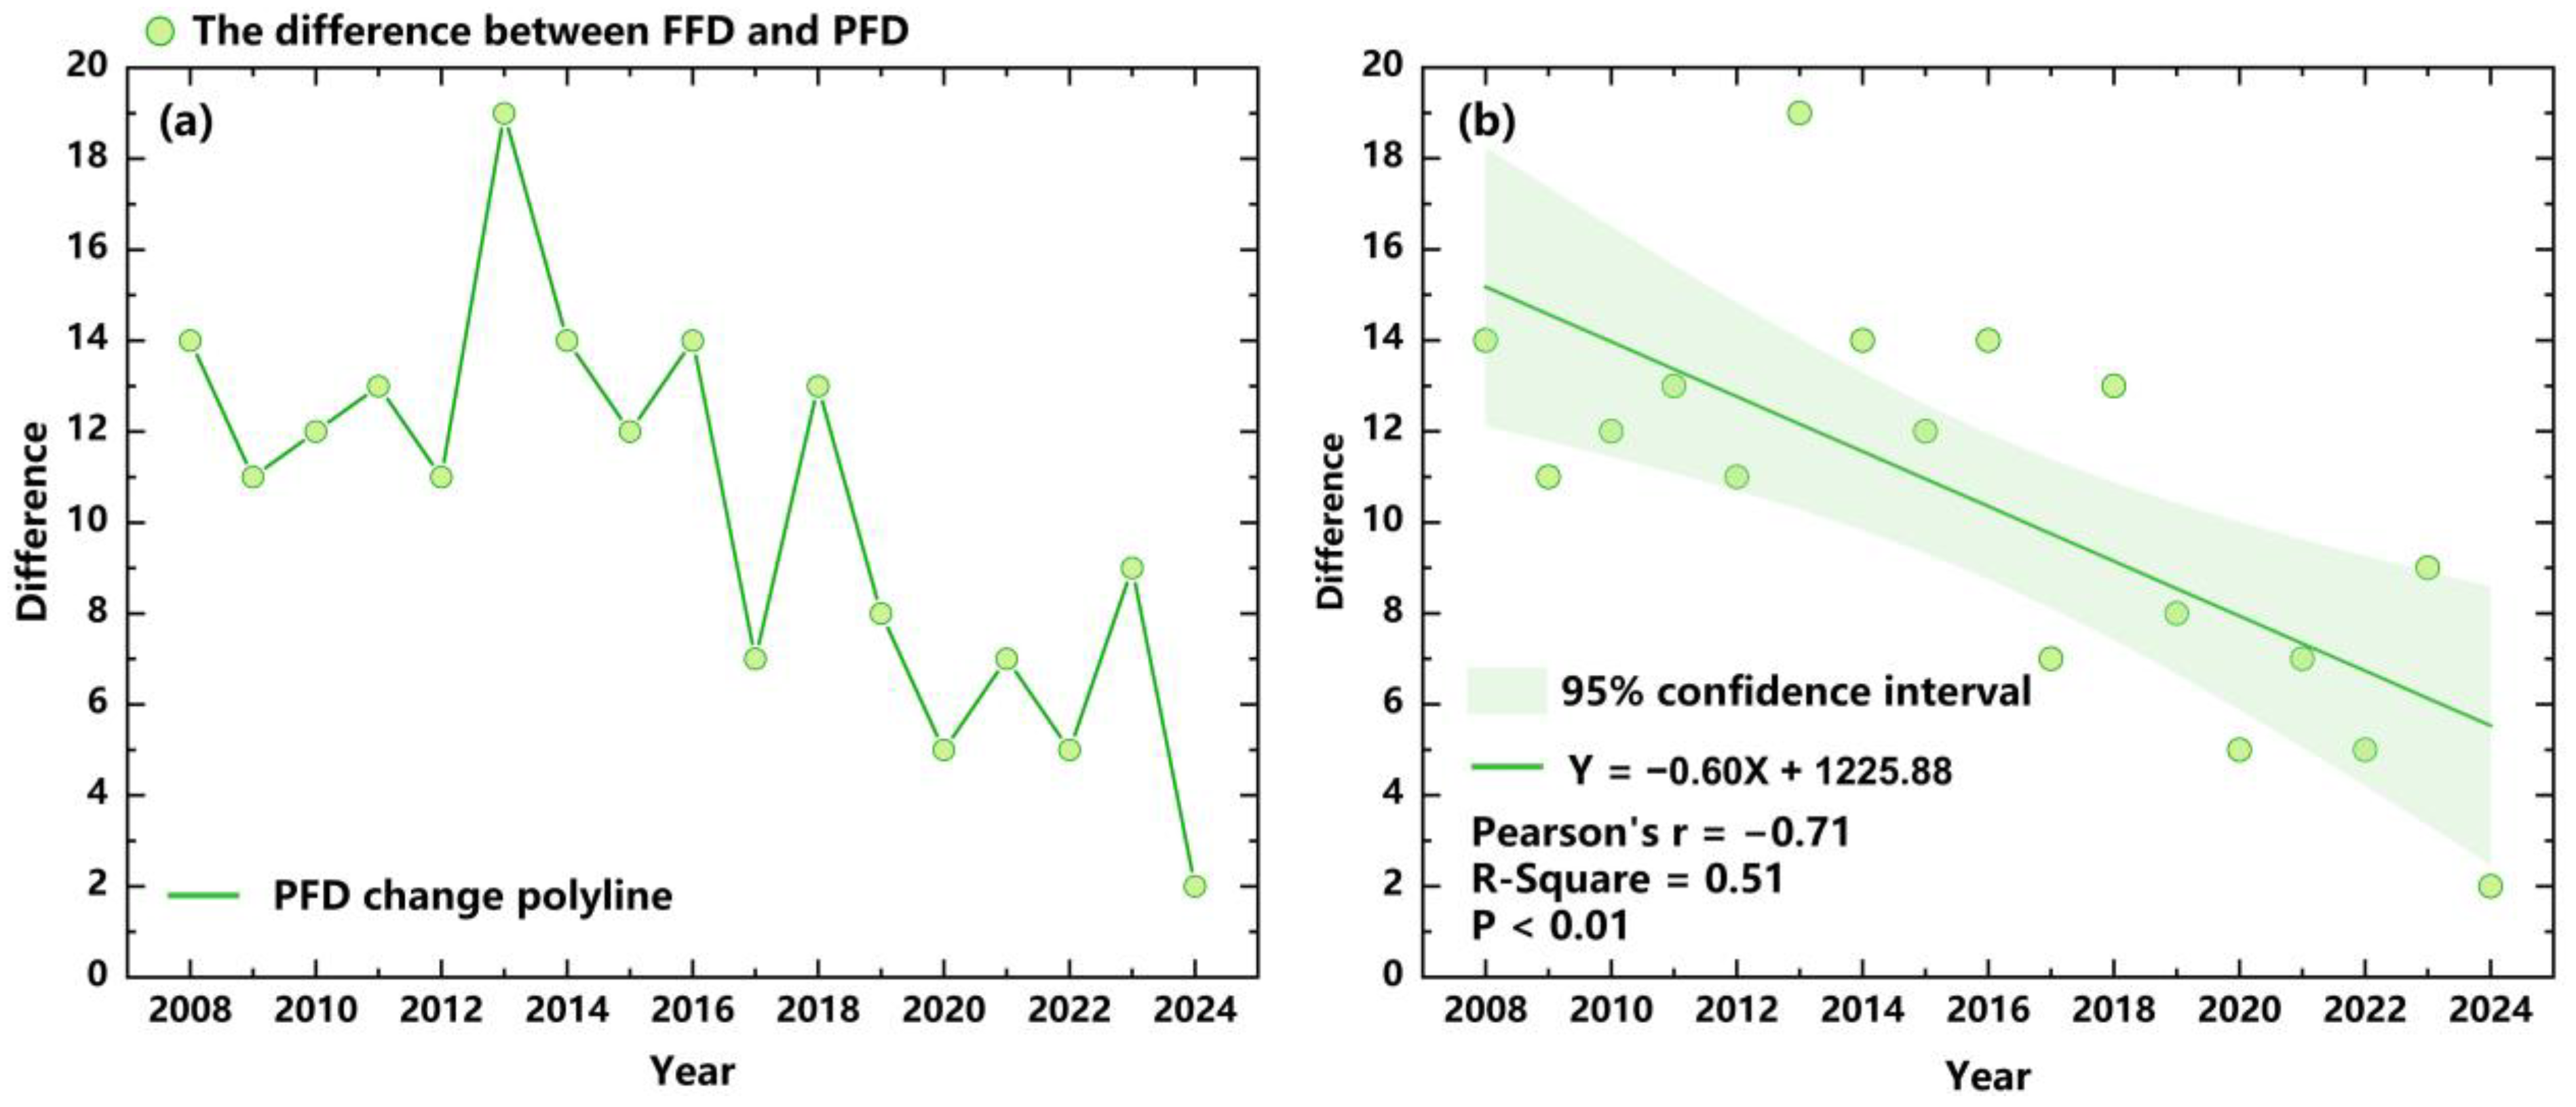
3.3. Analysis of Changes in Flooding Concentration

The FFD was the onset of flooding in paddy fields, while the PFD was the day with the maximum irrigated area. The difference between these two dates reflects changes in the concentration of flooding timing within the study area to some extent. If the difference between FFD and PFD is large, it indicates the distribution of flooding times among farmers was dispersed. In contrast, a smaller difference means the flooding activities of farmers tended to cluster together. We analyzed the difference between FFD and PFD over the past 17 years. The results revealed that the difference between the two dates is 10.4 days on average, with the largest gap (19 days) in 2013 and the smallest gap (2 days) in 2024 (Figure 7). In addition, the difference between FFD and PFD showed a significant decreasing trend and demonstrates a certain linear relationship. These findings suggest that the flooding behaviors of farmers are becoming gradually synchronized, likely due to environmental, policy, and practical agricultural factors. Adjustments made by farmers in response to climate change, the Ministry of Agriculture and Rural Affairs’ continuous emphasis on the importance of early flooding in its annual rice production guidelines, and the improvements in irrigation efficiency through upgraded facilities collectively contribute to the growing uniformity in flooding timing in paddy rice fields.

4. Discussion

4.1. Advantages and Limitations

This research employed MODIS daily time series spanning from 2008 to 2024, combined with a flood signal extraction method, to delineate the day of flooding in the Sanjiang Plain over these years. This marks the inaugural application of Daily MODIS data in the extraction of flooding timing. The successful progress of this study can be primarily attributed to three aspects. Firstly, the robust performance of the rice identification algorithm. The rice extraction method utilized in the article has been widely applied in the recognition of flood signals using MODIS data and has been extended to other satellite data [18,50]. The extracted results possess robustness and transferability, thus yielding highly accurate detection of paddy field flooding signals. Secondly, MODIS daily multispectral remote sensing images exhibit high temporal resolution. The MODIS daily multispectral remote sensing images encompass visible light (red, green, and blue), near-infrared (NIR1 and NIR2), and shortwave infrared (SWIR1 and SWIR2), thereby fully supporting the spectral bands required for the rice extraction methods, thus facilitating rice extraction. Although MODIS 8-day composite data, Landsat TM/ETM, and Sentinel-2 data also possess reasonably configured spectral bands and have been extensively utilized in rice extraction and similar endeavors in previous studies, their lower temporal resolution restricts their application in studies necessitating precise extraction for specific time periods, particularly in regard to the timing of rice flooding. Finally, to effectively remove interference from other land features, multiple reliable remote sensing datasets were used. While the rice identification algorithm was successful in extracting flooded rice fields, it also identified other bodies of water and some wetlands as rice fields, resulting in significant image noise [51]. Therefore, we utilized trustworthy wetland and water body datasets to exclude these influences and obtain improved extraction results.
The uncertainty in the extraction of the flooding time can be attributed to two factors. Firstly, for MODIS daily data, like all visible light data, it faces the challenge of meteorological conditions, such as the obstruction caused by clouds and cloud shadows [52]. The presence of clouds has a significant impact on the extraction of rice flooding; despite our basic cloud removal processing using GEE, there may still be an impact from cloud effects. Secondly, the spatial resolution of MODIS imagery is relatively low, and the problem of mixed pixels is more severe [53]. Data we used have a spatial resolution of 500 m, so if there are small areas of flooding, it may not be quickly reflected at the pixel level. In future research, we can mitigate the impact of cloud cover by integrating remote sensing data from multiple sources and acquired at different times. Additionally, along with the fusion of higher-resolution imagery, it could help address the limitations posed by the relatively low spatial resolution of MODIS data.

4.2. Contrast Verification with 8-Day Results

Zhang et al. [20] developed a method for identifying flooding and transplanting periods for rice based on MODIS 8-day composite imagery, which can approximately ascertain when paddy fields were flooded. This method has been widely recognized and verified, and the flooding time period extracted by this method can be considered accurate. However, this method also has disadvantages, because it can only obtain the time period of 8 days but cannot determine the specific date [54]. We use daily images and composite them by the method of Figure 2; we can extract the flooding time more accurately.
We processed the 8-day composite imagery from 2008 to 2024 based on this method, resulting in images that indicate potential rice flooding timings. We then compared these with the earliest detectable flooding times derived from daily imagery to assess their consistency. The eight-day composite method is widely used in many research studies, mainly because of its universality and robustness, and all of them have obtained good classification results. The results indicated that our extraction outcomes are entirely encompassed within the extraction range of the eight-day composite method, thereby affirming the accuracy and reliability of our findings. Furthermore, in comparison to previous studies, our research offers a more precise depiction of the flooding timing for paddy rice [20] (Table 1). It provides a basis for further study on flooding extraction of paddy fields in the future.

4.3. Impact of Advancing Rice Flooding Time

Firstly, Tair is influenced by factors such as climate conditions, seasonal variations, and atmospheric circulation, and it changes over time and location [55,56]. In contrast, LST is affected by factors such as sunlight duration, land cover, and soil texture [57]. These two temperatures are influenced by different factors. Global warming has a more direct impact on Tair, which in turn influences the evaporation rate of surface water and the transpiration of paddy rice [58]. Therefore, selecting an appropriate Tair is crucial to reduce water wastage and ensure the adequate growth and development of paddy rice [59]. On the other hand, the transplanting and growth of rice seedlings are closely related to LST, which directly affects root development and, consequently, the overall growth of the rice plants [20]. The purpose of this study is to investigate whether global warming, which leads to a rise in Tair, is contributing to flooding earlier in paddy fields. Additionally, this study examines the role of LST during flooding, as it can provide valuable insights into the rationality of early flooding. Tair and LST are significant to rice flooding and seedling growth, which is why we include both in our analysis.
In addition, the discussion of day and night temperatures separately stems from the distinct characteristics. Daytime, nighttime, or average temperatures alone are insufficient to determine that temperature is not the driver for earlier flooding. For instance, even if daytime temperatures decline yearly, nighttime temperatures may remain stable. Therefore, we considered both temperatures for a comprehensive temperature analysis.
Based on statistical analysis of the FFD and PFD in this study (Figure 4), the flooding time has been adapted in Sanjiang’s rice fields. The FFD has been advanced by approximately 0.4 days/yr, while the PFD has shifted forward by about 1.2 days/yr, which indicates that the PFD is approaching the FFD. Moreover, a clear decreasing trend has been observed in both daytime and nighttime Land Surface Temperature (LST) and Air Temperature (Tair) of PFD. The daytime LST has decreased by 0.44 °C/yr and nighttime LST by 0.27 °C/yr; similarly, daytime Tair has decreased by 0.32 °C/yr and nighttime Tair decreased by 0.46 °C/yr. The overly advanced flooding of the paddy fields in Sanjiang could generate a time gap between flooding and transplantation, leading to the waste of water [60]. On the other hand, advanced flooding may result in excessively low temperatures in the initial period of rice growth, reducing yields [26]. It is important to assess whether the advance of flooding time of Sanjiang, as one of China’s major high-latitude rice-producing regions, was appropriate for its grain production. In 2024, the nighttime LST of Sanjiang’s flooded rice fields was 4.9 °C, while the corresponding Tair was 3.2 °C. Previous efforts showed that a nighttime LST of 5 °C is generally suitable for rice transplantation [20]. Therefore, it can be concluded that the flooding timing of paddy fields in Sanjiang was generally appropriate for post-flooding rice transplantation. According to our findings, nighttime ground temperatures in 2018, 2019, 2021, 2022, and 2024 fell below the aforementioned threshold of 5 °C. This phenomenon may be related to improvements in the cold tolerance of rice seedlings. Rice breeders have successfully enhanced cold resistance by modifying multiple genetic loci through recent breeding efforts [61,62]. However, the abnormally low temperatures in 2019 still posed a risk of water wastage or frost damage to seedlings. Therefore, it is crucial to avoid excessively early flooding of the rice fields to mitigate these risks.
The results show a significant decrease in temperatures as flooding dates advance. It indicates that the advancement of flooding timing does not appear to be caused by rising temperatures. We analyzed the average temperature change during the potential flooding period (from 1 April to 31 May) for 17 years (Figure 8). The findings indicate that the average temperature in the Sanjiang Plain has only experienced minor fluctuations over the years and did not show a steady increase. Thus, we propose a new conclusion that is different from what we expected: rising temperatures are not the main driving factor for the earlier flooding timing.
Because of the Ministry of Agriculture and Rural Affairs’ continuous emphasis on the importance of early flooding in its annual rice production guidelines. This calls on farmers to seize the farming season and appropriately increase the growth time of paddy rice. Hence, farmers’ flooding behavior is also advanced. This change is reflected in the advance of FFD and PFD and the narrow difference between them. The improvement of rice’s cold-resistant genes guaranteed the rationality of advancing the flooding timing while the temperatures of daytime and nighttime are declining [61,62]. At the same time, it also supports the advance of FFD and PFD and the narrowing of their gap. The spread of the water-catching and controlled flooding technology of rice is also the main reason for advancing flooding time and narrowing the difference. Because it greatly improves the efficiency of agricultural irrigation and shortens the flooding timing [63]. The development of policies, science, and irrigation facilities has advanced the time of farmers’ flooding behavior to a certain extent, improved the irrigation efficiency, and ensured that the paddy rice seedlings can still grow normally when the temperature is decreased.

5. Conclusions

The Sanjiang Plain is an important high-latitude rice-producing area in China, and the rice phenology changed in the past 20 years. The initial flooding period of rice is of great importance for the whole growth. Too early flooding would waste water resources, while too late flooding would miss the optimum rice production period and affect the yield. Using daily MODIS data, along with the spectral-indices-based flooding signal mapping method and the GEE platform, we monitored the distribution of rice field flooding time from 2008 to 2024 in Sanjiang in China. The results showed that the FFD and PFD of rice fields both had a clear trend in advancement. Both Tair and LST of PFD had a significant negative correlation with years. Research indicates that global climate change may not be the primary driving factor for the earlier flooding of rice in the Sanjiang Plain. However, the current LST conditions of flooding can still ensure a smooth continuation of rice production processes. Policy requirements and technological advancements appear to have contributed to the earlier flooding of paddy fields, but the specific impact of these factors requires further research for a comprehensive and in-depth analysis. Compared with the previous studies, this study provides a long-term spatio-temporal pattern of flooding time with high temporal resolution. These findings are crucial for having a better understanding of the changes in crop planting timing and guiding the government and other departments to adapt the crop calendar effectively in the face of extreme climate events.

Author Contributions

Conceptualization, X.N. and H.L.; methodology, X.N., H.L. and R.L.; software, X.N.; validation, X.N. and R.L.; formal analysis, H.L.; investigation, X.N.; resources, X.N.; data curation, X.N. and R.L.; writing—original draft preparation, X.N. and H.L.; writing—review and editing, H.L. and R.L.; visualization, X.N. and R.L.; supervision, H.L.; project administration, H.L.; funding acquisition, H.L. All authors have read and agreed to the published version of the manuscript.

Funding

This research was funded by the Development Program of China (2021YFD1500100), the Strategic Priority Research Program of the Chinese Academy of Sciences (Grant No. XDA28070500), the Jilin Scientific and Technological Development Program (20220201158GX), and the Capital Construction Fund of Jilin Province (2021C045-2).

Data Availability Statement

The raw data supporting the conclusions of this article will be made available by the authors upon request.

Conflicts of Interest

The authors declare that the research was conducted in the absence of any commercial or financial relationships that could be construed as a potential conflict of interest.

References

  1. Normile, D. Reinventing Rice to Feed the World. Science 2008, 321, 330–333. [Google Scholar] [CrossRef] [PubMed]
  2. Elert, E. Rice by the Numbers: A Good Grain. Nature 2014, 514, S50–S51. [Google Scholar] [CrossRef] [PubMed]
  3. Samad, M.; Merrey, D.; Vermillion, D.; Fuchs-Carsch, M.; Mohtadullah, K.; Lenton, R. Irrigation Management Strategies for Improving the Performance of Irrigated Agriculture. Outlook Agric. 1992, 21, 279–286. [Google Scholar] [CrossRef]
  4. Tao, F.; Zhang, Z.; Shi, W.; Liu, Y.; Xiao, D.; Zhang, S.; Zhu, Z.; Wang, M.; Liu, F. Single Rice Growth Period Was Prolonged by Cultivars Shifts, but Yield Was Damaged by Climate Change during 1981–2009 in China, and Late Rice Was Just Opposite. Glob. Change Biol. 2013, 19, 3200–3209. [Google Scholar] [CrossRef] [PubMed]
  5. Belesky, P. Regional Governance, Food Security and Rice Reserves in East Asia. Glob. Food Secur. 2014, 3, 167–173. [Google Scholar] [CrossRef]
  6. Sarkar, D.; Kar, S.K.; Chattopadhyay, A.; Shikha; Rakshit, A.; Tripathi, V.K.; Dubey, P.K.; Abhilash, P.C. Low Input Sustainable Agriculture: A Viable Climate-Smart Option for Boosting Food Production in a Warming World. Ecol. Indic. 2020, 115, 106412. [Google Scholar] [CrossRef]
  7. Tilman, D.; Cassman, K.G.; Matson, P.A.; Naylor, R.; Polasky, S. Agricultural Sustainability and Intensive Production Practices. Nature 2002, 418, 671–677. [Google Scholar] [CrossRef]
  8. Yan, F.; Zhang, S.; Su, F. Variations in Ecosystem Services in Response to Paddy Expansion in the Sanjiang Plain, Northeast China. Int. J. Agric. Sustain. 2019, 17, 158–171. [Google Scholar] [CrossRef]
  9. Wang, W.; Peng, S.; Liu, H.; Tao, Y.; Huang, J.; Cui, K.; Nie, L. The Possibility of Replacing Puddled Transplanted Flooded Rice with Dry Seeded Rice in Central China: A Review. Field Crops Res. 2017, 214, 310–320. [Google Scholar] [CrossRef]
  10. Sudhir-Yadav; Evangelista, G.; Faronilo, J.; Humphreys, E.; Henry, A.; Fernandez, L. Establishment Method Effects on Crop Performance and Water Productivity of Irrigated Rice in the Tropics. Field Crops Res. 2014, 166, 112–127. [Google Scholar] [CrossRef]
  11. Kassam, A.; Stoop, W.; Uphoff, N. Review of SRI Modifications in Rice Crop and Water Management and Research Issues for Making Further Improvements in Agricultural and Water Productivity. Paddy Water Environ. 2011, 9, 163–180. [Google Scholar] [CrossRef]
  12. Dong, J.; Xiao, X.; Menarguez, M.A.; Zhang, G.; Qin, Y.; Thau, D.; Biradar, C.; Moore, B. Mapping Paddy Rice Planting Area in Northeastern Asia with Landsat 8 Images, Phenology-Based Algorithm and Google Earth Engine. Remote Sens. Environ. 2016, 185, 142–154. [Google Scholar] [CrossRef] [PubMed]
  13. Xiao, X.; Boles, S.; Frolking, S.; Salas, W.; Moore III, B.; Li, C.; He, L.; Zhao, R. Observation of Flooding and Rice Transplanting of Paddy Rice Fields at the Site to Landscape Scales in China Using VEGETATION Sensor Data. Int. J. Remote Sens. 2002, 23, 3009–3022. [Google Scholar] [CrossRef]
  14. Xiao, X.; Boles, S.; Frolking, S.; Salas, W.; Moore III, B.; Li, C.; He, L.; Zhao, R. Landscape-Scale Characterization of Cropland in China Using Vegetation and Landsat TM Images. Int. J. Remote Sens. 2002, 23, 3579–3594. [Google Scholar] [CrossRef]
  15. Xiao, X.; Boles, S.; Frolking, S.; Li, C.; Babu, J.Y.; Salas, W.; Moore, B. Mapping Paddy Rice Agriculture in South and Southeast Asia Using Multi-Temporal MODIS Images. Remote Sens. Environ. 2006, 100, 95–113. [Google Scholar] [CrossRef]
  16. Xiao, X.; Boles, S.; Liu, J.; Zhuang, D.; Frolking, S.; Li, C.; Salas, W.; Moore, B. Mapping Paddy Rice Agriculture in Southern China Using Multi-Temporal MODIS Images. Remote Sens. Environ. 2005, 95, 480–492. [Google Scholar] [CrossRef]
  17. Jeong, S.; Kang, S.; Jang, K.; Lee, H.; Hong, S.; Ko, D. Development of Variable Threshold Models for Detection of Irrigated Paddy Rice Fields and Irrigation Timing in Heterogeneous Land Cover. Agric. Water Manag. 2012, 115, 83–91. [Google Scholar] [CrossRef]
  18. Sun, H.; Huang, J.; Huete, A.R.; Peng, D.; Zhang, F. Mapping Paddy Rice with Multi-Date Moderate-Resolution Imaging Spectroradiometer (MODIS) Data in China. J. Zhejiang Univ. Sci. A 2009, 10, 1509–1522. [Google Scholar] [CrossRef]
  19. Peng, D.; Huete, A.R.; Huang, J.; Wang, F.; Sun, H. Detection and Estimation of Mixed Paddy Rice Cropping Patterns with MODIS Data. Int. J. Appl. Earth Obs. Geoinf. 2011, 13, 13–23. [Google Scholar] [CrossRef]
  20. Zhang, G.; Xiao, X.; Dong, J.; Kou, W.; Jin, C.; Qin, Y.; Zhou, Y.; Wang, J.; Menarguez, M.A.; Biradar, C. Mapping Paddy Rice Planting Areas through Time Series Analysis of MODIS Land Surface Temperature and Vegetation Index Data. ISPRS J. Photogramm. Remote Sens. 2015, 106, 157–171. [Google Scholar] [CrossRef]
  21. Ni, R.; Tian, J.; Li, X.; Yin, D.; Li, J.; Gong, H.; Zhang, J.; Zhu, L.; Wu, D. An Enhanced Pixel-Based Phenological Feature for Accurate Paddy Rice Mapping with Sentinel-2 Imagery in Google Earth Engine. ISPRS J. Photogramm. Remote Sens. 2021, 178, 282–296. [Google Scholar] [CrossRef]
  22. FAOSTAT. Statistical Database of the Food and Agricultural Organization of the United Nations. 2018. Available online: https://www.fao.org (accessed on 1 November 2024).
  23. Li, X.; Chen, D.; Cao, X.; Luo, Z.; Webber, M. Assessing the Components of, and Factors Influencing, Paddy Rice Water Footprint in China. Agric. Water Manag. 2020, 229, 105939. [Google Scholar] [CrossRef]
  24. Liu, Z.; Li, Z.; Tang, P.; Li, Z.; Wu, W.; Yang, P.; You, L.; Tang, H. Change Analysis of Rice Area and Production in China during the Past Three Decades. J. Geogr. Sci. 2013, 23, 1005–1018. [Google Scholar] [CrossRef]
  25. Wang, X.; Li, T.; Yang, X.; Zhang, T.; Liu, Z.; Guo, E.; Liu, Z.; Qu, H.; Chen, X.; Wang, L.; et al. Rice Yield Potential, Gaps and Constraints during the Past Three Decades in a Climate-Changing Northeast China. Agric. For. Meteorol. 2018, 259, 173–183. [Google Scholar] [CrossRef]
  26. Kim, D.-H.; Jang, T.; Hwang, S.; Jeong, H. Paddy Rice Adaptation Strategies to Climate Change: Transplanting Date Shift and BMP Applications. Agric. Water Manag. 2021, 252, 106926. [Google Scholar] [CrossRef]
  27. Ding, Y.; Wang, W.; Zhuang, Q.; Luo, Y. Adaptation of Paddy Rice in China to Climate Change: The Effects of Shifting Sowing Date on Yield and Irrigation Water Requirement. Agric. Water Manag. 2020, 228, 105890. [Google Scholar] [CrossRef]
  28. Yang, C.-Y.; Yang, M.-D.; Tseng, W.-C.; Hsu, Y.-C.; Li, G.-S.; Lai, M.-H.; Wu, D.-H.; Lu, H.-Y. Assessment of Rice Developmental Stage Using Time Series UAV Imagery for Variable Irrigation Management. Sensors 2020, 20, 5354. [Google Scholar] [CrossRef]
  29. Liu, L.; Ouyang, W.; Liu, H.; Zhu, J.; Ma, Y.; Wu, Q.; Chen, J.; Zhang, D. Potential of Paddy Drainage Optimization to Water and Food Security in China. Resour. Conserv. Recycl. 2021, 171, 105624. [Google Scholar] [CrossRef]
  30. Du, G.; Zhang, Y.; Li, Q. The evolution path of crop structure in the Sanjiang Plain in the 21st century. Res. Agric. Mod. 2019, 40, 736–744. [Google Scholar]
  31. Robinson, A.; Lehmann, J.; Barriopedro, D.; Rahmstorf, S.; Coumou, D. Increasing Heat and Rainfall Extremes Now Far Outside the Historical Climate. NPJ Clim. Atmos. Sci. 2021, 4, 45. [Google Scholar] [CrossRef]
  32. Yu, Y.; You, Q.; Zuo, Z.; Zhang, Y.; Cai, Z.; Li, W.; Jiang, Z.; Ullah, S.; Tang, X.; Zhang, R.; et al. Compound Climate Extremes in China: Trends, Causes, and Projections. Atmos. Res. 2023, 286, 106675. [Google Scholar] [CrossRef]
  33. You, N.; Dong, J.; Huang, J.; Du, G.; Zhang, G.; He, Y.; Yang, T.; Di, Y.; Xiao, X. The 10-m Crop Type Maps in Northeast China during 2017–2019. Sci. Data 2021, 8, 41. [Google Scholar] [CrossRef] [PubMed]
  34. Pekel, J.-F.; Cottam, A.; Gorelick, N.; Belward, A.S. High-Resolution Mapping of Global Surface Water and Its Long-Term Changes. Nature 2016, 540, 418–422. [Google Scholar] [CrossRef] [PubMed]
  35. Twedt, K.A.; Henderson, S.; Xiong, X.; Angal, A.; Geng, X. Nonlinear Detector Response of Aqua MODIS Land Imaging Bands. IEEE Trans. Geosci. Remote Sens. 2022, 60, 1–10. [Google Scholar] [CrossRef]
  36. Zhang, H.; Dong, X.; Xi, B.; Xin, X.; Liu, Q.; He, H.; Xie, X.; Li, L.; Yu, S. Retrieving High-Resolution Surface Photosynthetically Active Radiation from the MODIS and GOES-16 ABI Data. Remote Sens. Environ. 2021, 260, 112436. [Google Scholar] [CrossRef]
  37. Pan, Y.; Chen, J.; Chen, F.; Xiang, G.; Luo, D.; Sun, L.; Hong, J.; Shu, S. Ocean Water Colour Retrieval Method Based on Directional Polarimetric Camera. Int. J. Remote Sens. 2024, 45, 5175–5191. [Google Scholar] [CrossRef]
  38. Yang, M.; Zhao, W.; Zhan, Q.; Xiong, D. Spatiotemporal Patterns of Land Surface Temperature Change in the Tibetan Plateau Based on MODIS/Terra Daily Product From 2000 to 2018. IEEE J. Sel. Top. Appl. Earth Obs. Remote Sens. 2021, 14, 6501–6514. [Google Scholar] [CrossRef]
  39. Rauf, U.; Qureshi, W.S.; Jabbar, H.; Zeb, A.; Mirza, A.; Alanazi, E.; Khan, U.S.; Rashid, N. A New Method for Pixel Classification for Rice Variety Identification Using Spectral and Time Series Data from Sentinel-2 Satellite Imagery. Comput. Electron. Agric. 2022, 193, 106731. [Google Scholar] [CrossRef]
  40. Xiao, D.; Niu, H.; Guo, F.; Zhao, S.; Fan, L. Monitoring Irrigation Dynamics in Paddy Fields Using Spatiotemporal Fusion of Sentinel-2 and MODIS. Agric. Water Manag. 2022, 263, 107409. [Google Scholar] [CrossRef]
  41. Wang, Q.; Tenhunen, J.; Dinh, N.Q.; Reichstein, M.; Vesala, T.; Keronen, P. Similarities in Ground- and Satellite-Based NDVI Time Series and Their Relationship to Physiological Activity of a Scots Pine Forest in Finland. Remote Sens. Environ. 2004, 93, 225–237. [Google Scholar] [CrossRef]
  42. Huete, A.R.; Didan, K.; Shimabukuro, Y.E.; Ratana, P.; Saleska, S.R.; Hutyra, L.R.; Yang, W.; Nemani, R.R.; Myneni, R. Amazon Rainforests Green-up with Sunlight in Dry Season. Geophys. Res. Lett. 2006, 33. [Google Scholar] [CrossRef]
  43. Jiang, Z.; Huete, A.; Didan, K.; Miura, T. Development of a Two-Band Enhanced Vegetation Index without a Blue Band. Remote Sens. Environ. 2008, 112, 3833–3845. [Google Scholar] [CrossRef]
  44. Hall, D.K.; Riggs, G.A.; Salomonson, V.V. Development of Methods for Mapping Global Snow Cover Using Moderate Resolution Imaging Spectroradiometer Data. Remote Sens. Environ. 1995, 54, 127–140. [Google Scholar] [CrossRef]
  45. Potapov, P.; Turubanova, S.; Hansen, M.C.; Tyukavina, A.; Zalles, V.; Khan, A.; Song, X.-P.; Pickens, A.; Shen, Q.; Cortez, J. Global Maps of Cropland Extent and Change Show Accelerated Cropland Expansion in the Twenty-First Century. Nat. Food 2021, 3, 19–28. [Google Scholar] [CrossRef]
  46. Gong, P.; Niu, Z.; Cheng, X.; Guo, J.; Liang, L. China’s Wetland Change (1990–2000) Determined by Remote Sensing | Science China Earth Sciences. Sci. China Earth Sci. 2010, 53, 1036–1042. [Google Scholar] [CrossRef]
  47. Wang, Z.; Song, K.; Ma, W.; Ren, C.; Zhang, B.; Liu, D.; Chen, J.M.; Song, C. Loss and Fragmentation of Marshes in the Sanjiang Plain, Northeast China, 1954–2005. Wetlands 2011, 31, 945–954. [Google Scholar] [CrossRef]
  48. Mao, D.; Wang, Z.; Du, B.; Li, L.; Tian, Y.; Jia, M.; Zeng, Y.; Song, K.; Jiang, M.; Wang, Y. National Wetland Mapping in China: A New Product Resulting from Object-Based and Hierarchical Classification of Landsat 8 OLI Images. ISPRS J. Photogramm. Remote Sens. 2020, 164, 11–25. [Google Scholar] [CrossRef]
  49. Hutchinson, M.F. The Application of Thin Plate Smoothing Splines to Continent-Wide Data Assimilation. Bur. Meteorol. Res. Rep. 1991, 27, 104–113. [Google Scholar]
  50. Dong, T.; Liu, J.; Qian, B.; Zhao, T.; Jing, Q. Estimating Winter Wheat Biomass by Assimilating Leaf Area Index Derived from Fusion of Landsat-8 and MODIS Data. Int. J. Appl. Earth Obs. Geoinf. 2016, 49, 63–74. [Google Scholar] [CrossRef]
  51. Zhao, Z.; Dong, J.; Zhang, G.; Yang, J.; Liu, R.; Wu, B.; Xiao, X. Improved Phenology-Based Rice Mapping Algorithm by Integrating Optical and Radar Data. Remote Sens. Environ. 2024, 315, 114460. [Google Scholar] [CrossRef]
  52. Ticehurst, C.; Guerschman, J.P.; Chen, Y. The Strengths and Limitations in Using the Daily MODIS Open Water Likelihood Algorithm for Identifying Flood Events. Remote Sens. 2014, 6, 11791–11809. [Google Scholar] [CrossRef]
  53. Ines, A.V.M.; Honda, K. On Quantifying Agricultural and Water Management Practices from Low Spatial Resolution RS Data Using Genetic Algorithms: A Numerical Study for Mixed-Pixel Environment. Adv. Water Resour. 2005, 28, 856–870. [Google Scholar] [CrossRef]
  54. Marchenko, V. Observability of Hybrid Discrete-Continuous Systems. Differ. Equ. 2013, 49, 1389–1404. [Google Scholar] [CrossRef]
  55. Smith, D.M.; Screen, J.A.; Deser, C.; Cohen, J.; Fyfe, J.C.; García-Serrano, J.; Jung, T.; Kattsov, V.; Matei, D.; Msadek, R.; et al. The Polar Amplification Model Intercomparison Project (PAMIP) Contribution to CMIP6: Investigating the Causes and Consequences of Polar Amplification. Geosci. Model Dev. 2019, 12, 1139–1164. [Google Scholar] [CrossRef]
  56. Bolan, S.; Padhye, L.P.; Jasemizad, T.; Govarthanan, M.; Karmegam, N.; Wijesekara, H.; Amarasiri, D.; Hou, D.; Zhou, P.; Biswal, B.K.; et al. Impacts of Climate Change on the Fate of Contaminants through Extreme Weather Events. Sci. Total Environ. 2024, 909, 168388. [Google Scholar] [CrossRef]
  57. Zhang, Q.; Guan, Y.; Wu, X.; Zhang, J.; Li, R.; Lin, K.; Wang, Y. Revealing the Dynamic Effects of Land Cover Change on Land Surface Temperature in Global Major Bay Areas. Build. Environ. 2025, 267, 112266. [Google Scholar] [CrossRef]
  58. Guan, X.; Liu, C.; Zhang, J.; Wang, G.; Bao, Z.; Jin, J. On the Attribution of Changing Water Surface Evaporation across China. J. Hydrol. Reg. Stud. 2022, 40, 100991. [Google Scholar] [CrossRef]
  59. Arnell, N.W.; Lowe, J.A.; Challinor, A.J.; Osborn, T.J. Global and Regional Impacts of Climate Change at Different Levels of Global Temperature Increase. Clim. Change 2019, 155, 377–391. [Google Scholar] [CrossRef]
  60. Lee, J.; Shin, H.; Han, J. Assessing Irrigation Efficiency Improvements in Paddy Fields Using Granular SWMM Simulations. Agronomy 2024, 14, 2384. [Google Scholar] [CrossRef]
  61. Gu, S.; Zhuang, J.; Zhang, Z.; Chen, W.; Xu, H.; Zhao, M.; Ma, D. Multi-Omics Approach Reveals the Contribution of OsSEH1 to Rice Cold Tolerance. Front. Plant Sci. 2023, 13, 1110724. [Google Scholar] [CrossRef]
  62. Shahzad, N.; Nabi, H.G.; Qiao, L.; Li, W. The Molecular Mechanism of Cold-Stress Tolerance: Cold Responsive Genes and Their Mechanisms in Rice (Oryza sativa L.). Biology 2024, 13, 442. [Google Scholar] [CrossRef] [PubMed]
  63. Guo, X.; Yuan, J.; Guo, F.; Chen, Z. Preliminary Study on Water-Catching and Controlled Irrigation Technology of Rice. Trans. Chin. Soc. Agric. Eng. 2009, 25, 70–73. [Google Scholar]
Figure 1. Location of the Sanjiang Plain. The rice data were from You et al. (2021) [33]. DEM data were from SRTM. Water data were from Pekel et al. (2016) [34].
Remotesensing 16 04683 g001
Figure 2. Method for composite daily flooding images in potential flooding periods, and the definitions of FFD and PFD. Different pixel colors correspond to different DoY.
Remotesensing 16 04683 g002
Figure 3. The spatio-temporal distribution of paddy rice flooding time (FFD and PFD) in Sanjiang from 2008 to 2024. The insert numbers of each subfigure mean the different years from 2008 to 2024.
Remotesensing 16 04683 g003
Figure 4. Changes in paddy fields’ FFD and PFD year by year. (a) Broken line of FFD; (b) linear fit of FFD; (c) broken line of PFD; and (d) linear fit of PFD.
Remotesensing 16 04683 g004
Figure 5. PFD’s LST changes year by year. (a) PFD’s LST at 13:30. (b) PFD’s LST at 01:30 the next day.
Remotesensing 16 04683 g005
Figure 6. PFD’s Tair changes year by year. (a) PFD’s Tair at 14:00. (b) PFD’s Tair at 02:00 the next day.
Remotesensing 16 04683 g006
Figure 7. The differences between FFD and PFD year by year. (a) Broken line of the difference. (b) Linear fit of the difference.
Remotesensing 16 04683 g007
Figure 8. Average temperature from 1 April to 31 May of the Sanjiang Plain in 2008–2024.
Remotesensing 16 04683 g008
Table 1. Comparison of daily and previous 8-day composite methods for extracting the first flooding signal.
YearDaily8-Day Composite
2008118115–122
2009119115–122
2010122115–122
2011118107–114
2012120115–122
2013117115–122
2014115107–114
2015114115–122
2016115115–122
2017114107–114
2018113107–114
2019112107–114
2020115115–122
2021112107–114
2022113107–114
2023112107–114
2024110107–114
Disclaimer/Publisher’s Note: The statements, opinions and data contained in all publications are solely those of the individual author(s) and contributor(s) and not of MDPI and/or the editor(s). MDPI and/or the editor(s) disclaim responsibility for any injury to people or property resulting from any ideas, methods, instructions or products referred to in the content.

