Abstract
The eastern segment of the Sunan-Qilian Fault (ES-SQF) is located within the seismic gap between the 1927 M8.0 Gulang earthquake and the 1932 M7.6 Changma earthquake in China. It also aligns with the extension direction of the largest surface rupture zone associated with the 2022 Mw6.7 Menyuan earthquake. Understanding the activity parameters of this fault is essential for interpreting strain distribution patterns in the central–western segment of the Qilian–Haiyuan fault zone, located along the northeastern margin of the Tibetan Plateau, and for evaluating the seismic hazards in the region. High-resolution Google Earth satellite imagery and UAV (Unmanned Aerial Vehicle)-based photogrammetry provide favorable conditions for detailed mapping and the study of typical landforms along the ES-SQF. Combined with field geological surveys, the ES-SQF is identified as a continuous, singular-fault structure extending approximately 68 km in length. The fault trends in the WNW direction and along its trace, distinctive features, such as ridges, gullies, and terraces, show clear evidence of synchronous left lateral displacement. This study investigates the Qingsha River and the Dongzhong River. High-resolution digital elevation models (DEMs) derived from UAV imagery were used to conduct a detailed mapping of faulted landforms. An analysis of stripping trench profiles and radiocarbon dating of collected samples indicates that the most recent surface-rupturing seismic event in the area occurred between 3500 and 2328 y BP, pointing to the existence of an active fault from the Holocene epoch. Using the LaDiCaoz program to restore and measure displaced terraces at the study site, combined with geomorphological sample collection and testing, we estimated the fault’s slip rate since the Holocene to be approximately 2.0 ± 0.3 mm/y. Therefore, the ES-SQF plays a critical role in strain distribution across the central–western segment of the Qilian–Haiyuan fault zone. Together with the Tuolaishan fault, it accommodates and dissipates the left lateral shear deformation in this region. Based on the slip rate and the elapsed time since the last event, it is estimated that a seismic moment equivalent to Mw 7.5 has been accumulated on the ES-SQF. Additionally, with the significant Coulomb stress loading on the ES-SQF caused by the 2016 Mw 5.9 and 2022 Mw 6.7 Menyuan earthquakes, there is a potential for large earthquakes to occur in the future. Our results also indicate that high-resolution remote sensing imagery can facilitate detailed studies of active tectonics.
1. Introduction
The northeastern margin of the Tibetan Plateau is a region characterized by intense mutual compression along three major geological blocks: the Tibetan Plateau, the Gobi-Alashan block, and the Ordos block. This area exhibits significant tectonic deformation and seismic activity. Since the Late Quaternary period, it has been primarily divided into two structural features: the left lateral shear along the Qilian–Haiyuan fault (QHF) and the shortening and thickening associated with the Qilian Mountain thrust fault zone [1,2,3,4,5]. The QHF is an important boundary fault and a historically strong earthquake zone in this region. Between 1900 and 1932, three earthquakes with magnitudes greater than 7.5 occurred, namely, the 1920 M8.5 Haiyuan earthquake, the 1927 M8.0 Gulang earthquake, and the 1932 M7.6 Changma earthquake [6] (Figure 1). Previous researchers have proposed the existence of a “Tianzhu seismic gap” between the Haiyuan earthquake and the Gulang earthquake [7]. Similarly, between the Gulang earthquake and the Changma earthquake, there is a seismic gap of about 300 km (referred to as the “Tuolaishan seismic gap”), which mainly includes the Tuolaishan fault and the SunanQilian fault [8,9,10] (Figure 1). Additionally, there is a lack of historical records of strong earthquakes in the surrounding area [6], indicating a high seismic hazard.
Previous researchers, based on studies of the slip rate along the QHF, have established a movement transition model for the major strike-slip faults along the northeastern boundary of the Tibetan Plateau. The low slip rates at both the eastern and western ends of the QHF are closely related to compressional deformation [11,12,13,14]. At the eastern end, the left lateral strike-slip motion of the fault zone is primarily absorbed by the deformation of the Longxi basin and the uplift of Liupan mountain. At the western segment, the left lateral strike-slip motion from the Altyn Tagh fault is mainly absorbed by crustal shortening caused by the uplift within the Qilian Mountains and the deformation of the Cenozoic basins on both sides. In the central section, however, the dominant feature is a continuous strike-slip motion [11,12,13,14]. However, previous studies on the QHF have primarily focused on the central and eastern sections, specifically east of the Lenglongling fault. In contrast, the western section has mostly been studied at discrete research points. At the same time, the westward extension of the Lenglongling fault is unclear. For instance, research by the Institute of Geology and Lanzhou Institute of Seismology (1993) suggested that the QHF extends westward, passing through the Lenglongling fault and the Sunan–Qilian fault, eventually connecting with the Changma fault [15]. The latest tectonic map of China marks the entire Tuolaishan fault as the westward extension of the Lenglongling fault [9]. Another perspective is that it extends to the eastern segment of the Tuolaishan fault, terminating at the Halahu fault [11,14,16]. However, all three perspectives agree that the Lenglongling fault extends westward to the eastern segment of the Sunan–Qilian Fault (ES-SQF) and the eastern segment of the Tuolaishan fault (Figure 1). Nevertheless, due to high altitude, sparse human activity, and poor transportation, there has been limited research on the Sunan–Qilian fault, resulting in a lack of understanding of its geometric characteristics, activity, and deformation features. Additionally, the previously established movement transition models did not consider the role of the slip rate of the Sunan–Qilian fault in the strain distribution. Meanwhile, two Mengyuan earthquakes, 2016 Mw 5.9 and 2022 Mw 6.7, occurred on the eastern side of the ES-SQF. The eastern end is located within the intensity zones of VI for the 2016 earthquake and IX for the 2022 earthquake [17,18]. The fault orientation aligns closely with the long axis (WNW) of the isoseismal lines for both earthquakes and is also in the direction of the larger surface rupture zone generated by the 2022 Mengyuan earthquake (in terms of length and displacement) [17] (Figure 1). This further emphasizes the urgency of studying the seismic potential of the ES-SQF.
Based on the above analysis, we propose the following scientific questions: What are the latest activity period and kinematic characteristics of the ES-SQF? Does it participate in the strain distribution of the central–western segment of the QHF? Moreover, did the 2016 Mw5.9 and 2022 Mw6.7 Menyuan earthquakes load this fault? Answering these questions will help in understanding the strain distribution model of the QHF, assessing the seismic hazard in the region, and constraining the dynamic mechanisms of tectonic deformation on the northeastern margin of the Tibetan Plateau [19,20]. To this end, this study, based on the interpretation of remote sensing images and field geomorphological investigations of the ES-SQF, presents geological and geomorphological evidence of Holocene activity along the eastern segment of the fault. This is performed through trench profiles and preliminary dating sample tests. Using geological methods, we calculated the Holocene left lateral strike-slip rate of this fault. These preliminary findings provide valuable geological data that can be referenced to assess the future seismic hazard of the ES-SQF and better understand the seismic potential of the “Tuolaishan seismic gap”.
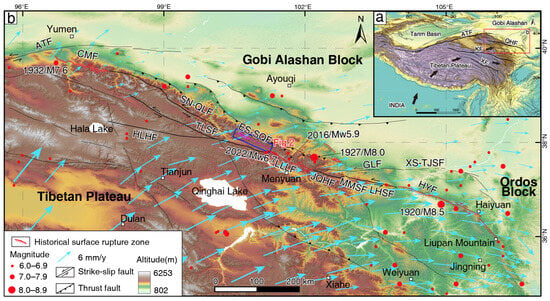
Figure 1.
The distribution of the major active faults and earthquake epicenters (M ≥ 6.0) along the northeastern margin of the Tibetan Plateau. (a) The red box indicates the area shown in panel (b), while the black arrows indicate the direction of block movement. Abbreviations: ATF, Altyn Tagh fault; KF, Kunlun fault; QHF, Qilian-Haiyuan fault; XF, Xianshuihe fault. (b) The locations and characteristics of the faults are based on [9]. The seismic data are sourced from the China Earthquake Information Network (https://news.ceic.ac.cn/index.html?time=1698442872, accessed on 3 October 2024), while the GPS velocity field relative to the stable Eurasian continent is derived from [21]. Abbreviations: ATF, Altyn Tagh fault; CMF, Changma fault; TLSF, Tuolaishan fault; HLHF, Halahu fault; SN-QLF, Sunan-Qilian fault; ES-SQF, Eastern segment of the Sunan–Qilian Fault; LLLF, Lenglongling fault; JQHF, Jinqianghe fault; MMSF, Maomaoshan fault; LHSF, Laohushan fault; HYF, Haiyuan fault; GLF, Gulang fault; XS-TJSF, Xiangshan-Tianjingshan fault.
2. Seismotectonic Setting
2.1. Qilian–Haiyuan Fault
The QHF is one of the main tectonic structures along the northern margin of the Tibetan Plateau, extending approximately 1000 km from Hala Lake in the west to Liupan Mountain in the east. From west to east, it mainly consists of the Tuolaishan, Lenglongling, Jinqianghe, Maomaoshan, Laohushan, and Haiyuan faults and is a historically strong earthquake zone [7]. Multiple earthquakes with magnitudes greater than 6.0 have occurred along this fault zone, causing a significant loss of life. For example, the 1920 M8.5 Haiyuan earthquake generated a surface rupture zone of about 220 km along the Haiyuan fault, with a maximum coseismic displacement of 10.2 m and an average of 8 m, resulting in 220,000 deaths [22]. The 1927 M8.0 Gulang earthquake ruptured the Lenglongling fault, creating a surface rupture of about 120 km, with a maximum coseismic displacement of 7.5 ± 0.8 m and an average displacement of 4.8 m [23]. The 1932 M7.6 Changma earthquake produced a surface rupture zone of about 120 km along the Changma fault [24]. The 1986 Ms 6.4 Menyuan earthquake and the 2016 Ms 6.4 Menyuan earthquake occurred on the northern side of the Lenglongling fault, both without generating surface rupture [18]. The 2022 Mw6.7 Menyuan earthquake occurred at the step-over between the Lenglongling and Tuolaishan faults, producing surface rupture zones of about 22–23 km along the Lenglongling fault and about 4 km along the Tuolaishan fault [10,17,25].
Currently, there are two deformation models for the QHF: a west-to-east decreasing model [7,26,27], and the other suggests that deformation is greatest along the Lenglongling fault and decreases gradually toward the adjacent faults [11,14,16,28,29]. This discrepancy mainly arises from earlier studies focusing on individual research points or being constrained by dating methods that may have overestimated slip rates [7]. In recent years, geological studies have shown that the slip rates of the QHF are not as high as previously thought. For example, the slip rates of the western and eastern segments of the Tuolaishan fault are 1.0 ± 0.2 mm/y and ~3–4 mm/y, respectively [30]. The Lenglongling fault has a slip rate of 6.0–6.6 mm/y [31,32,33], the Jinqianghe fault has a rate of 4.8–8.3 mm/y [34,35], the Maomaoshan fault has a rate of 3–4 mm/y [35,36], the Laohushan fault has a rate of 4.4–4.8 mm/y [28,37], and the Haiyuan fault has a slip rate of 4.5 mm/y [38]. Therefore, it is generally believed that the second model is more reasonable [28], and geodetic results from GPS and InSAR rates also support the second model [14,16].
2.2. Sunan–Qilian Fault
The Sunan–Qilian fault is part of the western segment of the active fault system in the Northern Qilian Mountains, located north of the Tuolaishan fault. Its western end connects with the Changma fault, starting west of the Hongshuiba River, and its eastern end terminates north of the Liuhuang River, where it obliquely intersects with the Lenglongling fault. The total length is approximately 360 km [9] (Figure 1), exhibiting distinct segmental activity characteristics [8,10]. Based on the geometric characteristics of discontinuities, the Sunan–Qilian fault can be divided into three segments: western, central, and eastern. The western segment shows relatively weak activity, primarily active during the Late Pleistocene [10]. The central segment is a Holocene active fault, approximately 100 km long, with a wavy distribution and a general WNW direction. Along the fault, left lateral displacements are observed in gullies, ridges, and terraces, and in some sections, there are fresh fault scarps [8]. The Holocene horizontal slip rate is 5 mm/y, and trench excavations have revealed three seismic events since the Late Holocene, occurring at approximately 2200 y BP, 1680 y BP, and 220 y BP, with a recurrence interval of 500–1000 years [8]. The eastern segment is about 68 km long and was initially considered a Late Pleistocene fault. Due to the high elevation and difficult access in this area, no quantitative data on the slip rate or elapsed time of this segment have been reported [9,39].
3. Data and Methods
3.1. Detailed Mapping of the ES-SQF
By interpreting high-resolution satellite imagery (Google Earth) and conducting field investigations, we identified features such as linear fault scarps, fault valleys, and fault escarpments, as well as left-lateral displacements of ridges, gullies, and alluvial terraces, to map the fault trace of the ES-SQF. Additionally, we selected Qingsha River and Dangzhong River sites along the fault as study areas, where well-preserved offset terraces were observed. These sites were subjected to detailed measurements using UAV (Unmanned Aerial Vehicle)-based photogrammetry.
UAV-based photogrammetry technology, widely applied in various fields of geosciences application [40] such as structural geology [41] and rockfall slope analysis [42], enables the acquisition of images that facilitate the creation of point clouds, meshes, textures, and high-resolution 2D orthomosaics. Additionally, it can generate digital elevation models (DEMs) and 3D digital outcrop models with resolutions ranging from sub-meter to sub-decimeter scale. This provides a new method for studying the detailed geometric structure of faults and measuring displacements in faulted micro-landforms [43]. The UAV platform used (model: DJI Phantom 4 RTK. The manufacturer is DJI Innovations, Shenzhen, China, purchased in Beijing, China) is equipped with a 20-megapixel image sensor and collected photos with 70% forward overlap and 70% lateral overlap, ensuring common features between adjacent images, with a flight altitude of 100–150 m. The data collection strip width was approximately 1.0 km, covering 300–800 m on both sides of the target fault, ensuring a comprehensive representation of the study sites and their surrounding geomorphic features. Subsequently, we used Agisoft PhotoScan software (v1.2.5) for image processing, generating orthophotos with a resolution of 0.04–0.08 m and DEMs with a resolution of 0.24–0.30 m. Using ESRI ArcGIS software (10.8), we integrated 2D and 3D terrain data for comprehensive analysis, combined with field investigations for large-scale mapping, interpreted the surface fault traces, and systematically measured the displacement of linear offset landforms.
3.2. Constraining the Latest Activity Timing of the Fault
At the Qingsha River and Dangzhong River sites along the ES-SQF, two trench profiles were excavated across the fault (Figure 2; Figure 3). High-resolution photographs of the trenches were taken using a digital camera with interchangeable lenses to perform structural motion photogrammetry. Agisoft Photoscan software (v1.2.5) [44] was used to create photomosaics, which were printed for detailed field recording. Finally, the images were vectorized using Adobe Illustrator drawing software (2021) in the laboratory.
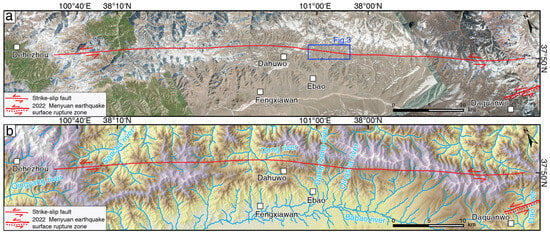
Figure 2.
The distribution map of the eastern segment of the Sunan–Qilian Fault. (a) A fault distribution map, with the fault trace based on [9], primarily interpreted using high-resolution remote sensing images (Google Earth, 0.4 m resolution). (b) Geomorphic features along and on both sides of the fault.
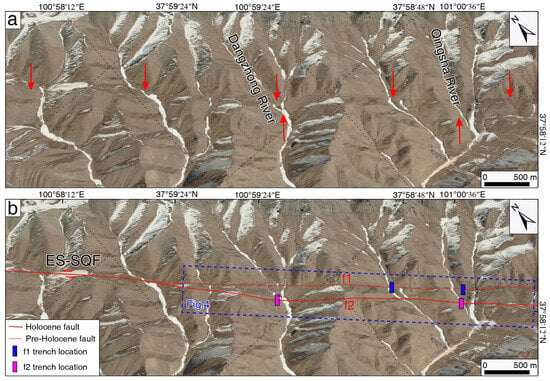
Figure 3.
The faulted geomorphic features north of Ebao town (base map: Google Earth 2024 image). (a) Google Earth imagery; (b) fault trace with Google Earth imagery as the base map.
The upward termination of faults is highly effective in identifying the most recent seismic event, as subsequent ruptures typically follow pre-existing fault planes [44,45]. Therefore, we used the upward termination of faults to identify the most recent event. The terminating layer of the fault rupture and the overlying strata provide upper and lower bounds for the timing of the latest seismic event. Meanwhile, radiocarbon dating of charcoal or blocky carbonaceous organic matter was employed to constrain the ages of strata before and after the seismic event, thereby determining the elapsed time and the latest activity period of the fault.
3.3. Determination of Fault Slip Rate
3.3.1. Measurement of Horizontal Displacement
Two methods were primarily used for measuring the horizontal displacement of geomorphic markers such as ridges, terrace risers, and gullies along the ES-SQF: (1) For the detected displacement markers in high-resolution orthophotos, displacement measurements were restored using high-resolution orthophotos and terrain shadows in ESRI ArcGIS software (10.8). (2) To obtain more accurate terrace riser displacement measurements, we used the LaDiCaoz software (V2.1) developed by the authors of [46,47] based on Matlab programming. We imported high-resolution DEM data into LaDiCaoz software (V2.1) and overlayed terrain shadow maps with contour lines. By interpreting high-resolution UAV orthophotos and combining field surveys to identify fault traces, we restored the original topography to obtain terrace riser displacement and verify the validity of the results measured in ESRI ArcGIS software (10.8).
3.3.2. Selection of Layered Geomorphic Surfaces and Abandonment Age Constraints
Determining the horizontal slip rate of a fault requires two measurements: the amount of displacement and the time over which this displacement occurred. During the calculation, differing views exist regarding the initiation time of cumulative displacement at the terrace risers due to the inability to quantitatively characterize the extent of erosion caused by the flowing water [48,49]. Based on the evolutionary patterns of river terraces and their response to slip-along faults, the “Upper-terrace reconstruction” and the “Lower-terrace reconstruction” concepts have been proposed to define the initiation time of cumulative displacement at terrace risers. It is further proposed to use the upper or lower terraces to represent the starting time of displacement accumulation. Based on the development of geomorphic surfaces at the Qingsha River and Dangzhong River study sites, we selected appropriate terraces for cleaning and excavating profiles. High-resolution photographs were taken using a digital camera, printed for detailed field interpretation, and later vectorized using Adobe Illustrator drafting software (2021). Radiocarbon dating of charcoal or bulk carbonaceous organic material collected from different stratigraphic layers in the profiles was employed to determine the age of the strata, thereby constraining the abandonment age of the terraces.
3.4. Seismic Stress Triggering Theory and Calculation Procedures
The seismic stress triggering theory suggests that after an earthquake, the stress accumulated on a fault does not completely dissipate. Instead, part of the stress is transferred to surrounding faults, influencing the Coulomb stress changes in nearby faults. This theoretical model is based on the Coulomb failure criterion, which introduces the concept of Coulomb stress changes to characterize regional stress variations [50]. Based on the above failure criterion, the Coulomb stress instability function on the rupture surface is defined as follows:
ΔCFS = Δτ + μ′Δσn
ΔCFS represents the Coulomb failure stress change, and the value of μ′ depends on factors such as the regional thermal state, fluid observations, and fault size. It is generally set to 0.4 [50]. The ΔCFS at the middle section of the fault is used to characterize the effect of the source fault [51]. When ΔCFS > 0, the stress change exerts a loading effect on the surrounding faults. Conversely, when ΔCFS < 0, the fault may experience an unloading effect.
This study uses the Coulomb stress change formula proposed by [50] and related developed algorithms. The Coulomb3.4 program [52,53] was employed to calculate the impact of the 2022 Menyuan earthquake on the ES-SQF and to analyze potential triggering effects through stress change images. Based on the finite fault model of the 2022 Menyuan earthquake provided by the USGS (https://earthquake.usgs.gov/earthquakes/eventpage/us7000g9zq/executive, accessed on 10 October 2024), and using field-measured fault geometry from the latest seismic event as the receiving fault parameters, we calculated the Coulomb stress change on the ES-SQF caused by the 2022 Menyuan earthquake.
4. Geological and Topographical Characteristics and Slip Rates
The ES-SQF is approximately 68 km long, with clear linear features in remote sensing images. It generally trends WNW, beginning west of Qingyang River and extending eastward along the Northern Qilian Mountains, passing through the Sancha River and Dong River, reaching the Dahu and Ebao town northern regions. It continues eastward through the Dangzhong River Qingsha River and terminates near the Daquanwo area close to the Dao River [9] (Figure 2). This ES-SQF is located in a remote area with minimal human modification, preserving the fault trace well. Linear fault troughs have developed along the segment, with synchronous left lateral displacements observed in ridges, gullies, and terraces on both sides. It manifests as a single, continuous structure with a consistent geometric pattern (Figure 2).
On the northern side of Ebao town, in the central part of the ES-SQF, two prominent linear geomorphic features can be observed, spaced 200–300 m apart. These gullies, along with the terraces on both sides and the ridges flanking the gullies, all show varying degrees of left lateral displacement where they cross the fault (Figure 3). We conducted field geological investigations along the linear features and excavated or cleaned two trench profiles on both lines. At the northern f1 feature, two trenches with depths of 2–3 m were excavated in loose deposits; the underlying bedrock also does not reveal the fault trace, indicating no fault activity since the Late Quaternary (the two blue trenches in Figure 3b). In contrast, the two profiles cleaned on the southern f2 revealed the most recent fault rupture events (the two pink trenches in Figure 3b), highlighting the youth and complexity of the fault zone (Figure 3). This is consistent with the latest seismic scientific investigations in the region. The surface rupture zone of the 2022 Mw 6.7 Menyuan earthquake did not propagate along the Lenglongling fault, which was previously thought to have clearer linear features but instead developed about 300–800 m north of it, with some overlap in localized sections [17,25]. Therefore, the most recent seismic event in the northern Ebao town region along the ES-SQF likely propagated along the f2 fault. In this study, we selected two large-scale gullies with well-preserved faulted geomorphic features as the research focus (Figure 4). Using UAV aerial photography and high-resolution Google Earth satellite imagery, we conducted a quantitative study of the latest activity period and slip rate of the ES-SQF.

Figure 4.
A shaded relief map of the mountainous area north of Ebao town, captured using UAVs.
4.1. Qingsha River Section
4.1.1. Faulted Geomorphic Features and Displacement Restoration Measurement
We used a UAV to conduct aerial surveys of the gullies and surrounding landforms in the Qingsha River section, obtaining point cloud data and generating a DEM with a resolution of 0.24 m. A shaded relief map was produced on the ArcGIS platform, and geomorphic mapping was conducted via field investigations (Figure 5).
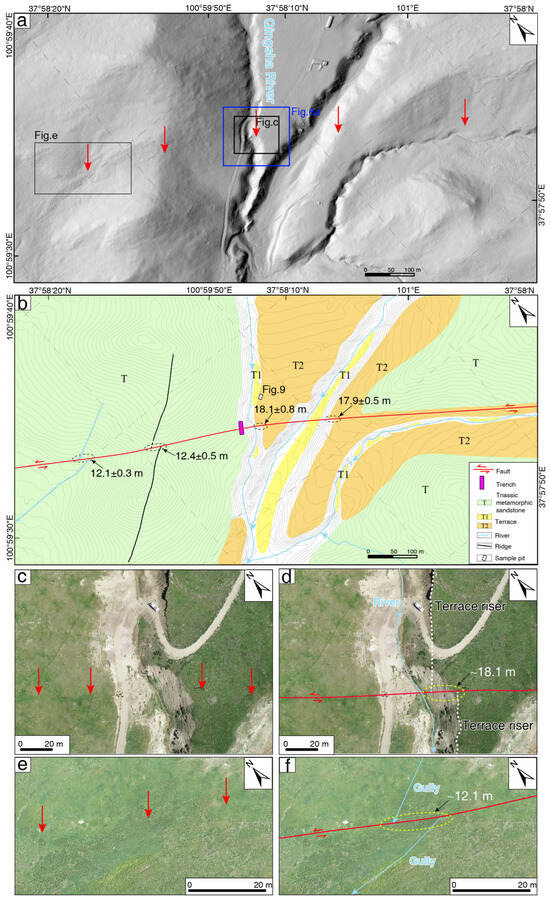
Figure 5.
Fault and displaced geomorphic features in the Qingsha River section. (a) Shaded relief map generated from the Unmanned Aerial Vehicle (UAV)-derived digital elevation model (DEM), with a resolution of 0.24 m. The contour interval is 2 m. (b) Interpreted map of displaced geomorphic features; (c–f) are close-up views.
This area is primarily characterized by the development of Triassic metamorphic sandstone. The Qingsha River crosses nearly vertically through the fault. On the eastern side, a similarly sized gully flows into the Qingsha River after crossing the fault (Figure 5). The right bank terraces downstream of the fault, which are offset into the Qingsha River channel, have been eroded by flowing water and are not preserved. In contrast, the left bank terraces, displaced away from the gully, are well preserved due to protection from the upstream topography and geological bodies, resulting in the development of two levels of terraces, where the horizontal offsets of the steep terrace escarpments are also retained (Figure 5). Furthermore, orthophoto imagery reveals a geomorphological contrast at the location of the fault (Figure 5c). In the geomorphic interpretation map with high-resolution contour lines, the Triassic metamorphic sandstone and terraces on both sides of the Qingsha River are displaced by the fault with a left lateral offset (Figure 5b). Since the T1 terrace, which was displaced downstream, has not been preserved, we only measured a left lateral offset of 18.1 ± 0.8 m for the T2/T1 riser. On the western side of the Qingsha River, a fault trough has developed, and ridges and gullies are also displaced left laterally by the fault. A small gully exhibits characteristics of a truncated gully, with a left lateral offset of 12.1 ± 0.3 m and a ridge offset of 12.4 ± 0.5 m, indicating that this small gully and ridge have recorded fewer seismic events than the T2 terrace of the Qingsha River (Figure 5b; Figure 5f). The left bank terraces of a nearby gully on the eastern side of the Qingsha River also show signs of left lateral displacement, possibly due to erosion, with remnants of the T1 terrace preserved in some areas. The right bank T2/T1 riser has not been preserved, while the left bank T2/T1 terrace has a measured offset of 17.9 ± 0.5 m, consistent with the offset measured on the left bank T2/T1 terrace of the Qingsha River.
To obtain a more accurate measurement of the terrace riser displacement, we used LaDiCaoz software (V2.1) developed by the authors based on the Matlab programming language, applying it to the well-preserved, clearly linear T2/T1 riser on the left bank of the Qingsha River for restoration measurements. First, the high-resolution DEM data were imported into LaDiCaoz, and contour lines were overlaid on the shaded relief map. The fault trace was determined using high-resolution UAV orthophoto interpretation combined with field surveys. The position of the topographic profiles was selected, and displacement markers were drawn. Based on the positions of the markers on both sides of the fault and their projection onto the fault line, we restored the original pre-displacement geomorphology and identified the best estimate for the horizontal displacement and its error (Figure 6). By reasonably restoring the original topography, the best estimate of the displacement for the T2/T1 riser was determined to be 18.0 m, with a maximum displacement of 19.0 m and a minimum displacement of 17.0 m, along with the best restoration diagram (Figure 6). This placed the displacement at 18.0 ± 1.0 m, consistent with measurements in ArcGIS (10.8) (Figure 5).
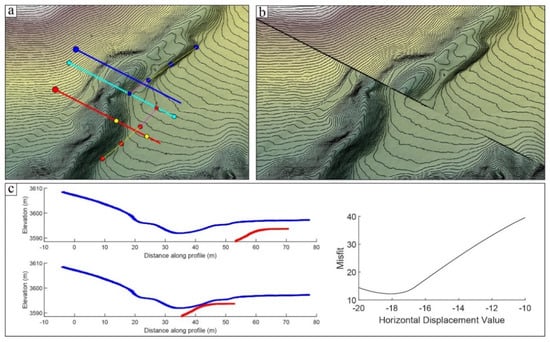
Figure 6.
The measurement and restoration of T2/T1 riser displacement in the Qingsha River section using LaDiCaozsoftware (V2.1). (a) Shaded relief map of the T2/T1 riser on the left bank of the Qingsha River; the cyan line indicates the fault location, the light yellow lines show the trend of the risers on both sides of the fault, and the red and blue lines mark the locations of topographic profiles of the risers; (b) the optimal displacement restoration map of the T2/T1 riser; (c) the original riser and gully topographic profile (top left), the restored riser and gully topographic profile (bottom left), and the misfit distribution map for displacement measurements (right).
4.1.2. Geological Faulting Characteristics
On the right bank of the Qingsha River, at the location of the fault where the gully makes a sharp turn, a vertical trench profile, 13 m long and 2–3 m deep, was excavated using a profile cleared by herders for road construction (Figure 5b and Figure 7). The profile can be roughly divided into eight stratigraphic sets, which are described from top to bottom as follows:
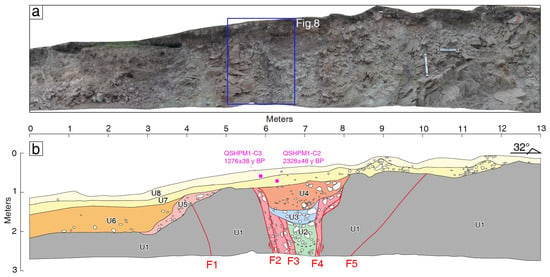
Figure 7.
Trench profile mosaic (a) and interpretation map (b) at the bend of the Qingsha River section.
U8: A black-brown modern root soil layer containing a small amount of gravel, with gravel diameters of about a few centimeters. To constrain the age of this layer, one 14C chronological sample was collected in the field.
U7: A yellow-brown to gray-brown clay layer, locally containing gravel; one 14C chronological sample was collected in the field.
U6: A brown clay layer containing a small amount of gravel, primarily distributed on the southern side of the profile, gradually tapering to the north.
U5: A dark brown sandstone weathering crust, locally distributed within the profile.
U4: A reddish-brown gravel layer is characterized by disordered and discontinuous distribution of gravels. It represents the faulted strata from the most recent seismic rupture event, with drag deformation observed near the fault.
U3: A white gravel layer, with gravel arranged randomly, serving as the fill material from a past earthquake event, displaying drag deformation.
U2: A bluish-white gravel layer with a high gravel content and randomly arranged gravel.
U1: Red-brown to gray-brown metamorphic sandstone.
The vertical profile clearly shows the fault traces, and based on the orientation of the gravel, stratigraphic displacement, and deformation, five faults were identified in the profile, named F1, F2, F3, F4, and F5, in sequence. Among these, F1 and F5 primarily develop in the U1 metamorphic sandstone layer, while the F2, F3, and F4 faults control the accumulation of loose layers. Moreover, the fault on the northern side of the profile dips southward, while the fault on the southern side dips northward. The central strata are younger, and the strata on both sides are older, indicating the characteristics of a normal fault. The profile, as a whole, reveals the negative flower structure of the ES-SQF. Based on a comprehensive analysis of fault deformation, three ancient seismic events were identified. The oldest event was when the F3 and F4 faults displaced the bluish-white gravel layer U2, which was overlain by a white gravel layer U3 (Figure 7b). The second most recent event involved the F2 and F4 faults displacing the white gravel layer U3, which was overlain by the red-brown gravel layer U4 (Figure 7b). The most recent seismic event occurred when the F2 and F4 faults displaced the red-brown gravel layer U4, with the yellow-brown to gray-brown clay layer U7 and the black-brown modern root soil layer U8 representing the debris deposited after the most recent seismic event, i.e., the overlying strata (Figure 7b; Figure 8). Therefore, the most recent seismic event occurred after the U4 layer and before the U7 layer.
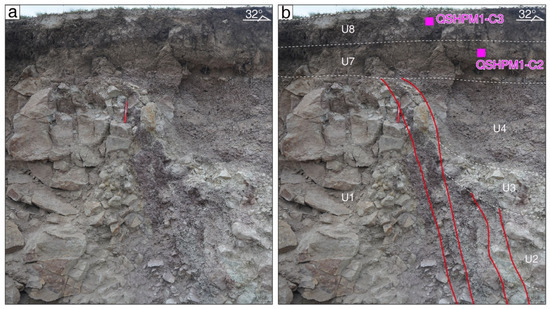
Figure 8.
Close-up photo and interpretation map of the Qingsha River trench profile. (a) Close-up photo. (b) Fault interpretation map.
Since no chronological samples were collected from the red-brown gravel layer U4, we cannot provide an upper limit for the most recent event. However, we can establish a lower limit for the most recent seismic event revealed by the profile. A 14C chronological sample (QSHPM1-C2) was collected from the U7 layer, and another 14C sample (QSHPM1-C3) was collected from the U8 layer. The ages of the samples, as calibrated by the BETA laboratory in the United States, are 2328 ± 48 y BP and 1276 ± 38 y BP, respectively (Table 1; Figure 7), and the chronological order of the two samples is consistent with the stratigraphic sequence. Therefore, the most recent seismic event revealed by the Dangzhong River trench profile should have occurred before 2328 ± 48 y BP.

Table 1.
The radiocarbon dating results of the excavated trench profiles and terraces along the ES-SQF.
4.1.3. Slip Rate
Displacement start time constraint.
The lateral erosion of the Qingsha River has scoured the terrace risers, primarily affecting the right bank that has been offset into the river channel. In contrast, the left bank, which has been displaced away from the river, is protected by upstream landforms. This conforms to the “Upper-terrace reconstruction”, whereby the abandonment age of the upper terrace can constrain the initiation time for the accumulation of displacement along the riser. Therefore, to determine the initiation time for the cumulative displacement along the T2/T1 riser, a 1.92 m deep excavation pit profile was cleared on the T2 terrace. By collecting and testing chronological samples, the abandonment age of the terrace was constrained (Figure 5b; Figure 9). Based on sedimentary characteristics, the profile can be divided into five layers:
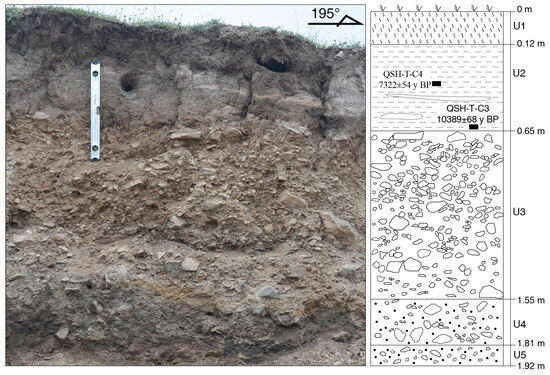
Figure 9.
The stratigraphic profile of the top of the T2 terrace in the Qingsha River section and sampling locations.
U1: A gray-black soil layer containing plant roots.
U2: A gray-black clay layer, about 0.53 m thick, interspersed with yellow clay bands.
U3: A yellow-brown gravel layer with poor rounding and sorting, about 0.9 m thick.
U4: A black sand-gravel layer, with gravel sizes around 8 cm, sub-angular to rounded.
U5: A reddish-brown sand-gravel layer with smaller gravel sizes.
Based on the sedimentological characteristics of the T2 terrace (Figure 9), gravel layers U5, U4, and U3 represent the deposits formed before the abandonment of the terrace, with possible color differences due to climate change. The gray-black clay layer U2, which is the closest layer to the gravel deposits, is likely to have been deposited by sheet flow on the alluvial fan after the abandonment of the terrace, and it approximates the terrace’s abandonment age. Two radiocarbon (14C) dating samples, QSH-T-C3 and QSH-T-C4, were collected from this layer and tested at the BETA laboratory in the United States. After calibration with dendrochronology, the results indicated sample ages of 7322 ± 54 y BP and 10,389 ± 68 y BP, respectively (Table 1; Figure 9). The chronological order of the two samples aligns with the stratigraphic order, with the upper sediment being younger than the lower one. Therefore, we took the age of sample QSH-T-C3, 10,389 ± 68 y BP, as the deposition age of the gravel layer closest to it. Consequently, the incision and abandonment age of the T2 terrace can be constrained to approximately 10,389 ± 68 y BP.
The radiocarbon (14C) dating sample from the T2 terrace near the gravel layer yielded an age of 10,389 ± 68 y BP, which closely approximates the actual abandonment age of the terrace. Additionally, the total displacement accumulated on the T2 terrace since its abandonment is 18.0 ± 1.0 m. Based on the correlation between the age and the displacement, the left lateral slip rate of the eastern segment of the ES-SQF since the Holocene is calculated to be 1.8 ± 0.1 mm/y.
4.2. Dangzhong River Section
4.2.1. Faulted Geomorphic Features and Displacement Restoration Measurement
The Dangzhong River section is located approximately 2 km west of the Qingsha River section (Figure 3 and Figure 4). Upstream, two gully systems flow roughly from north to south, with the right gully being a tributary of the Dangzhong River. These two gullies converge south of the fault. Based on field surveys, high-resolution orthophotos, and DEM obtained from UAV, a detailed interpretation of the Dangzhong River section was conducted (Figure 10). This area is primarily characterized by the development of Triassic metamorphic sandstone. The terrace risers along both banks have been preserved, with two levels of terraces identifiable on both sides; the heights of the T1 and T2 terraces are approximately 2 m and 5 m, respectively (Figure 10). The fault trace in this area is distinct, displaying linear characteristics, and fault troughs are developed on both sides of the gully. The ridge on the western side of the Dangzhong River, as well as the Triassic metamorphic sandstone on both sides, also exhibit characteristics of left lateral displacement. (Figure 10b). Due to the erosive effects of the gully, the horizontal displacement of the terrace riser on the right bank of the Dangzhong River, which has been offset into the river channel, has not been preserved (Figure 10). In contrast, the terrace riser on the left bank, further from the river, remains intact. There is a dry gully on the left bank terrace, where a small alluvial fan has developed at the gully’s mouth; however, this has not affected the T2 terrace riser on the left bank (Figure 10b). By conducting displacement recovery measurements on the risers of each terrace level, we measured a left lateral displacement of 6.5 ± 0.4 m for the rear edge of the T1 terrace on the left bank and a displacement of 14.2 ± 0.7 m for the T2/T1 riser (Figure 10b).
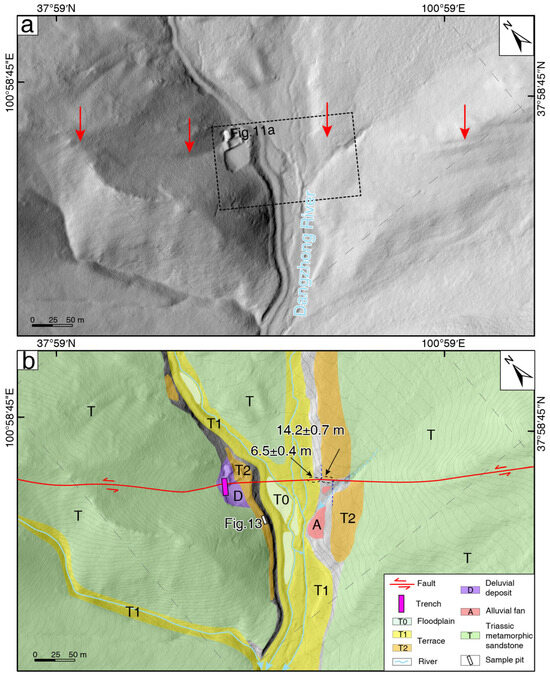
Figure 10.
Fault and displacement geomorphology features in the Dangzhong River section: (a) Shaded relief map generated from the Unmanned Aerial Vehicle (UAV)-derived digital elevation model (DEM), with a resolution of 0.24 m. The contour interval is 2 m. (b) Interpreted map of displaced geomorphic features.
Similarly, to reduce the subjective influence of human measurements on the displacement of terrace risers, we employed the LaDiCaoz software (V2.1) developed by using the Matlab programming language. This was based on high-resolution DEM data obtained from UAV to conduct recovery measurements on the T2/T1 risers on the left bank of the Qingsha River, which are well-preserved and exhibit distinct linear features. By appropriately restoring the original topography, the optimal displacement for the T2/T1 riser was found to be 14.6 m, with a maximum displacement of 15.0 m and a minimum displacement of 14.2 m. Therefore, the displacement for this riser is constrained to 14.6 ± 0.4 m (Figure 11), which is consistent with the measurements obtained from the high-resolution contour interpretation of the landforms.
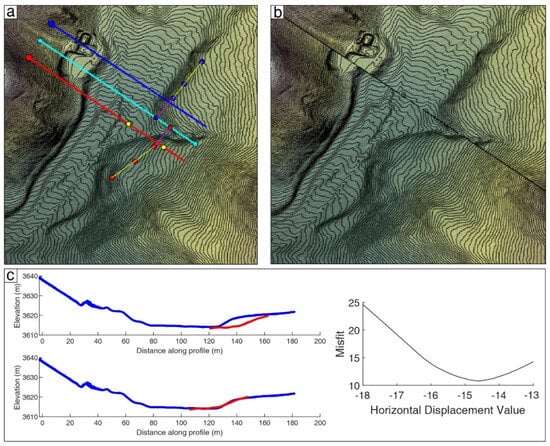
Figure 11.
The displacement measurement and restoration of the T2/T1 riser in the Dangzhong River section based on LaDiCaoz software (V2.1). (a) Shaded relief map of the T2/T1 riser on the left bank of the Dangzhong River; the cyan line indicates the fault location, the light yellow lines show the trend of the risers on both sides of the fault, and the red and blue lines mark the locations of topographic profiles of the risers; (b) the optimal displacement restoration map of the T2/T1 riser; (c) the original riser and gully topographic profile (top left), the restored riser and gully topographic profile (bottom left), and the misfit distribution map for displacement measurements (right).
4.2.2. Geological Faulting Characteristics
At the bend on the right bank of the Dongzhong River, a trench approximately 6 m long and 2–3 m deep was excavated where the fault crosses (Figure 10b; Figure 12). The profile can be roughly divided into nine strata, described from top to bottom as follows:
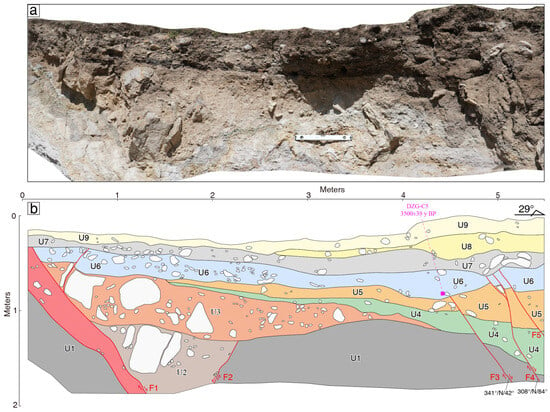
Figure 12.
Trench profile mosaic (a) and interpretation map (b) at the bend of the Dangzhong River.
U9: A dark brown soil layer containing a small amount of gravel.
U8: A gray-white to gray-yellow clay layer containing a small amount of gravel, decreasing in thickness toward the south and gradually tapering off.
U7: A bluish-white to brown clay layer containing a small amount of gravel, with well-rounded gravel, tapering off gradually to the south.
U6: A dark brown clay layer with gravel, showing significant displacement at the bottom; a 14C sample was collected from this layer.
U5: A dark-brown clay layer shows significant faulting, with drag deformation observed near the fault.
U4: A variegated clay layer containing a small amount of gravel, with poor rounding of the gravel.
U3: A light yellow gravel layer with gravel diameters ranging from a few centimeters to 1 meter, showing drag deformation near the fault.
U2: A yellow-white gravel layer with gravel diameters ranging from a few centimeters to several tens of centimeters.
U1: A bluish metamorphic sandstone.
The vertical profile reveals clear fault traces, and based on stratigraphic displacement, deformation, and the orientation of gravel, five faults have been identified, named from north to south as F1, F2, F3, F4, and F5, all exhibiting characteristics of normal faults. On the southern side of the profile, the F1 and F2 fault surfaces are distinct, controlling the accumulation of the U2 layer. F1 diverges upwards, displacing the deep yellow-white gravel layer U2, the light yellow gravel layer U3, and the brown gravelly clay layer U6, terminating at the bottom of the bluish-white to brown clay layer U7, with U7 and U9 serving as the overlying layers. On the northern side of the profile, the F3, F4, and F5 faults are straight, limited by the cleaned profile; F5 reveals only partial phenomena. The most recent rupture event involves the F4 and F5 faults displacing the U6 layer, terminating at the bottom of the U7 layer, with U7, U8, and U9 serving as the overlying layers, consistent with the stratigraphic displacements and terminations revealed by the F1 fault on the southern side of the profile. To constrain the timing of the most recent seismic event revealed by this profile, we collected and tested a 14C sample from the dark brown gravelly clay layer U6. The calibrated age of the sample, determined by the BETA laboratory in the United States, is 3500 ± 39 y BP (Figure 12; Table 1).
Therefore, the fault structural phenomena revealed by the trench profile at the Dongzhong River, the sedimentary characteristics of the displaced layers, and the preliminary dating test results indicate that the most recent seismic event of this fault occurred after 3500 ± 39 y BP, providing favorable evidence of the Holocene activity of the ES-SQF.
4.2.3. Slip Rate
Through detailed geomorphological interpretation of the Dangzhong River, it is evident that the left bank terrace, displaced away from the river channel, is well-preserved. Its evolutionary pattern also conforms to the “Upper-terrace reconstruction”, indicating that the abandonment age of the upper terrace can constrain the initiation time for the accumulation of displacement along the riser. To determine the start of the cumulative displacement along the T2/T1 riser, a profile measuring approximately 2 m in length and 2.25 m in depth was excavated on the T2 terrace (Figure 10b; Figure 13). Based on differences in sedimentary characteristics, the profile can be divided into the following four layers:
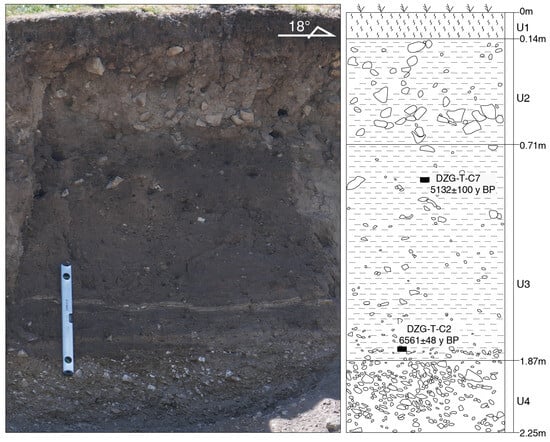
Figure 13.
The stratigraphic profile of the top of the T2 terrace in the Dangzhong River section and sampling locations.
U1: A gray-black soil layer containing plant roots.
U2: A gray-yellow clay layer with approximately 30% gravel content, where the gravel particle size ranges from a few centimeters to over ten centimeters.
U3: A brownish-black clay layer containing a small amount of gravel, with a gravel particle size of about a few centimeters and a thickness of approximately 1.1 m. Two 14C samples were collected from this layer, which also features two yellow clay interlayers approximately 6 cm wide in its lower section.
U4: A yellow-brown gravel layer with poor rounding and sorting, approximately 0.9 m thick.
Based on the sedimentary characteristics of the T2 terrace profile (Figure 13), the yellow-brown gravel layer U4 is considered sediment that predates the abandonment of the terrace. In contrast, the overlying brownish-black clay layer U3 is the closest layer to the terrace gravel layer and is near the abandonment age of the terrace. Consequently, two 14C dating samples, DZG-T-C2 and DZG-T-C7, were collected from the bottom and upper middle of U3 and tested at the BETA laboratory in the United States. The results show that the calibrated ages of the samples are 6561 ± 48 y BP and 5132 ± 100 y BP, respectively (Table 1; Figure 13). These ages correlate well with depth, and the age of 6561 ± 48 y BP, which is near the top of the yellow-brown gravel layer, can be considered as the abandonment age of the T2 terrace.
Using LaDiCaoz software (V2.1), the measured displacement of the T2/T1 riser was determined to be 14.6 ± 0.4 m. The abandonment age of the T2 terrace was dated to 6561 ± 48 y BP. Therefore, the cumulative time corresponding to the terrace riser displacement can be constrained to 6561 ± 48 y BP. Based on this, the left lateral slip rate of the ES-SQF at the Dangzhong River site is calculated to be 2.2 ± 0.1 mm/y.
5. Discussion
5.1. Recent Activity Period and Slip Rate of the ES-SQF
The Qingsha River and Dangzhong River research sites, which are about 2 km apart, provide fault activity age and slip rate data that can be cross-validated. The Dangzhong River profile reveals that the most recent seismic event along the ES-SQF occurred before 2328 ± 48 y BP, while the Qingsha River profile suggests that the latest event occurred after 3500 ± 39 y BP. Therefore, by synthesizing the age sample results from both profiles, we can constrain the timing of the most recent seismic event on the ES-SQF to between 3500 and 2328 y BP. Although this is a broad timeframe, it indicates that a surface-rupturing earthquake occurred along this fault segment between 3500 and 2328 y BP. Additionally, the abandonment ages of the T2 terraces at the Qingsha River and Dangzhong River sites are dated to 10,389 ± 68 y BP and 6561 ± 48 y BP, respectively. Both terraces have been offset by left lateral displacement, indicating that surface-rupturing earthquakes have occurred since the Holocene. The terrace dating, the amount of left lateral displacement, and the fault profile samples all demonstrate that the ES-SQF is an active Holocene fault. This contrasts with previous studies that classified the fault as active during the Late Pleistocene [9,15]. This study provides direct geological, geomorphological, and chronological evidence of Holocene activity. Furthermore, the slip rates obtained at the Qingsha River and Dangzhon River sites are 1.8 ± 0.1 mm/y and 2.2 ± 0.1 mm/y, respectively. Considering uncertainties in the calculations, the left lateral slip rate of the ES-SQF since the Holocene can be constrained to 2.0 ± 0.3 mm/y.
The current slip rate of the fault can also be obtained using GPS observation stations and InSAR data [54,55,56]. Zheng et al. (2013) [14] used GPS data (1998–2004) to construct a velocity profile across the entire Qilian Mountains perpendicular to the QHF [14]. A profile that spans the ES-SQF and Tuolaishan fault revealed a combined slip rate of 4.0 ± 1.0 mm/y. Huang et al. (2022) [16] used synthetic aperture radar data from the Sentinel-1 satellite (2014–2021) to study present-day strain accumulation along the QHF [16]. Profile P5 provided a combined slip rate of 3.7 ± 0.2 mm/y for the ES-SQF and Tolaishan fault. In general, if a fault is at the end of its seismic cycle, the geodetic slip rate derived from standard dislocation models may be lower than the long-term slip rate of the fault [57]. However, for faults that have recently experienced a large earthquake, the geodetic rate is usually consistent with the geological rate, as in the case of the HYF [38]. Geological methods indicate a slip rate of ~3–4 mm/y for the eastern segment of the Tuolaishan fault [30] and 2.0 ± 0.3 mm/y for the ES-SQF. The sum of the slip rates from these two faults is higher than the rate provided by geodetic measurements, which may be because both faults are reporting Holocene rates, covering fewer seismic cycles. Therefore, we believe it is reasonable for the Holocene slip rates of the ES-SQF and Tuolaishan fault to be slightly higher than the GPS and InSAR rates.
5.2. Strain Distribution Patterns in the Central–Western Segment of the QHY
The Altyn Tagh fault is a major boundary fault along the northern edge of the Tibetan Plateau. During the Late Quaternary, the left lateral slip rate decreased from 11 mm/y in the west to 4.8 mm/y in the east and subsequently dropped to 0–2 mm/y [24,48,49,58,59,60], exhibiting a regular decreasing trend. These studies suggest that the reduction in left lateral slip movement along the Altyn Tagh fault is primarily absorbed by structural deformation of the thrust or strike-slip faults developed in the Qaidam Basin and the Qilian Mountains fault [58,61]. Recent research indicates that the Changma fault also plays a significant role in the distribution of slip strain in the Altyn Tagh fault, with approximately 4.8 mm/y of slip strain being transferred to the Changma fault [24]. From a regional tectonic perspective, the Changma fault is connected to the Sunan–Qilian fault and has a generally consistent orientation [39] (Figure 1 and Figure 14). The slip strain from the Changma fault can be transmitted eastward to the ES-SQF. The slip rate of the Changma fault is 3.3–4.49 mm/y [24,62], while the rate for the ES-SQF is only 2.0 ± 0.3 mm/y, possibly due to the absorption of some strain through crustal shortening caused by mountain uplift or deformation of the adjacent basins. Meanwhile, the eastern segment of the Tolaishan fault has a slip rate of approximately 3–4 mm/y [30], which is coordinated well with the slip strain of the ES-SQF transmitted to the Lenglongling fault (6.0–6.6 mm/y) [31,32,33] (Figure 14).

Figure 14.
The geological slip rate distribution map of the QHF [5,7,8,24,27,28,30,31,32,33,34,35,36,37,38,62,63,64,65,66,67]. Abbreviations: CMF, Changma fault; TLSF, Tuolaishan fault; HLHF, Halahu fault; SN-QLF, Sunan-Qilian fault; ES-SQF, Eastern segment of the Sunan–Qilian Fault; LLLF, Lenglongling fault; JQHF, Jinqianghe fault; MMSF, Maomaoshan fault; LHSF, Laohushan fault; HYF, Haiyuan fault; GLF, Gulang fault; XS-TJSF, Xiangshan-Tianjingshan fault.
Parallel or subparallel branch faults can modulate the strain distribution, leading to a gradual decrease in the stable slip rate of the central segment of a major fault toward one side or both sides [68,69]. Additionally, the slip rate of the main fault is consistent with the sum of the slip rates at the fault’s termination and its various branches. The Late Quaternary geological slip rates, as well as the GPS and InSAR-derived slip rates along the QHF, exhibit an arc-like distribution, with the highest rates observed in the Lenglongling fault, gradually decreasing toward both ends of the fault [14,16,28,31,32,33] (Figure 14). This pattern supports the development of a tectonic model in which the low strike-slip rates at the western end of the QHF are linked to compressional deformation [11,12,13,14]. However, previous studies did not consider the role of the ES-SQF in strain partitioning along the central–western QHF, mainly due to the uncertainty in the activity and slip rate of its eastern segment. From a regional tectonic perspective, the Lenglongling fault extends westward and connects with the Changma fault, the Tuolaishan fault, or the Halahu fault, with the western part at least linking to the ES-SQF and Tuolaishan fault [9,11,15]. The combined slip rates of the eastern segments of the Sunan–Qilian and Tuolaishan faults match the slip rate of the Lenglongling fault, suggesting that the Sunan–Qilian fault also plays a significant role in strain transfer along the central–western part of the QHF (Figure 14). Therefore, we tend to believe that the western segment of the QHF may experience reduced slip rates along the Tuolaishan or Halahu faults due to the influence of subsidiary faults, such as the Sunan–Qilian fault. Together, the Sunan–Qilian and Tuolaishan faults absorb and accommodate the left lateral shear deformation along the central–western QHF. This pattern of strain partitioning is consistent with slip rate variations observed in the San Andreas Fault in the United States and the Alpine fault in New Zealand [28]. For instance, the northern segment of the San Andreas fault exhibits reduced slip rates due to subsidiary faults, such as the Calaveras and Hayward faults, while the southern segment experiences similar reductions due to the San Jacinto and Elsinore faults. Similarly, the eastern part of the Alpine fault sees a decrease in slip rate because of three secondary faults: Awatere, Clarence, and Hope.
5.3. Implications for Seismic Hazards Along the ES-SQF
Why did the ES-SQF not rupture during the 2022 Mw 6.7 Menyuan earthquake, while the 2022 earthquake ruptured the Lenglongling fault and the eastern segment of the Tuolaishan fault [10,17,70]? General studies suggest that the ability of seismic rupture to propagate from one fault to another parallel fault is related to the distance across the stepover [71]. Seismic case studies further indicate that rupture propagation can typically cross stepover structures within a distance of less than 4 km [72,73]. Finite difference simulations suggest that seismic rupture transitions can occur in both compressional and extensional stepovers, with extensional stepovers being more likely to be traversed compared to compressional ones [71]. The Lenglongling fault, the eastern segment of the Tuolaishan fault, and the ES-SQF, all characterized by left-lateral strike-slip motion, is located near the epicenter of the 2022 Mw 6.7 Menyuan earthquake (Figure 1). Between the Lenglongling fault and the eastern segment of the Tuolaishan fault is an extensional stepover with a distance of 2.6 km [17], while between the Lenglongling fault and the ES-SQF is a compressional stepover with a distance of 4.2 km (Figure 2). As a result, the 2022 Menyuan earthquake ruptured the Lenglongling fault and propagated through the extensional stepover to rupture the eastern segment of the Tuolai fault, whereas the ES-SQF, located in the compressional stepover, did not rupture. However, given the influence of the 2022 Menyuan earthquake, the seismic hazard of the ES-SQF, located to the north of the compressional stepover, should not be underestimated.
Numerous earthquake case studies have shown that changes in regional Coulomb stress due to strong seismic activity can significantly affect surrounding seismogenic faults [50,53]. Therefore, analyzing the Coulomb stress changes caused by major seismic events can help reveal future seismic hazards to surrounding faults [52,74]. According to existing studies, in regions where the static Coulomb stress change is positive, subsequent seismic activity may be triggered, while in regions of Coulomb stress unloading, earthquake occurrence may be delayed [75,76]. This provides a reference for assessing the risk of major earthquakes in the region.
In recent years, the eastern side of the ES-SQF has experienced the 2016 Mw 5.9 Menyuan earthquake and the 2022 Mw 6.7 Menyuan earthquake. Previous studies used InSAR data to constrain a fault model of the 2016 Mw 5.9 Menyuan earthquake and calculated its Coulomb stress on the ES-SQF, showing that Coulomb failure stress change (ΔCFS) was greater than 0.1 bar [70,77]. However, fewer studies have focused on the 2022 Menyuan earthquake as the source fault. Based on the finite fault model of the 2022 Mw 6.7 Menyuan earthquake provided by USGS and using the fault geometry from field measurements of the latest earthquake event (Figure 8 and Figure 12) as the receiver fault parameters, we calculated the Coulomb stress changes induced by the 2022 Menyuan earthquake on the ES-SQF (Figure 15). The results indicate that, regardless of the reference depth (5 or 10 km), the 2022 Menyuan earthquake significantly increased stress accumulation, with ΔCFS ranging from 0.03827 to 1.713 bar. In the central section, ΔCFS reached 0.3891 bar, representing the Coulomb stress change along the entire segment, which exceeds the triggering threshold of 0.1 bar [50]. This suggests the 2022 earthquake may have increased stress accumulation along this fault.
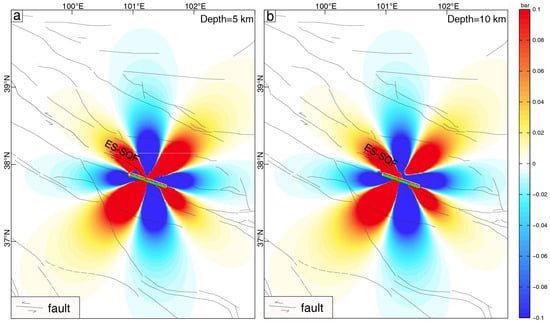
Figure 15.
The influence of the 2022 Menyuan earthquake on the Coulomb stress of ES-SQF. Abbreviations: ES-SQF, Eastern segment of the Sunan–Qilian Fault. (a) A depth of 5 km; (b) A depth of 10 km.
The 1920 Haiyuan earthquake, the 1927 Gulang earthquake, and the 2016 and 2022 Menyuan earthquakes show a westward migration in the spatial distribution (Figure 1), potentially indicating a trend of stress transfer to the west [78]. The ES-SQF is located in a seismic gap between the 1927 M8.0 Gulang earthquake and the 1932 M7.6 Changma earthquake, with no historical records of major earthquakes in the surrounding area [6]. Additionally, after the 2022 Menyuan earthquake, the aftershocks mainly aligned along two directions: east-west (EW) and north–northwest (NNW). The NNW aftershock zone extends toward the eastern segment of the ES-SQF, where few aftershocks were recorded, suggesting that fault stress was not fully released during the earthquake [17]. Moreover, the ES-SQF plays a significant role in the strain distribution of the central–western section of the QHF. The most recent seismic event on this segment occurred between 3500 and 2328 y BP, indicating a long elapsed time. Both the 2016 Mw 5.9 and 2022 Mw 6.7 Menyuan earthquakes produced a ΔCFS greater than 0.1 bar on the ES-SQF [70,77] (Figure 15), which exceeds the earthquake triggering threshold of 0.1 bar. Therefore, the spatial migration of major earthquakes, the distribution of aftershocks, strain partitioning, and the elapsed time suggest that stress accumulation on the ES-SQF is high. With the Coulomb stress loading from the 2016 and 2022 Menyuan earthquakes, the likelihood of a future major earthquake along this segment has increased, warranting greater attention in regional earthquake-preparedness and disaster-mitigation efforts.
Predicting the magnitude of the next rupture event on the ES-SQF is another key issue in assessing the seismic hazard of this region. Although the exact recurrence interval of fault rupture is unknown, approximately 3500 to 2328 years have passed since the last event. Geological data suggest a fault slip rate of about 2 mm/y, requiring up to 7 m of displacement to release all accumulated strain. Based on empirical relationships between displacement and magnitude [79,80], a displacement of up to 7 m suggests a possible earthquake magnitude of approximately Mw 7.5, indicating that the ES-SQF has accumulated a seismic moment equivalent to Mw 7.5.
6. Conclusions
This study focuses on the Qingsha River and Dangzhong River, areas with typical strike-slip faulted landforms located in the northern region of Ebao town, Qilian County, Qinghai Province. Based on field geological surveys, high-resolution DEMs obtained from UAVs, and detailed interpretation of Google Earth satellite imagery, we conducted vertical profile stripping, terrace riser displacement recovery measurements, and chronological dating of stratified geomorphological surfaces, leading to the following conclusions:
- (1)
- There is geological and geomorphological evidence of Holocene activity along the ES-SQF. At the Qingsha River and Dangzhong River sites, there are typical synchronous left lateral displacements of ridges, gullies, and terraces. The fault-crossing stripped profiles reveal that the most recent surface-rupturing earthquake occurred between 3500 and 2328 y BP.
- (2)
- Based on the correlation between the faulted landforms and the ages of the terraced landforms, the slip rates obtained at the Qingsha River and Dangzhong River sites are 1.8 ± 0.1 mm/y and 2.2 ± 0.1 mm/y, respectively. Comprehensive analysis indicates that the slip rate of the ES-SQF since the Holocene is 2.0 ± 0.3 mm/y. The ES-SQF plays an important role in the strain distribution of the middle and western segments of the QHF. The slip rate of the western faults may have decreased due to the influence of branching faults.
- (3)
- Based on the activity research results of the ES-SQF, it is estimated that a seismic moment equivalent to Mw7.5 has accumulated. The trends in strong earthquake spatial migration, aftershock spatial distribution, strain distribution, and elapsed time indicate that stress accumulation in the ES-SQF is at a relatively high state. Along with the Coulomb stress loading from the 2016 and 2022 Menyuan earthquakes, the seismic hazard of this fault in the future should not be underestimated.
Author Contributions
Conceptualization: P.N.; data curation: P.N.; formal analysis: P.N.; funding acquisition: Z.H.; investigation: P.N., Z.H., P.G., S.M. and H.M.; Methodology: P.N., Z.H. and P.G.; project administration: Z.H.; resources: P.N.; software: P.N., Z.H. and P.G.; supervision: Z.H.; visualization: P.N., Z.H. and P.G.; writing—original draft: P.N.; writing—review and editing: P.N., Z.H. and P.G. All authors have read and agreed to the published version of the manuscript.
Funding
This study was funded by the National Nonprofit Fundamental Research Grant of China, the Institute of Geology, and the China Earthquake Administration (IGCEA2206; IGCEA2407), as well as the National Natural Science Foundation of China (42002231).
Data Availability Statement
The original contributions presented in the study are included in the article, further inquiries can be directed to the corresponding author.
Acknowledgments
The authors are grateful for the help provided by Haomin Ji and Jun Ma of the Institute of Geology, the China Earthquake Administration.
Conflicts of Interest
The authors declare that they have no known competing financial interests or personal relationships that could have appeared to influence the work reported in this paper.
References
- Allen, M.B.; Walters, R.J.; Song, S.; Saville, C.; De Paola, N.; Ford, J.; Hu, Z.; Sun, W. Partitioning of oblique convergence coupled to the fault locking behavior of fold-and-thrust belts: Evidence from the Qilian Shan, northeastern Tibetan Plateau. Tectonics 2017, 36, 1679–1698. [Google Scholar] [CrossRef]
- Hu, X.; Pan, B.; Kirby, E.; Gao, H.; Hu, Z.; Cao, B.; Geng, H.; Li, Q.; Zhang, G. Rates and kinematics of active shortening along the eastern Qilian Shan, China, inferred from deformed fluvial terraces. Tectonics 2015, 34, 2478–2493. [Google Scholar] [CrossRef]
- Tapponnier, P.; Zhiqin, X.; Roger, F.; Meyer, B.; Arnaud, N.; Wittlinger, G.; Jingsui, Y. Oblique Stepwise Rise and Growth of the Tibet Plateau. Science 2001, 294, 1671–1677. [Google Scholar] [CrossRef]
- Xiong, J.; Li, Y.; Zhong, Y.; Lu, H.; Lei, J.; Xin, W.; Wang, L.; Hu, X.; Zhang, P. Latest Pleistocene to Holocene Thrusting Recorded by a Flight of Strath Terraces in the Eastern Qilian Shan, NE Tibetan Plateau. Tectonics 2017, 36, 2973–2986. [Google Scholar] [CrossRef]
- Zheng, W.; Zhang, P.; Ge, W.; Molnar, P.; Zhang, H.; Yuan, D.; Liu, J. Late Quaternary slip rate of the South Heli Shan Fault (northern Hexi Corridor, NW China) and its implications for northeastward growth of the Tibetan Plateau. Tectonics 2013, 32, 271–293. [Google Scholar] [CrossRef]
- Gu, G. Catalogue of Chinese Earthquakes (1831BC–1969AD); Science Press: Beijing, China, 1983. [Google Scholar]
- Gaudemer, Y.; Tapponnier, P.; Meyer, B.; Peltzer, G.; Shunmin, G.; Zhitai, C.; Huagung, D.; Cifuentes, I. Partitioning of crustal slip between linked, active faults in the eastern Qilian Shan, and evidence for a major seismic gap, the ‘Tianzhu gap’, on the western Haiyuan Fault, Gansu (China). Geophys. J. Int. 1995, 120, 599–645. [Google Scholar] [CrossRef]
- Liu, J.; Liu, B.; Yuan, D. Late Quaternary active characteristics of Sunan fault and preliminary study of paleoearthquakes. In Research on Active Faults in China; Seismological Press: Beijing, China, 1994; pp. 36–41. [Google Scholar]
- Xu, X.; Han, Z.; Yang, X. Seismotectonic Map of China and Adjacent Areas; Seismological Press: Beijing, China, 2016. [Google Scholar]
- Yuan, D.; Xie, H.; Su, R.; Li, Z.; Wen, Y.; Si, G.; Xue, S.; Chen, G.; Liu, B.; Liang, S.; et al. Characteristics of co-seismic surface rupture zone of Menyuan MS6.9 earthquake in Qinghai Province on January 8, 2022 and seismogenic mechanism. Chin. J. Geophys. 2023, 66, 229–244. [Google Scholar]
- Yuan, D.; Zhang, P.; Liu, B.; Gan, W.; Mao, F.; Wang, Z.; Zheng, W.; Guo, H. Geometrical Imagery and Tectonic Transformation of Late QuaternaryActive Tectonics in Northeastern Margin of Qinghai–Xizang Plateau. Acta Geol. Sin. 2004, 78, 270–278. [Google Scholar]
- Zheng, D.; Zhang, P.; Wan, J.; Yuan, D.; Li, C.; Yin, G.; Zhang, G.; Wang, Z.; Min, W.; Chen, J. Rapid exhumation at ~8 Ma on the Liupan Shan thrust fault from apatite fission-track thermochronology: Implications for growth of the northeastern Tibetan Plateau margin. Earth Planet. Sci. Lett. 2006, 248, 198–208. [Google Scholar] [CrossRef]
- Yuan, D.; Ge, W.; Chen, Z.; Li, C.; Wang, Z.; Zhang, H.; Zhang, P.; Zheng, D.; Zheng, W.; Craddock, W.H.; et al. The growth of northeastern Tibet and its relevance to large-scale continental geodynamics: A review of recent studies. Tectonics 2013, 32, 1358–1370. [Google Scholar] [CrossRef]
- Zheng, W.; Zhang, P.; He, W.; Yuan, D.; Shao, Y.; Zheng, D.; Ge, W.; Min, W. Transformation of displacement between strike-slip and crustal shortening in the northern margin of the Tibetan Plateau: Evidence from decadal GPS measurements and late Quaternary slip rates on faults. Tectonophysics 2013, 584, 267–280. [Google Scholar] [CrossRef]
- Institute of Geology, China Earthquake Administration. The Qilianshan–Hexi Corridor Active Fault System; Seismogical Press: Beijing, China, 1993. [Google Scholar]
- Huang, Z.; Zhou, Y.; Qiao, X.; Zhang, P.; Cheng, X.J.E.; Letters, P.S. Kinematics of the ∼1000 km Haiyuan fault system in northeastern Tibet from high-resolution Sentinel-1 InSAR velocities: Fault architecture, slip rates, and partitioning. Earth Planet. Sci. Lett. 2022, 583, 117450. [Google Scholar] [CrossRef]
- Niu, P.; Han, Z.; Li, K.; Lv, L.; Guo, P. The 2022 Mw 6.7 Menyuan Earthquake on the Northeastern Margin of the Tibetan Plateau, China: Complex Surface Ruptures and Large Slip. Bull. Seismol. Soc. Am. 2023, 113, 976–996. [Google Scholar] [CrossRef]
- Guo, P.; Han, Z.; An, Y.; Jiang, W.; Mao, Z.; Feng, W. Activity of the Lenglongling fault system and seismotectonics of the 2016 MS6.4 Menyuan earthquake. Sci. China Earth Sci. 2017, 60, 929–942. [Google Scholar] [CrossRef]
- England, P.; Molnar, P. Active Deformation of Asia: From Kinematics to Dynamics. Science 1997, 278, 647–650. [Google Scholar] [CrossRef]
- Molnar, P.; Tapponnier, P. Cenozoic Tectonics of Asia: Effects of a Continental Collision. Science 1975, 189, 419–426. [Google Scholar] [CrossRef] [PubMed]
- Zhao, B.; Huang, Y.; Zhang, C.; Wang, W.; Tan, K.; Du, R. Crustal deformation on the Chinese mainland during 1998–2014 based on GPS data. Geod. Geodyn. 2015, 6, 7–15. [Google Scholar] [CrossRef]
- Zhang, W.; Jiao, D.; Zhang, P.; Peter, M.; Burchfield, B.C.; Deng, Q.; Wang, Y.; Song, F. Displacement along the Haiyuan fault associated with the great 1920 Haiyuan, China, earthquake. Bull. Seismol. Soc. Am. 1987, 77, 117–131. [Google Scholar] [CrossRef]
- Guo, P.; Han, Z.; Gao, F.; Zhu, C.; Gai, H. A New Tectonic Model for the 1927 M8.0 Gulang Earthquake on the NE Tibetan Plateau. Tectonics 2020, 39, e2020TC006064. [Google Scholar] [CrossRef]
- Du, J.; Fu, B.; Guo, Q.; Shi, P.; Xue, G.; Xu, H. Segmentation and termination of the surface rupture zone produced by the 1932 Ms 7.6 Changma earthquake: New insights into the slip partitioning of the eastern Altyn Tagh fault system. Lithosphere 2019, 12, 19–39. [Google Scholar] [CrossRef]
- Pan, J.; Li, H.; CHEVALIER, M.-L.; Liu, D.; Li, C.; Liu, F.; Wu, Q.; Lu, H.; Jiao, L. Coseismic surtace rupture and seismogenic structure of the 2022 M6.9 Menyuan earthquake. Qinghai Province, China. Acta Geol. Sin. 2022, 96, 215–231. [Google Scholar] [CrossRef]
- Lasserre, C.; Morel, P.-H.; Gaudemer, Y.; Tapponnier, P.; Ryerson, F.J.; King, G.C.P.; Métivier, F.; Kasser, M.; Kashgarian, M.; Liu, B.; et al. Postglacial left slip rate and past occurrence of M ≥ 8 earthquakes on the Western Haiyuan Fault, Gansu, China. J. Geophys. Res. Solid Earth 1999, 104, 17633–17651. [Google Scholar] [CrossRef]
- Lasserre, C.; Gaudemer, Y.; Tapponnier, P.; Mériaux, A.-S.; Van der Woerd, J.; Daoyang, Y.; Ryerson, F.J.; Finkel, R.C.; Caffee, M.W. Fast late Pleistocene slip rate on the Leng Long Ling segment of the Haiyuan fault, Qinghai, China. J. Geophys. Res. Solid Earth 2002, 107, ETG 4-1–ETG 4-15. [Google Scholar] [CrossRef]
- Liu, J.; Ren, Z.; Zhang, H.; Li, C.; Zhang, Z.; Zheng, W.; Li, X.; Liu, C. Slip Rates Along the Laohushan Fault and Spatial Variation in Slip Rate Along the Haiyuan Fault Zone. Tectonics 2022, 41, e2021TC006992. [Google Scholar] [CrossRef]
- Daout, S.; Jolivet, R.; Lasserre, C.; Doin, M.-P.; Barbot, S.; Tapponnier, P.; Peltzer, G.; Socquet, A.; Sun, J. Along-strike variations of the partitioning of convergence across the Haiyuan fault system detected by InSAR. Geophys. J. Int. 2016, 205, 536–547. [Google Scholar] [CrossRef]
- Yuan, D.; Zhang, P.; Ge, W.; Liu, X.; Zhang, H.; Liang, M. Late Quaternary strike-slip features along the western segment of Haiyuan-Qilianshan fault, NE Tibetan Plateau. In Proceedings of the AGUFM, San Francisco, CA, USA, 15–19 December 2008; p. T33B–2057. [Google Scholar]
- Gao, F.; Zielke, O.; Han, Z.; Guo, P.; Gai, H.; Dai, C. Faulted landforms, slip-rate, and tectonic implications of the eastern Lenglongling fault, northeastern Tibetan Plateau. Tectonophysics 2022, 823, 229195. [Google Scholar] [CrossRef]
- Jiang, W.; Han, Z.; Guo, P.; Zhang, J.; Jiao, Q.; Kang, S.; Tian, Y. Slip rate and recurrence intervals of the east Lenglongling fault constrained by morphotectonics: Tectonic implications for the northeastern Tibetan Plateau. Lithosphere 2017, 9, 417–430. [Google Scholar] [CrossRef]
- Guo, P.; Han, Z.; Jiang, W.; Mao, Z. Holocene left-lateral sliprate of the Lenglongling fault, northeastern margin of the Tibetan Plateau. Seismol. Geol. 2017, 39, 323–341. [Google Scholar]
- Shao, Y.; Liu-Zeng, J.; Van der Woerd, J.; Klinger, Y.; Oskin, M.E.; Zhang, J.; Wang, P.; Wang, P.; Wang, W.; Yao, W. Late Pleistocene slip rate of the central Haiyuan fault constrained from optically stimulated luminescence, 14C, and cosmogenic isotope dating and high-resolution topography. GSA Bull. 2020, 133, 1347–1369. [Google Scholar] [CrossRef]
- Yuan, D.; Liu, B.; Lv, T.; He, W.; Liu, X.; Gan, W. Study on the segmentation in east segment of the northernoilianshan fault zone. Northwest. Seismol. J. 1998, 20, 27–34. [Google Scholar]
- Yao, W.; Liu-Zeng, J.; Oskin, M.E.; Wang, W.; Li, Z.; Prush, V.; Zhang, J.; Shao, Y.; Yuan, Z.; Klinger, Y. Reevaluation of the Late Pleistocene Slip Rate of the Haiyuan Fault Near Songshan, Gansu Province, China. J. Geophys. Res. Solid Earth 2019, 124, 5217–5240. [Google Scholar] [CrossRef]
- He, W.; Liu, B.; Lv, T.; Yuan, D.; Liu, J.; Liu, X. Study on the segmentation of Laohushan fault zone. Northwest. Seismol. J. 1994, 16, 66–72. [Google Scholar]
- Li, C.; Zhang, P.-z.; Yin, J.; Min, W. Late Quaternary left-lateral slip rate of the Haiyuan fault, northeastern margin of the Tibetan Plateau. Tectonics 2009, 28, TC5010. [Google Scholar] [CrossRef]
- Institute of Geology, S.S.B. Qilian Mountains Hexi Corridor Active Fault System; Seismological Press: Beijing, China, 1993. [Google Scholar]
- Westoby, M.J.; Brasington, J.; Glasser, N.F.; Hambrey, M.J.; Reynolds, J.M. ‘Structure-from-Motion’photogrammetry: A low-cost, effective tool for geoscience applications. Geomorphology 2012, 179, 300–314. [Google Scholar] [CrossRef]
- Cirillo, D.; Cerritelli, F.; Agostini, S.; Bello, S.; Lavecchia, G.; Brozzetti, F. Integrating post-processing kinematic (PPK)–structure-from-motion (SfM) with unmanned aerial vehicle (UAV) photogrammetry and digital field mapping for structural geological analysis. ISPRS Int. J. Geo-Inf. 2022, 11, 437. [Google Scholar] [CrossRef]
- Cirillo, D.; Zappa, M.; Tangari, A.C.; Brozzetti, F.; Ietto, F. Rockfall analysis from UAV-based photogrammetry and 3D models of a cliff area. Drones 2024, 8, 31. [Google Scholar] [CrossRef]
- Bi, H.; Zheng, W.; Ren, Z.; Zeng, J.; Yu, J. Using an unmanned aerial vehicle for topography mapping of the fault zone based on structure from motion photogrammetry. Int. J. Remote Sens. 2017, 38, 2495–2510. [Google Scholar] [CrossRef]
- Guo, P.; Han, Z.; Mao, Z.; Xie, Z.; Dong, S.; Gao, F.; Gai, H. Paleoearthquakes and Rupture Behavior of the Lenglongling Fault: Implications for Seismic Hazards of the Northeastern Margin of the Tibetan Plateau. J. Geophys. Res. Solid Earth 2019, 124, 1520–1543. [Google Scholar] [CrossRef]
- Yuan, Z.; Liu-Zeng, J.; Wang, W.; Weldon, R.J.; Oskin, M.E.; Shao, Y.; Li, Z.; Li, Z.; Wang, P.; Zhang, J. A 6000-year-long paleoseismologic record of earthquakes along the Xorkoli section of the Altyn Tagh fault, China. Earth Planet. Sci. Lett. 2018, 497, 193–203. [Google Scholar] [CrossRef]
- Zielke, O.; Arrowsmith, J.R.; Ludwig, L.G.; Akçiz, S.O. Slip in the 1857 and Earlier Large Earthquakes Along the Carrizo Plain, San Andreas Fault. Science 2010, 327, 1119–1122. [Google Scholar] [CrossRef]
- Zielke, O.; Arrowsmith, J.R.; Grant Ludwig, L.; Akciz, S.O. High-Resolution Topography-Derived Offsets along the 1857 Fort Tejon Earthquake Rupture Trace, San Andreas Fault. Bull. Seismol. Soc. Am. 2012, 102, 1135–1154. [Google Scholar] [CrossRef]
- Cowgill, E. Impact of riser reconstructions on estimation of secular variation in rates of strike–slip faulting: Revisiting the Cherchen River site along the Altyn Tagh Fault, NW China. Earth Planet. Sci. Lett. 2007, 254, 239–255. [Google Scholar] [CrossRef]
- Zhang, P.Z.; Molnar, P.; Xu, X. Late Quaternary and present-day rates of slip along the Altyn Tagh Fault, northern margin of the Tibetan Plateau. Tectonics 2007, 26, TC5010.5011–TC5010.5024. [Google Scholar] [CrossRef]
- King, G.C.P.; Stein, R.S.; Lin, J. Static stress changes and the triggering of earthquakes. Bull. Seismol. Soc. Am. 1994, 84, 935–953. [Google Scholar] [CrossRef]
- Han, z.; Dong, S.; Xie, F.; An, Y. Earthquake triggering by static stress: The 5 major earthquakes with M > 7 (1561~1920)in the northern section of South north seismic zone, China. Chin. J. Geophys. 2008, 51, 1776–1784. [Google Scholar]
- Lin, J.; Stein, R.S. Stress triggering in thrust and subduction earthquakes and stress interaction between the southern San Andreas and nearby thrust and strike-slip faults. J. Geophys. Res. Solid Earth 2004, 109, B02303. [Google Scholar] [CrossRef]
- Toda, S.; Stein, R.S.; Richards-Dinger, K.; Bozkurt, S.B. Forecasting the evolution of seismicity in southern California: Animations built on earthquake stress transfer. J. Geophys. Res. 2005, 110, B05S16. [Google Scholar] [CrossRef]
- Bendick, R.; Bilham, R.; Freymueller, J.; Larson, K.; Yin, G.J.N. Geodetic evidence for a low slip rate in the Altyn Tagh fault system. Nature 2000, 404, 69–72. [Google Scholar] [CrossRef] [PubMed]
- Zhang, P.; Shen, Z.; Wang, M.; Gan, W.; Burgmann, R.; Molnar, P.; Wang, Q.; Niu, Z.; Sun, J.; Wu, J. Continuous deformation of the Tibetan Plateau from global positioning system data. Geology 2004, 32, 809–812. [Google Scholar] [CrossRef]
- Jolivet, R.; Lasserre, C.; Doin, M.P.; Guillaso, S.; Peltzer, G.; Dailu, R.; Sun, J.; Shen, Z.K.; Xu, X. Shallow creep on the Haiyuan fault (Gansu, China) revealed by SAR interferometry. J. Geophys. Res. Solid Earth 2012, 117, B06401. [Google Scholar] [CrossRef]
- Chevalier, M.-L.; Ryerson, F.; Tapponnier, P.; Finkel, R.; Van Der Woerd, J.; Haibing, L.; Qing, L. Slip-rate measurements on the Karakorum fault may imply secular variations in fault motion. Science 2005, 307, 411–414. [Google Scholar] [CrossRef] [PubMed]
- Xu, X.; Wang, F.; Zheng, R.; Chen, W.; Ma, W.; Yu, G.; Chen, G.; Tapponnier, P.; Van Der Woerd, J.; Meriaux, A.S.; et al. Late Quaternary sinistral slip rate along the Altyn Tagh fault and its structural transformation model. Sci. China Ser. D Earth Sci. 2005, 48, 384–397. [Google Scholar] [CrossRef]
- Cowgill, E.; Gold, R.D.; Xuanhua, C.; Xiao-Feng, W.; Arrowsmith, J.R.; Southon, J.J.G. Low Quaternary slip rate reconciles geodetic and geologic rates along the Altyn Tagh fault, northwestern Tibet. Geology 2009, 37, 647–650. [Google Scholar] [CrossRef]
- Gold, R.D.; Cowgill, E.; Arrowsmith, J.R.; Chen, X.; Sharp, W.D.; Cooper, K.M.; Wang, X.-F.J.B. Faulted terrace risers place new constraints on the late Quaternary slip rate for the central Altyn Tagh fault, northwest Tibet. GSA Bull. 2011, 123, 958–978. [Google Scholar] [CrossRef]
- Yin, A.; Dang, Y.-Q.; Zhang, M.; Chen, X.-H.; McRivette, M.W. Cenozoic tectonic evolution of the Qaidam basin and its surrounding regions (Part 3): Structural geology, sedimentation, and regional tectonic reconstruction. GSA Bull. 2008, 120, 847–876. [Google Scholar] [CrossRef]
- Lanzhou Institute of Seismology, C.E.A. Changma Active Fault Zone; Seismogical Press: Beijing, China, 1992. [Google Scholar]
- He, W.; Yuan, D.; Ge, W.; Luo, H. Determination of the slip-rate of the Lenglongling Fault in the middle and eastern segments of the Qilian mountain active fault zone. Earthquake 2010, 30, 131–137. [Google Scholar]
- Zhang, P.; Peter, M.; Burchfiel, B.C.; Royden, L.; Wang, Y.; Deng, Q.; Song, F.; Zhang, W.; Jiao, D. Bounds on the Holocene slip rate of the Haiyuan fault, north-central China. Quat. Res. 1988, 30, 151–164. [Google Scholar]
- Burchfiel, B.; Zhang, P.; Wang, Y.; Zhang, W.; Song, F.; Deng, Q.; Molnar, P.; Royden, L. Geology of the Haiyuan fault zone, Ningxia-Hui Autonomous Region, China, and its relation to the evolution of the northeastern margin of the Tibetan Plateau. Tectonics 1991, 10, 1091–1110. [Google Scholar] [CrossRef]
- Zhang, Y.; Zheng, W.; Zhang, D.; Zhang, P.; Yuan, D.; Tian, Q.; Zhang, B.; Liang, S. Late Pleistocene left-lateral slip rates of the Gulang Fault and its tectonic implications in eastern Qilian Shan (NE Tibetan Plateau), China. Tectonophysics 2019, 756, 97–111. [Google Scholar] [CrossRef]
- Li, X.; Li, C.; Wesnousky, S.G.; Zhang, P.; Zheng, W.; Pierce, I.K.; Wang, X. Paleoseismology and slip rate of the western Tianjingshan fault of NE Tibet, China. J. Asian Earth Sci. 2017, 146, 304–316. [Google Scholar] [CrossRef]
- McGill, S.F.; Owen, L.A.; Weldon, R.J.; Kendrick, K.J.; Burgette, R.J. Latest Quaternary slip rates of the San Bernardino strand of the San Andreas fault, southern California, from Cajon Creek to Badger Canyon. Geosphere 2021, 17, 1354–1381. [Google Scholar] [CrossRef]
- Hatem, A.E.; Dolan, J.F.; Zinke, R.W.; Langridge, R.M.; McGuire, C.P.; Rhodes, E.J.; Brown, N.; Van Dissen, R.J. Holocene to latest Pleistocene incremental slip rates from the east-central Hope fault (Conway segment) at Hossack Station, Marlborough fault system, South Island, New Zealand: Towards a dated path of earthquake slip along a plate boundary fault. Geosphere 2020, 16, 1558–1584. [Google Scholar] [CrossRef]
- Li, K.; Tapponnier, P.; Xu, X.; Kang, W. The 2022, Ms 6.9 Menyuan earthquake: Surface rupture, Paleozoic suture re-activation, slip-rate and seismic gap along the Haiyuan fault system, NE Tibet. Earth Planet. Sci. Lett. 2023, 622, 118412. [Google Scholar] [CrossRef]
- Harris, R.A.; Archuleta, R.J.; Day, S.M. Fault steps and the dynamic rupture process: 2-D numerical simulations of a spontaneously propagating shear fracture. Geophys. Res. Lett. 1991, 18, 893–896. [Google Scholar] [CrossRef]
- Wesnousky, S.G. Predicting the endpoints of earthquake ruptures. Nature 2006, 444, 358–360. [Google Scholar] [CrossRef]
- Wesnousky, S.G. Displacement and Geometrical Characteristics of Earthquake Surface Ruptures: Issues and Implications for Seismic-Hazard Analysis and the Process of Earthquake Rupture. Bull. Seismol. Soc. Am. 2008, 98, 1609–1632. [Google Scholar] [CrossRef]
- Jia, K.; Zhou, S.; Zhuang, J.; Jiang, C. Stress Transfer Along the Western Boundary of the Bayan Har Block on the Tibet Plateau From the 2008 to 2020 Yutian Earthquake Sequence in China. Geophys. Res. Lett. 2021, 48, e2021GL094125. [Google Scholar] [CrossRef]
- Mancini, S.; Segou, M.; Werner, M.J.; Parsons, T. The Predictive Skills of Elastic Coulomb Rate-and-State Aftershock Forecasts during the 2019 Ridgecrest, California, Earthquake Sequence. Bull. Seismol. Soc. Am. 2020, 110, 1736–1751. [Google Scholar] [CrossRef]
- Toda, S.; Lin, J.; Meghraoui, M.; Stein, R.S. 12 May 2008 M = 7.9 Wenchuan, China, earthquake calculated to increase failure stress and seismicity rate on three major fault systems. Geophys. Res. Lett. 2008, 35, L17305. [Google Scholar] [CrossRef]
- Wu, D.; Qu, C.; Zhao, D.; Shan, X.; Chen, H. Slip Models of the 2016 and 2022 Menyuan, China, Earthquakes, Illustrating Regional Tectonic Structures. Remote Sens. 2022, 14, 6317. [Google Scholar] [CrossRef]
- Shi, F.; Xiong, x.; Wang, P.; Su, L.; Shan, B.; Zhu, L.; Shao, Z. Stress interaction between the two M > 6 earthquake since 20l6 andits implication on the seismie hazard along the Qilian-Haiyuan fault zone. Chin. J. Geophys. 2023, 66, 3230–3241. [Google Scholar]
- Wells, D.L.; Coppersmith, K.J. New empirical relationships among magnitude, rupture length, rupture width, rupture area, and surface displacement. Bull. Seismol. Soc. Am. 1994, 84, 974–1002. [Google Scholar] [CrossRef]
- Deng, Q.; Yu, G.; Ye, W. Relationship between earthquake magnitude and parameters of surface ruptures associated with historical earthquakes. Res. Act. Fault 1992, 2, 247–264. (In Chinese) [Google Scholar]
Disclaimer/Publisher’s Note: The statements, opinions and data contained in all publications are solely those of the individual author(s) and contributor(s) and not of MDPI and/or the editor(s). MDPI and/or the editor(s) disclaim responsibility for any injury to people or property resulting from any ideas, methods, instructions or products referred to in the content. |
© 2024 by the authors. Licensee MDPI, Basel, Switzerland. This article is an open access article distributed under the terms and conditions of the Creative Commons Attribution (CC BY) license (https://creativecommons.org/licenses/by/4.0/).