Technical Note

Disparity Refinement for Stereo Matching of High-Resolution Remote Sensing Images Based on GIS Data

1
Aerospace Information Research Institute, Chinese Academy of Sciences, Beijing 100094, China
2
Key Laboratory of Technology in Geo-Spatial Information Processing and Application System, Chinese Academy of Sciences, Beijing 100190, China
3
School of Electronic, Electrical and Communication Engineering, University of Chinese Academy of Sciences, Beijing 101408, China
*
Author to whom correspondence should be addressed.
Remote Sens. 2024, 16(3), 487; https://doi.org/10.3390/rs16030487
Submission received: 12 December 2023 / Revised: 11 January 2024 / Accepted: 23 January 2024 / Published: 26 January 2024

Abstract

:
With the emergence of the Smart City concept, the rapid advancement of urban three-dimensional (3D) reconstruction becomes imperative. While current developments in the field of 3D reconstruction have enabled the generation of 3D products such as Digital Surface Models (DSM), challenges persist in accurately reconstructing shadows, handling occlusions, and addressing low-texture areas in very-high-resolution remote sensing images. These challenges often lead to difficulties in calculating satisfactory disparity maps using existing stereo matching methods, thereby reducing the accuracy of 3D reconstruction. This issue is particularly pronounced in urban scenes, which contain numerous super high-rise and densely distributed buildings, resulting in large disparity values and occluded regions in stereo image pairs, and further leading to a large number of mismatched points in the obtained disparity map. In response to these challenges, this paper proposes a method to refine the disparity in urban scenes based on open-source GIS data. First, we register the GIS data with the epipolar-rectified images since there always exists unignorable geolocation errors between them. Specifically, buildings with different heights present different offsets in GIS data registering; thus, we perform multi-modal matching for each building and merge them into the final building mask. Subsequently, a two-layer optimization process is applied to the initial disparity map based on the building mask, encompassing both global and local optimization. Finally, we perform a post-correction on the building facades to obtain the final refined disparity map that can be employed for high-precision 3D reconstruction. Experimental results on SuperView-1, GaoFen-7, and GeoEye satellite images show that the proposed method has the ability to correct the occluded and mismatched areas in the initial disparity map generated by both hand-crafted and deep-learning stereo matching methods. The DSM generated by the refined disparity reduces the average height error from 2.2 m to 1.6 m, which demonstrates superior performance compared with other disparity refinement methods. Furthermore, the proposed method is able to improve the integrity of the target structure and present steeper building facades and complete roofs, which are conducive to subsequent 3D model generation.

1. Introduction

With the rapid development of remote sensing technology, large numbers of very-high-resolution (VHR) satellite sensors make it possible to automatically reconstruct three-dimensional (3D) surface models with sub-meter resolution, which are widely applied to city planning, disaster monitoring, and other fields. Nevertheless, the demands for the accuracy of 3D models across diverse applications are continually increasing. Consequently, the efficient reconstruction of high-precision 3D models has become a research hotspot.
In the process of 3D reconstruction, stereo matching is one of the critical steps, which refers to pixel-by-pixel matching between the rectified image pair to calculate a disparity map. Then, according to the disparity map and the stereoscopic relationship between the image pair, the depth of each pixel in the image can be restored. Therefore, the accuracy of the stereo matching algorithm results significantly influences the quality of 3D reconstruction. In the field of computer vision, scholars have extensively researched stereo matching algorithms. These stereo matching methods can be divided into two categories: traditional stereo matching methods [1,2,3,4] and deep learning-based stereo matching methods [5,6,7,8,9]. However, in practical applications, mismatched pixels caused by occlusion areas or low-texture areas inevitably appear in the disparity maps calculated by various stereo matching methods. Thus, many scholars have delved into researching disparity refinement methods to correct the values of mismatched points in the disparity map caused by occlusion and other issues. The majority of existing disparity refinement methods follow a three-step strategy: detection, filling, and filtering. Among them, left–right consistency checking (LRC) is a widely employed technique for outlier detection [10]. Additionally, Jang and Ho [11] proposed an energy function to identify occlusion areas and classify them into leftmost occlusions and inner occlusions. Banno and Ikeuchi [12] labeled pixels failing the LRC as low confidence and introduced directional anisotropic diffusion to refine them. Huang and Zhang [13] proposed a fast refinement method including belief aggregation for outlier detection and belief propagation for padding. Mei et al. [14] detected outliers and classified all outliers into occlusion and mismatching, and subsequently performed corresponding interpolation on these outliers through iterative region voting. Ma et al. [15] utilized bilateral filtering and weighted median filtering to refine disparity. Yan et al. [16] conducted plane and inclined plane fitting of disparity based on the superpixel segmentation results of color images to achieve the correction of outliers in the disparity map. However, this method requires the input initial disparity to meet specific constraints and is susceptible to the input color image.
Although scholars in the field of computer vision have delved into various methods for refining disparity maps, these methods encounter challenges when large occlusion areas exist in the images. Precisely refining abnormal matching points caused by occlusion becomes a struggle, and, in certain instances, the methods may inadvertently introduce cumulative errors. Consequently, rectifying disparity calculation errors induced by occlusion remains a significant challenge in computer vision. In the context of remote sensing images, this challenge becomes even more pronounced. The complexity of covered scenes in remote sensing images exacerbates occlusion and mismatch situations, which places higher requirements on the performance of disparity refinement methods in processing occluded areas. Furthermore, in contrast to natural images in computer vision, remote sensing images exhibit changeable and complex imaging conditions. Additionally, there are problems in remote sensing images such as large differences in target scales, inconsistent grayscale of the same target between different images, and susceptibility to interference from solar shadows. As a result, traditional disparity refinement methods in the field of computer vision often yield unsatisfactory results when applied to remote sensing images, particularly in urban areas characterized by substantial differences in target height and densely distributed buildings, as shown in Figure 1. Figure 1 illustrates an example of 3D reconstruction in an urban scene. Among them, the yellow area in Figure 1a represents the building facades, corresponding to the covered area in Figure 1b. Consequently, pixels in these facades struggle to find correct corresponding pixels during stereo matching, leading to mismatched points in the calculated disparity map, as highlighted in the red box in Figure 1c. In the generating of DSM, these pixels are interpolated to abnormally high elevation values, as shown in the white box in Figure 1d. In Figure 1b, the building facades are obscured in the left image, inducing a slope in the DSM generated with the left image as the reference, as shown in the blue box in Figure 1d. Therefore, when there are objects with large disparity values in the image pair (as illustrated in Figure 1c, where the disparity value difference between the building point and the ground point can reach 200 pixels), obvious building facades and occlusion areas emerge, resulting in numerous mismatched points in the disparity map. Eventually, problems such as inclined building facades, unclear edges of building roofs, and irregular building shapes are present in the generated DSM.
In addition, with the emergence of concepts such as Smart City, the demands for the accuracy of three-dimensional urban reconstruction in urban planning and other fields have increased sharply. Buildings, serving as pivotal components, hold the utmost significance in the construction of the Smart City. The precise geometric structure and topological information of building models play a good supporting role in urban infrastructure planning and Smart City construction [17]. Therefore, the accurate extraction of 3D building models has become a focal point of attention due to its potential to significantly enhance Smart City development. Most of the existing 3D building model extraction methods rely on aerial photography and laser point cloud data, which usually require substantial human resources and incur high costs. In contrast, 3D reconstruction of buildings based on VHR satellite images presents an opportunity for substantial cost reduction, addressing an urgent need. Nevertheless, as mentioned earlier, urban scenes captured in remote sensing images may encounter significant occlusion and mismatching challenges arising from buildings. This has prompted scholars to conduct in-depth research on reconstruction methods specifically tailored for building targets in remote sensing images. Huang et al. [18] utilized ZY-3 satellite images and combined them with the building height data provided by A-map, proposing a multi-view, multi-spectral, and multi-objective neural network method to extract building footprints and heights. Qi et al. [19] estimated building height based on the building shadow in Google Earth images, but this method imposes relatively high requirements on building height, satellite imaging angle, solar altitude angle, and azimuth angle. Liu et al. [20] employed the random forest method to extract building footprints from images and combined it with DSM to estimate building heights. However, the accuracy of extracting building footprints via the random forest method is relatively low, and the building height estimation is susceptible to ground elevation value in DSM. Wang et al. [21] proposed a method that initially extracts building footprints from GF-7 satellite images using a multi-stage U-Net and then derives building heights based on the DSM generated from the images. However, the effectiveness of this method relies on the accuracy of the DSM generated from the images. In situations where the satellite zenith angle is large, resulting in a large occlusion area and prominent building facades, incorrect elevation values around building footprints in the DSM may occur, consequently leading to errors in building height estimation.
In general, although serious target occlusion and mismatch problems are prevalent in stereo matching of remote sensing images, the corresponding disparity refinement methods for stereo matching are rarely studied but focus on refining the results generated in subsequent steps. For building targets, current refined reconstruction methods mostly include two categories: shadow-based height estimation methods and DSM-based height extraction methods. However, the effectiveness of height extraction methods based on building shadows is significantly compromised by the considerable variability in shadows under different imaging conditions in remote sensing images. For building reconstruction methods relying on DSM, their accuracy is susceptible to the satellite observation angle and building height, especially the severe occlusion of super high-rise buildings in remote sensing images. Therefore, achieving satisfactory results with existing building reconstruction methods becomes challenging in the presence of super high-rise building targets. Moreover, the majority of these methods only focus on reconstructing building targets and ignore other objects.
Therefore, in order to achieve the refined reconstruction of super high-rise buildings while preserving other ground objects, we employ the disparity refinement process based on the stereo matching results. Among them, in the building extraction step, we introduce GIS data for assistance. The currently available two-dimensional GIS data contain abundant ground object information, such as building footprints, and have been applied in various fields such as earthquake disaster detection [22]. By utilizing the building footprint information from GIS data to replace building detection in remote sensing images, the impact of shadows and satellite observation angles on reconstruction can be reduced, and the integrity and regularity of building structures can also be improved.
Based on the above analysis, we propose a remote sensing image disparity refinement method to achieve accurate reconstruction of super high-rise building targets by combining GIS data information. First, to extract building targets from images, we propose a precise building mask extraction method from GIS building vectors. By employing multi-modal matching of GIS building vectors with building roofs, the building roof mask of the image is calculated, and the building footprint and facade mask are further determined through offset estimation. In comparison to traditional methods of building extraction from images, the proposed building mask extraction method can obtain more accurate prior shape information of buildings from GIS vectors and therefore demonstrates higher accuracy. Subsequently, according to the extracted building mask, the proposed method employs a two-layer optimization process based on Markov Random Fields and RANSAC fitting, combined with post-correction of the disparity in the region of interest, through which the final refined disparity is obtained. The proposed method effectively solves mismatched points arising from super high-rise building facades and occlusions in the disparity map, consequently enhancing the accuracy of DSM generation.

2. Materials and Methods

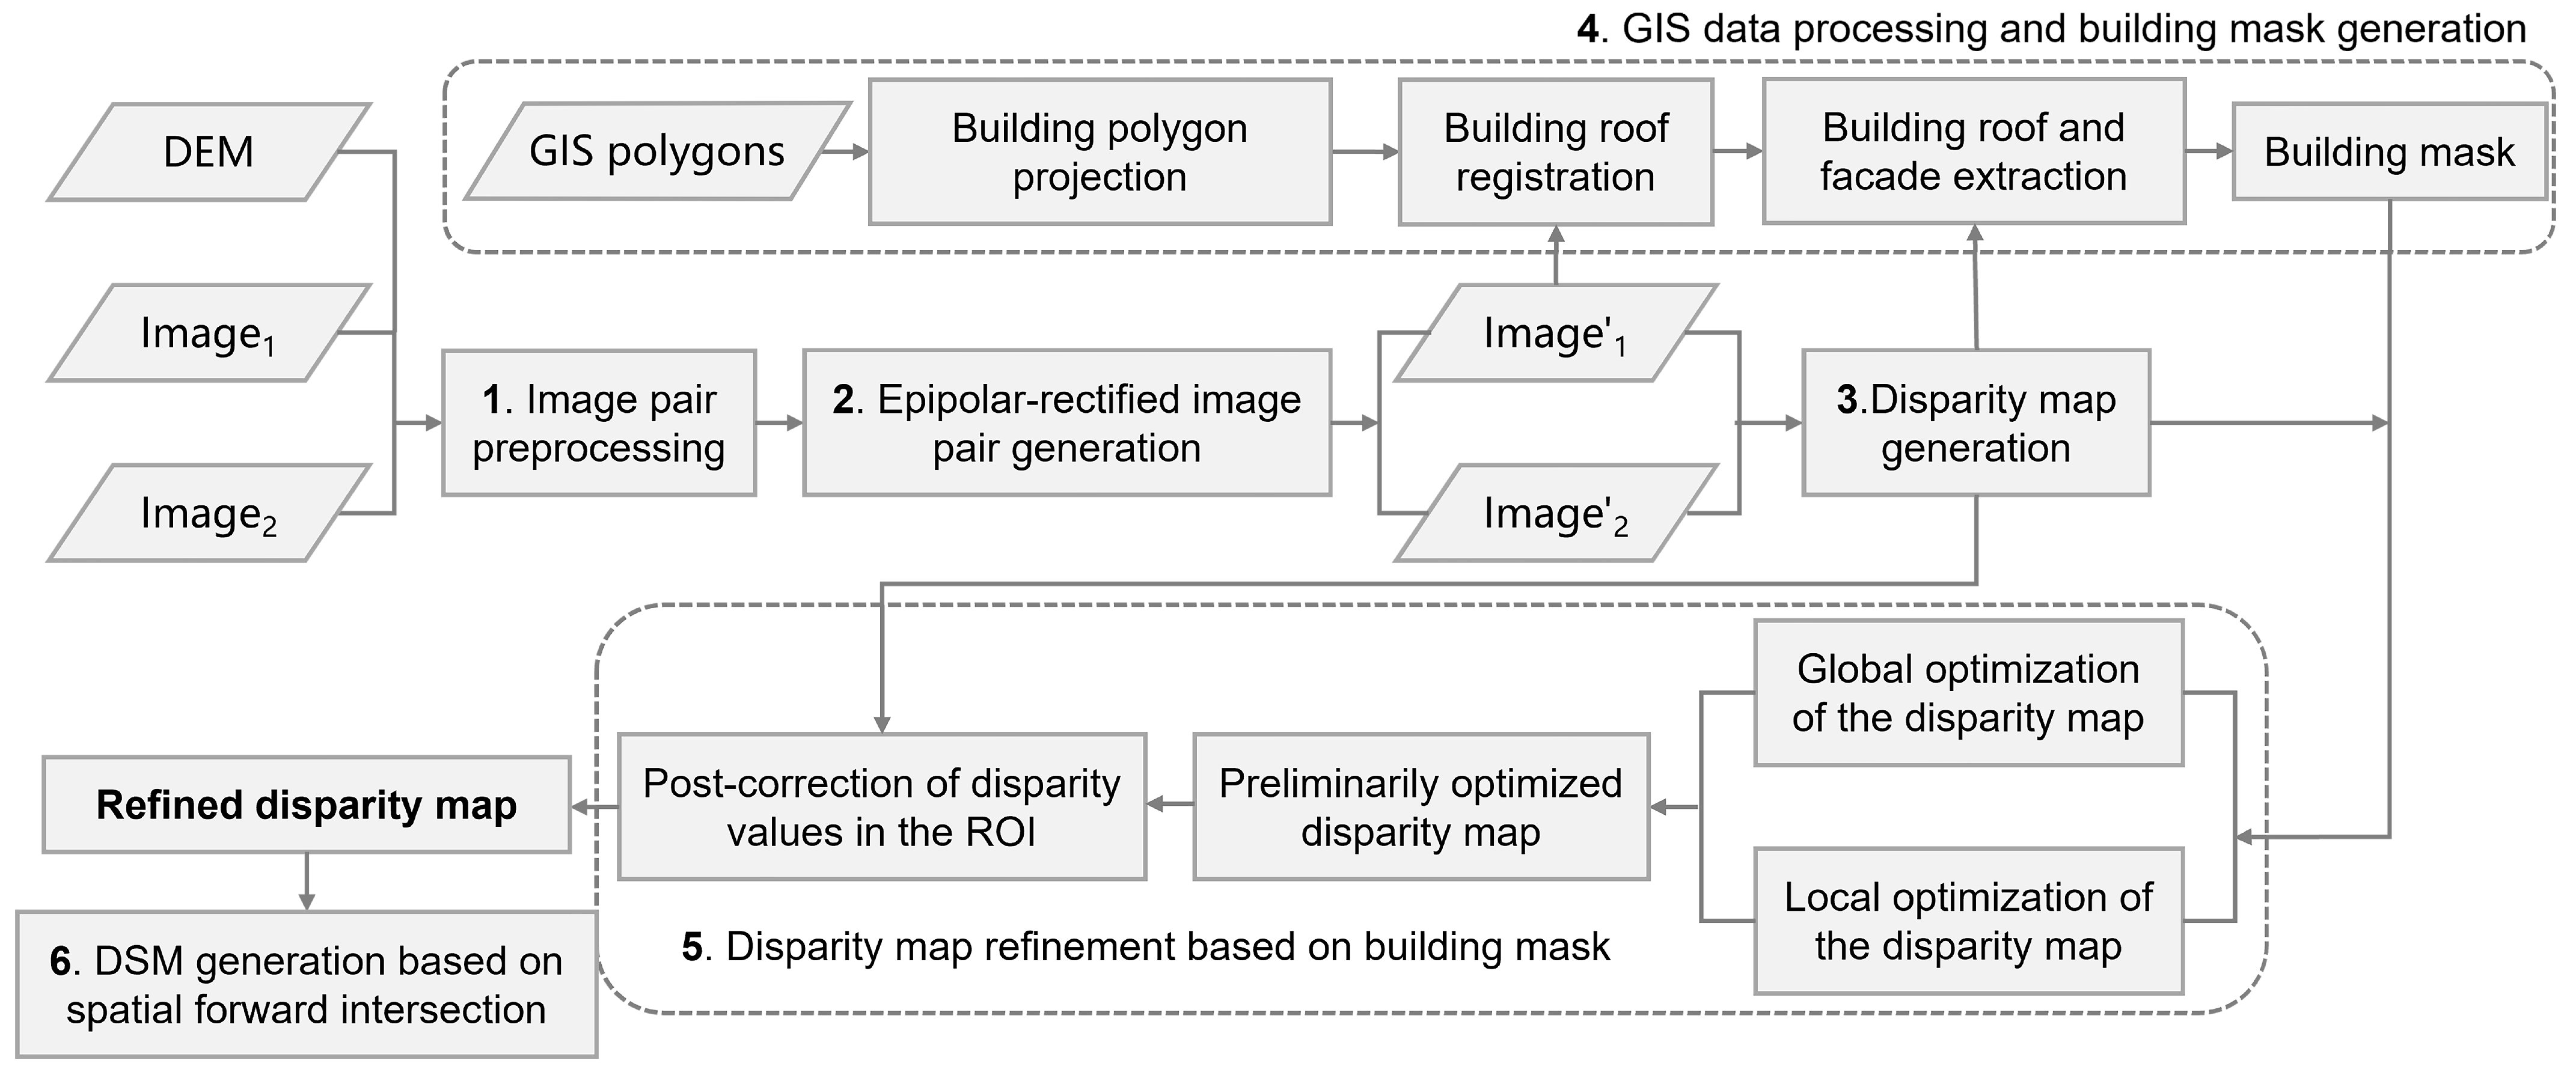
This paper proposes a stereo matching disparity refinement method for remote sensing images. With the assistance of GIS vector data, the disparity values of buildings are refined, laying the foundation for generating high-precision DSM. The inputs for this disparity refinement method encompass an optical remote sensing image pair, publicly available DEM data, and open-source GIS data. The output is the disparity map refined for the disparity values of building targets. Figure 2 illustrates the overall flow of DSM generation using the proposed disparity refinement method. The entire processing flow roughly includes 5 steps of the proposed disparity refinement method and the final DSM generation step. Among them, steps 1–3 are described in Section 2.1, step 4 is described in Section 2.2, and steps 5–6 are elaborated in Section 2.3.

2.1. Image Pair Correction Processing and Initial Disparity Map Generation

First, before all processes, it is necessary to preprocess the remote sensing image pair. We employ the Rational Function Model (RFM) to establish the relationship between object space and image space. The RFM is a generalized sensor model that can replace the linear array pushbroom camera imaging model and Synthetic Aperture Radar (SAR) image imaging model [23]. This model makes full use of the auxiliary parameters of satellite images, determining the model coefficients through a fitting process against existing rigorous geometric models. In practical applications, RFM is usually represented by Rational Polynomial Coefficients (RPC). Notably, there are errors from ephemeris and satellite drift in the obtained RPC, which need to be eliminated by bundle adjustment [24].
Subsequently, epipolar rectification is performed on the preprocessed image pair. This process effectively reduces the search range for matching points between image pairs from 2D to 1D, thereby significantly enhancing the accuracy and efficiency of stereo matching. However, for remote image pairs lacking a strict stereoscopic relationship, traditional epipolar constraints become inapplicable [25]. To overcome this challenge, we employ the approximate epipolar resampling method based on the local elevation surface to rectify the image pair and obtain the epipolar-rectified image pair [26]. All subsequent processing is conducted on the epipolar-rectified images.
After obtaining the epipolar-rectified images, we calculate the initial disparity map through stereo matching. In the selection of the stereo matching method, we employ both an optical flow method designed for large disparity [27] and a deep-learning-based stereo matching0 network [28] to calculate the disparity map.

2.2. GIS Vector Data Processing and Building Mask Generation

The GIS vector data we obtained contain abundant building footprint information, neatly organized within a shapefile, utilizing polygonal surface vectors. From the shapefile, we can extract the latitude and longitude coordinates of each vertex constituting the building footprint polygons. However, owing to inherent geolocation errors in GIS data and the absence of precise building heights, the building footprints cannot be accurately mapped directly into remote sensing image space using RPC. Instead, there is an offset between the mapped footprint and the true location of the building in the image. Therefore, it is necessary to register the footprints with the buildings in the remote sensing images. Traditional methods of registering building vectors and images often rely on the affine transformation model and apply a unified transformation across all vectors. However, when projecting vectors corresponding to buildings of varying heights onto epipolar-rectified remote sensing images, the offsets from their true positions differ, causing a uniform vector application, which is impractical. To address this, we propose a monolithic model-oriented registration algorithm designed for building footprints and remote sensing images. The specific implementation steps are as follows:
1.
Building polygon projection. Initially, we extract each building vector within the geographical scope of the processing area from the GIS data, encompassing coordinates of vertex and building size. Subsequently, utilizing the DEM, refined RPCs, and the parameters of epipolar rectification, we transform all individual building polygons into the image space of the epipolar-rectified image. Thus, we obtain the initial building mask of the epipolar-rectified image, denoted as b u i l d i n g s h p .
2.
Multi-modal and multi-building matching. For each building mask, we employ the multi-modal matching algorithm [29] to align the mask with the corresponding building roof in the epipolar-rectified image, and the registered building mask is denoted as b u i l d i n g r o o f . Moreover, to enhance the stability of the matching results, we crop the epipolar-rectified image based on the position of the building mask in b u i l d i n g s h p , preserving solely the image content around the building target to mitigate the interference of external information in the image. Then, we check the registration accuracy after the building mask is rectified using the matching offset obtained from the multi-modal matching method. An example is illustrated in Figure 3. As shown in Figure 3a, noticeable offsets exist between the original building polygons and their corresponding building roofs in the image, and the offsets of each polygon are inconsistent. Moreover, these offsets may even exceed 100 pixels, posing significant challenges for the matching work. After registration using our method, the polygons are adjusted to align with the positions of the building roofs, as shown in Figure 3b.
3.
Building facade extraction. Based on the registered building mask and RPCs, we calculate the offset of each building footprint relative to the roof in the image by utilizing the disparity values of the building roof and surrounding ground points from the initial disparity map. The process includes the following steps: (1) obtain the disparity values for the roof and ground, respectively; (2) utilize RPCs and the disparity values obtained in step (1) to estimate the roof height ( h 1 ) and ground height ( h 2 ); and (3) by giving different height values ( h 1 and h 2 ) to the same point in object space, calculate the offset of the building footprint relative to the roof. As a result, we obtain the building footprint mask in the epipolar-rectified image, denoted as b u i l d i n g f o o t . By analyzing the offset between b u i l d i n g f o o t and b u i l d i n g r o o f , we obtain the building facade mask in the image, denoted as b u i l d i n g f a c a d e . It is essential to highlight that in this process, to mitigate the adverse impact of unmatched points on the offset calculation of the building footprint relative to the roof, we only consider pixels with high disparity confidence for the calculation. Hence, the confidence level of each pixel disparity value needs to be determined in advance.
4.
Disparity-based building mask segmentation. Given that open-source building vectors provide only basic footprint shape information and are inadequate for the accurate reconstruction of buildings with complex roof structures, we perform a secondary segmentation on the building mask. We employ a statistical region merging-based segmentation method to extract multiple level height planes within each b u i l d i n g r o o f based on the disparity distribution within the roof superpixel [30]. For any two regions, R 1 and R 2 , the merging criterion is defined as follows:
P ( R , R ) = true , if | R ¯ R ¯ | b 2 ( R ) + b 2 ( R ) false , otherwise ,
b ( R ) = g ( 1 / ( 2 Q | R | ) ) ln ( | R | R | | / δ ) ,
where δ = 1 / ( 6 N 2 ) . | R | represents the number of pixels in the image area R. g denotes the gray level of the input data(usually set to 256). Q is employed to evaluate the possibility of merging two regions. This parameter plays a crucial role in controlling the number of regions in the segmentation result. Given that the data input in this paper is confined to a narrow range, primarily encompassing the roof, the scenario is relatively simple. In practical applications, we set Q to a smaller value, specifically 20. If P is true, the two regions will be merged, otherwise, they will remain separate. Figure 4 gives an example of disparity-based building mask segmentation. The building roofs illustrated in Figure 4a,d exhibit complex multi-layer structures. However, the existing building vector data merely label them into two polygons, as shown in Figure 4b,e. Through the secondary segmentation of the building roof vector based on disparity distribution, we obtain the roof mask that more accurately represents the building height, as shown in Figure 4c,f.
5.
Building mask generation. Finally, by merging b u i l d i n g f a c a d e corresponding to each building vector with the secondary segmented b u i l d i n g r o o f , we derive the mask corresponding to all buildings within the range of the epipolar-rectified image.
Figure 3. Schematic diagram of the position of building polygon vectors in the epipolar-rectified image. ( x , y ) represents the image coordinates of the point. c o l o f f s e t and r o w o f f s e t represent the offsets of the x coordinate and y coordinate, respectively. (a) The raw GIS building polygon vectors and the image. (b) The registered GIS building polygon vectors and the image.
Remotesensing 16 00487 g003
Figure 4. The secondary segmentation results of the registered building roof vectors. (a) Image of building-1. (b) Registered roof mask of building-1. (c) Roof mask of building-1 after secondary segmentation. (d) Image of building-2. (e) Registered roof mask of building-2. (f) Roof mask of building-2 after secondary segmentation.
Remotesensing 16 00487 g004

2.3. Disparity Map Refinement Based on Building Mask

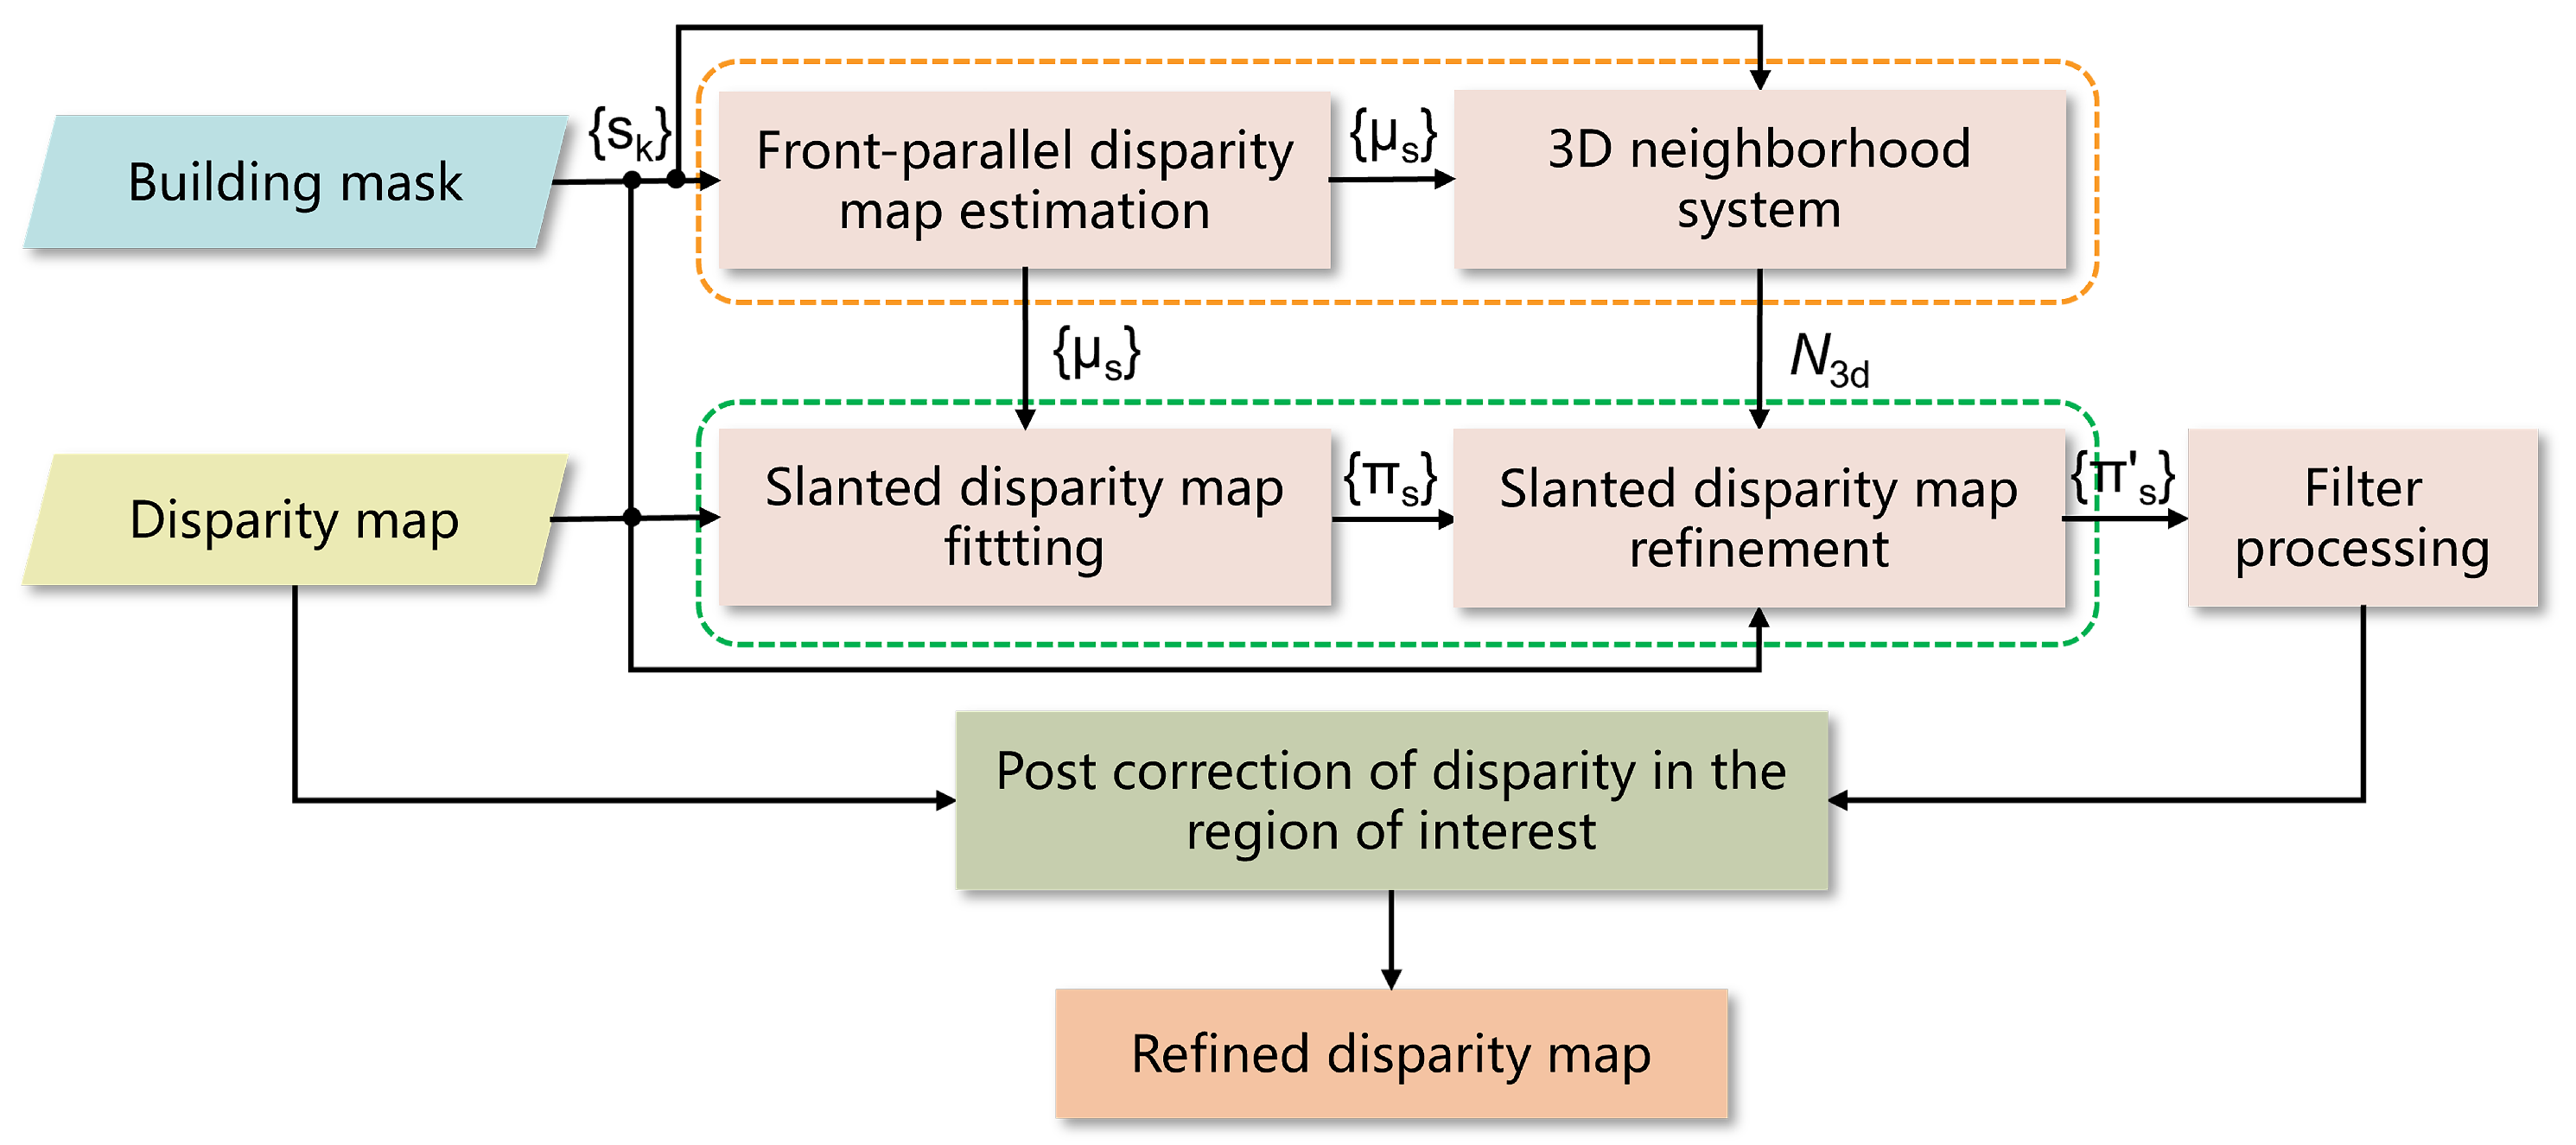
Utilizing the building mask acquired in the previous step, we perform refinement on the initial disparity map. This refinement process includes a preliminary segmenta-based disparity refinement (SDR) [16] and post-correction of disparity values in the region of interest. It should be emphasized that compared with the original SDR method, we employ the building mask obtained in Section 2.2 instead of the image superpixel data to guide the correction of the disparity map. The overall flowchart is shown in Figure 5. The SDR method includes two layers of optimization. The first layer is a global optimization layer that estimates the ground-parallel disparity planes through Markov Random Field (MRF) [31], depicted by the orange dashed box in Figure 5. The second layer is the local optimization layer, utilizing the RANSAC fitting method [32,33] to estimate the disparity planes tilted compared to the ground, as illustrated in the green dotted box in Figure 5.
In the first global optimization layer, the disparity distribution within superpixel s is initially modeled as a normal distribution:
Norm d μ s , σ s = 1 2 π σ s exp d μ s 2 2 σ s 2 ,
where d represents the disparity, and μ s and σ s represent disparity mean and variance of superpixel s, respectively. Subsequently, based on the principles of MRF, the superpixels within the input image are transformed into graph nodes, and the following energy function is obtained:
E ( μ ) = s Ω ϕ s ( μ s ) + λ ( s , t ) N ψ s t ( μ s , μ t ) ,
where ϕ s ( μ s ) represents the data item, ψ s t ( μ s , μ t ) is the smoothing term, λ is a parameter that balances the influence of the smoothness term, N represents the set of neighboring superpixels, and Ω is the set of superpixels. By minimizing the total energy function (Equation (4)), the disparity of each superpixel can be determined. Next, adjacent superpixels with the same disparity are merged into a new superpixel; thereby, we obtain several parallel disparity planes. Finally, by comparing the differences in disparity values between different superpixels, the 3D neighborhood relationship between superpixels is calculated. At this point, the first global optimization layer of disparity is completed.
The second-layer disparity optimization process consists of two steps: RANSAC slanted plane fitting and subsequent slanted plane refinement. Initially, based on the initial disparity map, the RANSAC fitting method is applied to establish the slanted plane model, denoted as π s = ( a s , b s , c s ) , for each superpixel s. Since there is an assumption that the disparity distribution within each superpixel follows a normal distribution, the effective distribution must conform to the unimodal distribution with a continuous disparity domain. To enhance robustness, the density distribution is used to replace the disparity distribution. The disparity density of a given disparity value d within the superpixel s is defined as follows:
ρ s ( d ) = x s F ( | d d ( x ) | L ) ,
where L is the width of the histogram bin, x represents each pixel within superpixel s, and F ( · ) is a function of condition, defined as
F · = 0 , if · is false 1 , if · is true .
According to the input initial disparity, the RANSAC method is employed to fit the prior average disparity μ s of each superpixel. The resulting fit is then compared with the disparity density distribution within the superpixel to ensure the success of the RANSAC fitting. Subsequently, the refinement of the slant disparity plane continues after the RANSAC plane fitting. The initial plane π s , calculated earlier through plane fitting, is individually refitted for each superpixel s. However, the effectiveness in regions lacking texture or existing occlusion is typically unsatisfying. To solve this, π s undergoes further refinement based on probability, utilizing the prior information from the local 3D neighborhood of superpixel s. For a pair of superpixels ( s , t ) N , if their mean disparities are similar, they are considered 3D neighbors, expressed as ( s , t ) N 3 d ; otherwise, they are not 3D neighbors, represented as ( s , t ) N 3 d . During this process, only prior information from the 3D neighborhood of superpixel s is taken into account. Consequently, for a superpixel t belonging to the 3D neighborhood of superpixel s (denoted as t N 3 d ( s ) ), the posterior probability that the disparity plane is π t is expressed as
P r ( π t | p 1 , , N s ) = P r ( p 1 , , N s | π t ) P r ( π t ) t N 3 d ( s ) P r ( p 1 , , N s | π t ) P r ( π t ) ,
where p 1 , , N s = p i | p i = ( u i , v i , d i ) , i = 1 , . . . , N s are the observations of superpixel s. Then, the weighted least squares method is applied to estimate the slant plane for each superpixel to generate the second-layer optimized disparity map. Subsequently, following the filtering of the optimized disparity map, the preliminary refined disparity map is obtained.
In the preceding step, the disparity values of the building roofs have been refined. To further diminish the possibility of disparity-induced errors in subsequent DSM generation due to mismatched points, a post-correction process is implemented on the building facades disparity values. For each building, we employ the ground disparity value around the building calculated in Section 2.2 to replace the disparity values of pixels within the building facade mask b u i l d i n g f a c a d e . At last, we obtain the refined disparity map, utilizing the disparity refinement method assisted by GIS building vector data to facilitate subsequent DSM generation.

2.4. Study Area and Data Preparation

In this subsection, we provide a detailed introduction to the study area and remote sensing images, GIS vectors, and other data used in this paper.
Imagery and study area. The proposed method mainly utilizes four pairs of in-track stereo VHR remote sensing images for experiments. Specifically, these consist of two pairs of SuperView-1 (SV1) satellite images, one pair of GeoEye satellite images, and one pair of Gaofen-7 (GF7) satellite images. The corresponding coverage areas encompass Hawaii, San Diego, Orange County, and Omaha in the United States. These study areas are strategically chosen from urban scenes, ensuring the presence of numerous building targets, to evaluate the effectiveness of the proposed method. And there are abundant GIS data and laser point cloud data in these areas. Additionally, for parallel preprocessing, the entire image is partitioned into several blocks, each with a size of 2048 × 2048 pixels.
GIS vector data preparation. The GIS data utilized in this paper are sourced from the OpenStreetMap (OSM) database, a globally renowned open geographic data platform. Users on the OSM platform have the flexibility to create, edit, download, and use data from the database [34]. This extensive database encompasses various point, line, and surface vectors, including features like roads, rivers, buildings, and more. Specifically, we employ the building polygon vectors within the OSM database to assist in the refinement of disparity. After processing, the OSM vector data can be converted into corresponding raster vectors for subsequent analysis.
Initial disparity calculation. The commonly used stereo matching method at present is the traditional semi-global matching (SGM). Although this method is extensively applied in traditional images, it falls short of achieving satisfactory results under conditions of large disparity. In remote sensing images, complex ground objects, particularly super high-rise buildings, often result in significant disparity differences. Even after epipolar rectification, it is difficult to maintain the parallax disparity within a small range for all objects in the field of view. Considering the unique challenges of remote sensing images, we employ the large displacement optical flow (LDOF) estimation method for stereo matching, which is adept at handling image pairs with large disparity [27]. In addition to this traditional stereo matching method, we include experiments with the CFNet stereo matching method based on deep learning to demonstrate the general applicability of our method [28]. This method achieves stereo matching by integrating the pyramid feature extraction network, fusion cost volume, and cascade cost volume.
Lidar data processing. Due to lacking the ground truth data of disparity, in order to objectively evaluate the disparity refinement results, we utilize the accuracy of the DSM generated from the disparity as the evaluation metric. To establish an accurate ground truth, we acquire publicly available laser point cloud data, processing the data to derive the ground truth of surface elevation. This point cloud data are sourced from the 3D Elevation Program (3DEP) project developed by the United States Geological Survey [35].

3. Results

3.1. Comparison of Disparity Refinement Experimental Results

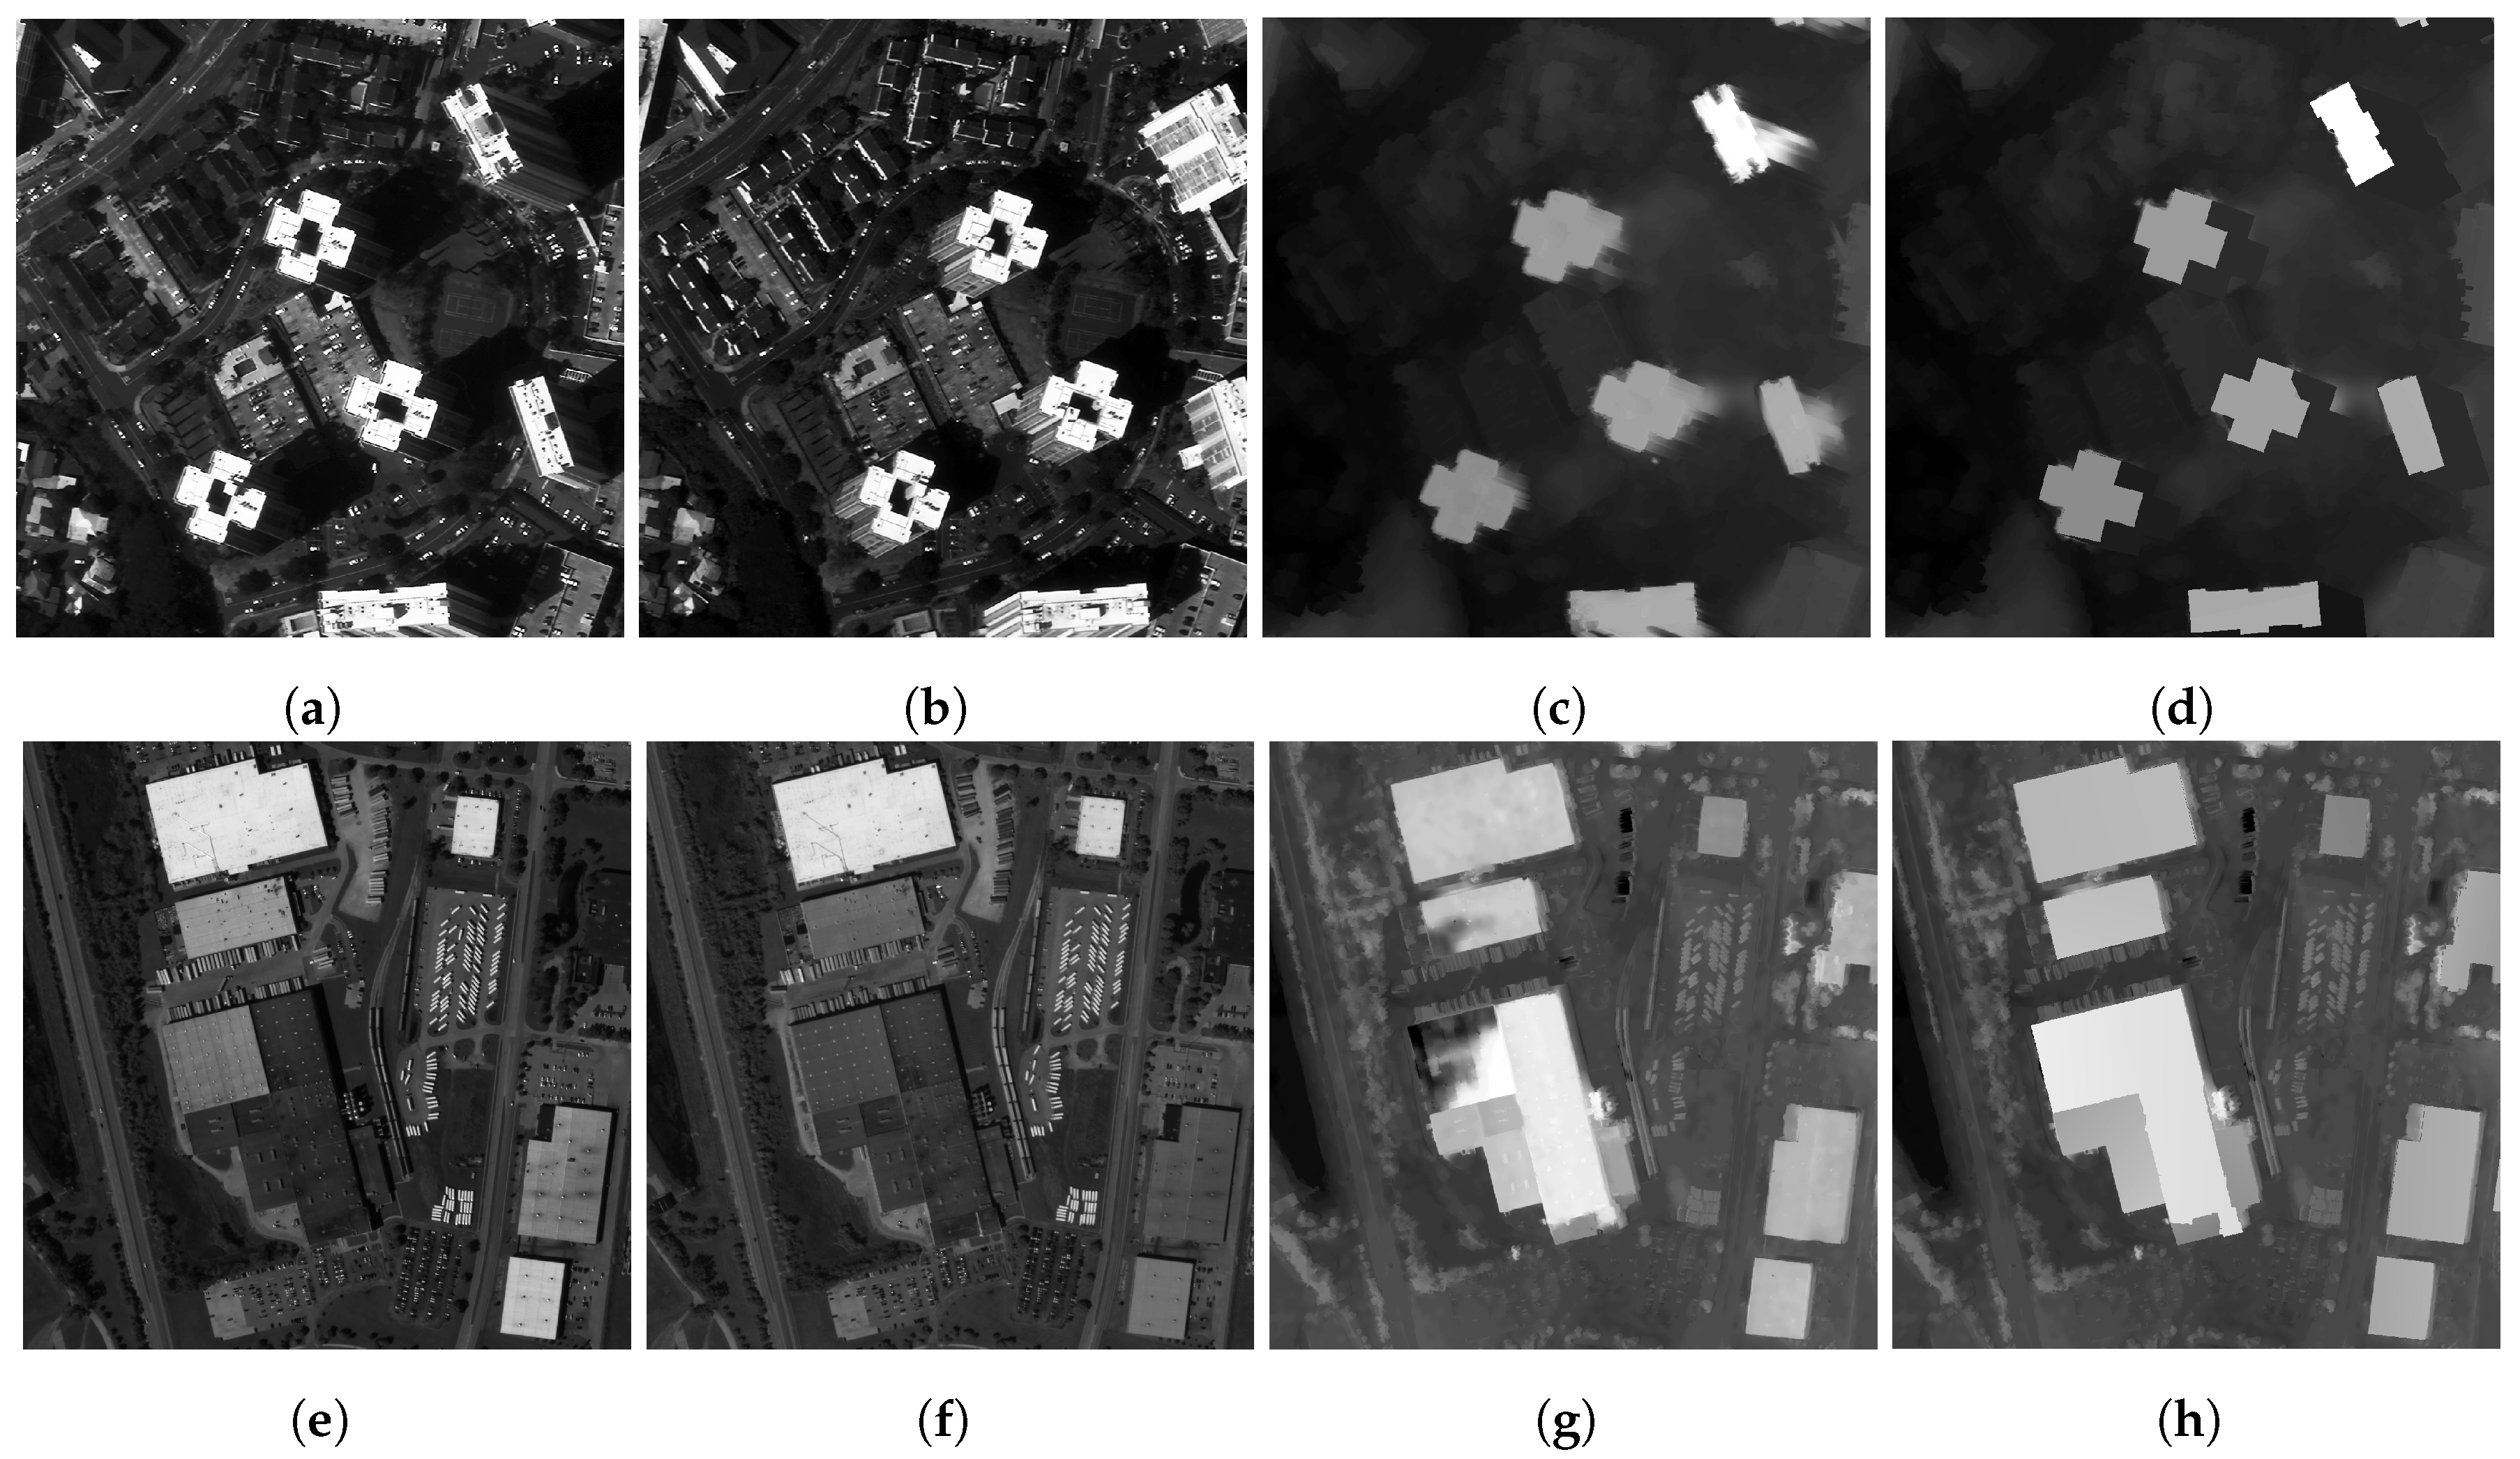
We first perform the image preprocessing and epipolar rectification on the two image pairs separately. Subsequently, we utilize the LDOF method to acquire the initial disparity maps for each image pair. Following this, we use GIS building vector data to refine the disparity maps. We conducted experiments on the four pairs of remote sensing images detailed in Section 2.4. Due to the absence of true disparity values for accuracy evaluation, in this subsection, we solely assess the visual effect of the disparity refinement results. In the next subsection, a comprehensive and objective evaluation of the disparity refinement effect on DSM elevation accuracy will be conducted. Some of the experimental results are shown in Figure 6. The first row of Figure 6 includes several super high-rise buildings, each exceeding 60 m in height, with the tallest building being over 100 m. These tall buildings present a significant challenge to stereo matching as their disparity values in the image pair can extend beyond 200 pixels. As illustrated in Figure 6b, the disparity values corresponding to the building facades in the left image are inaccurately computed. After disparity refinement, the shapes of the building roofs are more regular, and the disparity values of mismatched points on the building facades are corrected to be approximately equal to the disparity values of the ground points, as shown in Figure 6d. This refinement process significantly contributes to the generation of a more accurate DSM.
In addition to tall buildings, our method effectively refines the disparity of short buildings as well. In the initial disparity map depicted in Figure 6g, certain factors, such as significant grayscale variations of identical targets in the image and limited contrast with the background, lead to obvious mismatched points within the building. These issues resulted in the building’s structural details being lost. However, through the application of our method to refine the disparity map, the building’s structure is successfully restored. Additionally, by performing the secondary segmentation of the building vector, our method preserves the multi-level structure of the building roof. The introduced disparity confidence also proves beneficial in handling large areas of disparity abnormality, as evident in anomalies inside the building depicted in Figure 6g.

3.2. Comparison of the Accuracy of DSM Generated by Different Methods

In this subsection, we conduct a comprehensive evaluation of the DSM elevation accuracy generated based on stereo matching disparity results. Initial disparity maps are computed for the epipolar-rectified image pairs using both the LDOF method [27] and the CFNet method [28]. Subsequently, the initial disparity maps undergo refinement. Alongside our method, we incorporate the original SDR method as a comparative algorithm, which is specifically designed to handle occlusions in natural image disparity [16]. Then, we generate DSM based on the obtained disparity results through aerial triangulation and other processes. In the experiments involving the utilization of the refined disparity map for DSM generation, we also employ DSM fusion processing to fill in elevation information for occluded areas. This process involves utilizing two images with distinct imaging perspectives as reference images, generating D S M 1 and D S M 2 , respectively, and then merging D S M 1 and D S M 2 to obtain the final DSM.
In addition to the SDR disparity refinement method, to further demonstrate the effectiveness of our disparity refinement method in improving DSM elevation accuracy, we also compared it with the method that directly refines DSM. We selected the advanced ResDepth method as the DSM refinement comparison algorithm [36]. This method takes the initial DSM and the corresponding orthorectified images as input and outputs the refined DSM.
In summary, in the DSM elevation accuracy comparison experiment in this subsection, the disparity maps we used include (1) the disparity map calculated via the LDOF method; (2) the disparity map calculated via the LDOF method and the SDR refinement method; (3) the disparity map calculated via the LDOF method and our refinement method; (4) the disparity map calculated via the CFNet method; (5) the disparity map calculated via the CFNet method and the SDR refinement method; and (6) the disparity map calculated via the CFNet method and our refinement method. In the DSM refinement experiment, we are set to perform ResDepth-based refinement on the DSM generated based on the LDOF disparity and the DSM generated based on the CFNet disparity, respectively.
In the comparison phase, to assess the efficacy of the proposed method in refining the disparity values of super high-rise buildings, most of the images we selected contain tall building targets. DSM quality is evaluated by comparing the error between the generated DSM and the ground truth. The performance metric employed is the mean absolute error (MAE) defined in Equation (8). In this equation, i is the pixel number, N signifies the total number of pixels, h i represents the estimated elevation value, and h ^ i denotes the ground truth value. To illustrate the elevation accuracy of the generated DSM, we conducted experiments using two pairs of SV1 images and a pair of GF7 images, respectively. Some experimental results are detailed in Table 1.
M A E = 1 N i = 1 N h i h ^ i
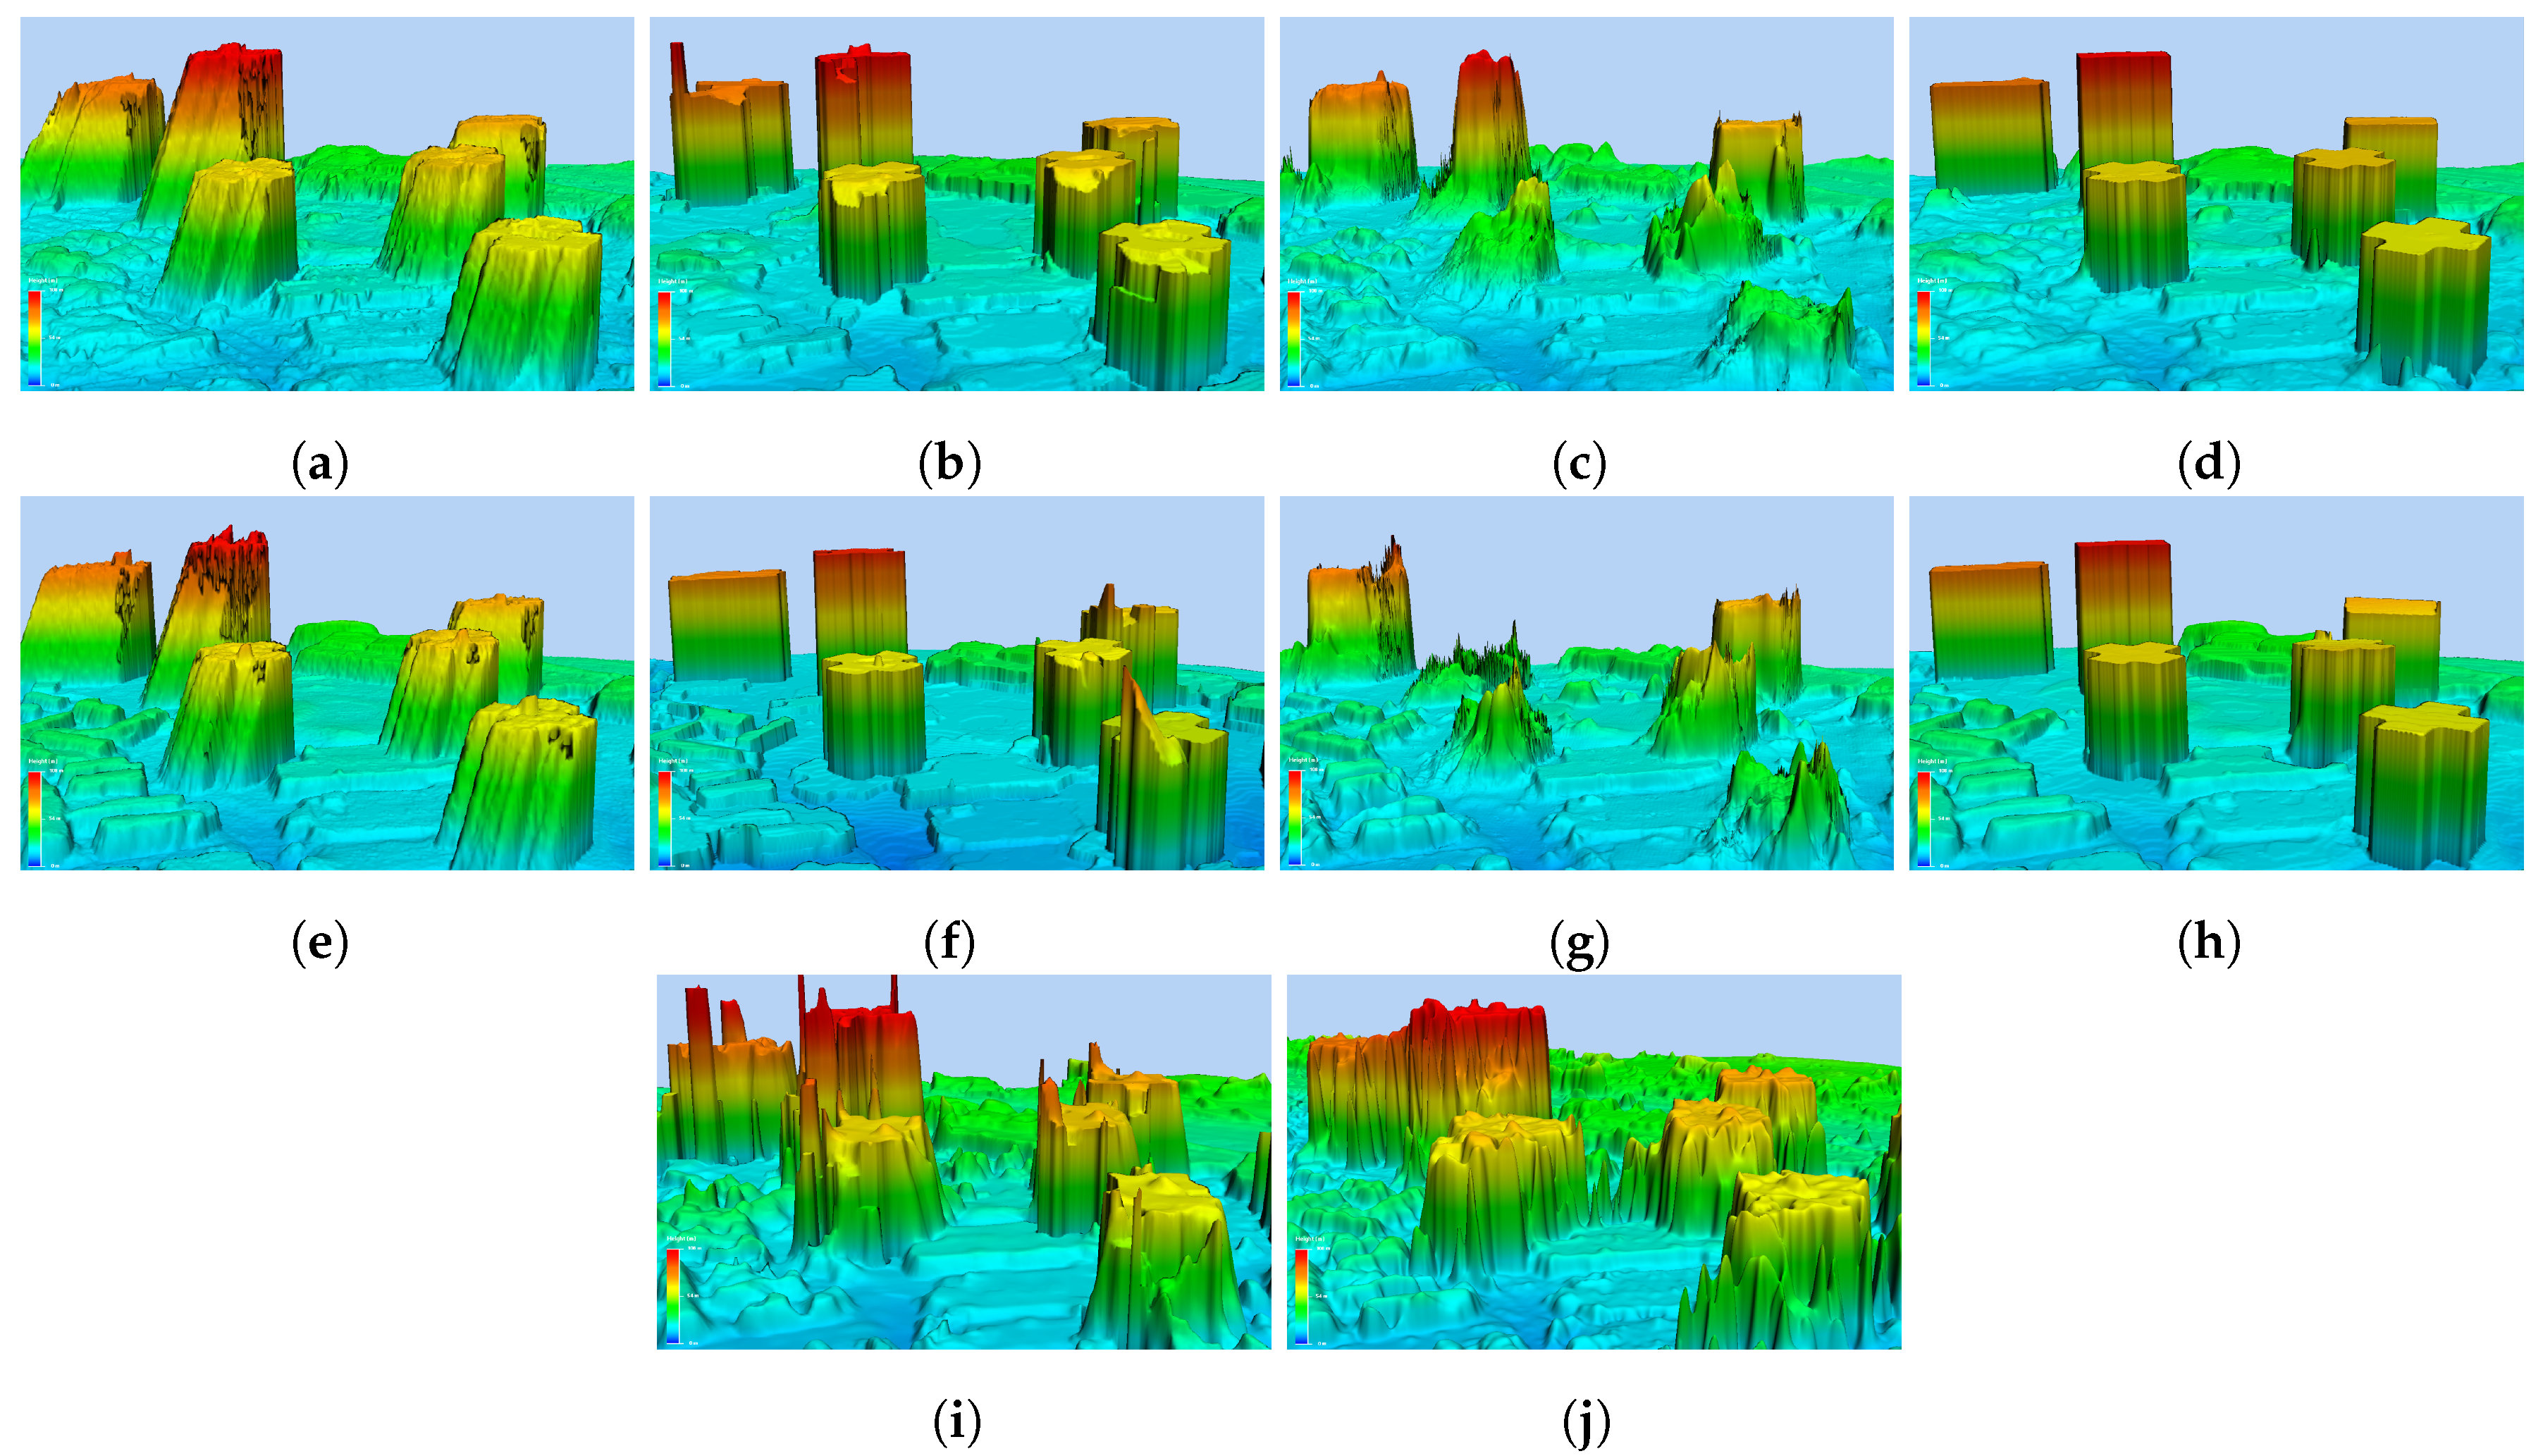
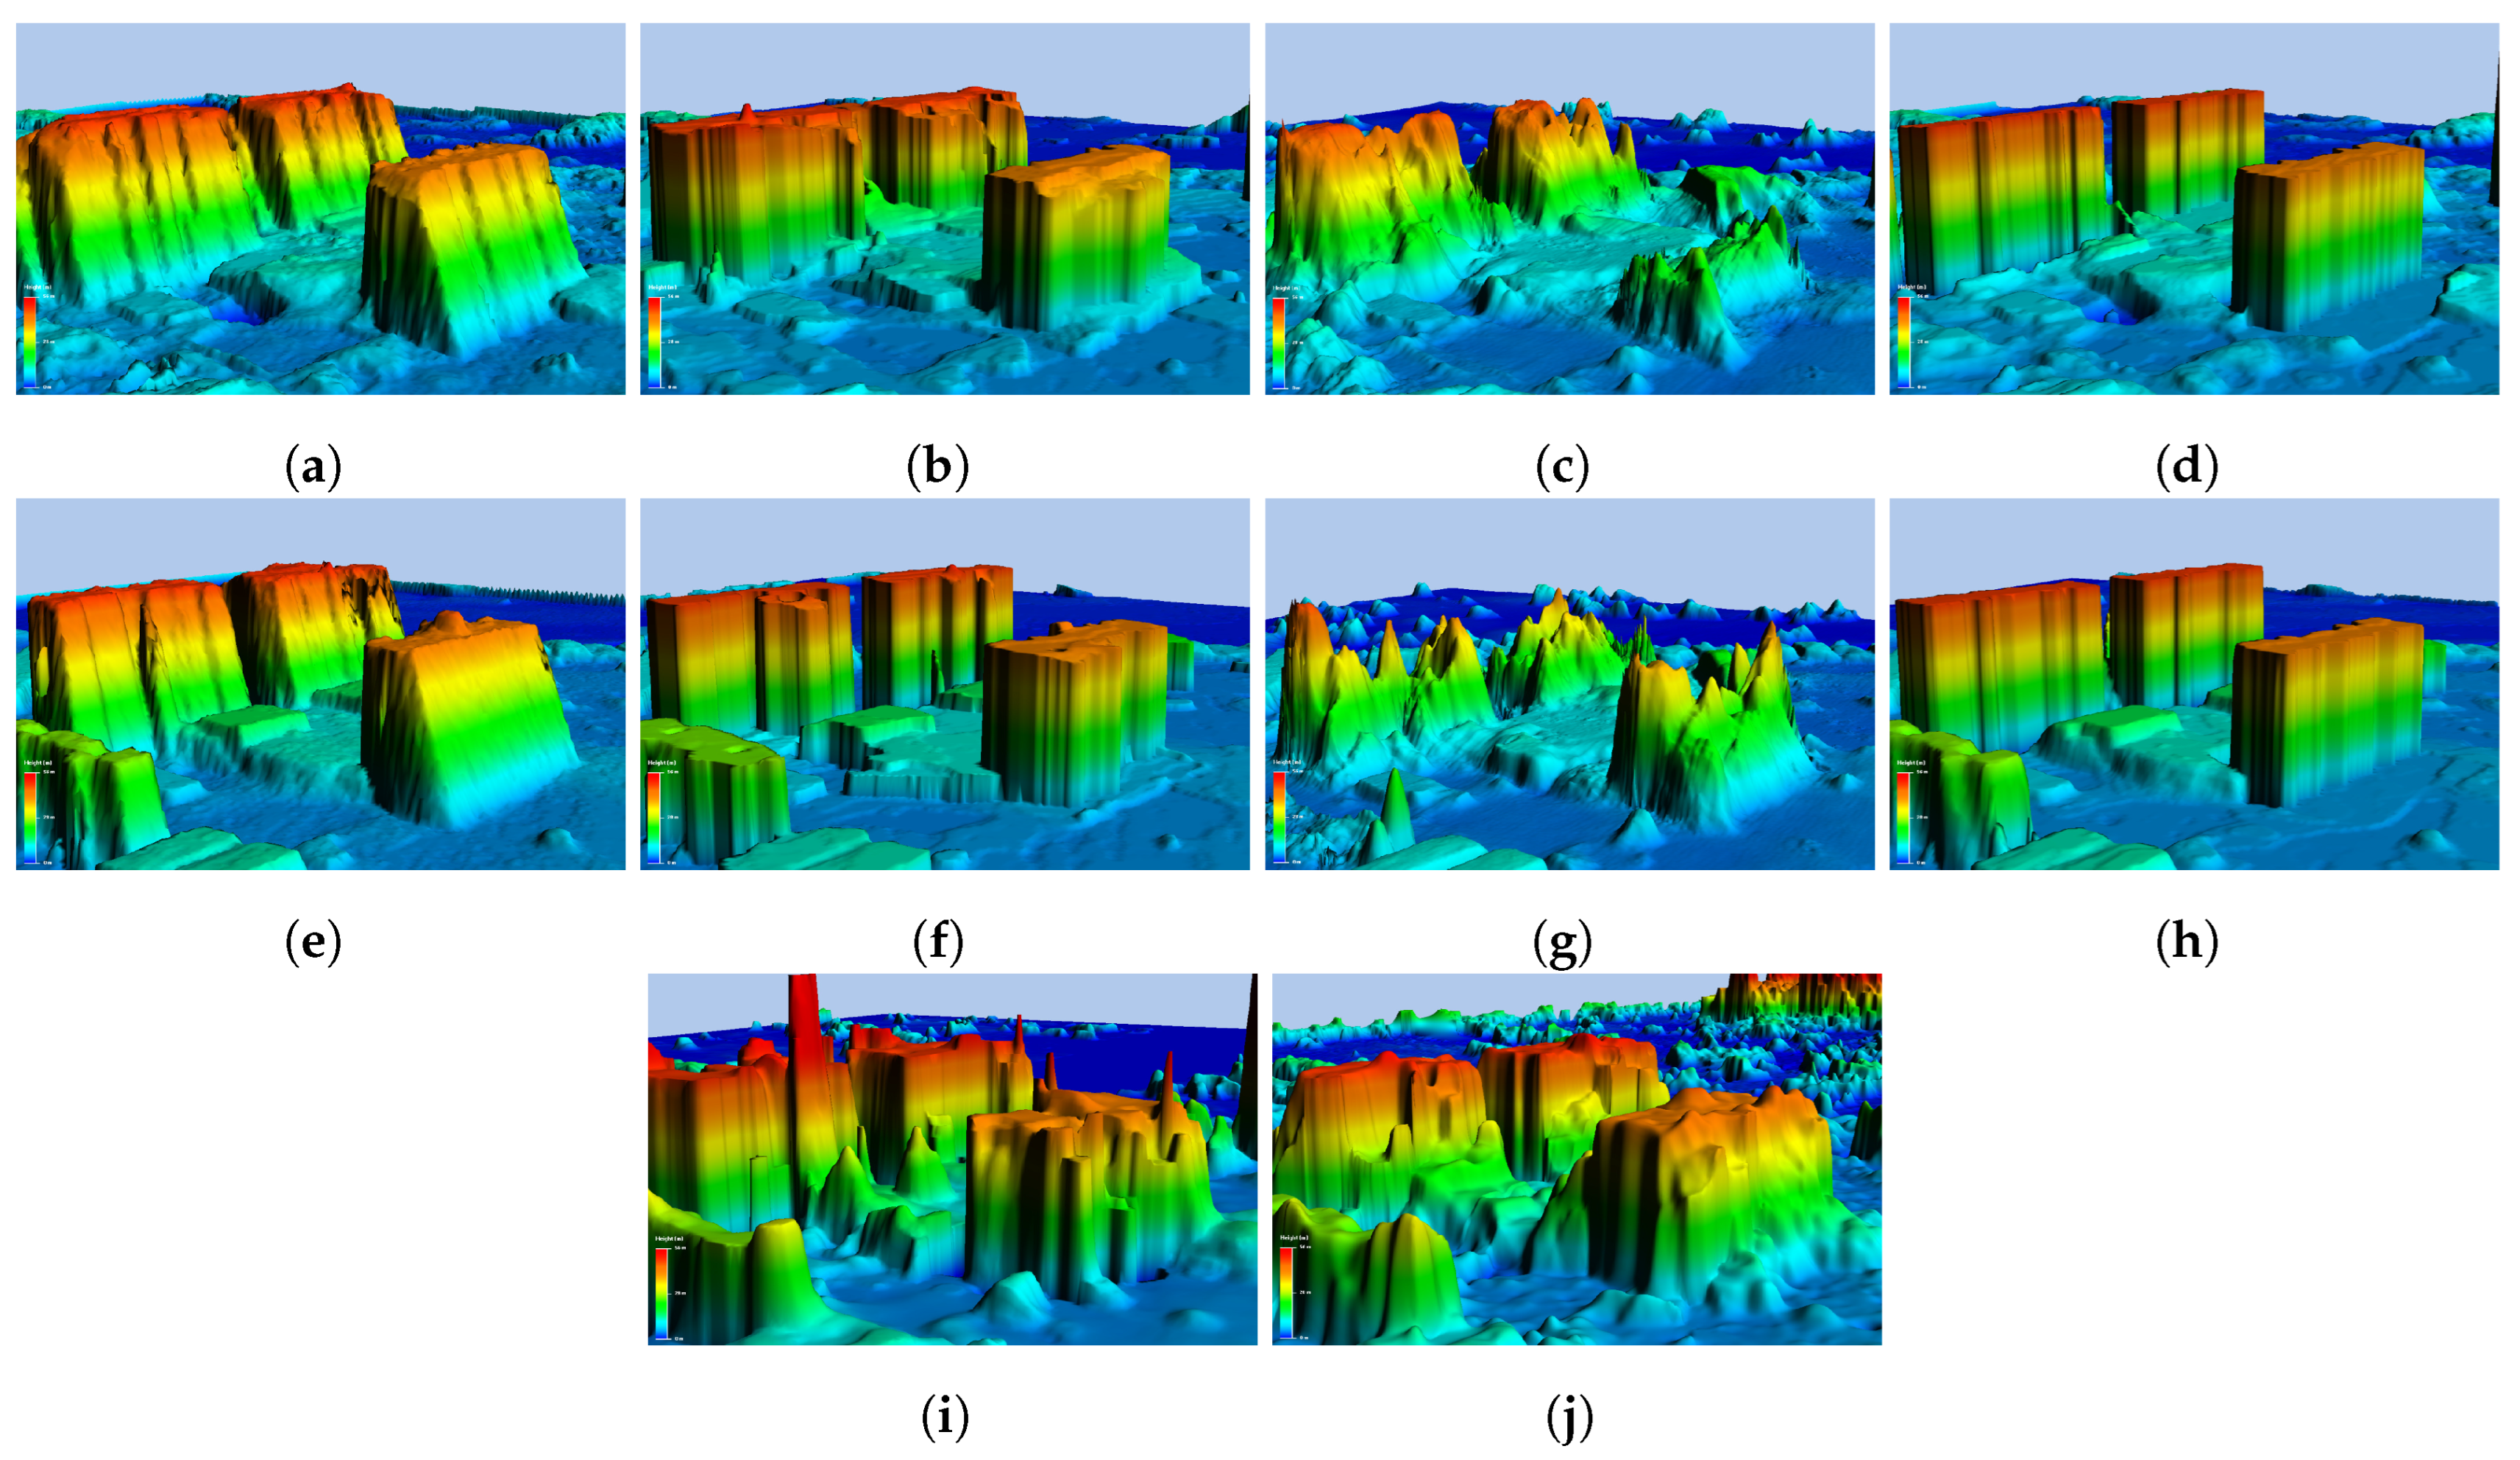
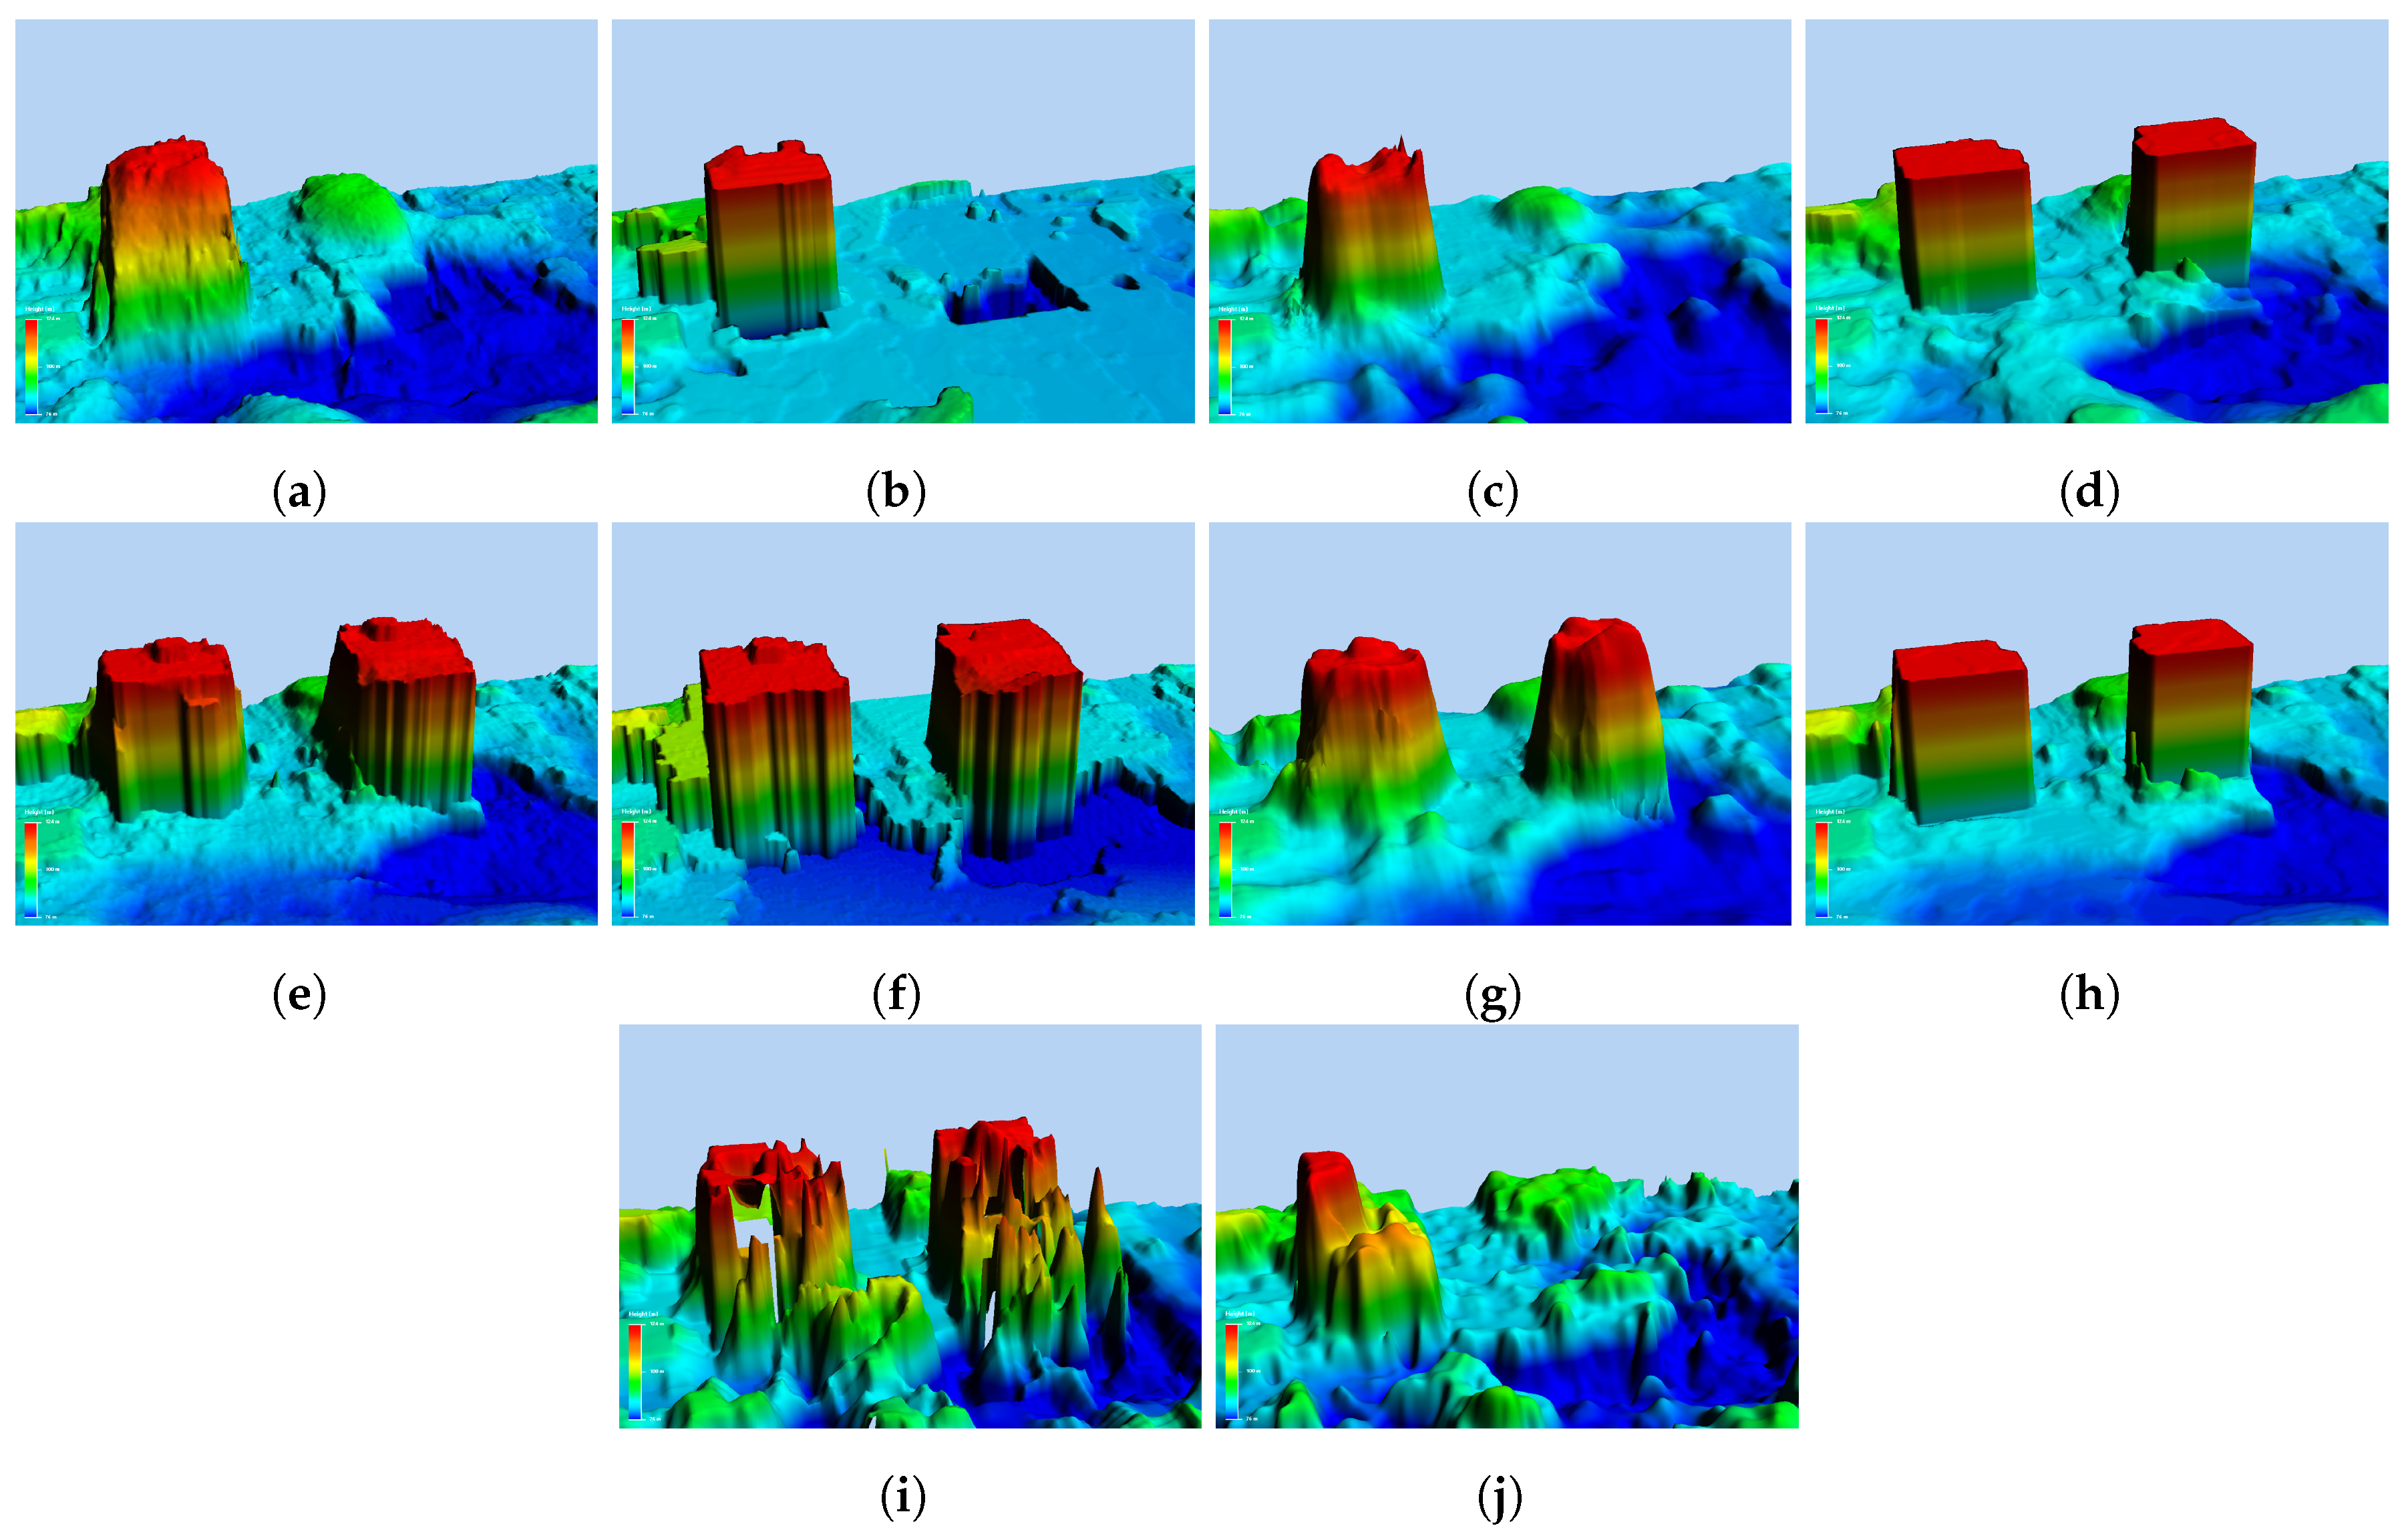
To more intuitively represent the DSM results, we utilize the QTReader software (v8.4.0) to perform a virtual stereoscopic display of the obtained DSM [37]. Figure 7, Figure 8, Figure 9 and Figure 10 present the virtual stereoscopic display results for several areas of interest, showcasing the DSMs generated through various methods.
The results presented in Table 1 demonstrate that the DSM generated based on the refined disparity through our method exhibits the highest accuracy, demonstrating its effectiveness for the initial disparity maps calculated via both the traditional hand-crafted method (LDOF) and deep learning-based method (CFNet). It is essential to note that, since our refinement method is focused on building objects, the elevation accuracy improvement across the entire image range might not exhibit a substantial absolute increase. However, when compared with the DSM results derived from the initial disparity, our method shows significant relative enhancement, achieving approximately 27 % improvement in elevation accuracy. Furthermore, in contrast to the DSM obtained through the SDR disparity refinement method, our method exhibits superior performance and lower elevation errors. In addition to the elevation index, the DSM stereoscopic display results in Figure 7, Figure 8, Figure 9 and Figure 10 show that the proposed method has more obvious advantages. For example, in Figure 7a,e and Figure 8a,e, building facades manifest as inclined planes with discernible burrs along the edges. However, after refinement through the proposed method, building facades become steeper and the structures of the buildings are clearer, as shown in Figure 8d,h.
Furthermore, the experimental results of DSM refinement using the ResDepth network indicate that this method cannot achieve satisfactory results for super high-rise buildings, as illustrated in Figure 7c–Figure 10c and Figure 7g–Figure 10g. Upon comparison with the DSM generated via the disparity process based on the proposed disparity refinement method in Figure 7 and Figure 8, it is evident that the buildings in the ResDepth network refined DSM have, to a large extent, lost their original heights and structures. And the elevation errors of the DSM, detailed in Table 1, further affirm that the DSM errors after ResDepth network refinement have not seen significant improvement. Consequently, in contrast to the DSM refinement method based on the ResDepth network, the DSM elevation accuracy achieved after processing via the proposed disparity refinement method is not only higher but, more importantly, more conducive to the reconstruction of super high-rise building targets.
In addition to various methods benchmarking against the DSM generation framework utilized in this study, we also evaluated our method against two established approaches: the advanced More Global Matching-based s2p method (MGM-s2p) [38,39] and the ENVI software (v5.6)-based DSM generation method [40]. The s2p method, representing the satellite stereo pipeline for pushbroom images, is widely recognized for its application in stereo production. On the other hand, the ENVI software (v5.6) incorporates processing modules tailored for satellite images such as GF7 and SV1. Table 2 lists the DSM elevation accuracy obtained by employing these two different DSM generation frameworks, respectively, and compares it with the results obtained based on the proposed method. And the stereo displays of DSM obtained using the MGM-s2p method and ENVI software (v5.6)-based method are shown in Figure 7i–Figure 10i and Figure 7j–Figure 10j, respectively.
It can be seen from the results that these two DSM-generating algorithms cannot produce a satisfactory DSM. In the outcomes of both methods, buildings manifest as irregular edges with significant elevation errors, as illustrated in Figure 7i,j and Figure 8i,j. Consequently, despite the widespread utilization of these two methods for DSM generation, achieving precise DSM in scenarios featuring super high-rise buildings proves to be a challenging endeavor.
In summary, the previous experiments demonstrate that, after epipolar rectification, constraining the matching point search range between image pairs to a relatively narrow scope already obtains high stereo matching accuracy. Nevertheless, when dealing with super high-rise building objects, existing stereo matching methods fall short of achieving satisfactory results. These mismatched points on the building facades lead to severe slopes in the generated DSM, making it difficult to distinguish the edges of the building, as shown in Figure 7a,e and Figure 8a,e. After applying our disparity refinement method to process the initial disparity, the effect of the generated DSM is significantly improved. For instance, the building reconstruction effects presented in the four images in the middle of Figure 7 are far better than those based on the initial disparity in the first column. It is noteworthy that while the building objects generated through the SDR disparity refinement method exhibit relatively steep facades, the structure of the building’s roof remains unclear, featuring some unusual elevation points. In contrast, the buildings obtained using our disparity refinement method have distinct, complete outlines and complete shapes, significantly enhancing the overall visual impact. Moreover, compared with the method of directly refining DSM based on the ResDepth network and the method based on other DSM generation frameworks (MGM-s2p method and ENVI-based method), the proposed disparity refinement method still has obvious advantages for high-precision reconstruction of super high-rise building targets.
From the perspective of DSM elevation error, our enhanced method also demonstrates superior performance. It needs to be emphasized that our refinement method is primarily designed for building objects. However, calculating the elevation error exclusively for buildings is challenging; therefore, we must assess the elevation accuracy of the entire image as the evaluation index. Furthermore, the DSM generated based on the initial disparity already exhibits relatively high accuracy. Consequently, due to the factors mentioned above, the absolute improvement of the DSM error metric by the proposed method is limited. Nevertheless, the relative reduction of error can approach nearly 30% at the highest.

4. Discussion

4.1. 3D Building Model Generation

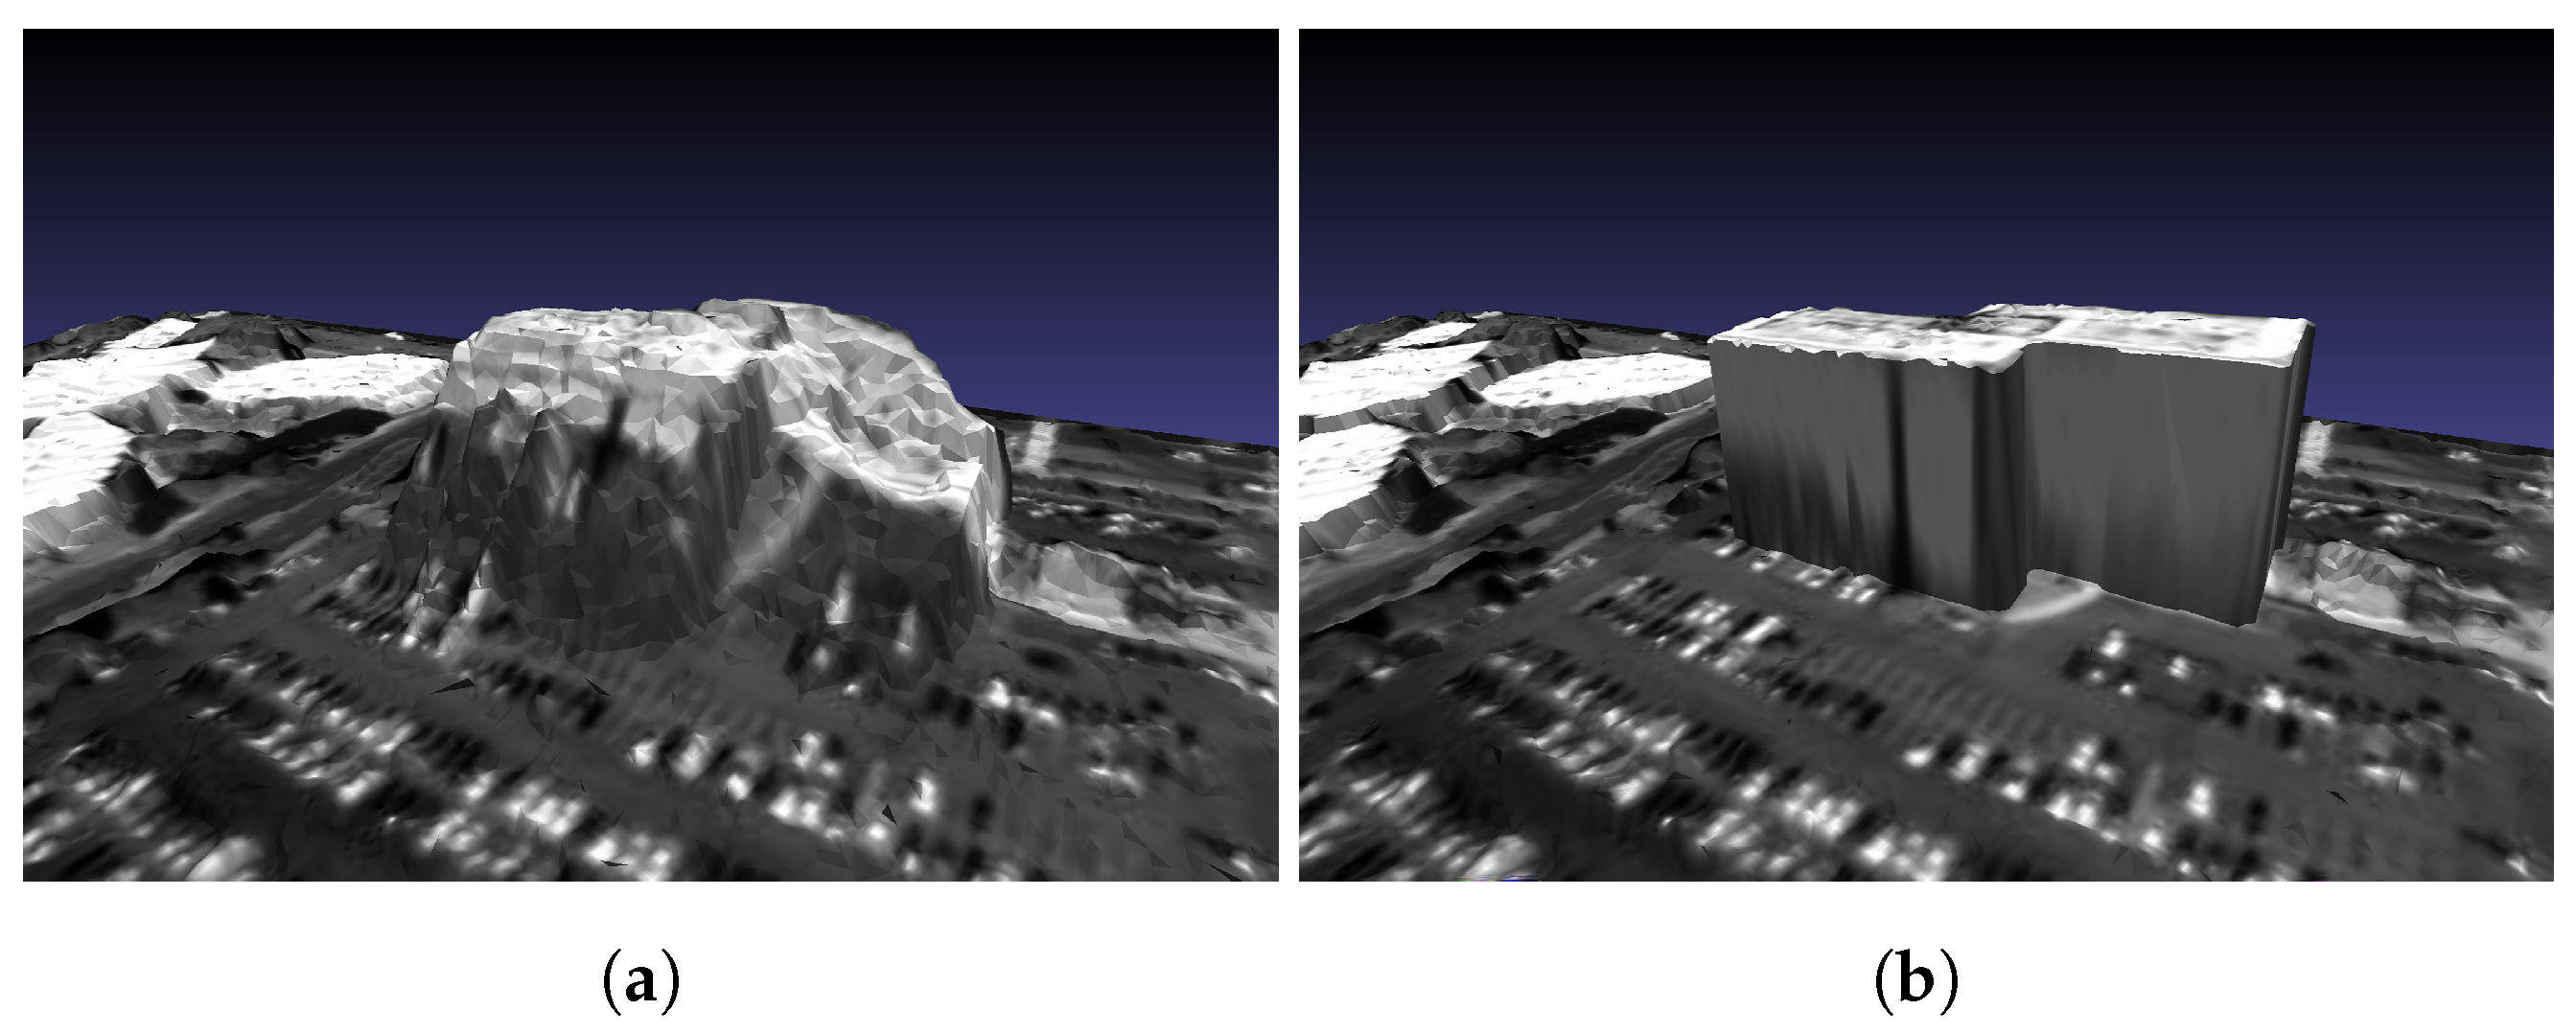
To verify that the proposed method can be used for subsequent high-precision 3D model generation, this paper made a preliminary attempt at generating 3D building models. Figure 11 shows the 3D building model generated by DSM before and after processing with the proposed method. By comparing the 3D reconstruction results in Figure 11a,b, it can be observed that the proposed disparity refinement method can reconstruct super high-rise building targets with clear structures and steep elevations. However, it should be emphasized that building model generation is not the primary focus of our research; hence, we employ a simple 3D model generation method based on DSM and remote sensing image pairs. Despite the absence of advanced 3D model generation techniques, the results depicted in Figure 11 demonstrate the potential of the proposed method in achieving refined 3D reconstruction of buildings.

4.2. Limitations

While the proposed disparity refinement method demonstrates effectiveness in enhancing the reconstruction of super high-rise building targets, there remain areas for further optimization. In this paper, the GIS data utilized are obtained from the OpenStreetMap website. A potential challenge arises from the time difference between OSM vector data and remote sensing images, resulting in differences between building vectors and images in certain areas and leading to vector mismatch during disparity refinement. Additionally, when dealing with building targets with irregular-shaped roofs, the complexity of building facades poses a challenge to accurate extraction, making it difficult for our method to achieve satisfactory results.
Furthermore, it should be emphasized that our disparity refinement method has limitations on the input disparity accuracy. Specifically, we require that the raw disparity input must encompass the disparity values of some pixels corresponding to super high-rise building targets. If the entirety of building target pixels in the raw disparity map manifests as mismatching points, indicating that the pixels of the building targets in the disparity maps are all low-confidence points, the building mask extraction will not be accurate, thereby diminishing the impact of the disparity refinement.
Therefore, in the future, we will further research the accurate extraction methods for super high-rise building facades with complex and irregular roof shapes. Simultaneously, we will explore precise building detection methods driven by GIS vector data to obtain building footprint vectors with higher consistency with remote sensing images. Furthermore, in this paper, we research the disparity refinement method for remote sensing image pairs. In the future, we can try to extend it to multi-view remote sensing images.

5. Conclusions

This paper proposes a method for refining disparity maps in stereo matching applied to very-high-resolution remote sensing images in urban environments, utilizing GIS data. First, we propose a method to extract building masks corresponding to remote sensing images based on OSM building vectors. This extraction process involves multiple steps, such as the multi-modal registration of building vectors and the extraction of building facades. Second, employing these building masks as image segmentation information, we present a two-step disparity refinement method specifically designed for building targets. This method comprises preliminary optimization steps for global and local optimization of the disparity map, along with the disparity post-correction procedure applied to building facades. Finally, we obtain the refined disparity map optimized for building targets.
The proposed menthod mainly has the following advantages:
1.
Replacing image segmentation information with open-source GIS data enhances the precision and regularity of building shapes, contributing to the generation of more accurate building models.
2.
A method for matching GIS vectors with remote sensing images is proposed, handling the problem of offsets between building footprints and imaging locations.
3.
By implementing a preliminary two-layer optimization of the disparity map, coupled with disparity post-correction of the building facades, the disparity values of building targets, particularly the disparity values within the building facades, are refined. This resolves the issue of inaccurate disparity estimation for super high-rise buildings.
Finally, the proposed disparity refinement method is extensively evaluated using ground truth data from LiDAR point clouds. The experimental results demonstrate the efficacy of the proposed disparity refinement method in reducing the elevation error of the generated DSM, thereby significantly enhancing the reconstruction of buildings in urban scenes. In particular, this method successfully solves issues such as the mismatching problem caused by super high-rise building facades and the presence of hole points in the DSM due to large occlusion areas. Furthermore, the proposed disparity refinement method is universal in traditional stereo matching methods and deep learning-based stereo matching methods.

Author Contributions

Conceptualization, F.W. and X.W.; methodology, X.W., F.W. and L.J.; software, X.W., L.J. and Y.X.; validation, X.W., L.J. and Y.X.; formal analysis, X.W. and Y.X.; investigation, X.W. and L.J.; resources, F.W. and Y.X.; data curation, X.W. and Y.X.; writing—original draft preparation, X.W.; writing—review and editing, Y.X., F.W. and H.Y.; visualization, X.W. and Y.X.; supervision, Y.X., F.W. and H.Y.; project administration, F.W. and H.Y.; funding acquisition, F.W. and X.W. All authors have read and agreed to the published version of the manuscript.

Funding

This research was funded by the Key Research Program of Frontier Sciences, Chinese Academy of Sciences, under Grant ZDBS-LY-JSC036.

Data Availability Statement

The data supporting the study are available from the authors upon reasonable request. The data are not publicly available due to privacy. Among them, the GIS data come from the website https://www.openstreetmap.org (accessed on 24 March 2023), and the LiDAR point clouds data were obtained from the website https://apps.nationalmap.gov/lidar-explorer (accessed on 17 August 2023).

Acknowledgments

The authors would like to thank the reviewers and the handling editor whose comments and suggestions have improved this paper.

Conflicts of Interest

The authors declare no conflicts of interest.

References

  1. Hirschmüller, H. Accurate and Efficient Stereo Processing by Semi-Global Matching and Mutual Information. In Proceedings of the 2005 IEEE Computer Society Conference on Computer Vision and Pattern Recognition, San Diego, CA, USA, 20–25 June 2005. [Google Scholar]
  2. Shahbazi, M.; Sohn, G.; Theau, J. High-density stereo image matching using intrinsic curves. ISPRS J. Photogramm. Remote Sens. 2018, 146, 373–388. [Google Scholar] [CrossRef]
  3. Tan, X.; Sun, C.; Pham, T.D. Stereo matching based on multi-direction polynomial model. Signal Process. Image Commun. Publ. Eur. Assoc. Signal Process. 2016, 44, 44–56. [Google Scholar] [CrossRef]
  4. Zhan, Y.; Gu, Y.; Huang, K.; Zhang, C.; Hu, K. Accurate Image-Guided Stereo Matching With Efficient Matching Cost and Disparity Refinement. IEEE Trans. Circuits Syst. Video Technol. 2016, 26, 1632–1645. [Google Scholar] [CrossRef]
  5. Tulyakov, S.; Ivanov, A.; Fleuret, F. Practical Deep Stereo (PDS): Toward applications-friendly deep stereo matching. Adv. Neural Inf. Process. Syst. 2018, 31, 5871–5881. [Google Scholar]
  6. Guo, X.; Yang, K.; Yang, W.; Wang, X.; Li, H. Group-Wise Correlation Stereo Network. 2019. In Proceedings of the Proceedings of the IEEE/CVF Conference on Computer Vision and Pattern Recognition 2019, Long Beach, CA, USA, 15–20 June 2019; pp. 3273–3282. [Google Scholar]
  7. Zbontar, J.; LeCun, Y. Stereo matching by training a convolutional neural network to compare image patches. J. Mach. Learn. Res. 2016, 17, 2287–2318. [Google Scholar]
  8. Schuster, R.; Wasenmuller, O.; Unger, C.; Stricker, D. Sdc-stacked dilated convolution: A unified descriptor network for dense matching tasks. In Proceedings of the Proceedings of the IEEE/CVF Conference on Computer Vision and Pattern Recognition 2019, Long Beach, CA, USA, 15–20 June 2019; pp. 2556–2565. [Google Scholar]
  9. Tao, R.; Xiang, Y.; You, H. A Confidence-Aware Cascade Network for Multi-Scale Stereo Matching of Very-High-Resolution Remote Sensing Images. Remote Sens. 2022, 14, 1667. [Google Scholar] [CrossRef]
  10. Egnal, G.; Mintz, M.; Wildes, R.P. A stereo confidence metric using single view imagery with comparison to five alternative approaches. Image Vis. Comput. 2004, 22, 943–957. [Google Scholar] [CrossRef]
  11. Jang, W.S.; Ho, Y.S. Discontinuity preserving disparity estimation with occlusion handling. J. Vis. Commun. Image Represent. 2014, 25, 1595–1603. [Google Scholar] [CrossRef]
  12. Banno, A.; Ikeuchi, K. Disparity map refinement and 3D surface smoothing via Directed Anisotropic Diffusion. 2009. In Proceedings of the Proceedings of the 2009 IEEE 12th International Conference on Computer Vision Workshops, ICCV Workshops, Kyoto, Japan, 27 September–4 October 2009; pp. 1870–1877. [Google Scholar]
  13. Huang, X.; Zhang, Y.J. An O (1) disparity refinement method for stereo matching. Pattern Recognit. 2016, 55, 198–206. [Google Scholar] [CrossRef]
  14. Mei, X.; Sun, X.; Zhou, M.; Jiao, S.; Zhang, X. On building an accurate stereo matching system on graphics hardware. In Proceedings of the Proceedings of the 2011 IEEE International Conference on Computer Vision Workshops, Barcelona, Spain, 6–13 November 2011; pp. 467–474. [Google Scholar]
  15. Ma, Z.; He, K.; Wei, Y.; Sun, J.; Wu, E. Constant Time Weighted Median Filtering for Stereo Matching and Beyond. In Proceedings of the Proceedings of the 2013 IEEE International Conference on Computer Vision, Sydney, Australia, 1–8 December 2013. [Google Scholar]
  16. Yan, T.; Gan, Y.; Xia, Z.; Zhao, Q. Segment-Based Disparity Refinement With Occlusion Handling for Stereo Matching. IEEE Trans. Image Process. 2019, 28, 3885–3897. [Google Scholar] [CrossRef]
  17. Zhang, Y.; Zhang, Z.; Gong, J. Generalized photogrammetry of spaceborne, airborne and terrestrial multisource remote sensing datasets. Acta Geod. Cartogr. Sin. 2021, 50, 11. [Google Scholar]
  18. Cao, Y.; Huang, X. A deep learning method for building height estimation using high-resolution multi-view imagery over urban areas: A case study of 42 Chinese cities. Remote Sens. Environ. 2021, 264, 112590. [Google Scholar] [CrossRef]
  19. Qi, F.; Zhai, J.Z.; Dang, G. Building height estimation using Google Earth. Energy Build. 2016, 118, 123–132. [Google Scholar] [CrossRef]
  20. Liu, C.; Huang, X.; Wen, D.; Chen, H.; Gong, J. Assessing the quality of building height extraction from ZiYuan-3 multi-view imagery. Remote Sens. Lett. 2017, 8, 907–916. [Google Scholar] [CrossRef]
  21. Wang, J.; Hu, X.; Meng, Q.; Zhang, L.; Wang, C.; Liu, X.; Zhao, M. Developing a Method to Extract Building 3D Information from GF-7 Data. Remote Sens. 2021, 13, 4532. [Google Scholar] [CrossRef]
  22. Dong, Y.; Li, Q.; Dou, A.; Wang, X. Extracting damages caused by the 2008 Ms 8.0 Wenchuan earthquake from SAR remote sensing data. J. Asian Earth Sci. 2011, 40, 907–914. [Google Scholar] [CrossRef]
  23. Pan, H.B.; Zhang, G.; Chen, T. A general method of generating satellite epipolar images based on RPC model. In Proceedings of the 2011 IEEE International Geoscience and Remote Sensing Symposium, IGARSS 2011, Vancouver, BC, Canada, 24–29 July 2011. [Google Scholar]
  24. Xiong. Z.; Zhang. Y. Bundle Adjustment With Rational Polynomial Camera Models Based on Generic Method. IEEE Trans. Geosci. Remote Sens. 2011, 49, 190–202. [Google Scholar] [CrossRef]
  25. Wang, X.; Wang, F.; Xiang, Y.; You, H. A General Framework of Remote Sensing Epipolar Image Generation. Remote Sens. 2021, 13, 4539. [Google Scholar] [CrossRef]
  26. Liao, P.; Chen, G.; Zhang, X.; Zhu, K.; Gong, Y.; Wang, T.; Li, X.; Yang, H. A linear pushbroom satellite image epipolar resampling method for digital surface model generation. ISPRS J. Photogramm. Remote Sens. 2022, 190, 56–68. [Google Scholar] [CrossRef]
  27. Brox, T.; Malik, J. Large Displacement Optical Flow: Descriptor Matching in Variational Motion Estimation. IEEE Trans. Pattern Anal. Mach. Intell. 2011, 33, 500–513. [Google Scholar] [CrossRef]
  28. Shen, Z.; Dai, Y.; Rao, Z. CFNet: Cascade and Fused Cost Volume for Robust Stereo Matching. In Proceedings of the Proceedings of the IEEE/CVF Conference on Computer Vision and Pattern Recognition (CVPR), Nashville, TN, USA, 20–25 June 2021; pp. 13906–13915. [Google Scholar]
  29. Xiang, Y.; Tao, R.; Wan, L.; Wang, F.; You, H. OS-PC: Combining feature representation and 3-D phase correlation for subpixel optical and SAR image registration. IEEE Trans. Geosci. Remote Sens. 2020, 58, 6451–6466. [Google Scholar] [CrossRef]
  30. Nock, R.; Nielsen, F. Statistical region merging. IEEE Trans. Pattern Anal. Mach. Intell. 2004, 26, 1452. [Google Scholar] [CrossRef] [PubMed]
  31. Yamaguchi, K.; Hazan, T.; McAllester, D.; Urtasun, R. Continuous markov random fields for robust stereo estimation. In Proceedings of the Computer Vision–ECCV 2012: 12th European Conference on Computer Vision, Florence, Italy, 7–13 October 2012; Proceedings, Part V 12. Springer: Berlin/Heidelberg, Germany, 2012; pp. 45–58. [Google Scholar]
  32. Fischler, M.A.; Bolles, R.C. Random sample consensus: A paradigm for model fitting with applications to image analysis and automated cartography. Commun. ACM 1981, 24, 381–395. [Google Scholar] [CrossRef]
  33. Ni, K.; Jin, H.; Dellaert, F. GroupSAC: Efficient consensus in the presence of groupings. In Proceedings of the 2009 IEEE 12th International Conference on Computer Vision, Kyoto, Japan, 27 September–4 October 2009; pp. 2193–2200. [Google Scholar]
  34. Ramm, F.; Topf, J.; Chilton, S. OpenStreetMap: Using and Enhancing the Free Map of the World; UIT Cambridge: Cambridge, UK, 2010. [Google Scholar]
  35. Snyder, G.I. 3D Elevation Program—Summary of Program Direction; Center for Integrated Data Analytics Wisconsin Science Center: Madison, WI, USA, 2012. [Google Scholar]
  36. Stucker, C.; Schindler, K. ResDepth: A deep residual prior for 3D reconstruction from high-resolution satellite images. ISPRS J. Photogramm. Remote Sens. 2022, 183, 560–580. [Google Scholar] [CrossRef]
  37. Imagery, A. Quick Terrain Modeler and Quick Terrain Reader, 2011. Available online: https://sensorsandsystems.com/quick-terrain-modeler-and-quick-terrain-reader (accessed on 1 December 2023).
  38. Franchis, C.D.; Meinhardtllopis, E.; Michel, J.; Morel, J.M.; Facciolo, G. An automatic and modular stereo pipeline for pushbroom images. ISPRS Ann. Photogramm. Remote Sens. Spat. Inf. Sci. 2014, 2, 49–56. [Google Scholar] [CrossRef]
  39. Facciolo, G.; Franchis, C.D.; Meinhardt, E. MGM: A Significantly More Global Matching for Stereovision. In Proceedings of the British Machine Vision Conference, Swansea, UK, 7–10 September 2015. [Google Scholar]
  40. ENVI-IDL Technology Hall. Extract DSM and Point Cloud Data Based on SuperView-1 Stereo Pair Data in ENVI, 2022. Available online: https://www.cnblogs.com/enviidl/p/16595635.html (accessed on 5 January 2024).
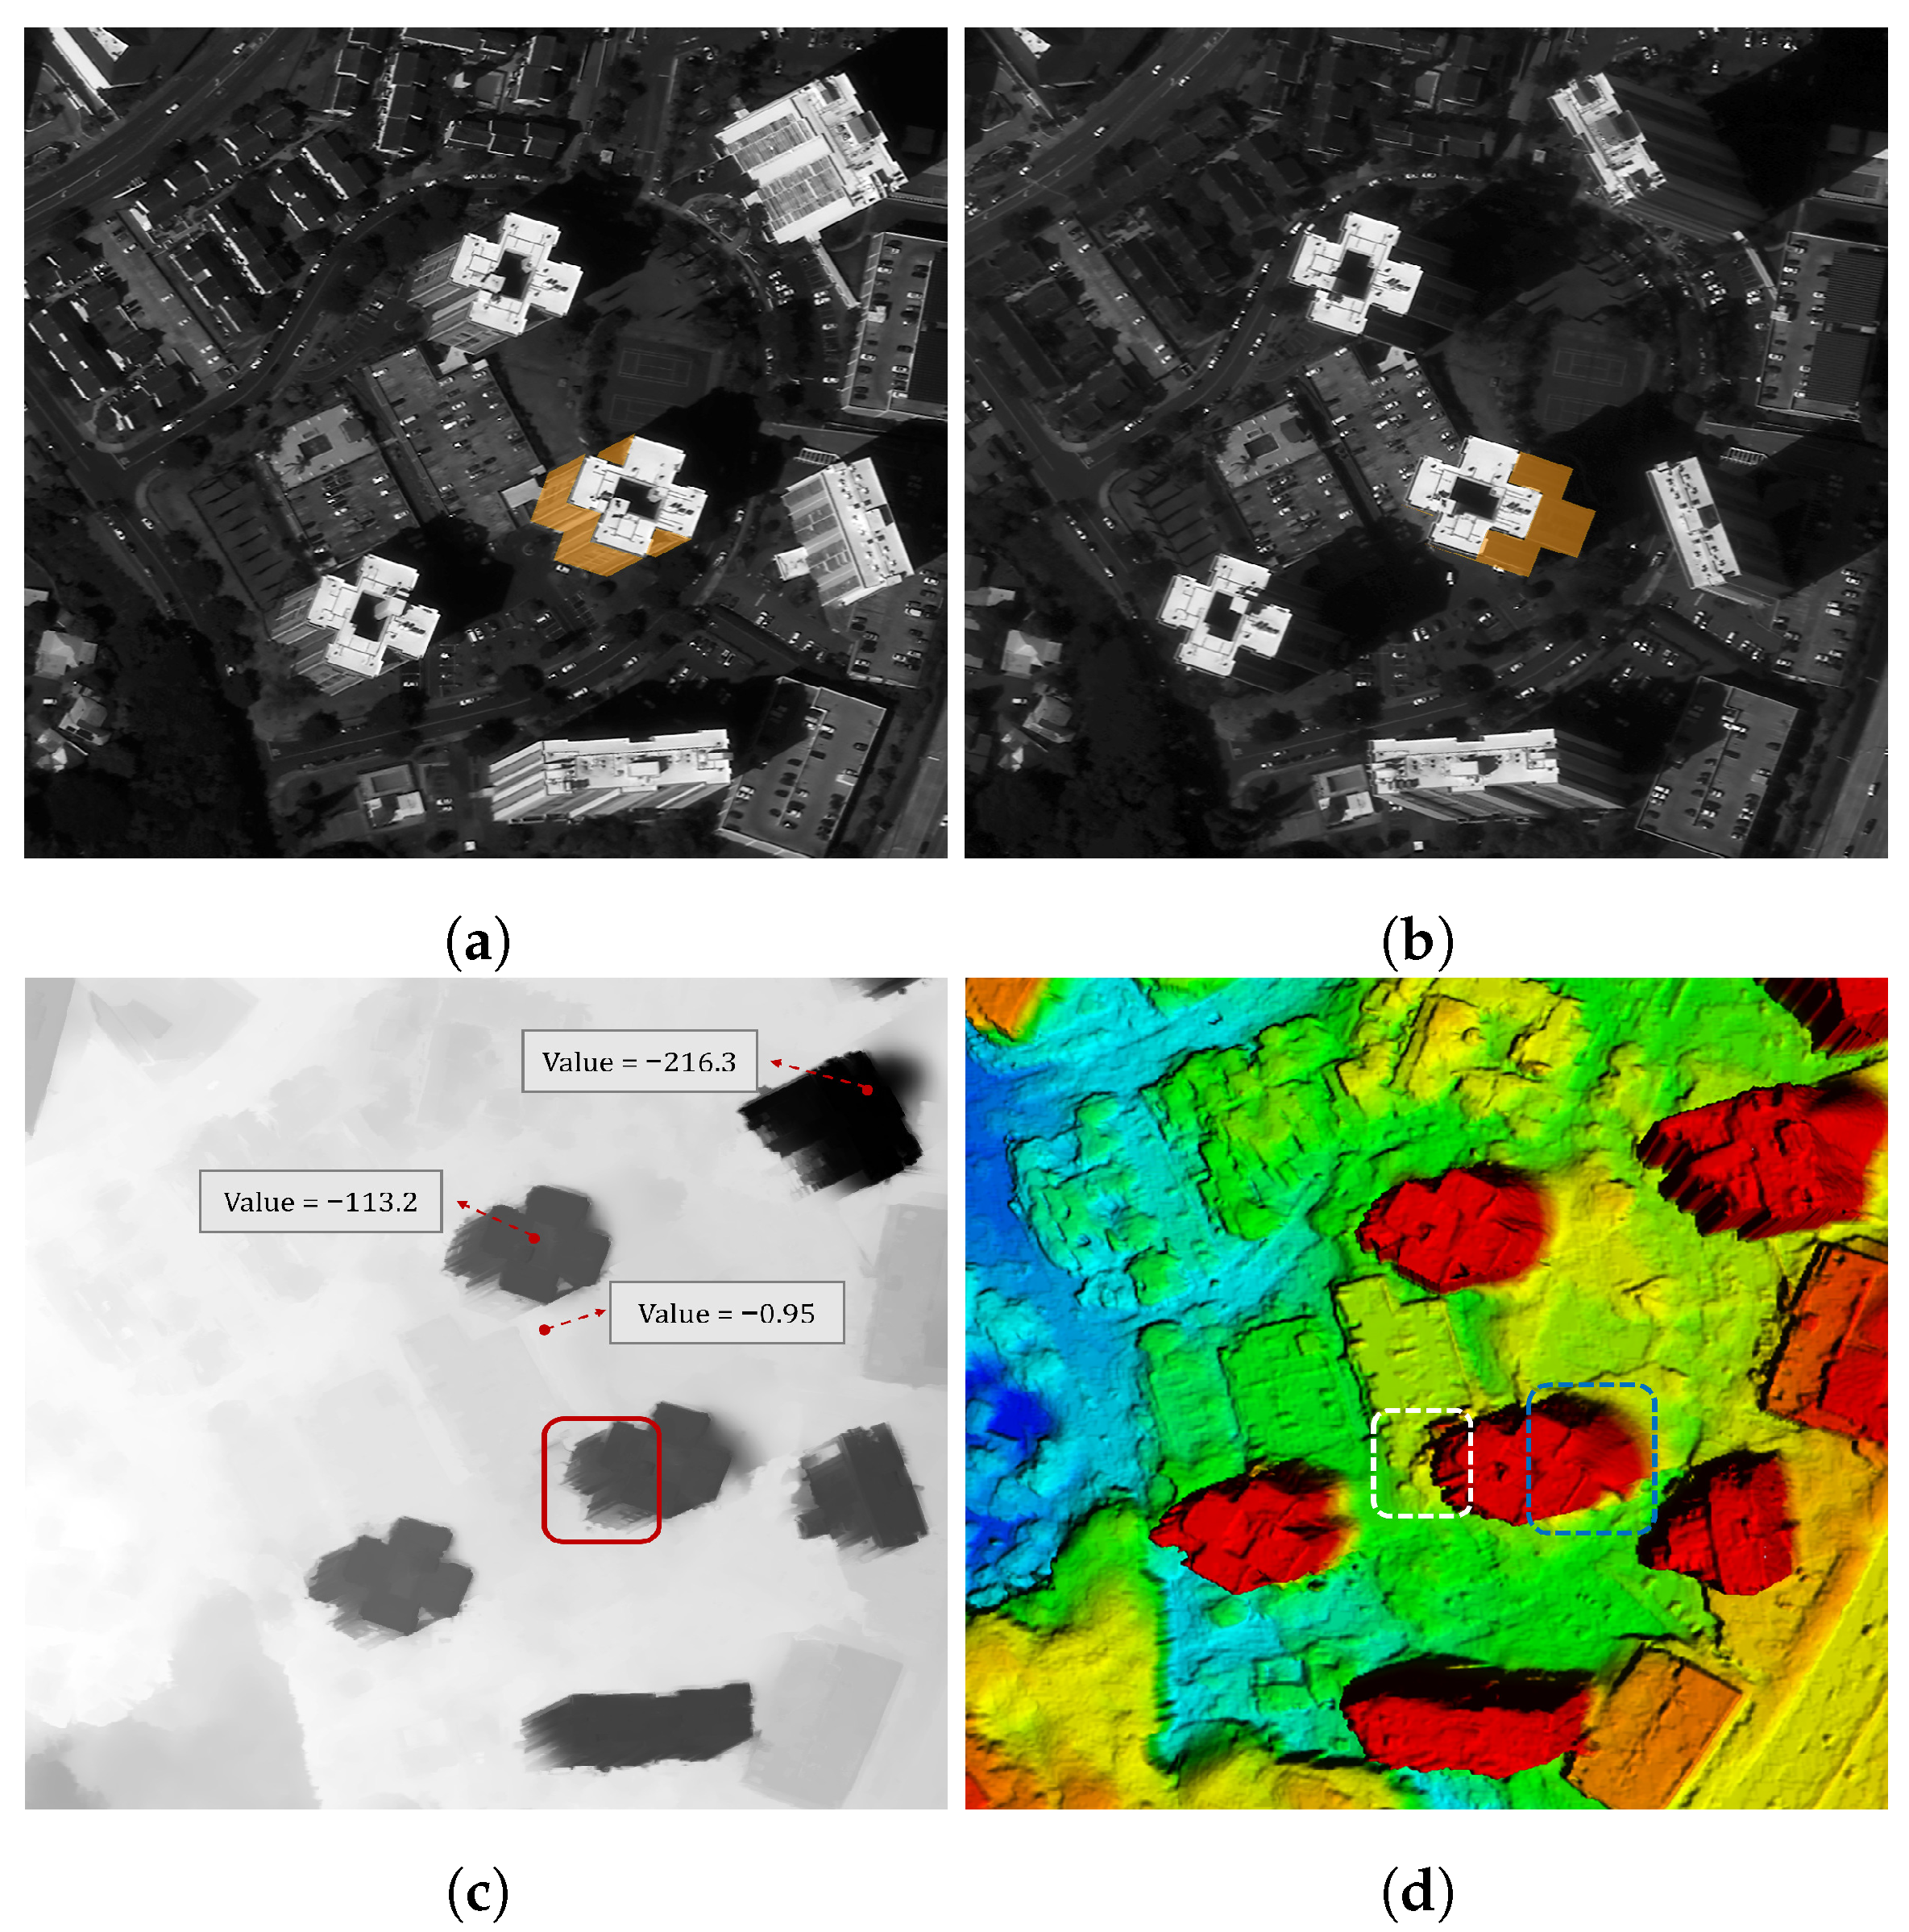
Figure 1. The example of 3D reconstruction results for buildings with large occluded areas in the image. (a) The left image. (b) The right image. (c) The disparity map calculated by applying (a) as the reference image. (d) The generated DSM. The yellow areas in (a,b) represent building facades. The values within the boxes marked in (c) are the pixel disparity values.
Remotesensing 16 00487 g001
Figure 2. Schematic diagram of the processing flow of DSM generated after processing by the proposed disparity refinement method. The overall process comprises 6 steps, with steps 15 constituting the disparity refinement phase, and step 6 is the DSM generation step based on the refined disparity map.
Remotesensing 16 00487 g002
Figure 5. The flowchart for refining the disparity map based on the obtained building mask. The orange dotted box is the local optimization part of the disparity map, and the green dotted box is the global optimization part. { s k } is the set of building superpixels obtained based on the building mask. μ s is the mean disparity of the superpixel s. N 3 d represents the 3D neighborhood relationship between superpixels. π s and π s are the estimated disparity planes of superpixel s.
Remotesensing 16 00487 g005
Figure 6. Image pairs and disparity refinement results. (a) Left image 1 from SV1. (b) Right image 1 from SV1. (c) Initial disparity map 1. (d) Refined disparity map 1. (e) Left image 2 from GeyEye. (f) Right image 2 from GeyEye. (g) Initial disparity map 2. (h) Refined disparity map 2.
Remotesensing 16 00487 g006
Figure 7. DSM virtual stereoscopic display generated by different methods of ROI-1. (a) DSM generated by LDOF (hand-crafted). (b) DSM generated by LDOF with SDR refinement. (c) DSM generated by LDOF with ResDepth refinement. (d) DSM generated by LDOF with the proposed method. (e) DSM generated by CFNet (deep-learing). (f) DSM generated by CFNet with SDR refinement. (g) DSM generated by CFNet with ResDepth refinement. (h) DSM generated by CFNet with the proposed method. (i) DSM generated by MGM-s2p. (j) DSM generated by ENVI software (v5.6).
Remotesensing 16 00487 g007
Figure 8. DSM virtual stereoscopic display generated by different methods of ROI-2. (a) DSM generated by LDOF (hand-crafted). (b) DSM generated by LDOF with SDR refinement. (c) DSM generated by LDOF with ResDepth refinement. (d) DSM generated by LDOF with the proposed method. (e) DSM generated by CFNet (deep-learing). (f) DSM generated by CFNet with SDR refinement. (g) DSM generated by CFNet with ResDepth refinement. (h) DSM generated by CFNet with the proposed method. (i) DSM generated by MGM-s2p. (j) DSM generated by ENVI software (v5.6).
Remotesensing 16 00487 g008
Figure 9. DSM virtual stereoscopic display generated by different methods of ROI-3. (a) DSM generated by LDOF (hand-crafted). (b) DSM generated by LDOF with SDR refinement. (c) DSM generated by LDOF with ResDepth refinement. (d) DSM generated by LDOF with the proposed method. (e) DSM generated by CFNet (deep-learing). (f) DSM generated by CFNet with SDR refinement. (g) DSM generated by CFNet with ResDepth refinement. (h) DSM generated by CFNet with the proposed method. (i) DSM generated by MGM-s2p. (j) DSM generated by ENVI software (v5.6).
Remotesensing 16 00487 g009
Figure 10. DSM virtual stereoscopic display generated by different methods of ROI-4. (a) DSM generated by LDOF (hand-crafted). (b) DSM generated by LDOF with SDR refinement. (c) DSM generated by LDOF with ResDepth refinement. (d) DSM generated by LDOF with the proposed method. (e) DSM generated by CFNet (deep-learing). (f) DSM generated by CFNet with SDR refinement. (g) DSM generated by CFNet with ResDepth refinement. (h) DSM generated by CFNet with the proposed method. (i) DSM generated by MGM-s2p. (j) DSM generated by ENVI software (v5.6).
Remotesensing 16 00487 g010
Figure 11. Three-dimensional building model generated by DSM before and after processing with the proposed method. (a) 3D building model generated by the original DSM. (b) 3D building model generated by the DSM after processing using the proposed disparity refinement method.
Remotesensing 16 00487 g011
Table 1. The elevation errors of the DSM generated via different methods. LDOF and CFNet represent a hand-crafted stereo matching method and a deep-learning stereo matching method, respectively. SDR and ResDepth represent the original SDR disparity refinement method and the ResDepth-based DSM refinement method, respectively. RoI-n represents the n-th test area.
MethodMAE (m)
RoI-1 RoI-2 RoI-3 RoI-4
LDOF (Hand-Crafted)2.201.862.555.58
LDOF + SDR2.231.822.375.53
LDOF + ResDepth1.741.892.525.14
LDOF + Our method1.611.432.183.85
CFNet (Deep-Learning)1.991.622.404.47
CFNet + SDR2.221.272.395.20
CFNet + ResDepth2.142.022.564.28
CFNet + Our method1.591.172.013.71
Table 2. The elevation errors of the DSM generated via different methods. LDOF and CFNet represent a hand-crafted stereo matching method and a deep learning stereo matching method, respectively. MGM-s2p and ENVI, respectively, represent two DSM generation methods different from our DSM generation benchmark. RoI-n represents the n-th test area.
MethodMAE (m)
RoI-1 RoI-2 RoI-3 RoI-4
MGM-s2p2.991.733.364.81
ENVI3.401.883.465.71
LDOF + Our method1.611.432.183.85
CFNet + Our method1.591.172.013.71
Disclaimer/Publisher’s Note: The statements, opinions and data contained in all publications are solely those of the individual author(s) and contributor(s) and not of MDPI and/or the editor(s). MDPI and/or the editor(s) disclaim responsibility for any injury to people or property resulting from any ideas, methods, instructions or products referred to in the content.