Abstract
To reveal the deep seismogenic environment and mechanism of earthquakes in Songyuan City, Northeastern China, 59 broadband magnetotelluric sites in the Songyuan area were arranged in this study at a spacing of 5 km. In addition, two intersecting magnetotelluric profiles, with a total of 23 measuring sites and a spacing of 2 km, were established near the Ningjiang earthquake swarm. Using a nonlinear conjugate gradient (NLCG) algorithm, resistivity structures in the lithosphere were obtained at different scales using three-dimensional (3D) inversion. The research results show that: a deep high-conductivity system (<10 Ω·m) was identified at 25–85 km depth in the lithosphere under Songyuan, corresponding closely to a region of high heat flow. It is inferred to be the molten material of mantle upwelling. In addition, a shallow high-conductivity system (<10 Ω·m) was identified beneath the Ningjiang earthquake swarm, which is interpreted to correspond to the Fuyu North fault. It is the main seismo-controlling structure of the Ningjiang earthquake swarm. The deep seismogenic environment and seismogenic mechanism of the Ningjiang earthquake swarm can be described as a deep upwelling of molten mantle material, which provides the power source. The deep magma intruded into the lower crust and accumulated, then intruded along faults and fissures, resulting in the activation of the North Fuyu fault and triggering the Ningjiang earthquake. It is attributed to the activation of shallow faults caused by the upwelling of molten mantle material.
1. Introduction
The study area is located in the south-central region of Songliao Basin (Figure 1a), which is located in the northeast of China, spanning across Heilongjiang, Jilin, Liaoning, and Inner Mongolia. It is a rift–depression dual structure basin that exhibits characteristics of both large-scale rift basins and depression basins [1]. The Songliao Basin is strongly influenced by deep mantle convection, with frequent regional tectonic activity and strong magmatic activity in the deep region [2,3,4,5].
The seismic activity area in Songyuan is located at the junction of the southeastern uplift and central depression of the Songliao Basin. It is an active seismic region with a higher intensity and frequency of seismicity than the rest of the northeast of China [6]. Earthquakes are generally classified as plate boundary earthquakes or intraplate earthquakes, according to their locations. Plate boundary earthquakes are caused by tectonic movements between plates, involving processes such as subduction and collision, and the strong stress and active tectonic structures in such regions lead to frequent earthquakes [7]. However, it is more difficult to explain seismic activity and deformation taking place within plates [8,9]. Intraplate earthquakes can be classified into shallow-source, medium-source, and deep-source earthquakes according to their focal depth. Earthquakes in Songyuan are mainly shallow-source and medium-source earthquakes, which are located at the top and bottom of the lower crust, respectively [10]. During 2019, numerous earthquakes occurred in the Ningjiang district, Songyuan City, one with a magnitude of 5.1. These earthquakes occurred near the epicenters of a magnitude 4.9 earthquake that took place on 23 July 2017 and a magnitude 5.7 earthquake that occurred on 28 May 2018. The clustering of several earthquake epicenters indicates that the Songyuan area has strong seismic activity. Studying the mechanism of the Songyuan earthquake and its connection with deep structures is of great significance for earthquake prediction and prevention.
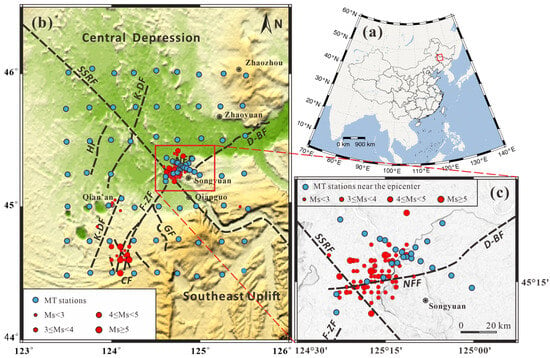
Figure 1.
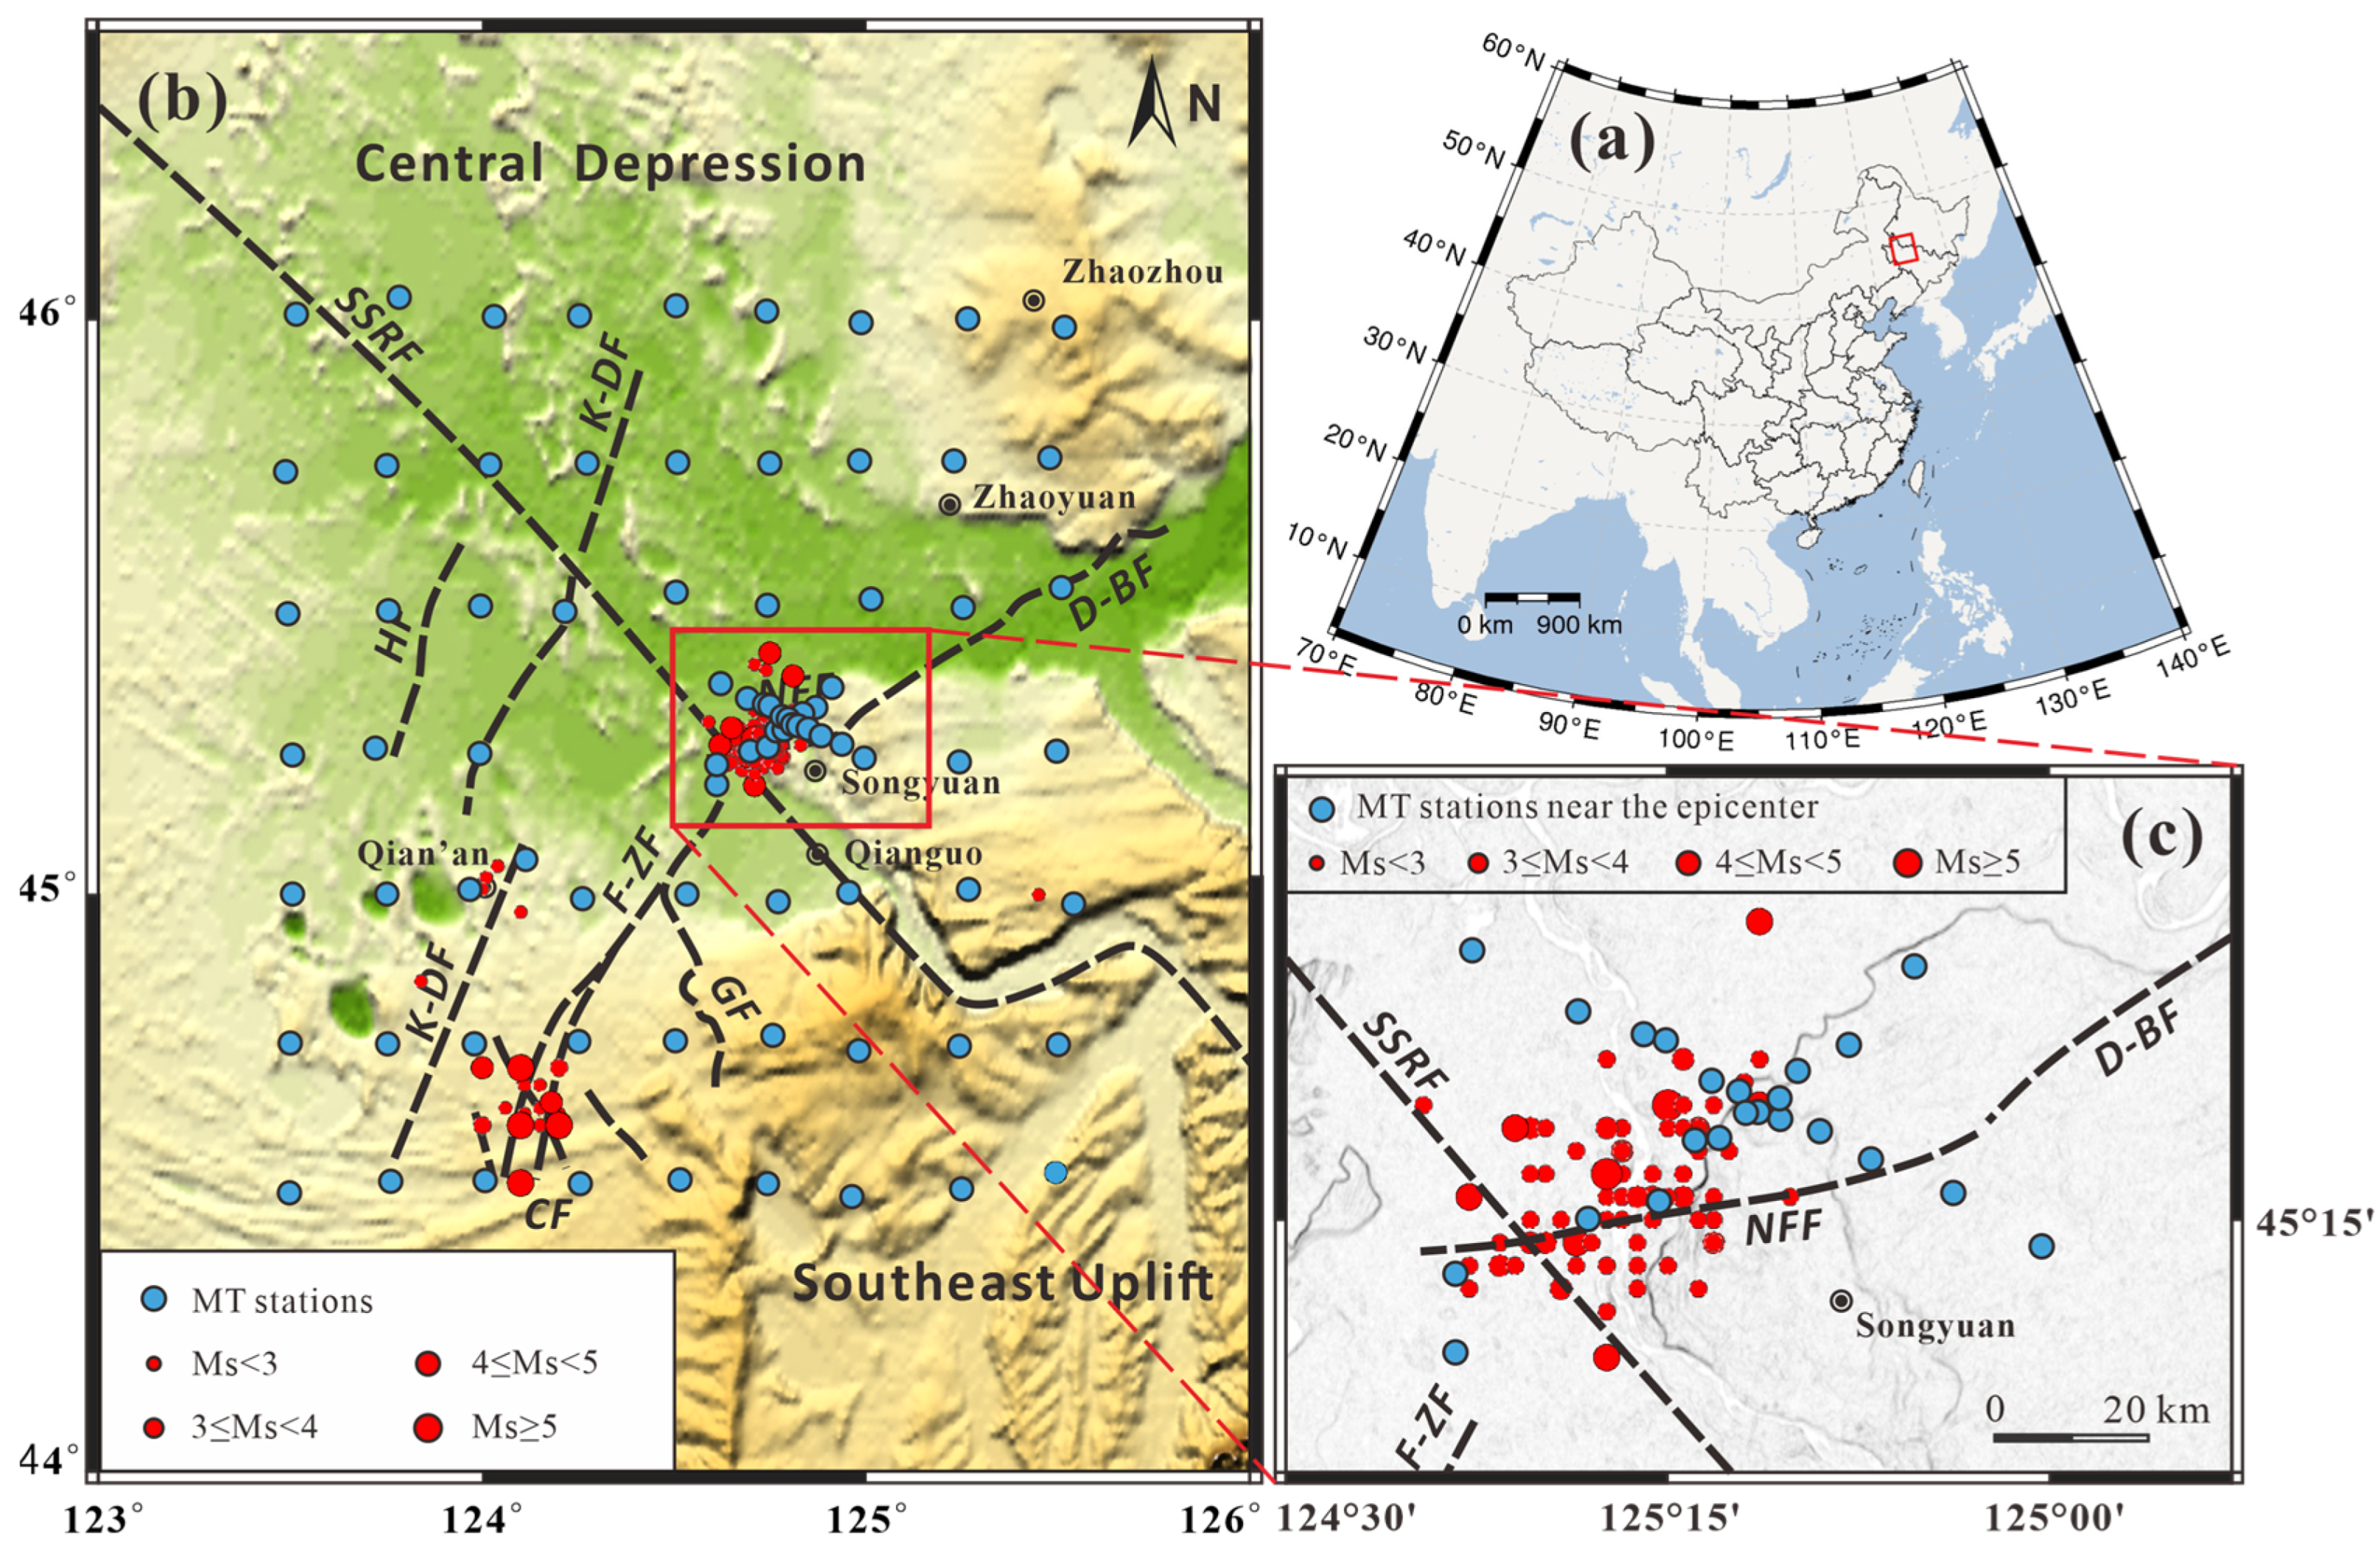
(a) The location of the study area. (b) The topographic map of the study area with the distribution of the MT stations (modified from [11]); (c) MT stations distribution near the Songyuan earthquake swarm. The earthquake data set was provided by the China Earthquake Networks Center, National Earthquake Data Center: http://data.earthquake.cn (accessed on 28 May 2023). SSRF: Second Songhua River fault; F-ZF: Fuyu–Zhaodong fault; NFF: North Fuyu fault; D-BF: Dawa–Bohetai fault; K-DF: Keshan–Daan fault; HF: Honggang fault; GF: Gudian fault; CF: Chaganhua fault.
Three main hypotheses regarding the seismogenic mechanism of earthquakes in the Songyuan area have been proposed: (1) “magma bubble” bursting: earthquakes occur as a result of the sudden energy release from a magma bubble bursting and the consequent overlying strata fracturing [12]; (2) fluid-induced seismicity [1,4,13]; and (3) seismicity associated with the exploration of hydrocarbons [14,15]. However, it remains unclear which of these proposed mechanisms applies to earthquakes in the Songyuan area, meaning that further studies are needed to identify the reason for this seismicity.
Previous studies have mainly focused on revealing the seismogenic environment and large-scale tectonic background of the Songyuan earthquake, lacking the structural characteristics of the earthquake area from deep to shallow due to geophysical data constraints, as the connection of the crust–mantle structure and the material exchange process were not clear. The MT method is very sensitive to the existence of partial melting or fluid conductors [16,17,18,19,20], which has been widely used in the study of deep structures including seismogenic zones [21]. Based on an MT 3D inversion model, combined with the deep and shallow structure of the Songyuan seismic area, we reveal the deep seismogenic environment and seismogenic mechanism in the Songyuan area, which is of great significance for the study of regional earthquake prediction and prevention.
2. Regional Tectonic Setting
The Songliao Basin is located in the Songnen block in Northeast China (Figure 1), controlled by the Nenjiang–Balihan fault in the west and the Yilan–Yitong fault in the east [22]. A composite sedimentary basin with a fault depression dual structure was formed [23]. The evolution of the basin was influenced by the upwelling of deep mantle material and associated extension during the early period, and was subsequently controlled by a compressional environment induced by Paleo-Pacific plate subduction underneath Asia during the late period.
The Songyuan seismicity area is located at the intersection of the central depression and Southeast uplift belt in the basin (Figure 1b). There are a large number of NE- and NW-trending conjugate faults in the area, including the NE-trending Fuyu–Zhaodong fault, Keshan–Da’an fault, and Honggang fault, and the NW-trending Second Songhua River fault and Gudian fault. At the intersection of the second Songhuajiang fault and the Fuyu–Zhaodong fault, the Qianguo earthquake with Ms 6.75 occurred in 1119. The length of the Fuyu–Zhaodong fault can reach 130 km [24], which can be divided into the Fuyu–Zhaodong fault in the south, the North Fuyu fault in the middle, and the Dawa-Bohetai fault in the north.
3. Data Acquisition
The MT data were collected by using the V5-2000 magnetotelluric system from the Phoenix company of Canada. Two orthogonal electrical field components (Ex and Ey) and three orthogonal magnetic field components (Hx, Hy, and Hz) were recorded at each site with the axis directions corresponding to geographic north–south (x), east–west (y), and vertically downward (z). In 2017, survey profiles AA’ and BB’ were arranged near the Ningjiang earthquake swarm in the Songyuan area, including 23 broadband MT sites with a spacing of 2 km (Figure 1c). The average site spacing of 2 km could reflect a more refined structure, which can better display the structural characteristics of the upper and middle crust. In 2018, data were collected from 59 broadband MT sites with a spacing of 5 km around the Ningjiang earthquake swarm. The average site spacing was 5 km (Figure 1b). The average site spacing can effectively constrain deep information. If the distance increases, the structural characteristics of deep structures cannot be reflected well. If the distance decreases, the costs will be increased. So, the average site spacing of 5 km is more cost-effective. The recording time of each measuring site was more than 20 h, with a period range of 0.003 to 2000 s.
4. Data Analysis
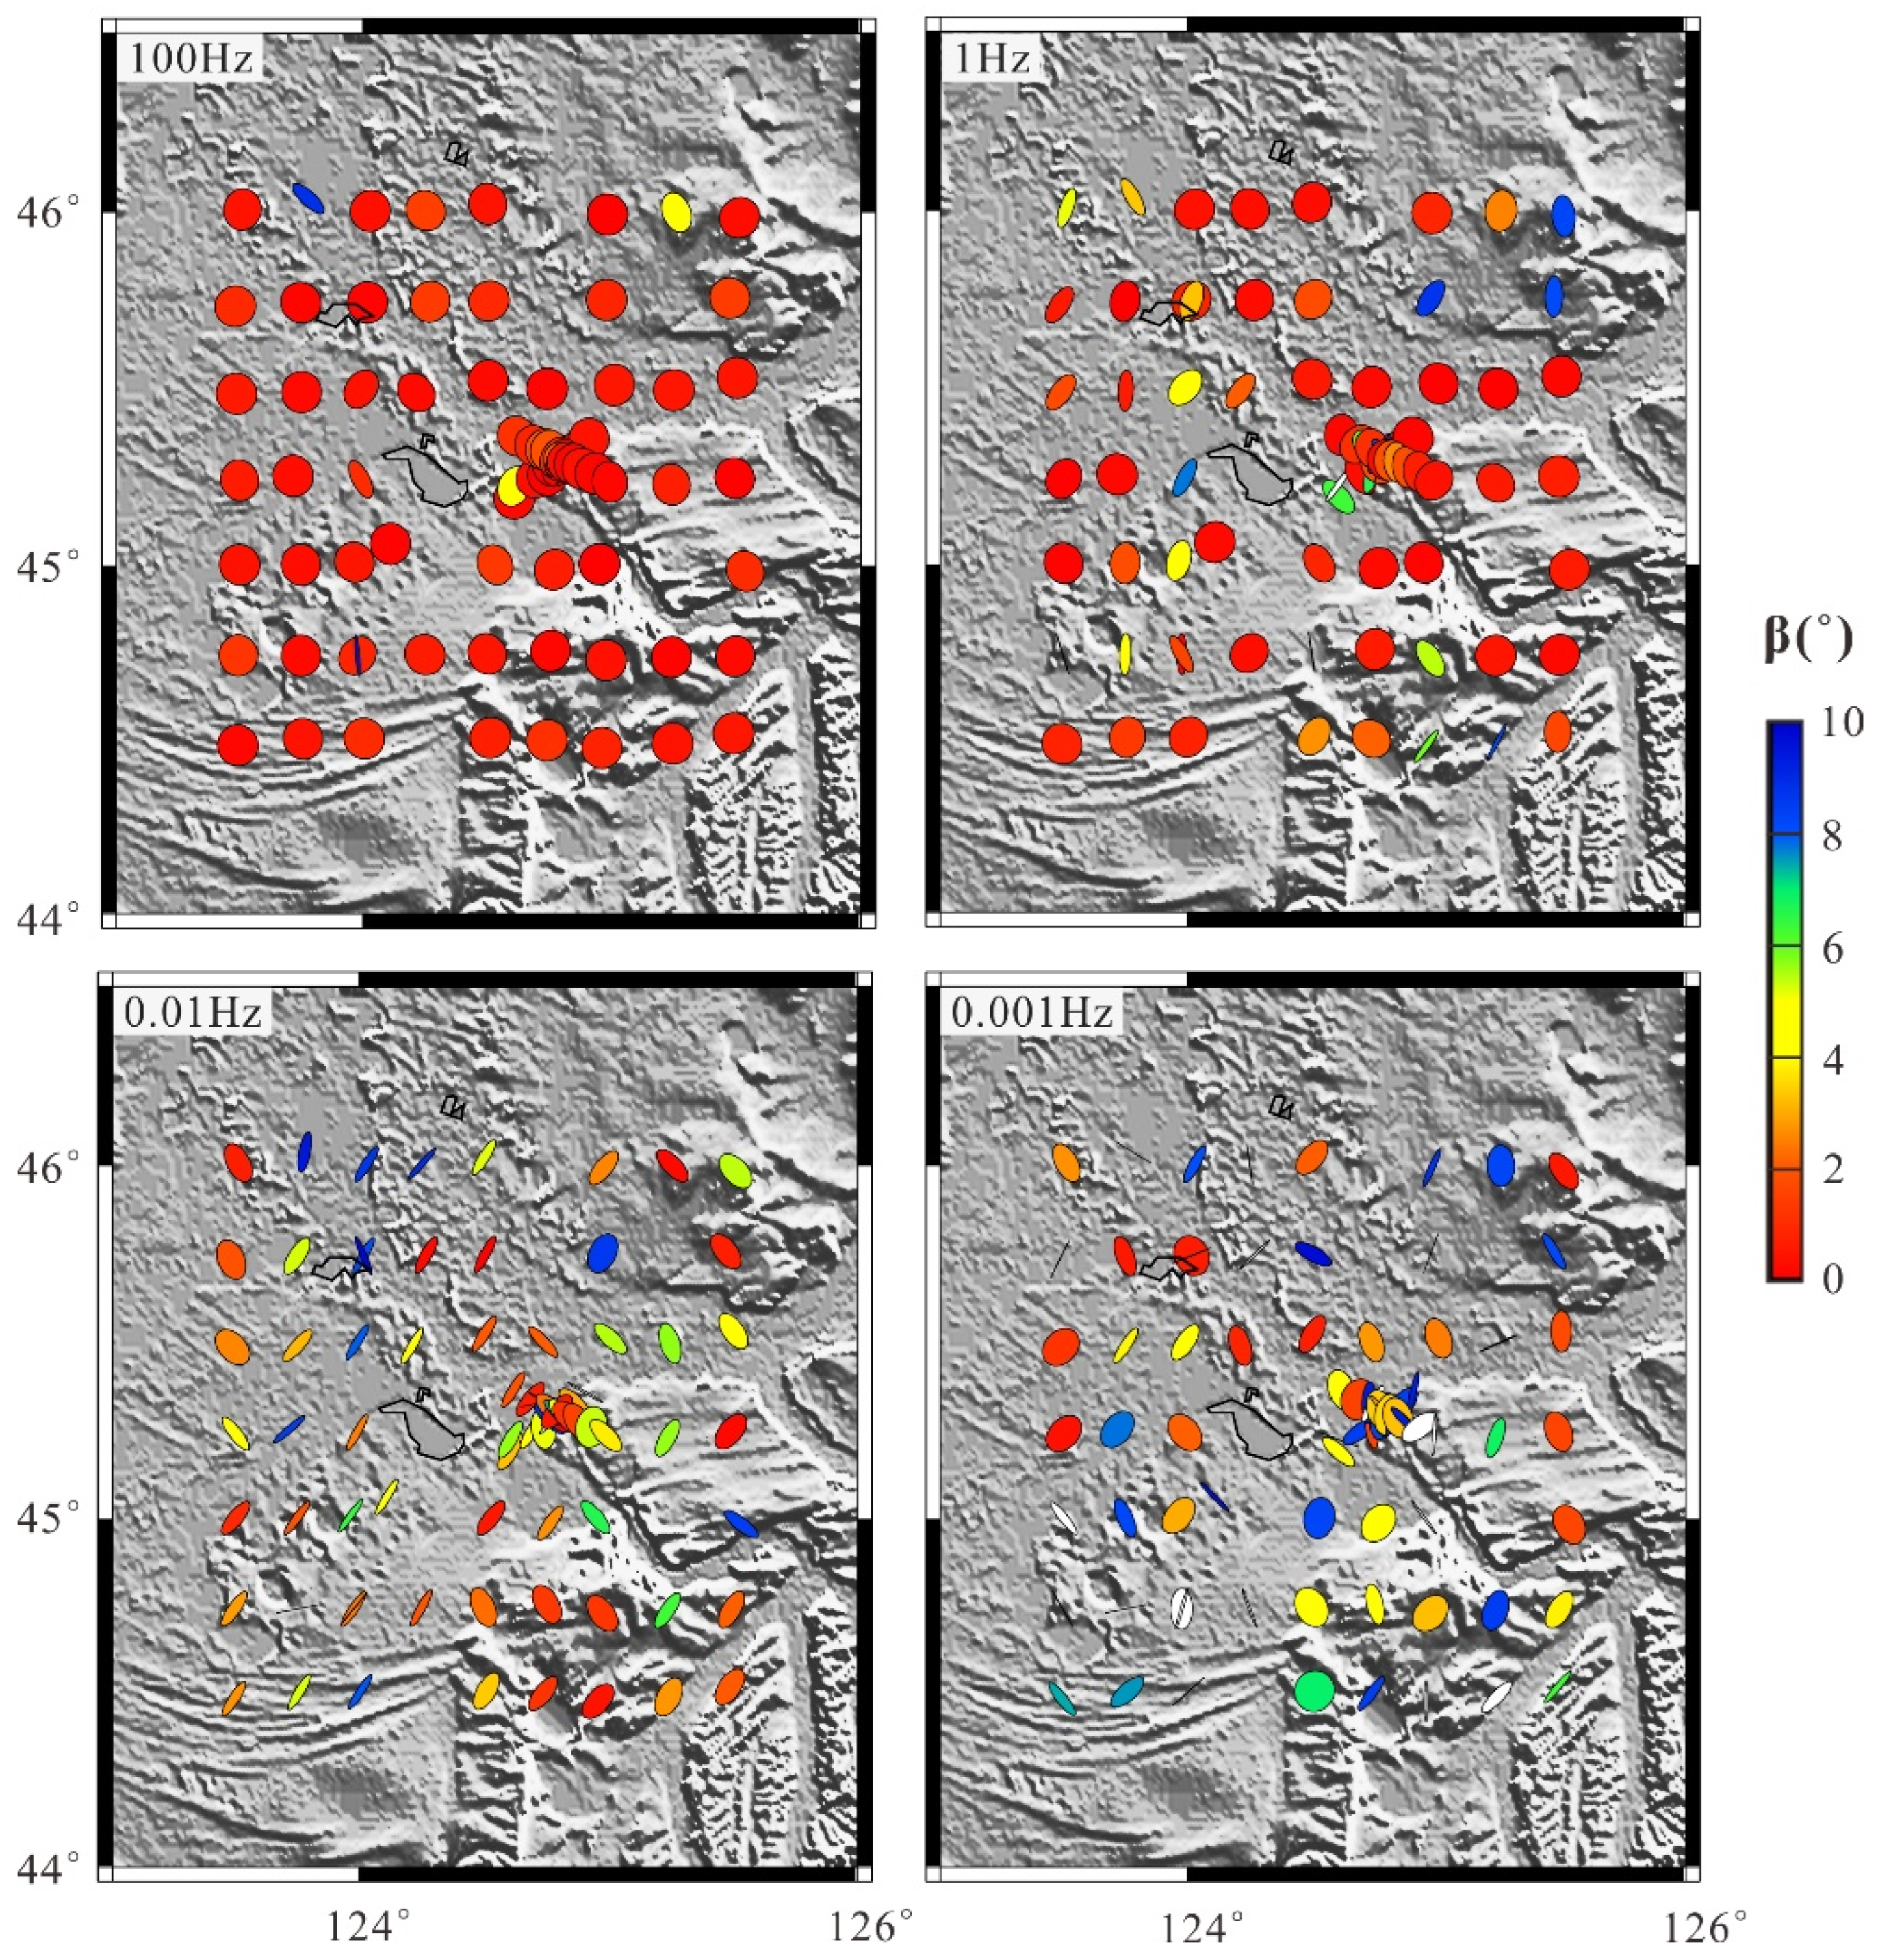
Because the phase tensor method [25] is not affected by the current distortion, we used it to analyze the dimensionality of the data. Under 1D conditions, the phase tensor ellipse of the measuring sites is close to a circle. A skew angle β smaller than 3° represents a 2D structure, and the direction of the major axis (maximum phase φmax) of the ellipse indicates the strike of regional tectonics. When β is greater than 3°, the underground structure shows strong 3D characteristics. Figure 2 shows the phase tensor ellipses at different frequencies of all MT data sites in the study area, the β of most of which in the 1–100 Hz band was less than 3°, and the major axis and minor axis of the ellipse were basically the same, which indicates that the shallow part is one-dimensional and mainly characterized by basin sedimentation. At frequencies of 0.01 and 0.001 Hz, the elliptical polarization is obvious; the main axis direction is NE and NW, which is basically consistent with the strike of the fault structure in the study area, and β is generally greater than 3°. It shows strong 3D characteristics in the deep region. Based on the above analysis, we chose to carry out 3D inversion on the data to more accurately reflect the deep structure of the study area.
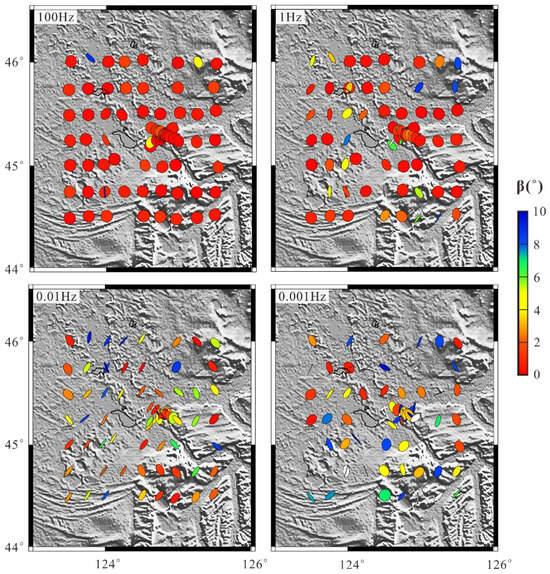
Figure 2.
Distribution and characteristics of phase tensor ellipses for measuring sites in the Songyuan area.
5. 3D Inversion
Based on the nonlinear conjugate gradient (NLCG) algorithm, the Mod EM electromagnetic inversion system [26] was used to carry out large-scale 3D inversion for the regional MT data and small-scale 3D inversion for two MT profiles near the Ningjiang earthquake swarm.
For the large-scale 3D inversion, 54 sites with uniform spacing and high data quality were selected from 82 magnetotelluric sounding data points. The input data were composed of 28 full-impedance tensor data points in the period range of 0.003–2000 s, but the frequency band with poor data quality was deleted, and an error floor of 5% of |Zxy × Zyx|0.5 was added. We chose a background resistivity of 100 Ω·m. The minimum cell length was 4 km along the X direction (north–south) and 4 km along the Y direction (east–west), with a total of 50 × 50 grids. Along the Z direction (vertical direction), the first layer of the grid was 14 m, and the layer thickness increased downward with a coefficient of 1.3, with a total of 30 grids. Five meshes were expanded along three directions with a coefficient of 2.5, and the smoothing coefficient was set to 0.3. After 22 iterations, the large-scale 3D electrical structure over 85 km in the study area was obtained, and the overall misfit error (RMS) was 3.57.
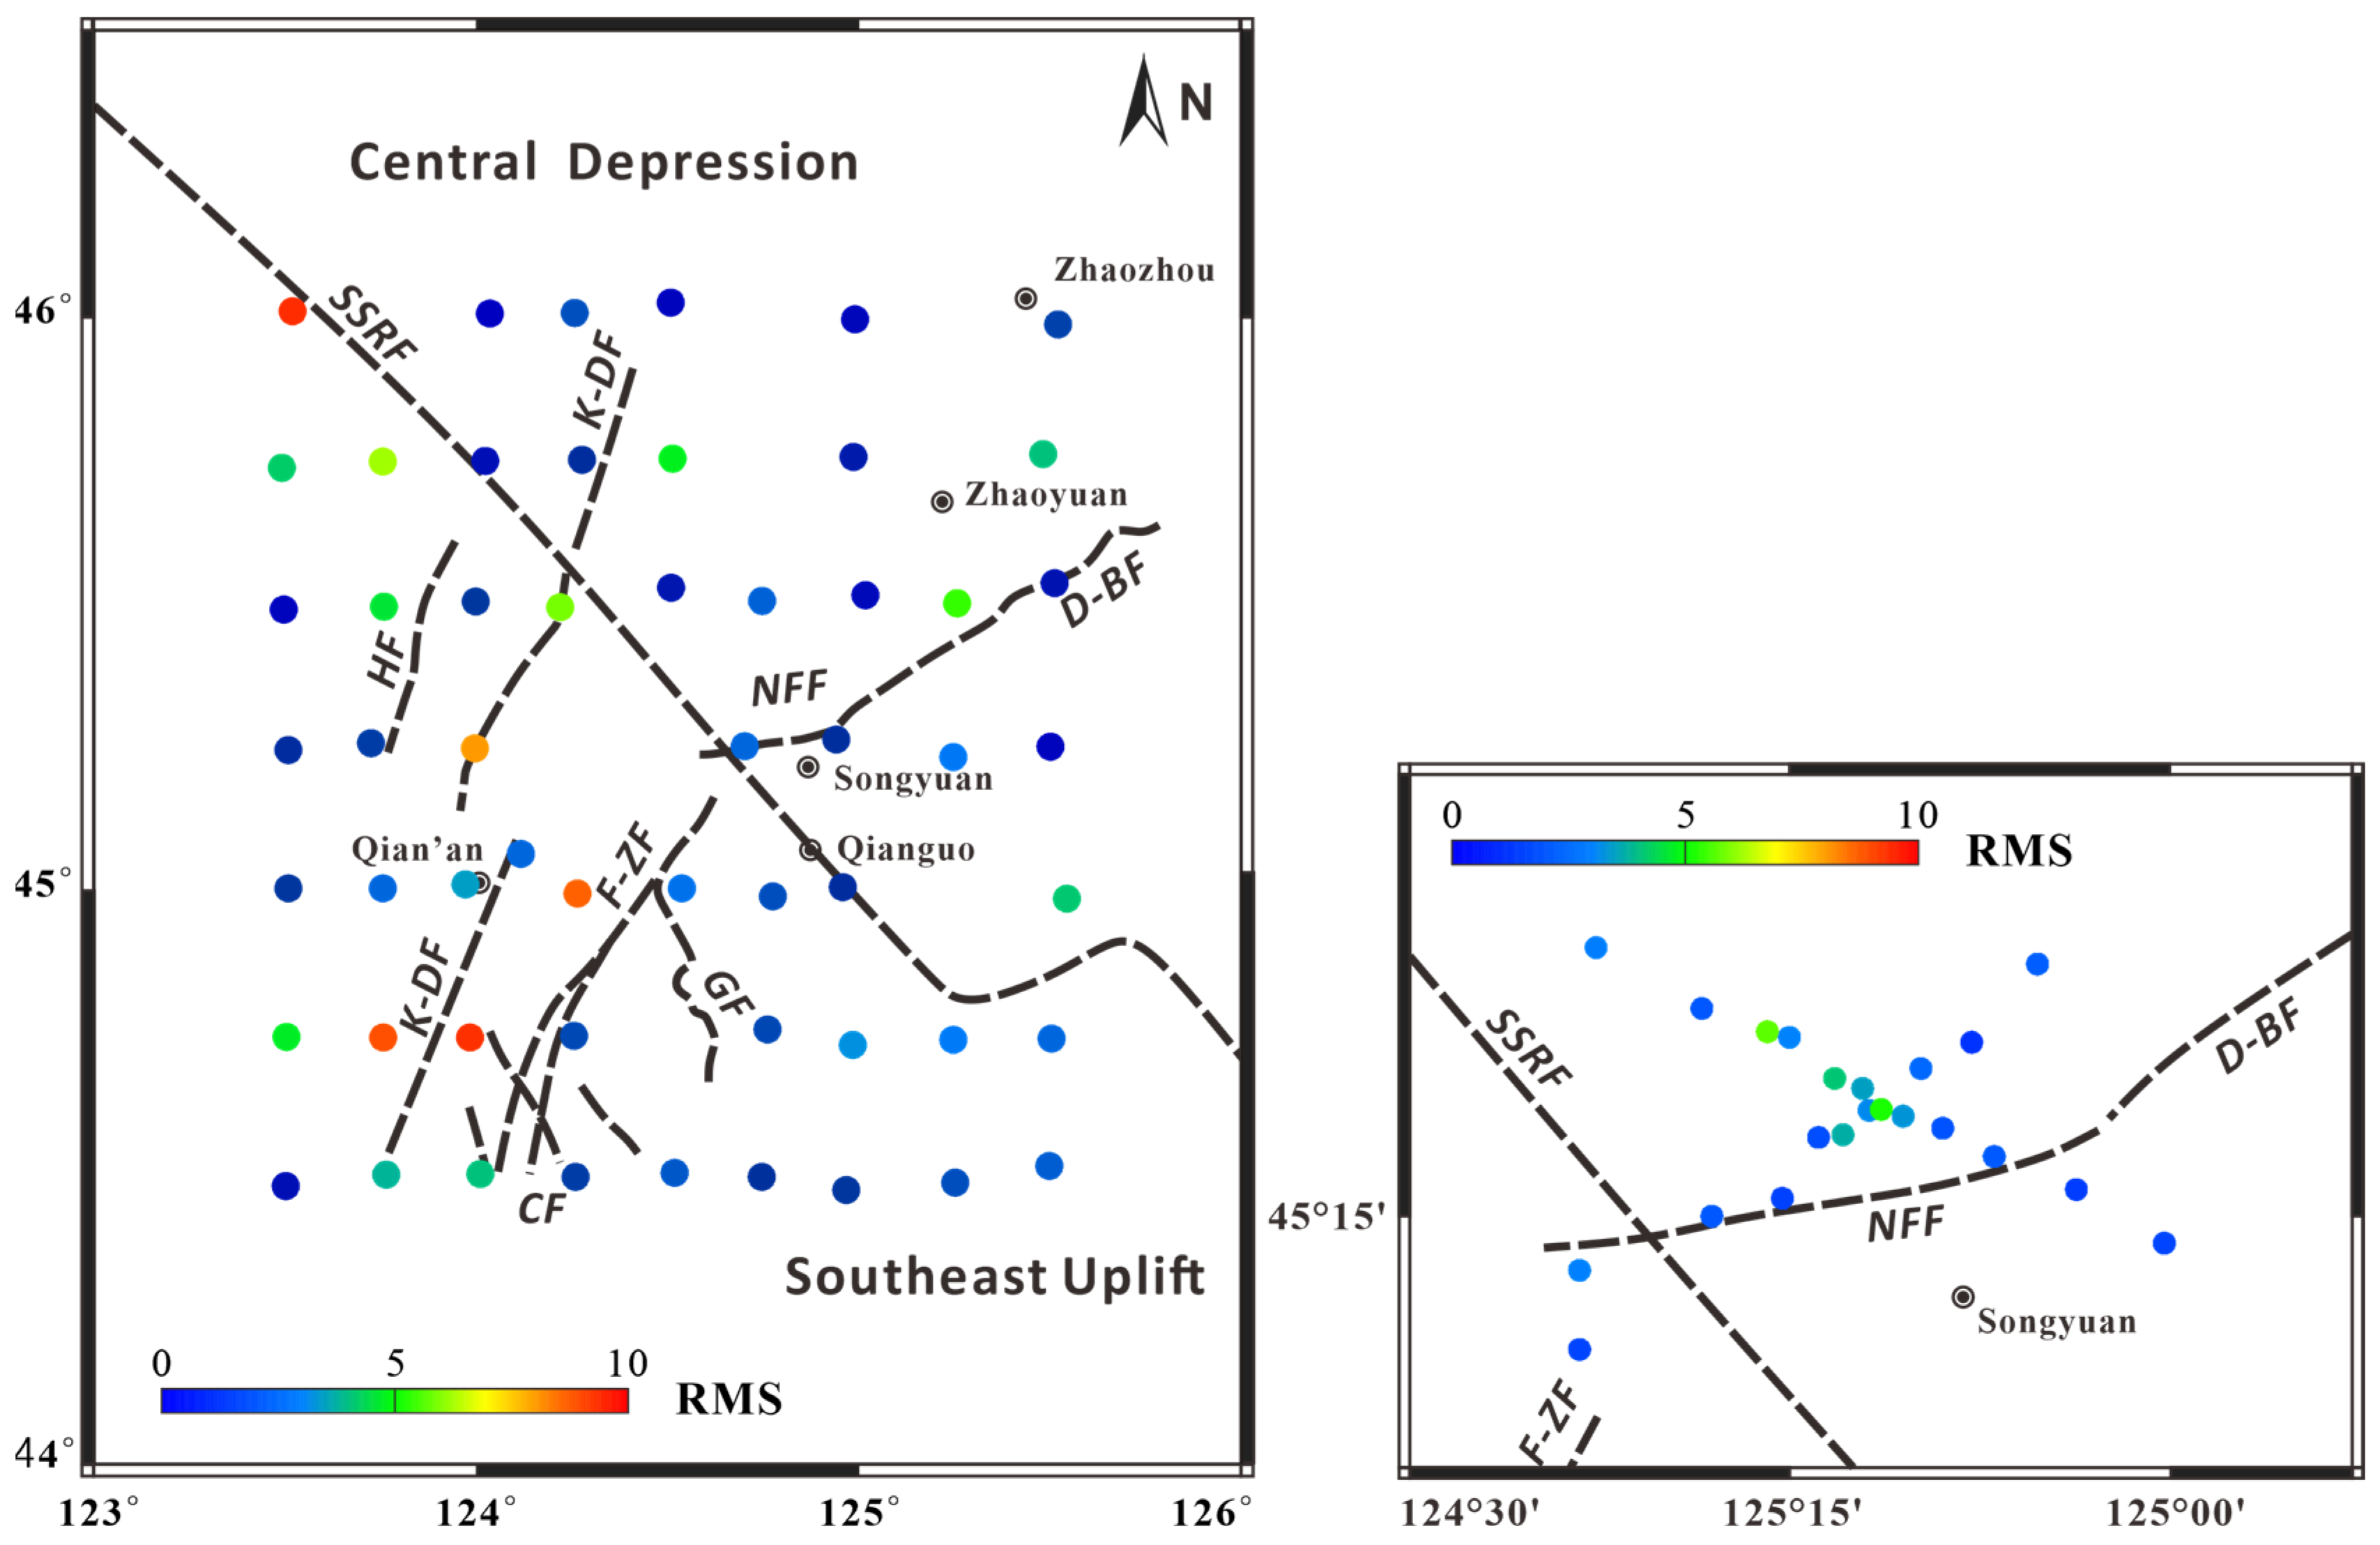
For the small-scale 3D inversion, 22 observation sites of two MT profiles in the Ningjiang seismic area were selected, and the input data were composed of 28 full-impedance tensor data points in the period range of 0.003–2000 s, with the added error floor of 5% |Zxy × Zyx|0.5. We again chose the background resistivity of 100 Ω·m. The minimum cell length was 1 km along the X direction and 2 km along the Y direction, with a total of 25 × 20 grids. Along the Z direction, the first layer of the grid was 15 m, and the layer thickness increased downward with a coefficient of 1.22, with a total of 30 grids. Five meshes were expanded along three directions with a coefficient of 2.5, and the smoothing coefficient was set to 0.3. After 64 iterations, the small-scale 3D electrical structure near the Ningjiang earthquake swarm was obtained, and the RMS was reduced to 2.94. Figure 3 shows the RMS of each measuring site for the two kinds of 3D inversion.
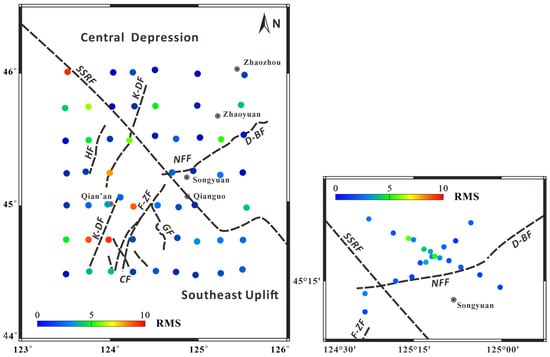
Figure 3.
Site-by-site RMS of large-scale and small-scale 3D inversion (refer to Figure 1 for fault names).
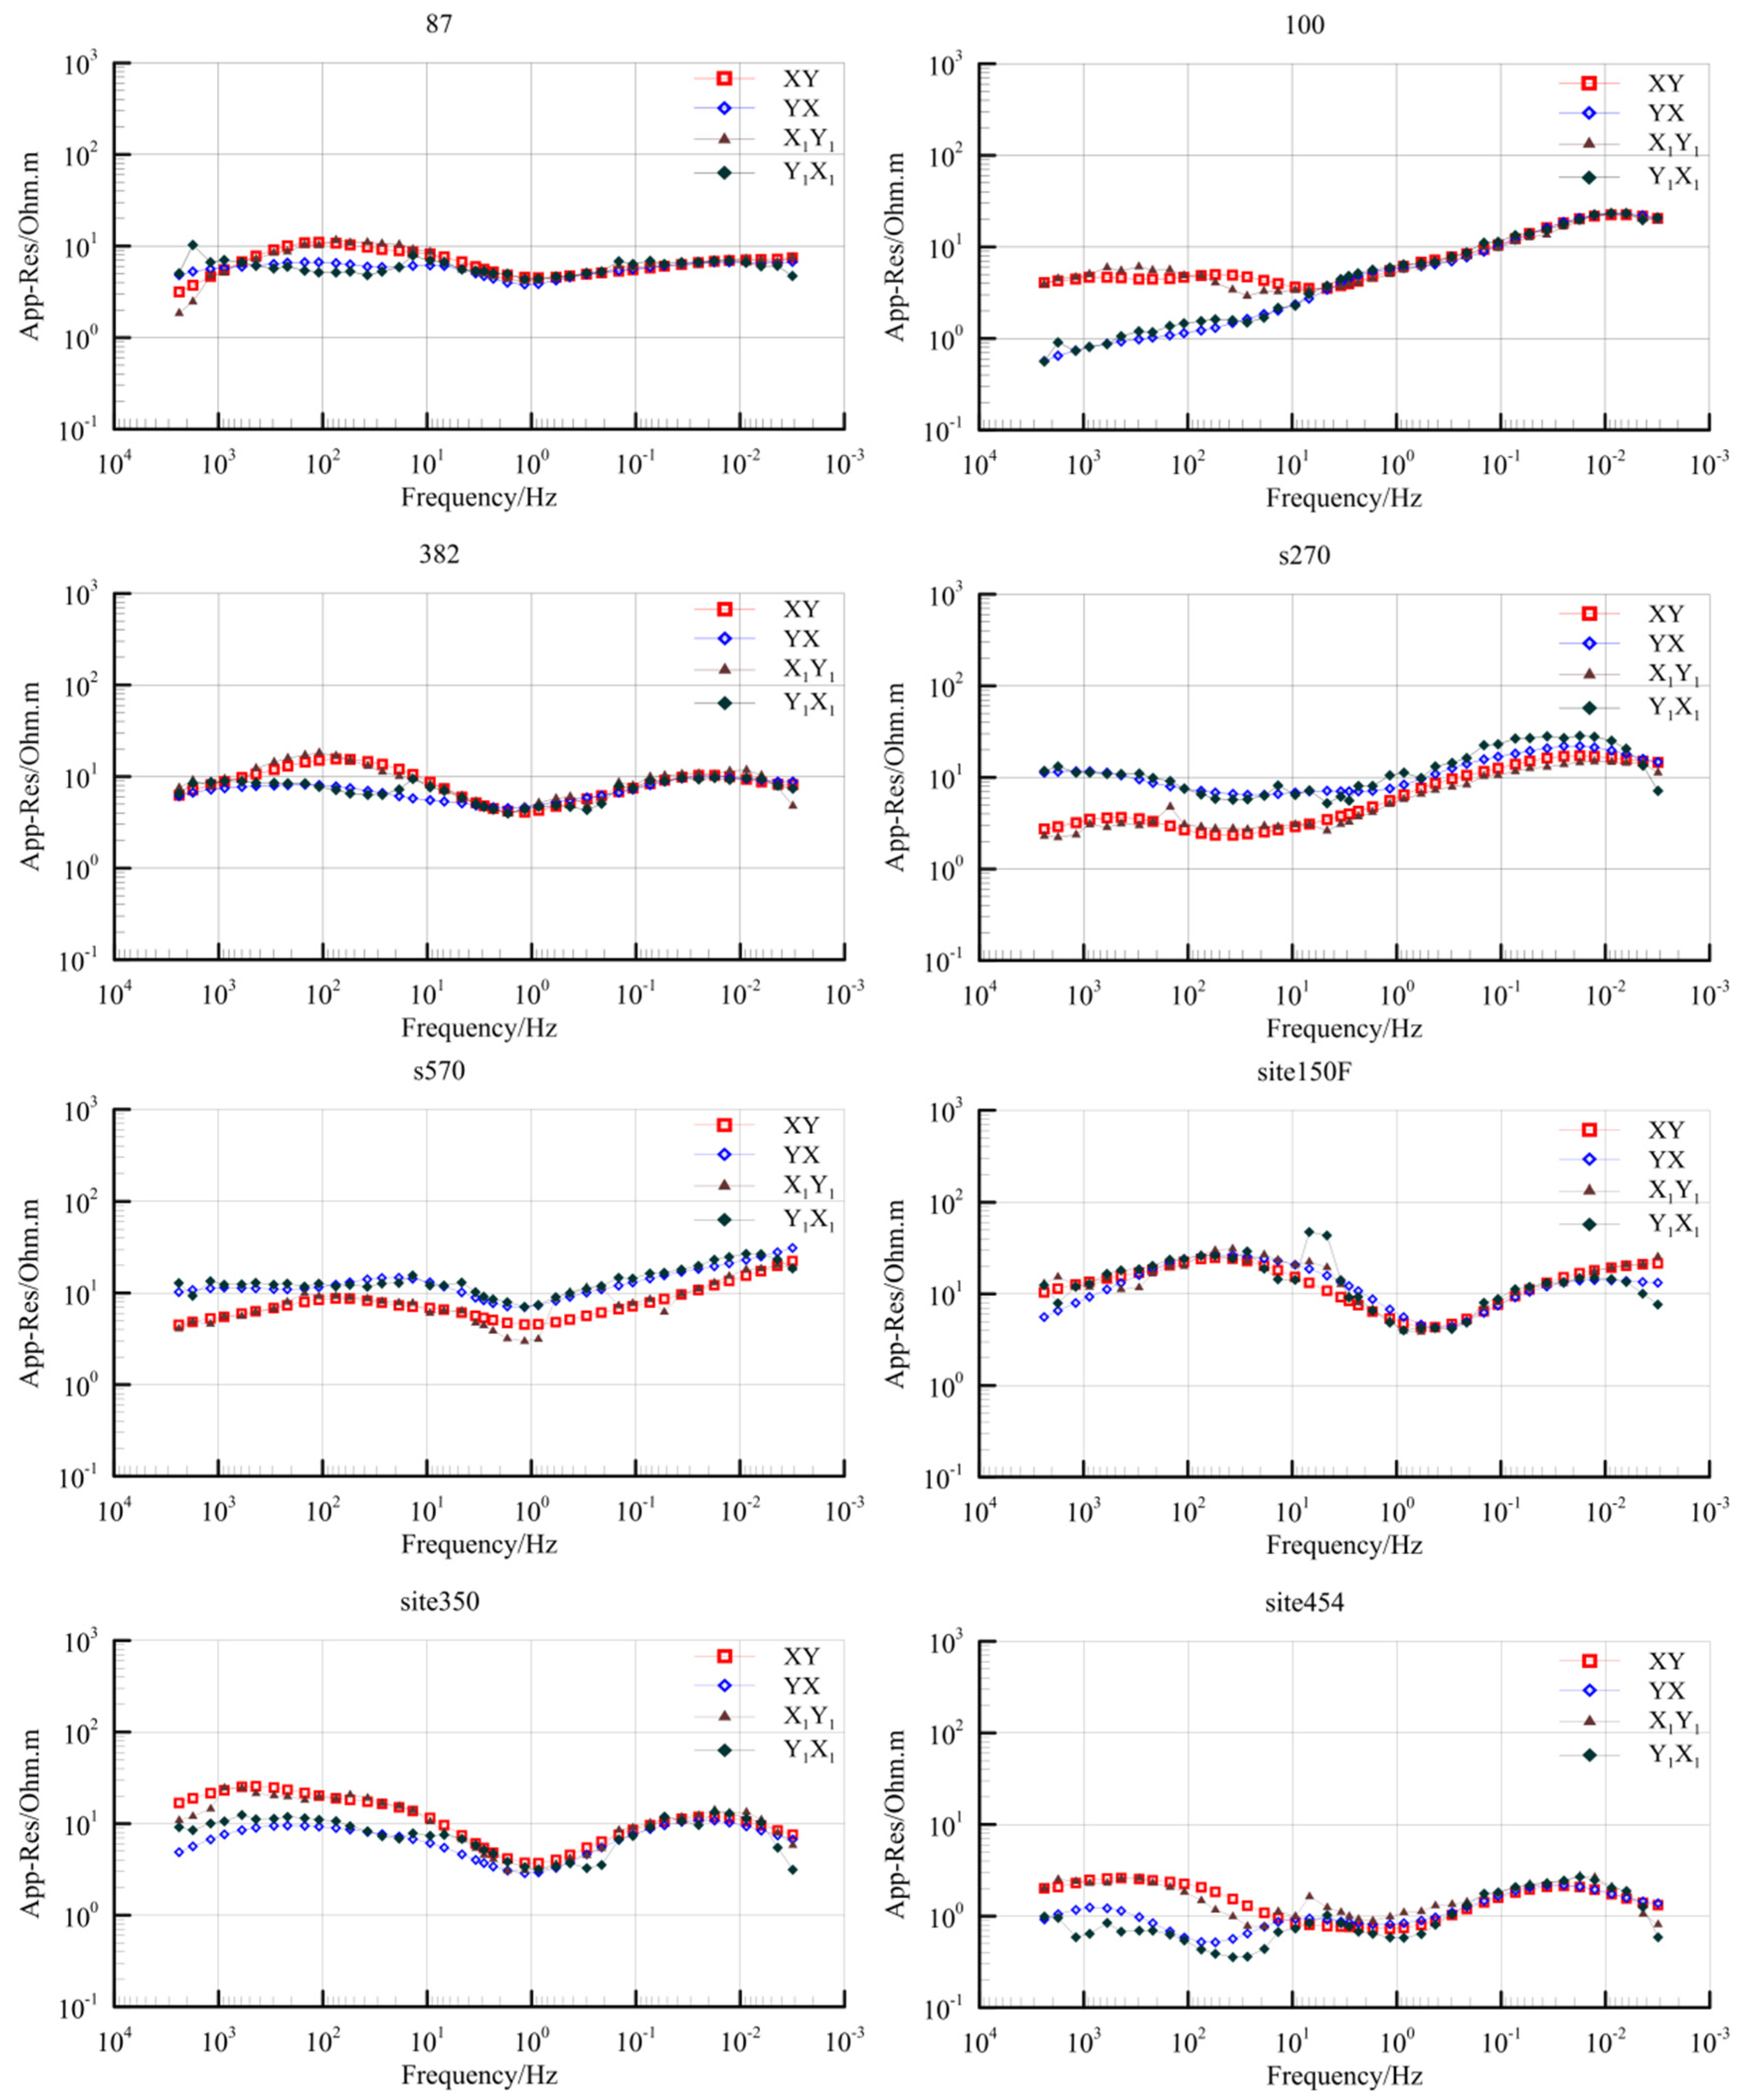
Comparing the resistivity curve fitting between the original data of some measuring points involved in inversion and the model data demonstrates a high degree of fitting and reliable inversion results (Figure 4).
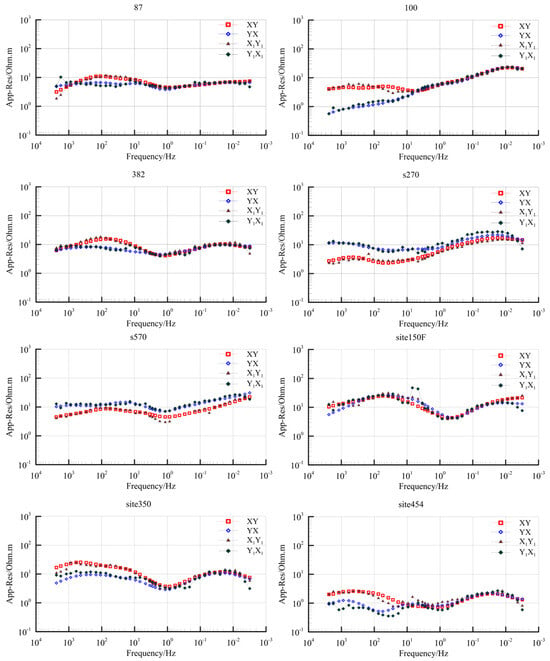
Figure 4.
Comparison between the measured apparent resistivity curve and the inversion model apparent resistivity curve. XY and YX reflect the observed data, while X1Y1 and Y1X1 represents the modeled data.
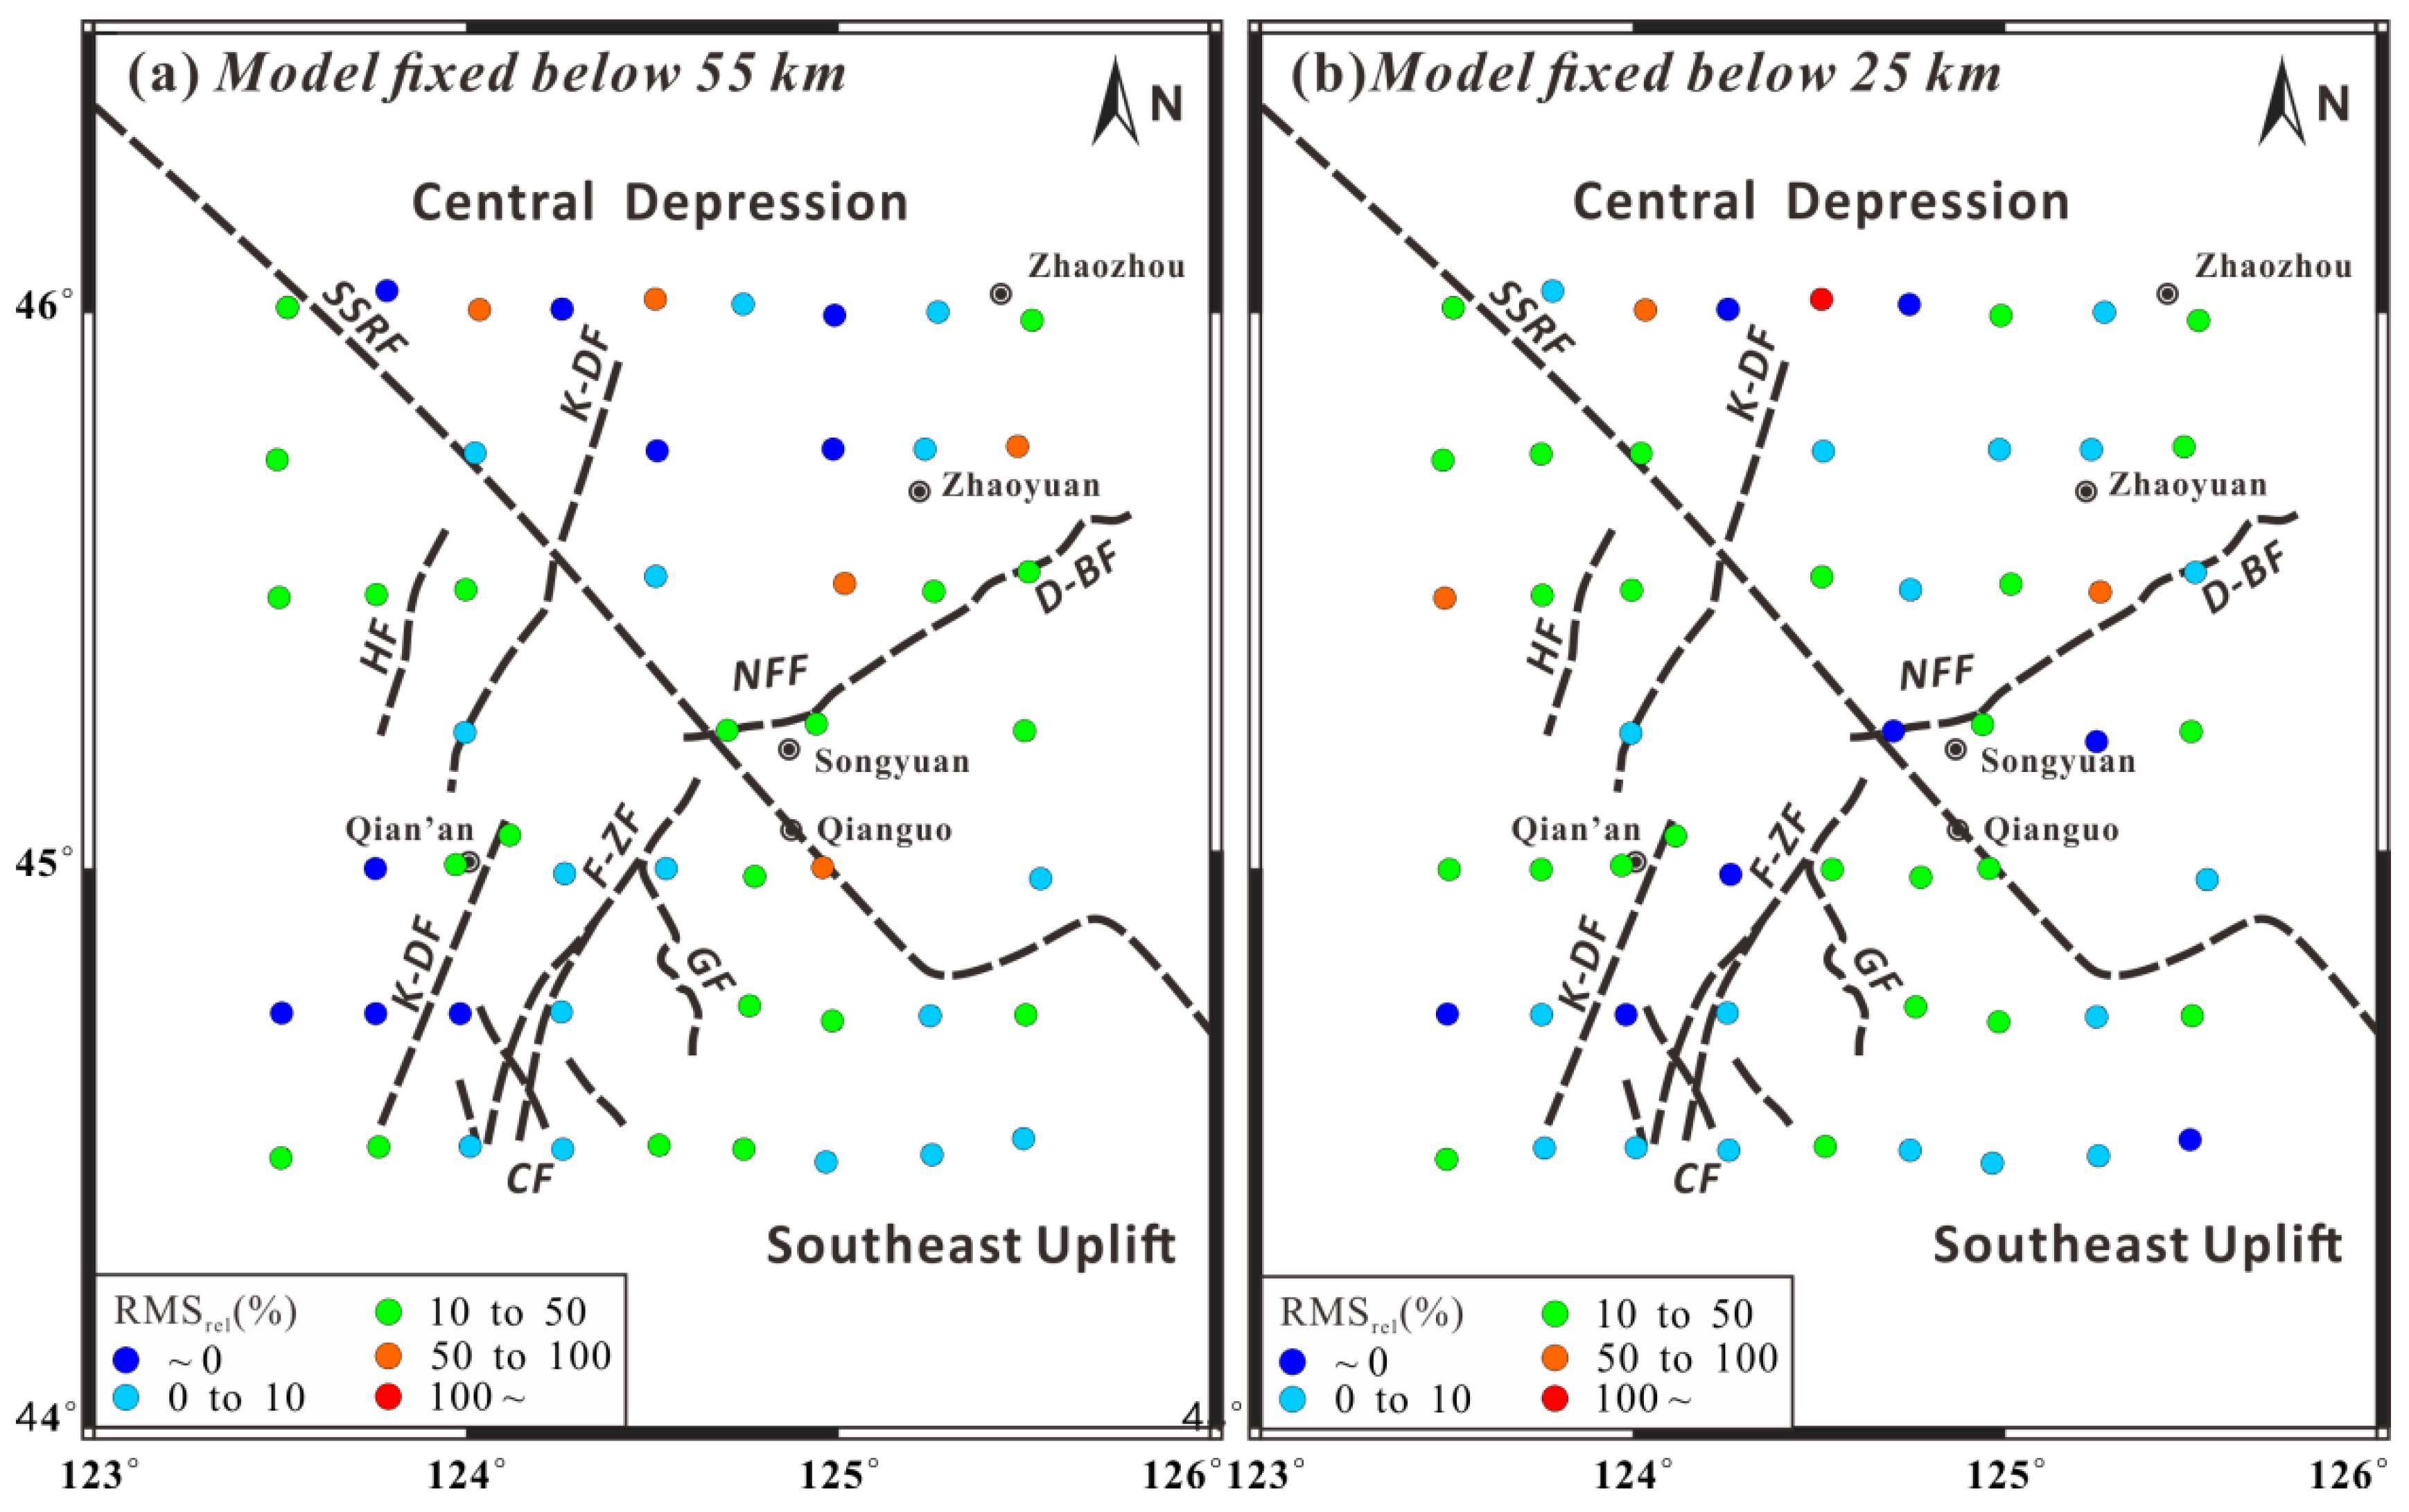
Due to the MT method not being as effective as the shallow one in restraining the deep structure, we tested the depth sensitivity of the large-scale 3D inversion results. The structures below 55 km and 25 km of the preferred model were replaced by the background resistivity of 100 Ω·m. Through forward modeling of the modified model, the RMS of the modified model was obtained. The relative fitting error percentage formula was introduced.
Since the MT method has a weaker constraint on the deep structure than the shallow one, we tested the depth sensitivity of the large-scale 3D inversion results. We obtained the model of the structure under 55 km and 25 km to replace the background resistivity of 100 Ω·m. We performed forward modeling on the modified model and obtained its fitting error. The relative fitting difference percentage calculation formula is as follows:
where RMSrel is the relative misfit error percentage, RMSrep is the misfit error of the new model after replacing the anomaly, and RMSpre is the misfit error of the original model.
Figure 5 shows the percentage of relative fitting error of each measuring site after modifying the resistivity at different depths. The RMSrel is negative or less than 10%, which means that the replaced resistivity has no worse an effect on the inversion results, indicating that the anomaly is not credible. For the deep low-resistivity structure in this paper, the RMSrel of the corresponding measuring sites is basically greater than 10%, which indicates that the anomaly is true and reliable.
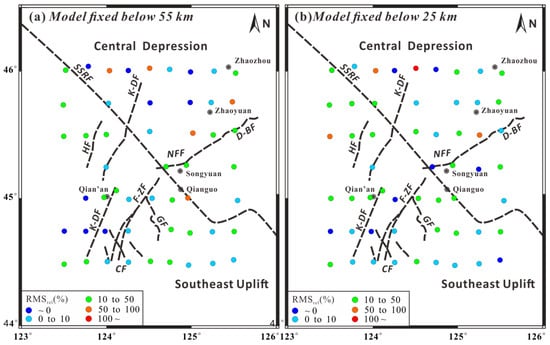
Figure 5.
Sensitivity test of the deep-resistivity structure in the preferred model.
6. Interpretation and Discussion
6.1. Shallow Low-Resistivity Fault
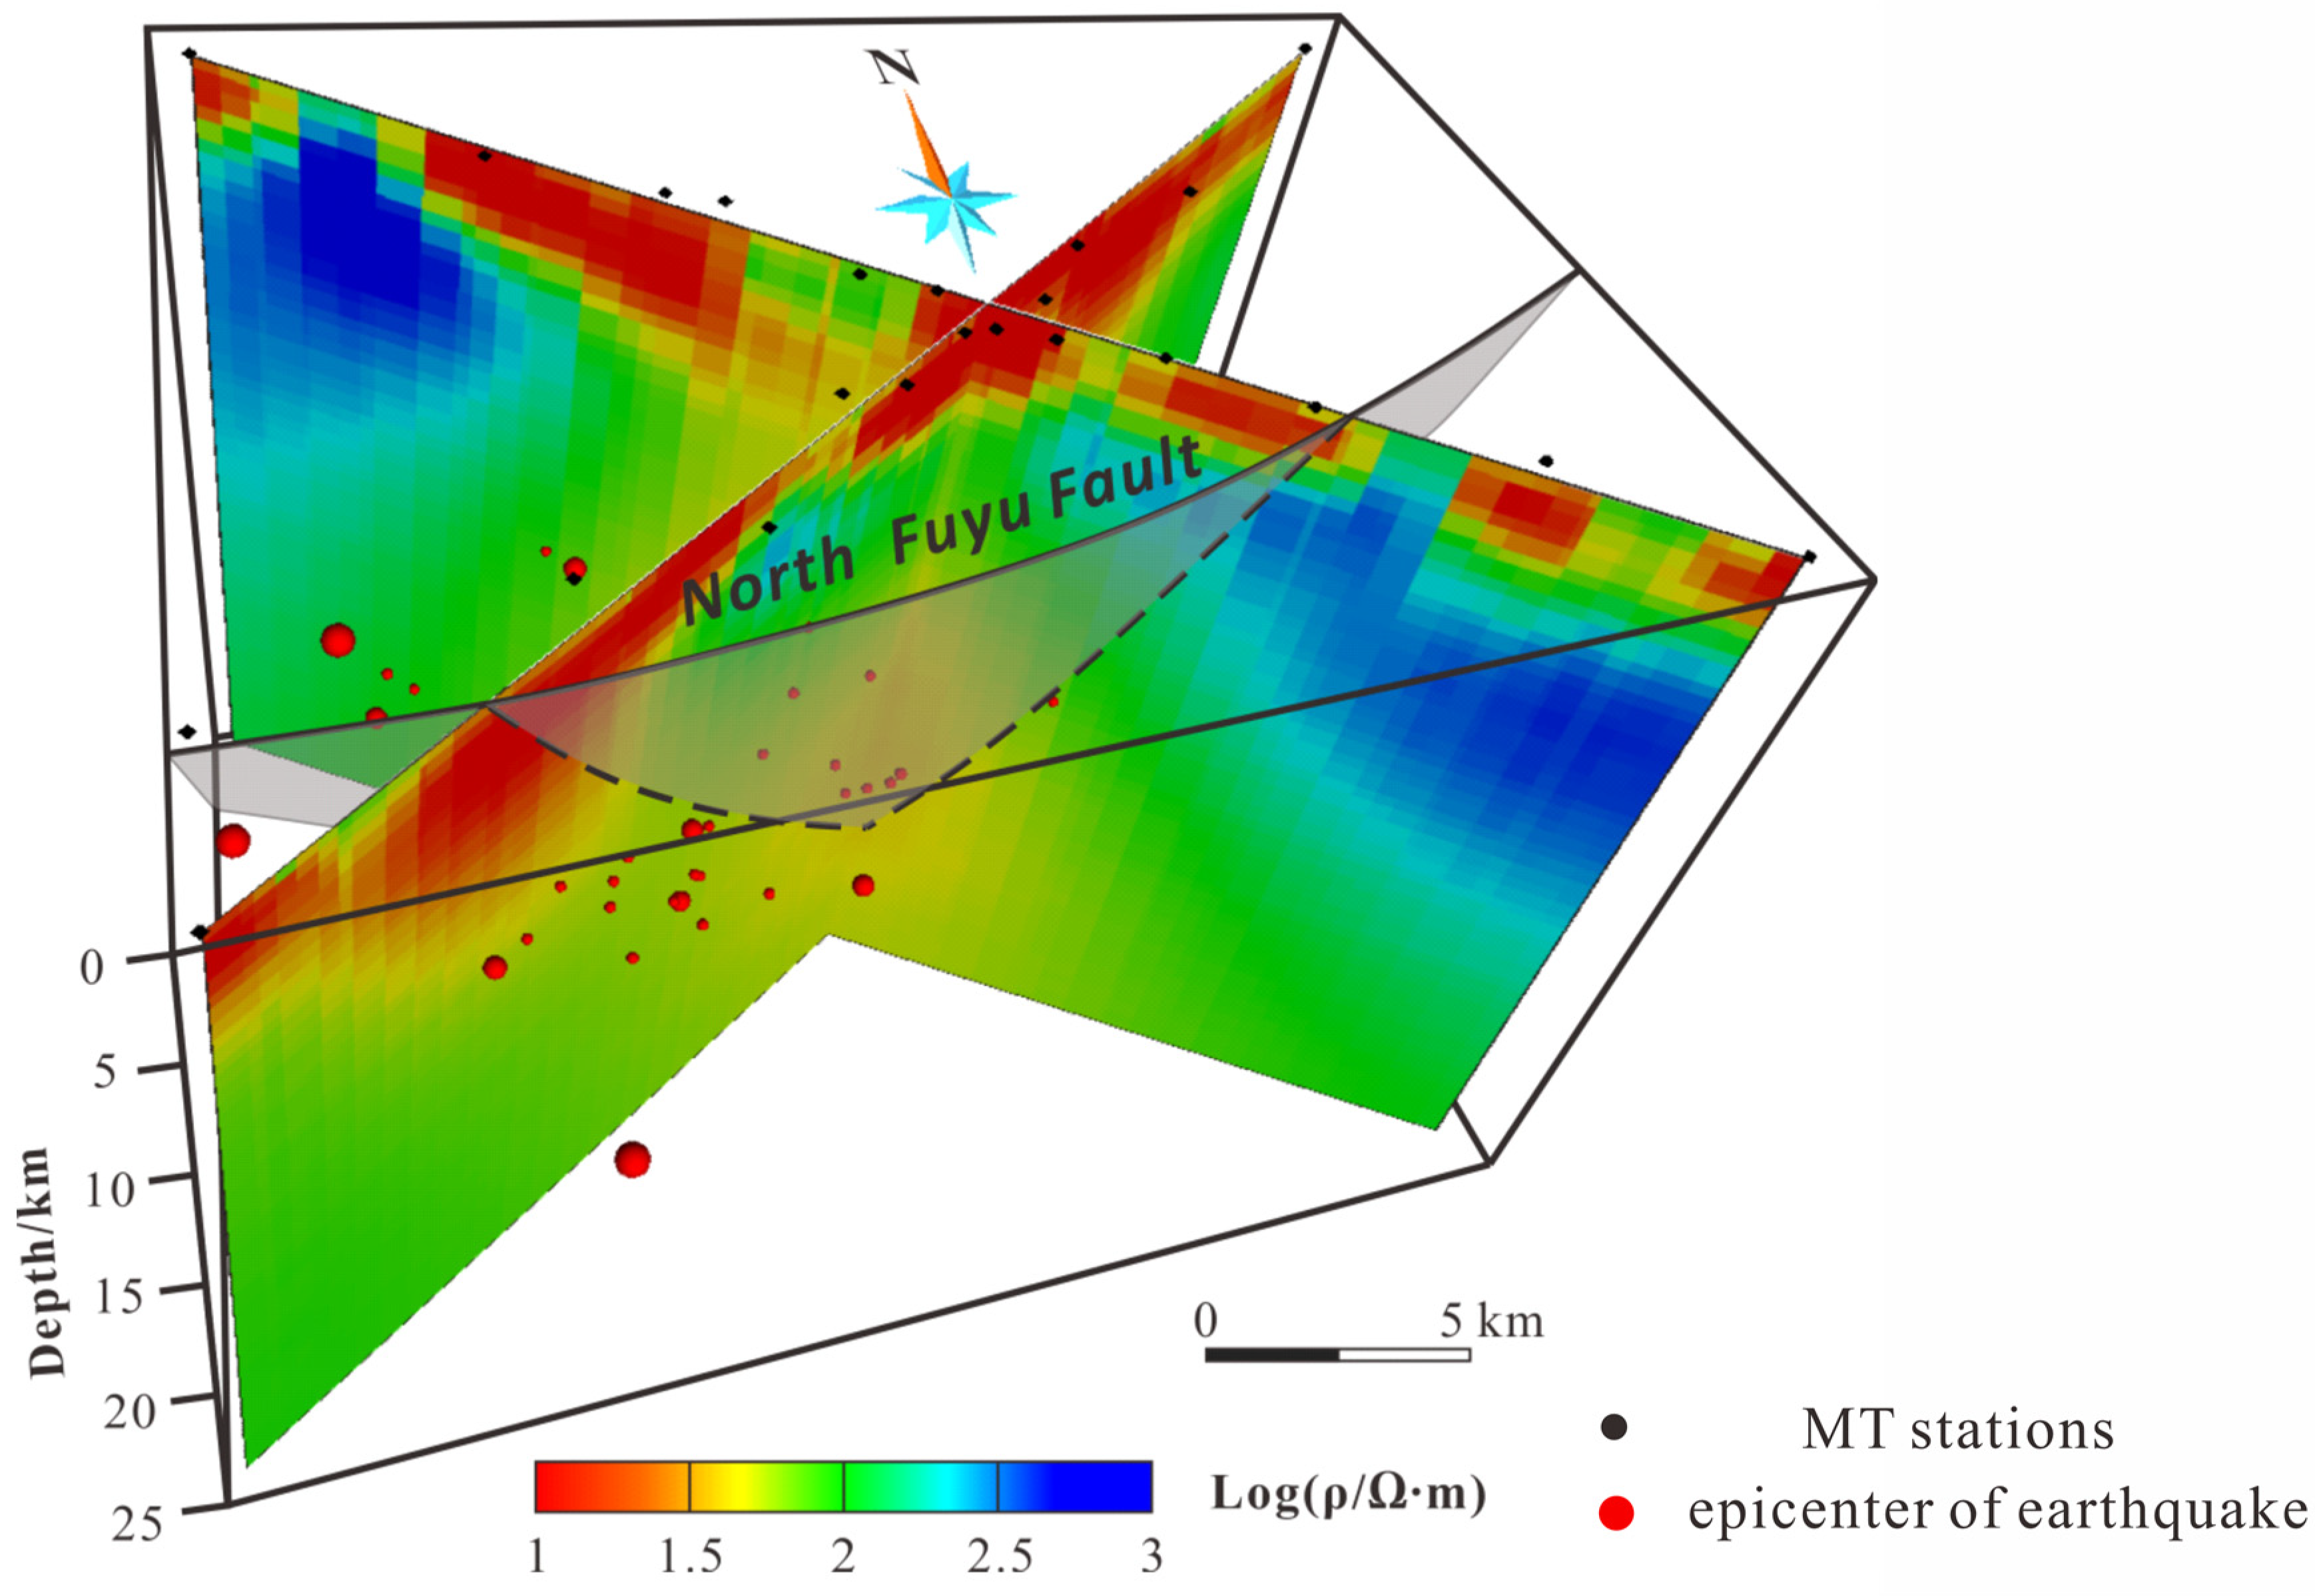
Figure 6 shows the electrical section cut out along the two profiles of the preferred model for small-scale 3D inversion. There is a thin low-resistivity layer anomaly in the shallow subsurface. The sediments here are composed of Paleozoic to Cenozoic strata [11]. The resistivity structure of the crystalline basement below the sediments shows a medium–high resistivity of >400 Ω·m (Figure 6). The main feature of the two studied profiles is a conductive zone, with a resistivity of <10 Ω·m, indicating the deep structure of the North Fuyu fault with the near east–west strike. The interior of the fault zone is filled with some fluids, breccia clasts, and other materials, which makes the resistivity of the fracture zone lower than that of the surrounding rock. Tang et al. [13] also conducted MT research in the Songyuan area to discuss the seismogenic mechanism of the earthquake and identified the low-resistivity anomaly in the shallow part below the Ningjiang earthquake swarm. However, due to the limitation of the site spacing, the identification of the shallow fault structure is not particularly clear.
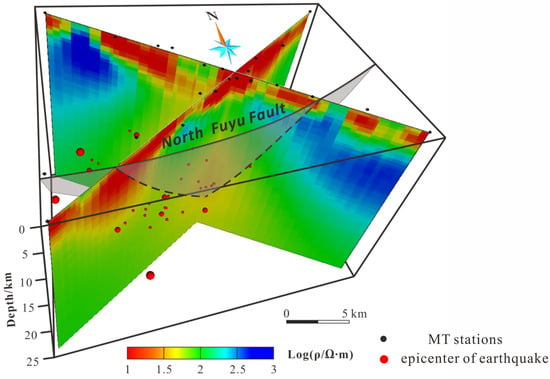
Figure 6.
Vertical slices of the small-scale 3D inversion model. Red dots represent the epicenter of the Ningjiang earthquake swarm, and black dots represent the MT stations involved in small-scale 3D inversion.
The Songyuan area is characterized by cluster distribution, mainly distributed in Chaganhua of Qianguo County and the Ningjiang district of Songyuan City. We projected the epicenter of the area into the 3D model (Figure 6) and found that the distribution of the epicenter, which is mainly distributed along the northeast direction, is consistent with the low-resistivity Fuyu–Zhaodong fault. In addition, the long axis of the seismic isointensity line is NE, which indicates that the Songyuan earthquake is controlled by the NE-trending fault activity or that the NE-trending fault participated in the activity at least [27]. We infer that the North Fuyu fault is closely related to the occurrence of the earthquake, and that it is the shallow seismic control structure of the Ningjiang earthquake swarm in the Songyuan area.
6.2. Deep Low-Resistivity Fluid
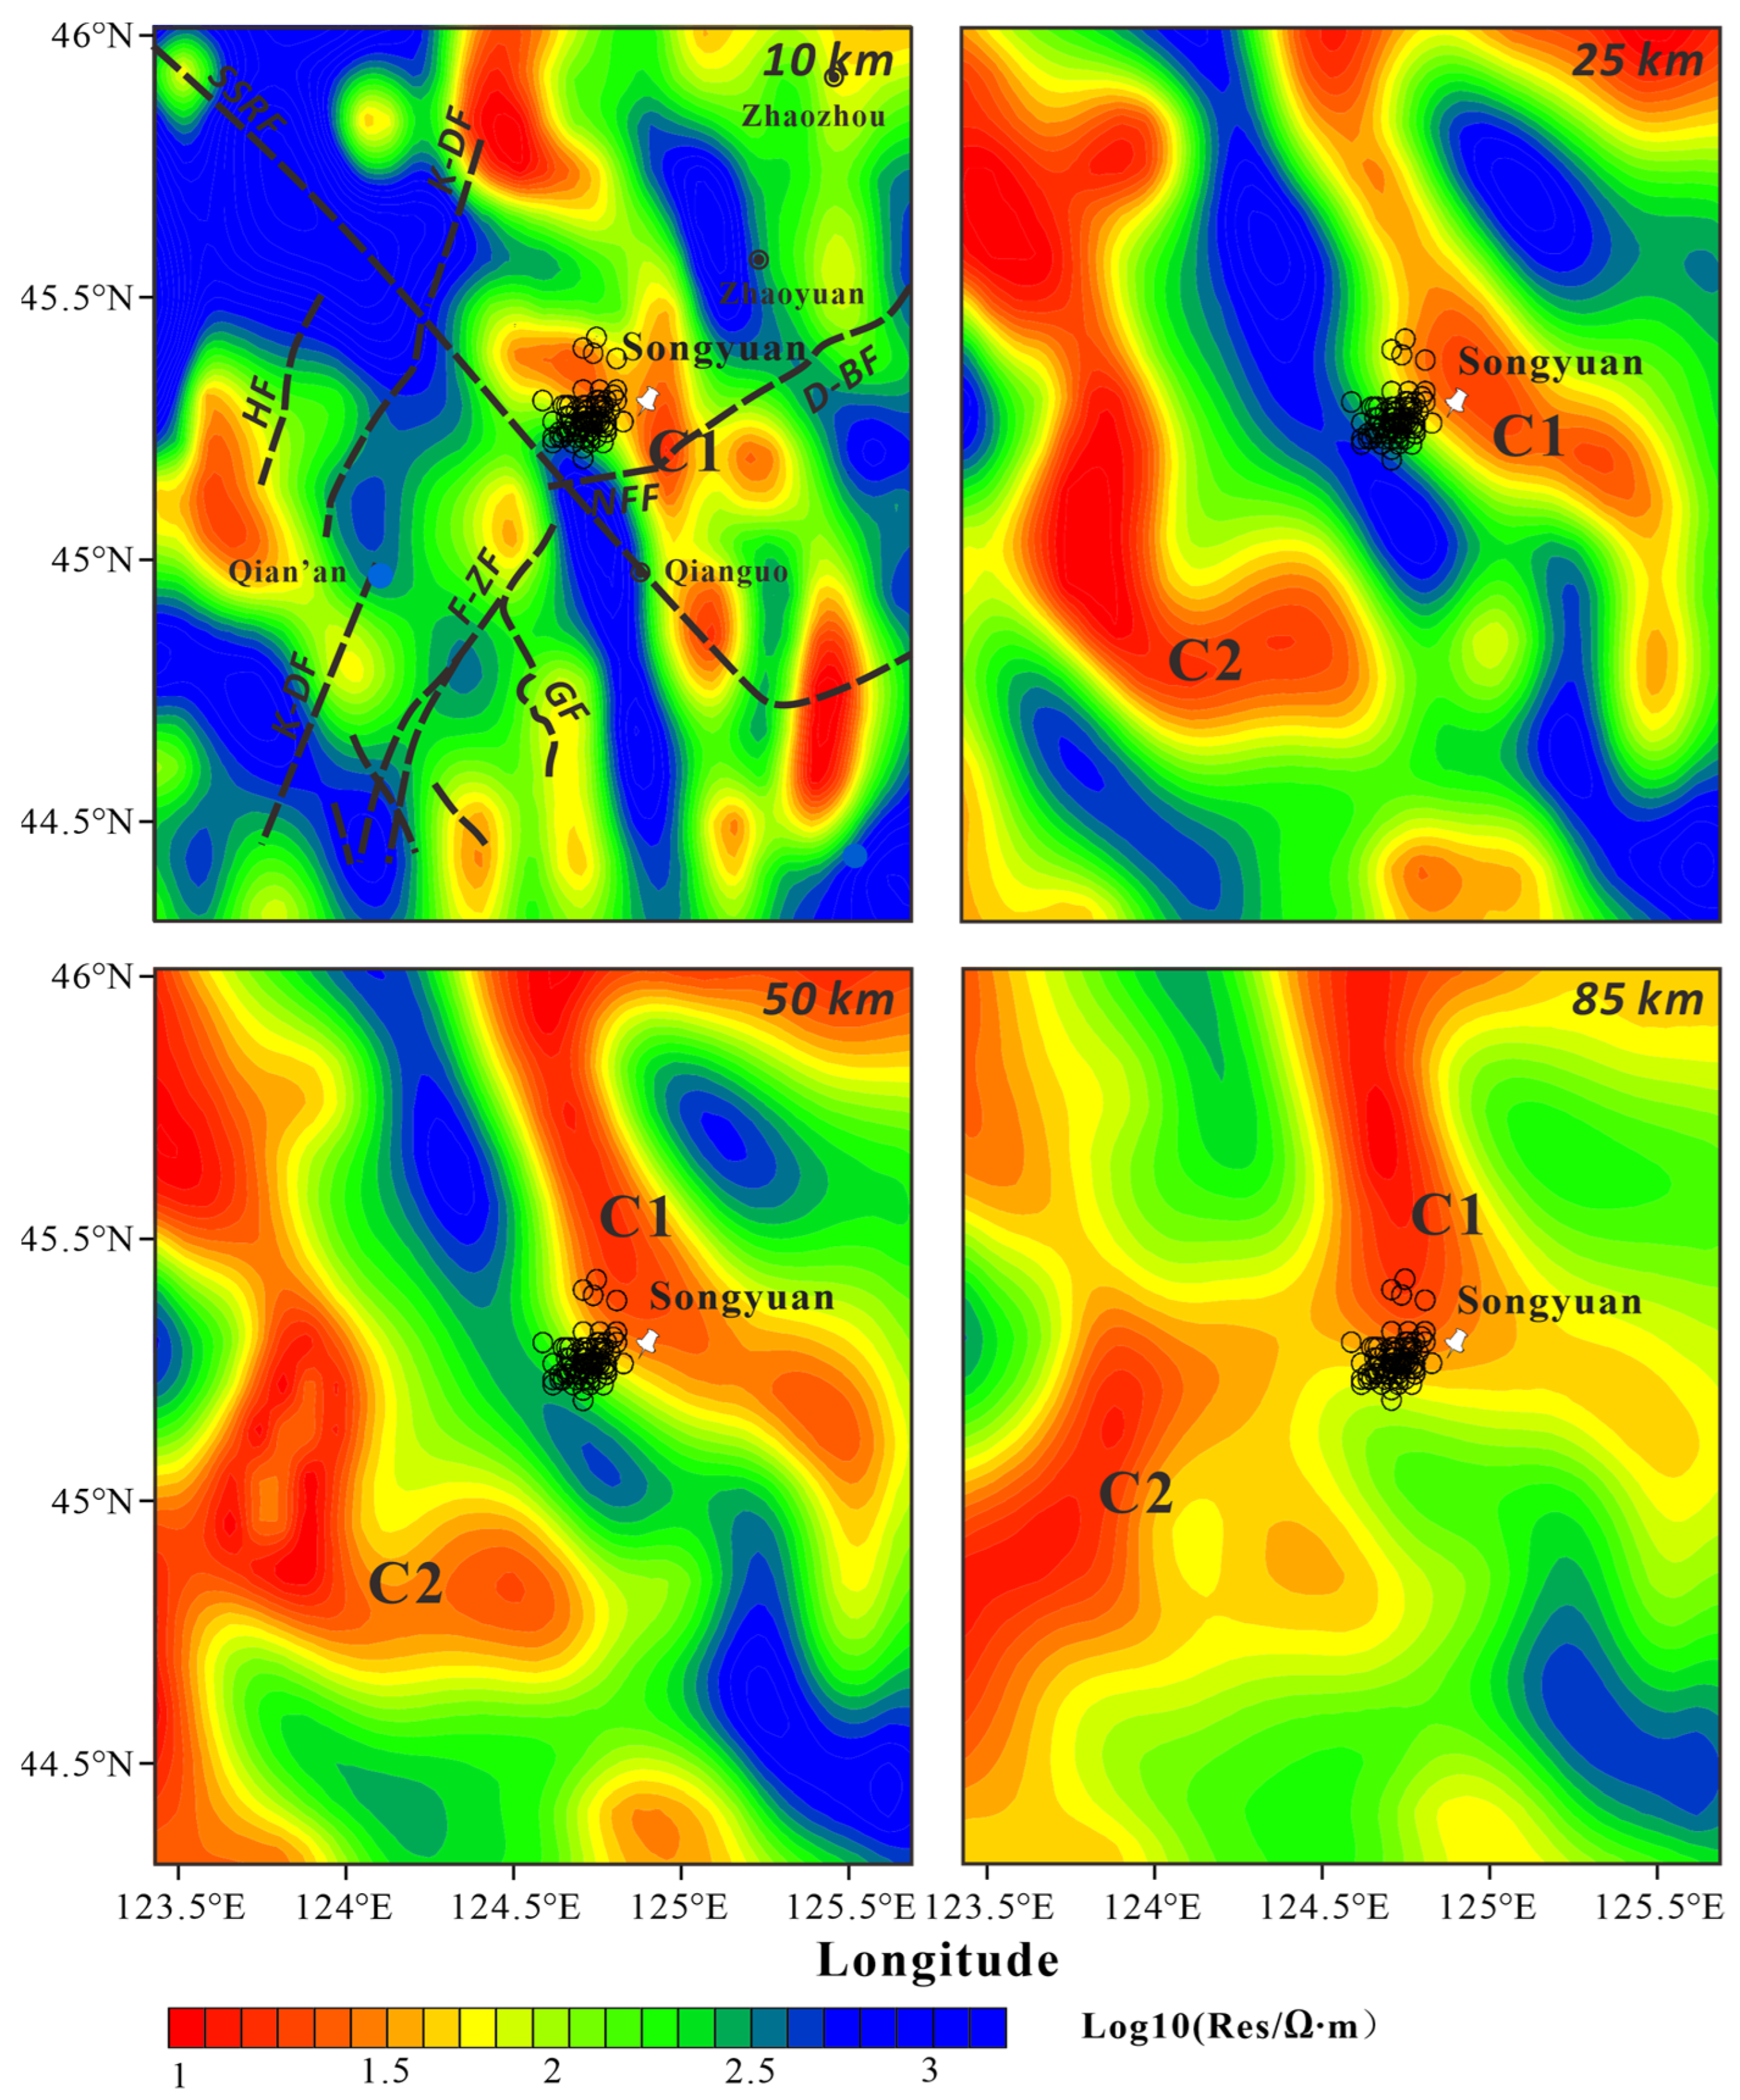
Figure 7 shows the slices of the large-scale 3D inversion results at different depths, in which the black circle is the location of the Ningjiang earthquake swarm, and the white circle is the location of the MT survey sites involved in the large-scale 3D inversion. For the 10 km depth slice, the distribution of high-conductivity anomalies is relatively scattered, but the overall distribution is in the NNW direction. There is a main high-conductivity anomaly C1 near the Ningjiang earthquake swarm, and the epicenter is generally 8–15 km in depth, so the earthquake outbreak is closely related to the C1 anomaly. At the depth of 25 km, the shallow high-conductivity structure C1 below the earthquake area extends downward, and the scattered high-conductivity anomalies converge as a whole. In addition, there is another high-conductivity structure C2 in the west, whose spatial location is consistent with the distribution of the Chaganhua earthquake swarm, which may be the deep dynamic source of frequent earthquakes in the Chaganhua area. The southeast uplift zone is characterized by high resistivity, which may be related to basement uplift. The anomaly structure of 50 km depth is basically the same as that of the 25 km depth. In the 85 km depth slice, the low-resistivity anomalies C1 and C2 are distributed in a large area and converge into a whole, which indicates that the deep dynamic sources leading to the earthquakes in the Ningjiang area and Chaganhua area may have the same origin. Tang et al. (2021) also found that there are low-resistivity characteristics in the study area based on an MT study of this area, which is consistent with our results.
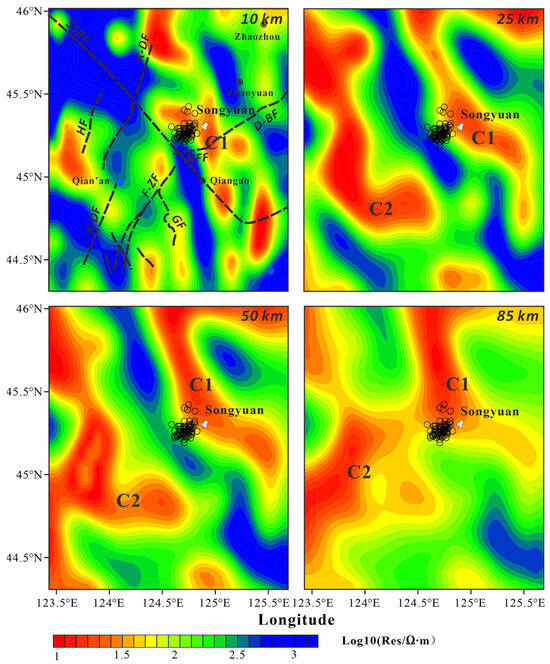
Figure 7.
Large-scale 3D inversion slices at different depths (as marked). White circles represent the distribution of MT measuring sites, and black circles represent the distribution of epicenters projected to different depths.
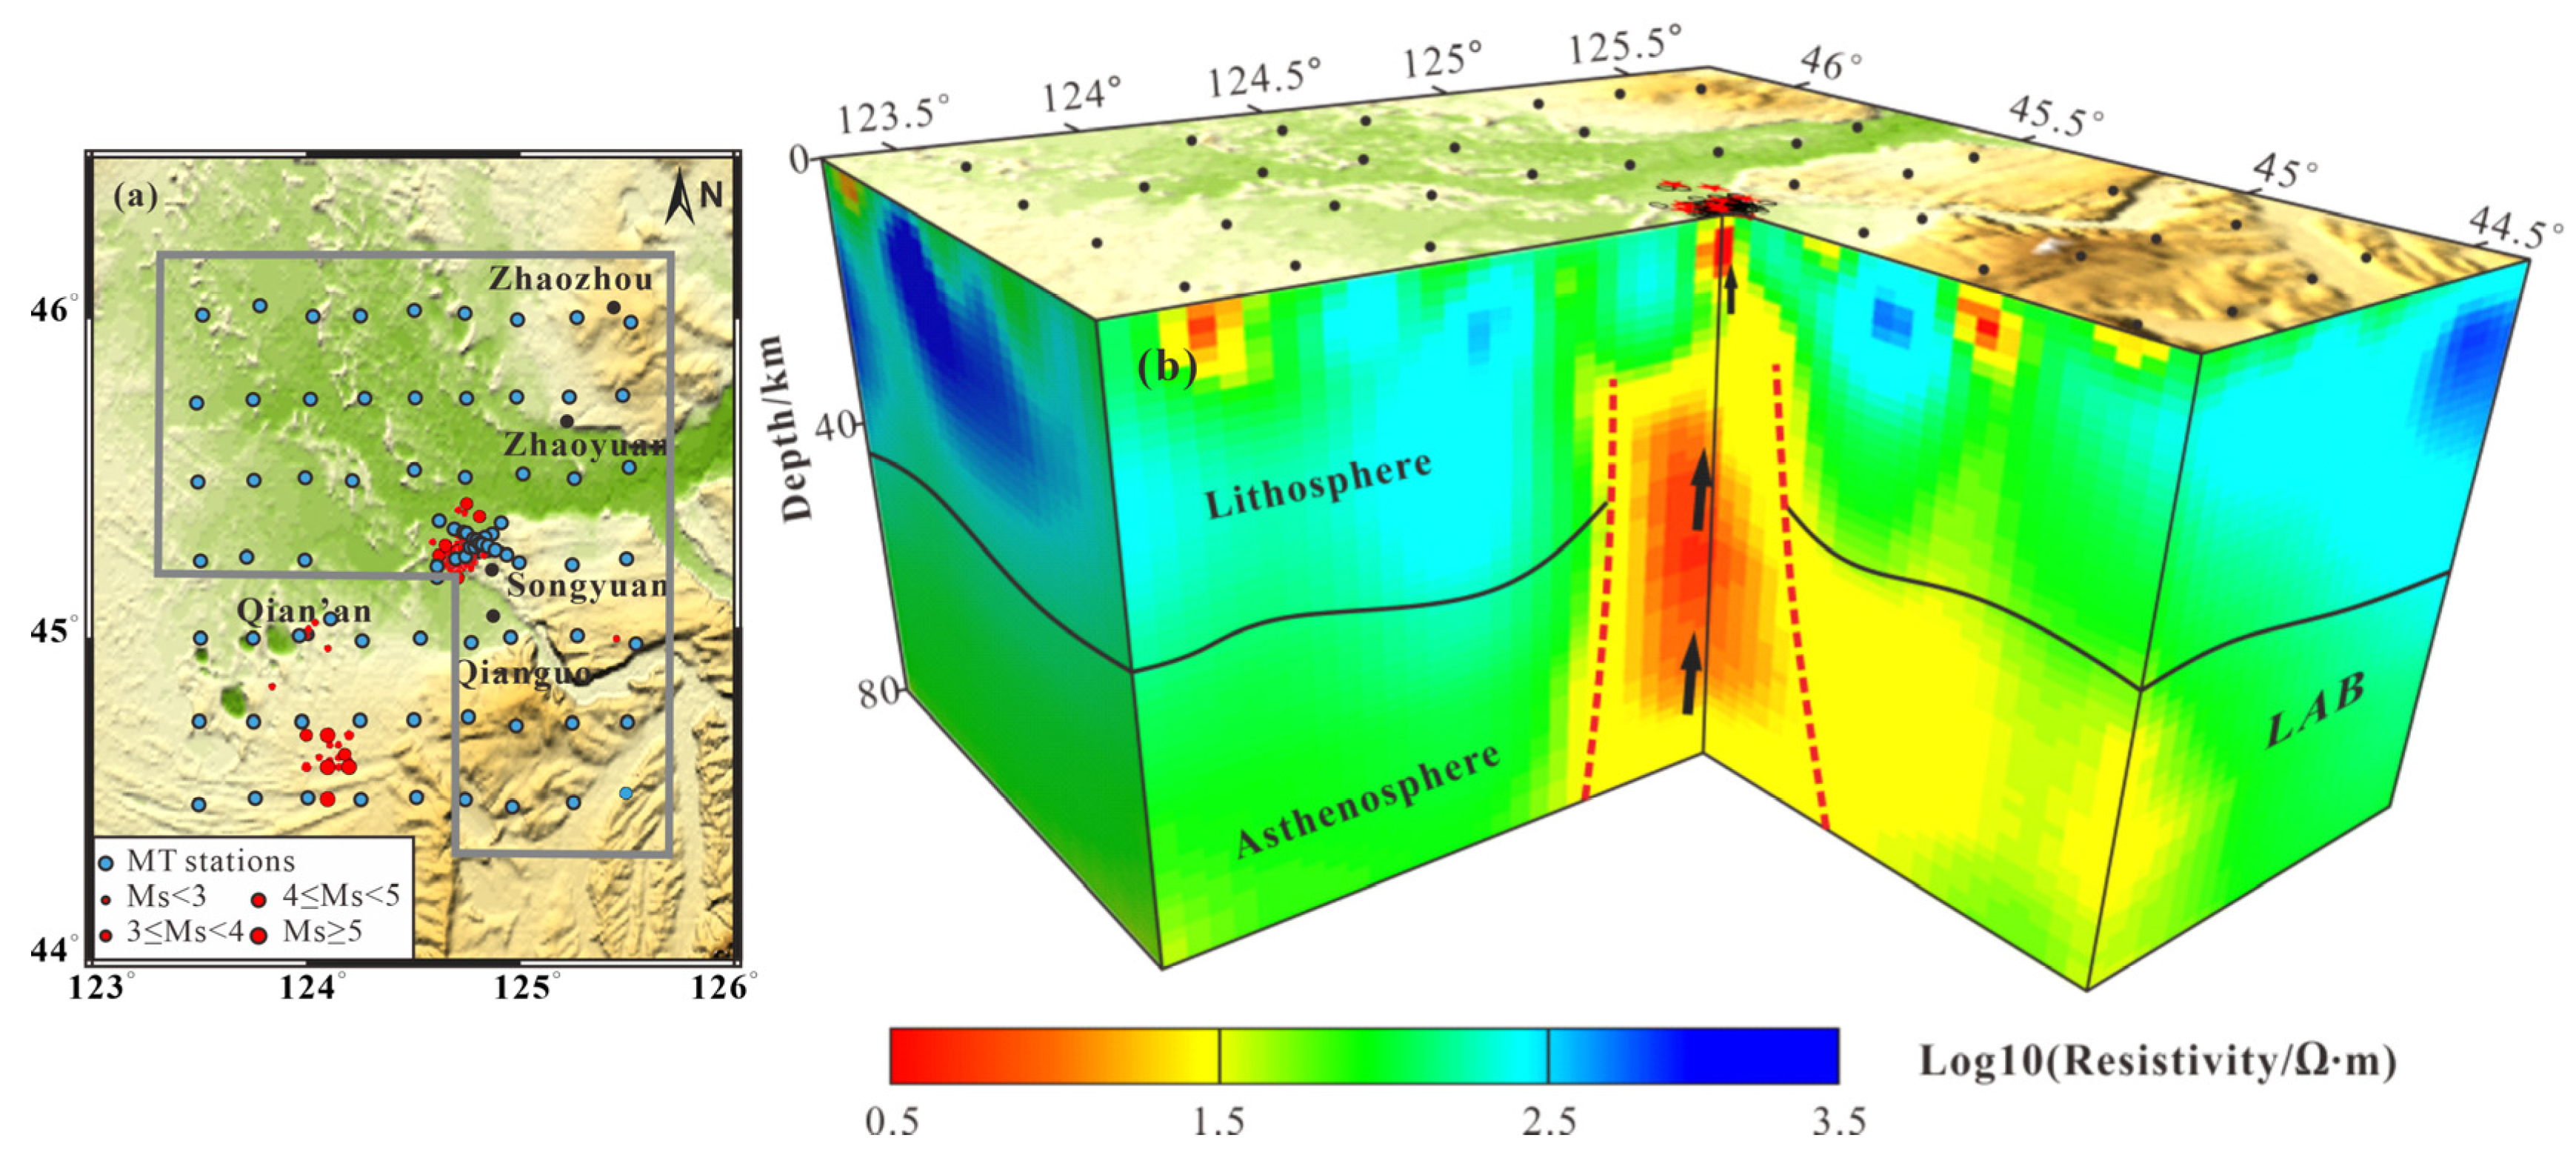
Geothermal activity can modify regional resistivity [28]. Regions with a high heat flow caused by multiple deep faults and lithospheric thinning commonly have a low resistivity [29], so deep low-resistivity anomalies are often interpreted as geothermal reservoirs [30]. The spatial variation in terrestrial heat flow in the Songyuan area shows a high heat flow [3], which is generally inferred to result from the raised geotherm at depth [31]. Stacked horizontal slices of 3D inversions at different depths from 10 to 85 km (Figure 8) show that the deep low-resistivity structure in the study area has vertical consistency and that there is a low-resistivity channel connecting the asthenosphere beneath the Songyuan area.
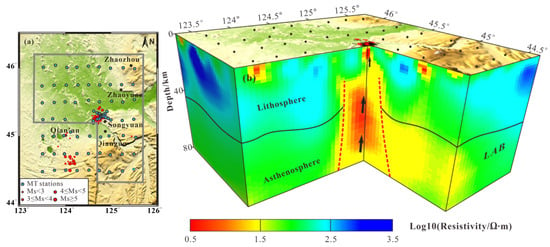
Figure 8.
(a) The position of the longitudinal section of the three-dimensional inversion result; (b) Deep magmatic system inferred from magnetotelluric 3D inversion in Songyuan area.
Our 3D inversion results reveal the resistivity structure of the lithosphere in the study area (Figure 8). Under the Songyuan area, there is a deep low-resistivity belt with a resistivity range of 1–10 Ω·m that penetrates the lithosphere and connects with the asthenosphere. Seismic tomography studies in Northeastern China have revealed the presence of a pronounced low-wave velocity anomaly, which is thought to be the result of the upwelling of mantle material [32,33,34,35]. Combining our inversion results, we believe that the low-resistivity structure represents the response of deep hot material [17]. One previous MT study also found that the Songliao Basin is a geothermal area affected by deep mantle convection [5]. During the Jurassic period, the Paleo-Pacific plate began to subduct underneath the Eurasian continent at a shallow angle. With progressive dehydration of the oceanic slab, fluids entered the asthenosphere, which would have lowered the solidus of mantle material and caused partial or complete melting [36,37,38], so this provides a source of upwelling mantle material. Previous studies have found that internal deformation of plates may be controlled by the thermal properties of the crust and upper mantle [39]. Hot material derived from the deep mantle contributes to a reduction in the effective elastic thickness of the lithosphere and stress accumulation in the upper crust [31]. Therefore, the upwelling mantle material that corresponds to the 25–85 km low-resistivity anomaly may provide an important dynamic source for earthquakes, and the vertical action of hot mantle material beneath the Songyuan region may be the deep dynamic factor that induces earthquakes in the Songyuan region. So, we propose that seismicity in the Songyuan area is induced by the ascent of deep mantle material from directly below this area.
6.3. The Seismogenic Mechanism in the Songyuan Area
Our measured electrical structure of the Songyuan area allows for the identification of two low-resistivity anomalies at different depths. The shallow low-resistivity structure is a northward-dipping crustal-scale anomaly whose location corresponds to that of the North Fuyu fault and coincides with the Ningjiang earthquake swarm. The depth of Moho in this area is about 30–40 km [5], and the deep low-resistivity anomaly extends from the Moho down to the asthenosphere and is inferred to have formed as a result of low-angle subduction of the Paleo-Pacific plate during the Jurassic period, resulting in an upwelling of molten asthenospheric material [36,37]. So, we propose that this deep low-resistivity structure reveals the existence of a magmatic system originating from the asthenosphere under the Songyuan area.
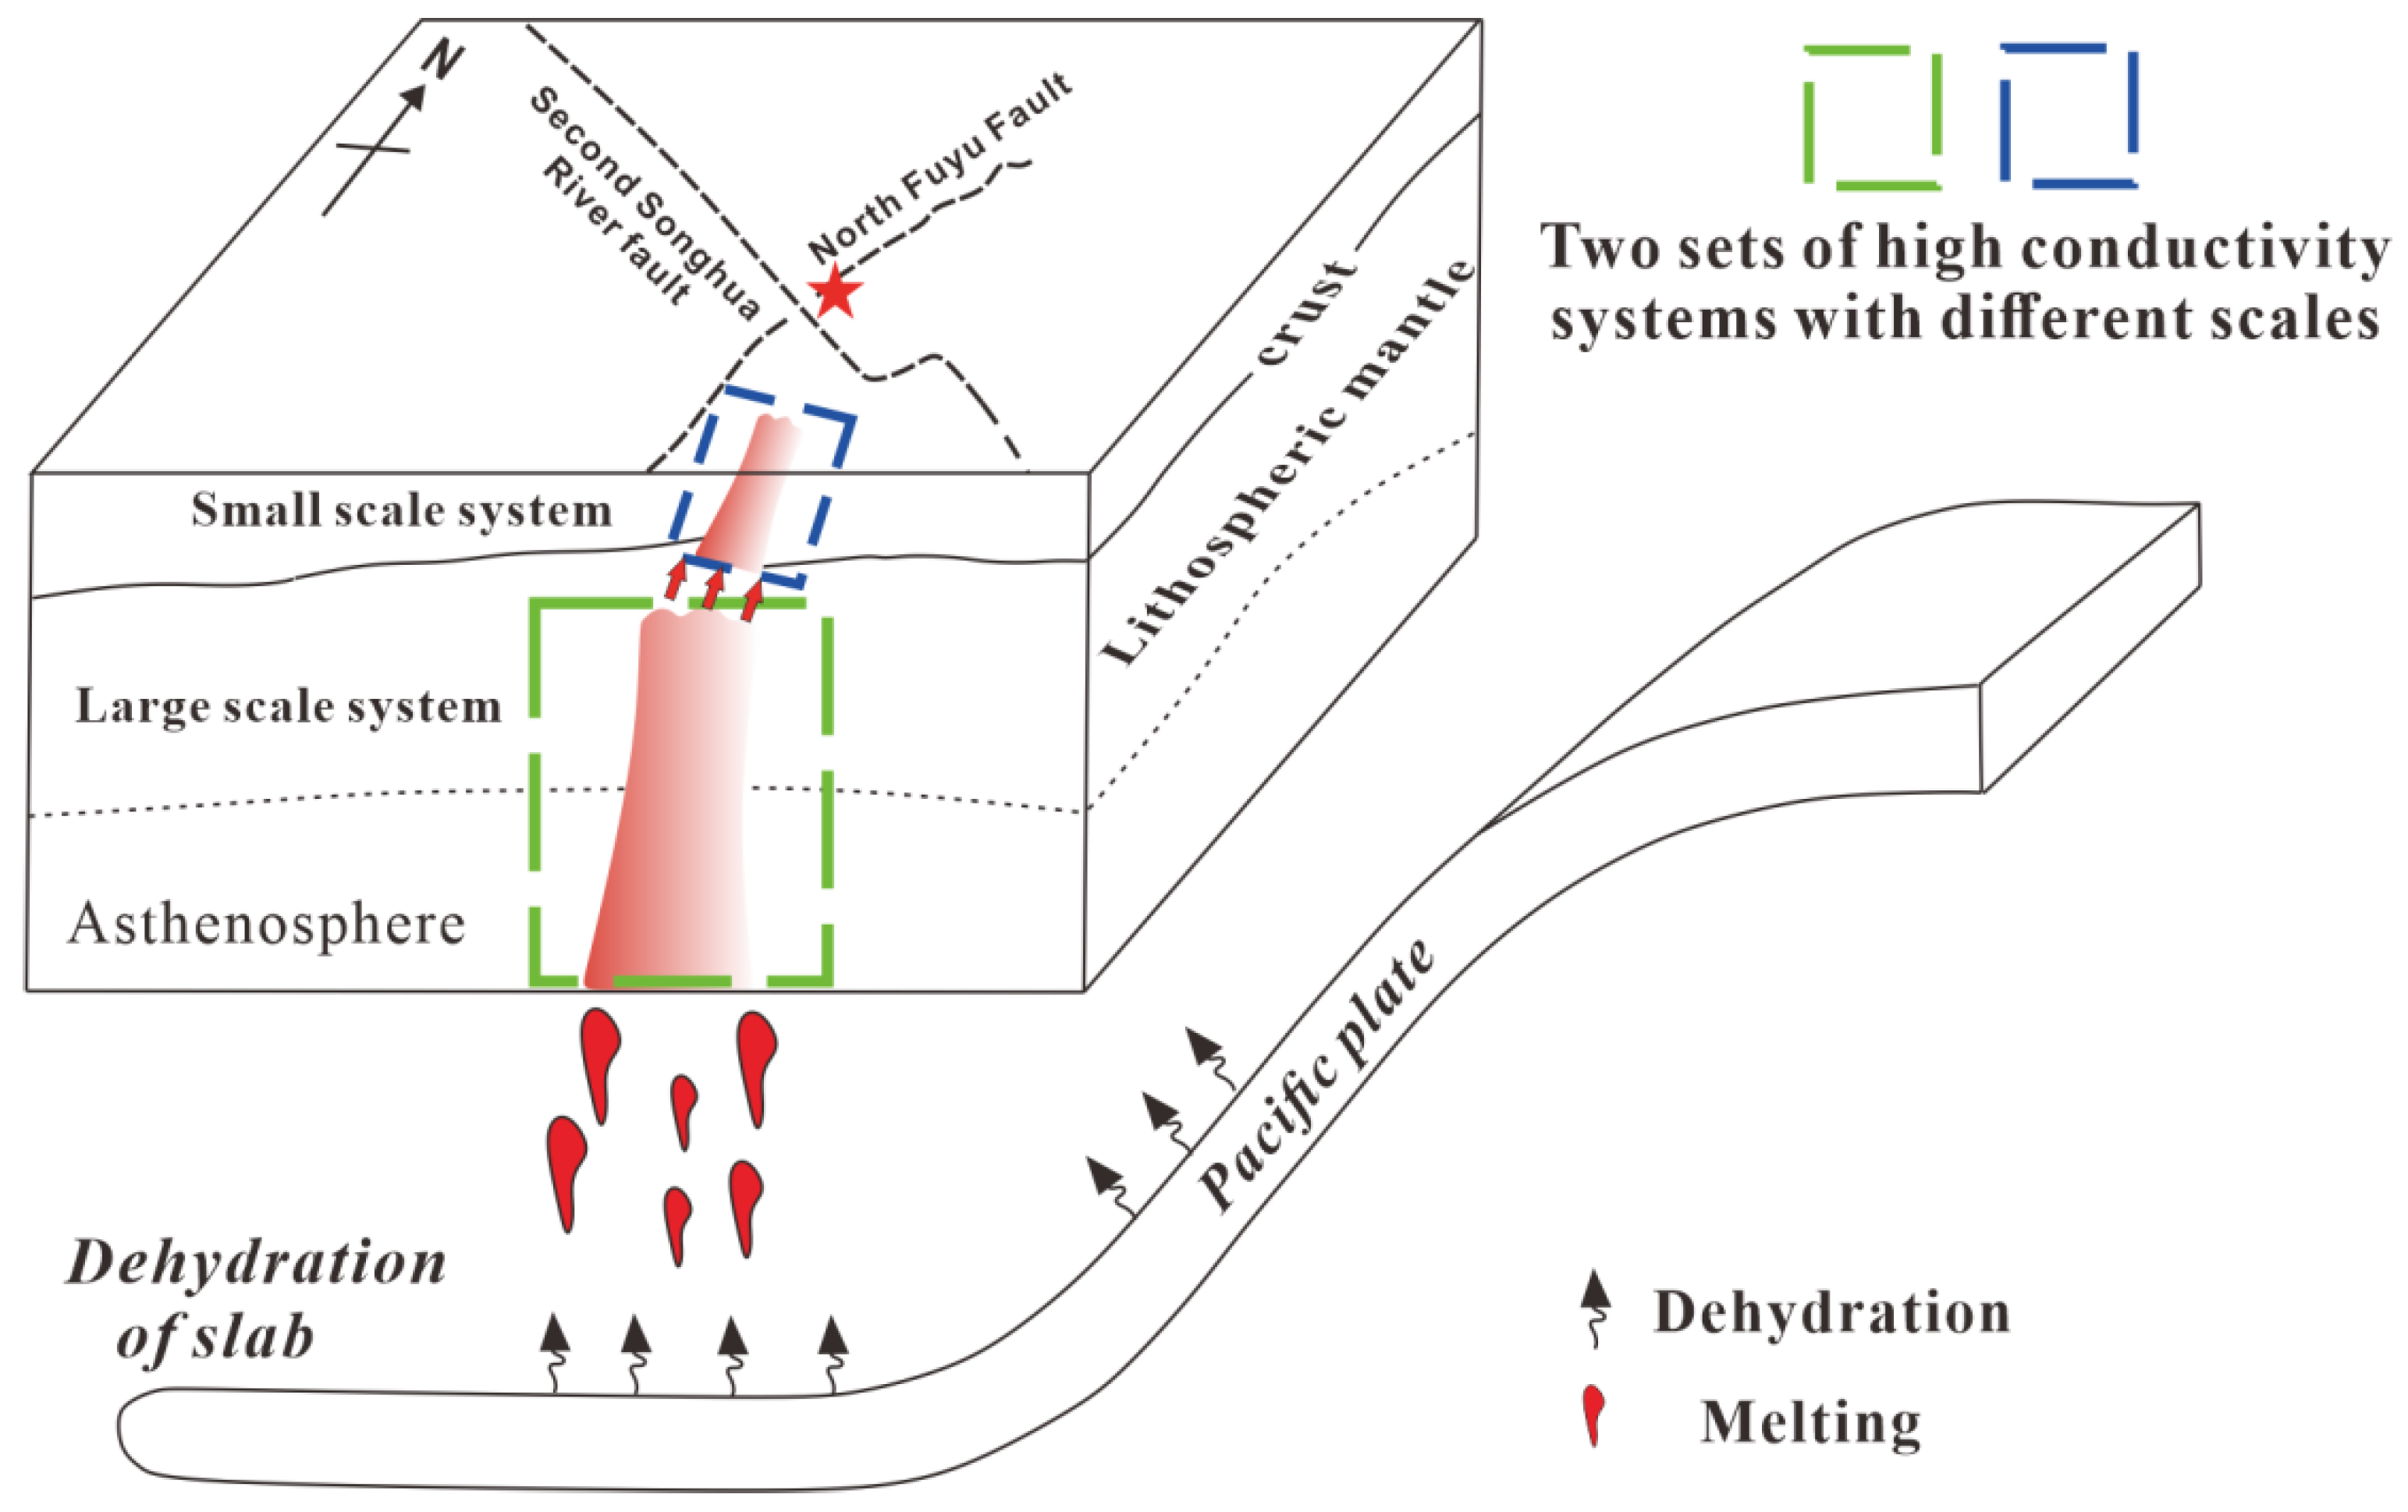
The upwelling of these mantle-derived fluids caused faults in the locked segment of the upper and middle crust to be activated. Some magma continued to migrate upward along these faults. In general, hydrothermal fluids are expected to migrate along pre-existing faults and then activate them into becoming generate earthquakes [40]. Before the earthquake, the ground temperature in the Songyuan area increased significantly because greenhouse gases (such as methane and carbon dioxide) spilled over the surface along the fault, which indicates that the fault in this area was activated, and that the stress accumulated to a certain extent [41]. The activation of the Fuyu fault was affected by thermal material; the hydrothermal fluids passed through the Fuyu North fault, and its shallow structure changed. The earthquake epicenters of recent seismicity are concentrated mostly in the area near the Fuyu North fault, suggesting a causal relationship between this fault and earthquake occurrence (Figure 9).
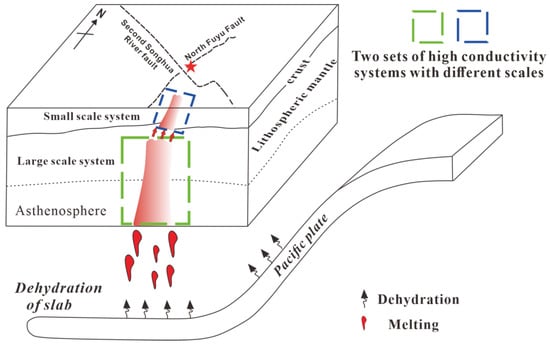
Figure 9.
Illustration of molten material rising along the fracture. The subduction of the Paleo-Pacific plate led to the rise of molten material, which caused two sets of high-conductivity systems with different scales. The molten material migrated upward along the fault and activated the Fuyu North fault, thus inducing earthquakes.
In conclusion, the Songyuan earthquakes are the result of the interaction of two sets of high-conductivity systems, namely the deep mantle fluid system and the shallow fault activation system. The seismic results reflect the high-speed anomaly brittle layer (<20 km) and ductile layer (>25 km) [42] in the region. The ductile layer corresponds to the large-scale high-conductivity anomaly in the electrical inversion results, that is, the upwelling of asthenosphere materials. This anomaly reflects the deep dynamic source of the Songyuan earthquake; the brittle layer corresponds to the small-scale high-conductivity anomaly in the electrical inversion results, that is, the fluid action in the crust. This anomaly reflects the stress change in the shallow part of the Songyuan area, indicating that the Fuyu North fault played a decisive role in the occurrence of the earthquake. The joint action of the two systems makes the Songyuan region a region prone to earthquakes.
7. Conclusions
- (1)
- The Fuyu North fault is a shallow seismogenic structure in the Songyuan area. In addition, the deep part of the North Fuyu fault is north-dipping, which is different from the south-dipping part, as demonstrated in previous research.
- (2)
- There is a low-resistivity anomaly in the deep part of the Songyuan area, directly leading to the asthenosphere, which is the upwelling mantle material. This provides a power source for the accumulation and release of stress above.
- (3)
- The seismogenic mechanism of the Songyuan area is mainly characterized by a deep shallow interaction, which can be specifically described as follows: There are two sets of high-conductivity systems with different scales. The deep high-conductivity system corresponds to magma upwelling, while the shallow high-conductivity system corresponds to fault activation. The vertical action of thermal material from the upper mantle provides the power source for the Songyuan area: the molten material underplates to the lower crust, accumulating and invading along the fault, leading to the activation of the North Fuyu fault and inducing the Songyuan earthquake.
Author Contributions
Resources, L.L.; Data curation, Z.X. and L.L.; Writing—original draft, Z.L., J.H. and Z.X.; Writing—review & editing, X.J., H.H. and W.L.; Supervision, J.H.; Project administration, X.J. and J.H. All authors have read and agreed to the published version of the manuscript.
Funding
This work was supported by Research on the Risk Prevention and Control Strategy for Earthquake Disasters in Liaoning Province (2023JH4/10700060, Xiaodong Jia), the National Natural Science Foundation of China (42230303, Hesheng Hou), the Jilin Science and Technological Development Program (20220101152JC, 20180101093JC, Jiangtao Han), and the China Geological Survey Project (DD20190010, Jiangtao Han).
Data Availability Statement
Due to limitations of project, data needs to be kept confidential and cannot be shared.
Acknowledgments
Acknowledgments are given for the data support from “China Earthquake Networks Center, National Earthquake Data Center (http://data.earthquake.cn, accessed on 28 May 2023)”.
Conflicts of Interest
The authors declare no conflict of interest.
References
- Yang, Y. Deep Electrical Structure and Seismogenic Mechanism in Seismic Active Area of Songyuan. Ph.D. Thesis, Jilin University, Changchun, China, 2019. (In Chinese). [Google Scholar]
- Yang, H.D.; Yao, P.; Zhang, X.; Liu, L.; Yang, Y.C.; Wang, C.J. Distribution of Inorganic Carbon Dioxide in Southern Songliao Basin. Nat. Gas Geosci. 2008, 5, 634–638. (In Chinese) [Google Scholar]
- Jiang, G.Z.; Gao, P.; Rao, S.; Zhang, C.Y.; Tang, X.Y.; Huang, F. Compilation of heat flow data in the continental area of China (4th edition). Chin. J. Geophys. 2016, 59, 314. (In Chinese) [Google Scholar] [CrossRef]
- Weng, A.H.; Tang, Y.; Li, Y.B.; Yang, Y. Magnetotelluric image of fluid-induced Songyuan earthquake. Recent Dev. World Seismol. 2019, 8, 124–125. (In Chinese) [Google Scholar]
- Han, J.T.; Guo, Z.Y.; Liu, W.Y.; Hou, H.S.; Liu, G.X.; Han, S. Deep dynamic process of lithosphere thinning in Songliao basin. Chin. J. Geophys. 2018, 61, 95–109. (In Chinese) [Google Scholar]
- Zhao, G.Z.; Unsworth, M.J.; Zhan, Y.; Wang, L.F.; Chen, X.B.; Jones, A.G.; Tang, J.; Xiao, Q.B.; Wang, J.J.; Cai, J.T.; et al. Crustal structure and rheology of the Longmenshan and Wenchuan Mw 7.9 earthquake epicentral area from magnetotelluric data. Geology 2012, 40, 1139–1142. [Google Scholar] [CrossRef]
- Gardonio, B.; Jolivet, R.; Calais, E.; Leclère, H. The April 2017 Mw6. 5 Botswana earthquake: An intraplate event triggered by deep fluids. Geophys. Res. Lett. 2018, 45, 8886–8896. [Google Scholar] [CrossRef]
- Stein, S.; Liu, M. Long Aftershock Sequences within Continents and Implications for Earthquake Hazard Assessment. Recent Dev. World Seismol. 2009, 12, 7–11. [Google Scholar] [CrossRef]
- Stephenson, R.; Egholm, D.L.; Nielsen, S.B.; Stovba, S.M. Role of thermal refraction in localizing intraplate deformation in southeastern Ukraine. Nat. Geosci. 2009, 2, 290. [Google Scholar] [CrossRef]
- Wang, X.F.; Yu, S.; Li, S.Z.; Ma, Y.; Zhao, S.J.; Liu, X.; Dai, L.M. Comparison of active structure and earthquake triggering mechanism between plate margin and plate interior. Mar. Geol. Quat. Geol. 2014, 34, 159–175. (In Chinese) [Google Scholar]
- Shen, J.; Shao, B.; Yu, X.H.; Yu, Y.; Qi, G.; Deng, M.; Zhang, H. Seismogenic tectonics of the Qian-gorlos earthquake in Jilin Province, China. Earthq. Sci. 2016, 29, 93–103. [Google Scholar] [CrossRef][Green Version]
- Xue, L.F.; Zhu, M.; Li, W.Q.; Liu, W.Y.; Liu, Z.H.; Liu, Z.Y. Earthquake Triggered by “Magma Bubble” Bursting: 2013 Songyuan Earthquake Cluaters in Jilin as an Example. J. Jilin Univ. (Earth Sci. Ed.) 2018, 48, 1865–1875. (In Chinese) [Google Scholar] [CrossRef]
- Tang, Y.; Weng, A.H.; Yang, Y.; Li, S.W.; Niu, J.J.; Zhang, Y.H.; Li, Y.B.; Li, J.P. Connection between earthquakes and deep fluids revealed by magnetotelluric imaging in Songyuan, China. Sci. China Earth Sci. 2021, 64, 161–176. [Google Scholar] [CrossRef]
- Buttinelli, M.; Improta, L.; Bagh, S.; Chiarabba, C. Inversion of inherited thrusts by wastewater injection induced seismicity at the Val d’Agri oilfield (Italy). Sci. Rep. 2016, 6, 37165. [Google Scholar] [CrossRef] [PubMed]
- Lopez-Comino, A.J.; Cesca, S.; Jarosławski, J.; Montcoudiol, N.; Heimann, S.; Dahm, T.; Lasocki, S.; Gunning, A.; Capuano, P.; Ellsworth, W.L. Induced seismicity response of hydraulic fracturing: Results of a multidisciplinary monitoring at the Wysin site, Poland. In Proceedings of the 20th EGU General Assembly, EGU, Vienna, Austria, 4–13 April 2018; p. 8307. [Google Scholar] [CrossRef]
- Hill, G.J.; Caldwell, G.; Heise, W.; Cas, R.A.F.; Cull, J.P.; Bibby, H.M.; Burgess, M.K. Imaging magmatic systems using magnetotelluric data: Mount St. Helens and Mount Adams. Nat. Geosci. 2009, 2, 785–789. [Google Scholar] [CrossRef]
- Wannamaker, P.E.; Caldwell, T.G.; Jiracek, G.R.; Maris, V.; Hill, G.J.; Ogawa, Y.; Bibby, H.M.; Bennie, S.L.; Heise, W. Fluid and deformation regime of an advancing subduction system at Marlborough. N. Z. Nat. 2009, 460, 733–736. [Google Scholar] [CrossRef]
- Ingham, M.R.; Bibby, H.M.; Heise, W.; Jones, K.A.; Cairns, P.; Dravitzki, S.; Bennie, S.L.; Caldwell, T.G.; Ogawa, Y. A magnetotelluric study of Mount Ruapehu volcano, New Zealand. Geophys. J. Int. 2009, 179, 887–904. [Google Scholar] [CrossRef]
- Aizawa, K.; Ogawa, Y.; Ishido, T. Groundwater flow and hydrothermal systems within volcanic edifices: Delineation by electric self-potential and magnetotellurics. J. Geophys. Res. Solid Earth 2009, 114, B01208. [Google Scholar] [CrossRef]
- Ogawa, Y.; Ichiki, M.; Kanda, W.; Mishina, M.; Asamori, K. Three-dimensional magnetotelluric imaging of crustal fluids and seismicity around Naruko volcano, NE Japan. Earth Planets Space 2014, 66, 158. [Google Scholar] [CrossRef]
- Ogawa, Y.; Mishina, M.; Goto, T.; Satoh, H.; Oshiman, N.; Kasaya, T.; Takahashi, Y.; Nishitani, T.; Sakanaka, S.; Uyeshima, M.; et al. Magnetotelluric imaging of fluids in intraplate earthquake zones, NE Japan back arc. Geophys. Res. Lett. 2001, 28, 3741–3744. [Google Scholar] [CrossRef]
- Ge, R.F.; Zhang, Q.L.; Wang, L.S.; Xie, G.A.; Xu, S.Y.; Chen, J.; Wang, X.Y. Tectonic evolution of Songliao Basin and the prominent tectonic regime transition in eastern China. Geol. Rev. 2010, 56, 180–195. [Google Scholar]
- Gao, L.X. Structural Environment of Songliao Basin and Characteristics of Seismic Activity in Northeast China Region. Earthquake 2008, 28, 59–67. (In Chinese) [Google Scholar] [CrossRef]
- Shao, B.; Shen, J.; Hou, G.; Yu, X.; Dai, X.; Yu, Y. Discussion on the seismogenic structure of Qianguo earthquake of 1119 AD. Beijing Da Xue Xue Bao 2020, 56, 135–142. [Google Scholar] [CrossRef]
- Caldwell, T.G.; Bibby, H.M.; Brown, C. The magnetotelluric phase tensor. Geophys. J. Int. 2004, 158, 457–469. [Google Scholar] [CrossRef]
- Kelbert, A.; Meqbel, N.; Egbert, G.D.; Tandon, K. ModEM: A modular system for inversion of electromagnetic geophysical data. Comput. Geosci. 2014, 66, 40–53. [Google Scholar] [CrossRef]
- Pan, X.D.; Wang, J.L.; Sun, X.L.; Lu, Y.H.; Zhang, C.X.; Kang, J.H. Analysis on the seismic tectonic background of 5.0 earthquake on the border between Qian’an and Qianguo county. Seismol. Res. Northeast China 2007, 23, 8–15. (In Chinese) [Google Scholar] [CrossRef]
- Gasperikova, E.; Newman, G.; Feucht, D.; Arnason, K. 3D MT characterization of two geothermal fields in Iceland. GRC Trans. 2011, 35, 1667–1671. [Google Scholar]
- Spichak, V.; Manzella, A. Electromagnetic sounding of geothermal zones. J. Appl. Geophys. 2009, 68, 459–478. [Google Scholar] [CrossRef]
- Beka, T.I.; Smirnov, M.; Birkelund, Y.; Senger, K.; Bergh, S.G. Analysis and 3D inversion of magnetotelluric crooked profile data from central Svalbard for geothermal application. Tectonophysics 2016, 686, 98–115. [Google Scholar] [CrossRef]
- Balfour, N.J.; Cummins, P.R.; Pilia, S.; Love, D. Localization of intraplate deformation through fluid-assisted faulting in the lower-crust: The Flinders Ranges, South Australia. Tectonophysics 2015, 655, 97–106. [Google Scholar] [CrossRef]
- Wang, J.C. Study on the Basement Structure Characteristics of the Paleo Central Uplift Belt. Ph.D. Thesis, Jilin University, Changchun, China, 2016. (In Chinese). [Google Scholar]
- Yang, B.J.; Mu, S.M.; Jin, X.; Liu, C. Synthesized Study On The Geophysics of ManZhouli-SuiFenhe Geoscience Transec, China. Chin. J. Geophys. 1996, 39, 772–782. [Google Scholar]
- Yang, G.; Xue, L.F.; Liu, Z.B.; Liu, J.P. Studies of deep geology with seismic section interpretation in Songliao basin. Oil Gas Geol. 2001, 22, 326–330. (In Chinese) [Google Scholar] [CrossRef]
- Yang, Y.; Lei, J.S.; Zhang, G.W.; Liang, S.S.; Sun, C.Q.; Mi, Q.; Lu, M.W.; Du, M.F.; Zhang, B.; Tian, F.F.; et al. Crustal velocity structure and seismogenic environment in the source areas of the Qianguo MS5.8 and Songyuan MS5.7 earthquakes. Chin. J. Geophys. 2019, 62, 4259–4278. (In Chinese) [Google Scholar] [CrossRef]
- Zhu, R.X.; Zhang, H.F.; Zhu, G.; Meng, Q.R.; Fan, H.R.; Yang, J.H.; Wu, F.Y.; Zhang, Z.Y.; Zheng, T.Y. Craton destruction and related resources. Int. J. Earth Sci. 2017, 106, 2233–2257. [Google Scholar] [CrossRef]
- Zhu, R.X.; Xu, G.Y. Subduction of the Western Pacific plate and destruction of the North China Craton. Sci. Sin. (Terrae) 2019, 49, 1346–1356. (In Chinese) [Google Scholar]
- Tian, Y.; Ma, J.C.; Liu, C.; Feng, X.; Liu, T.T.; Zhu, H.X.; Yan, D.; Li, H.H. Effects of subduction of the western Pacific plate on tectonic evolution of Northeast China and geodynamic implications. Chin. J. Geophys. 2019, 62, 1071–1082. (In Chinese) [Google Scholar] [CrossRef]
- Holford, S.P.; Hillis, R.R.; Hand, M.; Sandiford, M. Thermal weakening localizes intraplate deformation along the southern Australian continental margin. Earth Planet. Sci. Lett. 2011, 305, 207–214. [Google Scholar] [CrossRef]
- Lénat, J.F.; Bachèlery, P.; Peltier, A. The interplay between collapse structures, hydrothermal systems, and magma intrusions: The case of the central area of Piton de la Fournaise volcano. Bull. Volcanol. 2012, 74, 407–421. [Google Scholar] [CrossRef]
- Zhang, Z.H.; Li, M.Y.; Jiao, M.R.; Huang, M.W.; Yang, S.C.; Sun, Q.S. Research on variation characteristics of fault activity based on satellite thermal infrared remote sensing data taking an example of Songyuan M S5.7 in 2018. IOP Conf. Ser. Earth Environ. Sci. 2021, 861, 052018. [Google Scholar] [CrossRef]
- Ruan, Q.F.; Liu, J.Q.; Tian, Y.; Liu, C.; Zhang, Y.; Cai, H.L. Research on seismogenic mechanism and migration characteristics of the earthquakes in the Songyuan area. Chin. J. Geophys. 2022, 65, 3309–3321. [Google Scholar]
Disclaimer/Publisher’s Note: The statements, opinions and data contained in all publications are solely those of the individual author(s) and contributor(s) and not of MDPI and/or the editor(s). MDPI and/or the editor(s) disclaim responsibility for any injury to people or property resulting from any ideas, methods, instructions or products referred to in the content. |
© 2024 by the authors. Licensee MDPI, Basel, Switzerland. This article is an open access article distributed under the terms and conditions of the Creative Commons Attribution (CC BY) license (https://creativecommons.org/licenses/by/4.0/).

