Article

Estimating the Colored Dissolved Organic Matter in the Negro River, Amazon Basin, with In Situ Remote Sensing Data

by
Rogério Ribeiro Marinho
1,*,
Jean-Michel Martinez
2,
Tereza Cristina Souza de Oliveira
3,
Wagner Picanço Moreira
3,
Lino A. Sander de Carvalho
4,
Patricia Moreira-Turcq
2 and
Tristan Harmel
2
1
Departamento de Geografia, Universidade Federal do Amazonas, Manaus 69080-900, Brazil
2
Géosciences Environnement Toulouse, Centre National de la Recherche Scientifique—CNRS, Institut de Recherche pour le Développement—IRD, Université Paul Sabatier—UPS, 31400 Toulouse, France
3
Departamento de Química, Universidade Federal do Amazonas, Manaus 69080-900, Brazil
4
Departamento de Meteorologia, Universidade Federal do Rio de Janeiro, Rio de Janeiro 21941-916, Brazil
*
Author to whom correspondence should be addressed.
Remote Sens. 2024, 16(4), 613; https://doi.org/10.3390/rs16040613
Submission received: 2 January 2024 / Revised: 2 February 2024 / Accepted: 4 February 2024 / Published: 6 February 2024

Abstract

:
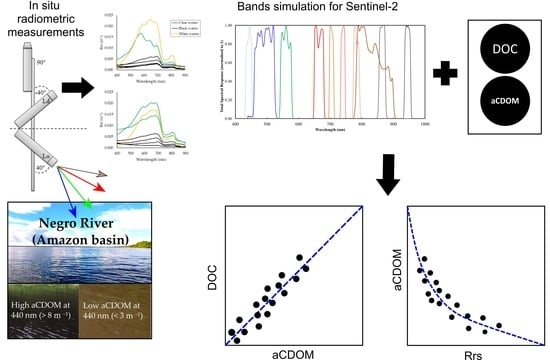
Dissolved organic matter (DOM) is a crucial component of continental aquatic ecosystems. It plays a vital role in the carbon cycle by serving as a significant source and reservoir of carbon in water. DOM provides energy and nutrients to organisms, affecting primary productivity, organic composition, and the food chain. This study presents empirical bio-optical models for estimating the absorption of colored dissolved organic matter (aCDOM) in the Negro River using in situ remote sensing reflectance (Rrs) data. Physical–chemical data (TSS, DOC, and POC) and optical data (aCDOM and Rrs) were collected from the Negro River, its tributaries, and lakes and empirical relationships between aCDOM at 440 nm, single band, and the ratio bands of Rrs were assessed. The analysis of spectral slope shows no statistically significant correlations with DOC concentration or aCDOM absorption coefficient. However, strong relationships were observed between DOC and aCDOM (R2 = 0.72), aCDOM and Rrs at 650 nm (R2 > 0.80 and RMSE < 1.75 m−1), as well as aCDOM and the green/red band ratio (R2 > 0.80 and RMSE < 2.30 m−1). aCDOM displayed large spatial and temporal variations, varying from 1.9 up to 20.1 m−1, with higher values in rivers of the upper course of the Negro basin and lower values in rivers with total solids suspended > 10 mg·L−1. Environmental factors that influence the production of dissolved organic matter include soil type, dense forest cover, high precipitation, and low erosion rates. This study demonstrated that aCDOM can serve as an indicator of DOC, and Rrs can serve as an indicator of aCDOM in the Negro basin. Our findings offer a starting point for future research on the optical properties of Amazonian black-water rivers.

Graphical Abstract

1. Introduction

Dissolved organic matter (DOM) plays a pivotal role in continental aquatic ecosystems, contributing significantly to various biogeochemical processes that govern the interaction between the biosphere and the atmosphere [1,2]. This influence is particularly noteworthy in processes associated with the carbon cycle. The presence of DOM in aquatic environments acts as a key factor regulating dissolved oxygen levels, acidity, and the availability of nutrients and pollutants [3]. Additionally, DOM influences the attenuation of light in the water [4,5]. In aquatic systems, the quantification of organic matter is primarily achieved through total organic carbon (TOC) and its subdivisions, namely dissolved organic carbon (DOC) and particulate organic carbon (POC).
Continental aquatic ecosystems have a crucial role in the storage, processing, and transport of terrestrial-derived organic matter to the oceans through rivers. They serve as essential natural freshwater reservoirs and habitats for a diverse range of animal and plant species. The study of these environments is crucial to our understanding of the global carbon cycle, as they actively contribute to the emission of carbon dioxide and methane [6]. Notably, the Amazon Basin, the world’s largest river system, exports an estimated 22 to 27 Tg of dissolved organic carbon to the Atlantic Ocean [7,8].
Given the high cost associated with processing dissolved organic carbon (DOC) data in the laboratory and logistical challenges in collecting samples over large aquatic environments, remote sensing data have emerged as a valuable quantitative indicator of colored dissolved organic matter (CDOM) [4,9,10,11,12]. CDOM, considered the optically active portion of DOM, can be remotely monitored over extensive areas using bio-optical models that relate the absorption coefficient of CDOM (aCDOM) to radiometric data [13,14], primarily utilizing remote sensing reflectance (Rrs) [11,15,16].
In recent years, the remote sensing community has faced significant challenges in understanding the origin and processing of dissolved organic matter in continental, coastal, and ocean sources. To address this issue, emphasis has been placed on the use of orbital and in situ radiometric data. Recent studies have developed models to analyze the temporal and spatial variability of CDOM, including empirical [17,18,19,20], semi-analytical [21,22,23,24], and machine learning models [25,26,27].
Empirical algorithms, while simple to implement and computationally efficient [10,11,13,28], rely on observational data and are limited to specific contexts, compromising their ability to generalize to diverse conditions. It is important to note that the most commonly used Rrs band ratios in empirical algorithms are those associated with the green to red [10,29,30] or red to blue [28,31] ranges. Semi-analytical algorithms, on the other hand, incorporate both theoretical and statistical techniques, as well as observational elements. Their modular structure makes them suitable for regional customization [32], allowing for optimization of the empirical relationships on which they are based [33]. However, their implementation demands substantial computational resources due to their complexity [13]. The use of semi-analytical methods, e.g., QAA models, in inland waters with intricate absorption characteristics often results in low precision and requires complex parameterization compared to empirical models based on Rrs (either single-band or band ratio) and CDOM [28]. Machine learning-based algorithms, known for their ability to generalize in complex and variable patterns, require extensive and representative datasets and a more intricate interpretation of their outcomes [34].
Despite the interest in CDOM studies with remote sensing data dating back to the 1980s [35], few studies have been conducted in the Amazon Basin [12,36,37,38]. However, estimating the concentration of DOM in large aquatic ecosystems is important for understanding primary productivity [39], greenhouse gas emissions [40], pH implications, contaminant transport within the ecosystem, and the suitability of surface waters for human use [11].
The Negro River and its floodplain (igapó forests) is the main black-water aquatic ecosystem in the Amazon Basin, which is responsible for approximately 40% of the total organic carbon transported by the Amazon River. Its waters have a high concentration of DOC, acidic pH [40], and low total suspended solids concentration [41]. In this environment, light absorption processes outweigh scattering, resulting in the dark appearance of the water due to its low reflectance [36,42].
This study aims to evaluate the use of remote sensing reflectance in situ data to estimate CDOM in the Negro River. It is important to consider the need for new in situ studies to establish relationships between dissolved organic matter and remote sensing data [11,43], as satellite data can only capture reflected energy and not absorbed energy. The main objective of this article is to assess empirical bio-optical models for estimating aCDOM using in situ remote sensing reflectance for the Negro River, a crucial ecosystem in the Amazon Basin that harbors unique biodiversity, supporting an extraordinary number of protected areas and indigenous communities. Additionally, it is the largest Ramsar site on the planet [44]. Therefore, evaluating the quality and health of water bodies through aCDOM monitoring is a significant endeavor for developing conservation strategies for the region [45].

2. Materials and Methods

2.1. Study Area

The data used in this study were collected from different sections of the Negro River and its main tributaries, which are located in the northern part of the Amazon Basin (Figure 1). The Negro River basin covers an area of 712,000 km2 spanning Brazil, Colombia, Venezuela, and Guyana. More than 80% of the basin is located within Brazilian territory and is characterized by elevations below 200 m.a.s.l. This basin drains extensive regions of dense tropical forest and open vegetation (grasslands and savannas) on geologically ancient Precambrian Guiana Shield terrains [46]. The Negro River flows over Cretaceous sedimentary rocks [47], and its floodplain covers approximately 17% of the basin’s area [48]. The average annual precipitation in the Negro River Basin averages over 2600 mm [49], and the average annual net discharge near the mouth is approximately 30,000 m3∙s−1 [41], with higher values between May and July (high-water season) and lower values in October–November (low-water season).
The Negro River and its main black-water tributaries exhibit a high concentration of dissolved organic carbon (~8 mg∙L−1) and low suspended solids when compared to rivers like the Amazonas, Madeira, Tapajós, and Xingu. The Negro River has a total suspended solids concentrations on the order of 5 mg∙L−1 [42]. The black-water in this basin, ranging in color from brown to reddish, is rich in humic substances, nutrient-poor, acidic (pH 4–5), and has electrical conductivity less than 20 µS∙cm−1 [45]. Black-waters in these rivers primarily result from decomposed plant organic matter and the presence of shallow podzol soils [50]. The primary tributary of the basin is the Branco River, a clear-water river draining extensive savanna areas with its mouth located on the left bank of the Negro River, characterized by slightly acidic to neutral pH (6–7) and an average suspended solids concentration of 15 mg∙L−1 [42].
In the Amazon Basin, dissolved organic carbon represents approximately 70% of the total carbon, with concentrations ranging from 4 to 6 mg∙L−1 in the Solimões, Amazonas, and Madeira rivers, and exceeding 10 mg∙L−1 in the Negro River [7,8]. The DOM present in the Negro River is primarily derived from decomposed plant material in large areas with soils that leach humic substances into the drainage channel [50]. DOM in this type of aquatic environment plays a significant role in light absorption and attenuation within the water column, limiting phytoplankton primary production (the chlorophyll-a concentrations in this river is less than 01 µg∙L−1), contributing to the production of significant carbon dioxide fluxes [40].

2.2. On-Site Data Collection

This study analyzed 80 physical–chemical and optical datasets collected from 25 sample stations along a 1100 km reach of the Negro River, its tributaries, and connected lakes (Figure 1). In each sampling station, triplicates of dissolved organic carbon (DOC) concentration, particulate organic carbon (POC), total suspended solids (TSS) concentration, absorption coefficient of CDOM (aCDOM), and remote sensing reflectance (Rrs) were obtained. After collecting water samples from the sub-surface for DOC, POC, TSS, and CDOM analyses, we conducted radiometric measurements simultaneously in the same spatial–temporal domain. This dataset was collected during both high- and low-water periods between 2017 and 2021 (for details see Supplementary Materials Table S1).
The DOC and POC concentrations were determined in water samples filtered through analytical filters—glass microfiber, resin-free, with a porosity of 0.7 µm, 47 mm in diameter (MERK S/A AP4004700; Merck Millipore, Darmstadt, Germany)—free from organic contamination, as they underwent a decontamination process through calcination in a muffle furnace at 450 °C for 4 h. The filtered samples were stored in amber glass bottles and kept in refrigerators until the time of analysis. The DOC concentration was determined using the Shimadzu TOC-VCPH (Kyoto, Japan) total carbon analyzer with the high-temperature combustion method at 680 °C—Method 5310 B, High-Temperature Combustion Method [51].
The POC was quantified in the filtered material using an elemental analyzer following the NF EN 1484/ISO 8245 method [52]. The concentration of total suspended solids (TSS) was determined using the SO-Hybam protocol [53], which is based on the difference in weighing cellulose acetate filters with a porosity of 0.45 µm.
The absorption coefficient of colored dissolved organic matter (aCDOM) was determined using the hyperspectral spectrophotometer TriOS VIPER (Rastede, Germany), which operates in the range of 350 to 750 nm with a resolution of 2.2 nm. Sample processing in the spectrophotometer was carried out on the same day as the Rrs measurements and water sample collection to determine DOC concentration. aCDOM was obtained using Equation (1) [54]:
a C D O M λ = 2.303 × A λ L ,
where 2.303 is the conversion factor between the base 10 logarithm and natural logarithm, A(λ) is the absorbance value at wavelength λ (nm), and L is the optical path length of the spectrophotometer cuvette cell (0.1 m). Milli-Q water was used as a reference.
The remote sensing reflectance (Rrs in sr−1) was obtained using the simultaneous operation of three TriOS RAMSES sensors, with two sensors measuring radiance and one sensor measuring irradiance, all operating between 320 and 950 nm with a resolution of 3.3 nm. These measurements were conducted with a 40° viewing angle towards the water surface and a solar azimuth angle of 135° [55]. Rrs at different wavelengths (λ) were determined using Equation (2):
R r s λ = L t λ ρ w s , a o t , λ . L s λ E s λ ,
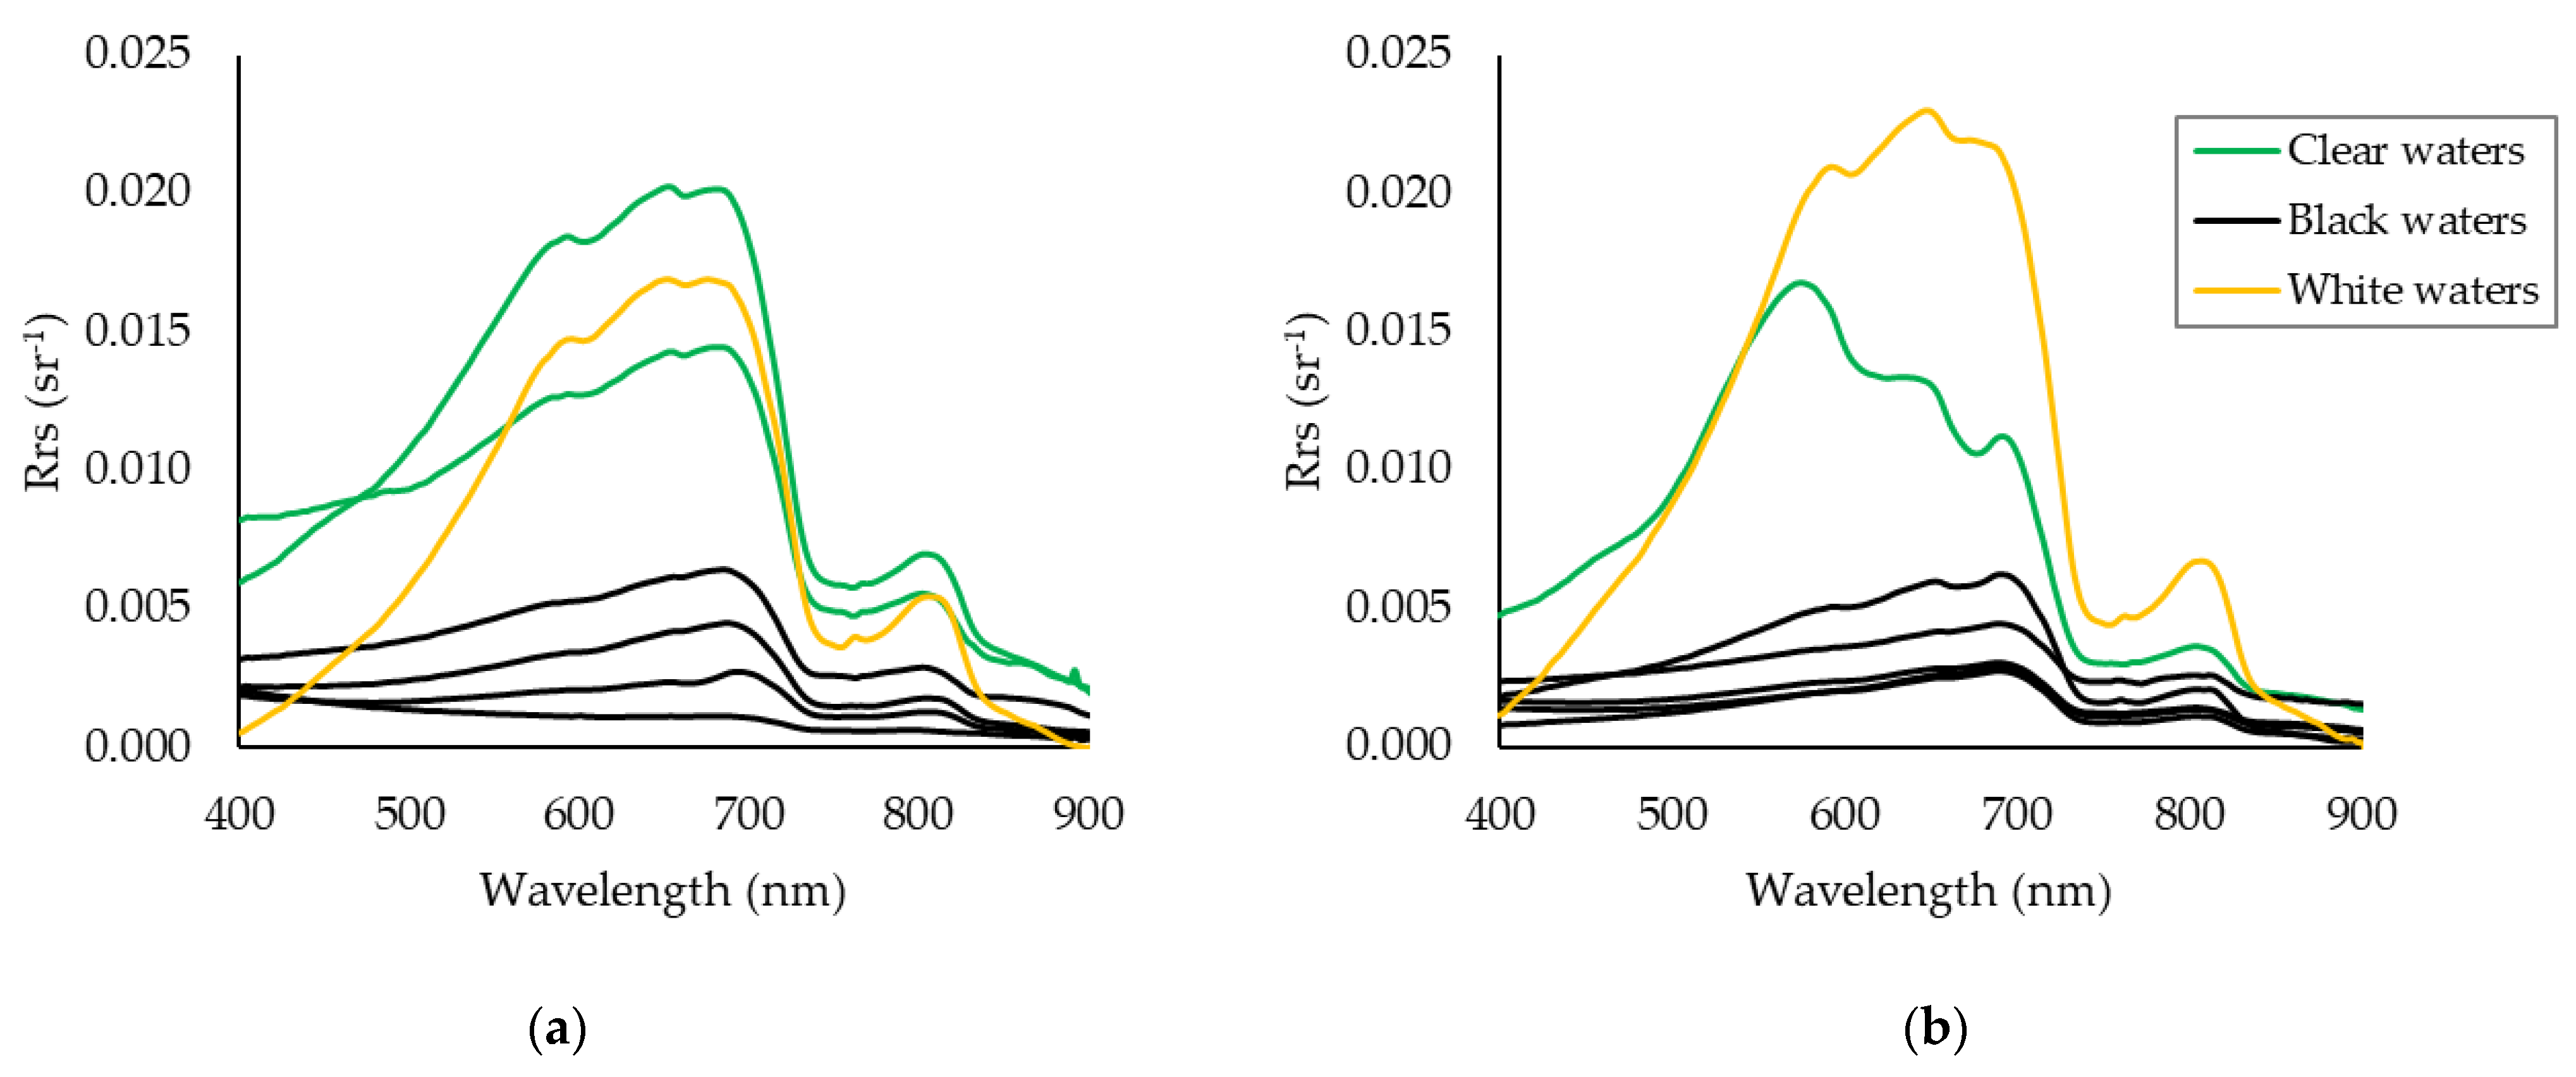
where Es is the incident irradiance at the water surface at 90°, Lt is the upwelling radiance from the water surface at 40° off-nadir, Ls is the radiance from the sky at 40°, ρ is a tabulated multiplicative factor [56], ws is the wind speed measured in situ, and aot is the aerosol optical thickness calculated using CAMS dataset [57]. Figure 2 shows examples of the collected Rrs in the study area during the high-water (Figure 2a) and low-water (Figure 2b) periods. Further details on the Rrs processing can be found in Marinho et al. [42].

2.3. Model Development and Analysis

aCDOM at 440 nm (aCDOM) data were used to analyze the spatial variability of DOM and for the development of bio-optical models using empirical approach. Several studies have evaluated the ratio of Rrs bands at wavelengths in the visible and infrared spectrum to estimate aCDOM in coastal and inland waters [9,10,11,12,18,58]. To develop an aCDOM algorithm, we divided the dataset of in situ data into two representative and independent sub-datasets: 70% for calibration and 30% for validation. Linear and non-linear statistical relationships were assessed between aCDOM (dependent variable) and the ratio of Rrs bands (independent variables) to fit bio-optical models for estimating CDOM in the study area.
Before creating a new customized aCDOM model, we evaluated the accuracy of three existing empirical algorithms found in the literature that use the bands ratio (Ficek et al. [10]) and Sentinel-2 MSI simulated bands from the in situ measured Rrs [11,12]. Empirical models developed by Brezonik et al. [11] and Da Silva et al. [12] were assessed to estimate aCDOM for the Negro River using simulated Rrs for Sentinel-2 satellite bands (MSI sensor). The MSI bands were simulated using the in situ Rrs spectra measured in the study area resampled using the relative spectral response function of this sensor. The resampling was performed using Equation (3):
R r f λ j = i = 1 n R r s λ i × R E R ( λ i ) i = 1 n R r s λ i ,
where Rrf(λj) is the remote sensing reflectance MSI band simulated at wavelength j, and RER is the relative spectral response of each spectral band of the MSI sensor.
The spectral slope (Equation (4)) is an index calculated between different wavelength intervals that can be used to characterize the physical–chemical properties of dissolved organic matter, such as its origin and molecular weight [59]. Based on the aCDOM spectra, exponential functions were fitted to assess the values of spectral slope (S) in the following intervals: 360 to 400 nm (S360–400); 360 to 500 nm (S360–500); 400 to 460 nm (S400–460); and 380 to 700 nm (S380–700).
a c d o m λ = a c d o m   λ r e f · e S λ λ r e f
where S represents the spectral slope (nm−1) within the wavelength interval from λ to λref, and λref is a reference wavelength (nm).
The uncertainties of the models, both from the literature and developed, were evaluated by comparing the estimated and observed data using the coefficient of determination R2, Root Mean Square Error (RMSE), and Mean Absolute Percentage Error (MAPE), as per Equations (5) and (6), respectively:
R M S E = ( x i x o b s ) 2 n ,
M A P E = i = 1 n x i x o b s x o b s × 100   ,
where xobs and xi are the observed and estimated values of aCDOM, respectively, and n is the number of samples.

3. Results

This study analyzed a dataset of 80 samples of CDOM from different hydrological periods. Of these, 58 samples were acquired during low-water periods and 22 during high-water periods. The sampling locations covered diverse areas within the basin, including the Negro River channel (48 samples), the Amazon River (08 samples), lakes connected to the Negro River (04 samples), and tributaries along the left and right banks of the Negro River (20 samples). Additional details about this dataset can be found in Table S1 of the Supplementary Materials.

3.1. Optical and Chemical Properties of Negro River and Tributaries Waters

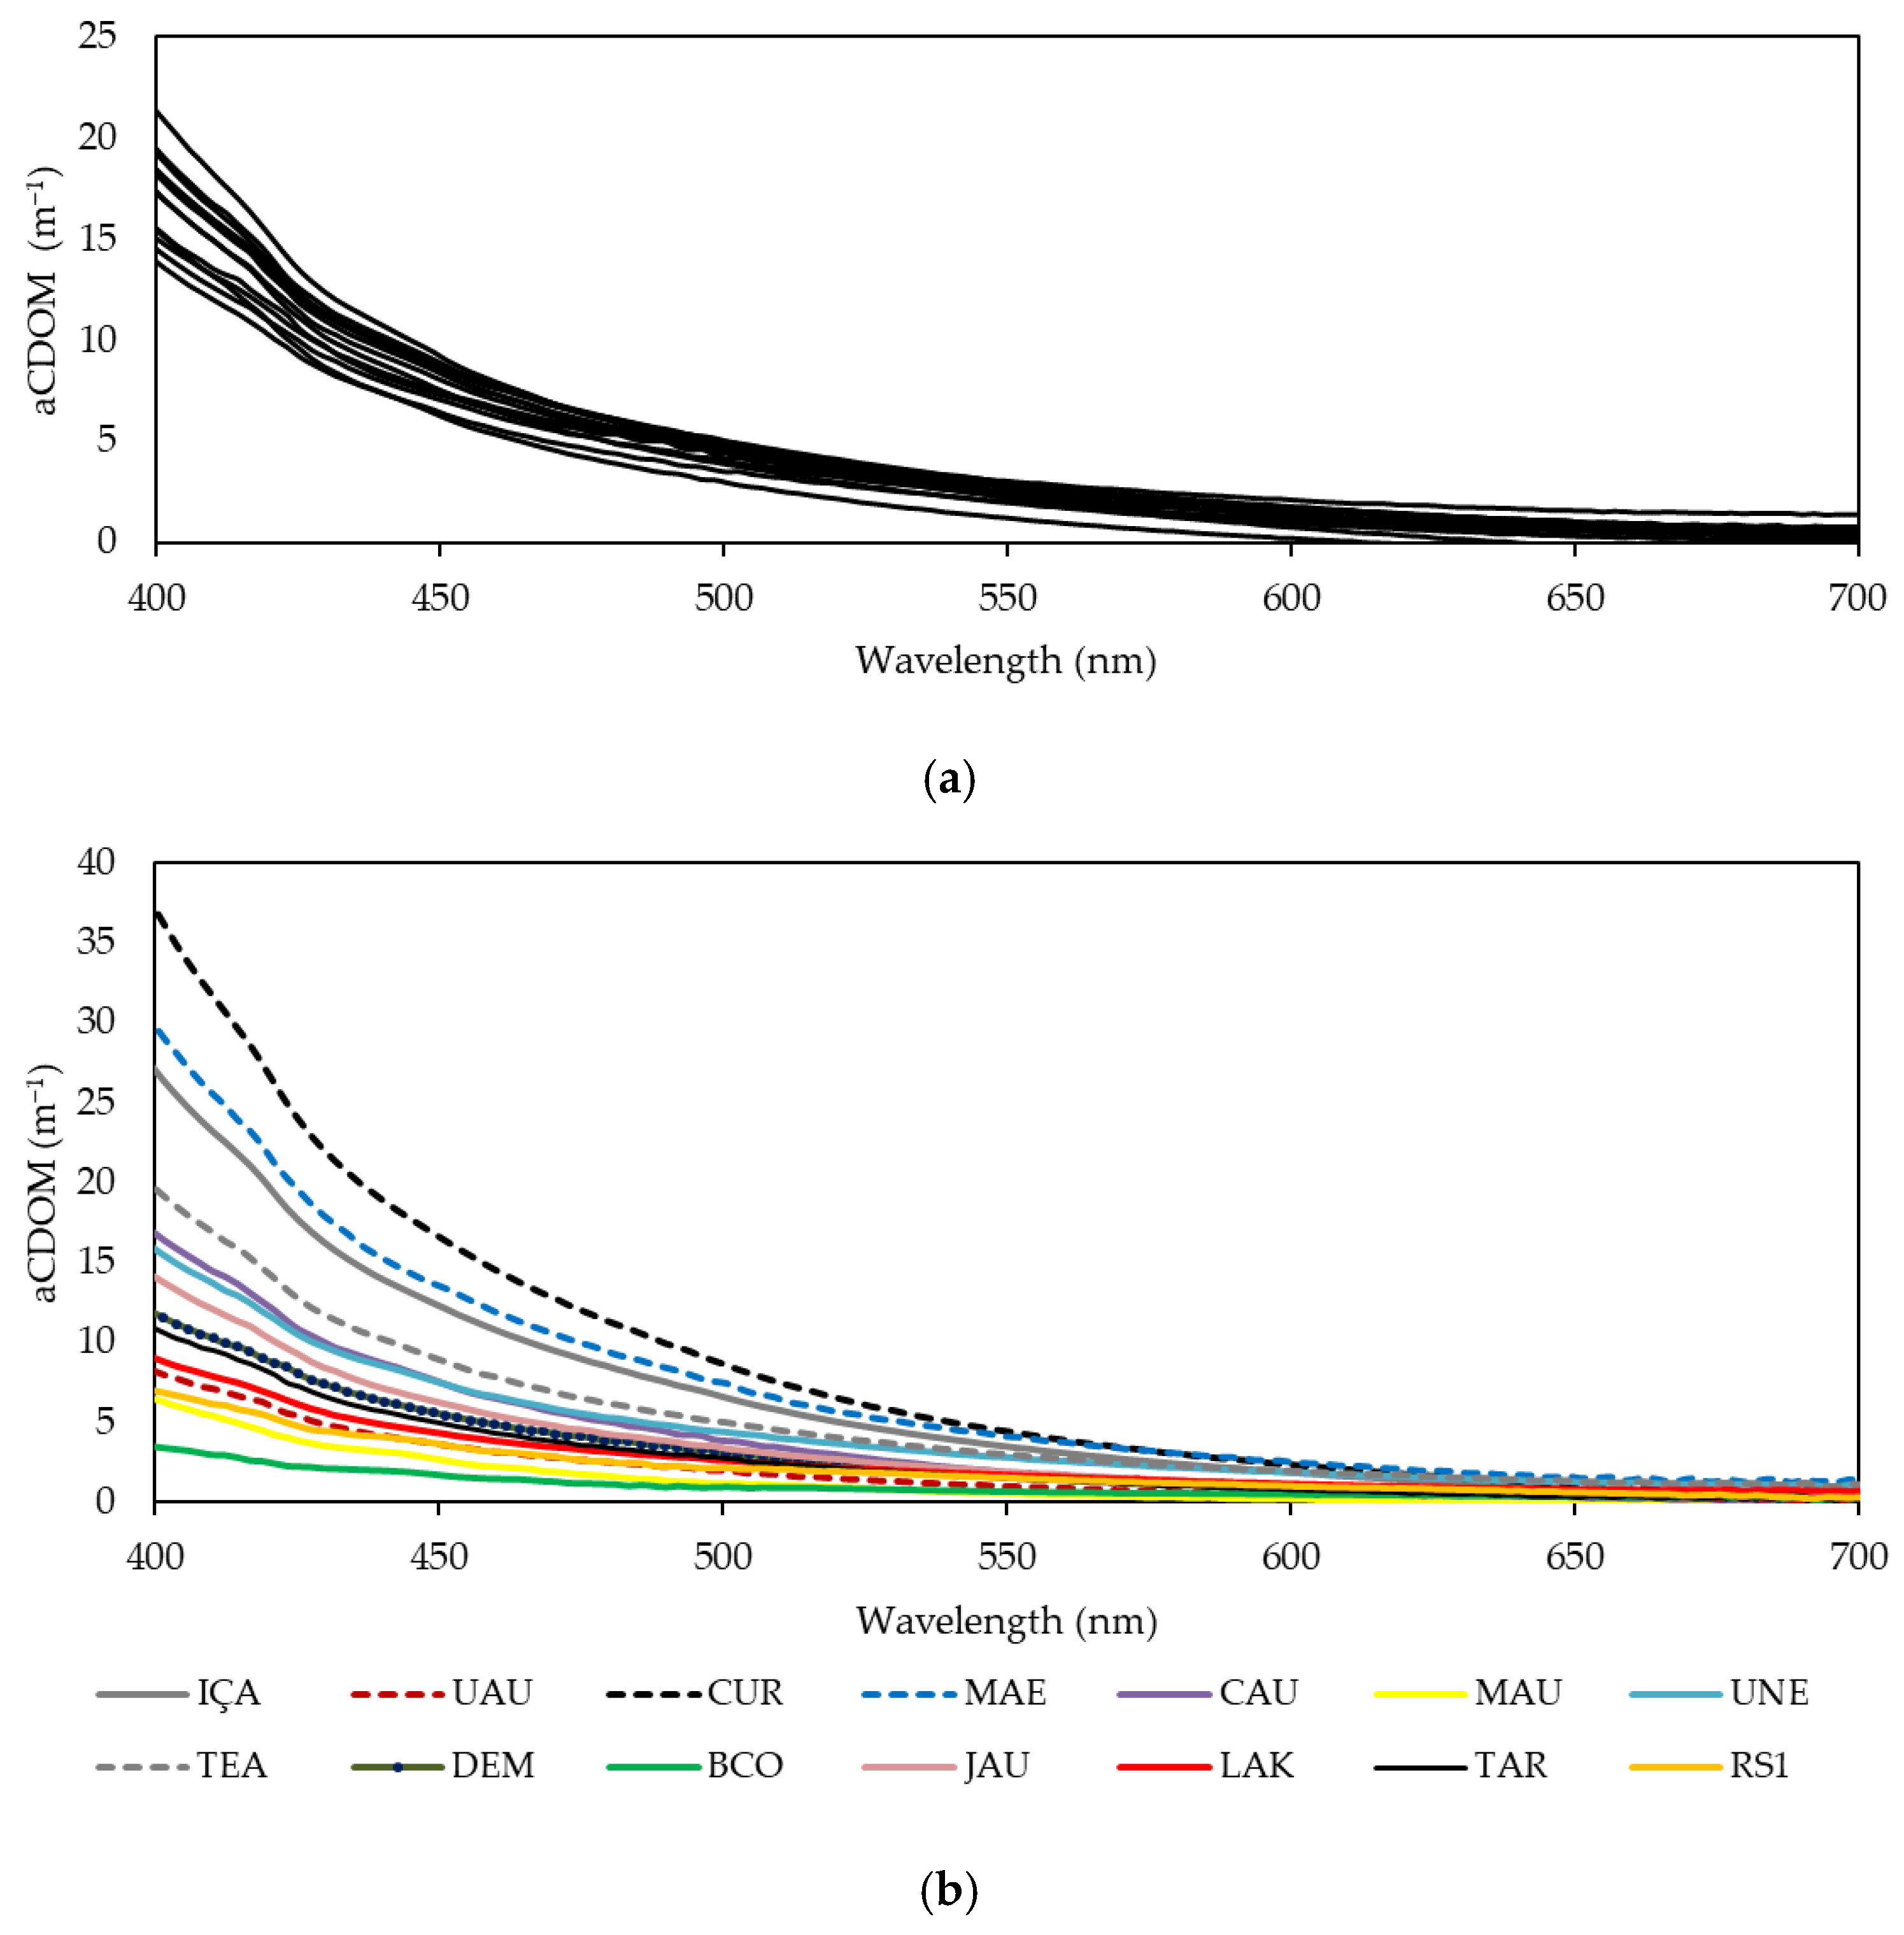
The absorption of light in the water column can be explained by the sum of pure water absorption, suspended solids, phytoplankton, and CDOM. In the Negro River basin, the highest absorption coefficients among the Amazonian rivers stand out, mainly because its waters are strongly marked by the high CDOM and low TSS. Figure 3 presents the dataset of aCDOM from the Negro River and its tributaries, in which we highlight the high values in the violet region (400 nm) and its exponential reduction towards longer wavelengths.
In the dataset of the Negro River (Figure 3a), the aCDOM at 440 nm exhibited an average value of 8.97 m−1, ranging from 6.10 m−1 (station RN6) downstream of the confluence with the Branco River to 10.64 m−1 (station RN9) downstream of the Jaú River. In the stations located in the tributaries (Figure 3b), were observed average values of aCDOM at 440 nm of approximately 5.39 m−1, but with a greater range, varying from 0.61 m−1 (BCO station) in the Branco River to 18.80 m−1 (CUR station) in the Curicuriari River, respectively. The ratio between maximum and minimum values of aCDOM at 440 nm was approximately 10.22, indicating a high spatial variability of CDOM in this basin.
The average concentration of DOC in the Negro River was 10.03 mg∙L−1, ranging from 4.22 mg∙L−1 (station RN6) in its middle course to 14.76 mg∙L−1 (station RN2) in its upper course. It is worth noting that the low DOC concentration at station RN6 is related to the influence of the Branco River, which is the main river of the Negro basin with clear water and the highest concentration of total suspended solids (Table 1). Like the aCDOM data, the tributaries of the Negro River show high spatial variation in DOC concentration values, with the lowest concentration (4.20 mg∙L−1) observed at station PBC, a narrow channel influenced by the Branco River. The Branco River has an average DOC concentration of around 5.18 mg∙L−1. The highest DOC concentrations were observed at stations MAE (20.10 mg∙L−1) and CUR (18.40 mg∙L−1), which are both rivers located on the right bank, draining the tropical forest-covered plain with an annual average precipitation exceeding 3200 mm year.
Regarding the concentration of POC, an average value of 0.33 mg∙L−1 was observed in the Negro River, with values ranging from 0.14 mg∙L−1 in the upper basin (section RN1) to 0.65 mg∙L−1 in its middle course (section RN5). The average concentration of POC in the tributaries was slightly higher than that in the Negro River, approximately 0.45 mg∙L−1, varying from 0.16 mg∙L−1 in the CUR section to 0.70 mg∙L−1 in the BCO section (Table 1). In general, it was observed that POC in the Negro basin accounts for an average of 7.33% of TSS, with higher proportions observed in the Tea, Içana, and Uneixi rivers, all of which drain extensive dense forest plains on the right bank.
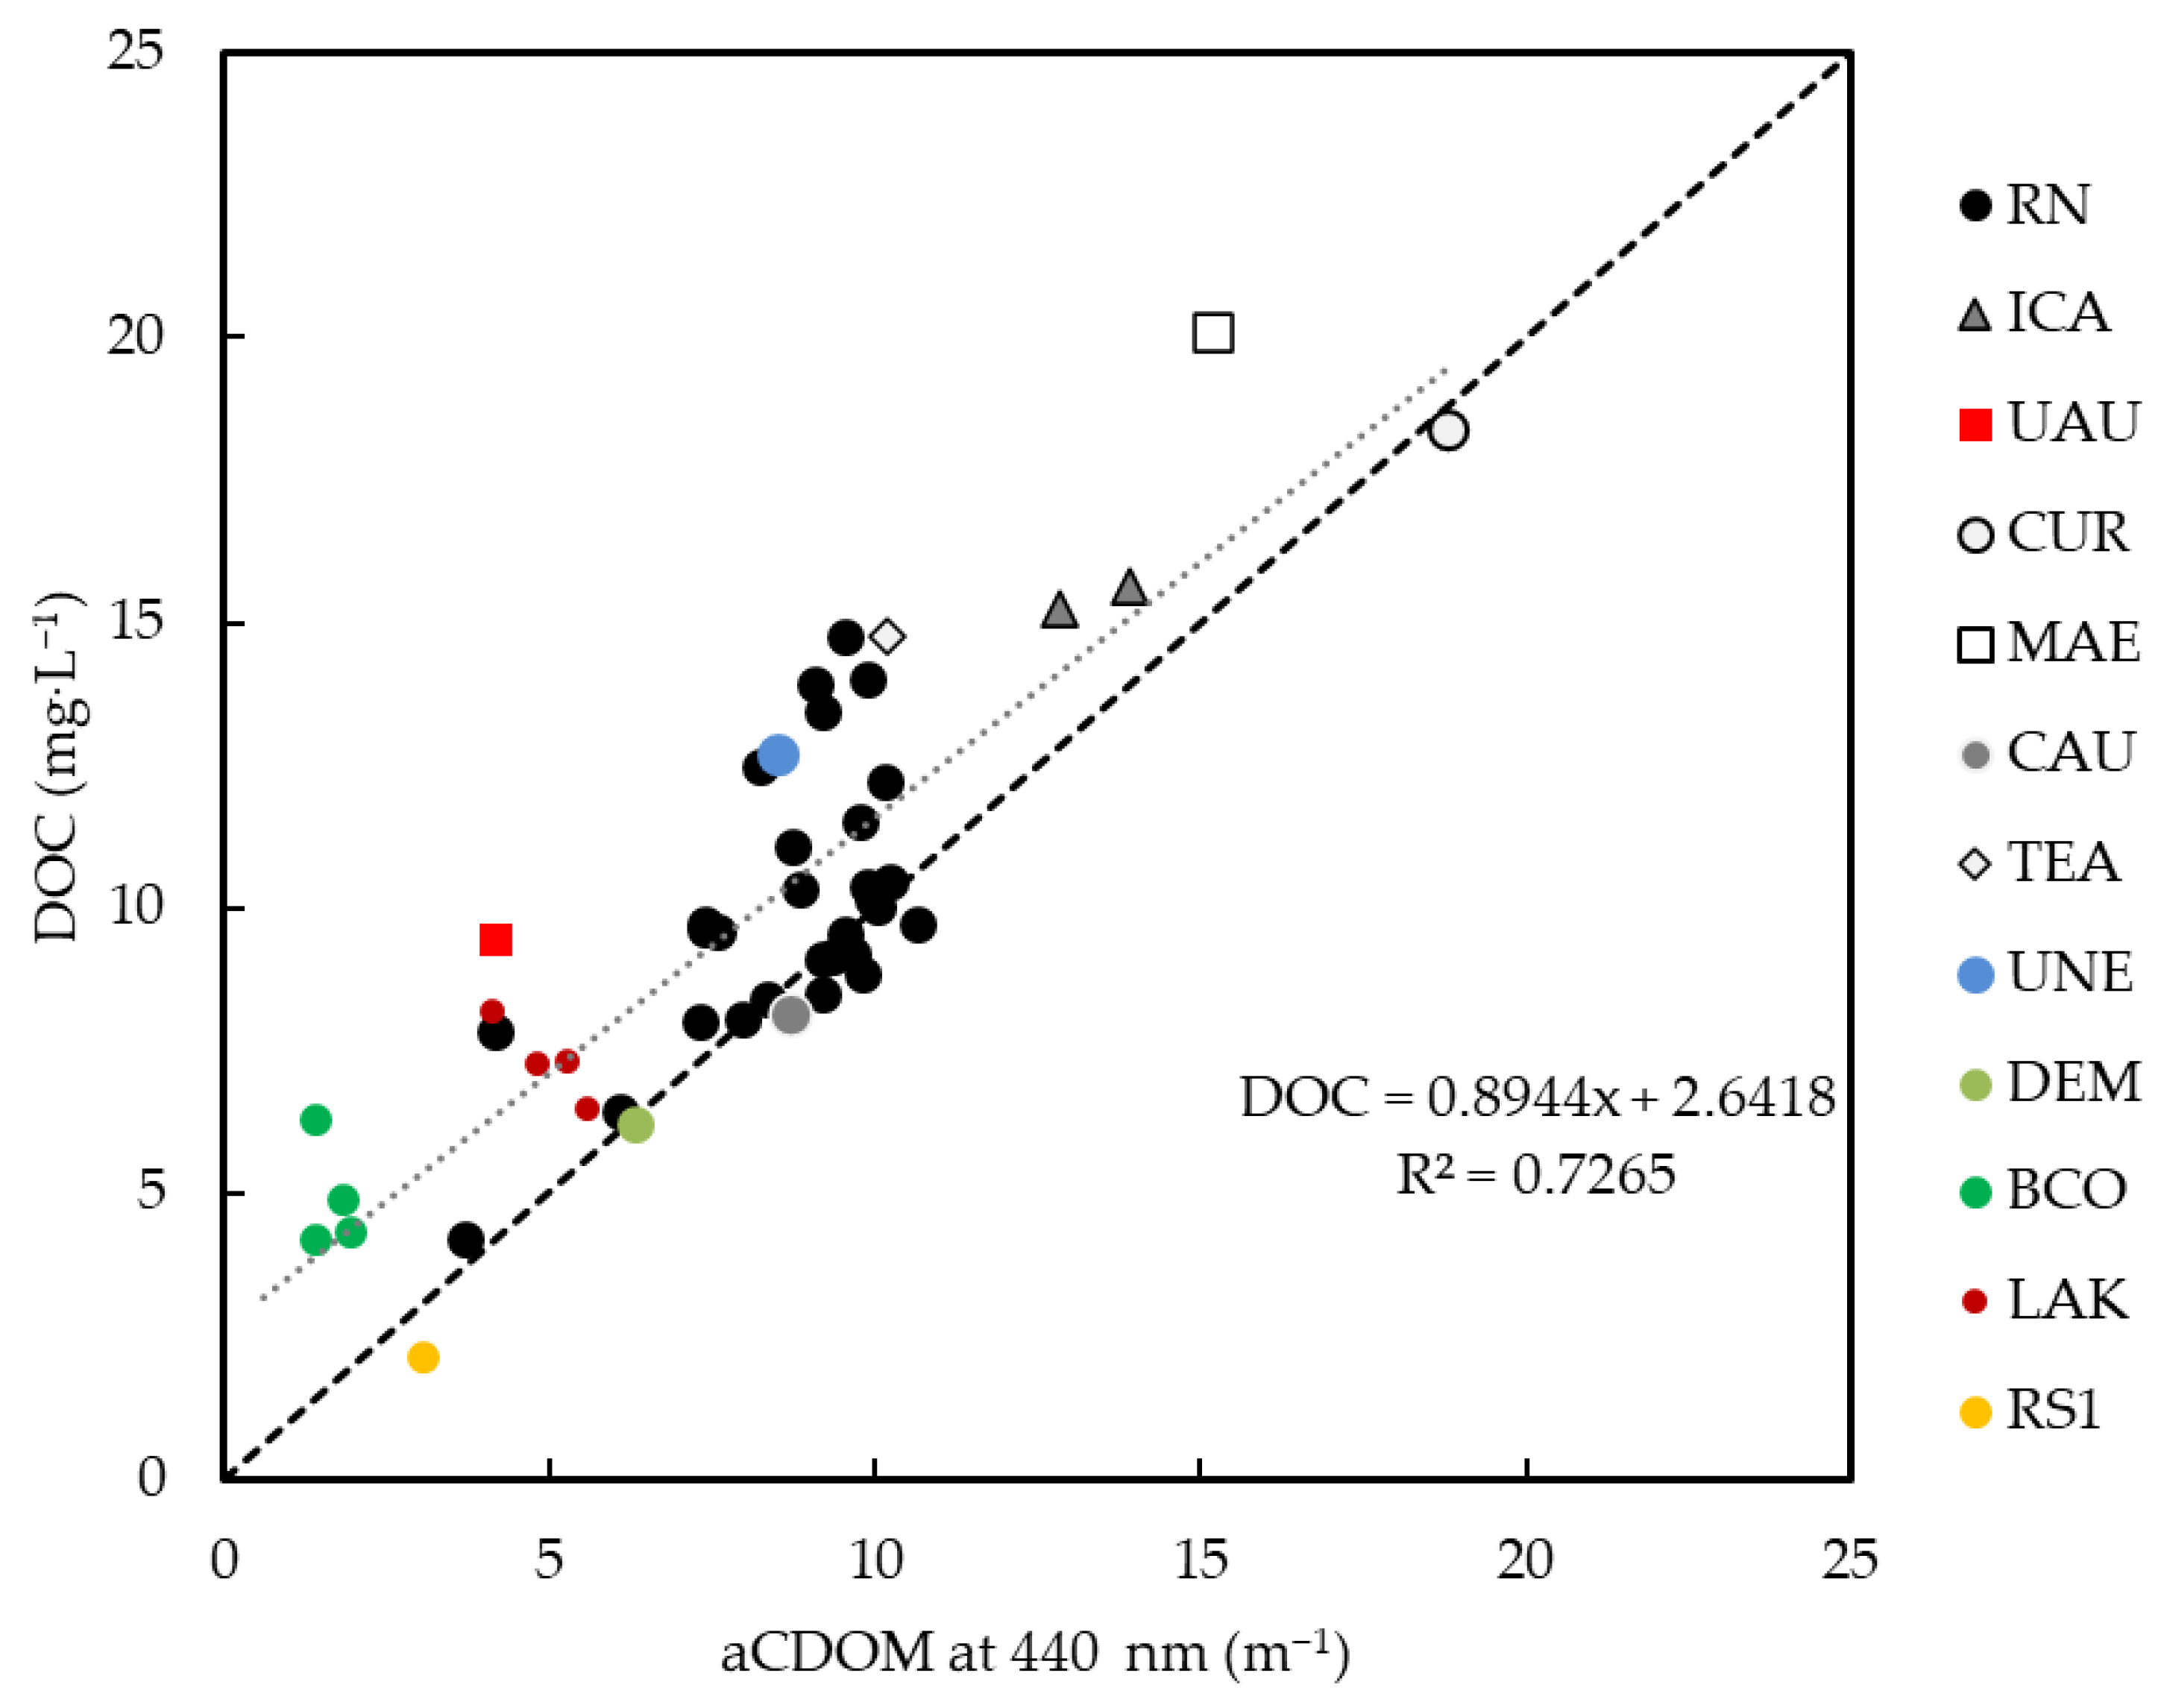
The aCDOM at 440 nm is the most used indicator to characterize the concentration of colored dissolved organic matter in natural waters. The relationship between DOC and aCDOM was assessed and Figure 4 shows the positive linear relationship (R2 = 0.72) obtained, making it possible to separate rivers dominated by black-water (DOC > 6 mg∙L−1) from rivers with white-water (TSS > 12 mg∙L−1, orange and green dots in Figure 3).
The aCDOM/DOC ratio indicates that light absorption at 440 nm increases with DOC concentration. The comparison between observed DOC data and DOC estimated based on aCDOM indicated an RMSE of 2.73 mg∙L−1, with a tendency to overestimate the concentrations (Figure 4).
The analysis of the average spectral slope over different intervals in the UV–visible region showed variations ranging from 0.014 to 0.016, with no significant differences between high-water (0.016) and low-water periods (0.015). The spectral slope for the wavelength range of 380 to 700 nm (S380–700) had a wider range, with minimum values of 0.009 (UNE section) to maximum values of 0.038 (MAR section), as shown in Table 2.
It was observed that the spectral slope of samples collected in black-water rivers was lower than those from rivers with higher concentrations of total suspended solids. In general, we found that the spectral slope calculated in different UV–visible ranges did not exhibit significant relationships with DOC concentration and aCDOM.

3.2. Empirical Models to Estimate aCDOM

We evaluated three models available in the literature for estimating aCDOM from remote sensing reflectance (Table 3). The performance of each model was assessed considering the Rrs in situ data collected during both high- and low-water hydrological periods in the Negro River Basin.
The R2, RMSE, and MAPE are metrics used to assess the goodness of fit, accuracy, and precision of the model’s predictions. R2 indicates the proportion of variance in aCDOM that can be predicted from Rrs. RMSE measures the average magnitude of the residuals, while MAPE evaluates the accuracy of predictions in terms of percentage errors. Both the Ficek and Brezonik models tend to overestimate the estimated aCDOM and the Da Silva et al. model shows higher dispersion during low- and high-water periods (refer to Figure S1).
The performance of models developed in previous studies and applied to the rivers in the Negro basin showed R2 values ranging from 0.08 to 0.67 in the relationship between aCDOM and ratios between Rrs bands (Table 3). The highest percentage error (MAPE of 134%) was obtained with the Ficek et al. [10] model for the high-water period data. On the other hand, this model had the lowest MAPE value for the low-water period data due to the higher Rrs at 570 observed in the BCO and LAK sections (see Figure 2). The models of Brezonik et al. [11] and Da Silva et al. [12], which use Sentinel-2’s blue (MSI-2) and near-infrared (MSI-5 and MSI-6) simulated bands, were not suitable for monitoring colored dissolved organic matter in the Negro basin.
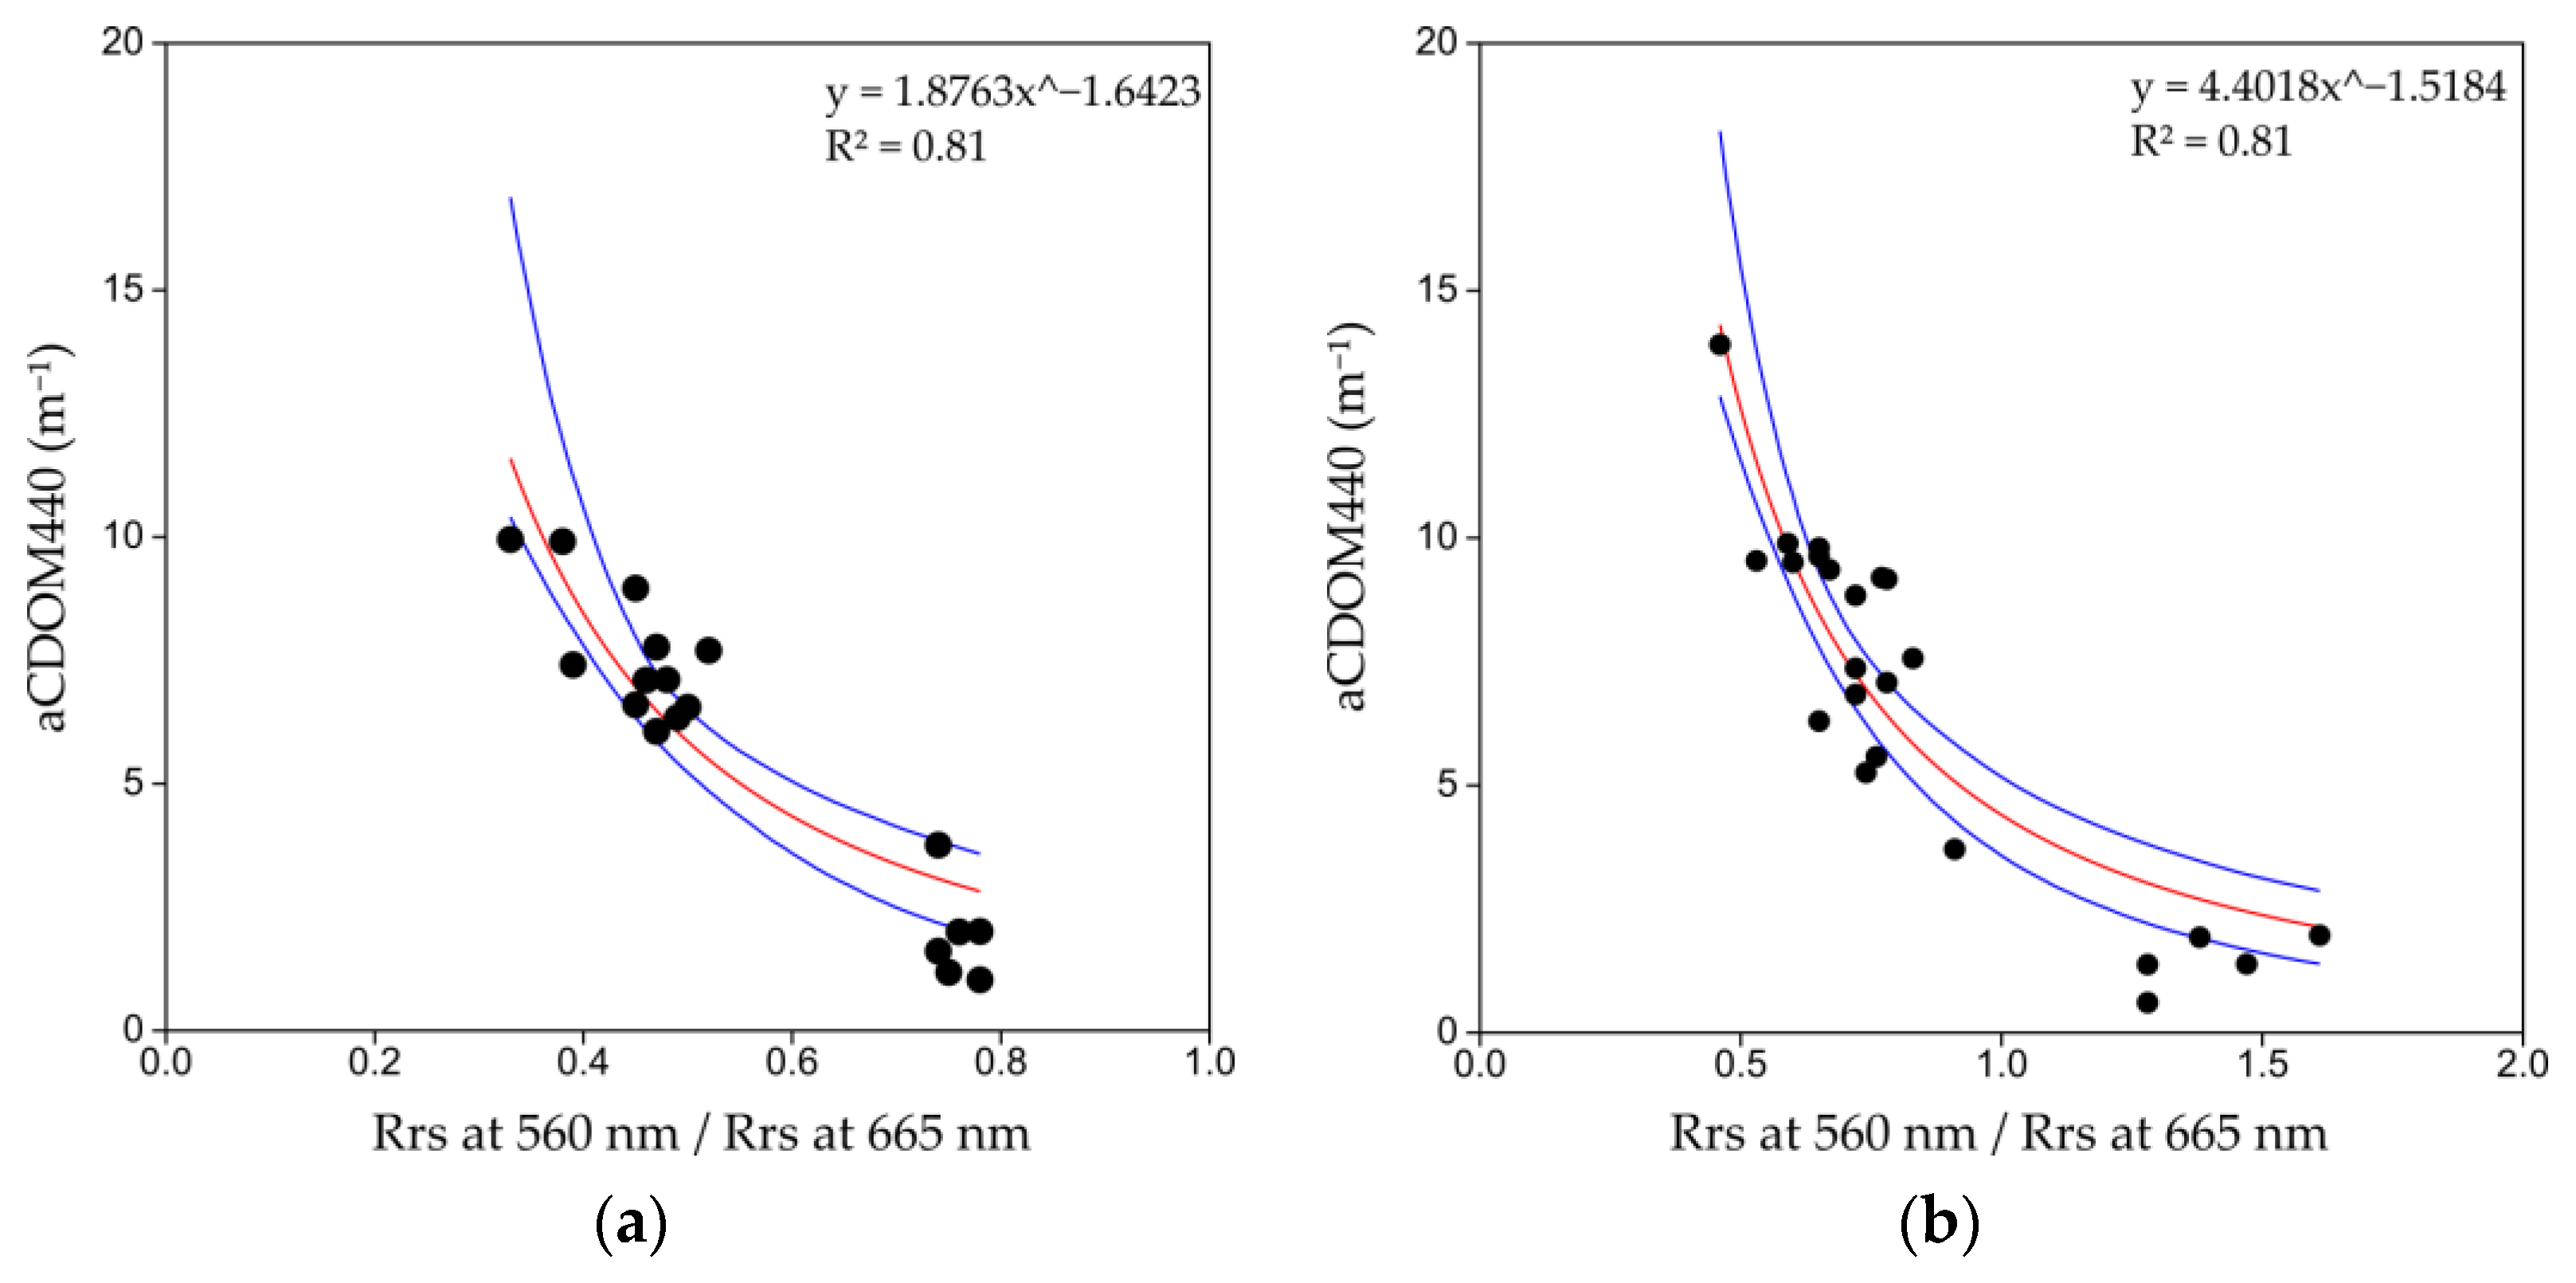
Figure 5 shows the coefficients developed in this study that consider the relationship between aCDOM and the ratio between Rrs at green and red bands. The functions obtained in both low- and high-water periods exhibit a negative exponential shape, with R2 coefficients exceeding 0.80. The model obtained with high-water data had an RMSE of 2.29 (m−1), while the model obtained with low-water data had an RMSE of 1.96 (m−1). The MAPE was 58% for high-water data and 34% for low-water data.
As highlighted earlier, during low-water periods, there are higher values of Rrs at 560 nm over the waters of the Branco River and lakes connected to the floodplain of the Negro River, resulting in values exceeding 1.00 in the ratio between green and red bands (Figure 5b).
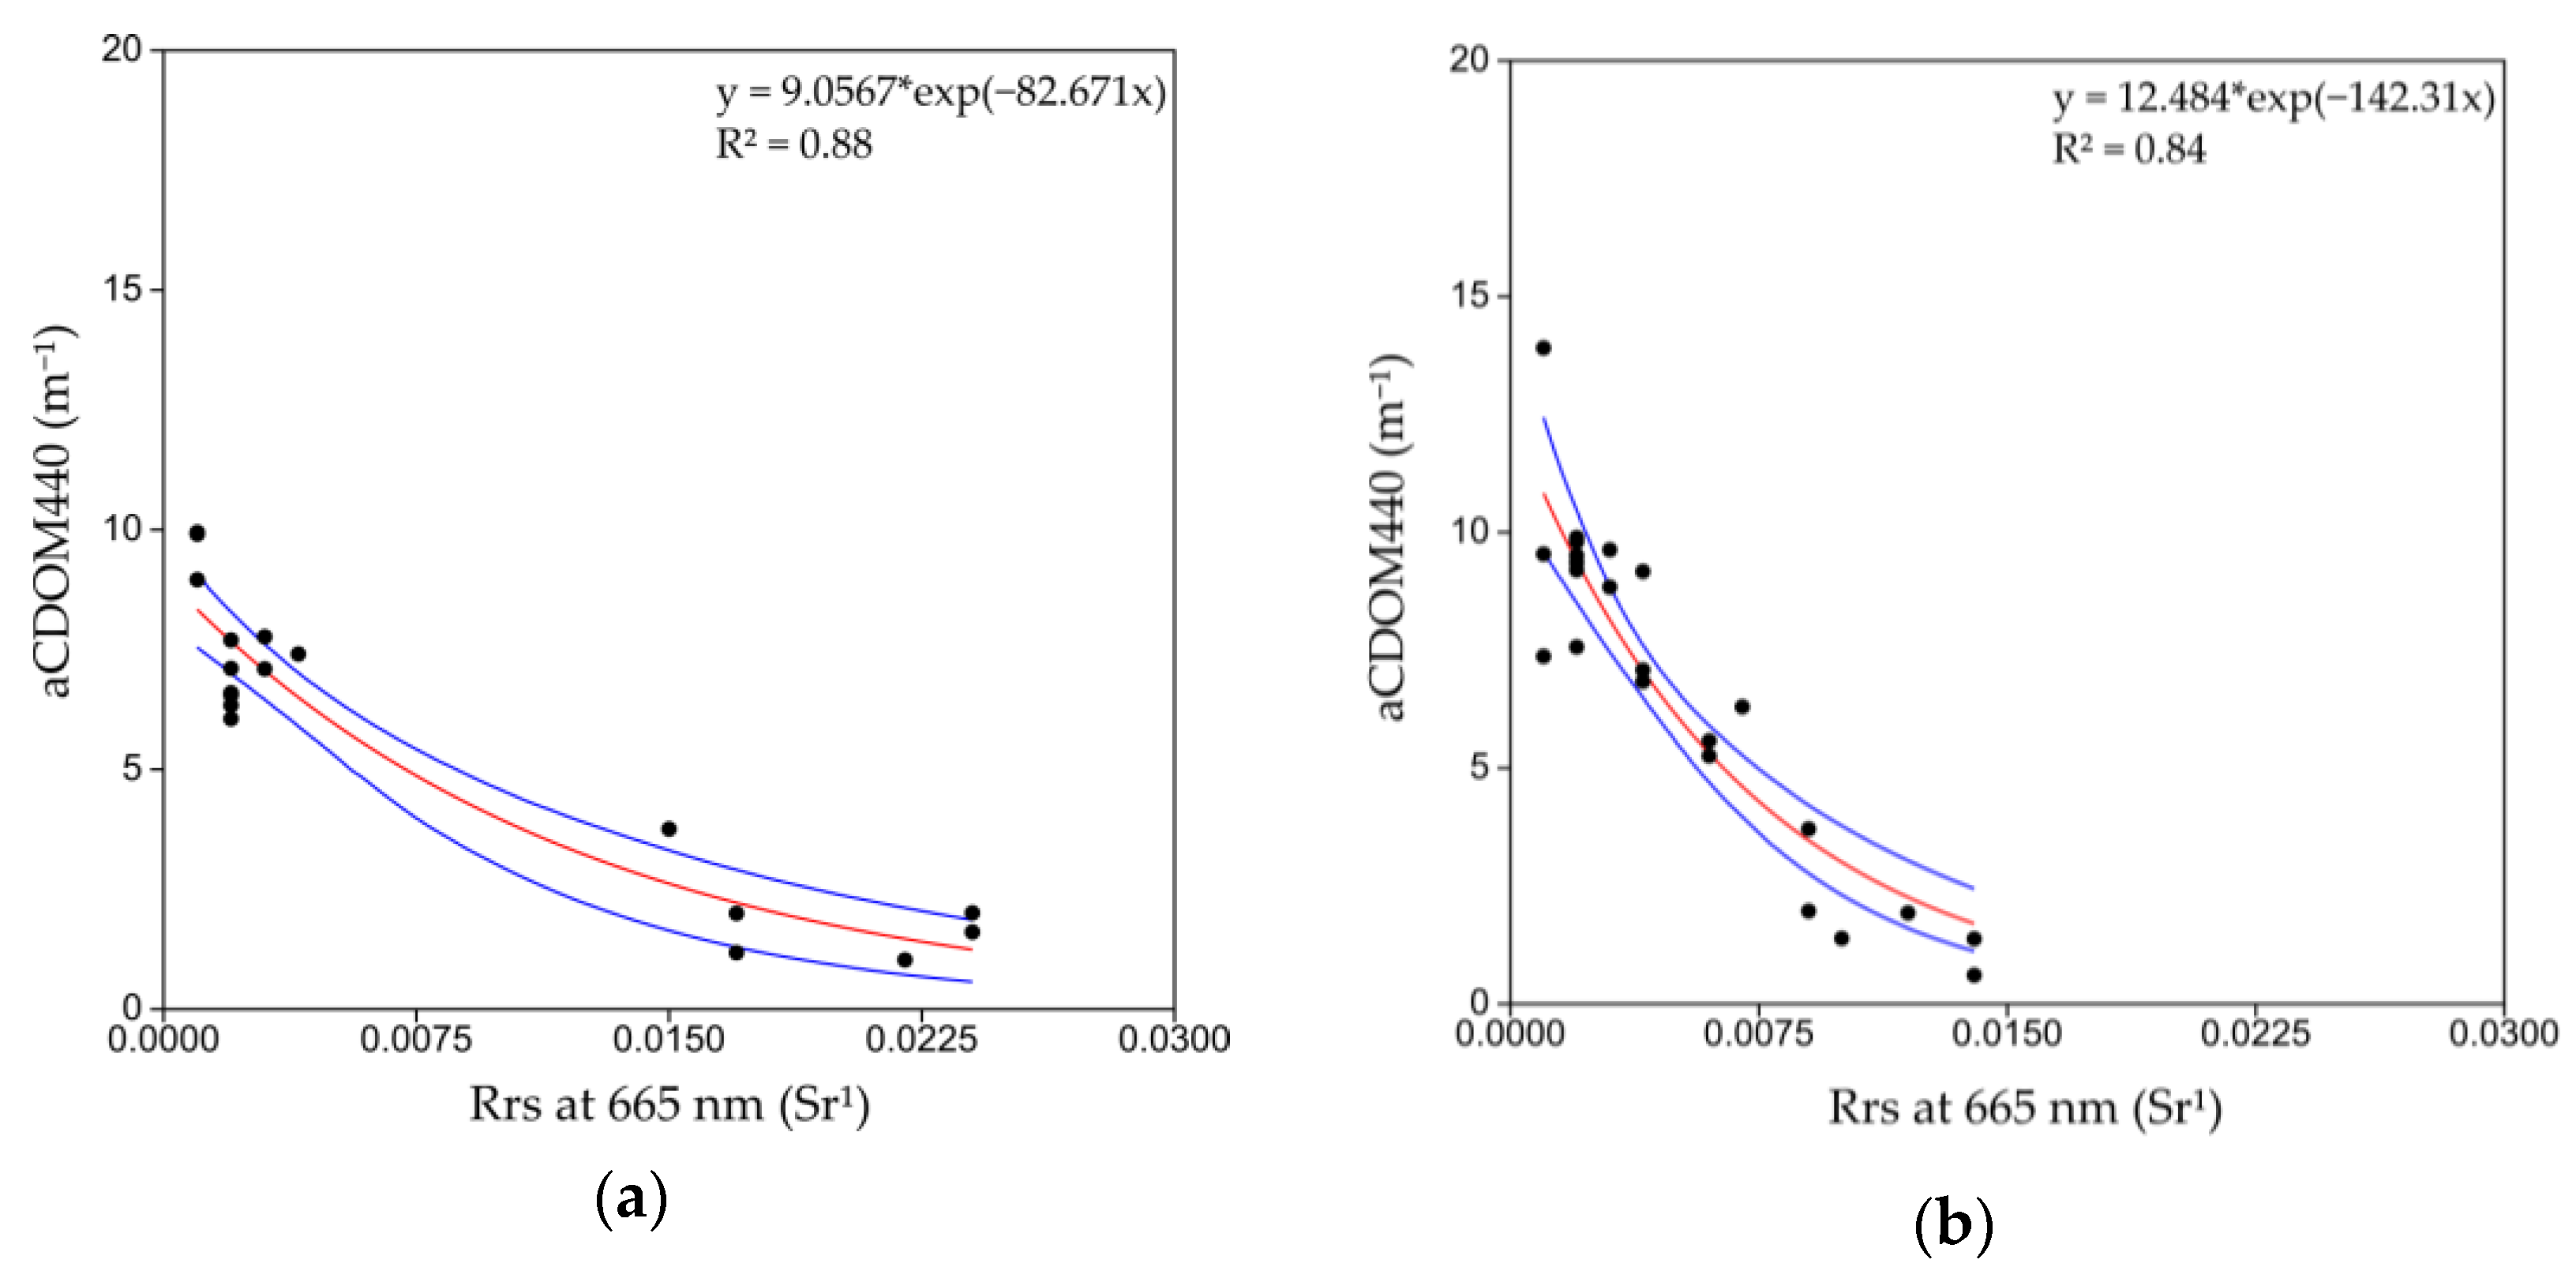
This study also obtained a good correlation between Rrs at 665 nm and aCDOM at 440 nm, considering an exponential fit (Figure 6). Using only Rrs at 665 nm to estimate aCDOM, the R2 values range from 0.84 to 0.88, and the RMSE was 1.75 (m−1) for the model obtained with high-water data (Figure 6a) and 0.88 (m−1) for the model obtained with low-water data (Figure 6b). The MAPE was 34% for high water and 12% for low water. This indicates that the red band exhibits good sensitivity to monitor the spatial and temporal variation of CDOM in the Negro River basin.
The R2 values indicate that around 88% and 84% of the observed variation in Rrs at 665 nm is associated with changes in aCDOM concentration during high-water and low-water periods, respectively. The regression slope that Figure 6 models is negative, indicating that Rrs decreases as aCDOM concentration increases, particularly during low-water periods. This behavior is a result of aCDOM’s ability to absorb sunlight, which reduces the amount of light that reaches the water’s surface and is reflected.

4. Discussion

Obtaining the spatial distribution of CDOM is crucial for inferring biogeochemical processes occurring in aquatic environments and obtaining insight into the dynamics of large aquatic ecosystems with complex optical properties, such as the Negro River. Mapping CDOM in different regions allows for a better understanding of how DOM in rivers can be influenced by environmental factors like temperature, salinity, and pH. This information contributes to a deeper comprehension of biogeochemical processes, water quality, and aquatic ecosystems. Furthermore, it can provide valuable insights into the management and conservation of water resources.
This study analyzed the connections between the spectral properties of water surfaces and the functional characteristics of complex wetland ecosystems. It identified unique interactions between solar radiation and the Amazonian rivers. This assessment allows for the visualization of biogeochemical dynamics in aquatic systems with increasing detail. It leverages the capabilities of new satellite generations, such as Landsat-8, Sentinel-2, Landsat-9, PRISMA, ERMAP, and Planet Tanager, to detect subtle changes in inland water spectral behaviors at higher spatial, spectral, and temporal resolutions. Despite these advancements, identifying carbon inputs and fluxes in inland waters remains a pivotal focus for future remote sensing investigations [13]. Rivers play a fundamental role in the global carbon cycle, underscoring the importance of developing early warning systems to monitor and understand carbon dynamics in these vital ecosystems.
The presence of CDOM significantly affects water quality in both continental and coastal aquatic ecosystems. In the case of the Negro basin, the high CDOM at 440 nm in the rivers reduces the single scattering albedo and alters its physical and chemical properties. For example, the average temperature of the Negro River is approximately 1 °C higher than that of the Amazon River [60]. CDOM also affects water acidity (pH), nutrient retention capacity, and the formation of complex chemical compounds through chemical reactions. These changes in the physical and chemical properties of water due to CDOM affect the availability of nutrients in aquatic ecosystems, photosynthesis, as well as the diversity and composition of the biological community [61].
CDOM is an important photoactive component of dissolved organic matter that strongly absorbs ultraviolet and visible light [36]. It is formed by a combination of acid-soluble substances leached from the soil, primarily originating from the degradation of vegetation in the soil [5], and can influence the amount of light available in the water for photosynthesis [13].
CDOM plays an important role in aquatic ecosystems because the absorption of light by dissolved organic matter influences the availability of radiant energy for photosynthesis and other biological processes in aquatic ecosystems. Additionally, the interaction of CDOM with light can also affect water temperature and the photodegradation and photosensitization processes. The black-water rivers in the Negro River basin have a high concentration of humic acids [50,62,63]. The humic substances present in aquatic environments in the basin, along with the high concentration of dissolved organic carbon, can create conditions to act as a buffer and affect the chemical equilibrium of the aquatic environment and nutrient availability [64].
The soils in the Negro basin are nutrient-poor, with extensive areas of sandy texture, covered by dense equatorial forest [65]. A typical soil in the Negro basin is Podzol, mainly found in the upper courses of the Negro and Branco rivers, characterized by its low chemical fertility due to its high acidity, abundant quartz, and low clay content. Along the floodplain, Gleysols predominate [66]. Clayey soils are the main source of dissolved silica, while sandy soils are considered the primary source of organic compounds and mineral particles [63].
The primary change in optical properties caused by the high CDOM values in the analyzed rivers is the increase in the absorption of solar radiation in the water column, which, in turn, influences the physical properties of the water near the surface (average temperature of 30.20 °C; pH of 4.88; and dissolved oxygen of 7.42 mg∙L−1). These extreme conditions can intensify with global warming scenarios and affect water quality and the capacity to support aquatic life in the igapós of the basin.
In the Negro River and right-bank tributaries, DOC accounts for more than 97% of the total carbon, while in the Branco River, this proportion reduces to 86%. The ratio between POC concentration and TSS concentration can be used to understand the relationship between the amount of suspended material and the amount of particulate organic carbon in the water. Higher ratios (POC/TSS > 10%) were observed in the data collected from the Içana, Tea, and Uneixi rivers, indicating that in these tributaries, there is a greater contribution of POC compared to suspended material compared to other rivers in the basin.
The light absorption by CDOM can provide information about the allochthonous (terrestrial source) or autochthonous (algae, microbes) origin of DOC. The CDOM in the Negro River predominantly has an allochthonous origin [67], with a higher degree of aromaticity and larger molecular weight. Absorption spectra of CDOM typically exhibit properties like absorption near 280 nm and fluorescence around 360–400 nm, which are common characteristics of DOC from terrestrial sources. In contrast, dissolved organic matter produced by algae and/or microbes generally shows high absorption around 254 nm and weaker fluorescence around 400–500 nm [4]. Analyses of the spectral slope of the absorption in these regions of the electromagnetic spectrum can provide important information about the origin of DOC [4,12]. The acids present in the aquatic environment of the Negro basin are dark compounds primarily derived from the decomposition of local vegetation that has primarily developed on podzolic soils [67,68].
As presented in Table 2 and observed in previous studies [11,12,59,69], the spectral slope values tend to remain within a narrow range. In the case of the Negro River, the spectral slope was around 0.015, a value close to data obtained in oceanic [70] and terrestrial waters [12,69]. It is interesting to note that when evaluating the relationship between aCDOM and spectral slope about the origin of CDOM, it was not possible to observe a clear pattern in terms of temporal or spatial variations in this basin. However, it is important to highlight that this analysis had limitations due to the unavailability of SUVA and spectral slope calculated near 220 nm for a more comprehensive and detailed characterization of these relationships.
The presented dataset in this study focuses on water quality and remote sensing, with a predominance of black-water in the Amazon Basin. The results show a strong relationship between aCDOM and DOC concentrations (Figure 4), as well as between aCDOM and Rrs at 560 nm/Rrs at 665 nm (Figure 5), which is consistent with previous studies [11,12,18,71] conducted in different aquatic environments. Empirical algorithms were chosen for their effectiveness in capturing the simple relationships between in situ remote sensing data and aCDOM in this environment. The simplicity and practicality of empirical models make them well-suited for our study, allowing us to efficiently assess the accuracy and feasibility of this approach for aCDOM estimation in optically complex inland waters.
The observed positive correlation between CDOM and DOC concentrations can be explained by the fact that CDOM primarily originates from DOM. The wide range of DOC and aCDOM values in the rivers of the basin (0.61–18.80, see Table 1), as well as the predominantly terrestrial origin of DOM, further support this relationship. This correlation has allowed for the development of empirical predictive models to estimate aCDOM, which can be used to predict CDOM in the study area based on red and green bands.
The aCDOM at 440 nm exhibited spatial and temporal variation in the study area, with higher values in the right-bank tributaries (Curicuriari, Içana, and Marié rivers) located in the upper course of the Negro basin and lower values in white-water rivers with higher TSS concentrations (Branco, Marauiá, and Amazon rivers). This spatial variation followed the pattern of DOC presented in Table 1, with higher values observed in the upper course tributaries. During the high-water period, we noticed lower values of the green/red band ratio (<1), which can be related to the greater absorption of light by CDOM in the water during the flooding period. In this basin, the fluvial regime’s variability causes water levels to vary by up to 10 m between high-water and low-water periods [41].
This study’s results demonstrate that seasonality affects the green/red band ratio. During the high-water period in the Negro basin, there is a higher concentration of dissolved organic carbon (DOC), resulting in reduced reflectance across the visible spectrum [36]. It is noteworthy that Da Silva et al. [12] estimated aCDOM in lakes located in the Amazon floodplain with a strong influence of suspended solids from the Amazon River, using simulated in situ Rrs from the MSI sensor (Sentinel-2). The evaluation of this model using blue-, green-, and red-edge bands with data from the Negro basin showed good performance for data collected during the high-water period (refer to Table 2). However, models that use the blue band to estimate aCDOM may perform poorly due to the strong influence of atmospheric constituents in this spectral region [19,72].
The aCDOM values at 440 nm observed in this study are higher than those obtained in previous studies in the Amazonian floodplain [12,36], lakes, and rivers with different trophic states [69], as evident in Table 4. The soil, a dense forest cover, high precipitation, and low erosion rates observed in the Negro basin are the primary environmental factors explaining CDOM in this region.
Figure 7 shows the longitudinal distribution of average CDOM along the Negro River, Amazon River, and the coast of French Guiana, highlighting aCDOM at 440 nm values exceeding 10 m−1 along the entire Negro River, except for data observed in the Uaupés River, an upper-course tributary. It is interesting to note that the aCDOM values of the Amazon River are not affected by the input of CDOM from the Negro River, indicating that the high concentrations of total suspended solids in white-water rivers of the Amazon River mask the spectral signature of CDOM [43,74]. Indeed, the area drained by the Amazon River upstream from the mouth of the Negro River contributes significantly to the dissolved organic matter exported to the ocean, but CDOM does not dominate the spectral response.
During the low-water period, some of the water stored in the floodplain lakes during the rainy season flows into the channels of the Negro River. This dynamic can influence the concentration of DOC and, as a result, increase light absorption. Internal processes, such as autochthonous CDOM production, primary production, photooxidation, and bacterial decomposition, have a low influence on the colored dissolved organic matter in the Negro River waters.

5. Conclusions

This study assessed the spatial and temporal variation of colored dissolved organic matter (CDOM) in black-water rivers in the northwest Amazon Basin. Using a dataset of in situ aCDOM at 440 nm, dissolved organic carbon (DOC), and remote sensing reflectance (Rrs), empirical algorithms were evaluated and developed to estimate the aCDOM for rivers in the Negro River basin, using the ratio of Rrs in the green and red bands. Robust relationships were obtained between aCDOM and DOC, as well as between aCDOM and the Rrs bands ratio.
It was shown that aCDOM can serve as a proxy for DOC, and Rrs can serve as a proxy for aCDOM in the Negro basin. It is important to note that the correlation was lower during the flood period. Additionally, we observed that the results in the model fits were influenced by the presence of waters with widely distinct spectral responses.
Our results demonstrate the feasibility of using aCDOM and the Rrs ratio to monitor colored dissolved organic matter in black-water rivers in the northwest Amazon Basin. The analysis of the relationship between the Rrs ratio in the green and red bands and aCDOM, as observed in various studies, proves to be suitable for monitoring the colored dissolved organic matter in the Negro River. Although the empirical relationships are only valid for the analyzed dataset, the evaluated models suggest that Rrs can serve as a quantitative indicator of DOC concentration in this basin. This enables the future evaluation and use of orbital or airborne multispectral sensors.
This study shows that CDOM can be used to monitor organic carbon in the Negro basin, and Rrs data can be used to map its spatial distribution with satellite images. However, robust atmospheric correction is necessary. The water composition of black-water rivers in the Amazon varies significantly due to the soil and vegetation characteristics of the basin. These optical differences are reflected in the aCDOM and remote sensing reflectance. Therefore, when analyzing rivers with significant optical differences, the empirical model developed in this study considered the complexity of the water composition in this basin. This consideration improved the accuracy of aCDOM estimates.
For different UV–visible ranges, we demonstrate that black-water rivers in the Amazon basin exhibit a stable spectral slope with no significant variations, regardless of hydrological and geographical variability, despite the wide variation in dissolved organic matter in these rivers. These findings establish an initial baseline for future investigations into the inherent optical properties of black-water rivers, as well as their relationship to carbon cycling dynamics and other relevant ecosystem processes.
The distribution of aCDOM in the Negro River basin varies with the type of aquatic environment (clear-, black-, and white-water) and the hydrological variability. Further research is needed to better understand the factors that control the distribution of CDOM in the Negro basin. Future investigation could focus on developing local empirical models that combine more data from the main channel, tributaries, confluences, and/or lakes. To enhance the analysis and monitoring of CDOM in optically complex inland waters, it is recommended to develop semi-analytical, machine learning models and explore other band ratios. Additionally, the developed models should be applied to multispectral and hyperspectral orbital imagery. This approach is particularly useful for large rivers like those observed in the Amazon Basin.

Supplementary Materials

The following supporting information can be downloaded at https://www.mdpi.com/article/10.3390/rs16040613/s1, Table S1: Summary of in situ measurements collected from 2017 to 2021. Figure S1: Comparison of aCDOM measured and estimated for the models Ficek et al. (a), Brezonik et al. (b), and Da Silva et al. (c).

Author Contributions

Conceptualization, R.R.M. and J.-M.M.; methodology, R.R.M., J.-M.M., T.C.S.d.O., W.P.M., L.A.S.d.C. and T.H.; formal analysis, R.R.M., J.-M.M., W.P.M. and L.A.S.d.C.; resources, J.-M.M. and T.C.S.d.O.; data curation, R.R.M.; writing—original draft preparation, R.R.M., J.-M.M., T.C.S.d.O., W.P.M., P.M.-T. and L.A.S.d.C.; writing—review and editing, R.R.M. and J.-M.M.; supervision, J.-M.M. and T.C.S.d.O.; funding acquisition, J.-M.M. and T.C.S.d.O. All authors have read and agreed to the published version of the manuscript.

Funding

This research was funded by Universidade Federal do Amazonas [0621/2017]; Institut de Recherche pour le Développement [grant number 262185]; Coordenação de Aperfeiçoamento de Pessoal de Nível Superior—Brasil (CAPES) [Finance Code 001]; and Fundação de Amparo a Pesquisa do Estado do Amazonas (Edital Universal FAPEAM 20 anos). This study was partly funded by CNES through the TOSCA program (project OBS2CO) and The HYBAM Program.

Data Availability Statement

The data presented in this study are available on request from the corresponding author.

Acknowledgments

The authors thank the management team of the Anavilhanas National Park in Novo Airão (ICMBio) for providing logistical support and the Géosciences Environnement Toulouse for the internship received by the first author. The authors would like to thank the Brazilian Navy, the company Petróleo Brasileiro S.A. (PETROBRAS) and the Agência Nacional do Petróleo (ANP) for making fieldwork possible, through the Cooperation Terms SIGITEC 2018/00451-6 and 2018/00452-2. We acknowledge the Centro de Hidrografia e Navegação do Noroeste (CHN-9), and the crew of the AvHoFlu Rio Solimões (H14) for the support in the data acquisition for this research. The authors express their gratitude to the anonymous reviewers for their valuable suggestions to improve the manuscript.

Conflicts of Interest

The authors declare no conflicts of interest. The funders had no role in the design of the study; in the collection, analyses, or interpretation of data; in the writing of the manuscript; or in the decision to publish the results.

References

  1. Richey, J.E.; Krusche, A.V.; Johnson, M.S.; da Cunha, H.B.; Ballester, M.V. The Role of Rivers in the Regional Carbon Balance. In Amazonia and Global Change; Keller, M., Bustamante, M., Gash, J., Silva Dias, P., Eds.; American Geophysical Union: Washington, DC, USA, 2009; Volume 186, pp. 489–504. [Google Scholar]
  2. Sutfin, N.A.; Wohl, E.E.; Dwire, K.A. Banking Carbon: A Review of Organic Carbon Storage and Physical Factors Influencing Retention in Floodplains and Riparian Ecosystems. Earth Surf. Process. Landf. 2016, 41, 38–60. [Google Scholar] [CrossRef]
  3. Leenheer, J.A.; Croué, J.-P. Peer Reviewed: Characterizing Aquatic Dissolved Organic Matter. Environ. Sci. Technol. 2003, 37, 18A–26A. [Google Scholar] [CrossRef] [PubMed]
  4. Coble, P.G. Marine Optical Biogeochemistry: The Chemistry of Ocean Color. Chem. Rev. 2007, 107, 402–418. [Google Scholar] [CrossRef] [PubMed]
  5. Kirk, J.T.O. Light and Photosiynthesis in Aquatic Ecossystems; Cambridge University Press: Cambridge, UK, 2011; ISBN 978-0-521-15175-7. [Google Scholar]
  6. Cole, J.J.; Prairie, Y.T.; Caraco, N.F.; McDowell, W.H.; Tranvik, L.J.; Striegl, R.G.; Duarte, C.M.; Kortelainen, P.; Downing, J.A.; Middelburg, J.J.; et al. Plumbing the Global Carbon Cycle: Integrating Inland Waters into the Terrestrial Carbon Budget. Ecosystems 2007, 10, 172–185. [Google Scholar] [CrossRef]
  7. Richey, J.E.; Hedges, J.I.; Devol, A.H.; Quay, P.D.; Victoria, R.; Martinelli, L.; Forsberg, B.R. Biogeochemistry of Carbon in the Amazon River. Limnol. Oceanogr. 1990, 35, 352–371. [Google Scholar] [CrossRef]
  8. Moreira-Turcq, P.; Seyler, P.; Guyot, J.L.; Etcheber, H. Exportation of Organic Carbon from the Amazon River and Its Main Tributaries. Hydrol. Process. 2003, 17, 1329–1344. [Google Scholar] [CrossRef]
  9. Kutser, T.; Pierson, D.C.; Kallio, K.Y.; Reinart, A.; Sobek, S. Mapping Lake CDOM by Satellite Remote Sensing. Remote Sens. Environ. 2005, 95, 535–540. [Google Scholar] [CrossRef]
  10. Ficek, D.; Zapadka, T.; Dera, J. Remote Sensing Reflectance of Pomeranian Lakes and the Baltic. Oceanologia 2011, 53, 959–970. [Google Scholar] [CrossRef]
  11. Brezonik, P.L.; Olmanson, L.G.; Finlay, J.C.; Bauer, M.E. Factors Affecting the Measurement of CDOM by Remote Sensing of Optically Complex Inland Waters. Remote Sens. Environ. 2015, 157, 199–215. [Google Scholar] [CrossRef]
  12. da Silva, M.P.; Sander de Carvalho, L.A.; Novo, E.; Jorge, D.S.F.; Barbosa, C.C.F. Use of Optical Absorption Indices to Assess Seasonal Variability of Dissolved Organic Matter in Amazon Floodplain Lakes. Biogeosciences 2020, 17, 5355–5364. [Google Scholar] [CrossRef]
  13. Kutser, T.; Koponen, S.; Kallio, K.Y.; Fincke, T.; Paavel, B. Bio-Optical Modeling of Colored Dissolved Organic Matter. In Bio-Optical Modeling and Remote Sensing of Inland Waters; Elsevier: Amsterdam, The Netherlands, 2017; pp. 101–128. [Google Scholar]
  14. Bio-Optical Modelling and Remote Sensing of Inland Waters; Mishra, D.R.; Ogashawara, I.; Gitelson, A.A. (Eds.) Elsevier: Amsterdam, The Netherlands, 2017; ISBN 978-0-12-804644-9. [Google Scholar]
  15. Binding, C.E.; Bowers, D.G. Measuring the Salinity of the Clyde Sea from Remotely Sensed Ocean Colour. Estuar. Coast. Shelf Sci. 2003, 57, 605–611. [Google Scholar] [CrossRef]
  16. Zhu, W.; Yu, Q.; Tian, Y.Q.; Becker, B.L.; Zheng, T.; Carrick, H.J. An Assessment of Remote Sensing Algorithms for Colored Dissolved Organic Matter in Complex Freshwater Environments. Remote Sens. Environ. 2014, 140, 766–778. [Google Scholar] [CrossRef]
  17. Sahay, A.; Ali, S.M.; Raman, M.; Gupta, A.; Motwani, G.; Thakker, R.; Tirkey, A.; Solanki, H.A.; Shanmugam, P. Empirically Derived Coloured Dissolved Organic Matter Absorption Coefficient Using In-Situ and Sentinel 3/OLCI in Coastal Waters of India. Int. J. Remote Sens. 2022, 43, 1430–1450. [Google Scholar] [CrossRef]
  18. Alcântara, E.; Bernardo, N.; Watanabe, F.; Rodrigues, T.; Rotta, L.; Carmo, A.; Shimabukuro, M.; Gonçalves, S.; Imai, N. Estimating the CDOM Absorption Coefficient in Tropical Inland Waters Using OLI/Landsat-8 Images. Remote Sens. Lett. 2016, 7, 661–670. [Google Scholar] [CrossRef]
  19. Kutser, T.; Casal Pascual, G.; Barbosa, C.; Paavel, B.; Ferreira, R.; Carvalho, L.; Toming, K. Mapping Inland Water Carbon Content with Landsat 8 Data. Int. J. Remote Sens. 2016, 37, 2950–2961. [Google Scholar] [CrossRef]
  20. Alcântara, E.; Bernardo, N.; Rodrigues, T.; Watanabe, F. Modeling the Spatio-Temporal Dissolved Organic Carbon Concentration in Barra Bonita Reservoir Using OLI/Landsat-8 Images. Model. Earth Syst. Environ. 2017, 3, 11. [Google Scholar] [CrossRef]
  21. Santiago, M.I.; Frey, K.E. Assessment of Empirical and Semi-Analytical Algorithms Using MODIS-Aqua for Representing In-Situ Chromophoric Dissolved Organic Matter (CDOM) in the Bering, Chukchi, and Western Beaufort Seas of the Pacific Arctic Region. Remote Sens. 2021, 13, 3673. [Google Scholar] [CrossRef]
  22. Ogashawara, I.; Mishra, D.R.; Nascimento, R.F.F.; Alcântara, E.H.; Kampel, M.; Stech, J.L. Re-Parameterization of a Quasi-Analytical Algorithm for Colored Dissolved Organic Matter Dominant Inland Waters. Int. J. Appl. Earth Obs. Geoinf. 2016, 53, 128–145. [Google Scholar] [CrossRef]
  23. Lima Filho, M.C.D.O.; Tavares, M.H.; Fragoso, C.R.; Lins, R.C.; Vich, D.V. Semi-Empirical Models for Remote Estimating Colored Dissolved Organic Matter (CDOM) in a Productive Tropical Estuary. Environ. Monit. Assess. 2023, 195, 846. [Google Scholar] [CrossRef] [PubMed]
  24. Korosov, A.; Pozdnyakov, D.; Folkestad, A.; Pettersson, L.; Sørensen, K.; Shuchman, R. Semi-Empirical Algorithm for the Retrieval of Ecology-Relevant Water Constituents in Various Aquatic Environments. Algorithms 2009, 2, 470–497. [Google Scholar] [CrossRef]
  25. Zhang, R.; Deng, R.; Liu, Y.; Liang, Y.; Xiong, L.; Cao, B.; Zhang, W. Developing New Colored Dissolved Organic Matter Retrieval Algorithms Based on Sparse Learning. IEEE J. Sel. Top. Appl. Earth Obs. Remote Sens. 2020, 13, 3478–3492. [Google Scholar] [CrossRef]
  26. Sun, X.; Zhang, Y.; Zhang, Y.; Shi, K.; Zhou, Y.; Li, N. Machine Learning Algorithms for Chromophoric Dissolved Organic Matter (CDOM) Estimation Based on Landsat 8 Images. Remote Sens. 2021, 13, 3560. [Google Scholar] [CrossRef]
  27. Kim, J.; Jang, W.; Hwi Kim, J.; Lee, J.; Hwa Cho, K.; Lee, Y.-G.; Chon, K.; Park, S.; Pyo, J.; Park, Y.; et al. Application of Airborne Hyperspectral Imagery to Retrieve Spatiotemporal CDOM Distribution Using Machine Learning in a Reservoir. Int. J. Appl. Earth Obs. Geoinf. 2022, 114, 103053. [Google Scholar] [CrossRef]
  28. Xu, J.; Fang, C.; Gao, D.; Zhang, H.; Gao, C.; Xu, Z.; Wang, Y. Optical Models for Remote Sensing of Chromophoric Dissolved Organic Matter (CDOM) Absorption in Poyang Lake. ISPRS J. Photogramm. Remote Sens. 2018, 142, 124–136. [Google Scholar] [CrossRef]
  29. Chen, J.; Zhu, W.; Tian, Y.Q.; Yu, Q.; Zheng, Y.; Huang, L. Remote Estimation of Colored Dissolved Organic Matter and Chlorophyll-a in Lake Huron Using Sentinel-2 Measurements. J. Appl. Remote Sens. 2017, 11, 1. [Google Scholar] [CrossRef]
  30. Ciancia, E.; Campanelli, A.; Colonna, R.; Palombo, A.; Pascucci, S.; Pignatti, S.; Pergola, N. Improving Colored Dissolved Organic Matter (CDOM) Retrievals by Sentinel2-MSI Data through a Total Suspended Matter (TSM)-Driven Classification: The Case of Pertusillo Lake (Southern Italy). Remote Sens. 2023, 15, 5718. [Google Scholar] [CrossRef]
  31. Shang, Y.; Liu, G.; Wen, Z.; Jacinthe, P.-A.; Song, K.; Zhang, B.; Lyu, L.; Li, S.; Wang, X.; Yu, X. Remote Estimates of CDOM Using Sentinel-2 Remote Sensing Data in Reservoirs with Different Trophic States across China. J. Environ. Manag. 2021, 286, 112275. [Google Scholar] [CrossRef] [PubMed]
  32. Pitarch, J.; Vanhellemont, Q. The QAA-RGB: A Universal Three-Band Absorption and Backscattering Retrieval Algorithm for High Resolution Satellite Sensors. Development and Implementation in ACOLITE. Remote Sens. Environ. 2021, 265, 112667. [Google Scholar] [CrossRef]
  33. Wang, Y.; Shen, F.; Sokoletsky, L.; Sun, X. Validation and Calibration of QAA Algorithm for CDOM Absorption Retrieval in the Changjiang (Yangtze) Estuarine and Coastal Waters. Remote Sens. 2017, 9, 1192. [Google Scholar] [CrossRef]
  34. Zhu, M.; Wang, J.; Yang, X.; Zhang, Y.; Zhang, L.; Ren, H.; Wu, B.; Ye, L. A Review of the Application of Machine Learning in Water Quality Evaluation. Eco-Environ. Health 2022, 1, 107–116. [Google Scholar] [CrossRef] [PubMed]
  35. Slonecker, E.T.; Jones, D.K.; Pellerin, B.A. The New Landsat 8 Potential for Remote Sensing of Colored Dissolved Organic Matter (CDOM). Mar. Pollut. Bull. 2015, 107, 518–527. [Google Scholar] [CrossRef]
  36. Martinez, J.-M.; Espinoza-Villar, R.; Armijos, E.; Silva Moreira, L. The Optical Properties of River and Floodplain Waters in the Amazon River Basin: Implications for Satellite-Based Measurements of Suspended Particulate Matter. J. Geophys. Res. Earth Surf. 2015, 120, 1274–1287. [Google Scholar] [CrossRef]
  37. Barbosa, C.; Novo, E.; Ferreira, R.; Carvalho, L.; Cairo, C.; Lopes, F.; Stech, J.; Alcantara, E. Brazilian Inland Water Bio-Optical Dataset to Support Carbon Budget Studies in Reservoirs as Well as Anthropogenic Impacts in Amazon Floodplain Lakes: Preliminary Results. ISPRS Int. Arch. Photogramm. Remote Sens. Spat. Inf. Sci. 2015, XL-7/W3, 1439–1446. [Google Scholar] [CrossRef]
  38. de Matos Valerio, A.; Kampel, M.; Vantrepotte, V.; Ward, N.D.; Sawakuchi, H.O.; Less, D.F.D.S.; Neu, V.; Cunha, A.; Richey, J. Using CDOM Optical Properties for Estimating DOC Concentrations and pCO2 in the Lower Amazon River. Opt. Express 2018, 26, A657. [Google Scholar] [CrossRef] [PubMed]
  39. Melack, J.M.; Novo, E.M.L.M.; Forsberg, B.R.; Piedade, M.T.F.; Maurice, L. Floodplain Ecosystem Processes. In Amazonia and Global Change; Wiley: Hoboken, NJ, USA, 2009; pp. 525–541. [Google Scholar]
  40. Scofield, V.; Melack, J.M.; Barbosa, P.M.; Amaral, J.H.F.; Forsberg, B.R.; Farjalla, V.F. Carbon Dioxide Outgassing from Amazonian Aquatic Ecosystems in the Negro River Basin. Biogeochemistry 2016, 129, 77–91. [Google Scholar] [CrossRef]
  41. Marinho, R.R.; Filizola Junior, N.P.; Cremon, É.H. Analysis of Suspended Sediment in the Anavilhanas Archipelago, Rio Negro, Amazon Basin. Water 2020, 12, 1073. [Google Scholar] [CrossRef]
  42. Marinho, R.R.; Harmel, T.; Martinez, J.-M.; Filizola Junior, N.P. Spatiotemporal Dynamics of Suspended Sediments in the Negro River, Amazon Basin, from In Situ and Sentinel-2 Remote Sensing Data. ISPRS Int. J. Geo-Inf. 2021, 10, 86. [Google Scholar] [CrossRef]
  43. Fassoni-Andrade, A.C.; Fleischmann, A.S.; Papa, F.; de Paiva, R.C.D.; Wongchuig, S.; Melack, J.M.; Moreira, A.A.; Paris, A.; Ruhoff, A.; Barbosa, C.; et al. Amazon Hydrology from Space: Scientific Advances and Future Challenges. Rev. Geophys. 2021, 59, e2020RG000728. [Google Scholar] [CrossRef]
  44. RSIS Ramsar Information Sheet. Rio Negro, Brazil. Available online: https://rsis.ramsar.org/ris/2335 (accessed on 29 December 2022).
  45. Junk, W.J.; Wittmann, F.; Schöngart, J.; Piedade, M.T.F. A Classification of the Major Habitats of Amazonian Black-Water River Floodplains and a Comparison with Their White-Water Counterparts. Wetl. Ecol. Manag. 2015, 23, 677–693. [Google Scholar] [CrossRef]
  46. Filizola, N.; Guyot, J.L. Suspended Sediment Yields in the Amazon Basin: An Assessment Using the Brazilian National Data Set. Hydrol. Process. 2009, 23, 3207–3215. [Google Scholar] [CrossRef]
  47. Latrubesse, E.M.; Franzinelli, E. The Late Quaternary Evolution of the Negro River, Amazon, Brazil: Implications for Island and Floodplain Formation in Large Anabranching Tropical Systems. Geomorphology 2005, 70, 372–397. [Google Scholar] [CrossRef]
  48. Melack, J.M.; Hess, L.L. Remote Sensing of the Distribution and Extent of Wetlands in the Amazon Basin. In Amazonian Floodplain Forests; Ecological Studies; Springer: Berlin/Heidelberg, Germany, 2010; Volume 210, pp. 43–59. [Google Scholar]
  49. Getirana, A.C.V.; Espinoza, J.C.V.; Ronchail, J.; Rotunno Filho, O.C. Assessment of Different Precipitation Datasets and Their Impacts on the Water Balance of the Negro River Basin. J. Hydrol. 2011, 404, 304–322. [Google Scholar] [CrossRef]
  50. Leenheer, J.A. Origin and Nature of Humic Substances in the Waters of the Amazon River Basin. Acta Amaz. 1980, 10, 513–526. [Google Scholar] [CrossRef]
  51. APHA. Standard Methods for the Examination of Water and Wastewater; American Public Health Association: Washington, DC, USA, 2012. [Google Scholar]
  52. ISO 8245; Water Quality—Guidelines for the Determination of Total Organic Carbon (TOC) and Dissolved Organic Carbon (DOC). ISO: Geneva, Switzerland, 1999.
  53. HYBAM. Observation Service SO HYBAM. Available online: http://www.ore-hybam.org (accessed on 29 June 2021).
  54. Bricaud, A.; Morel, A.; Prieur, L. Absorption by Dissolved Organic Matter of the Sea (Yellow Substance) in the UV and Visible Domains. Limnol. Oceanogr. 1981, 26, 43–53. [Google Scholar] [CrossRef]
  55. Mobley, C.D. Estimation of the Remote-Sensing Reflectance from above-Surface Measurements. Appl. Opt. 1999, 38, 7442. [Google Scholar] [CrossRef] [PubMed]
  56. Chami, M.; Lafrance, B.; Fougnie, B.; Chowdhary, J.; Harmel, T.; Waquet, F. OSOAA: A Vector Radiative Transfer Model of Coupled Atmosphere-Ocean System for a Rough Sea Surface Application to the Estimates of the Directional Variations of the Water Leaving Reflectance to Better Process Multi-Angular Satellite Sensors Data over The Ocean. Opt. Express 2015, 23, 27829. [Google Scholar] [CrossRef] [PubMed]
  57. Morcrette, J.-J.; Boucher, O.; Jones, L.; Salmond, D.; Bechtold, P.; Beljaars, A.; Benedetti, A.; Bonet, A.; Kaiser, J.W.; Razinger, M.; et al. Aerosol Analysis and Forecast in the European Centre for Medium-Range Weather Forecasts Integrated Forecast System: Forward Modeling. J. Geophys. Res. 2009, 114, D06206. [Google Scholar] [CrossRef]
  58. Watanabe, F.; Alcântara, E.; Curtarelli, M.; Kampel, M.; Stech, J. Landsat-Based Remote Sensing of the Colored Dissolved Organic Matter Absorption Coefficient in a Tropical Oligotrophic Reservoir. Remote Sens. Appl. Soc. Environ. 2018, 9, 82–90. [Google Scholar] [CrossRef]
  59. Helms, J.R.; Stubbins, A.; Ritchie, J.D.; Minor, E.C.; Kieber, D.J.; Mopper, K. Absorption Spectral Slopes and Slope Ratios as Indicators of Molecular Weight, Source, and Photobleaching of Chromophoric Dissolved Organic Matter. Limonology Oceanogr. 2008, 53, 955–969. [Google Scholar] [CrossRef]
  60. Laraque, A.; Guyot, J.L.; Filizola, N. Mixing Processes in the Amazon River at the Confluences of the Negro and Solimões Rivers, Encontro Das Águas, Manaus, Brazil. Hydrol. Process. 2009, 23, 3131–3140. [Google Scholar] [CrossRef]
  61. Mostofa, K.M.G.; Liu, C.; Mottaleb, M.A.; Wan, G.; Ogawa, H.; Vione, D.; Yoshioka, T.; Wu, F. Dissolved Organic Matter in Natural Waters. In Photobiogeochemistry of Organic Matter; Environmental Science and Engineering; Mostofa, K.M.G., Yoshioka, T., Mottaleb, A., Vione, D., Eds.; Springer: Berlin/Heidelberg, Germany, 2013; pp. 1–137. ISBN 978-3-642-32222-8. [Google Scholar]
  62. de Oliveira, L.C.; Sargentini, É., Jr.; Rosa, A.H.; Rocha, J.C.; Simões, M.L.; Martin-Neto, L.; da Silva, W.T.L.; Serudo, R.L. The Influence of Seasonalness on the Structural Characteristics of Aquatic Humic Substances Extracted from Negro River (Amazon State) Waters: Interactions with Hg(II). J. Braz. Chem. Soc. 2007, 18, 860–868. [Google Scholar] [CrossRef]
  63. Chauvel, A.; Walker, I.; Lucas, Y. Sedimentation and Pedogenesis in a Central Amazonian Black Water Basin. Biogeochemistry 1996, 33, 77–95. [Google Scholar] [CrossRef]
  64. Sargentini Junior, É.; Rocha, J.C.; Rosa, A.H.; Zara, L.F.; dos Santos, A.d. Substâncias húmicas aquáticas: Fracionamento molecular e caracterização de rearranjos internos após complexação com íons metálicos. Quím. Nova 2001, 24, 339–344. [Google Scholar] [CrossRef]
  65. Goulding, M.; Leal Carvalho, M.; Ferreira, E. Río Negro, Rich Life in Poor Water: Amazonian Diversity and Foodchain Ecology as Seen through Fish Communities; SPB Academic Publishing: The Hague, The Netherlands, 1989. [Google Scholar]
  66. Quesada, C.A.; Lloyd, J.; Anderson, L.O.; Fyllas, N.M.; Schwarz, M.; Czimczik, C.I. Soils of Amazonia with Particular Reference to the RAINFOR Sites. Biogeosciences 2011, 8, 1415–1440. [Google Scholar] [CrossRef]
  67. Johannsson, O.E.; Smith, D.S.; Sadauskas-Henrique, H.; Cimprich, G.; Wood, C.M.; Val, A.L. Photo-Oxidation Processes, Properties of DOC, Reactive Oxygen Species (ROS), and Their Potential Impacts on Native Biota and Carbon Cycling in the Rio Negro (Amazonia, Brazil). Hydrobiologia 2017, 789, 7–29. [Google Scholar] [CrossRef]
  68. Leenherr, J.A.; Santos, H. Considerações Sobre Os Processos de Sediementação Na Água Preta Ácida Do Rio Negro (Amazônia Central). Acta Amaz. 1980, 10, 343–355. [Google Scholar] [CrossRef]
  69. Nima, C.; Frette, Ø.; Hamre, B.; Stamnes, J.J.; Chen, Y.-C.; Sørensen, K.; Norli, M.; Lu, D.; Xing, Q.; Muyimbwa, D.; et al. CDOM Absorption Properties of Natural Water Bodies along Extreme Environmental Gradients. Water 2019, 11, 1988. [Google Scholar] [CrossRef]
  70. Babin, M. Variations in the Light Absorption Coefficients of Phytoplankton, Nonalgal Particles, and Dissolved Organic Matter in Coastal Waters around Europe. J. Geophys. Res. 2003, 108, 3211. [Google Scholar] [CrossRef]
  71. Ficke, A.D.; Myrick, C.A.; Hansen, L.J. Potential Impacts of Global Climate Change on Freshwater Fisheries. Rev. Fish Biol. Fish. 2007, 17, 581–613. [Google Scholar] [CrossRef]
  72. Martins, V.S.; Barbosa, C.C.F.; Carvalho, L.A.S.; Jorge, D.S.F.; Lobo, F.D.L.; Novo, E.M.L.M. Assessment of Atmospheric Correction Methods for Sentinel-2 MSI Images Applied to Amazon Floodplain Lakes. Remote Sens. 2017, 9, 322. [Google Scholar] [CrossRef]
  73. Lehmann, M.K.; Gurlin, D.; Pahlevan, N.; Alikas, K.; Conroy, T.; Anstee, J.; Balasubramanian, S.V.; Barbosa, C.C.F.; Binding, C.; Bracher, A.; et al. GLORIA—A Globally Representative Hyperspectral in Situ Dataset for Optical Sensing of Water Quality. Sci. Data 2023, 10, 100. [Google Scholar] [CrossRef] [PubMed]
  74. Jorge, D.S.F.; Loisel, H.; Jamet, C.; Dessailly, D.; Demaria, J.; Bricaud, A.; Maritorena, S.; Zhang, X.; Antoine, D.; Kutser, T.; et al. A Three-Step Semi Analytical Algorithm (3SAA) for Estimating Inherent Optical Properties over Oceanic, Coastal, and Inland Waters from Remote Sensing Reflectance. Remote Sens. Environ. 2021, 263, 112537. [Google Scholar] [CrossRef]
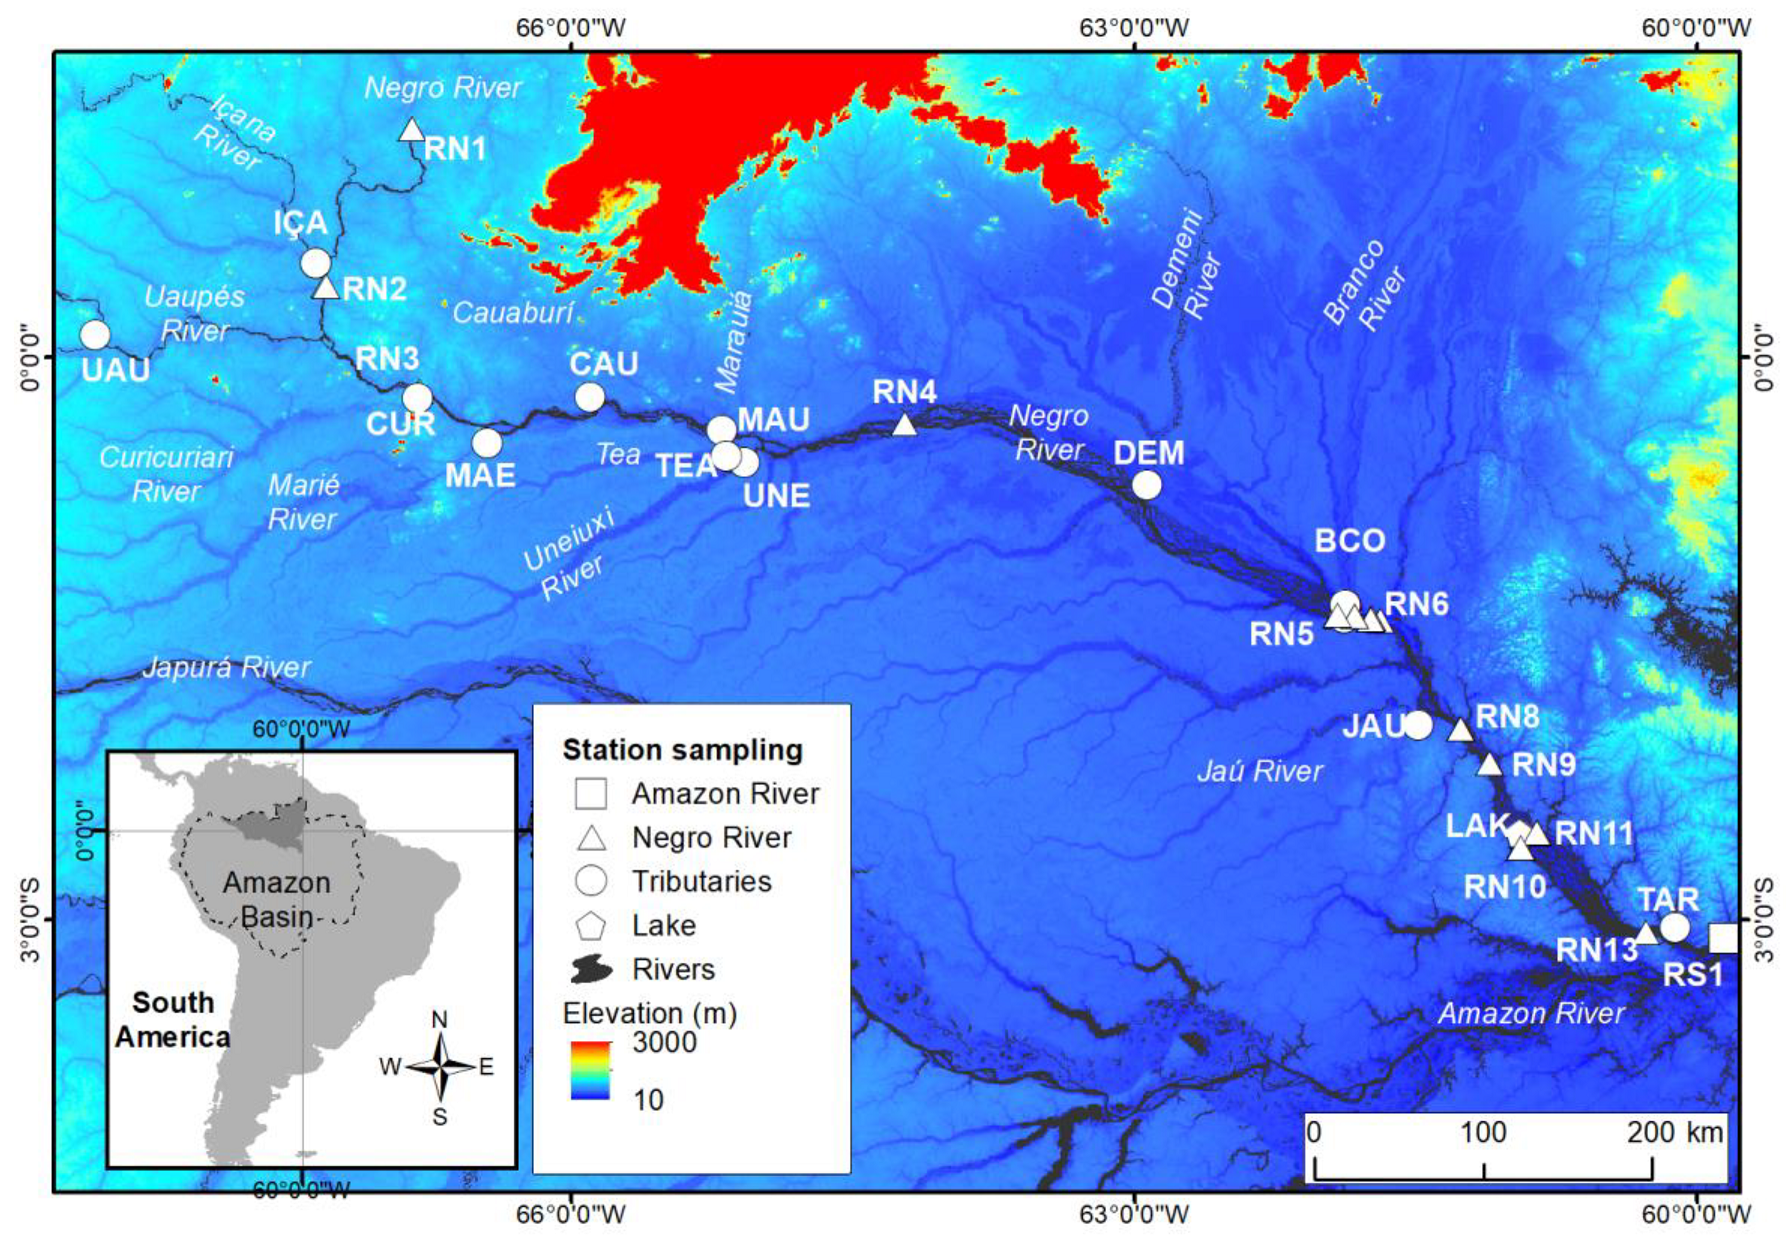
Figure 1. Location of the study area and sampling sections.
Remotesensing 16 00613 g001
Figure 2. Examples of Rrs collected in different sections of the Negro River (black-water), its tributaries (black- and clear-water), and the Amazon River (white-water). (a) High-water period; (b) low-water period.
Remotesensing 16 00613 g002
Figure 3. aCDOM of the Negro River (a) and tributaries (b). Note that the Y-axis scale in (a) is different from the Y-axis scale in Figure 3b. Refer to Table 1 for the names of the sections in (b).
Remotesensing 16 00613 g003
Figure 4. DOC versus aCDOM in the Negro River Basin. The dashed black line indicates a 1:1 relationship. Please refer to Table 1 for the names of the sections.
Remotesensing 16 00613 g004
Figure 5. Relationship between aCDOM at 440 nm and the ratio of Rrs for MSI bands simulated at 560 nm and 665 nm in the high-water period (a) and low-water period (b). The blue lines are 95% confidence intervals.
Remotesensing 16 00613 g005
Figure 6. The relationship between aCDOM at 440 nm and the Rrs for MSI band simulated at 665 nm for the high-water period (a) and low-water period (b). The blue lines represent the 95% confidence intervals.
Remotesensing 16 00613 g006
Figure 7. Spatial distribution of aCDOM at 440 nm in the Negro basin, Amazon River, and the coast of French Guiana. Source: This study and GLORIA [73].
Remotesensing 16 00613 g007
Table 1. Average values of DOC, POC, TSS, and aCDOM at the sampling stations in the Negro River and its tributaries. Please refer to the station locations in Figure 1. The acquisition dates and number of samples used in this study are available in Supplementary Table S1.
SectionRiver NameDOC
(mg∙L−1)
POC
(mg∙L−1)
TSS
(mg∙L−1)
aCDOM at 440
(m−1)
RN1 to RN13Negro10.030.334.678.97
IÇAIçana15.450.463.2113.36
UAUUaupés9.470.409.644.16
CURCuricuriari18.400.162.5518.80
MAEMarié20.100.304.6015.18
CAUCauaburi8.170.4714.588.69
MARMarauiá*0.5015.143.16
TEATea14.760.473.1210.17
UNEUneixi12.700.372.908.50
DEMDemini6.230.5510.276.30
BCOBranco4.940.7012.031.84
JAUJaú*0.67*7.08
LAKApacú Lake7.320.358.484.94
TARTarumã**12.415.68
RS1Amazon3.051.5250.802.15
* Data not available.
Table 2. Spectral slope mean values for different ranges of UV–visible. Please refer to the station locations in Figure 1 for specific details.
Water TypeSectionS360–400S360–500S400–460S380–700
BlackRN0.0160.0150.0160.015
IÇA0.0160.0150.0160.012
UAU0.0150.0150.0170.016
CUR0.0160.0150.0160.013
MAE0.0160.0150.0160.011
CAU0.0150.0150.0160.022
TEA0.0160.0150.0160.010
UNE0.0160.0140.0150.009
JAU0.0160.0150.0170.012
LAK0.0150.0150.0160.011
TAR0.0150.0140.0150.011
ClearMAR0.0150.0170.0180.038
DEM0.0150.0140.0150.012
BCO0.0170.0160.0150.012
WhiteRS10.0170.0180.0210.011
Table 3. Performance of empirical models for aCDOM at 440 nm (aCDOM). hw = high water. lw = low water. For the scatter plots of the match-ups between aCDOM models see Supplementary Figure S1.
AuthorModelR2RMSEMAPE (%)
hwlwhwlwhwlw
Ficek et al. [10]aCDOM = 3.65 [Rrs(570)/Rrs(655)]−1.9930.610.635.456.2513454
Brezonik et al. [11]ln(aCDOM) = 1.872 − 0.830 ln(MSI-2/MSI-6)0.520.674.026.679769
Da Silva et al. [12]aCDOM = 4.39 (MSI−2/MSI−3) + 0.59 (MSI−6/MSI−5) − 6.670.560.085.697.407373
Table 4. Average values of aCDOM at 440 nm in rivers from different countries.
CountryRiveraCDOM at 440 nm
Mean (m−1)
aCDOM at 440 nm
Range (m−1)
Source
BrazilNegro and tributaries8.974.94–20.10This study
Amazon2.151.03–6.71
USAAltamaha4.711.04–15.28GLORIA [73]
Ashepoo14.596.52–21.08
Duplin0.740.26–1.50
Edisto8.452.22–12.98
Ogeechee1.880.62–3.92
Satilla2.681.31–4.08
St. Jones1.210.78–2.00
St. Marys5.910.70–14.88
VietnamSoai Rap0.540.78–3.22
Disclaimer/Publisher’s Note: The statements, opinions and data contained in all publications are solely those of the individual author(s) and contributor(s) and not of MDPI and/or the editor(s). MDPI and/or the editor(s) disclaim responsibility for any injury to people or property resulting from any ideas, methods, instructions or products referred to in the content.